CO 2 adsorption on carbonaceous surfaces: a combined experimental and theoretical study
11
Carbon 41 (2003) 29–39 CO adsorption on carbonaceous surfaces: a combined 2 experimental and theoretical study a a b, * ´ Alejandro Montoya , Fanor Mondragon , Thanh N. Truong a Institute of Chemistry, University of Antioquia, Medellin A. A 1226, Colombia b Department of Chemistry, Henry Eyring Center for Theoretical Chemistry, Rm 2020, University of Utah, 315 South 1400 East, Salt Lake City, UT 84112, USA Received 24 June 2001; accepted 14 July 2002 Abstract We present an experimental and theoretical study to provide further insight into the mechanism of CO chemisorption on 2 carbonaceous surfaces. The differential heat of CO adsorption at low and high coverages was determined in the temperature 2 range 553–593 K. We found that the heat profile has two distinct energetic zones that suggest two different adsorption processes. In the low-coverage region, the heat of adsorption decreases rapidly from 75 to 24 kcal / mol, suggesting a broad spectrum of binding sites. In the high-coverage region, the heat becomes nearly independent of the loading, from 9 to 5 kcal / mol. A systematic molecular modeling study of CO chemisorption on carbonaceous surfaces was performed. Several 2 of the carbon–oxygen complexes that have been proposed in the literature were identified and characterized. The calculated adsorption energies are within the experimental uncertainty of the heat of adsorption at low coverage. Pre-adsorbed oxygen groups decrease the exothermicity of CO adsorption. In the high-coverage region, our theoretical results suggest that CO 2 2 molecules are likely to adsorb on surface oxygen complexes and on graphene planes. 2003 Elsevier Science Ltd. All rights reserved. Keywords: A. Char; B. Gasification; C. Chemisorption, Molecular simulation; D. Surface oxygen complexes 1. Introduction the carbonaceous surface. For instance, some studies have argued multiple chemisorption active sites [1] and that molecular [1,2] or dissociative modes of adsorption are The carbon–CO reaction has been used as an energy 2 possible [3,4]. There have been a number of experimental source and to partially oxidize carbonaceous surfaces to studies attempting to identify and quantify the carbon– obtain microporous materials with valuable properties in oxygen complexes during this reaction [1,2,5–9]. This is the chemical industry. The identification of the surface important for deducing the mechanism for CO gas release oxygen complexes is very important since it provides in the subsequent step of the reaction. The stability of the insights into the detailed gasification mechanism and surface oxygen complexes has been studied mainly from surface characterization of carbonaceous materials. The the desorption features of the CO molecule after the chemisorption reaction can be represented as follows: carbon–CO reaction using either temperature-pro- 2 grammed desorption [5,6,10,11] or transient kinetic tech- CO (g) 1 C ⇔C(CO ) (1) 2 f 2 niques [12–14]. These studies suggested that there are more than two surface oxygen complexes formed with where a gas-phase CO (g) molecule chemisorbs on an 2 different stabilities [15,16]. In fact, several complexes have active site C to produce a surface carbon–oxygen com- f been proposed so far, namely lactone [1,7,8], ether [5], plex C(CO ). The CO chemisorption is a complex 2 2 pyrone [6,9], carbonyl [2,9] and semiquinone [2,9]. Other reaction that is further complicated by the heterogeneity of groups, such as acid anhydride [17,18] and epoxy oxygen groups [19,20], have also been proposed in the gasification *Corresponding author. Tel.: 11-801-581-7272; fax: 11-801- with oxygen. Identifying in-situ surface oxygen complexes 581-4353. E-mail address: [email protected] (T.N. Truong). in the chemisorption process is difficult for several 0008-6223 / 03 / $ – see front matter 2003 Elsevier Science Ltd. All rights reserved. PII: S0008-6223(02)00249-X
-
Upload
independent -
Category
Documents
-
view
1 -
download
0
Transcript of CO 2 adsorption on carbonaceous surfaces: a combined experimental and theoretical study

Carbon 41 (2003) 29–39
C O adsorption on carbonaceous surfaces: a combined2
experimental and theoretical studya a b ,*´Alejandro Montoya , Fanor Mondragon , Thanh N. Truong
aInstitute of Chemistry, University of Antioquia, Medellin A.A 1226, ColombiabDepartment of Chemistry, Henry Eyring Center for Theoretical Chemistry, Rm 2020,University of Utah, 315 South 1400 East,
Salt Lake City, UT 84112,USA
Received 24 June 2001; accepted 14 July 2002
Abstract
We present an experimental and theoretical study to provide further insight into the mechanism of CO chemisorption on2
carbonaceous surfaces. The differential heat of CO adsorption at low and high coverages was determined in the temperature2
range 553–593 K. We found that the heat profile has two distinct energetic zones that suggest two different adsorptionprocesses. In the low-coverage region, the heat of adsorption decreases rapidly from 75 to 24 kcal /mol, suggesting a broadspectrum of binding sites. In the high-coverage region, the heat becomes nearly independent of the loading, from 9 to 5kcal /mol. A systematic molecular modeling study of CO chemisorption on carbonaceous surfaces was performed. Several2
of the carbon–oxygen complexes that have been proposed in the literature were identified and characterized. The calculatedadsorption energies are within the experimental uncertainty of the heat of adsorption at low coverage. Pre-adsorbed oxygengroups decrease the exothermicity of CO adsorption. In the high-coverage region, our theoretical results suggest that CO2 2
molecules are likely to adsorb on surface oxygen complexes and on graphene planes. 2003 Elsevier Science Ltd. All rights reserved.
Keywords: A. Char; B. Gasification; C. Chemisorption, Molecular simulation; D. Surface oxygen complexes
1 . Introduction the carbonaceous surface. For instance, some studies haveargued multiple chemisorption active sites [1] and thatmolecular [1,2] or dissociative modes of adsorption areThe carbon–CO reaction has been used as an energy2possible [3,4]. There have been a number of experimentalsource and to partially oxidize carbonaceous surfaces tostudies attempting to identify and quantify the carbon–obtain microporous materials with valuable properties inoxygen complexes during this reaction [1,2,5–9]. This isthe chemical industry. The identification of the surfaceimportant for deducing the mechanism for CO gas releaseoxygen complexes is very important since it providesin the subsequent step of the reaction. The stability of theinsights into the detailed gasification mechanism andsurface oxygen complexes has been studied mainly fromsurface characterization of carbonaceous materials. Thethe desorption features of the CO molecule after thechemisorption reaction can be represented as follows:carbon–CO reaction using either temperature-pro-2
grammed desorption [5,6,10,11] or transient kinetic tech-CO (g)1C ⇔C(CO ) (1)2 f 2
niques [12–14]. These studies suggested that there aremore than two surface oxygen complexes formed withwhere a gas-phase CO (g) molecule chemisorbs on an2
different stabilities [15,16]. In fact, several complexes haveactive site C to produce a surface carbon–oxygen com-f
been proposed so far, namely lactone [1,7,8], ether [5],plex C(CO ). The CO chemisorption is a complex2 2
pyrone [6,9], carbonyl [2,9] and semiquinone [2,9]. Otherreaction that is further complicated by the heterogeneity ofgroups, such as acid anhydride [17,18] and epoxy oxygengroups [19,20], have also been proposed in the gasification*Corresponding author. Tel.:11-801-581-7272; fax:11-801-with oxygen. Identifying in-situ surface oxygen complexes581-4353.
E-mail address: [email protected](T.N. Truong). in the chemisorption process is difficult for several
0008-6223/03/$ – see front matter 2003 Elsevier Science Ltd. All rights reserved.PI I : S0008-6223( 02 )00249-X
30 A. Montoya et al. / Carbon 41 (2003) 29–39
reasons, namely (1) thermal transformation to different About 20 mg of the sample was heated at 10.0 K/min tospecies on the char surface, (2) diffusion of gaseous agents 1073 K and held at this temperature for 30 min in N flow.2
on the micropore network and (3) re-adsorption of CO The sample temperature was then lowered to the reactiondesorbed species [5,21]. temperature and N was switched to CO . Weight changes2 2
Our goal in this study was to identify the carbon– of the char sample were analyzed as chemisorption (weightoxygen complexes formed due just to the interaction of gain) or gasification (weight loss) of the material. ThisCO with the carbonaceous surface. One of the properties procedure was carried out at different temperatures to2
used was the differential enthalpy of adsorption, the determine a suitable temperature range where CO can be2
amount of heat released when an adsorbate adsorbs on a chemisorbed without gasification. Then, a fresh carbonsubstrate that contains many adsorption sites. When this sample was subjected to CO adsorption at different2
quantity is determined for low coverages, the value of the pressures in a volumetric equipment to obtain the CO2
heat of adsorption is due only to the interaction between adsorption profile at different CO loadings. The procedure2
the adsorbate and the substrate. The heat of CO ad- used was as follows. The carbon material was outgassed223sorption has been measured by volumetric experiments for 24 h at 573 K at a residual pressure of 5310 mmHg
below 273 K on graphite and amorphous carbon surfaces N to eliminate humidity and trapped gases and the weight2
[22,23]. At this temperature the process is mainly a of the sample was recorded. Then, the sample was heatedphysical interaction between the CO molecules and the to 1073 K at a pressure of 1.5310 mmHg He to eliminate2
carbonaceous surface. Few studies have been carried out to some of the oxygen complexes that could have beenmeasure the differential enthalpy of adsorption of CO on formed during handling of the sample after pyrolysis. The2
carbonaceous surfaces above its critical temperature. Com- sample was cooled to the chemisorption temperature andplications may arise due to the possible in-situ gasification CO adsorption was recorded at different pressures. The2
of the solid material [24]. However, it has been shown that CO equilibrium pressure in the adsorption chamber was2
the surface oxygen complexes formed with CO at low considered to be reached when the pressure change per2
surface coverage at 573 K are stable up to 873 K [3]. equilibrium time interval was less than 0.01% of theThis study is divided into two main sections. First, the average pressure during the interval. For the determination
isosteric heat of CO adsorption was measured at low and of the low-coverage heat of adsorption, 10 pressure points2
high surface coverage between 553 and 593 K. Second, as were recorded in the range 0.05–5 Torr. For the de-a complementary tool, a state-of-the-art quantum chemical termination of the high-coverage heat of adsorption, 20method was used to characterize the nature of the carbon– points were recorded in the range 10–650 Torr. Theoxygen complexes and to predict heats of adsorption. The adsorbed volume was calculated assuming ideal behavior.results from these calculations were then compared with All gases were of high purity. The experimental error wasthe experimental data. Several fundamental questions 1 K in measuring the temperature and 0.15% in pressure.regarding the adsorption process were examined, in par-ticular molecular structures and stability of the carbon–CO complexes, and the effects of neighboring surface 3 . Computational approach2
oxygen complexes on the calculated CO adsorption2
properties. We have published several studies on computationalmethodologies and their applications to adsorption/desorp-tion processes on char surfaces [25–27]. Many computa-
2 . Experimental tional details have been discussed previously and thus theyare only briefly summarized here. To calculate the geomet-
The adsorption of CO was carried out on a pure carbon ries and CO adsorption energies, carbon models and their2 2
material in order to avoid mineral matter contamination corresponding CO surface oxygen complexes were fully2
that can affect the measured CO adsorption properties. optimized in their ground states. To determine the correct2
The carbonaceous material was obtained by pyrolysis of a ground state for each system, we have performed single-pure phenol–formaldehyde resin under high-purity N point energy calculations at the same level of theory for2
flow. Phenol–formaldehyde resin was heated to 1273 K at different electronic states, the ground state being selected10 K/min in a horizontal quartz tube and held at this to be the lowest energy state. Normal mode analyses weretemperature for 2 h. After this time, the reactor was performed for selected complexes to provide some in-allowed to cool to room temperature under He flow to formation on the IR spectra of the surface oxygen com-prevent oxidation. The small amount of mineral matter on plexes and to characterize the stationary points as stablethe char (0.6 wt%, daf) suggested that chemisorption takes equilibrium structures or as saddle points. All calculationsplace mainly on the aromatic network of the char, for were performed at the B3LYP DFT level of theory, i.e.instance on the active sites of the carbonaceous surface. Becke’s hybrid three-parameter non-local exchange func-
The reactivity of carbonaceous material with CO was tional [28–30] with Lee, Yang, and Parr’s non-local2
measured in a thermogravimetric balance at 0.84 atm. correlation functional [31], using the 6-31G(d) basis set. It
A. Montoya et al. / Carbon 41 (2003) 29–39 31
is known that B3LYP produces fairly accurate bond The temperature affects the volume adsorbed at a higherenergies and thermodynamic properties of reactions and surface coverage where CO may adsorb on the external2
the basis set used is adequate. An unrestricted open-shell surface. In general, two regions can be distinguished in thewave function was used in all open-shell cases. In a adsorption isotherm, one below 60 mmHg, where the CO2
3previous study we have shown that the spin contamination uptake increases to 0.2 cm /g, and the second after 603in unrestricted B3LYP is reasonably small and has small mmHg, where the CO uptake increases to 1.6 cm /g.2
¯effects on the energetic properties of graphene layers [25]. The differential heat of adsorption (Dh ) was obtainedAll calculations were performed using the GAUSSIAN 98 from the CO adsorption isotherms shown in Fig. 1. The2
program [32]. heat was obtained in terms of differences between datapoints in isotherms measured at different temperatures forthe same value of the amount of gas adsorbed on the
4 . Results carbon surface using the Clausius–Clapeyron equation. Adetailed procedure can be found elsewhere [33]. The ideal
4 .1. CO isosteric heat of adsorption gas law is assumed and the adsorbed phase molar volume2
is not considered in this case. This assumption is reason-The isosteric heat of adsorption on phenol–formalde- able since errors in the isosteric heat of adsorption due to
hyde char at different CO loadings was determined from non-ideality are noticeable only when the pressure is over2
the variation of the CO adsorbed volume with tempera- 4.6 atm [34]. Furthermore, it is known that errors from2
ture. The temperature range was obtained from reactivity neglecting the adsorbed phase volume are smaller thanmeasurements of CO with the char surface in a thermo- those from the assumption of the ideal gas law [34,35].2
gravimetric balance. No decrease in weight was observed Since the experiments were done below 650 mmHg, wewhen the sample was exposed to CO below 673 K (with a expect that these errors are not significant.2
soak time of 60 min under N flow). Then, to avoid in-situ Because adsorption is spontaneous and this process is2
gasification not detected in the TGA, the CO adsorption associated with a loss of entropy, the enthalpy of ad-2¯isotherms were obtained in the temperature range 553–593 sorption is exothermic, andDh is negative in sign [36].
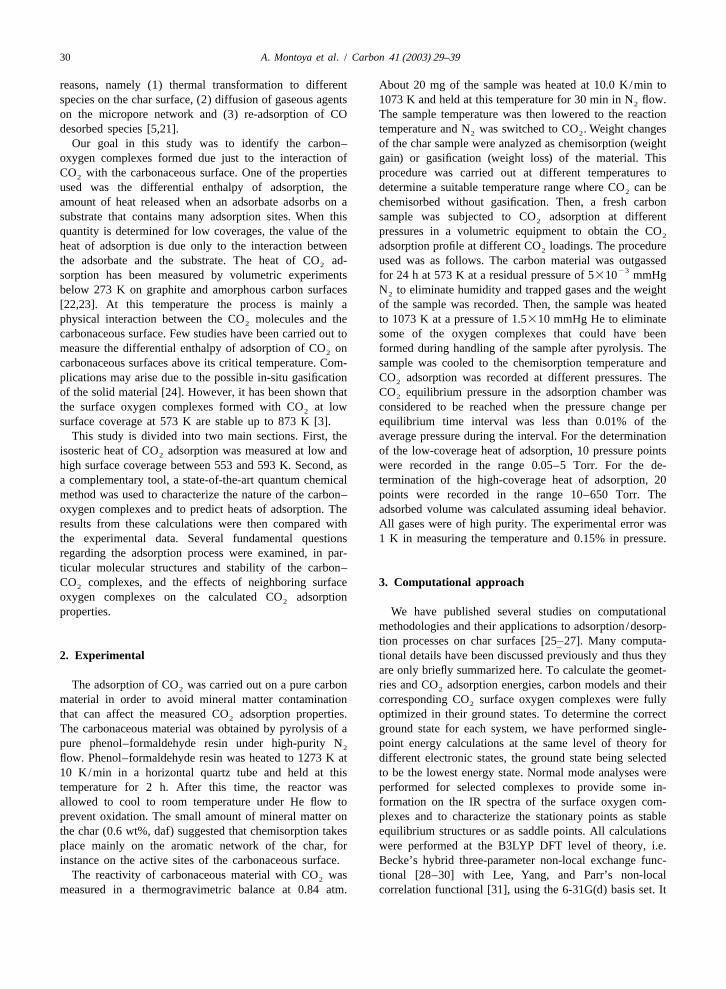
K. The adsorption isotherms at different temperatures are Therefore, the temperature and pressure should increase atshown in Fig. 1. As can be seen, the CO volume adsorbed constant loading for exothermic adsorption. In other words,2
decreased when the adsorption temperature was increased. the amount of gas adsorbed decreases as the adsorptionHowever, notice that, in the low-pressure region, there is a temperature is increased, as seen in the CO adsorption2
small difference in the adsorbed volume at different isotherms in Fig. 1. By definition, the isosteric heat is a¯adsorption temperatures, but the adsorbed volume in- positive number and thereforeq 5 2Dh. The isostericisos
creases faster than in the high-pressure region. This heat of CO adsorption at different loadings on the2
suggests that the CO molecule occupies the same number carbonaceous surface is shown in Fig. 2. The isosteric heat2
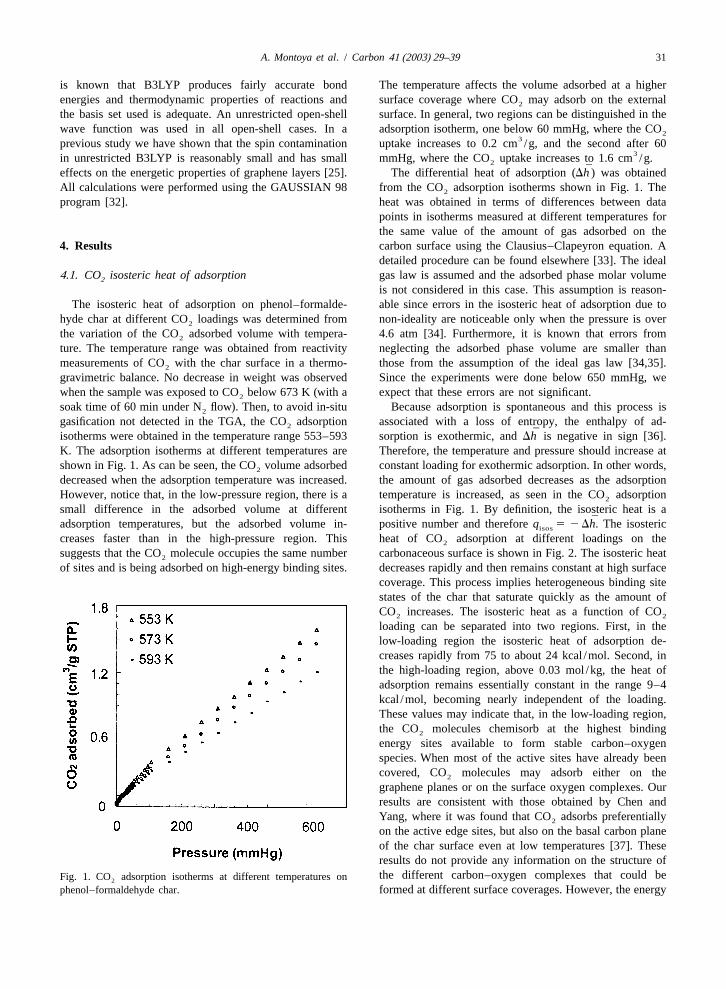
of sites and is being adsorbed on high-energy binding sites. decreases rapidly and then remains constant at high surfacecoverage. This process implies heterogeneous binding sitestates of the char that saturate quickly as the amount ofCO increases. The isosteric heat as a function of CO2 2
loading can be separated into two regions. First, in thelow-loading region the isosteric heat of adsorption de-creases rapidly from 75 to about 24 kcal /mol. Second, inthe high-loading region, above 0.03 mol /kg, the heat ofadsorption remains essentially constant in the range 9–4kcal /mol, becoming nearly independent of the loading.These values may indicate that, in the low-loading region,the CO molecules chemisorb at the highest binding2
energy sites available to form stable carbon–oxygenspecies. When most of the active sites have already beencovered, CO molecules may adsorb either on the2
graphene planes or on the surface oxygen complexes. Ourresults are consistent with those obtained by Chen andYang, where it was found that CO adsorbs preferentially2
on the active edge sites, but also on the basal carbon planeof the char surface even at low temperatures [37]. Theseresults do not provide any information on the structure ofthe different carbon–oxygen complexes that could beFig. 1. CO adsorption isotherms at different temperatures on2
phenol–formaldehyde char. formed at different surface coverages. However, the energy
32 A. Montoya et al. / Carbon 41 (2003) 29–39
Fig. 2. Isosteric heat of CO adsorption on phenol–formaldehyde char at different CO loadings in the range 553–593 K.2 2
profile can be a reference point for comparisons with the oxygen groups. Vertical adsorption can form a carbonyl-predicted heats of formation of different possible carbon– type oxygen group in the zig-zag and tip models. In theoxygen complexes from our quantum molecular modeling armchair model, it can form a furan group and a gas-phasedescribed below. CO molecule. The chemical nature of each surface oxygen
complex was analyzed by a normal mode analysis. The4 .2. Molecular modeling carbonyl-type and the heterocyclic in the armchair model
were found to have at least one imaginary frequency andSince the reaction of CO with char usually takes place thus do not correspond to local equilibrium structures and2
at high temperatures, CO can be vibrationally excited, will not be discussed further.2
particularly in the low-frequency bending modes. Thissuggests four possible CO adsorption configurations, as 4 .4. Size convergence2
shown in Fig. 3. Different molecular models (also shownin Fig. 3) of the char in zig-zag, armchair and tip shapes The stable oxygen complexes were optimized at differ-were used. In these models, several carbon atoms at the ent molecular sizes. Char models in zig-zag, armchair andedge are left unsaturated to simulate the active sites. Such tip shapes were used and are indicated by ‘z’, ‘a’ and ‘t’,models have been used in our previous study [38], and respectively, followed by the number of six-memberedthose of Chen and Yang [39], and Kyotani and Tomita rings. The size convergence analysis was performed on the[40]. Radovic et al. [41] suggested a broad distribution of heat of adsorption. The adsorption energies were obtainedcarbon active sites with different heats of chemisorption as as the difference between the total energy of the optimizedentities for char oxidation. Although char has a much more surface oxygen complexes and those of the reagents. Thecomplex structure, where graphene layers of various sizes standard heat of adsorption was calculated by addinghave random orientations and translations, our previous corrections for the zero-point energy and thermal energy atstudy [38] has shown that the models considered here give 298 K to the adsorption energy. These corrections forappropriate representations of different local environments lactone and heterocyclic oxygen groups in the seven six-of an active site. membered ring zig-zag carbon models are 6.90 and 4.57
kcal /mol, respectively. These two oxygen complexes have4 .3. CO surface oxygen complexes the same number of atoms, but different oxygen groups.2
As discussed below, we found that the zero-point andWe found that adsorption of CO on a clean surface can thermal energy corrections depend strongly on the type of2
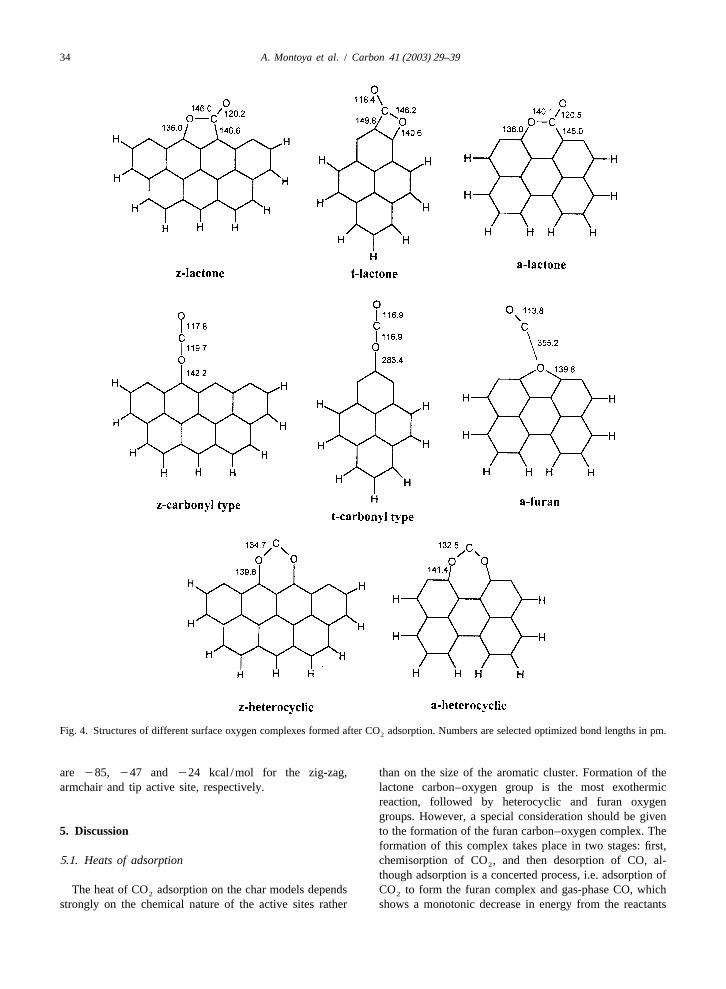
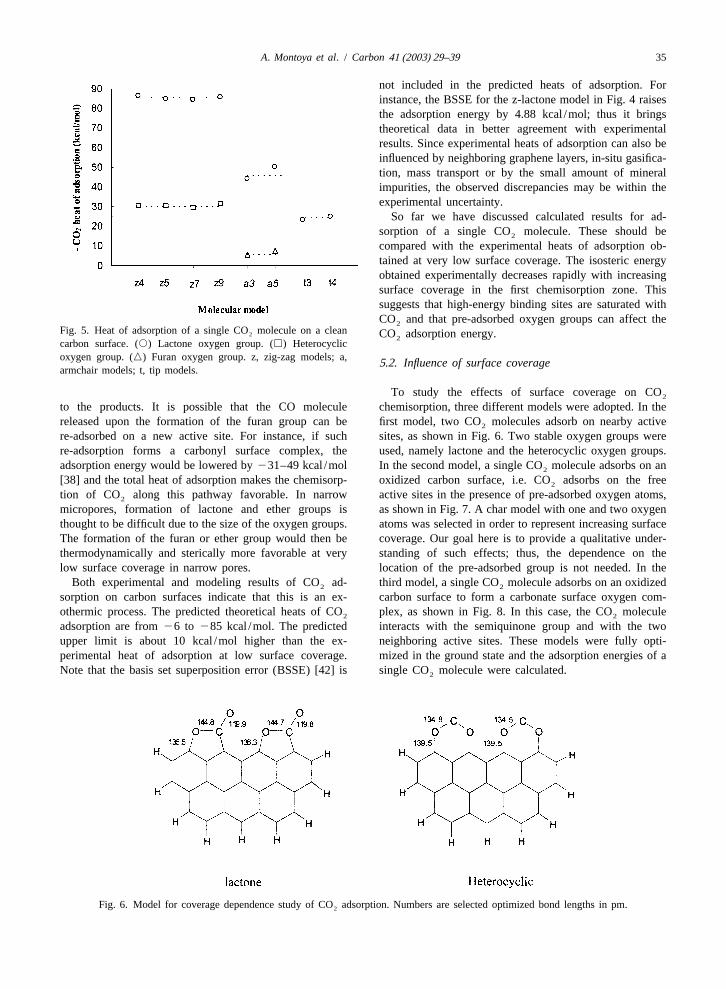
produce four different surface oxygen complexes, namely surface complex rather than on the size of the molecularlactone, carbonyl-type, furan, and heterocyclic oxygen model. Therefore, we used the results from the z7, a5, andgroups, as shown in Fig. 4. Selected optimized geometrical t4 models as estimates for the corrections in the otherparameters are shown in the same figure. Horizontal models with different sizes.adsorption can form either the lactone or heterocyclic Fig. 5 shows the heats of adsorption of different CO2

A. Montoya et al. / Carbon 41 (2003) 29–39 33
Fig. 3. Illustration of four different CO adsorption orientations on different carbon models of char. z, zig-zag shape; a, armchair shape, t,2
tip shape. Numbers after the letters represent the number of six-membered rings.
oxygen complexes on different model sizes and different model. The heats of adsorption remain nearly constant aslocal environments of the active sites. It was found that the model size increases. However, the adsorption energiesadsorption of CO is an exothermic process in all cases. are distinctively different for formation of the same2
The adsorption energy depends strongly on the type of the complex on different types of active sites. For instance, thelocal active site rather than on the size of the molecular average CO adsorption energies to form the lactone group2
34 A. Montoya et al. / Carbon 41 (2003) 29–39
Fig. 4. Structures of different surface oxygen complexes formed after CO adsorption. Numbers are selected optimized bond lengths in pm.2
are 285, 247 and 224 kcal /mol for the zig-zag, than on the size of the aromatic cluster. Formation of thearmchair and tip active site, respectively. lactone carbon–oxygen group is the most exothermic
reaction, followed by heterocyclic and furan oxygengroups. However, a special consideration should be given
5 . Discussion to the formation of the furan carbon–oxygen complex. Theformation of this complex takes place in two stages: first,
5 .1. Heats of adsorption chemisorption of CO , and then desorption of CO, al-2
though adsorption is a concerted process, i.e. adsorption ofThe heat of CO adsorption on the char models depends CO to form the furan complex and gas-phase CO, which2 2
strongly on the chemical nature of the active sites rather shows a monotonic decrease in energy from the reactants
A. Montoya et al. / Carbon 41 (2003) 29–39 35
not included in the predicted heats of adsorption. Forinstance, the BSSE for the z-lactone model in Fig. 4 raisesthe adsorption energy by 4.88 kcal /mol; thus it bringstheoretical data in better agreement with experimentalresults. Since experimental heats of adsorption can also beinfluenced by neighboring graphene layers, in-situ gasifica-tion, mass transport or by the small amount of mineralimpurities, the observed discrepancies may be within theexperimental uncertainty.
So far we have discussed calculated results for ad-sorption of a single CO molecule. These should be2
compared with the experimental heats of adsorption ob-tained at very low surface coverage. The isosteric energyobtained experimentally decreases rapidly with increasingsurface coverage in the first chemisorption zone. Thissuggests that high-energy binding sites are saturated withCO and that pre-adsorbed oxygen groups can affect the2
Fig. 5. Heat of adsorption of a single CO molecule on a clean2 CO adsorption energy.2carbon surface. (s) Lactone oxygen group. (h) Heterocyclicoxygen group. (n) Furan oxygen group. z, zig-zag models; a, 5 .2. Influence of surface coveragearmchair models; t, tip models.
To study the effects of surface coverage on CO2
to the products. It is possible that the CO molecule chemisorption, three different models were adopted. In thereleased upon the formation of the furan group can be first model, two CO molecules adsorb on nearby active2
re-adsorbed on a new active site. For instance, if such sites, as shown in Fig. 6. Two stable oxygen groups werere-adsorption forms a carbonyl surface complex, the used, namely lactone and the heterocyclic oxygen groups.adsorption energy would be lowered by231–49 kcal /mol In the second model, a single CO molecule adsorbs on an2
[38] and the total heat of adsorption makes the chemisorp- oxidized carbon surface, i.e. CO adsorbs on the free2
tion of CO along this pathway favorable. In narrow active sites in the presence of pre-adsorbed oxygen atoms,2
micropores, formation of lactone and ether groups is as shown in Fig. 7. A char model with one and two oxygenthought to be difficult due to the size of the oxygen groups. atoms was selected in order to represent increasing surfaceThe formation of the furan or ether group would then be coverage. Our goal here is to provide a qualitative under-thermodynamically and sterically more favorable at very standing of such effects; thus, the dependence on thelow surface coverage in narrow pores. location of the pre-adsorbed group is not needed. In the
Both experimental and modeling results of CO ad- third model, a single CO molecule adsorbs on an oxidized2 2
sorption on carbon surfaces indicate that this is an ex- carbon surface to form a carbonate surface oxygen com-othermic process. The predicted theoretical heats of CO plex, as shown in Fig. 8. In this case, the CO molecule2 2
adsorption are from26 to 285 kcal /mol. The predicted interacts with the semiquinone group and with the twoupper limit is about 10 kcal /mol higher than the ex- neighboring active sites. These models were fully opti-perimental heat of adsorption at low surface coverage. mized in the ground state and the adsorption energies of aNote that the basis set superposition error (BSSE) [42] is single CO molecule were calculated.2
Fig. 6. Model for coverage dependence study of CO adsorption. Numbers are selected optimized bond lengths in pm.2
36 A. Montoya et al. / Carbon 41 (2003) 29–39
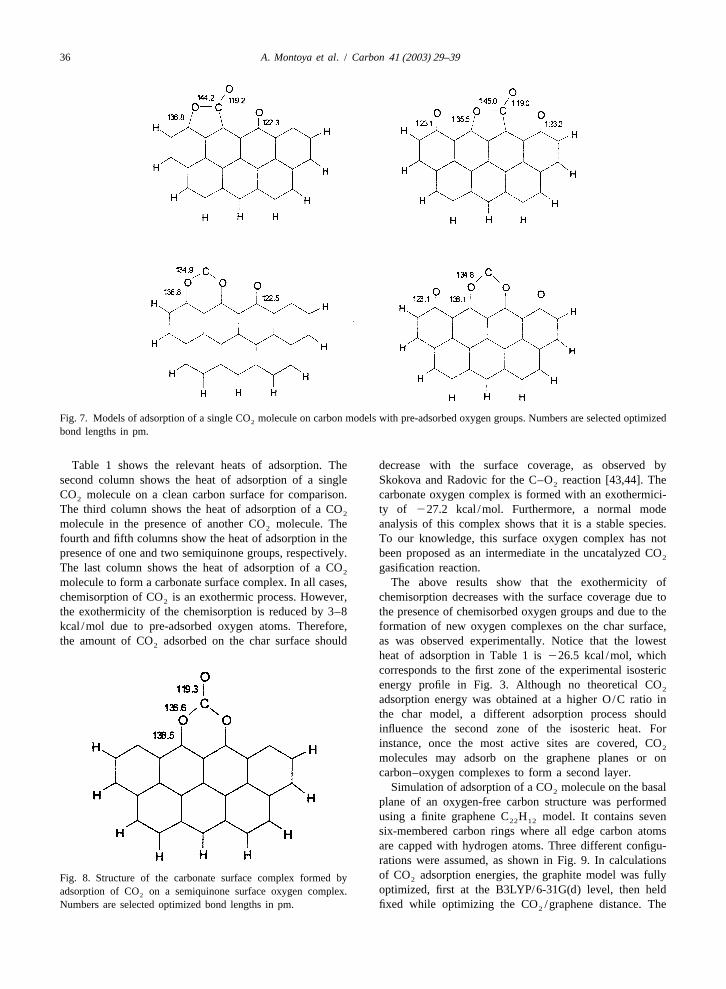
Fig. 7. Models of adsorption of a single CO molecule on carbon models with pre-adsorbed oxygen groups. Numbers are selected optimized2
bond lengths in pm.
Table 1 shows the relevant heats of adsorption. The decrease with the surface coverage, as observed bysecond column shows the heat of adsorption of a single Skokova and Radovic for the C–O reaction [43,44]. The2
CO molecule on a clean carbon surface for comparison. carbonate oxygen complex is formed with an exothermici-2
The third column shows the heat of adsorption of a CO ty of227.2 kcal /mol. Furthermore, a normal mode2
molecule in the presence of another CO molecule. The analysis of this complex shows that it is a stable species.2
fourth and fifth columns show the heat of adsorption in the To our knowledge, this surface oxygen complex has notpresence of one and two semiquinone groups, respectively. been proposed as an intermediate in the uncatalyzed CO2
The last column shows the heat of adsorption of a CO gasification reaction.2
molecule to form a carbonate surface complex. In all cases, The above results show that the exothermicity ofchemisorption of CO is an exothermic process. However, chemisorption decreases with the surface coverage due to2
the exothermicity of the chemisorption is reduced by 3–8 the presence of chemisorbed oxygen groups and due to thekcal /mol due to pre-adsorbed oxygen atoms. Therefore, formation of new oxygen complexes on the char surface,the amount of CO adsorbed on the char surface should as was observed experimentally. Notice that the lowest2
heat of adsorption in Table 1 is226.5 kcal /mol, whichcorresponds to the first zone of the experimental isostericenergy profile in Fig. 3. Although no theoretical CO2
adsorption energy was obtained at a higher O/C ratio inthe char model, a different adsorption process shouldinfluence the second zone of the isosteric heat. Forinstance, once the most active sites are covered, CO2
molecules may adsorb on the graphene planes or oncarbon–oxygen complexes to form a second layer.
Simulation of adsorption of a CO molecule on the basal2
plane of an oxygen-free carbon structure was performedusing a finite graphene C H model. It contains seven22 12
six-membered carbon rings where all edge carbon atomsare capped with hydrogen atoms. Three different configu-rations were assumed, as shown in Fig. 9. In calculationsof CO adsorption energies, the graphite model was fullyFig. 8. Structure of the carbonate surface complex formed by 2
optimized, first at the B3LYP/6-31G(d) level, then heldadsorption of CO on a semiquinone surface oxygen complex.2
Numbers are selected optimized bond lengths in pm. fixed while optimizing the CO /graphene distance. The2
A. Montoya et al. / Carbon 41 (2003) 29–39 37
Table 1Predicted heats of adsorption (kcal /mol) of the CO molecule on carbonaceous surfaces2
Single CO molecule Next to a Next to a Between two New2
(reference) CO semiquinone semiquinone group2
molecule group groups
Lactone 285.0 282.9 277.7 277.2 227.2*Heterocyclic 230.0 228.1 229.9 226.5
* Carbonate.
approximated potential curves were also calculated by shown in the figure. It was found that the CO bond axis is2
scanning the CO /graphene distance from 20 to 80 pm in perpendicular to the carbon plane and the adsorption of2
intervals of 1 pm. The distance between the planar CO does not change the bonding characteristics of the2
graphene and the CO molecule is defined by the perpen- heterocyclic surface complexes. It was found that ad-2
dicular line dropped from the carbon atom of the CO sorption ‘in the second layer’ is also favorable with a2
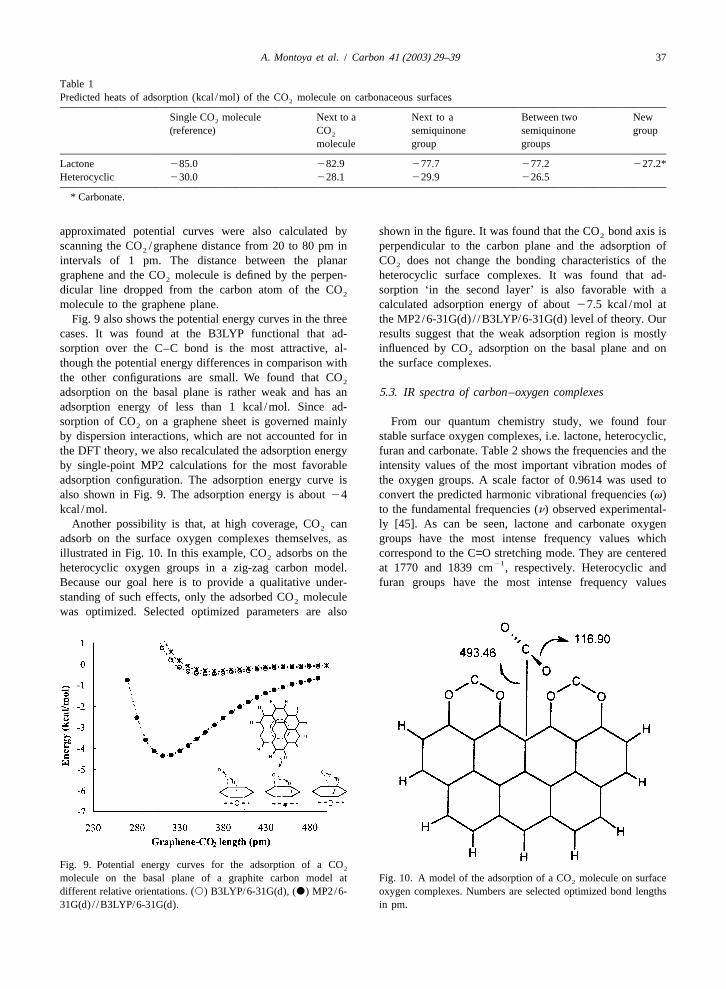
molecule to the graphene plane. calculated adsorption energy of about27.5 kcal /mol atFig. 9 also shows the potential energy curves in the three the MP2/6-31G(d) / /B3LYP/6-31G(d) level of theory. Our
cases. It was found at the B3LYP functional that ad- results suggest that the weak adsorption region is mostlysorption over the C–C bond is the most attractive, al- influenced by CO adsorption on the basal plane and on2
though the potential energy differences in comparison with the surface complexes.the other configurations are small. We found that CO2
adsorption on the basal plane is rather weak and has an5 .3. IR spectra of carbon–oxygen complexesadsorption energy of less than 1 kcal /mol. Since ad-sorption of CO on a graphene sheet is governed mainly From our quantum chemistry study, we found four2
by dispersion interactions, which are not accounted for in stable surface oxygen complexes, i.e. lactone, heterocyclic,the DFT theory, we also recalculated the adsorption energy furan and carbonate. Table 2 shows the frequencies and theby single-point MP2 calculations for the most favorable intensity values of the most important vibration modes ofadsorption configuration. The adsorption energy curve is the oxygen groups. A scale factor of 0.9614 was used toalso shown in Fig. 9. The adsorption energy is about24 convert the predicted harmonic vibrational frequencies (v)kcal /mol. to the fundamental frequencies (n) observed experimental-
Another possibility is that, at high coverage, CO can ly [45]. As can be seen, lactone and carbonate oxygen2
adsorb on the surface oxygen complexes themselves, as groups have the most intense frequency values whichillustrated in Fig. 10. In this example, CO adsorbs on the correspond to the C=O stretching mode. They are centered2
21heterocyclic oxygen groups in a zig-zag carbon model. at 1770 and 1839 cm , respectively. Heterocyclic andBecause our goal here is to provide a qualitative under- furan groups have the most intense frequency valuesstanding of such effects, only the adsorbed CO molecule2
was optimized. Selected optimized parameters are also
Fig. 9. Potential energy curves for the adsorption of a CO2
molecule on the basal plane of a graphite carbon model at Fig. 10. A model of the adsorption of a CO molecule on surface2
different relative orientations. (s) B3LYP/6-31G(d), (d) MP2/6- oxygen complexes. Numbers are selected optimized bond lengths31G(d) / /B3LYP/6-31G(d). in pm.
38 A. Montoya et al. / Carbon 41 (2003) 29–39
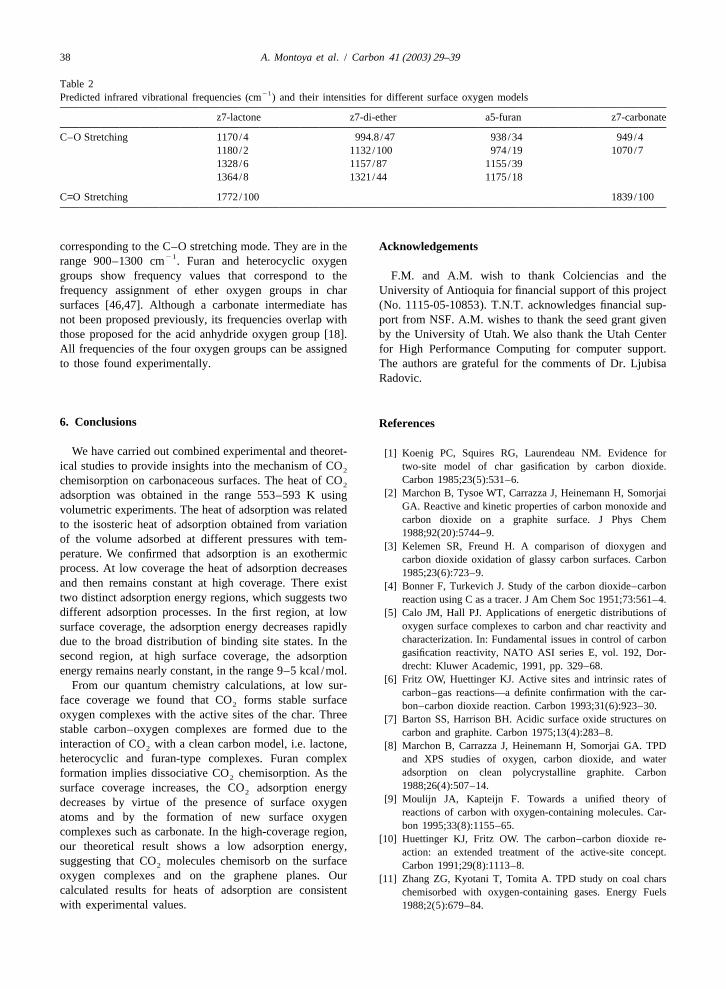
Table 221Predicted infrared vibrational frequencies (cm ) and their intensities for different surface oxygen models
z7-lactone z7-di-ether a5-furan z7-carbonate
C–O Stretching 1170/4 994.8/47 938/34 949/41180/2 1132/100 974/19 1070/71328/6 1157/87 1155/391364/8 1321/44 1175/18
C=O Stretching 1772/100 1839/100
corresponding to the C–O stretching mode. They are in the A cknowledgements21range 900–1300 cm . Furan and heterocyclic oxygen
groups show frequency values that correspond to the F.M. and A.M. wish to thank Colciencias and thefrequency assignment of ether oxygen groups in char University of Antioquia for financial support of this projectsurfaces [46,47]. Although a carbonate intermediate has (No. 1115-05-10853). T.N.T. acknowledges financial sup-not been proposed previously, its frequencies overlap with port from NSF. A.M. wishes to thank the seed grant giventhose proposed for the acid anhydride oxygen group [18]. by the University of Utah. We also thank the Utah CenterAll frequencies of the four oxygen groups can be assigned for High Performance Computing for computer support.to those found experimentally. The authors are grateful for the comments of Dr. Ljubisa
Radovic.
6 . Conclusions R eferences
We have carried out combined experimental and theoret- [1] Koenig PC, Squires RG, Laurendeau NM. Evidence forical studies to provide insights into the mechanism of CO two-site model of char gasification by carbon dioxide.2
Carbon 1985;23(5):531–6.chemisorption on carbonaceous surfaces. The heat of CO2[2] Marchon B, Tysoe WT, Carrazza J, Heinemann H, Somorjaiadsorption was obtained in the range 553–593 K using
GA. Reactive and kinetic properties of carbon monoxide andvolumetric experiments. The heat of adsorption was relatedcarbon dioxide on a graphite surface. J Phys Chemto the isosteric heat of adsorption obtained from variation1988;92(20):5744–9.of the volume adsorbed at different pressures with tem-
[3] Kelemen SR, Freund H. A comparison of dioxygen andperature. We confirmed that adsorption is an exothermic carbon dioxide oxidation of glassy carbon surfaces. Carbonprocess. At low coverage the heat of adsorption decreases 1985;23(6):723–9.and then remains constant at high coverage. There exist [4] Bonner F, Turkevich J. Study of the carbon dioxide–carbontwo distinct adsorption energy regions, which suggests two reaction using C as a tracer. J Am Chem Soc 1951;73:561–4.different adsorption processes. In the first region, at low [5] Calo JM, Hall PJ. Applications of energetic distributions of
oxygen surface complexes to carbon and char reactivity andsurface coverage, the adsorption energy decreases rapidlycharacterization. In: Fundamental issues in control of carbondue to the broad distribution of binding site states. In thegasification reactivity, NATO ASI series E, vol. 192, Dor-second region, at high surface coverage, the adsorptiondrecht: Kluwer Academic, 1991, pp. 329–68.energy remains nearly constant, in the range 9–5 kcal /mol.
[6] Fritz OW, Huettinger KJ. Active sites and intrinsic rates ofFrom our quantum chemistry calculations, at low sur-carbon–gas reactions—a definite confirmation with the car-
face coverage we found that CO forms stable surface2 bon–carbon dioxide reaction. Carbon 1993;31(6):923–30.oxygen complexes with the active sites of the char. Three [7] Barton SS, Harrison BH. Acidic surface oxide structures onstable carbon–oxygen complexes are formed due to the carbon and graphite. Carbon 1975;13(4):283–8.interaction of CO with a clean carbon model, i.e. lactone, [8] Marchon B, Carrazza J, Heinemann H, Somorjai GA. TPD2
heterocyclic and furan-type complexes. Furan complex and XPS studies of oxygen, carbon dioxide, and wateradsorption on clean polycrystalline graphite. Carbonformation implies dissociative CO chemisorption. As the21988;26(4):507–14.surface coverage increases, the CO adsorption energy2
[9] Moulijn JA, Kapteijn F. Towards a unified theory ofdecreases by virtue of the presence of surface oxygenreactions of carbon with oxygen-containing molecules. Car-atoms and by the formation of new surface oxygenbon 1995;33(8):1155–65.complexes such as carbonate. In the high-coverage region,
[10] Huettinger KJ, Fritz OW. The carbon–carbon dioxide re-our theoretical result shows a low adsorption energy, action: an extended treatment of the active-site concept.suggesting that CO molecules chemisorb on the surface2 Carbon 1991;29(8):1113–8.oxygen complexes and on the graphene planes. Our [11] Zhang ZG, Kyotani T, Tomita A. TPD study on coal charscalculated results for heats of adsorption are consistent chemisorbed with oxygen-containing gases. Energy Fuelswith experimental values. 1988;2(5):679–84.

A. Montoya et al. / Carbon 41 (2003) 29–39 39
[12] Radovic LR, Jiang H, Lizzio AA. A transient kinetics study [29] Becke AD. Density-functional thermochemistry. I. The effectof char gasification in carbon dioxide and oxygen. Energy of the exchange-only gradient correction. J Chem PhysFuels 1991;5(1):68–74. 1992;96(3):2155–60.
[13] Kapteijn F, Meijer R, Moulijn JA, Cazorla-Amoros D. On [30] Becke AD. Density-functional thermochemistry. III. The rolewhy do different carbons show different gasification rates: a of exact exchange. J Chem Phys 1993;98(7):5648–52.transient isotopic CO gasification study. Carbon [31] Lee C, Yang W, Parr RG. Development of the Colle–Salvetti2
1994;32(7):1223–31. correlation-energy formula into a functional of the electron[14] Kapteijn F, Meijer R, Moulijn JA. Transient kinetic tech- density. Phys Rev B: Condens Matter 1988;37(2):785–9.
niques for detailed insight in gas–solid reactions. Energy [32] Frisch MJ, Trucks GW, Schlegel HB, Scuseria GE, RobbFuels 1992;6(4):494–7. MA, Cheeseman JR et al. Gaussian 98, Rev. A.9. Pittsburgh,
[15] Huettinger KJ. Active sites and carbon gasification kinetics: PA; 1998.theoretical treatment and experimental results. In: Fun- [33] Webb PA, Orr C, editors, Analytical methods in fine particledamental issues in control of carbon gasification reactivity, technology, Norcross: Micromeritics Instrumental, 1997, pp.NATO ASI series E, vol. 192, Dordrecht: Kluwer Academic, 253–6.1991, pp. 163–73. [34] Pan H, Ritter JA, Balbuena PB. Examination of the approxi-
[16] Kapteijn F, Meijer R, Eck BV, Moulijn JA. Active sites in mations used in determining the isosteric heat of adsorptioncarbon gasification with CO transient kinetic experiments. from the Clausius–Clapeyron equation. Langmuir2
In: Fundamental issues in control of carbon gasification 1998;14(21):6323–7.reactivity, NATO ASI series E, vol. 192, Dordrecht: Kluwer [35] Al-Muhtaseb SA, Ritter JA. Roles of surface heterogeneityAcademic, 1991, pp. 221–33. and lateral interactions on the isosteric heat of adsorption and
[17] Starsinic M, Taylor RL, Walker Jr. PL, Painter PC. FTIR adsorbed phase heat capacity. J Phys Chem Bstudies of saran chars. Carbon 1983;21(1):69–74. 1999;103(13):2467–79.
[18] Zhuang QL, Kyotani T, Tomita A. DRIFT and TK/TPD [36] Myers AL. Thermodynamics of adsorption in porous materi-analyses of surface oxygen complexes formed during carbon als. AIChE J 2002;48(1):145–60.gasification. Energy Fuels 1994;8(3):714–8. [37] Chen SG, Yang RT. Titration for basal plane versus edge
[19] Pan Z, Yang RT. Strongly bonded oxygen in graphite: plane surface on graphitic carbons by adsorption. Langmuirdetection by high-temperature TPD and characterization. Ind 1993;9(11):3259–63.Eng Chem Res 1992;31(12):2675–80. [38] Montoya A, Truong T-TT, Mondragon F, Truong TN. CO
[20] Dubsky J, Beran S. Quantum chemical study of oxygen desorption from oxygen species on carbonaceous surface: 1.adsorption on graphite. II. Molecular orbital study of dis- Effects of the local structure of the active site and the surfacesociation of molecular oxygen on graphite. Surf Sci coverage. J Phys Chem A 2001;105(27):6757–64.1979;79(1):53–62. [39] Chen N, Yang RT. Ab initio molecular orbital calculation on
[21] Huettinger KJ. Transport and other effects in coal gasifica- graphite: selection of molecular system and model chemistry.tion. In: New trends in coal science, NATO ASI series C, Carbon 1998;36(7/8):1061–70.vol. 244, Dordrecht: Kluwer Academic, 1988, pp. 453–80. [40] Kyotani T, Tomita A. Analysis of the reaction of carbon with
[22] de Torre LEC, Flores ES, Llanos JL, Bottani EJ. Gas–solid NO/N O using ab initio molecular orbital theory. J Phys2
potentials for N , O , and CO adsorbed on graphite, Chem B 1999;103(17):3434–41.2 2 2
amorphous carbons, Al O , and TiO . Langmuir [41] Radovic LR, Walker Jr. PL, Jenkins RG. Importance of2 3 2
1995;11(12):4742–7. carbon active sites in the gasification of coal chars. Fuel[23] Bottani EJ, Bakaev V, Steele W. A simulation/experimental 1983;62(7):849–56.
study of the thermodynamic properties of carbon dioxide on [42] van Duijneveldt FB, van Duijneveldt-van de Rijdt JGCM,graphite. Chem Eng Sci 1994;49(17):2931–9. van Lenthe JH. State of the art in counterpoise theory. Chem
[24] Lussow RO, Vastola FJ, Walker Jr. PL. Kinetics of oxygen Rev (Washington, DC) 1994;94(7):1873–85.interaction with graphon between 450 and 6758C. Carbon [43] Skokova K, Radovic LR. Role of carbon–oxygen complexes(Oxford) 1967;5(6):591–602. in the CO/CO ratio during carbon oxidation. In: Extended2
[25] Montoya A, Truong TN, Sarofim AF. Spin contamination in Abstracts, 23rd Biennial Conference on Carbon, State Col-Hartree–Fock and density functional theory wavefunctions in lege, PA, American Carbon Society, 1997, pp. 414–5.modeling of adsorption on graphite. J Phys Chem A [44] Skokova K, Radovic LR. On the role of carbon–oxygen2000;104(26):6108–10. surface complexes in the carbon/oxygen reaction mecha-
´[26] Montoya A, Mondragon F, Truong TN. Adsorption on nism. Am Chem Soc, Div Fuel Chem 1996;41(1):143–7.carbonaceous surfaces: cost-effective computational strate- [45] Scott AP, Radom L. Harmonic vibrational frequencies: angies for quantum chemistry studies of aromatic systems. evaluation of Hartree–Fock, Moeller–Plesset, quadratic con-Carbon 2002;40(11):1863–72. figuration interaction, density functional theory, and semiem-
[27] Montoya A, Truong TN, Sarofim AF. Application of density pirical scale factors. J Phys Chem 1996;100(41):16502–13.functional theory to the study of the reaction of NO with [46] Meldrum BJ, Rochester CH. Infrared spectra of carbonace-char-bound nitrogen during combustion. J Phys Chem A ous chars under carbonization and oxidation conditions. Fuel2000;104(36):8410–8. 1991;70(1):57–63.
[28] Becke AD. Density-functional thermochemistry. II. The [47] Fanning PE, Vannice MA. A DRIFT study of the formationeffect of the Perdew–Wang generalized-gradient correlation of surface groups on carbon by oxidation. Carboncorrection. J Chem Phys 1992;97(12):9173–7. 1993;31(5):721–30.


![Experimental and theoretical study of the adsorption of fumaramide [2]rotaxane on Au(111) and Ag(111) surfaces](https://static.fdokumen.com/doc/165x107/632424f748d448ffa007029a/experimental-and-theoretical-study-of-the-adsorption-of-fumaramide-2rotaxane-on.jpg)