Photoelectron–Auger electron coincidence spectroscopy of free molecules: New experiments
Upload
independentCategory
view
3download
0
Journal of Electron Spectroscopy and Related Phenomena 121 (2001) 57–74www.elsevier.com/ locate /elspec
Understanding the initial stages of polymer grafting on metals: aphotoelectron spectroscopy study of acrylonitrile adsorption on
transition metal surfacesa , b a b b,c a* ´X. Crispin , R. Lazzaroni , A. Crispin , V.M. Geskin , J.L. Bredas , W.R. Salaneck
a ¨ ¨Department of Physics and Measurement Technology, Linkoping University, S-58183 Linkoping, Swedenb ´ ´Service de Chimie des Materiaux Nouveaux, Centre de Recherche en Electronique et Photonique Moleculaires,
´Universite de Mons-Hainaut, Place du Parc 20, B-7000 Mons, BelgiumcDepartment of Chemistry, The University of Arizona, Tucson, AZ 85721-0041, USA
Received 2 January 2001; received in revised form 26 April 2001; accepted 1 May 2001
Abstract
X-ray and UV photoelectron spectroscopies show that acrylonitrile is chemisorbed on iron, nickel and copperpolycrystalline surfaces via the carbon and nitrogen atoms. Depending on the conditions used, different adsorptiongeometries are found. The molecules can either be adsorbed flat on the surface and chemically bound by a (2p )–(3d/4s)p
overlap via both the C=C double bond and the C≡N nitrile group or they can be adsorbed perpendicular to the surface via acovalent interaction between the nitrogen lone pair and the 3d–4s levels of the metals. Analysis of the XPS data obtained onmolecular mono-layers chemisorbed on metal surfaces emphasizes the importance of initial-state effects (charge transferupon chemisorption, contribution of the metal surface dipole) and final-state effects (metal screening and polarization effectwithin the mono-layer). The correlation between the XPS and UPS data illustrates the importance of the metal surface dipolein understanding the workfunction changes upon molecular adsorption on metal surfaces. 2001 Elsevier Science B.V. Allrights reserved.
Keywords: Chemisorption; Transition metals; Polymer grafting; Vinylic monomers
1. Introduction zation of acrylonitrile or methacrylonitrile on thesurface of transition metals such as iron, copper and
Getting detailed information on the interaction of nickel, leads to strongly adherent polymer films [2–molecules with metal surfaces is of central impor- 8]. Potential applications of such processes includetance in the understanding of adhesion processes and corrosion protection [9], bio-compatibility of metal-surface reactions [1]. It has been known for almost lic prostheses [10], adhesion of lubricant formed20 years that the strictly controlled electropolymeri- upon annealing of grafted polyacrylonitrile [11], low
level connectors [9], among others. The stability ofthe polymer-on-metal interfaces obtained by elec-tropolymerization has been attributed to the forma-*Corresponding author. Tel.: 146-13-282-359; fax: 146-13-288-tion of covalent chemical bonds between the polymer969.
E-mail address: [email protected] (X. Crispin). chains and the metal surface [12–14]. Recently, this
0368-2048/01/$ – see front matter 2001 Elsevier Science B.V. All rights reserved.PI I : S0368-2048( 01 )00326-7

58 X. Crispin et al. / Journal of Electron Spectroscopy and Related Phenomena 121 (2001) 57 –74
electrografting method has been extended to other determination of the vaporization temperature of ANacrylic monomers [10,15]. at low pressures, i.e. the thermodynamic conditions
Although the full mechanism leading to grafting is to obtain a multi-layer or a mono-layer adsorbed onstill a subject of debate [8,16,17], several studies the metal surface. A comparison of the photoelectronshow that the key starting point for electrografting is binding energies of AN in the gas phase and in athe adsorption of the monomer on the metal elec- condensed (multi-layer) molecular solid film pro-trode. This is substantiated by the following observa- vides an estimate of the polarization energy, arisingtions. (i) Ellipsometric studies show that the reduc- from both the metal substrate and the surroundingtion of the oxide initially present at the surface AN molecules. The second part of the work dealsappears as a prerequisite for polyacrylonitrile graft- with the nature of AN mono-layers formed eithering [15b]. The grafting process takes place on a from the vaporization of the over-layers of a multi-clean metal surface dipped in an electrolytic solution. layer film, or by direct deposition of a single mono-(ii) Competitive solvent /monomer adsorption on the layer at a temperature higher than the condensationmetal electrode has been observed and rationalized temperature. Third, the chemisorption of an ANby theoretical molecular models [15a,18]. A con- mono-layer on copper, nickel and iron surfaces isdition for polymer grafting is that the monomer characterized by UPS and XPS. After accounting foradsorption is stronger than the solvent adsorption on the effects of polarization and surface dipole, thethe non-polarized electrode. (iii) Electrochemical chemisorption of AN is described in terms of ainvestigations using a rotating disk electrode show redistribution of electron density, as compared withthat a high spinning rate, leading to very efficient molecules in the gas phase. An estimate of thestirring close to the electrode surface, prevents the charge transferred upon chemisorption is rationalizedprecipitation of the polymer chains formed in solu- on the basis of the Hard and Soft Acids and Basestion, whereas it does not prevent the formation of (HSAB) principle [22], as described in the frame-grafted polymer chains [17]. Therefore, the grafting work of Density Functional Theory (DFT) [23–25].does not result from the precipitation of reactive Finally, we discuss the change in work functionpolymer chains from solution [16a]. Together with occurring upon chemisorption and estimate its twoquartz crystal microbalance measurements coupled to major sources: (i) the dipole formed between thecyclic voltammetry, they indicate that the grafted adsorbate and the surface as a result of chargepolymer film grows from the metal electrode [16b]. transfer upon chemisorption; and (ii) the modifica-(iv) Several theoretical studies suggest that tion of the metal surface dipole upon adsorption.chemisorption of acrylonitrile on copper [19,20],nickel [15] or iron [21] surfaces occurs through boththe C=C double bond and the nitrile group. (v) Asurface-enhanced Raman spectroscopy investigation 2. Experimentalindicates that acrylonitrile is chemisorbed on acopper electrode [20a]. Polycrystalline Ni, Cu and Fe metal surfaces were
In this work, UV and X-ray photoelectron spec- sputtered (ion etched) clean in the ultra-high vacuumtroscopies (UPS and XPS) were used to investigate (UHV) preparation chamber of the spectrometer.
27the adsorption of acrylonitrile (CH =CH–C≡N, or Both neon ions and argon ions (P 5 4 3 10 mbar),2
AN) on three polycrystalline transition metal sur- accelerated by 5 and 3 kV, respectively, can be usedfaces: Cu, Ni and Fe. Our aim was to shed light on to clean the metal surfaces at the atomic level. Afterthe changes in the geometric and electronic structure cleaning, the copper surfaces are free of carbon,of the molecule upon adsorption, through a com- nitrogen and oxygen; the nickel surface exhibits aparison between the experimental observations and very low level of contamination from carbonpreviously reported theoretical results. As a first step, (C(1s)5283.9 eV) and oxygen (O(1s)5531.1 eV),the temperature dependence of AN adsorption on while the iron surface does not show any C(1s)copper was studied with XPS. This allows the signal and only a very weak O(1s) signal at 530.0 eV.

X. Crispin et al. / Journal of Electron Spectroscopy and Related Phenomena 121 (2001) 57 –74 59
Note that, at such low levels of contamination, the all XPS and UPS spectra were recorded with aintensities of the XPS signals corresponding to an take-off angle of 908.AN adsorbed mono-layer are much larger than thoseof the contaminants. The XPS spectra of the adsor-bate are not affected by the presence of the smallcontamination signals. 3. Results and discussion
The AN mono-layers were prepared in two differ-ent ways: (i) by evaporation of the over-layers of a 3.1. AN multi-layer adsorbed on copperthick (multi-layer) condensed molecular solid film; or(ii) by direct adsorption of a mono-layer of AN We first consider the evolution of an acrylonitrilemolecules on a substrate kept above the vaporization multi-layer, formed by vapor deposition of ANtemperature (so that multi-layer formation was in- molecules on the surface of copper cooled tohibited). In order to form a multi-layer film, the 21708C, as the temperature is slowly raised abovemetal surface was first cooled to 21708C and then the vaporization temperature of AN. The intensities
27exposed to the molecular vapor (P(1 3 10 mbar). of typical XPS peaks are shown as a function ofOnce the multi-layer was formed, the sample was temperature in Fig. 1. The C(1s) and N(1s) inten-moved into the analysis chamber of the spectrometer sities show a well-pronounced decrease aroundfor XPS and UPS measurements. In order to avoid 21458C, while the Cu(2p ) signal increases simul-3 / 2
surface charging, the thickness of the condensed taneously. This evolution corresponds to the evapo-˚multi-layer films was kept well below 100 A, as ration of the AN over-layers. Note that, during the
determined from the intensities of the copper XPS temperature increase, the C(1s) /N(1s) intensity ratiosignal from the substrate. is constant, which indicates that no chemical de-
XPS was carried out using a home-designed and composition is taking place. Above 21208C, thebuilt UHV photoelectron spectrometer. This system intensities of the C(1s) and N(1s) peaks remainconsists of introduction, preparation and analysis constant and consistent with the composition of thechambers, pumped by a special combination of cryo, AN molecule, which indicates the presence of aion and turbo-pumps. Background pressures are well strongly-adsorbed mono-layer of AN molecules.
29below 1310 mbar. This spectrometer has excel- Note that radiation-induced polymerization can belent control of the sample temperature. The X-ray ruled out as the origin of the persistent layer. Indeed,source is non-monochromatized Mg(Ka) at 1253.6 even prolonged X-ray exposure at 21658C does noteV. The electron energy analyzer was run under suppress evaporation when the temperature is sub-conditions such that the Au(4f ) line is recorded sequently raised. In contrast, a multiplayer of7 / 2
with a FWHM of 0.9 eV. ethylacrylate appears to polymerize when exposed toAdditional XPS and UPS measurements were X-rays, as indicated by the fact that the amount of
performed using a Scienta ESCA 200 spectrometer material on the surface does not decrease even when[26]. The ESCA 200 uses monochromatized Al(Ka) the sample is brought to room temperature. From theradiation, at 1486.6 eV, for XPS, or a doubly temperature dependence of the XPS signals in Fig. 1,differentially pumped He-resonance lamp for UPS. the vaporization temperature is estimated to be
29Note that, with both spectrometers, the adsorption of T ( 2 1458C for P 5 3 3 10 mbar. These datavap
acrylonitrile from the gas phase onto the metal provide the determination of the thermodynamicsurface is carried out with a doser, which provides a conditions to be used to form an AN mono-layer orhigher local pressure around the metal substrate. The an AN multi-layer.background pressure in the sample preparation During evaporation of the over-layers, the
210chamber is 3310 mbar, and the pressure in the Cu(2p ) intensity increases only by a factor of 1.9.3 / 2210analysis chamber is 1310 mbar. Data analysis This observation can be used to estimate the thick-
was performed using the curve-fitting routines in- ness of the AN over-layer. A schematic view of ANcluded in the Scienta ESCA 200 software. Note that adsorbed on the metal surface is presented in Fig. 2.

60 X. Crispin et al. / Journal of Electron Spectroscopy and Related Phenomena 121 (2001) 57 –74
Fig. 2. Scheme of the AN multi-layer composed of the chemi-sorbed AN mono-layer and one condensed AN layer. Thestructure of the chemisorbed AN comes from a previous theoret-ical study [15,20].
layer physisorbed on top of the chemisorbed AN˚mono-layer then has an average thickness X(4.5 A.
Fig. 2 illustrates the presence of two differenttypes of AN molecules: the chemisorbed moleculesin contact with the metal and AN molecules con-densed over the chemisorbed layer. Based on the Vander Waals radii, the thickness of one layer of ANmolecules oriented parallel to the metal surface is
˚around 3.3 A. However, the structure of the over-layer is probably more complex, consisting of ANmolecules parallel or tilted with respect to the
˚surface. All things considered, the value X 5 4.5 Aapproximately corresponds to a one-molecule-thick
Fig. 1. Evolution of the XPS C(1s), N(1s), and Cu2p integrated layer. Therefore, the ‘multi-layer’ formed at 21608C3 / 2
peak intensities for acrylonitrile adsorbed on a polycrystalline is most probably a bi-layer consisting of the chemi-copper surface, as a function of temperature.
sorbed AN mono-layer and one condensed AN over-layer. Consequently, the chemisorbed mono-layer isexpected to contribute significantly to the XPS
In a first approximation, a homogeneous over-layer signals of that system (see Section 3.1.2).model can be used:
3.1.1. Valence levels of acrylonitrileI 5 I exp(2X /l) (1)0 The UPS HeII spectra of the AN condensed multi-where I is the intensity due to electrons with layer at 21608C and the clean copper surface are0
inelastic mean-free-path l, which is decreased to shown in Fig. 3. The comparison of the spectraintensity I by the presence of an over-layer of clearly shows the contribution of the copper substrateorganic material of thickness X. For Al(Ka) radia- in the UPS spectrum of the AN layer. The coppertion, Cu(2p ) photoelectrons have a kinetic energy signal is composed of a low intensity signal at the3 / 2
of about 320 eV, which corresponds to an inelastic Fermi level (0 eV in the spectrum), and a more˚mean-free-path of approximately 7 A [27]. The AN intense peak around 3 eV arising mainly from the

X. Crispin et al. / Journal of Electron Spectroscopy and Related Phenomena 121 (2001) 57 –74 61
level by adding the workfunction W obtained fromthe HeI spectrum (W 5 3.8 eV, see Fig. 4). Theshifted UPS spectrum can then be compared with theHeI spectrum of AN in the gas phase [28,29], inorder to evaluate the intermolecular relaxationenergy.
The evaluation of the intermolecular relaxationenergy, also called the polarization energy, has beenwidely studied in the past by comparing gas-phaseand solid-state spectra (e.g., Refs. [30–32]). Theaverage value of the intermolecular relaxation energyof organic molecules in the bulk has been determinedto be 1.7 eV for a series of organic molecules [31].
Fig. 3. UPS HeII spectrum of a sputtered copper surface and theAN multi-layer on the copper surface, at 21608C.
Cu(3d) levels. The observation of photoelectronsfrom the copper substrate getting through the ANlayer is consistent with the XPS data indicating thepresence of a bi-layer on the metal. The energies ofthe features in the UPS spectrum for the bi-layer arelisted in Table 1; they are referred to the vacuum
Table 1Comparison between corrected binding energies of the UPSspectrum of the AN multi-layer (Eb 1 W ) and the UPS peaksmulti
of AN in the gas phase (I ). The differences [(Eb 1 W ) 2gas multi
I ] gives an estimate of the polarization energy of the valencegas
levelsa aPeak Eb Eb 1 W I E Charactermulti multi gas pol
(eV) (eV) (eV) (eV)
1 6.0 9.8 10.9 1.1 p pC=C, CN
2 8.5 12.3 12.4 0.7 pCNb13.0 p pCN, C–C
13.5 sCN
3 9.2 13.0 pCH2
4 10.9 14.7 14.4 1.4 sC=C
5 12.4 16.2 16.2 1.5 C2s(CN)
6 15.8 19.6 17.6 1.4
Average – – – –– 1.2
Fig. 4. UPS HeI spectra of a ‘thick’ multi-layer of about 2.5 ANa Ref. [28]. The peaks beyond 18 eV are not given in this condensed layers, (b) a ‘thin’ multi-layer having around 1.5 AN
reference. layers, a chemisorbed layer of AN obtained from gas-phaseb The central value is taken for the evaluation of the inter- adsorption at 2908C; the sputtered copper surface used as
molecular relaxation energy. substrate for the above-mentioned samples.

62 X. Crispin et al. / Journal of Electron Spectroscopy and Related Phenomena 121 (2001) 57 –74
These conclusions have been drawn for rather thick is shifted even more, by 0.9 eV (DW included)molecular solids, for which the contribution of the compared to the ‘thick’ multi-layer sample. Hence,metal substrate to the polarization is negligible, and we believe that the thin multi-layer spectrum hasby considering the ionization threshold as typical of significant contributions from both the chemisorbedthe bulk [30]. In contrast, in our study, the multi- AN mono-layer and the AN molecules not in directlayer actually consists of only two AN layers. contact with the metal (i.e. the second layer). Such aConsequently, the photoelectron emission from an significant shift has also been observed by Parent etAN molecule at the surface of the bi-layer contains al. for AN chemisorbed on Pt (111) [33]. Thetwo contributions to the polarization energy: (i) a apparent shift of peak 2 can be interpreted as acontribution from the surrounding AN molecules, combination of: (i) the disappearance of peak 2and (ii) a contribution from the metal surface. These itself, related to the p molecular orbital located oncontributions are discussed in detail for core photo- the nitrile group and the nitrogen lone pair (s ),CN
electrons for which the hole created upon photoelec- and (ii) the unchanged position of peak 3 due to antron emission is localized. The core holes are local- orbital located on the CH part. The disappearance2
ized on one atom and can thus be modeled by a point of peak 2 is explained by the formation of covalentcharge at the position of the nucleus. In contrast, a bonds between the nitrile group and the copperhole formed in a valence level may be delocalized atoms. From a model composed of AN chemisorbedand no simple model can be proposed. Consequently, on a Cu cluster, the molecular orbitals (MOs) of20
polarization effects for valence levels are not dis- the adsorbate involved in the chemisorption are splitcussed in detail in this paper, and we just mention upon interaction with the 3d–4s levels at the copperthat the average polarization energy of the valence surface [20]. Hence, the disappearance of peak 2 islevels is evaluated to be 1.2 eV (Table 1). in fact due to the splitting and spreading over a wide
Fig. 4 shows the HeI spectrum of the clean copper energy range of the molecular orbitals such that asubstrate (curve d), the AN mono-layer (curve c) and sharp peak can no longer be observed.two multi-layers of different thickness (curves a andb). In the ‘thick’ multi-layer (around 2.5 layers), the 3.1.2. Core levels of acrylonitrileFermi level region still shows a weak signature of Recent Density Functional Theory calculationsthe copper substrate, but the spectrum mainly dis- [34], using the Generalized Slater Transition Stateplays the electronic structure of AN. The labeling of method [35], applied to molecular models providethe peaks corresponds to that in Fig. 3. Table 1 accurate values for the core-electron binding energiescontains the character of the molecular orbitals (Eb). The success of this method is due to theinvolved in the photoionization process, attributed inclusion of both the intramolecular electronic relax-from a comparison between gas- phase AN UPS ation and the electron correlation. Bureau et al. [36]peaks and ab initio calculations performed on the AN have successfully applied this method to the ANmolecule [28]. In the UPS spectrum obtained for the molecule, with an average absolute deviation of onlyAN mono-layer, it is difficult to clearly distinguish 0.09 eV between the calculated Eb’s and the ex-the AN contribution. Only the shoulder around 9 eV perimental XPS gas-phase values. That theoreticalcan be related to peak 2 of the multi-layer spectrum. work allowed assigning indisputably the experimen-It is interesting to compare the spectrum of the tal XPS spectrum of acrylonitrile in the gas phase‘thick’ multi-layer and that of the thin multi-layer obtained by Naves de Brito et al. [37].(around 1.5 layer). Indeed, if the spectra are cor- The AN bi-layer is characterized by a broad C(1s)rected for the workfunction difference DW (i.e., 0.2 signal (Fig. 5a) at 286.5 eV and a N(1s) peak at 399.9eV), all the peaks of the ‘thick’ multi-layer corre- eV (Fig. 5b). The C(1s) signal in Fig. 5a is composedspond to those of the thin multi-layer, except for of contributions from the three different carbonpeaks 2 and 3. atoms of non-chemisorbed AN in the multi-layer,
Peak 2 of the thin multi-layer is shifted by 0.5 eV and from those of the chemisorbed AN mono-layer.(DW included) towards higher binding energy. The This broad C(1s) signal will be rationalized afterhump associated with this feature in the mono-layer examining the spectrum of the chemisorbed mono-

X. Crispin et al. / Journal of Electron Spectroscopy and Related Phenomena 121 (2001) 57 –74 63
Fig. 5. XPS (a) C(1s) peak and (b) N(1s) peak of a multi-layer of acrylonitrile adsorbed on a copper surface at T 5 2 1608C. Spectrum (c) isthe C(1s) peak of the chemisorbed AN mono-layer. Binding energies (Eb) are related to the Fermi level.
layer. The mono-layer, obtained after vaporization of As with UPS, an estimate of the polarizationthe multi-layer (T 5 2 1008C), is characterized by a energy can be obtained from the difference betweenbroad C(1s) signal (Fig. 5c) that can be decomposed the XPS Eb’s of AN in the gas phase and those ofinto two components: the first, at 286.5 eV, is the AN multi-layer (Table 2). The average value ofapproximately twice as intense as the second, cen- the polarization energy is 1.7 eV. Thus, the valuetered at 284.3 eV. These two components are then obtained from XPS for the core levels is 0.5 eVincluded in the C(1s) signal of the multi-layer in higher than that evaluated from UPS for the valenceorder to determine the contribution of the non-chemi- levels (1.2 eV). It has been shown that the polariza-sorbed AN layer. We therefore add one component tion energy is inversely proportional to the size offor each of the three carbon atoms of acrylonitrile in the hole [38]. The difference in polarization energythe non-chemisorbed layer. The width of these three observed is therefore consistent with the fact that thecomponents is taken as the typical width of a C(1s) hole created in a valence level in UPS is notpeak (1.5 eV) measured with our spectrometer, and localized on one atom, as is the case for the C(1s) ortheir intensities are set to be identical. The binding N(1s) XPS peaks, but is rather delocalized on theenergy differences among these three components molecule according to the molecular orbital in-are kept equal to those obtained in XPS studies of volved. As already noted for the polarization energygas-phase acrylonitrile [37]. For the broad C(1s) of the valence levels, the polarization energy of thepeak of Fig. 5a, the sum of the three components at core levels likely involves the contribution of both285.77, 286.65, and 286.84 eV attributed to the CH , the metal and the surrounding AN molecules. In2
CH, and CN carbon atoms of the non-chemisorbed order to discuss the different contributions to thelayers, respectively, and the two components at polarization energy, the following notation is286.5 and 284.3 eV corresponding to the chemi- adopted:sorbed mono-layer, is in good agreement with the
ANexperimental spectrum (Fig. 5a). (i) E (i, j) is the contribution of the AN mole-pol

64 X. Crispin et al. / Journal of Electron Spectroscopy and Related Phenomena 121 (2001) 57 –74
Table 2Core level binding energies (in eV) of AN in the gas phase and AN in the multi-layer. The multi-layer Eb’s with respect to the vacuum levelare obtained by adding the workfunction of the sample (W 5 3.8 eV) to the measured values. The difference between the gas-phase Eb’s andthe multi-layer Eb’s gives the polarization energy
aGas phase Multi-layer Polarization
(relative to E ) Relative to E Relative to E energy (eV)vac F vac
1C 292.61 286.84 290.64 1.77(H )22C 292.42 286.65 290.45 1.77(H)3C 291.54 285.77 289.57 1.77(N)
N 405.56 399.90 403.70 1.66
Average 1.74a From Ref. [37].
mcules surrounding the core hole created in layer i metal contribution to the polarization energy (E (1)polm m mfor a multi-layer of j layers (the first layer is in and E (2)). Estimating E (1) and E (2) ispol pol pol
contact with the metal). important since it allows extracting a value form AN(ii) E (i) is the metal contribution to the screen- E (2,2), in order to remove all the polarizationpol pol
ing of the hole formed after photoelectron emis- effects from the measured binding energy for thesion from layer i. chemisorbed AN mono-layer.
Following this notation, the polarization energy is 3.2. Characterization of the mono-layerswritten:
The AN mono-layer can be formed either byAN mFor a mono-layer: E (1,1) 1 E (1) partial evaporation of the multi-layer following anpol polAN mFor the first layer of a E (1,2) 1 E (1) increase in temperature, or by adsorption at a tem-pol pol
bi-layer: perature higher than the condensation temperature.AN mFor the second layer of E (2,2) 1 E (2) The first three curves (a, b, c) in Fig. 6 show thepol pol
a bi-layer: evolution of the C(1s) peak of an AN multi-layercondensed on nickel upon a temperature increase.
Note that the contribution of AN to the polariza- The total C(1s) signal intensity decreases and be-tion energy is expected to be similar for ionized comes constant for temperatures higher thanmolecules located in the first layer of a bi-layer or in 21208C, consistent with the evaporation of thethe second layer of a bi-layer, since both are multi-layer, and the persistence of a chemisorbed
ANsurrounded only by one AN layer: E (2,2) 5 mono-layer. The evaporation of the physisorbed ANpolANE (1,2). Hence, the only difference comes from the molecules corresponds to the decrease of the com-pol
metal screening, which is more efficient for the ponent located at 286.4 eV. However, this componentm mchemisorbed layer: E (1) . E (2), because of the does not disappear completely and is still present inpol pol
shorter distance to the metal. Since it is the surface the mono-layer; curve c therefore shows two com-a blayer that contributes most to the spectrum of a ponents: C(1s) at 286.4 eV and C(1s) at 283.8 eV.
bi-layer [39], the energy difference between the The C(1s) peak of the mono-layer formed by ad-maximum of the peak of the AN multi-layer and the sorption of AN at 2908C, i.e. above the condensa-peak in the gas phase gives an estimate of the tion temperature, is depicted in curve d. The com-intermolecular relaxation for molecules at the surface parison between the two types of mono-layers isof the multi-layer (non-chemisorbed). In other words, striking (comparison of curves c and d): the mono-the estimated value of the polarization energy (1.7 layer formed at 2908C shows only one peak at
AN meV) corresponds to E (2,2) 1 E (2). In a previous 283.9 eV [41]. These results thus suggest that twopol pol
paper [40], a model was proposed to evaluate the types of AN mono-layer can be formed on nickel.

X. Crispin et al. / Journal of Electron Spectroscopy and Related Phenomena 121 (2001) 57 –74 65
binding energy is related to the C(1s) component atlower binding energy.
Similar to the case of nickel (curve c in Fig. 6),the C(1s) spectrum of the mono-layer chemisorbedon Cu, after evaporation of the multi-layer (curve cin Fig. 7A; see also Figs. 1 and 5), has twocomponents appearing at 286.5 and 284.3 eV. As inthe AN/Ni system, the mono-layer obtained fromadsorption of AN at 2908C displays only one C(1s)peak centered at 284.9 eV (curve d in Fig. 7A),corresponding to the component at 284.3 eV in theC(1s) spectrum of the mono-layer formed from themulti-layer (curve c). The N(1s) peak of the mono-layer formed at 2908C (curve d in Fig. 7B) iscentered at 398.2 eV and corresponds to the lowerenergy component of the thin multi-layer (curve b inFig. 7B). Note that the spectra of both types ofmono-layer remain unchanged upon warming toroom temperature, which reflects the strength of thebond created between AN and the metals.
We interpret the existence of two different types ofchemisorbed AN mono-layers by considering twodifferent adsorption geometries:
(i) AN adsorbed flat on the surface. This corre-sponds to a very stable chemisorption via theC=C double bond and the nitrile group, consistentwith the fact that the C(1s) and N(1s) are bothshifted to lower binding energies (see Section
Fig. 6. Curves (a), (b), and (c) display the evolution of the C(1s)3.3).peak of an AN multi-layer adsorbed on Ni upon increasing the(ii) AN adsorbed perpendicular to the surface andtemperature. Curve (c) corresponds to the chemisorbed mono-layer
formed from the multi-layer, curve (d) is the C(1s) signal of the bonded to the metal surface via the nitrogen lonemono-layer formed by adsorption at 2908C. Binding energies are pair (s ). A donation–retrodonation process viaNreferred to the Fermi level. two different interactions involved in the N–metal
covalent bond [s –(3d–4s) and p –(3d–4s)N N
In order to check if this is specific to nickel, the overlap] could explain why the N(1s) peak is notsame comparison was made with the least reactive shifted compared to the multi-layer signal. In thismetal among the three studied: the copper surface. adsorption geometry, there is no strong interactionCurve a in Fig. 7A and B shows the C(1s) and N(1s) between the metal and the carbon atoms of thepeak of a thick AN multi-layer adsorbed on copper, molecule, consistent with the absence of a shift ofat 21608C. Upon adsorption of a thin multi-layer the C(1s) component relative to the multilayer.(between one and two layers), two components are Previous theoretical modeling [20] indicates thatpresent, both in the N(1s) spectrum, at 398.3 and the perpendicular adsorption complex is a stable400.2 eV (curve b in Fig. 7B), and in the C(1s) entity, although slightly less energetically favor-signal, at 284.8 and 286.7 eV (curve b in Fig. 7A). able than the flat one.Note that for both the C(1s) and N(1s) spectra, theratio between the two components is the same (0.4), The results suggest that the mono-layer formed viawhich indicates that the N(1s) component at lower AN adsorption at 2908C is composed exclusively of
66 X. Crispin et al. / Journal of Electron Spectroscopy and Related Phenomena 121 (2001) 57 –74
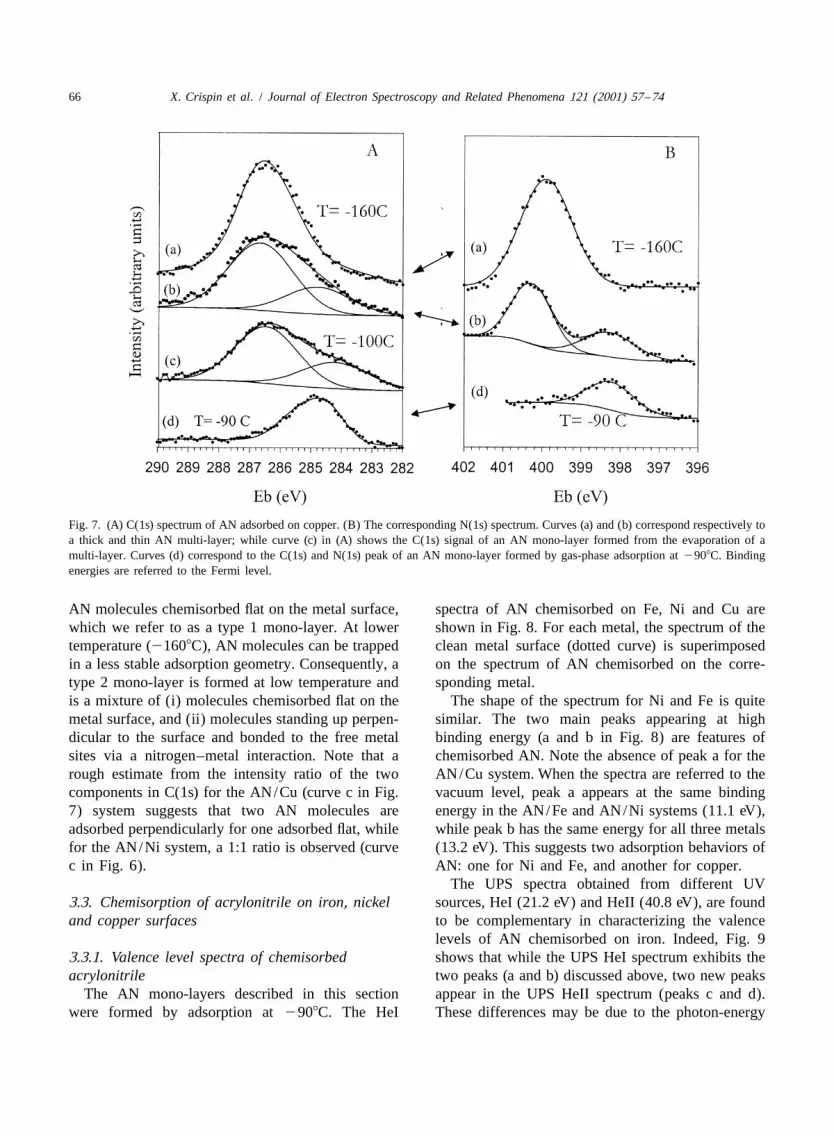
Fig. 7. (A) C(1s) spectrum of AN adsorbed on copper. (B) The corresponding N(1s) spectrum. Curves (a) and (b) correspond respectively toa thick and thin AN multi-layer; while curve (c) in (A) shows the C(1s) signal of an AN mono-layer formed from the evaporation of amulti-layer. Curves (d) correspond to the C(1s) and N(1s) peak of an AN mono-layer formed by gas-phase adsorption at 2908C. Bindingenergies are referred to the Fermi level.
AN molecules chemisorbed flat on the metal surface, spectra of AN chemisorbed on Fe, Ni and Cu arewhich we refer to as a type 1 mono-layer. At lower shown in Fig. 8. For each metal, the spectrum of thetemperature (21608C), AN molecules can be trapped clean metal surface (dotted curve) is superimposedin a less stable adsorption geometry. Consequently, a on the spectrum of AN chemisorbed on the corre-type 2 mono-layer is formed at low temperature and sponding metal.is a mixture of (i) molecules chemisorbed flat on the The shape of the spectrum for Ni and Fe is quitemetal surface, and (ii) molecules standing up perpen- similar. The two main peaks appearing at highdicular to the surface and bonded to the free metal binding energy (a and b in Fig. 8) are features ofsites via a nitrogen–metal interaction. Note that a chemisorbed AN. Note the absence of peak a for therough estimate from the intensity ratio of the two AN/Cu system. When the spectra are referred to thecomponents in C(1s) for the AN/Cu (curve c in Fig. vacuum level, peak a appears at the same binding7) system suggests that two AN molecules are energy in the AN/Fe and AN/Ni systems (11.1 eV),adsorbed perpendicularly for one adsorbed flat, while while peak b has the same energy for all three metalsfor the AN/Ni system, a 1:1 ratio is observed (curve (13.2 eV). This suggests two adsorption behaviors ofc in Fig. 6). AN: one for Ni and Fe, and another for copper.
The UPS spectra obtained from different UV3.3. Chemisorption of acrylonitrile on iron, nickel sources, HeI (21.2 eV) and HeII (40.8 eV), are foundand copper surfaces to be complementary in characterizing the valence
levels of AN chemisorbed on iron. Indeed, Fig. 93.3.1. Valence level spectra of chemisorbed shows that while the UPS HeI spectrum exhibits theacrylonitrile two peaks (a and b) discussed above, two new peaks
The AN mono-layers described in this section appear in the UPS HeII spectrum (peaks c and d).were formed by adsorption at 2908C. The HeI These differences may be due to the photon-energy

X. Crispin et al. / Journal of Electron Spectroscopy and Related Phenomena 121 (2001) 57 –74 67
Fig. 9. Comparison between the HeI and HeII UPS spectra of anAN mono-layer adsorbed on Fe. The dotted lines correspond tothe clean Fe surface.
cussed above. Before discussing the shape of thesespectra, it is important to remember that the metalsurfaces are polycrystalline and sputtered. The XPS
Fig. 8. Comparison between the UPS HeI spectra of the clean peaks are therefore expected to correspond to anmetal surface (? ? ?) and the spectra obtained after adsorption of average signal of slightly different adsorptionan AN mono-layer at 2908C (———).
geometries of AN because of the different adsorptionsites present on the surfaces. Consequently, there is
dependence of the cross section of the molecular no real meaning to use sophisticated methods toorbitals involved in the photoelectron emission. The decompose the peaks into different components.four peaks, characterizing AN chemisorbed on iron, Gaussian functions with a Shirley-type backgroundappear at 11.1, 13.2, 9.5 and 14.9 eV. The correlation were used to fit the experimental spectra. As there isbetween the UPS peaks observed for chemisorbed only one nitrogen atom per chemisorbed AN, theAN and the valence levels observed in the gas phase N(1s) peak is used to estimate the typical peakis complex because the valence levels are involved in width, which is then used to build the components ofthe chemisorption, and are therefore expected to be the C(1s) signal. The full width at half maximumshifted and split. (FWHM) of the N(1s) peak is 1.41 eV for AN/Cu,
1.29 eV for AN/Fe, and 1.28 eV for AN/Ni. In the3.3.2. Core levels of chemisorbed acrylonitrile XPS spectrum of gas-phase AN [37], the N(1s) and
Fig. 10 shows the C(1s) and N(1s) spectra of the C(1s) peaks were found to have almost identicalchemisorbed layers obtained by adsorption at FWHM. Consequently, the C(1s) peak of chemi-2908C, the UPS spectra of which have been dis- sorbed AN is fitted with three components having the

68 X. Crispin et al. / Journal of Electron Spectroscopy and Related Phenomena 121 (2001) 57 –74
Fig. 10. C(1s) (left) and N(1s) (right) spectra of AN mono-layers chemisorbed on Ni, Fe, and Cu. The dashed lines indicate the position ofthe peak maximum in the multi-layer. The binding energies are referred to the vacuum level.
same intensity and a FWHM of 1.4 eV. This simple 3. The dashed lines in Fig. 10 indicate the position ofdeconvolution scheme is displayed in Fig. 10 and the peak maximum for the bi-layer (290.2 eV forprovides the C(1s) binding energies reported in Table C(1s) and 403.8 eV for N(1s)). The C(1s) and N(1s)
spectra for AN/Cu are shifted to higher bindingenergies relative to AN/Ni and AN/Fe, whichTable 3suggests that the strength of the chemical interactionBinding energies in eV (with respect to the vacuum level) of the
N(1s) peak and the different components in the C(1s) signal of between the molecule and the metal is different onAN mono-layers chemisorbed on Cu, Ni and Fe copper compared to nickel and iron. Note, however,
AN/Ni AN/Fe AN/Cu that the shapes of the C(1s) spectra for AN adsorbedW 5 4.1 eV W 5 4.0 eV W 5 4.2 eV on nickel and iron are different. For the latter, a clear
a shoulder appears at low binding energy, whichC(1s) 289.0 288.6 289.8bC(1s) 288.1 288.3 289.0 suggests a stronger electronic density rearrangementcC(1s) 287.8 287.2 288.5 on one of the carbon atoms.
N(1s) 401.6 401.4 402.4 In order to discuss the partial charge transfer on

X. Crispin et al. / Journal of Electron Spectroscopy and Related Phenomena 121 (2001) 57 –74 69
Table 4Energetic contributions (in eV) included in Eq. (2). Note that (C(1s)1W ) corresponds to the peak maximum referred to the vacuum level.The last column is the evaluation of the charge on AN upon chemisorption. Q is the Sanderson charge carried on the AN moleculeAN
gasC(1s) N(1s) E C(1s)1W N(1s)1W C(1s) DE N(1s) DE Qcorr chem chem ANgas gas
1W 1W 1E 1E Eq. (2) Eq. (2) in ueucorr corr
Cu 289.1 402.4 2.1 291.2 404.5 1.0 1.1 0.25Ni 288.3 401.6 2.0 290.3 403.6 1.9 2.0 0.46Fe 288.0 401.4 1.9 289.9 403.3 2.3 2.3 0.55AN gas 292.2 405.6 –
the molecule upon chemisorption, only the position tronic density tail of the metal, and, consequently,of the C(1s) peak maximum is used (Table 4). A the surface dipole of the metal. While the valencelarge shift of the order of 3–4 eV appears between electrons of the metal are involved in the bond withthe measured C(1s) and N(1s) binding energies the AN molecule, the metal electron density aroundmeasured on the chemisorbed mono-layer (with the adsorption site extends away from the metalrespect to the vacuum level) and the gas-phase surface plane. The chemisorbed AN molecule can bevalues. This shift is not only due to the rearrange- seen as surrounded by the electron density of thement of the electron density upon chemisorption, metal. When an electron is removed from the chemi-DE , but also to several effects: (i) the surface sorbed molecule, it undergoes complex electrostaticchem
dipole effect (efD, where fD is a fraction f of the interactions resulting from the electronic density tailmetal surface dipole D); (ii) the metal polarization of the metal surrounding the adsorbate. In the early
menergy E (1); and (iii) the AN contribution to the model of Gadzuk [38], the molecule is ‘within’ thepolAN dipole surface potential eD. Hence, for chemisorp-polarization energy, E (1,1). Hence, in order topol
tion, the molecule is so close to the metal thatobtain the real ‘chemical’ effect DE due to thechem
additional energy feD is needed for the electron torearrangement of the electron density, the otherovercome a part f of the metal surface dipole D. Incontributions have to be subtracted. The core bindingorder to estimate this surface dipole contribution fD,energy for AN in the gas phase, Eb , can begas
we consider the factor f to be zero for an adsorbatecompared to the measured Eb(1,1) of the chemi-farther than 2z . In the jellium model describingsorbed AN mono-layer via the relation 0
metal surfaces, z is the position of the image plane0DEb 5 Eb 2 Eb(1,1)gas with respect to the atomic surface plane [42]. If them AN adsorbate is placed at z of the non-covered metal5 W 1 E (1) 1 E (1,1) 2 efD 1 DE 0AN-m pol pol chem
surface, f is 1 /2; and if the molecule is at z 5 0, i.e.(2)at the same position as the nuclei of the surface,f 5 1. For Cu(100), the values given in the literaturewhere W represents the reference level shiftAN-m
˚are distributed around z 5 1.2 A [44–48]. For(Fermi level vs. vacuum level). We thus make the 0
Ni(100), the only value found is close to that ofdrastic approximation that these effects are additive˚and independent of each other; this is true only to a copper (z 5 1.3 A [44]). From these limiting cases0
certain extent; therefore, the evaluation of all the of the parameter f, a first approximation is to take aterms proposed below must be considered as semi- linear interpolation that gives f 5 0.21 for AN lo-
˚quantitative at best. cated at 1.9 A from the metal surface. The surfaceTheoretical models indicate that the C and N dipole potential energy, eD, obtained as the differ-
˚nuclei of chemisorbed AN are located at (1.9 A ence between the calculated density functional bulkfrom the metal surface nuclei [15,20], and that the chemical potential and the experimental workfunc-electron density of a metal surface is known to tion, is 3.6 eV for Cu, 4.2 eV for Ni and 4.9 eV for Fe
¨decrease exponentially over several Angstroms [42] [49]. Hence, the contribution (efD) is 0.8, 0.9 andaway from the surface plane of the nuclei. Hence, the 1.0 eV, for Cu, Ni and Fe. This contribution has to bechemisorbed molecules strongly modify the elec- subtracted from the measured binding energy Eb in

70 X. Crispin et al. / Journal of Electron Spectroscopy and Related Phenomena 121 (2001) 57 –74
order to isolate the chemical effect of the chemisorp- these authors is probably due to the similar relaxa-tion. Note that this effect is opposite to the metal tion energies of the compounds investigated. Theyscreening effect for comparison with gas-phase found that the C(1s) binding energy is correlated tobinding energies. the atomic charge by a factor of 16.7 eV/ ueu. We use
In a previous work [40], the metal polarization this factor and not the absolute value of the bindingmenergy E (1) was estimated to be 2.3 eV. The AN energy to estimate the charge on the adsorbate. Forpol
molecules surrounding the hole also contribute sig- copper, the three carbon atoms undergo a global shiftnificantly to the polarization energy in the term of 1.0 eV, while the N(1s) shifts by 1.1 eV. Consider-
ANE (1,1). In Section 3.1, the polarization energy for ing the charge increase on each atom, AN chemi-pol
a localized hole (C(1s), N(1s)) in an AN bi-layer was sorbed on copper carries a charge of h[(331.0)1
evaluated to be 1.7 eV. As explained before, this 1.1] /16.7j50.25ueu. Following the same approach,value corresponds to the surface layer of a bi-layer. chemisorbed AN has a charge of 0.46 and 0.55ueu on
mHence, for the top layer of a bi-layer: E (2) 1 Ni and Fe, respectively.polAN mE (2,2) 5 1.7 eV. E (2) has been estimated to be As expected from the qualitative comparisonpol pol
AN0.5 eV using a JJJ barrier-type [40,43,44]; E (2,2) between the multi-layer (dashed vertical line in Fig.pol
is therefore equal to 1.2 eV. A rough approximation 10) and the mono-layer spectra, the partial chargeis to consider that the molecules within the layer transfer is more important for iron and nickel thanwhere the hole is located contribute equally to the for copper. The partial charge transfer between theAN polarization energy compared to the contribution AN molecule and the metal upon chemisorption canfrom the molecules belonging to the other layer in a be rationalized on the basis of electronic chemicalbi-layer system. Following this assumption, the potentials m [20,53] used in DFT. When two systems
ANpolarization effect of AN in a mono-layer E (1,1) interact, their electronic chemical potentials tend topolAN1
]is E (2,2) 5 0.6 eV. equalize; this determines the direction of electronpol2
Table 4 displays the estimation of the chemical transfer [23,24]. The charge goes from the speciesshift DE as deduced from Eq. (2). For all the with the higher chemical potential towards that withchem
metals, the estimated shift is positive and very the lower chemical potential. The chemical potentialsimilar for N(1s) and C(1s). This means that the of AN can be estimated from the finite-differenceelectron density around both the carbon and the approximation, i.e. as the opposite of the averagenitrogen atoms is increased upon chemisorption. In between the first ionization potential (IP) and the
1]other words, there is a partial electron transfer from electron affinity (EA) [54,55]: m 52 (IP1EA).AN 2
the metal surface to the AN molecule. The chemical From the vertical IP and EA obtained with DFTshift of C(1s) and N(1s) indicates that both the calculations, the electronic chemical potential of ANcarbon and nitrogen atoms are involved in the is estimated to be m 525.5 eV [20]. For theAN
chemisorption, as expected from our previous theo- metals, the DFT chemical potential is the opposite ofretical simulations showing a preferential chemisorp- the workfunction m 5 2 W [56,57]. The valuesm
tion of AN flat on copper, iron and nickel surfaces obtained for the metal surfaces used for the ad-[15,19,21,50] via both the C=C double bond and the sorption of AN (m 5 2 4.7 eV, m 5 2 4.8 eV,Cu Ni
nitrile group. m 5 2 4.4 eV) are higher than that for the ANFe
The chemical shift DE can be used to evaluate molecule. Consequently, the chemical potentialchem
the charge on the molecule. Attempts to correlate equalization is expected to produce a partial electronC(1s) binding energies and atomic charges face transfer from the metal surface (Cu, Ni or Fe) to theseveral difficulties: the intramolecular relaxation AN adsorbate. However, the chemical potentialenergy differs from molecule to molecule [51] and difference alone does not explain the higher chargethe definition of the atomic charge is a delicate transfer observed with nickel compared to copper,matter [52]. The linear correlation obtained by Patil since they have similar workfunctions (W 5 4.7 eVCu
et al. [51] between the atomic charge and the C(1s) and W 5 4.8 eV). This difference can be understoodNi
binding energy for benzene derivatives is used in from the finite-difference approximation expressionorder to evaluate the charge transferred between the for the charge transferred DN between the metal andmetal and AN. The good correlation obtained by AN [23,25]:

X. Crispin et al. / Journal of Electron Spectroscopy and Related Phenomena 121 (2001) 57 –74 71
DN 5 (m 2 m ) /2(h 1h ) (3) (i) The first contribution, D , comes from theAN m AN m chem
formation of a chemisorption dipole between thewhere h and h are the chemical hardness of the metal and the adsorbate due to the charge transferm AN
isolated reactants [55]. The chemical hardness of AN upon chemisorption. This effect is essential tocan be obtained, in the same finite-difference approx- explain the workfunction change upon theimation, from the difference between the ionization chemisorption of alkali metal atoms, for which a
1]potential and the electron affinity [55]: h 5 (IP2 large charge transfer occurs [59,60].AN 2
EA). From DFT calculations, h is estimated to be (ii) The second contribution, DD, is due to theAN
5.51 eV [20]. For a metal, the chemical hardness is modification of the metal surface dipole uponequal to half the inverse of the density of states at the adsorption. For physisorbed mono-layers, thisFermi level g(E ) [58]: h 5 1/ [2g(E )]. On that contribution is the most important one and leadsF m F
basis, a large difference in hardness is expected to a decrease of the workfunction. For instance, abetween copper and nickel. Indeed, since the Fermi mono-layer of Xe adsorbed on Pd leads to alevel in copper is located in the 4s band, the density workfunction decrease of 0.9 eV [61]. The pres-of states at the Fermi level is much lower than for ence of the molecule leads to a shortening of thenickel, for which E is in the 3d unfilled band. This electron density tail at the metal surface [62]. AsF
is illustrated by the UPS spectra of the clean metal a result, the metal surface dipole D is significantlysurfaces in Fig. 8. Consequently, the hardness of reduced and the workfunction is decreased by thecopper is significantly larger than the hardness of same amount, since, for a metal surface, W 5 2nickel, which should lead to a smaller charge transfer ¯ ¯m 1 D, where m is the internal chemical potential.between Cu and AN compared to Ni and AN (Eq.(3)). The case of acrylonitrile is intermediate between
the two extreme cases; therefore, the measured DWis a combination of the two contributions. Indeed, the3.4. Workfunction change upon AN chemisorptionXPS data reveal that a partial electron charge transferDN occurs from the metal surfaces towards the ANWorkfunction changes upon adsorption are shownadsorbate. This partial charge transfer creates ain Fig. 8. The clean metal spectra are normalized tochemisorption dipole between the positively chargedthe corresponding AN/metal spectra by equalizingmetal surface and the negatively charged AN adsor-the intensities of the 3d metal peak. Since thebates. The corresponding contribution D is thuschemsecondary electron background has a significantexpected to increase the work necessary for a metalcontribution of inelastic photoelectrons coming fromphotoelectron to leave the surface. However, asthe metal, the fact that the workfunction of thedescribed above, the UPS spectra reveal a decreaseAN/metal sample (measured from the cut-off of theof the metal workfunction upon adsorption. Thisbackground) is different from that of the clean metalclearly indicates that the workfunction change iscan be associated with a change of metal workfunc-dominated by the other contribution (DD) comingtion. A decrease of the workfunction, DW, is mea-from the metal surface dipole modification uponsured upon AN chemisorption: 0.4 eV for Fe, 0.7 eVadsorption.for Ni and 0.5 eV for Cu
Since the negative charge on chemisorbed ANAmong studies dealing with the workfunctionincreases in the series Cu→ Ni→ Fe (see Table 4),change of metal surfaces upon adsorption, the twothe contribution D due to the formation ofchemextreme cases are the chemisorption of alkali atomsdipoles between the metal surface and the chemi-(for which there is a large charge transfer; e.g. Refs.sorbed mono-layer follows a parallel increase in this[59,60]) and the physisorption of inert gas atoms (forseries. The observed decrease in the workfunction iswhich no charge transfer occurs between the adsor-then explained by a more and more negative contri-bate and the metal surface).bution DD in the series Cu→ Ni→ Fe. Note that theTwo important contributions to the workfunctionincreasing contribution of DD in the serieschange upon adsorption can thus be considered:Cu→Ni→Fe is consistent with the increasing valueof the dipole D in this series (D 5 3.6 eV, D 5DW 5 D 1 DD (4) Cu Nichem

72 X. Crispin et al. / Journal of Electron Spectroscopy and Related Phenomena 121 (2001) 57 –74
4.2 eV, D 5 4.9 eV [49]). This suggests that the surface dipole effects thus contribute about 2 eV toFe
larger the extension of the electron density tail out of the observed DEb total shift. The remaining 1–2 eVthe metal, i.e. the higher the metal surface dipole D, shift is the chemical shift DE due to initial statechem
the more sensitive the electron density tail is to a effects related to the electron density rearrangementchange in the environment, such as the presence of upon chemisorption. Both the N(1s) and C(1s) peaksan adsorbate. undergo the same chemical shift, which is consistent
with the fact that the AN molecules interact via boththe C=C and nitrile C≡N group by 2p –3d andp
4. Conclusions 2p –4s atomic orbital overlaps.p
From the evaluated chemical shift, the charge onX-ray and UV photoelectron spectroscopies show the chemisorbed AN molecules is estimated to be
that acrylonitrile is chemisorbed on Cu, Ni and Fe 0.25ueu for AN/Cu, 0.46ueu for AN/Ni and 0.55ueu forpolycrystalline surfaces via the carbon and nitrogen AN/Fe. This partial charge transfer can be under-atoms. Depending on the procedure used, two kinds stood in terms of chemical potential equalization, asof layers can be formed: expressed in Density Functional Theory. The
chemisorption of AN on the transition metal surfaces• An AN mono-layer of type 1 is formed via induces a systematic decrease of the workfunction W
vaporization of the multi-layer; it is a mixture of: as measured from UPS spectra (DW 5 2 0.5, 20.4(i) AN molecules adsorbed flat on the surface and and 20.7 eV for Cu, Ni and Fe, respectively),chemically bound by a (2p )–(3d/4s) overlap via despite the fact that the surface dipole D formedp chem
both the C=C double bond and the C≡N nitrile upon chemisorption would be expected to increasegroup; and (ii) AN molecules adsorbed perpen- the workfunction. The measured decrease of Wdicular to the surface via a covalent interaction indicates that the metal surface dipole energy modi-between the nitrogen lone pair and the 3d–4s fication upon chemisorption DD overcomes thelevels of the metals. effect of the chemisorption dipole. Note that DD is
• An AN mono-layer of type 2 is formed by found to be higher for the metal having a higheradsorption from AN from the gas phase at a metal surface dipole potential D.temperature higher than the condensation tem- In a broader context, the chemisorption of AN onperature. This type of mono-layer consists only of these metal surfaces is a strong indication that theAN molecules adsorbed flat on the metal surface. AN monomer (as a prototype for vinylic monomers
with electron-withdrawing groups) indeedFor the flat adsorption geometry, the XPS data chemisorbs on the surface of metal electrodes. Based
show a shift in binding energy DEb of 3–4 eV on the present results and the experimental andbetween the C(1s) and N(1s) peaks of AN adsorbed theoretical studies mentioned in the Introduction, theflat and the corresponding AN gas-phase peaks. chemisorption of acrylonitrile appears to be theThese shifts are not only due to a chemical effect but initial step in the electrochemical generation of thealso to other effects, which we take as additive and corresponding polymers chemically grafted ontoindependent of each other: (i) the polarization energy transition metals.coming from the surrounding AN molecules in themono-layer, which has been estimated to be 0.6 eV;(ii) the metal polarization energy, calculated to be2.3 eV for a photoelectron ejected from the core Acknowledgementslevels of chemisorbed AN; (iii) chemisorption also
¨implies that AN is within the metal surface dipole; The Mons–Linkoping collaboration is supportedconsequently, a photoelectron ejected from a core by the European Commission ‘Research and Train-level of AN has to overcome a part of the metal ing Networks Program (Project LAMINATE)’. Thissurface dipole potential, which requires an energy work was partly supported by the Belgian Federal( fD) of the order of 1 eV. The polarization and metal Government ‘Service des Affaires Scientifiques,

X. Crispin et al. / Journal of Electron Spectroscopy and Related Phenomena 121 (2001) 57 –74 73
[20] (a) B.H. Loo, T. Kato, Surf. Sci. 284 (1993) 167;Techniques et Culturelle (SSTC)’ in the framework(b) X. Crispin, V. Geskin, R. Lazzaroni, C. Bureau, W.ˆof ‘Pole d’Attraction Interuniversitaire en Chimie
´Salaneck, J.L. Bredas, J. Chem. Phys. 111 (1999) 3237.´ ´Supramoleculaire et Catalyse Supramoleculaire (PAI ´ ˆ ´[21] X. Crispin, V. Geskin, R. Jerome, R. Lazzaroni, J.L. Bredas,4 /11)’. The work in Mons was also supported by in: J.J. Pireaux, J. Delhalle, P. Rudolf (Eds.), Proceedings ofFNRS-FRFC. XC is a grant holder of the Marie- the Second International Conference on Polymer–Solid
interfaces: From Model to Real Systems, Presses Univer-Curie Individual Fellowship (contract HPMF-CT-sitaires, Namur, 1996, p. 53.ˆ2000-00646). RL is ‘Maıtre de Recherches du Fonds
[22] R.G. Pearson, J. Am. Chem. Soc. 85 (1963) 3533.National de la Recherche Scientifique (FNRS)’.[23] R.F. Nalewajski, J. Am. Chem. Soc. 106 (1984) 944.[24] W.J. Mortier, S.K. Ghosh, S. Shankar, J. Am. Chem. Soc.
108 (1986) 4315.[25] R.G. Parr, W. Yang, Density-Functional Theory of Atoms andReferences
Molecules, Oxford University Press, New York, 1989.[26] Scienta: http: / /www.ifm.liu.se /Surfphys /equipment / scien-
[1] G.A. Somorjai, Introduction to Surface Chemistry andta1.jpg.
Catalysis, Wiley, New York, 1994.[27] V. Stary, J. Phys. D 32 (1999) 1811.´ ¨[2] G. Lecayon, C. LeGressus, A.L. Moel, Eur. Patent 0038244,[28] K. Kimura, S. Katsumata, Y. Achiba, T. Yamazaki, S. Iwata,1981.
Handbook of HeI Photoelectron Spectra of Fundamental´[3] G. Lecayon, Y. Bouizem, C. LeGressus, C. Reynaud, C.Organic Molecules, Halsted Press, New York, 1981.Boiziau, C. Juret, Chem. Phys. Lett. 91 (1982) 506.
[29] J. Delwiche, M. Gochel-Dupuis, J.E. Collin, J. Heinesch, J.´[4] J. Tanguy, P.Viel, G. Deniau, G. Lecayon, Electrochim. ActaElectron Spectrosc. Relat. Phenom. 66 (1993) 65.38 (1993) 1501.
[30] W. Salaneck, Phys. Rev. Lett. 40 (1978) 60.´ ´[5] J. Tanguy, G. Deniau, C. Auge, G. Zalczer, G. Lecayon, J.[31] N. Sato, K. Seki, H. Inokuchi, J. Chem. Soc., Faraday Trans.Electroanal. Chem. 377 (1994) 123.
(1981) 77.´ ˆ[6] R. Jerome, M. Mertens, L. Martinot, Adv. Mater. 7 (1995)[32] N. Sato, H. Inokuchi, I. Shirotani, Chem. Phys. 60 (1981)807.
327.´ ˆ[7] M. Mertens, C. Calberg, L. Martinot, R. Jerome, Macro-[33] P. Parent, C. Laffon, G. Tourillon, A. Cassuto, J. Phys.molecules 29 (1996) 4910.
Chem. 99 (1995) 5058.´[8] C. Bureau, G. Deniau, P. Viel, G. Lecayon, Macromolecules[34] D.P. Chong, Chem. Phys. Lett. 232 (1995) 486.30 (1997) 333.[35] A.R. Williams, R.A. deGroot, C.B. Sommers, J. Chem. Phys.´[9] G. Deniau, G. Lecayon, C. Bureau, J. Tanguy, in: Y.
63 (1975) 628.Pauleau, P.B. Barna (Eds.), Protective Coatings and Thin´[36] C. Bureau, D.P. Chong, G. Lecayon, J. Delhalle, J. ElectronFilms, Kluwer Academic, Dordrecht, 1997, p. 265.
Spectrosc. Relat. Phenom. 83 (1997) 227.´[10] N. Baute, P. Teyssie, L. Martinot, M. Mertens, P. Dubois, R.[37] A.N. deBrito, S. Svensson, H. Agren, J. Delhalle, J. Electron´ ˆJerome, Eur. J. Inorg. Chem. (1998) 1711.
Spectrosc. Relat. Phenom. 63 (1993) 239.[11] S. Leroy, C. Boiziau, J. Perreau, C. Reynaud, G. Zalczer, G.[38] J.W. Gadzuk, Phys. Rev. B 14 (1976) 2267.´Lecayon, C.L. Gressus, J. Mol. Struct. 128 (1985) 269.[39] R. Opila, R. Gomer, Surf. Sci. 127 (1983) 569.´[12] G. Deniau, P. Viel, G. Lecayon, J. Delhalle, Surf. Interface
´[40] X. Crispin, R. Lazzaroni, V. Geskin, J.L. Bredas, W. SalaneckAnal. 18 (1992) 443.(submitted for publication).[13] C. Bureau, M. Defranceschi, J. Delhalle, G. Deniau, J.
[41] Note that the FWHM for the peak in curve d and the´Tanguy, G. Lecayon, Surf. Sci. 311 (1994) 349.component in curve c are different because the spectra were[14] P. Jonnard, F. Vergand, P.F. Staub, C. Bonnelle, G. Deniau,obtained with different spectrometers.´C. Bureau, G. Lecayon, Surf. Interface Anal. 24 (1996) 339.
[42] N.D. Lang, W. Kohn, Phys. Rev. B 7 (1973) 3541.[15] (a) X. Crispin, R. Lazzaroni, V. Geskin, N. Baute, P. Dubois,[43] R.O. Jones, P.J. Jennings, O. Jepsen, Phys. Rev. B 29 (1984)´ ˆ ´R. Jerome, J.L. Bredas, J. Am. Chem. Soc. 121 (1999) 176;
6474.(b) Y. Bouizem, F. Chao, M. Costa, A. Tadjeddine, G.J.[44] N.V. Smith, C.T. Chen, M. Weinert, Phys. Rev. B 40 (1989)´Lecayon, Electroanal. Chem. 172 (1984) 101.
7565.´[16] (a) J. Tanguy, G. Deniau, G. Zalczer, G. Lecayon, J.[45] M. Weinert, S.L. Hulbert, P.D. Johnson, Phys. Rev. Lett. 55Electroanal. Chem. 417 (1996) 175;
(1985) 2055.´(b) J. Charlier, C. Bureau, G. Lecayon, J. Electroanal.[46] S.L. Hulbert, P.D. Johnson, M. Weinert, Phys. Rev. B 34Chem. 465 (1999) 200.
(1986) 3670.´[17] P. Viel, C. Bureau, G. Deniau, G. Zalczer, G. Lecayon, J.¨[47] G. Thorner, G. Borstel, Appl. Phys. A 41 (1986) 99.Electroanal. Chem. 470 (1999) 14.
[48] M. Ortuno, P.M. Echenique, Phys. Rev. B 34 (1986) 5199.[18] X. Crispin, V. Geskin, C. Bureau, R. Lazzaroni, W. Schmic-´kler, J.L. Bredas, J. Chem. Phys. (submitted for publication). [49] N.D. Lang, in: S. Lundqvist, N.H. March (Eds.), Theory of
´ ´[19] V. Geskin, R. Lazzaroni, M. Mertens, R. Jerome, J.L. Bredas, the Inhomogeneous Electron Gas, Plenum Press, New York,J. Chem. Phys. 105 (1996) 3278. 1983, pp. 309.

74 X. Crispin et al. / Journal of Electron Spectroscopy and Related Phenomena 121 (2001) 57 –74
´[50] X. Crispin, V. Geskin, R. Lazzaroni, C. Bureau, J.L. Bredas, [56] N.D. Lang, W. Kohn, Phys. Rev. B 3 (1970) 1215.Eur. J. Inorg. Chem. (1999) 349. [57] F. Garcia-Moliner, F. Flores, Introduction to the Theory of
[51] V. Patil, S. Oke, M. Sastry, J. Electron Spectrosc. Relat. Solid Surfaces, Cambridge, 1979.Phenom. 85 (1997) 249. [58] W. Yang, R.G. Parr, Proc. Natl. Acad. Sci. USA 82 (1985)
[52] B. Folkesson, R. Larsson, J. Electron Spectrosc. Relat. 6723.Phenom. 50 (1990) 251. [59] J.R. Macdonald, C.A. Barlow, J. Chem. Phys. 39 (1963) 412.
´[53] C. Bureau, G. Deniau, P. Viel, G. Lecayon, J. Delhalle, J. [60] N.D. Lang, Phys. Rev. B 4 (1971) 4234.Adhesion 58 (1996) 101. [61] K. Wandelt, J.E. Hulse, J. Chem. Phys. 80 (1984) 1340.
[54] R.G. Parr, R.A. Donnelly, M. Levy, W.E. Palke, J. Chem. [62] D.L. Price, J.W. Halley, Phys. Rev. B 38 (1988) 9357.Phys. 68 (1978) 3801.
[55] R.G. Parr, R.G. Pearson, J. Am. Chem. Soc. 105 (1983)7512.
Copyright © 2022 FDOKUMEN