Photoelectron Spectroscopy and Thermochemistry of the Peroxyformate Anion
Upload
independentCategory
view
0download
0
arX
iv:c
ond-
mat
/061
1120
v1 [
cond
-mat
.mtr
l-sc
i] 5
Nov
200
6Fecher et al., HEHRPES of Co2Mn1−xFexSi.
High energy, high resolution photoelectron spectroscopy of
Co2Mn1−xFexSi.
Gerhard H. Fecher, Benjamin Balke, Siham Ouardi, and Claudia Felser∗
Institut fur Anorganische und Analytische Chemie,
Johannes Gutenberg - Universitat, D-55099 Mainz, Germany.
Eiji Ikenaga, Jung-Jin Kim, Shigenori Ueda, and Keisuke Kobayashi
Japan Synchrotron Radiation Research Institute (SPring-8/JASRI),
Kouto 1-1-1, Sayo-cho, Sayou-gun, Hyogo, 679-5198, Japan
(Dated: February 6, 2008)
Abstract
This work reports on high resolution photoelectron spectroscopy for the valence band of
Co2Mn1−xFexSi (x = 0, 0.5, 1) excited by photons of about 8 keV energy. The measurements
show a good agreement to calculations of the electronic structure using the LDA+U scheme. It
is shown that the high energy spectra reveal the bulk electronic structure better compared to low
energy XPS spectra. The high resolution measurements of the valence band close to the Fermi
energy indicate the existence of the gap in the minority states for all three alloys.
PACS numbers: 79.60.Bm, 71.20.Lp, 71.20.Nr
Keywords: Heusler compounds, Photoelectron spectroscopy, Electronic Structure, Intermetallics.
∗Electronic address: [email protected]
1

I. INTRODUCTION
Electronic devices exploiting the spin of an electron (spintronics [1]) have attracted great
scientific interest in particular for magneto-electronics [2]. The basic element is a ferromag-
netic electrode providing a spin polarised electrical current. Materials with a complete spin
polarisation would be most desirable, i.e. a metal for spin up and an insulator for spin
down electrons. Such materials are called half-metallic ferromagnets [3, 4]. Kubler et al
[5] recognised that the minority-spin state density at the Fermi energy nearly vanishes in
the Heusler compounds Co2MnAl and Co2MnSn. The authors concluded that this should
lead to peculiar transport properties in these compounds because only the majority den-
sity contributes. The Heusler alloy Co2MnSi has attracted particular interest because it is
predicted to have a large minority spin band gap of 0.4 eV and, at 985 K, has one of the
highest Curie temperatures, among the known Heusler compounds [6, 7]. An even higher
Curie temperature (1100 K) accompanied by a large magnetic moment (6 µB) was found in
recent investigations of Co2FeSi [8, 9, 10]. The end members of the series Co2Mn1−xFexSi,
that are the purely Mn or Fe containing compounds, have been used for fabrication of mag-
netic tunnel junctions [11, 12]. The tunnel magneto-resistance ratios of 159% in the Mn
compound at low temperature and 41% in the Fe compound at room temperature suggest
that still an improvement in the materials is necessary for successful use in devices.
It was recently shown that the complete substitutional series Co2Mn1−xFexSi (0 ≤ x ≤ 1)
orders in the Heusler type L21 structure [13]. Magneto-structural investigations using 57Fe
Moßbauer spectroscopy confirmed the high degree of structural order. A structural phase
transitions at about 1025 K was detected by means of differential scanning calorimetry.
Low temperature magnetometry confirmed a Slater-Pauling like behaviour [14] of the com-
plete series of alloys with the magnetic moment increasing linearly from 5 µB to 6 µB with
increasing iron content x from 0 to 1.
Photoelectron spectroscopy is one of the best suited techniques to study the occupied
electronic structure of materials. Low kinetic energies result in a small electron mean free
path of less than 5.2 A at kinetic energies below 100 eV. That is, the escape depth of the
electrons is less than one cubic cell of the investigated compounds and mainly the surface
will contribute to the intensity if using UV light for excitation. This very high surface
sensitivity may be able to explain the quite low spin polarisation of photoelectrons emerging
2

from single crystalline Co2MnSi films at the Fermi level of only 12 % [15]. Wang et al
[15, 16] assumed that partial chemical disorder was responsible for this discrepancy with the
theoretical predictions.
In the common X-ray photoelectron spectroscopy (XPS) one uses medium energies for
excitation being provided by Al-Kα or Mg-Kα sources resulting in a probing depth of about
24 A at 1.2 keV. The situation becomes much better at higher energies. In hard X-ray pho-
toelectron spectroscopy with excitation energies of about 8 keV one will reach a high bulk
sensitivity with an escape depth being larger than 115 A (corresponding to 20 cubic cells).
Lindau et al [17] demonstrated in 1974 the possibility of high energy photoemission with
energies up to 8 keV, however, no further attention was devoted to such experiments for
many years. High energy photoemission (at about 15 keV excitation energy) was also per-
formed as early as 1989 [18] using a 57Co Moßbauer γ-source for excitation, however, with
very low resolution only. Nowadays, high energy excitation and analysis of the electrons
become easily feasible due to the development of high intense sources (insertion devices at
synchrotron facilities) and multi-channel electron detection. Thus, high energy photoemis-
sion spectroscopy was recently introduced by several groups [19, 20, 21, 22, 23, 24] as a bulk
sensitive probe of the electronic structure in complex materials.
In Ref. [25] it was demonstrated that high energy photoelectron spectroscopy is a use-
ful tool to study the electronic structure of complex Heusler alloys using the example of
Co2Cr0.6Fe0.4Al. In that work photon energies of 3.5 keV were used for excitation, and
compared to resonant, medium energy (0.5-0.8 keV) excitation at the L3,2 edges of the con-
tributing 3d-transition metals. In the present work, an excitation energy of hν = 8 keV
was used to study the density of states of Co2Mn1−xFexSi with x = 0, 0.5, 1.
II. EXPERIMENTAL AND COMPUTATIONAL DETAILS
Co2Mn1−xFexSi samples were prepared by arc melting of stoichiometric amounts of the
constituents in an argon atmosphere at 10−4 mbar. Care was taken to avoid oxygen contam-
ination. This was ensured by evaporating Ti inside of the vacuum chamber before melting
the compound as well as by additional purifying of the process gas. After cooling of the
resulting polycrystalline ingots, they were annealed in an evacuated quartz tube for 21 days.
Rods with a dimension of (1 × 1 × 5) mm3 were cut from the ingots by spark-erosion for
3

experiments on in-situ fractured samples. Flat discs with about 10 mm diameter and 1 mm
thickness were cut and polished for spectroscopic investigations. Further experimental de-
tails and results of the structural and magnetic properties are reported in Ref. [13, 26].
X-ray photoemission spectroscopy was used to verify the composition and to check the
cleanliness of the samples. After removal of the native oxide from the polished surfaces by
Ar+ ion bombardment, no impurities were detected with XPS. The ESCALAB Mk II (VG)
was also used to take valence band spectra at 1253.6 eV (Mg Kα with a natural line width
of 0.69 eV [27]) for comparison. For this purpose, the slits and pass energy were set for an
analyser-resolution of 200 meV. The energy was calibrated at the Au 4f7/2 emission line.
The electronic structure was explored experimentally by means of high energy X-ray
photoemission spectroscopy (HXPS). The measurements were performed at the beamline
BL47XU of SPring 8 (Hyogo, Japan). The photons are produced by means of a 140-pole in-
vacuum undulator and are further monochromatised by two double-crystal monochromators.
The first monochromator uses Si(111) crystals and the second a Si(111) channel-cut crystal
with 444 reflections (for 8 keV X-rays). The energy of the photoemitted electrons is analysed
using a Gammadata - Scienta R 4000-10kV electron spectrometer. The ultimate resolution
of the set up (monochromator plus analyser at 50 eV pass energy using a 200 µm slit) is
83.5 meV at 7935.099 eV photon energy as employed for the reported experiments. Under
the present experimental conditions an overall resolution of 250 meV has been reached for
the valence band spectra and 130 meV for the spectra taken at the Fermi energy. All values
concerning the resolution are determined from the Fermi-edge of an Au sample. Due to the
low cross-section of the valence states from the investigated compounds, the spectra had to
be taken with Epass = 200 eV and a 500 µm (200 µm) slit for a good signal to noise ratio.
The polycrystalline samples have been fractured in-situ before taking the spectra to remove
the native oxide layer. Core-level spectra have been taken to check the cleanliness of the
samples. No traces of impurities were found. The valence band spectra were collected over
up to 4 h at about 100 mA electron current in the storage ring in the top-up mode. All
measurements have been taken at a sample temperature of 20 K.
The self-consistent electronic structure calculations have been carried out using the full
potential linearised augmented plane wave method (FLAPW) as provided by Wien2k [28].
The exchange-correlation functional was taken within the generalised gradient approxima-
tion (GGA) as introduced by Perdew et al [29]. A 25 × 25 × 25 mesh has been used for
4
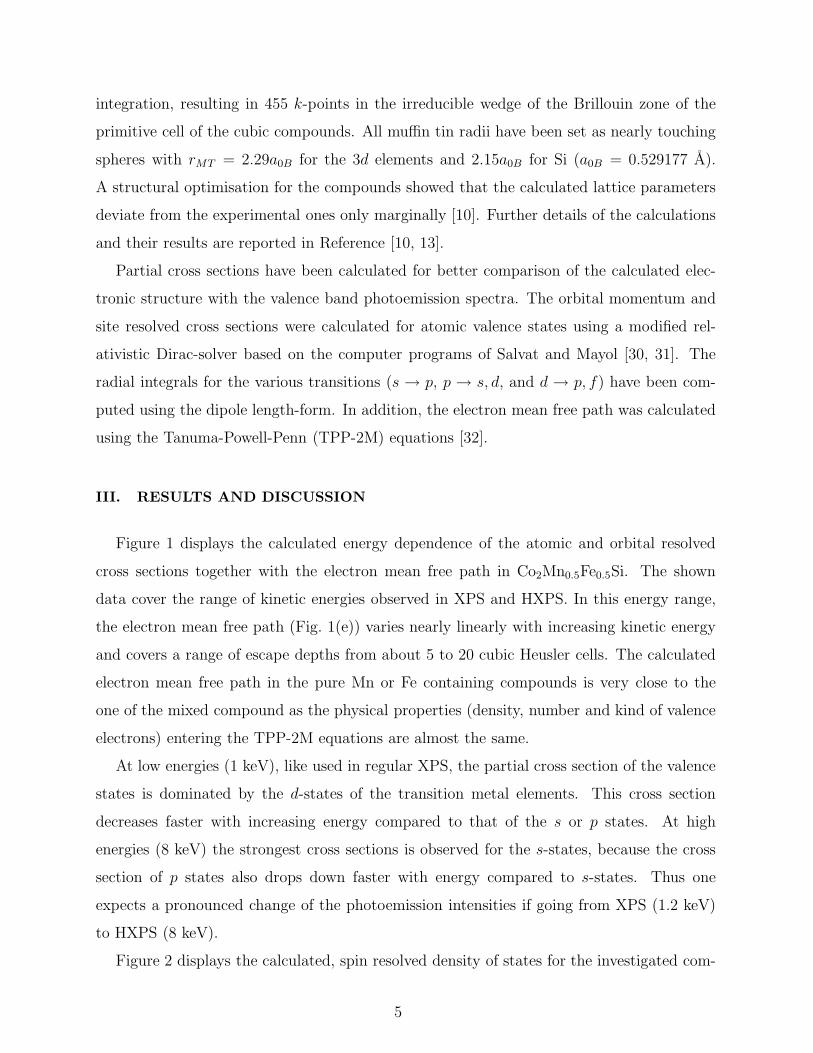
integration, resulting in 455 k-points in the irreducible wedge of the Brillouin zone of the
primitive cell of the cubic compounds. All muffin tin radii have been set as nearly touching
spheres with rMT = 2.29a0B for the 3d elements and 2.15a0B for Si (a0B = 0.529177 A).
A structural optimisation for the compounds showed that the calculated lattice parameters
deviate from the experimental ones only marginally [10]. Further details of the calculations
and their results are reported in Reference [10, 13].
Partial cross sections have been calculated for better comparison of the calculated elec-
tronic structure with the valence band photoemission spectra. The orbital momentum and
site resolved cross sections were calculated for atomic valence states using a modified rel-
ativistic Dirac-solver based on the computer programs of Salvat and Mayol [30, 31]. The
radial integrals for the various transitions (s → p, p → s, d, and d → p, f) have been com-
puted using the dipole length-form. In addition, the electron mean free path was calculated
using the Tanuma-Powell-Penn (TPP-2M) equations [32].
III. RESULTS AND DISCUSSION
Figure 1 displays the calculated energy dependence of the atomic and orbital resolved
cross sections together with the electron mean free path in Co2Mn0.5Fe0.5Si. The shown
data cover the range of kinetic energies observed in XPS and HXPS. In this energy range,
the electron mean free path (Fig. 1(e)) varies nearly linearly with increasing kinetic energy
and covers a range of escape depths from about 5 to 20 cubic Heusler cells. The calculated
electron mean free path in the pure Mn or Fe containing compounds is very close to the
one of the mixed compound as the physical properties (density, number and kind of valence
electrons) entering the TPP-2M equations are almost the same.
At low energies (1 keV), like used in regular XPS, the partial cross section of the valence
states is dominated by the d-states of the transition metal elements. This cross section
decreases faster with increasing energy compared to that of the s or p states. At high
energies (8 keV) the strongest cross sections is observed for the s-states, because the cross
section of p states also drops down faster with energy compared to s-states. Thus one
expects a pronounced change of the photoemission intensities if going from XPS (1.2 keV)
to HXPS (8 keV).
Figure 2 displays the calculated, spin resolved density of states for the investigated com-
5

10-3
10-2
10-1
100
10-3
10-2
10-1
100
10-3
10-2
10-1
100
10-3
10-2
10-1
100
1 2 3 4 5 6 7 80
255075
100
(a) Co
Cros
s sec
tion
[M
barn
]
(b) Mn
3d 4s 4p
(c) Fe
(d) Si
3s 3p
M
fp
[Å]
(e) Co2Mn0.5Fe0.5Si
Kinetic energy Ekin [keV]
FIG. 1: Cross sections and electron mean free path.
The atomic, partial cross sections of the contributing elements are displayed in (a)-(d) and the
electron mean free path (Mfp) as calculated for Co2Mn0.5Fe0.5Si in (e).
pounds. All three compounds, Co2Mn1−xFexSi with x = 0, 1/2, and 1, exhibit a clear gap
in the minority density of states, that is they are half-metallic ferromagnets. The gap has
the result that the calculated spin magnetic moments of Co2MnSi and CoFeSi have integer
values of 5 µB and 6 µB, respectively. The magnetic moment of Co2Mn1/2Fe1/2Si is 5.5 µB.
All those values are in perfect agreement with the experimental values [13] and the Slater-
Pauling rule [14]. The majority spin density reveals that the d-states emerging from flat
majority bands are shifted away from the Fermi energy ǫF with increasing Fe content. At
the same time the Fermi energy moves from near the top of the minority valence states
towards the bottom of the minority conduction bands. It is clearly visible that the gap in
the minority states is defined by regions of high density emerging from flat d-bands. At
the same time, the majority spin density contributes only few states in the region close
to the Fermi energy. This behaviour is typical for Heusler compounds with high magnetic
moments. More details of the electronic structure are reported in Refs. [10, 13].
The particular shape of the spin densities close to ǫF - a low density emerging from
6

-10 -5 0 510
5
0
5
10
-10 -5 0 5 -10 -5 0 5
Den
sity
of st
ates
[e
V-1]
Minority
Majority
(a)
Co2MnSi
Energy E F [eV]
(b)
Co2Mn1/2Fe1/2Si
(c)
Co2FeSi
FIG. 2: Spin resolved density of states of Co2Mn1−xFexSi for x = 0, 1/2, and 1.
0
5
10
15
-10 -5 00
5
10
-10 -5 0 -10 -5 0
(a)
Co2MnSi
DO
S
tot [e
V-1]
(b)
Co2Mn
1/2Fe
1/2Si
(c)
Co2FeSi
(d)
l-DO
S
l [eV
-1] s
p d
(e)
Energy E F [eV]
(f)
FIG. 3: Spin averaged density of states of Co2Mn1−xFexSi.
The total, spin averaged density of states ρtot is shown in (a) - (c) for x = 0, 1/2, and 1. The
corresponding orbital momentum resolved l-DOS ρl is displayed in (d) - (f).
majority states surrounded by regions of high minority density - should be easily detected
in valence band photoemission and thus may be a good indicator for the existence of the
gap, even without spin analysis. Figures 3(a)-(c) show the total, spin integrated density of
states. The low density of states in the vicinity of the Fermi energy is clearly visible.
Additionally, the orbital momentum resolved density of states (l-DOS) is shown in Fig-
ure 3(d)-(f). The partial DOS of the interstitial can not be extracted from the calculations in
an l-resolved way and therefore is not included. The l-DOS for higher angular momenta (l)
7

is omitted as they contribute only very few to the total density of states. From Figure 3(d)-
(f) it follows that the s-states are mainly found at below 8.5 eV below ǫF . The density
at the Fermi energy is dominated by d-states. Although the density of d-states is already
low at ǫF , the s-like density is still at least one order of magnitude smaller. The density
related to p-states is found from the bottom of the d-bands up to about 1 eV below ǫF . This
behaviour reflects the interaction between transition metal d-states with Si p-states. For
better comparison with the measured photoemission spectra, the l-DOS has been weighted
in the following by the partial cross sections. The sum of the weighted l-DOS has been
additionally convoluted by the Fermi-Dirac distribution (300 K for XPS; 20 K for HXPS)
and afterwards has been broadened by Gaussians of 0.7 eV (XPS) or 0.27 eV (HXPS) width
to account roughly for the experimental resolution at excitation energies of 1.2 keV or 8 keV,
respectively.
The valence band spectra excited by Mg Kα radiation are shown in Figure 4. All three
spectra show a high intensity close to the Fermi energy. The low lying sp band at 8 eV
to 11 eV below ǫF is only weakly revealed. There is also no particular structure seen close
to ǫF . However, a closer inspection of the maximum intensity of the emission exhibits that
it is shifted away from the Fermi energy in the Fe containing alloys (b,c). The maximum
intensity is found at -1.3 eV, -1.46 eV, and -1.55 eV for x = 0, 0.5, and 1, respectively.
This observation is in rough agreement with the density of states where the maximum of
the majority density (as well as the total DOS) is also shifted to higher binding energies
with increasing Fe content. It is also seen in the DOS weighted by the partial cross sections
(dashed lines in Fig. 4) where the maximum of the intensity shifts from -1.48 eV for x = 0
to -2.85 eV for x = 1. Both values are in the calculations larger than those observed in the
spectra. In particular, this suggests that the calculations shift the d-states in Co2FeSi to
much below the Fermi energy, what may be prevented by using different values of Ueff such
that the Fermi energy comes closer to the top of the minority valence band [10].
The results from high energy photoemission are shown in Figure 5. The spectra of all
three compounds reveal clearly the low lying s-states at about -11 eV to -9 eV below the
Fermi energy, in well agreement to the calculated DOS. These low lying bands are separated
from the high lying d-states by the Heusler-typical hybridisation gap being clearly resolved
in the spectra as well as the calculated DOS. The size of this gap amounts typically to
∆E ≈ 2 eV in Si containing compounds.
8

-10 -5 0
20
30
40
-10 -5 0 -10 -5 0
Co2MnSi
(a)
Inte
nsity
I [
s-1]
Co2Mn0.5Fe0.5Si
(b)
Energy E F [eV]
Co2FeSi
(c)
FIG. 4: Low energy valence band spectra of Co2Mn1−xFexSi.
(a) - (c) display the XPS valence band spectra for x = 0, 0.5, and 1. The DOS - convoluted by the
Fermi-Dirac distribution and weighted by the partial cross sections - is shown as dashed line. The
spectra were excited by Mg Kα radiation (1.254 keV).
Obviously, the emission from the low lying s-states is pronouncedly enhanced compared
to the emission from the d-states. This can be explained by a different behaviour of the cross
sections of the s, p, and d states with increasing kinetic energy as was recently demonstrated
by Panaccione et al for the case of the silver valence band [23]. In particular, the cross section
for d-states decreases faster with increasing photon energy than the one of the s-states. This
behaviour influences also the onset of the d-bands at about -7 eV. Just at the bottom of
those d-bands, they are hybridised with s, p-like states, leading to a relatively high intensity
in this energy region.
The structure of the spectra in the range of the d states agrees with the structures observed
in the total DOS. However, one has to account not only for the experimental resolution but
also for lifetime broadening if comparing that energy range. The lowest flat band of the
majority band structure, accompanying the localised moment, results in a sharp peak in
the DOS at about -3.5 eV and -5 eV for Mn and Fe, respectively (marked by arrows in
Fig.3 (a) and (c). These peaks are shifted away from ǫF by the electron-electron correlation
in the LDA+U calculation and would appear without U closer to the Fermi energy. Their
energetic position corresponds to structures revealed in the measured spectra, thus they are
a good proof for the use of the LDA+U scheme.
9

-10 -5 00
5
10
15
-10 -5 0 -10 -5 0
-1.5 -1.0 -0.5 0.0
1
2
3
4
-1.5 -1.0 -0.5 0.0
1
2
-1.5 -1.0 -0.5 0.0
1
2
3
(a)
Co2MnSi
(b)
Co2Mn
0.5Fe
0.5Si
(c)
Co2FeSi
(d)
Inte
nsity
I [
kcts]
(e)
Energy E F [eV]
(f)
FIG. 5: High energy valence band spectra of Co2Mn1−xFexSi.
The complete valence band is shown in panels (a) - (c) for x = 0, 0.5, and 1. The DOS - convoluted
by the Fermi-Dirac distribution and weighted by the partial cross sections - is shown as dashed
line. High resolution valence band spectra taken close to the Fermi energy are displayed in (d) - (f).
The spectra were excited by synchrotron radiation with hν = 7.939 keV.
As mentioned, one also has to account for lifetime broadening. At 1.3 keV excitation, the
emission is dominated by the high dense d-states at about -1.4 eV. Increasing the excitation
energy to 8 keV (note the better resolution of set-up at that energy) has the result that the
intensity in this energy range becomes considerably lower. At the same time, the emission
from the remaining d-bands becomes strongly enhanced. Obviously, the intensity at the
Fermi energy is much higher compared to the calculated DOS even after weighting by the
partial cross sections. As those structures in the DOS emerge rather all from d-states,
the transfer of the intensity maximum is not only explained by pure cross section effects.
The valence band spectra may be seen as a convolution of the initial (bound) and final
(unoccupied) state DOS. The final state DOS is rather constant at high kinetic energies and
final state effects may play a minor rule only. Two other weighting factors enter the DOS-
convolution. The first is, as explained above, the transition matrix element that contains
both the selection rules and the cross sections (radial matrix elements). The radial matrix
elements are partially responsible for the rearrangement of the orbital resolved intensities as
discussed above. The second weighting factor is the complex self-energy of the photoelectron.
Among other things, it depends on the hole lifetime due to the coupling of the photoemitted
10
electron with the hole left behind. At low kinetic energies, the spectra are obviously governed
by the long life time of the holes at binding energies close to ǫF . At high kinetic energies,
where the sudden approximation is reached, the photoelectron is not as strongly coupled to
its hole and the lifetime at ǫF plays less a role. Not only from the mean free path but also
from the presented point of view, the high energy photoemission may help to understand
the bulk electronic structure better than using only low energy XPS.
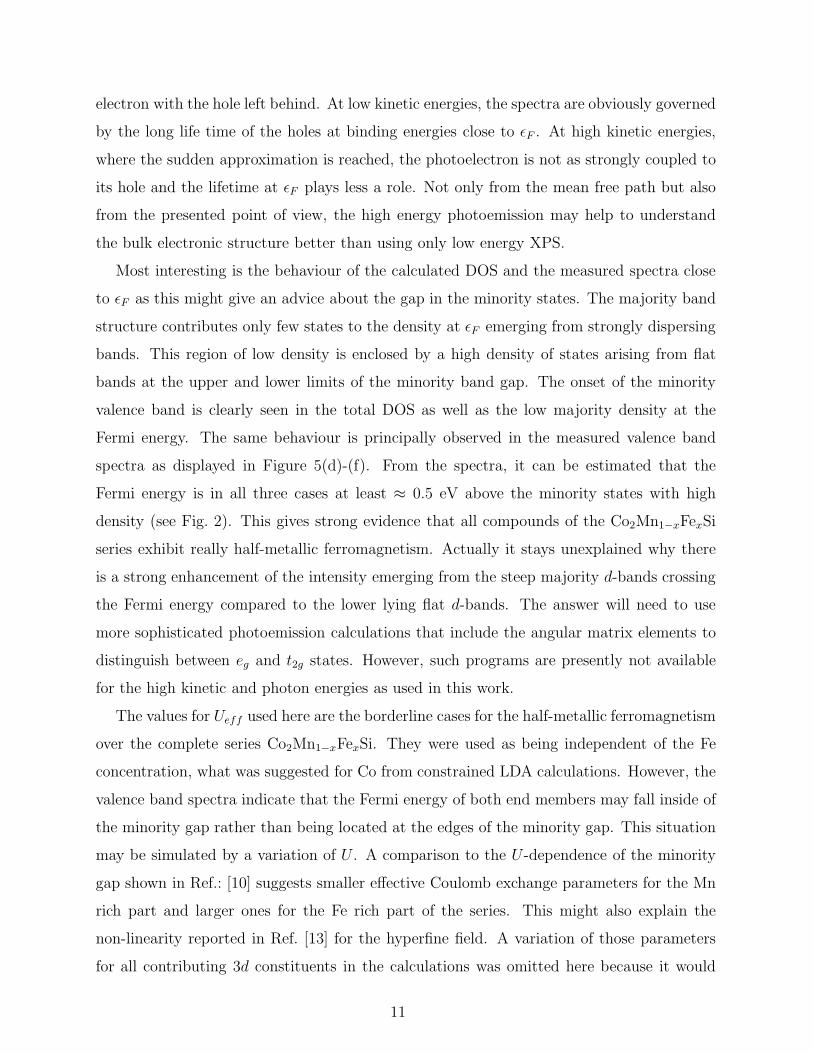
Most interesting is the behaviour of the calculated DOS and the measured spectra close
to ǫF as this might give an advice about the gap in the minority states. The majority band
structure contributes only few states to the density at ǫF emerging from strongly dispersing
bands. This region of low density is enclosed by a high density of states arising from flat
bands at the upper and lower limits of the minority band gap. The onset of the minority
valence band is clearly seen in the total DOS as well as the low majority density at the
Fermi energy. The same behaviour is principally observed in the measured valence band
spectra as displayed in Figure 5(d)-(f). From the spectra, it can be estimated that the
Fermi energy is in all three cases at least ≈ 0.5 eV above the minority states with high
density (see Fig. 2). This gives strong evidence that all compounds of the Co2Mn1−xFexSi
series exhibit really half-metallic ferromagnetism. Actually it stays unexplained why there
is a strong enhancement of the intensity emerging from the steep majority d-bands crossing
the Fermi energy compared to the lower lying flat d-bands. The answer will need to use
more sophisticated photoemission calculations that include the angular matrix elements to
distinguish between eg and t2g states. However, such programs are presently not available
for the high kinetic and photon energies as used in this work.
The values for Ueff used here are the borderline cases for the half-metallic ferromagnetism
over the complete series Co2Mn1−xFexSi. They were used as being independent of the Fe
concentration, what was suggested for Co from constrained LDA calculations. However, the
valence band spectra indicate that the Fermi energy of both end members may fall inside of
the minority gap rather than being located at the edges of the minority gap. This situation
may be simulated by a variation of U . A comparison to the U -dependence of the minority
gap shown in Ref.: [10] suggests smaller effective Coulomb exchange parameters for the Mn
rich part and larger ones for the Fe rich part of the series. This might also explain the
non-linearity reported in Ref. [13] for the hyperfine field. A variation of those parameters
for all contributing 3d constituents in the calculations was omitted here because it would
11

not bring more insight into the nature of the problem, at present.
Overall, the measured photoelectron spectra agree well with the calculated density of
states and principally verify the use of the LDA+U scheme. In particular, the shape of the
spectra close to ǫF can be explained by the occurrence of a gap in the minority states and
thus points indirectly on the half-metallic state of all three compounds investigated here by
photoemission. For clarity about the gap, spin resolved photoemission spectroscopy at high
energies would be highly desirable. However, this will make another step of improvement
of the instrumentation necessary, for both photon sources as well as electron energy and
spin analysers, as the spin detection will need a factor of at least three to four orders of
magnitude more intensity for a single energy channel at the same resolution as used here for
the intensity spectra.
IV. SUMMARY AND CONCLUSIONS
The quaternary Heusler compound Co2Mn1−xFexSi was investigated for x = 0, 0.5, 1. All
samples of the substitutional series exhibit an L21 order, independent of the Fe concen-
tration. In agreement with the expectation from the Slater-Pauling curve for half-metallic
ferromagnets, the magnetic moment increases linearly with x from 5 µB to 6 µB.
True bulk sensitive, high energy photoemission bearded out the inclusion of electron-
electron correlation in the calculation of the electronic structure and gave an indirect advise
on the gap in the minority states. The valence band spectra indicate an increase of the
effective Coulomb exchange parameters with increasing Fe concentration.
Acknowledgment :
The authors are grateful for the support by G. Schonhense and thank S. Wurmehl for
preparing the Co2FeSi sample and H. C. Kandpal for help with the calculations. The syn-
chrotron radiation experiments were performed at the beamline BL47XU of SPring-8 with
the approval of the Japan Synchrotron Radiation Research Institute (JASRI) (proposal no.
2006A1476). This work was partially supported by a Grant-in-Aid for Scientific Research
(A) (No.15206006), and also partially supported by a Nanotechnology Support Project, of
The Ministry of Education, Culture, Sports, Science and Technology of Japan. Financial
12

support by the Deutsche Forschungsgemeinschaft (project TP7 in research group FG 559)
is gratefully acknowledged.
[1] S. A. Wolf, D. D. Awschalom, R. A. Buhrman, J. M. Daughton, S. v. Molnar, M. L. Roukes,
A. Y. Chtchelkanova, and D. M. Treger, Science 294, 1488 (2001).
[2] G. A. Prinz, Science 282, 1660 (1998).
[3] R. A. d. Groot, F. M. Mueller, P. G. v. Engen, and K. H. J. Buschow, Phys. Rev. Lett. 50,
2024 (1983).
[4] J. M. D. Coey, M. Venkatesan, and M. A. Bari (Springer, Heidelberg, 2002), vol. 595 of Lecture
Notes in Physics.
[5] J. Kubler, A. R. Williams, and C. B. Sommers, Phys. Rev. B 28, 1745 (1983).
[6] S. Fuji, S. Sugimura, S. Ishida, and S. Asano, J. Phys.: Condens. Matter 2, 8583 (1990).
[7] P. J. Brown, K.-U. Neumann, P. J. Webster, and K. R. A. Ziebeck, J. Phys.: Condens. Matter
12, 1827 (2000).
[8] S. Wurmehl, G. H. Fecher, H. C. Kandpal, V. Ksenofontov, C. Felser, H.-J. Lin, and J. Morais,
Phys. Rev. B 72, 184434 (2005).
[9] S. Wurmehl, G. H. Fecher, H. C. Kandpal, V. Ksenofontov, C. Felser, and H.-J. Lin, Appl.
Phys. Lett. 88, 032503 (2006).
[10] H. C. Kandpal, G. H. Fecher, and C. Felser, Phys. Rev. B 73, 094422 (2006).
[11] K. Inomata, S. Okamura, A. Miyazaki, M. Kikuchi, N. Tezuka, M. Wojcik, and E. Jedryka, J
Phys. D: Appl. Phys. 39, 816 (2006).
[12] M. Oogane, Y. Sakuraba, J. Nakata, H. Kubota, Y. Ando, A. Sakuma, and T. Miyazaki, J
Phys. D: Appl. Phys. 39, 834 (2006).
[13] B. Balke, G. H. Fecher, H. C. Kandpal, C. Felser, K. Kobayashi, E. Ikenaga, J.-J. Kim, and
S. Ueda, Phys. Rev. B 74, 104405 (2006).
[14] G. H. Fecher, H. C. Kandpal, S. Wurmehl, and C. Felser, J. Appl. Phys. 99, 08J106 (2006).
[15] W. H. Wang, M. Przybylskia, W. Kuch, L. I. Chelaru, J. Wang, Y. F. Lu, J. Barthel, and
J. Kirschner, J. Magn. Magn. Mat. 286, 336 (2005).
[16] W. H. Wang, M. Przybylski, W. Kuch, L. I. Chelaru, J. Wang, F. Lu, J. Barthel, H. L.
Meyerheim, and J. Kirschner, Phys. Rev. B 71, 144416 (2005).
13

[17] I. Lindau, P. Pianetta, S. Doniach, and W. E. Spicer, Nature 250, 214 (1974).
[18] W. Meisel, Hyperfine Interact. 45, 73 (1989).
[19] K. Kobayashi, M. Yabashi, Y. Takata, T. Tokushima, S. Shin, K. Tamasaku, D. Miwa,
T. Ishikawa, H. Nohira, T. Hattori, et al., Appl. Phys. Lett. 83, 1005 (2003).
[20] A. Sekiyama and S. Suga, J. Electron Spectrosc. Relat. Phenom. 137-140, 681 (2004).
[21] S. Thiess, C. Kunz, B. C. C. Cowie, T.-L. Lee, M. Reniera, and J. Zegenhagen, Solid State
Comm. 132, 589 (2004).
[22] K. Kobayashi, Nucl. Instrum. Methods Phys. Res., Sect. A 547, 98 (2005).
[23] G. Panaccione, G. Cautero, M. Cautero, A. Fondacaro, M. Grioni, P. Lacovig, G. Monaco,
F. Offi, G. Paolicelli, M. Sacchi, et al., J. Phys.: Condens. Matter 17, 2671 (2005).
[24] P. Torelli, M. Sacchi, G. Cautero, M. Cautero, B. Krastanov, P. Lacovig, P. Pittana, R. Sergo,
R. Tommasini, A. Fondacaro, et al., Rev. Sci. Instrum. 76, 023909 (2005).
[25] S. Wurmehl, G. H. Fecher, K. Kroth, F. Kronast, H. A. Durr, Y. Takeda, Y. Saitoh,
K. Kobayashi, H.-J. Lin, G. Schonhense, et al., J. Phys. D: Appl. Phys. 39, 803 (2006).
[26] M. Kallmayer, H. J. Elmers, B. Balke, S. Wurmehl, F. Emmerling, G. H. Fecher, and C. Felser,
J. Phys. D: Appl. Phys. 39, 786 (2006).
[27] M. S. Banna and D. A. Shirley, J. Electron Spectrosc. Relat. Phenom. 8, 23, 255 (1976).
[28] P. Blaha, K. Schwarz, G. K. H. Madsen, D. Kvasnicka, and J. Luitz, WIEN2k, An Augmented
Plane Wave + Local Orbitals Program for Calculating Crystal Properties (Karlheinz Schwarz,
Techn. Universitaet Wien, Wien, Austria, 2001).
[29] J. P. Perdew, K. Burke, and M. Ernzerhof, Phys. Rev. Lett. 77, 3865 (1996).
[30] F. Salvat and R. Mayol, Comp. Phys. Commun. 62, 65 (1991).
[31] F. Salvat and R. Mayol, Comp. Phys. Commun. 74, 358 (1993).
[32] S. Tanuma, C. J. Powell, and D. R. Penn, Surf. Interf. Anal. 21, 165 (1993).
14
Copyright © 2022 FDOKUMEN