THE SPITZER INFRARED NEARBY GALAXIES SURVEY: A HIGH-RESOLUTION SPECTROSCOPY ANTHOLOGY
43
arXiv:0811.4190v1 [astro-ph] 25 Nov 2008 The Spitzer Infrared Nearby Galaxies Survey: A High-Resolution Spectroscopy Anthology D.A. Dale 1 , J.D.T. Smith 2 , E.A. Schlawin 1 , L. Armus 3 , B.A. Buckalew 4 , S.A. Cohen 1 , G. Helou 3 , T.H. Jarrett 3 , L.C. Johnson 1 , J. Moustakas 6 , E.J. Murphy 3 , H. Roussel 7 , K. Sheth 3 , S. Staudaher 1 , C. Bot 8 , D. Calzetti 9 , C.W. Engelbracht 10 , K.D. Gordon 11 , D.J. Hollenbach 12 , R.C. Kennicutt 5 , S. Malhotra 13 ABSTRACT High resolution mid-infrared spectra are presented for 155 nuclear and ex- tranuclear regions from the Spitzer Infrared Nearby Galaxies Survey (SINGS). The fluxes for nine atomic forbidden and three molecular hydrogen mid-infrared emission lines are also provided, along with upper limits in key lines for infrared-faint targets. The SINGS sample shows a wide range in the ratio of [S III] 18.71 μm/[S III] 33.48 μm, but the average ratio of the ensemble indi- cates a typical interstellar electron density of 300–400 cm −3 on ∼23 ′′ ×15 ′′ scales and 500–600 cm −3 using ∼11 ′′ ×9 ′′ apertures, independent of whether the region probed is a star-forming nuclear, a star-forming extranuclear, or an AGN en- vironment. Evidence is provided that variations in gas-phase metallicity play an important role in driving variations in radiation field hardness, as indicated 1 Department of Physics and Astronomy, University of Wyoming, Laramie, WY 82071; [email protected] 2 Department of Physics and Astronomy, University of Toledo, Toledo, OH 43606 3 Spitzer Science Center, California Institute of Technology, Pasadena, CA 91101 4 Embry-Riddle Aeronautical University, Prescott, AZ 86301 5 Institute of Astronomy, University of Cambridge, Cambridge, United Kingdom 6 Center for Cosmology and Particle Physics, New York University, New York, NY 10003 7 Institut d’Astrophysique de Paris, 75014 Paris, France 8 Observatoire Astronomique de Strasbourg, 67000 Strasbourg, France 9 Department of Astronomy, University of Massachusetts, Amherst, MA 01003 10 Steward Observatory, University of Arizona, Tucson, AZ 85721 11 Space Telescope Science Institute, Baltimore, MD 21218 12 NASA/Ames Research Center, Moffett Field, CA 94035 13 Department of Physics and Astronomy, Arizona State University, Tempe, AZ 85287
-
Upload
independent -
Category
Documents
-
view
0 -
download
0
Transcript of THE SPITZER INFRARED NEARBY GALAXIES SURVEY: A HIGH-RESOLUTION SPECTROSCOPY ANTHOLOGY

arX
iv:0
811.
4190
v1 [
astr
o-ph
] 2
5 N
ov 2
008
The Spitzer Infrared Nearby Galaxies Survey: A High-Resolution
Spectroscopy Anthology
D.A. Dale1, J.D.T. Smith2, E.A. Schlawin1, L. Armus3, B.A. Buckalew4, S.A. Cohen1,
G. Helou3, T.H. Jarrett3, L.C. Johnson1, J. Moustakas6, E.J. Murphy3, H. Roussel7,
K. Sheth3, S. Staudaher1, C. Bot8, D. Calzetti9, C.W. Engelbracht10, K.D. Gordon11,
D.J. Hollenbach12, R.C. Kennicutt5, S. Malhotra13
ABSTRACT
High resolution mid-infrared spectra are presented for 155 nuclear and ex-
tranuclear regions from the Spitzer Infrared Nearby Galaxies Survey (SINGS).
The fluxes for nine atomic forbidden and three molecular hydrogen mid-infrared
emission lines are also provided, along with upper limits in key lines for
infrared-faint targets. The SINGS sample shows a wide range in the ratio of
[S III] 18.71 µm/[S III] 33.48 µm, but the average ratio of the ensemble indi-
cates a typical interstellar electron density of 300–400 cm−3 on ∼23′′×15′′ scales
and 500–600 cm−3 using ∼11′′×9′′ apertures, independent of whether the region
probed is a star-forming nuclear, a star-forming extranuclear, or an AGN en-
vironment. Evidence is provided that variations in gas-phase metallicity play
an important role in driving variations in radiation field hardness, as indicated
1Department of Physics and Astronomy, University of Wyoming, Laramie, WY 82071; [email protected]
2Department of Physics and Astronomy, University of Toledo, Toledo, OH 43606
3Spitzer Science Center, California Institute of Technology, Pasadena, CA 91101
4Embry-Riddle Aeronautical University, Prescott, AZ 86301
5Institute of Astronomy, University of Cambridge, Cambridge, United Kingdom
6Center for Cosmology and Particle Physics, New York University, New York, NY 10003
7Institut d’Astrophysique de Paris, 75014 Paris, France
8Observatoire Astronomique de Strasbourg, 67000 Strasbourg, France
9Department of Astronomy, University of Massachusetts, Amherst, MA 01003
10Steward Observatory, University of Arizona, Tucson, AZ 85721
11Space Telescope Science Institute, Baltimore, MD 21218
12NASA/Ames Research Center, Moffett Field, CA 94035
13Department of Physics and Astronomy, Arizona State University, Tempe, AZ 85287

– 2 –
by [Ne III] 15.56 µm/[Ne II] 12.81 µm, for regions powered by star forma-
tion. Conversely, the radiation hardness for galaxy nuclei powered by accre-
tion around a massive black hole is independent of metal abundance. Further-
more, for metal-rich environments AGN are distinguishable from star-forming
regions by significantly larger [Ne III] 15.56 µm/[Ne II] 12.81 µm ratios. Finally,
[Fe II] 25.99 µm/[Ne II] 12.81 µm versus [Si II] 34.82 µm/[S III] 33.48 µm also pro-
vides an empirical method for discerning AGN from normal star-forming sources.
However, similar to [Ne III] 15.56 µm/[Ne II] 12.81 µm, these mid-infrared line
ratios lose their AGN/star-formation diagnostic powers for very low metallicity
star-forming systems with hard radiation fields.
Subject headings: infrared: galaxies — infrared: ISM — galaxies: nuclei —
galaxies: active — H II regions.
1. Introduction
The Spitzer Space Telescope has pushed extragalactic infrared spectroscopy into new
territory. Spitzer observations of silicate emission and absorption in Type 1 and 2 Seyferts,
respectively, have provided strong support for the unification model for Active Galactic Nu-
cleus (AGN) galaxies (Sturm et al. 2005; Siebenmorgen et al. 2005; Hao et al. 2005).
Polycyclic Aromatic Hydrocarbons (PAHs) can now be detected and used as redshift indi-
cators for dusty systems at high redshifts (Yan et al. 2005; Weedman et al. 2006a; Teplitz
et al. 2007; Valiante et al. 2007). Spectroscopy from Spitzer has led to the improvement of
mid-infrared diagnostics that characterize and distinguish between ULIRGs, AGN, and star-
forming galaxies (Sturm et al. 2006; Weedman et al. 2006b; Dale et al. 2006; O’Halloran,
Satyapal, & Dudik 2006; Brandl et al. 2006; Spoon et al. 2007; Armus et al. 2007; Dudik et
al. 2007; Hunter & Kaufman 2007; Farrah et al. 2007; Sajina et al. 2007, 2008). Galaxies
of low metal abundances exhibit interesting mid-infrared spectral properties as observed by
Spitzer, properties that are attributed to some combination of the inhibition of PAH for-
mation in regions of low metallicity and PAH destruction due to the hard radiation fields
present in such systems (e.g., Engelbracht et al. 2005; Cannon et al. 2006; Wu et al. 2006;
Engelbracht et al. 2008a; Gordon et al. 2008). H2 lines have been used to trace shocks and
the excitation temperatures and masses of warm molecular hydrogen in galaxies (Devost et
al. 2004; Higdon et al. 2006; Appleton et al. 2006; Johnstone et al. 2007; Brunner et al.
2008). Another interesting result from Spitzer is that many elliptical galaxies show unusual
mid-infrared spectra (Kaneda et al. 2005; Bregman et al. 2006; Kaneda et al. 2008) that
may be related to the presence of X-ray emission from low luminosity AGN. Smith et al.

– 3 –
(2007a) suggest that the quiescent environments within ellipticals offer favorable conditions
in which to observe these unusual spectra, since the mid-infrared spectra are not dominated
by the effects of star formation typically seen in spiral and irregular galaxies.
The Spitzer Infrared Nearby Galaxies Survey, or SINGS, legacy project obtained a
comprehensive spectral database for a large sample of nearby galaxies, and there have been
several studies published based on SINGS spectroscopy. Smith et al. (2004) present first
results from science validation galaxy NGC 7331, including one of the first reports of the
new PAH complex near 17 µm. Engelbracht et al. (2006), Bendo et al. (2006), and Cannon
et al. (2006) explore the strength of the PAH features in different regions of NGC 3034
(M 82), NGC 4594 (M 104), and NGC 1705, respectively. Dale et al. (2006) use SINGS high
resolution spectroscopy for 50 nuclear and 26 extranuclear regions to quantify the power of
mid-infrared line diagnostics for distinguishing between star-forming and AGN environments.
Roussel et al. (2006) study silicate, PAH, and H2 emission in the opaque nascent starburst
NGC 1377. Smith et al. (2007a) quantify the energy budget and variations of PAH emission
for 59 SINGS nuclei utilizing 5–38 µm low resolution spectra. Roussel et al. (2007) study
the physical conditions within 57 SINGS nuclei using low and high resolution spectroscopy
on H2 lines and [Si II]34.82 µm. Engelbracht et al. (2008b) use 20–95 µm low-resolution
IRS + MIPS SED spectra for 56 SINGS galaxies to compute dust temperatures and the
wavelengths at which the mid/far-infrared significantly deviates from a blackbody. Buckalew
et al. (2008) study the impact of ionizing radiation from stellar clusters on the mid-infrared
spectra from SINGS extranuclear targets. Finally, Bot et al. (2008) analyze low resolution
Ne, Ar, and S spectral lines from 45 SINGS nuclei to determine the feasibility of constraining
elemental abundances using infrared spectroscopy.
Though there are numerous SINGS papers involving infrared spectroscopy, none has
provided the complete set of aperture-matched high resolution spectroscopy data. Here we
present the full compilation of the SINGS high resolution spectral dataset for 88 extranuclear
regions and the 67 nuclei with high resolution spectral data. The data from separate 10–
19 µm and 19–37 µm instrument modules are extracted from matching 23′′×15′′ apertures
(or 31′′×27′′ apertures in the case of nine nuclei with extended circumnuclear emission).
The results presented here focus on the applications and interpretations of mid-infrared line
ratios. Compared to previous mid-infrared spectral surveys carried out with the Infrared
Space Observatory (e.g., Thornley et al. 2000; Sturm et al. 2002; Martın-Hernandez et al.
2002; Rigopoulou et al. 2002; Vermeij et al. 2002; Verma et al. 2003), Spitzer/SINGS
offers superior sensitivity, and that is the main advantage exploited in this work. Section 2
describes the sample, Section 3 presents the data, and Section 4 provides the results from
this study. Section 5 summarizes our findings.

– 4 –
2. The Sample
The typical distance for SINGS galaxies is ∼10 Mpc, and the distances range from
the Local Group out to ∼25 Mpc. The sample spans a wide range of environments and
galaxies: low-metallicity dwarfs; quiescent ellipticals; dusty grand design spirals; Seyferts,
LINERs, and normal galaxies with starbursting nuclei; and systems within the Local and
M 81 groups (see Kennicutt et al. 2003). However, no SINGS galaxies are exceptionally
bright (LFIR < 1011 L⊙ in all cases) and none harbors an AGN that dominates the overall
luminosity.
The AGN/star-forming nuclear classifications adopted here are based on the optical
spectroscopy described in Moustakas et al. (2009). In that work three sets of spectroscopic
apertures centered on the galaxies are used that cover varying fractions of the integrated B
band light: nuclear ∼2.5′′×2.5′′ observations (covering between 0.2 and 1% of the optical
emission), circumnuclear 20′′×20′′ observations (3–40%), and ∼1′-wide long-slit drift scan
observations (30–100%). Though no SINGS AGN dominate the integrated light of the host
galaxy—less than 1% of the total optical emission stems from the central central 2.5′′×2.5′′—
the AGN can be energetically significant on the smaller scales studied here. For example,
only 14% of the nuclei classified as AGN on 2.5′′×2.5′′ scales switch to the star-forming
category when the classifications are carried out on 20′′×20′′ scales. More details on the
nuclear classifications of SINGS galaxies can be found in Moustakas et al. (2009).
Though the full SINGS sample comprises 75 galaxies, high resolution infrared spec-
troscopy was obtained for only 67 nuclei. The nuclei for Holmberg I, Holmberg II, M 81 Dwarf A,
M 81 Dwarf B, DDO 154, IC 2574, and NGC 6822 were deemed too faint in the mid-infrared
to merit high resolution spectral observations. In addition, the nucleus of NGC 3034 (M 82)
was reserved by a Guaranteed Time Observer spectroscopy program (Beirao et al. 2008).
There are a total of 88 extranuclear sources targeted for spectroscopy in the SINGS
project, and results from all of them are presented here. Thirty-nine of these targets were
selected based on optical criteria (Kennicutt et al. 2003), while the remaining 49 targets
were selected to span a range in infrared properties. The optically-selected OB/H II re-
gions cover a large range of metallicity, ranging from one-tenth solar to a few times solar,
extinction-corrected ionizing luminosity (1049−1052 photons s−1), extinction (AV . 4 mag),
radiation field intensity (100-fold range), ionizing stellar temperature (Teff = 35 − 55 kK),
and local H2/H I ratio as inferred from CO (<0.1 to >10). The infrared-selected extranuclear
targets were chosen to span a range in fν(8.0 µm)/fν(24 µm) and f(Hα)/fν(8.0 µm). These
selection criteria ensured that our observations covered the full range of physical conditions
and spectral characteristics found in (bright) infrared sources in nearby galaxies.

– 5 –
3. Observations and Data Processing
High-resolution spectroscopy (R ∼ 600) was obtained in the Short-High (10–19 µm) and
Long-High (19–37 µm) modules (Houck et al. 2004). Figure 1 displays examples of the gen-
eral scheme followed for high resolution spectral observations. High resolution spectroscopy
targets were generally mapped with a 3×5 grid in both the Short-High and Long-High mod-
ules, utilizing half-slit width and half-slit length steps. This observational scheme allows for
significant data redundancy at each sky position, an important factor if large numbers of bad
pixels need to be masked during the construction of the cubes described below. Owing to the
different angular sizes subtended by the instruments, the resulting maps are approximately
45′′×33′′ in Long-High and 23′′×15′′ in Short-High. This mapping scheme made it possible
to measure line fluxes with common effective aperture sizes, despite the four-fold change
in spatial resolution over the spectral range of our observations. Slightly larger Short-High
nuclear maps were obtained for a subset of nine sources with extended circumnuclear star
formation: NGC 1097, NGC 1482, NGC 1512, NGC 1705, NGC 3351, NGC 4321, NGC 4536,
NGC 6946, and NGC 7552. The nine expanded Short-High nuclear maps utilize a 6×10 ob-
servational pointing grid and thus span 40′′×28′′. All integrations are 60 s per pointing. The
effective integrations are longer since each location was observed 2–4 times.
The individual data files for a given spectral map were assembled into spectral cubes
using the software CUBISM (Smith et al. 2007b). The cube input data were pre-processed
using the latest versions of the Spitzer Science Center pipeline: S15.3 for Short-High and
S17.2 for Long-High. The S17.2 Long-High data include improved corrections for the order-
to-order continuum tilts that are present in the S15.3 Long-High data. As no sky observations
were obtained at high spectral resolution, the high resolution spectra are not sky-subtracted.
Various processing steps within CUBISM are described by Smith et al. (2007b). One-
dimensional spectra were extracted from most of the Short-High and Long-High data cubes
using matching ∼23′′×15′′ apertures. For the nine galaxies with extended Short-High maps
described above, the extraction apertures are ∼31′′×27′′. In terms of physical scales, the
projected areal coverage of the extractions spans the range 0.002–11 kpc2 with a sample
median of 0.48 kpc2.1 The extraction centers and projected areas are listed in Table 1.
Figure 2 shows all the high resolution spectra for the 67 nuclear and 88 extranuclear regions
observed.2
1The distances in the SINGS sample span a factor of ∼50 and the high resolution spectral maps are
relatively small, so it is difficult to carry out interesting, sample-wide analyses of the high resolution spectral
maps that utilize apertures matched in physical size.
2SINGS data, including these spectra, are found at http://ssc.spitzer.caltech.edu/legacy/singshistory.html.

– 6 –
Emission line fluxes are derived from continuum-subtracted Gaussian fits to the lines
and first or second order polynomial fits to the continua; second order continuum fits are
used for cases like [Ne II]12.81 µm, which is blended with a PAH emission feature. Based on
extrapolations from the 19-31 µm continuum, the pipeline corrections for the order-to-order
continuum tilts mentioned above appear to be overestimated for the longest two wavelength
(λ & 31 µm) orders in S17.2 data. Hence, our emission line flux estimates for [S III] 33.48 µm
and [Si II] 34.82 µm are averaged from the S15.3 and S17.2 pipelines. These S15.3/S17.2
average line fluxes deviate by ∼8% and 1.5%, respectively, from the individual S15.3 and
S17.3 pipeline extractions. The emission line fluxes are listed in Tables 1 and 2 along with
3σ upper limits for nondetections in several key lines. Upper limits are based on the spectral
resolution ∆λ of the high resolution spectrometer and the root-mean-square variations in
the flux density of the local continuum:
f(3σ) = 3fλ(r.m.s.)∆λ = 3fλ(r.m.s.)λ/600. (1)
It is occasionally difficult to assess from the one-dimensional spectra alone whether or not
a faint line is detected. The fully-processed two-dimensional spectra were thus inspected
within CUBISM to verify each detection and each non-detection.
Several cross-checks on the flux calibration were made between data from the various IRS
modules and Spitzer imaging data at 8.0 and 24 µm and Infrared Space Observatory imaging
data at 6.75 and 15 µm. The cross-checks were carried out by comparing the broadband
imaging flux densities to the corresponding simulated values obtained by integrating under
the spectra weighted according to the imaging filter bandpass profiles. The absolute flux
calibration uncertainty for the spectral data is estimated to be 25% (1σ); the uncertainty
in line flux ratios is ∼10% (see also the SINGS Fifth Data Release delivery document at
http://ssc.spitzer.caltech.edu/legacy/singshistory.html).
4. Results
4.1. Nuclear and Extra-Nuclear Mid-Infrared Spectra
Figure 2 displays all 155 10–37 µm high resolution spectra for the SINGS sample. The
continuum levels observed by the separate Short-High (10–19 µm) and Long-High (19–
37 µm) modules were not adjusted to be equal, but they do roughly match each other
in most cases. The agreement between Short-High and Long-High at ∼19.3 µm is within
0.5 ·10−6 W m−2 sr−1 for 95% of the cases. Expressed relative to the continuum levels, ∼95%
of the Short-High and Long-High spectra match to within 33%; only 5% of the Short-High
and Long-High data have significant amplitude mismatches relative to the continuum level,

– 7 –
and in each of these cases the large relative discrepancy is due to a weak continuum. For
many of the faintest galaxies, the Long-High continuum slopes downwards for longer wave-
lengths (e.g., NGC 1404). In these cases we are seeing the effects of foreground zodiacal
emission, not emission from the target galaxy, since we have not sky-subtracted the high
resolution spectra.
The strongest features in these spectra are typically the 11.3, 12.7, and 17 µm PAH
complexes (see Smith et al. 2007a) and the [Ne II]12.81 µm, [Ne III]15.56 µm, [S III]18.71 µm,
[Fe II]25.99 µm, [S III]33.48 µm, and [Si II]34.82 µm emission lines. Weaker or more variable
features include the higher ionization forbidden lines [S IV]10.51 µm, [Ne V]14.32 µm, and
[O IV]25.89 µm, and the molecular hydrogen lines at 12.28, 17.04, and 28.22 µm. The
ν = 0 − 0 S(0), S(1), and S(2) molecular hydrogen lines from SINGS were studied in detail
by Roussel et al. (2007), and one of the main results from that work is the discovery of
a tight link between the H2 line intensities and the PAH emission, over a large range in
radiation field intensities (see also Rigopoulou et al. 2002).
Figure 3 shows many of the above mid-infrared emission features over smaller wavelength
ranges for the bright nucleus of NGC 5194 (M 51). Much of the infrared fine structure line
emission from the SINGS sample derives from nebular lines from H II regions. However,
there are several exceptions. [Si II]34.82 µm, for example, comes from a wider variety of
environments, including both ionized gas and warm atomic gas such as photodissociation re-
gions and X-ray dominated regions (e.g., Hollenbach & Tielens 1999). The spatial variability
of [Si II]34.82 µm will be explored in a future paper using the much more spatially exten-
sive SINGS low-resolution spectral maps. Iron also has an ionization potential smaller than
13.6 eV, so similar to [Si II]34.82 µm the [Fe II]25.99 µm line can be strong outside of H II
regions, and in fact is frequently used as an indicator of shocks from supernova activity (e.g.,
Alonso-Herrero et al. 2003) or AGN via X-ray photoionization processes (e.g., Knop et al.
2001). In addition, Ne3+ has such a high ionization potential (∼97 eV) that [Ne V] 14.32 µm
in galactic nuclei is only observed in AGN (Satyapal et al. 2007); ∼55 eV are necessary
to create O3+, so [O IV] 25.89 µm is also frequently used as a tracer of AGN (see Lutz et
al. 1998; Genzel et al. 1998). The ionization potentials needed to create the species for
each fine structure line are provided in Table 2. The unusual mid-infrared spectrum of the
NGC 1377 nucleus is described as a heavily dust-obscured nascent starburst in Roussel et al.
(2007). Comparing the nuclear and extranuclear spectra, there is one broad generalization
that immediately catches the eye: the proportion of spectra with large line-to-continuum
ratios is higher for the extranuclear regions than for the nuclei. This general result is ex-
pected, though, since the extranuclear targets are primarily actively forming stars, whereas
the SINGS nuclei have more luminous continuum levels and are far more diverse, spanning
a larger range in star formation activity and hosting varying levels of AGN activity (§ 2).

– 8 –
The same tendency for nuclei to have lower line-to-continuum ratios than disk H II regions
is also seen in optical spectra (e.g., Kennicutt et al. 1989).
4.2. Radiation Field Hardness and Oxygen Abundance
The hardness of the interstellar radiation field is influenced by several factors, including
the age of the stellar population producing the bulk of the light, the characteristic metallicity
of the environment, and the properties of the AGN’s accretion disk when a massive central
black hole is present. In this section the radiation field hardness is explored as a function of
metal abundance. The oxygen abundances utilized in this work are from Moustakas et al.
(2009), who have coupled new optical spectroscopic data with archival optical emission line
measurements from 570 SINGS H II regions) to derive abundances and radial abundance
gradients for most SINGS galaxies. The abundances used for the extranuclear sources are
computed from their (de-projected) radial distances and parent galaxy radial abundance
gradients. The abundances used for the nuclear sources are the “characteristic” abundances
at a radial position of 40% of the optical radius, 0.4R25, a definition which avoids issues
related to AGN contamination. The characteristic abundance is representative of the mean,
optical-luminosity-weighted oxygen abundance of each galaxy. The strong-line calibration of
Kobulnicky & Kewley (2004) is adopted for the abundances in this work.
Several emission line and PAH diagnostics were presented in Dale et al. (2006) based
on a subset (about half) of the SINGS high resolution spectral database. Figure 4 shows an-
other emission line ratio diagram, using the entire SINGS high resolution spectral database:
[Ne III]15.56 µm/[Ne II]12.81 µm ratio as a function of the gas-phase oxygen abundance (see
Verma et al. 2003 for a similar analysis using ISO data). The [Ne III] 15.56 µm/[Ne II] 12.81 µm
ratio is considered an indicator of the hardness of the interstellar radiation field (e.g., Thorn-
ley et al. 2000; Madden et al. 2006; Beirao et al. 2008; Gordon et al. 2008). Perhaps the
most important result from Figure 4 is that star-forming nuclear and extranuclear targets
show the same general trend: harder radiation fields for lower metal abundance environ-
ments, consistent with prior optical studies (e.g., Searle 1971). This trend spans a factor of
150 in [Ne III]15.56 µm/[Ne II]12.81 µm and a factor of 10 in metallicity. Theoretical predic-
tions from photoionization models are superposed onto the data displayed in the righthand
panel of Figure 4. The models assume an 8 Myr continuous Starburst99 (Leitherer et al.
1999) star formation scenario for an electron density of 350 cm−3. In order from lowest to
highest, the models overlaid correspond to q = Uc = 2 · 107, 4 · 107, 8 · 107, 1.5 · 108, and
3 · 108 cm s−1, where the ionization parameter U is defined as the ionizing photon flux per

– 9 –
unit area normalized to the gas number density:
U = QH/(4πr2nc), (2)
with QH representing the number of ionizing photons per second, n the gas number density,
and r the separation between illumination source and cloud. This range of photoionization
models does a fair job of bracketing the observed trend in radiation hardness and metallicity
for star-forming regions. The metallicity of galaxies with AGN, on the other hand, empiri-
cally plays little role in the radiation field hardness. Rather, the radiation field hardness for
AGN systems likely depends more on the temperature distribution within the X-ray-emitting
accretion disk, contributions from non-thermal processes such as synchrotron radiation, and
the AGN/star formation luminosity ratio within our apertures.
Star-forming regions show a larger dynamic range than the LINER/Seyfert regions in ra-
diation field hardness (a factor of 150 versus a factor of 30 in [Ne III] 15.56 µm/[Ne II] 12.81 µm);
the radiation field hardness in the two populations reaches down to a similar lower bound,
but ranges to substantially higher values for the lowest-metallicity star-forming regions. In
a Spitzer/IRS study of eight classical AGN, Weedman et al. (2005) find a similar range in
[Ne III] 15.56 µm/[Ne II] 12.81 µm, with ratios spanning a range from ∼0.17 to 1.9. Assum-
ing that our catchall term “AGN” is comprised of both LINERs and Seyferts, it is somewhat
surprising that star-forming regions show a much larger hardness range than AGN since
LINERs are known to have ionization parameters an order of magnitude lower than Seyferts
(e.g., Ho, Filippenko, & Sargent 2003 and references therein). In addition to the lack of
dependence of radiation hardness on metallicity, presumably SINGS AGN do not exhibit ex-
tremely large [Ne III]15.56 µm/[Ne II]12.81 µm ratios partly due to a larger fraction of neon
residing in ionization states higher than Ne2+. This interpretation is anecdotally supported
by the detection rate of [Ne V]14.32 µm in the SINGS sample: [Ne V]14.32 µm is detected
in four of 35 AGN but in none of the 120 star-forming targets. For comparison Weedman et
al. (2005) detect [Ne V]14.32 µm in four of eight AGN studied.
Though the lowest-metallicity star-forming sources exhibit the hardest radiation fields,
and despite the fact that a substantial portion of the neon in AGN may reside in ionization
states higher than Ne2+, overall the AGN show larger average [Ne III]15.56 µm/[Ne II]12.81 µm
ratios (see also Madden et al. 2006; Kaneda et al 2008). Statistically, the extranuclear and
star-forming nuclear regions exhibit a median and dispersion in [Ne III]15.56 µm/[Ne II]12.81 µm
of 0.28 and 0.49 dex, respectively, whereas the AGN show a median of 0.53 and a spread
of 0.38 dex in the ionized neon ratio. Furthermore, note that for super-solar metallicity
systems (12 + log(O/H) & 9.0 for the Kobulnicky & Kewley (2004) strong-line calibration),
the average hardness of the radiation field is conspicuously more elevated for AGN than for
star-forming regions. For the region defined by 12 + log(O/H) & 9.0, AGN cluster mainly

– 10 –
between 0.04 and 2 in the ratio [Ne III]15.56 µm/[Ne II]12.81 µm whereas the star-forming
regions group between 0.006 and 0.04. The ability to distinguish between AGN and star
formation using a [Ne III]/[Ne II] hardness indicator, at least for metal rich environments, is
consistent with theoretical expectations (e.g., Figure 6g of Spinoglio & Malkan 1992; § 3.2.3
of Voit 1992).
4.3. OIV/NeII and PAH Strength
Studies of AGN, starbursting galaxies, and ultraluminous infrared galaxies with the In-
frared Space Observatory showed that ratios of high ionization-to-low ionization lines could
separate AGN-dominated sytems from sytems powered by star formation (e.g, Genzel et
al. 1998; Sturm et al. 2002; Peeters, Spoon, & Tielens 2004). When such ratios are
plotted as a function of PAH strength, the separation is accentuated. Figure 5 displays
this type of diagram for SINGS targets based on Spitzer spectroscopy. The SINGS sam-
ple does not contain luminous infrared galaxies (LFIR & 1011 L⊙) or ultraluminous infrared
galaxies(LFIR & 1012 L⊙), and probes relatively faint dwarf galaxies and individual H II re-
gions. Nevertheless, these mid-infrared diagnostics for the relatively lower-luminosity SINGS
sample show a separation between AGN and star-forming regions similar to that seen for
higher luminosity targets.
4.4. FeII/NeII and SiII/SIII
Figure 6 shows [Fe II] 25.99 µm/[Ne II] 12.81 µm as a function of [Si II] 34.82 µm/[S III] 33.48 µm.
This line ratio combination shows a strong correlation, and more strikingly, a clear separa-
tion between star-forming and AGN regions. To understand the correlation as well as the
separation, it is instructive to review the similarities in the two line ratios. The numerators
utilize Si and Fe, refractory elements that provide two of the main building blocks for dust
grains (Draine 2003). Both numerators involve species with similar ionization potentials
(∼8 eV) that are below one Rydberg, whereas the denominators involve species with ioniza-
tion potentials of 22–23 eV; Fe+ and Si+ can emit from outside of H II regions while Ne+
and S2+ emit from within H II regions.
One possibility for the AGN/star-forming separation in Figure 6 involves the extent to
which Si and Fe are depleted onto dust grains. Perhaps the hard radiation fields concomitant
with AGN provide enough sufficiently energetic photons such that photodesorption returns
a large number of Si and Fe atoms from the surfaces of dust grains back to the gas phase of

– 11 –
the interstellar medium. In addition, AGN are able to heat dust to very high temperatures
out to large radii, potentially leading to thermal sublimation of interstellar grains, or it’s
possible that the dense environment leads to enhanced grain erosion through sputtering or
even shattering (see Draine 2003 for a review). Thus the liberation of dust grain constituents,
as indicated by gas phase Fe and Si lines, may be enhanced for active galaxies. A difficulty
with this interpretation is that Si and Fe can also be returned to the gas phase via shocks
associated with individual supernovae or with starburst-driven superwinds, or even mergers
(Forbes & Ward 1993; Alonso-Herrero et al. 2003; O’Halloran, Satyapal, & Dudik 2006;
Armus et al. 2006; Armus et al. 2007), so it’s unclear whether the level of Si and Fe
depletion is the dominant factor for the AGN/star-forming separation observed in Figure 6.
Another interpretation for the observed separation in Figure 6 relies on X-ray photoion-
ization processes associated with AGN (e.g., Knop et al. 2001). According to predictions
from X-ray dissociation models (e.g., Maloney et al. 1996), very energetic (&keV) photons
are able to travel large distances through the interstellar medium due to their small cross-
sections to absorption. Once these energetic photons finally are absorbed and deposit their
energy into the interstellar medium, a large, low ionization volume is produced via a slew of
secondary ionizations. Along with several prominent ultraviolet and optical emission lines
(e.g., Lyα, [O I] 6300A, [C I] 9823,9850A), a few infrared emission lines are predicted to be
particularly bright from X-ray dissociation regions, including [O I] 63.18 µm, [Si II] 34.82 µm,
[Fe II] 25.99 µm, [O I] 145.5, and [C II] 157.7 µm. Observations support this scenario of
bright XDR lines for AGN-like environments (Veilleux & Osterbrock 1987; Armus, Heckman,
& Miley 1989; Veilleux 1991; Spinoglio & Malkan 1992; Osterbrock 1993; Dale et al. 2004).
Compared to sites of star formation, a smaller fraction of the energy budget in XDRs results
in nebular line emission such as [Ne II] 12.81 µm and [S III] 33.48 µm. The observed range
of [Fe II] 25.99 µm/[Ne II] 12.81 µm for AGN can be recovered for some X-ray dissociation
models (e.g., Maloney 1999; P. Maloney, priv. comm.), but the unknown Si and Fe depletion
factors and ionization parameters complicate any model-based conclusions.
A third explanation for the unusually high proportion of [Si II] 34.82 µm, and [Fe II] 25.99 µm
emission for AGN environments is based on interstellar density. Theoretical models show that
the ratios [Si II](PDR)/[Si II](H II), [Fe II](PDR)/[Fe II](H II), [Si II](XDR)/[Si II](PDR),
and [Fe II](XDR)/[Fe II](PDR) increase with increasing density (Kaufman, Wolfire, & Hol-
lenbach 2006; Meijerink & Spaans 2005). So if the mid-infrared line-emitting gas in AGN
is typically more dense than found in starbursts and normal galaxies, this could lead to the
observed enhancement in [Si II] 34.82 µm and [Fe II] 25.99 µm emission. As will be shown
in Section 4.5, there is no evidence that the H II regions within apertures centered on AGN
are significantly more dense compared to sites dominated by star formation, even when the
extraction apertures are shrunk by a factor of three to four in area. It is conceivable that

– 12 –
the bulk of the mid-infrared emitting regions associated with these AGN may be far more
compact than our apertures, but we can at least report that the use of apertures three to
four times smaller results in no significant change in Figure 6.
The above interpretations focus on the emission from Si and Fe, but it is also possible
that the trends observed in Figure 6 are governed by the line emission mechanisms responsible
for the normalizations in these line ratios. For example, the separation between AGN and
star-forming regions holds when either of the two normalizations in Figure 6 are replaced by a
third nebular line with a similar ∼23 eV ionization potential: [S III] 18.71 µm. Furthermore,
the distribution in Figure 6 hints that extranuclear regions, presumably more representative
of “pure” H II regions, slightly separate from the star-forming nuclei, further supporting
the notion that nebular lines drive the correlation. In addition, many AGN show a higher
fraction of elements residing in highly ionized states (§ 4.2); relatively weak low-ionization
emission in AGN can drive these ratios to higher values than seen in star-forming regions.
Consistent with this picture is the finding by O’Halloran et al. (2006) of relatively large
ratios of [Fe II] 25.99 µm/[Ne II] 12.81 µm for very low metal abundance systems. The hard
radiation fields for such systems (§ 4.2) expend comparatively more of their radiative energy
on producing higher ionization lines such as [Ne III] 15.56 µm and less on relatively lower ion-
ization lines like [Ne II] 12.81 µm. It is also possible that low-metallicity regions have lower Fe
depletion rates onto grains. In this narrow sense low metallicity systems are observationally
similar to AGN, and show relatively large ratios of [Fe II] 25.99 µm/[Ne II] 12.81 µm. Note
that the SINGS targets with the lowest metallicities do not appear in Figures 4 and 6 since
they were either not observed with the IRS high resolution spectrometer (e.g., M81 Dwarf A,
M81 Dwarf B, IC 2574, DDO 154, NGC 6822, Holmberg I, and Holmberg II) or were not
detected in these lines (e.g., Holmberg IX, DDO 053, DDO 165, NGC 5408, and NGC 5474).
4.5. Interstellar Density
Figure 7 shows the distribution of nebular electron densities as determined by the line
ratio [S III]18.71 µm/[S III]33.48 µm(see the top axis of the figure; Martın-Hernandez et
al. 2002). The average density is calculated using electron collision strengths from Tayal &
Gupta (1999). The effects of differential extinction at these mid-infrared wavelengths have
not been included in this calculation, but the internal extinction for SINGS galaxies at these
wavelengths is negligible (Dale et al. 2006; Prescott et al. 2007; Smith et al. 2007a), except
for NGC 1377 which does not appear in Figure 7 since neither sulfur line is securely de-
tected (Roussel et al. 2006). Though the SINGS sample exhibits a wide range in interstellar
electron densities, the average values for the three different environments are similar. The

– 13 –
median densities for star-forming nuclear, extranuclear, and AGN regions are respectively
270, 380, and 280 cm−3. The lack of significant differences in average density between dif-
ferent environments could be partly attributable to the ∼kiloparsec scales sampled by our
apertures—each aperture presumably captures emission from both H II and photodissocia-
tion regions, in addition to the emission from the accretion disks for some apertures (e.g.,
Dudik et al. 2007). To investigate this possibility we have re-extracted the spectra over
∼11′′×9′′ apertures. Over these smaller apertures, which cover ∼29% of the area spanned
by the ∼23′′×15′′ apertures, the median inferred densities are 60-70% larger, or 460, 600,
and 460 cm−3 for star-forming nuclear, extranuclear, and AGN regions, respectively. Due
to the diffraction limitations of the telescope we cannot meaningfully take this type of com-
parison to smaller spatial scales, but on the relatively small scales probed here the different
environments retain their density similarities.
5. Summary
The SINGS sample of 75 galaxies and 88 extranuclear regions covers a broad swath of
the extragalactic environments found in the local universe. Faint low metallicity systems,
bright starbursting galaxies, quiescent and star-forming ellipticals, low luminosity AGN, and
“normal” spirals are all represented in the SINGS sample. Important legacy aspects to the
SINGS project are the comprehensive, uniform databases of Spitzer imaging and low- and
high-resolution spectroscopy, along with the extensive ancillary ultraviolet, optical, near-
infrared, submillimeter, and radio datasets. This contribution focuses on the SINGS high
resolution mid-infrared spectroscopy. Short-High (10–19 µm) and Long-High (19–37 µm)
spectra from matching apertures are presented for the full SINGS sample of nuclear and
extranuclear regions. The majority of apertures are ∼23′′×15′′, though 31′′×27′′ apertures
are utilized for nine nuclei with extended circumnuclear emission for which we obtained
larger Short-High maps. The fluxes for nine atomic forbidden and three molecular hydrogen
mid-infrared emission lines are provided in addition to upper limits in several key lines for
infrared-faint targets.
Three mid-infrared line diagnostics present opportunities to distinguish between star
formation and accretion-powered systems. Using a mid-infrared line diagnostic that involves
the radiation field hardness indicator [Ne III]15.56 µm/[Ne II]12.81 µm, it is shown that for
regions with super-solar abundances of oxygen the [Ne III]15.56 µm/[Ne II]12.81 µm ratio is
elevated for AGN. Moreover, and more importantly, metallicity is associated with radiation
field hardness for regions powered by star formation. The observed trend for star-forming
targets matches photoionization models using standard inputs. The same dependence on

– 14 –
metallicity does not hold true for active galactic nuclei, systems for which the radiation field
hardness is more likely driven by the properties of the resident accretion disk.
PAH equivalent widths and ratios of mid-infrared high ionization-to-low ionization lines
both help to discriminate between AGN and star-forming nuclei, a technique first pioneered
by Infrared Space Observatory observations of AGN, starbursting, and ultraluminous infrared
galaxies. Lower luminosity SINGS AGN, star-forming nuclei, and star-forming extra-nuclear
regions follow the same general trend first seen with ISO.
In a third mid-infrared line diagnostic, the ratios [Fe II] 25.99 µm/[Ne II] 12.81 µm
and [Si II] 34.82 µm/[S III] 33.48 µm are smaller for normal star-forming environments
than for AGN. This striking result is presumably due to depressed [Ne II] 12.81 µm and
[S III] 33.48 µm emission, and/or enhanced [Fe II] 25.99 µm and [Si II] 34.82 µm emission
for sites powered by AGN. The former would be due to increased ionization of the species,
and the latter to increased emission from X-ray dissociation regions, or possibly to decreased
depletion of iron and silicates onto interstellar dust grains in AGN-powered environments;
Fe and Si atoms are perhaps more easily liberated from dust grains into the gas phase in the
hot accretion disk environments associated with AGN. However, the ability to discriminate
between AGN and star formation breaks down for environments with very low metallicities.
The hardness of the radiation fields for systems with low metal abundances appears to blur
the lines between AGN and low-metallicity star formation, at least in the narrow sense of
the line ratios [Fe II] 25.99 µm/[Ne II] 12.81 µm, [Si II] 34.82 µm/[S III] 33.48 µm, and
[Ne III]15.56 µm/[Ne II]12.81 µm.
Finally, the ratio of [S III] 18.71 µm/[S III] 33.48 µm indicates a wide range of interstellar
electron densities but the average value on ∼23′′×15′′ (∼11′′×9′′) scales is 300–400 cm−3 (500–
600 cm−3) for star-forming nuclear, star-forming extranuclear, and AGN environments.
Rajib Ganguly, Brent Groves, and Phil Maloney graciously helped with comparisons of
the data to theoretical models. We are grateful for the helpful suggestions provided by the
referee. Support for this work, part of the Spitzer Space Telescope Legacy Science Program,
was provided by NASA through Contract Number 1224769 issued by the Jet Propulsion
Laboratory, California Institute of Technology under NASA contract 1407. This research has
made use of the NASA/IPAC Extragalactic Database which is operated by JPL/Caltech,
under contract with NASA. This publication makes use of data products from the Two
Micron All Sky Survey, which is a joint project of the University of Massachusetts and the
Infrared Processing and Analysis Center/California Institute of Technology, funded by the
National Aeronautics and Space Administration and the National Science Foundation.

– 15 –
REFERENCES
Appleton, P.N. et al. 2006, ApJ, 639, L51
Armus, L., Heckman, T.M., & Miley, G.K. 1989, ApJ, 347, 727
Armus, L. et al. 2006, ApJ, 640, 204
Armus, L. et al. 2007, ApJ, 656, 148
Alonso-Herrero, A., Rieke, G.H., Rieke, M.J., & Kelly, D. 2003, AJ, 125, 1210
Beirao, P. et al. 2008, ApJ, 676, 304
Bendo, G. et al. 2006, ApJ, 645, 134
Bot, C. et al. 2008, ApJ, submitted
Brandl, B.R. et al. 2006, ApJ, 653, 1129
Bregman, J.N., Temi, P., & Bregman, J.D. 2006, ApJ, 647, 265
Brunner, G. et al. 2008, ApJ, 675, 316
Buckalew, B.A. et al. 2008, ApJ, submitted
Cannon, J.M. et al. 2006, ApJ, 647, 293
Dale, D.A., Helou, G., Brauher, J.R., Cutri, R.M., Malhotra, S., & Beichman, C.A. 2004,
ApJ, 604, 565
Dale, D.A. et al. 2006, ApJ, 646, 161
Devost, D. et al. 2004, ApJS, 154, 242
Draine, B.T. 2003, ARA&A, 41, 241
Dudik, R.P., Weingartner, J.C., Satyapal, S., Fischer, J., Dudley, C.C., & O’Halloran, B.
2007, ApJ, 664, 71
Engelbracht, C.W., Gordon, K.D., Rieke, G.H., Werner, M.W., Dale, D.A., & Latter, W.B.
2005, ApJ, 628, L29
Engelbracht, C.W. et al. 2006, ApJ, 642, L127

– 16 –
Engelbracht, C.W., Rieke, G.H., Gordon, K.D., Smith, J.-D.T., Werner, M.W., Moustakas,
J., Willmer, C.N.A., & Vanzi, L. 2008, ApJ, 678, 804
Engelbracht, C.W. et al. 2008b, ApJ, submitted
Farrah, D. et al. 2007, ApJ, 667, 149
Forbes, D.A. & Ward, M.J. 1993, ApJ, 416, 150
Genzel, R. et al. 1998, ApJ, 498, 579
Gordon, K.D., Engelbracht, C.W., Rieke, G.H., Misselt, K.A., Smith, J.D.T., & Kennicutt,
R.C. 2008, ApJ, in press
Hao, L. et al. 2005, ApJ, 625, L75
Habing, H.J. 1968, Bull. Astron. Inst. Netherlands, 19, 421
, S.J.U., Armus, L., Higdon, J.L., Soifer, B.T., & Spoon, H.W.W. 2006, ApJ, 648, 323
Higdon, S.J.U., Armus, L., Higdon, J.L., Soifer, B.T., & Spoon, H.W.W. 2006, ApJ, 648,
323
Ho, L., Filippenko, A.V., & Sargent, W.L. 2003, ApJ, 583, 159
Hollenbach, D. & Tielens, A.G.G.M. 1999, Rev. Mod. Phys., 71, 173
Houck, J.R. et al. 2004, ApJS, 154, L18
Hunter, D.A. & Kaufman, M. 2007, AJ, 134, 721
Johnstone, R.M., Hatch, N.A., Ferland, G.J., Fabian, A.C., Crawford, C.S., & Wilman, R.J.
2007, MNRAS, 328, 1246
Kaneda, H., Onaka, T., & Sakon, I. 2005, ApJ, 632, L83
Kaneda, H., Onaka, T., Sakon, I., Kitayama, T., Okada, Y., & T. Suzuki, T. 2008, ApJ, in
press
Kennicutt, R.C., Keel, W.C., & Blaha, C.A. 1989, AJ, 97, 1022
Kennicutt, R.C. et al. 2003, PASP, 115, 928
Kewley, L.J., Dopita, M.A., Sutherland, R.S., Heisler, C.A., Trevena, J. 2001, ApJ, 556, 121
Knop, R.A., Armus, L., Matthews, K., Murphy, T.W., & Soifer, B.T. 2001, ApJ, 122, 764

– 17 –
Kobulnicky, H.A. & Kewley, L.J. 2004, ApJ, 617, 240
Leitherer, C. et al. 1999, ApJS, 123, 3
Lutz, D., Kunze, D., Spoon, H.W.W., & Thornley, M.D. 1998, A&A, 333, L75
Madden, S.C., Galliano, F., Jones, A.P., & Sauvage, M. 2006, A&A, 446, 877
Martın-Hernandez, N.L. et al. 2002, A&A, 381, 606
Maloney, P.R., Hollenbach, D.J., & Tielens, A.G.G.M. 1996, ApJ, 466, 561
Maloney, P.R. 1999, Astrophysics and Space Science, 266, 207
Moustakas, J. & Kennicutt, R.C. 2006, ApJS, 164, 81
Moustakas, J., Kennicutt, R.C., Calzetti, D., Dale, D.A., Prescott, M., Smith, J.D.T., &
Tremonti, C.A. 2009, ApJ, submitted
O’Halloran, B., Satyapal, S., & Dudik, R.P. 2006, ApJ, 641, 795
Osterbrock, D.E. 1993, ApJ, 404, 551
Peeters, E., Spoon, H.W.W., & Tielens, A.G.G.M. 2004, ApJ, 613, 986
Prescott, M.K.M. et al. 2007, ApJ, 668, 182
Rigoupoulou, D., Kunze, D., Lutz, D., Genzel, R., & Moorwood, A.F.M. 2002, A&A, 389,
374
Roussel, H. et al. 2006, ApJ, 646, 841
Roussel, H. et al. 2007, ApJ, 669, 959
Sajina, A., Yan, L., Armus, L., Choi, P., Fadda, D., Helou, G., & Spoon, H. 2007, ApJ, 664,
713
Sajina, A. et al. 2008, ApJ, in press
Siebenmorgen, R., Haas, M., Krugel, E., & Schulz, B. 2005, A&A, 436, L5
Smith, J.D.T. et al. 2004, ApJS, 154, L199
Smith, J.D.T. et al. 2007a, ApJ, 656, 770

– 18 –
Smith, J.D.T., Armus, L., Dale, D.A., Roussel, H., Kartik, S., Buckalew, B.A., Jarrett, T.H.,
Helou, G., & Kennicutt, R.C. 2007b, PASP, 119, 1133
Satyapal, S., Vega, D., Heckman, T., O’Halloran, & Dudik, R. 2007, ApJ, 663, L9
Searle, L. 1971, ApJ, 168, 327
Spinoglio, L. & Malkan, M.A. 1992, ApJ, 399, 504
Spoon, H.W.W., Marshall, J.A., Houck, J.R., Elitzur, M., Hao, L., Armus, L., Brandl, B.R.,
& Charmandaris, V. 2007, ApJ, 654, L49
Sturm, E. et al. 2005, ApJ, 629, L21
Sturm, E. et al. 2006, ApJ, 653, L13
Sturm, E., Lutz, D., Verma, A., Netzer, H., Sternberg, A., Moorwood, A.F.M., Oliva, E., &
Genzel, R. 2002, A&A, 393, 821
Tayal, S.S., & Gupta, G.P. 1999, ApJS, 526, 544
Teplitz, H. et al. 2007, ApJ, 659, 941
Thornley, M.D., Forster Schreiber, N.M., Lutz, D., Genzel, R., Spoon, H.W.W., Kunze, D.,
& Sternberg, A. 2000, ApJ, 539, 641
Valiante, E., Lutz, D., Sturm, E., Genzel, R., Tacconi, L.J., Lehnert, M.D., & Baker, A.J.
2007, ApJ, 660, 1060
Veilleux, S. & Osterbrock, D.E. 1987, ApJS, 63, 295
Veilleux, S. 1991, ApJ, 369, 331
Verma, A., Lutz, D., Sturm, E., Sternberg, A., Genzel, R., & Vacca, W. 2003, A&A, 403,
829
Vermeij, R., Damour, F., van der Hulst, J.M., & Baluteau, J.-P. 2002, A&A, 390, 649
Voit, G.M. 1992, ApJ, 399, 495
Weedman, D. et al. 2005, ApJ, 633, 706
Weedman, D. Le Floc’h, E., Higdon, S.J.U., Higdon, J.L., & Houck, J.R. 2006a, ApJ, 638,
613

– 19 –
Weedman, D. et al. 2006b, ApJ, 653, 101
Wu, Y., Charmandaris, V., Hao, H., Brandl, B.R., Bernard-Salas, J., Spoon, H.W.W., &
Houck, J.R. 2006, ApJ, 639, 157
Yan, L., Chary, R., Armus, L., Teplitz, H., Helou, G., Frayer, D., Fadda, D., Surace, J., &
Choi, P. 2005, ApJ, 628, 604
This preprint was prepared with the AAS LATEX macros v5.2.

–20
–
Table 1. Nuclear and ExtraNuclear Emission Line Fluxes: Molecular Hydrogen
Target α0 δ0 Projected H2 S(2) H2 S(1) H2 S(0)
(J2000.0) Area 12.28µm 17.04µm 28.22µm
(kpc2) 1682 K 1015 K 510 K
NGC 0024 000956.3 −245750 0.427 · · · 0.82±0.42 0.94±0.22
NGC 0337 005950.0 −073441 3.975 · · · 2.95±0.53 1.86±0.49
NGC 0584a 013120.7 −065204 3.154 · · · · · · · · ·
NGC 0628 013641.7 +154701 0.463 · · · 2.18±0.53 0.91±0.27
NGC 0855 021403.6 +275239 0.721 · · · 2.71±1.16 · · ·
NGC 0925 022717.1 +333445 0.660 · · · 1.65±0.47 0.63±0.14
NGC 1097a b 024619.0 −301629 5.732 19.99±1.66 43.10±0.81 12.72±3.76
NGC 1266a 031600.7 −022538 7.144 17.34±0.86 21.76±0.71 · · ·
NGC 1291a 031718.6 −410629 0.928 1.50±0.44 5.01±0.62 1.15±0.26
NGC 1316a 032241.7 −371230 4.686 2.84±0.54 6.09±0.59 · · ·
NGC 1377a 033639.1 −205408 5.842 3.53±0.92 9.47±0.82 · · ·
NGC 1404a 033851.9 −353539 2.694 · · · · · · · · ·
NGC 1482b 035438.9 −203008 10.583 13.58±0.82 24.49±0.84 5.76±1.55
NGC 1512a b 040354.2 −432055 2.739 · · · 4.84±0.32 1.47±0.16
NGC 1566a 042000.4 −545617 3.582 8.25±0.61 17.01±0.61 3.10±0.38
NGC 1705b 045413.6 −532138 0.511 · · · 0.29±0.13 · · ·
NGC 2403 073650.0 +653604 0.082 · · · · · · 0.74±0.18
DDO 053 083407.2 +661054 0.101 · · · · · · · · ·
NGC 2798 091722.9 +420000 5.432 15.10±1.41 31.52±0.94 · · ·
NGC 2841a 092202.6 +505835 0.844 1.32±1.29 1.52±0.31 0.46±0.13
NGC 2915 092611.5 −763736 0.113 · · · · · · · · ·
NGC 2976 094715.3 +675500 0.100 · · · 2.57±0.63 1.30±0.14
NGC 3049 095449.6 +091617 4.986 · · · 2.66±0.35 1.42±0.58
NGC 3031a 095533.2 +690355 0.104 4.30±0.63 7.17±0.38 0.95±0.34
Holmberg IX 095732.0 +690245 0.086 · · · · · · · · ·
NGC 3190a 101805.6 +214956 3.797 3.14±0.44 9.35±0.44 3.04±0.21
NGC 3184 101816.9 +412528 0.671 1.64±0.34 3.56±0.47 1.40±0.27
NGC 3198a 101954.9 +453259 1.488 2.30±0.79 4.85±0.84 2.41±0.52
NGC 3265 103106.7 +284748 4.256 2.36±1.03 4.36±0.40 1.69±0.48
Markarian33 103231.9 +542404 4.510 2.03±0.60 3.90±0.87 2.48±0.62
NGC 3351b 104357.7 +114213 1.712 5.52±0.64 13.55±0.43 3.81±1.05
NGC 3521a 110548.6 −000209 0.793 1.72±0.80 5.06±0.85 2.43±0.32
NGC 3621a 111816.5 −324851 0.347 2.66±0.69 6.18±0.49 2.41±0.17

–21
–
Table 1—Continued
Target α0 δ0 Projected H2 S(2) H2 S(1) H2 S(0)
(J2000.0) Area 12.28µm 17.04µm 28.22µm
(kpc2) 1682 K 1015 K 510 K
NGC 3627a 112015.0 +125930 0.759 21.44±0.75 44.49±0.78 6.02±0.71
NGC 3773 113813.0 +120644 1.125 · · · 1.05±0.23 0.90±0.19
NGC 3938a 115249.4 +440715 1.650 · · · 1.84±0.28 1.29±0.19
NGC 4125a 120806.0 +651028 4.156 1.33±0.40 3.12±0.51 0.62±0.10
NGC 4236 121642.1 +692746 0.157 · · · · · · · · ·
NGC 4254 121849.6 +142500 10.959 5.09±0.61 13.94±0.79 2.92±0.40
NGC 4321a b 122254.9 +154921 4.022 8.26±0.90 15.35±0.37 5.36±0.40
NGC 4450a 122829.6 +170506 7.858 5.68±0.80 15.39±0.55 1.74±0.24
NGC 4536b 123427.1 +021117 4.091 11.31±0.90 26.89±1.02 6.85±1.66
NGC 4552a 123539.8 +123323 2.008 · · · · · · · · ·
NGC 4559 123557.7 +275736 0.840 · · · 3.01±0.39 1.89±0.18
NGC 4569a 123649.8 +130946 3.166 24.69±0.89 48.48±0.62 5.96±0.89
NGC 4579a 123743.6 +114906 2.184 16.58±0.82 25.05±0.45 1.72±0.27
NGC 4594a 123959.5 −113723 0.694 · · · · · · 0.54±0.38
NGC 4625a 124152.6 +411626 0.666 1.09±0.38 2.12±0.37 1.22±0.20
NGC 4631 124207.8 +323235 0.604 8.35±0.95 16.71±0.52 10.28±0.82
NGC 4725a 125026.6 +253003 1.223 2.63±0.67 5.97±0.58 1.79±0.21
NGC 4736a 125053.1 +410713 0.217 14.78±1.02 33.21±0.99 4.18±0.68
NGC 4826a 125643.7 +214100 0.194 22.86±1.79 51.42±0.74 11.11±0.62
DDO 165 130624.8 +674225 0.165 · · · · · · · · ·
NGC 5033a 131327.5 +363538 2.027 9.88±0.57 23.92±0.69 5.23±0.31
NGC 5055a 131549.3 +420146 0.528 7.12±1.00 11.70±0.49 6.07±0.12
NGC 5194a 132952.7 +471143 0.523 11.20±0.87 18.40±0.57 2.60±0.30
NGC 5195a 132959.6 +471559 0.556 17.30±1.30 41.47±0.75 4.88±0.78
Tololo 89c 140121.7 −330346 2.403 · · · · · · · · ·
NGC 5408c 140321.0 −412244 0.182 · · · · · · · · ·
NGC 5474 140501.5 +533945 0.367 · · · · · · · · ·
NGC 5713 144011.5 −001720 6.833 8.90±1.32 24.29±0.76 4.57±0.71
NGC 5866a 150629.5 +554548 1.817 5.51±0.87 13.54±0.51 2.53±0.17
IC 4710 182838.1 −665854 0.635 · · · · · · · · ·
NGC 6946b 203452.3 +600914 0.907 18.16±1.05 37.88±0.86 8.77±1.81
NGC 7331a 223704.1 +342456 1.820 2.90±0.40 8.76±0.51 2.90±0.20
NGC 7552a b 231610.8 −423505 8.677 18.98±0.82 36.53±1.51 14.89±5.45

–22
–
Table 1—Continued
Target α0 δ0 Projected H2 S(2) H2 S(1) H2 S(0)
(J2000.0) Area 12.28µm 17.04µm 28.22µm
(kpc2) 1682 K 1015 K 510 K
NGC 7793 235749.8 −323527 0.127 2.30±0.70 2.33±0.43 0.88±0.27
NGC0628 00 013645.1 +154751 0.464 · · · 2.12±0.46 1.60±0.30
NGC0628 01 013637.5 +154512 0.463 · · · 1.48±0.48 1.02±0.36
NGC0628 02 013638.8 +154425 0.464 · · · 1.82±0.60 0.84±0.33
NGC0628 03 013635.5 +155011 0.463 · · · · · · · · ·
NGC1097 00 024624.0 −301751 2.313 2.19±0.84 3.42±0.54 1.47±0.50
NGC1097 01 024615.2 −301511 2.315 · · · 3.65±0.64 1.82±0.31
NGC1097 02 024614.2 −301459 2.317 · · · 2.36±0.50 1.45±0.27
NGC1566 00 042003.1 −545631 2.313 · · · 4.47±0.75 1.88±0.53
NGC1566 01 041955.5 −545614 2.312 2.66±1.48 6.48±0.67 2.92±0.62
NGC1566 02 041957.9 −545508 2.313 1.83±0.64 5.62±0.78 2.55±0.34
NGC2403 06 073645.5 +653700 0.082 · · · · · · · · ·
NGC2403 07 073652.7 +653646 0.082 · · · · · · 0.89±0.17
NGC2403 08 073706.9 +653639 0.082 0.76±0.38 2.05±0.20 · · ·
NGC2403 09 073717.9 +653346 0.082 · · · · · · 0.56±0.20
NGC2403 10 073619.5 +653704 0.082 · · · · · · · · ·
NGC2403 11 073628.5 +653350 0.082 · · · · · · · · ·
HolmbII 00 081913.3 +704308 0.111 · · · · · · · · ·
HolmbII 01 081927.0 +704159 0.111 · · · · · · · · ·
HolmbII 02 081928.8 +704221 0.111 · · · · · · · · ·
HolmbII 03 081850.1 +704448 0.111 · · · · · · · · ·
HolmbII 04 081928.9 +704301 0.102 · · · · · · · · ·
NGC2976 00 094707.8 +675552 0.101 2.49±0.98 3.53±0.70 2.26±0.49
NGC2976 01 094724.1 +675357 0.101 2.45±1.00 4.37±0.72 2.50±0.32
NGC3031 00 095600.4 +690402 0.114 · · · 1.19±0.44 0.61±0.16
NGC3031 01 095540.7 +685945 0.105 · · · 1.32±0.47 0.52±0.26
NGC3031 02 095524.4 +690815 0.114 · · · 1.52±0.27 0.53±0.18
NGC3031 03 095553.2 +685904 0.122 · · · 1.22±0.33 0.57±0.07
NGC3031 04 095456.6 +690847 0.133 · · · 0.43±0.20 0.29±0.00
NGC3031 05 095442.3 +690336 0.114 · · · 1.79±0.48 0.67±0.26
NGC3031 06 095617.4 +684950 0.105 · · · · · · · · ·
IC 2574 00 102848.4 +682802 0.034 · · · · · · · · ·
NGC3521 00 110546.3 −000410 0.801 · · · 1.78±0.94 0.53±0.12

–23
–
Table 1—Continued
Target α0 δ0 Projected H2 S(2) H2 S(1) H2 S(0)
(J2000.0) Area 12.28µm 17.04µm 28.22µm
(kpc2) 1682 K 1015 K 510 K
NGC3521 01 110550.0 −000340 0.799 · · · 6.67±0.78 3.93±0.31
NGC3521 02 110549.2 −000232 0.800 · · · 11.00±0.90 4.18±0.54
NGC3521 03 110547.7 +000033 0.801 · · · 2.04±0.22 0.98±0.36
NGC3627 00 112016.3 +125750 0.695 3.72±1.27 7.40±0.77 2.95±0.56
NGC3627 01 112016.4 +125844 0.697 9.42±0.61 22.73±0.80 4.03±0.51
NGC3627 02 112016.1 +125952 0.702 · · · 5.63±1.04 2.08±0.30
NGC3938 00 115246.4 +440701 1.414 · · · 3.14±0.50 0.94±0.16
NGC3938 01 115300.2 +440749 1.408 · · · · · · · · ·
NGC3938 02 115300.0 +440801 1.410 · · · · · · · · ·
NGC4254 00 121849.1 +142359 11.017 · · · 3.61±1.13 1.91±0.17
NGC4254 01 121844.7 +142425 11.022 · · · 2.20±0.84 1.00±0.34
NGC4321 00 122259.0 +154935 1.609 · · · 3.49±0.76 1.62±0.39
NGC4321 01 122247.4 +154945 1.612 · · · 2.10±0.46 1.52±0.27
NGC4321 02 122249.9 +155029 1.626 · · · 2.17±0.66 1.18±0.31
NGC4631 00 124140.8 +323151 0.514 · · · · · · 0.92±0.50
NGC4631 01 124210.9 +323236 0.518 12.23±2.35 23.73±0.83 10.09±1.05
NGC4631 02 124221.4 +323307 0.515 · · · · · · 0.89±0.22
NGC4736 00 125049.6 +410723 0.199 2.89±0.62 7.99±0.59 2.36±0.50
NGC4736 01 125049.6 +410734 0.199 3.35±0.67 9.02±0.34 2.96±0.50
NGC4736 02 125056.3 +410720 0.199 5.83±0.66 10.38±0.49 2.45±0.73
NGC5055 00 131558.1 +420026 0.484 · · · 3.07±0.60 2.19±0.23
NGC5194 00 132953.1 +471240 0.482 3.13±0.59 7.33±0.46 2.71±0.47
NGC5194 01 132944.1 +471021 0.478 4.70±0.81 8.65±0.42 3.01±0.58
NGC5194 02 132944.6 +470955 0.480 2.83±1.00 4.76±0.43 1.82±0.60
NGC5194 03 132956.2 +471407 0.478 2.01±0.46 5.53±0.38 2.09±0.34
NGC5194 04 132959.6 +471401 0.478 2.39±0.52 4.37±0.45 1.38±0.34
NGC5194 05 132939.5 +470835 0.477 1.45±1.21 4.76±0.47 2.43±0.39
NGC5194 06 133002.5 +470952 0.478 · · · 3.94±0.66 2.06±0.61
NGC5194 07 133001.6 +471252 0.478 1.63±0.65 6.98±0.52 2.99±1.38
NGC5194 08 132959.9 +471112 0.476 · · · 6.18±0.57 2.93±0.57
NGC5194 09 132956.7 +471046 0.478 3.07±0.75 9.78±0.39 3.97±0.40
NGC5194 10 132949.7 +471329 0.478 · · · 2.46±0.34 2.15±0.20
Tololo89 00 140120.2 −330410 2.416 · · · 1.55±0.49 · · ·

–24
–
Table 1—Continued
Target α0 δ0 Projected H2 S(2) H2 S(1) H2 S(0)
(J2000.0) Area 12.28µm 17.04µm 28.22µm
(kpc2) 1682 K 1015 K 510 K
NGC5408 00 140318.3 −412252 0.183 · · · · · · · · ·
NGC5713 00 144012.2 −001747 6.833 1.59±0.10 3.07±0.69 0.92±0.22
NGC5713 01 144010.6 −001747 6.859 3.77±0.69 5.38±1.06 1.66±0.36
NGC6822 00 194452.9 −144311 0.002 2.19±0.48 2.81±0.36 1.79±0.42
NGC6822 01 194505.2 −144313 0.002 2.11±0.47 · · · · · ·
NGC6822 02 194431.6 −144201 0.002 · · · 1.37±0.61 0.69±0.37
NGC6822 03 194434.1 −144222 0.002 · · · 1.00±0.32 · · ·
NGC6822 04 194448.6 −145227 0.002 · · · · · · 1.02±0.32
NGC6822 05 194450.6 −145251 0.002 · · · 1.20±0.52 1.81±0.31
NGC6822 06 194457.2 −144749 0.002 · · · · · · 0.98±0.37
NGC6946 00 203516.7 +601057 0.367 · · · 2.64±0.25 1.39±0.30
NGC6946 01 203525.1 +601003 0.467 1.35±0.30 1.35±0.42 1.10±0.36
NGC6946 02 203452.3 +601241 0.401 1.47±0.46 2.28±0.36 1.61±0.33
NGC6946 03 203419.5 +601009 0.400 2.29±0.20 2.53±0.47 1.59±0.23
NGC6946 04 203439.0 +600453 0.400 1.09±0.19 0.95±0.23 0.77±0.11
NGC6946 05 203505.8 +601059 0.365 4.65±0.58 8.01±0.37 3.45±0.70
NGC6946 06 203511.0 +600859 0.367 4.66±0.99 7.73±0.60 3.49±0.83
NGC6946 07 203432.3 +601020 0.366 3.81±2.38 7.09±0.52 3.41±0.47
NGC6946 08 203513.0 +600851 0.366 5.17±0.68 7.04±0.47 3.91±0.60
NGC7793 00 235748.8 −323659 0.126 · · · · · · · · ·
NGC7793 01 235741.1 −323551 0.116 · · · · · · 0.37±0.08
NGC7793 02 235756.1 −323540 0.127 · · · · · · 0.47±0.28
NGC7793 03 235748.9 −323453 0.126 · · · · · · 0.32±0.29
Note. — Fluxes and their statistical uncertainties are listed in units of
10−9 W m−2 sr−1. Calibration uncertainties are an additional ∼25%. The 3σ
upper limits are provided for nondetections in several key lines. The nuclear
targets are listed first followed by the extranuclear targets.
Note. — The nuclei for eight SINGS galaxies are not listed in this table.

–25
–No high resolution infrared spectral data were taken for the optical centers of
Holmberg I, Holmberg II, M 81 Dwarf A, M 81 Dwarf B, IC 2574, DDO 154,
NGC 3034 (M 82), and NGC 6822.
aConsidered to harbor an AGN, based on optical spectroscopy (Moustakas
et al. 2009).
bThe Short-High maps are 45′′×33′′ instead of the standard ∼23′′×15′′.
cThe infrared emission peaks outside of the field of view of the nuclear
spectral maps. The infrared center was thus observed as an extranuclear
target, and the data from those observations are listed further down the table.

–26
–
Table 2. Nuclear and ExtraNuclear Emission Line Fluxes: Ionic Forbidden
Target [SIV] [NeII] [NeV] [NeIII] [SIII] [OIV] [FeII] [SIII] [SiII]
10.51µm 12.81µm 14.32µm 15.56µm 18.71µm 25.89µm 25.99µm 33.48µm 34.82µm
34.8 eV 21.6 eV 97.1 eV 41.0 eV 23.3 eV 54.9 eV 7.9 eV 23.3 eV 8.2 eV
NGC 0024 < 0.82 3.84±0.49 < 1.09 1.64±0.50 1.72±0.80 < 0.52 < 0.28 2.56±0.39 3.94±0.29
NGC 0337 1.93±0.78 23.13±0.50 < 0.91 9.90±0.37 15.70±0.92 < 0.60 1.13±0.24 24.76±0.75 25.90±0.59
NGC 0584 < 1.15 < 1.09 < 1.14 2.10±0.64 1.20±0.45 < 0.37 < 0.57 < 0.90 1.62±0.43
NGC 0628 < 2.17 7.69±0.43 < 1.23 < 1.17 3.11±0.59 < 0.47 < 0.21 4.98±0.42 7.58±0.58
NGC 0855 2.51±0.31 6.82±0.51 < 0.89 < 1.23 9.26±0.54 < 0.49 < 0.81 10.67±0.52 9.93±0.52
NGC 0925 < 2.03 12.80±0.70 < 1.25 6.29±0.58 5.80±0.87 < 0.45 0.68±0.21 11.19±0.37 12.46±0.49
NGC 1097b < 3.66 295.78±5.89 < 1.00 25.08±0.92 77.09±0.92 2.61±0.46 13.77±1.40 119.01±2.65 280.39±3.05
NGC 1266 < 2.22 35.74±1.20 < 1.13 11.90±0.55 1.47±0.54 < 1.75 3.75±1.14 4.99±0.58 19.87±3.58
NGC 1291 < 2.08 6.45±0.72 < 1.06 8.89±0.50 3.35±0.68 1.75±0.31 1.55±0.25 3.84±0.67 10.70±0.51
NGC 1316 < 2.09 15.70±1.18 < 0.75 13.43±0.47 3.14±0.60 3.16±0.18 3.91±0.27 3.91±0.83 14.87±0.78
NGC 1377 < 2.57 5.01±1.29 < 2.32 3.18±0.68 1.28±0.54 < 2.12 < 2.82 < 3.38 < 5.16
NGC 1404 < 1.75 1.67±0.45 < 1.19 1.23±0.34 < 1.09 < 0.43 < 0.43 < 0.54 < 1.04
NGC 1482b < 5.16 231.78±4.32 < 1.33 28.48±0.32 61.16±0.77 < 3.25 8.77±1.33 117.12±3.92 214.68±3.11
NGC 1512b < 1.24 15.69±3.51 < 0.55 2.38±0.40 6.61±0.63 < 0.42 0.79±0.23 11.53±0.57 21.69±0.49
NGC 1566 < 2.50 21.09±1.04 1.19±0.35 11.53±0.44 8.55±0.54 7.50±0.95 1.56±0.31 9.03±0.59 18.37±0.87
NGC 1705b 3.49±0.35 1.64±0.39 < 0.46 6.31±0.56 3.73±0.51 1.25±0.19 < 0.44 6.10±0.64 4.76±0.51
NGC 2403 < 1.89 6.29±0.74 < 0.88 2.59±0.33 4.26±0.49 < 0.44 0.57±0.19 7.33±0.39 11.94±1.32
DDO 053 < 1.44 < 1.40 < 1.10 1.21±0.15 < 1.11 < 0.46 < 0.43 < 1.19 < 1.33
NGC 2798 6.79±1.21 265.44±5.53 < 2.37 41.26±0.52 99.05±1.16 < 6.28 8.86±2.76 98.69±2.94 128.81±2.93
NGC 2841 < 1.64 7.03±0.45 < 5.51 8.30±0.61 3.42±0.63 0.96±0.17 0.96±0.18 4.88±0.29 10.98±0.44
NGC 2915 2.33±0.22 3.93±0.41 < 0.92 13.40±0.52 5.38±0.51 0.55±0.16 0.25±0.07 7.75±0.22 6.06±0.51
NGC 2976 < 1.94 9.17±0.55 < 1.22 3.41±0.33 7.56±0.48 < 0.38 0.52±0.15 10.84±0.41 10.75±0.47
NGC 3049 < 1.80 47.94±1.34 < 1.10 7.35±0.40 31.72±0.49 < 1.23 0.88±0.24 32.27±0.70 26.29±0.79
NGC 3031 2.03±1.53 38.43±0.98 < 0.93 30.34±0.70 9.65±0.73 5.72±1.10 4.22±0.46 9.60±0.65 29.67±0.72
Holmberg IX < 1.62 < 1.10 < 0.79 < 0.93 < 1.01 < 0.47 < 0.51 < 1.03 < 1.25
NGC 3190 < 2.58 10.18±0.86 < 0.82 5.93±0.42 3.09±0.66 1.15±0.28 1.63±0.22 2.62±0.42 8.95±0.42
NGC 3184 < 1.71 22.31±1.13 < 1.02 2.66±0.51 10.11±0.57 < 0.36 1.06±0.27 9.82±0.41 14.93±0.31
NGC 3198 < 2.05 18.24±0.64 < 1.23 1.00±0.41 6.52±1.20 < 0.39 1.05±0.21 7.80±0.68 13.41±0.62
NGC 3265 < 2.47 36.68±0.91 < 0.96 6.72±0.55 18.99±0.75 < 0.88 1.36±0.49 17.83±0.71 20.92±0.81
Markarian33 19.37±0.94 73.32±0.74 < 1.27 55.21±0.48 62.70±0.90 1.10±0.34 2.50±0.51 54.33±1.07 34.99±1.01
NGC 3351b < 1.96 110.94±5.29 < 1.16 9.37±0.29 39.66±0.67 1.29±0.62 4.90±0.71 54.77±1.74 105.81±1.40
NGC 3521 < 2.01 16.92±0.66 < 1.17 9.08±0.47 2.88±0.80 2.76±1.15 1.25±0.21 9.06±0.81 23.29±0.65
NGC 3621 2.01±0.49 19.57±0.86 1.28±0.87 6.98±0.40 8.60±0.77 5.66±0.13 1.43±0.32 14.84±0.43 23.02±0.42

–27
–
Table 2—Continued
Target [SIV] [NeII] [NeV] [NeIII] [SIII] [OIV] [FeII] [SIII] [SiII]
10.51µm 12.81µm 14.32µm 15.56µm 18.71µm 25.89µm 25.99µm 33.48µm 34.82µm
34.8 eV 21.6 eV 97.1 eV 41.0 eV 23.3 eV 54.9 eV 7.9 eV 23.3 eV 8.2 eV
NGC 3627 < 3.25 28.60±1.28 < 1.14 10.48±0.60 6.12±0.57 2.04±0.94 3.81±0.20 9.76±0.64 24.85±1.14
NGC 3773 4.61±0.75 21.74±0.69 < 1.00 19.19±0.43 18.16±0.66 0.44±0.83 1.14±0.26 22.89±0.55 16.17±0.50
NGC 3938 < 1.40 6.69±0.60 < 0.81 1.25±0.17 1.53±0.39 0.31±0.18 0.47±0.09 3.53±0.49 9.29±0.49
NGC 4125 < 1.57 2.89±0.59 < 0.76 4.06±0.58 1.14±0.60 0.93±0.26 1.47±0.40 1.34±0.36 5.92±0.45
NGC 4236 < 1.64 < 1.18 < 1.87 < 0.91 < 1.00 < 0.28 < 0.96 < 0.78 < 1.06
NGC 4254 < 2.49 65.51±1.18 < 1.13 7.51±0.47 12.17±0.66 3.11±0.23 2.74±0.19 22.01±0.56 61.07±0.57
NGC 4321b < 1.94 76.96±1.45 < 0.63 9.22±0.30 16.17±0.54 < 0.94 4.39±1.27 27.55±0.81 79.50±0.98
NGC 4450 < 1.66 4.31±0.82 < 0.65 2.60±0.46 1.42±0.39 0.78±0.22 0.85±0.37 1.93±0.85 4.68±0.63
NGC 4536b < 1.94 195.88±1.58 < 0.63 30.41±0.57 80.37±0.86 < 4.02 9.04±2.24 141.25±2.03 174.73±2.59
NGC 4552 < 1.90 2.06±0.95 < 1.10 3.63±0.61 < 1.52 < 0.65 < 0.48 1.60±0.51 1.64±0.43
NGC 4559 < 1.94 10.25±0.66 < 1.26 2.83±0.32 5.73±0.55 0.15±0.08 0.68±0.12 11.55±0.32 12.62±0.49
NGC 4569 < 2.26 44.51±1.16 < 1.15 19.68±0.50 9.49±1.11 3.52±0.42 4.28±0.25 9.35±0.98 36.65±1.37
NGC 4579 < 1.56 29.99±0.92 < 0.90 14.41±0.43 5.58±1.11 3.38±0.11 5.44±0.41 4.87±0.45 23.48±0.56
NGC 4594 3.64±0.80 17.29±0.97 < 1.89 20.05±0.71 6.15±0.71 2.75±0.29 3.14±0.28 8.67±0.53 17.06±0.55
NGC 4625 < 2.08 7.31±0.60 < 1.03 1.49±0.45 3.58±0.53 < 0.32 0.45±0.17 5.49±0.48 8.35±0.69
NGC 4631 3.90±0.56 164.45±2.21 < 0.64 36.55±0.54 81.06±0.97 3.64±1.23 7.31±1.06 149.01±0.97 192.18±2.00
NGC 4725 1.38±0.59 2.79±0.55 < 0.98 3.27±0.38 < 0.93 1.90±0.32 1.62±0.20 1.77±0.36 3.99±0.45
NGC 4736 < 5.25 16.63±0.81 < 1.00 17.28±0.58 8.02±1.07 4.08±0.50 6.52±0.48 8.89±1.38 28.87±2.86
NGC 4826 < 4.09 129.26±2.57 < 1.59 28.13±0.52 50.62±0.49 5.26±0.06 11.76±0.71 71.46±1.27 130.41±1.31
DDO 165 < 1.43 < 0.86 < 0.93 < 0.78 < 1.16 < 0.30 < 0.55 < 0.55 < 0.99
NGC 5033 2.83±0.31 64.67±1.80 1.40±0.30 19.59±0.52 14.88±0.50 9.98±0.74 5.44±0.46 27.56±0.41 72.19±0.60
NGC 5055 < 2.30 27.32±0.95 < 1.17 11.80±0.35 21.06±0.51 2.86±0.11 3.38±0.24 15.67±0.38 45.91±0.55
NGC 5194 5.70±0.95 83.20±1.23 2.68±0.19 43.93±0.64 15.35±0.76 19.79±0.72 8.48±1.22 22.51±0.53 73.72±0.77
NGC 5195 < 2.90 21.88±0.80 < 1.24 8.55±0.47 3.28±0.80 < 2.36 1.82±0.73 4.13±1.06 16.20±1.12
Tololo 89a < 1.85 < 1.06 < 0.62 < 1.30 < 1.24 < 0.38 < 0.21 1.48±0.50 < 1.43
NGC 5408a < 1.39 < 1.10 < 1.15 1.49±0.47 1.54±0.30 < 0.63 < 0.63 2.56±0.50 2.36±0.46
NGC 5474 < 1.34 < 1.00 < 1.02 < 1.31 < 0.61 < 0.38 < 0.37 1.88±0.25 3.12±0.31
NGC 5713 1.56±0.86 156.77±2.35 < 0.99 20.91±0.39 57.53±0.75 3.43±0.77 7.80±0.85 81.00±0.98 111.06±1.24
NGC 5866 < 1.86 9.56±1.03 < 1.19 6.03±0.47 1.52±0.70 1.15±0.21 1.75±0.14 5.41±0.33 12.38±0.29
IC 4710 4.30±0.92 1.08±0.92 < 1.28 5.33±0.41 4.11±0.40 < 0.37 < 0.38 5.96±0.46 1.67±0.26
NGC 6946b < 2.86 218.43±4.74 < 0.77 19.91±0.53 63.54±0.92 < 3.65 9.71±2.05 85.72±3.05 161.71±2.21
NGC 7331 < 1.75 23.71±0.93 < 0.64 12.52±0.44 7.14±0.61 3.69±0.24 2.63±0.21 16.64±0.33 40.27±0.51
NGC 7552b < 1.70 423.29±19.65 < 1.82 35.54±0.51 129.25±1.23 < 5.27 16.41±3.44 140.40±5.56 207.63±5.97

–28
–
Table 2—Continued
Target [SIV] [NeII] [NeV] [NeIII] [SIII] [OIV] [FeII] [SIII] [SiII]
10.51µm 12.81µm 14.32µm 15.56µm 18.71µm 25.89µm 25.99µm 33.48µm 34.82µm
34.8 eV 21.6 eV 97.1 eV 41.0 eV 23.3 eV 54.9 eV 7.9 eV 23.3 eV 8.2 eV
NGC 7793 < 2.38 12.69±0.73 < 1.24 3.25±0.46 9.92±0.67 < 0.40 0.71±0.21 11.52±0.28 11.62±0.45
NGC0628 00 < 1.86 32.69±0.71 < 1.52 3.04±0.53 24.73±0.73 < 1.00 < 1.17 27.42±0.50 14.18±0.44
NGC0628 01 < 2.11 15.77±0.45 < 1.45 2.83±0.38 9.82±0.59 < 0.70 < 0.68 10.37±0.45 7.79±0.70
NGC0628 02 5.96±0.49 14.03±0.52 < 1.04 11.53±0.41 12.85±0.58 < 0.78 0.46±0.13 16.46±1.24 9.85±0.83
NGC0628 03 < 2.12 5.65±0.56 < 1.18 2.44±0.48 6.38±0.55 < 0.62 < 0.84 5.99±0.48 3.97±0.51
NGC1097 00 < 1.90 13.90±0.65 < 1.19 1.95±0.52 5.95±1.16 < 0.72 0.55±0.15 6.65±1.10 12.96±0.88
NGC1097 01 < 1.98 5.81±0.54 < 1.51 < 1.36 < 1.59 < 0.72 0.48±0.20 5.65±0.87 7.18±0.81
NGC1097 02 < 2.25 7.69±0.76 < 1.32 2.68±0.31 3.58±0.33 < 0.59 < 0.59 7.31±0.73 8.47±1.01
NGC1566 00 < 2.81 22.27±1.13 < 1.72 3.92±0.46 8.30±0.75 < 0.75 0.61±0.14 13.77±0.73 23.80±0.98
NGC1566 01 0.66±0.30 53.18±0.78 < 1.54 8.44±0.67 30.20±1.05 < 1.38 < 1.36 34.66±0.87 38.44±1.28
NGC1566 02 1.82±0.90 69.94±1.14 < 1.57 11.08±0.61 46.52±1.28 < 1.41 1.12±0.35 49.23±1.77 44.59±1.36
NGC2403 06 8.86±1.40 57.33±1.64 < 1.26 31.56±0.52 59.57±0.73 < 0.78 1.16±0.15 65.43±0.82 31.19±0.82
NGC2403 07 10.01±1.13 49.17±0.95 < 0.99 26.64±0.70 51.08±0.65 < 0.90 1.26±0.08 54.68±0.84 27.56±0.72
NGC2403 08 31.21±1.19 99.96±1.78 < 1.05 88.60±0.78 116.16±1.71 < 0.94 2.82±0.32 125.66±1.09 59.95±1.47
NGC2403 09 6.24±1.18 19.46±0.86 < 1.07 18.41±0.84 21.58±0.89 < 0.55 0.43±0.18 25.92±0.66 11.83±0.57
NGC2403 10 8.54±1.01 42.95±0.97 < 1.28 23.21±0.70 42.55±1.11 < 0.80 1.16±0.15 47.66±0.56 22.71±0.61
NGC2403 11 3.50±0.43 8.68±0.41 < 1.24 12.83±0.78 10.60±0.76 < 0.63 < 0.38 11.28±0.59 4.78±0.96
HolmbII 00 1.29±0.27 < 1.03 < 0.85 4.10±0.65 4.35±0.88 < 0.41 0.45±0.13 3.64±0.84 3.06±0.48
HolmbII 01 < 1.93 < 1.15 < 0.87 1.39±0.37 < 1.17 < 0.38 < 0.47 < 0.72 < 1.09
HolmbII 02 < 2.18 < 0.98 < 0.82 1.67±0.52 1.13±0.60 1.25±0.80 < 0.35 0.90±0.23 1.57±0.47
HolmbII 03 1.02±0.60 < 1.05 < 1.16 1.49±0.62 1.02±0.30 < 0.43 < 0.40 0.66±0.31 1.10±0.24
HolmbII 04 < 1.81 < 1.31 < 0.88 2.49±0.58 0.54±0.29 < 0.50 < 0.41 1.37±0.48 1.81±0.49
NGC2976 00 8.89±1.51 80.80±1.79 < 1.50 29.58±0.68 90.05±1.15 < 1.06 1.27±0.26 100.57±1.30 45.99±1.06
NGC2976 01 6.84±1.64 43.10±1.21 < 1.03 20.28±1.01 37.82±2.17 < 0.55 0.77±0.17 42.99±0.83 30.52±0.93
NGC3031 00 < 1.84 5.15±0.60 < 0.81 1.02±0.48 3.12±0.56 < 0.63 < 0.49 4.23±0.52 5.04±0.64
NGC3031 01 < 1.92 9.58±0.60 < 1.26 4.54±0.51 8.22±0.66 < 0.42 < 0.74 13.05±0.55 7.89±0.72
NGC3031 02 < 1.80 9.60±0.62 < 1.05 4.57±0.56 8.19±0.67 < 0.56 0.51±0.18 14.88±0.46 11.26±0.53
NGC3031 03 < 1.69 19.29±0.66 < 0.93 7.58±0.52 18.96±0.76 < 0.67 < 0.60 22.84±0.58 15.44±0.63
NGC3031 04 < 1.90 13.61±0.70 < 0.92 3.12±0.72 11.36±0.71 < 0.62 0.67±0.31 13.98±0.55 14.09±0.60
NGC3031 05 < 1.83 11.94±0.56 < 1.07 1.94±0.57 8.67±0.70 < 0.54 < 0.43 10.05±0.46 7.71±0.59
NGC3031 06 < 1.40 < 1.28 < 0.78 1.86±0.42 < 1.35 < 0.46 < 0.39 < 0.78 < 0.82
IC 2574 00 4.16±0.67 2.21±0.56 < 1.67 6.95±0.15 3.64±0.92 < 0.63 < 0.81 4.55±0.72 2.14±0.63
NGC3521 00 4.10±1.73 2.45±1.14 < 1.57 4.76±0.53 3.96±1.05 < 0.77 < 1.21 3.10±0.57 2.64±0.67

–29
–
Table 2—Continued
Target [SIV] [NeII] [NeV] [NeIII] [SIII] [OIV] [FeII] [SIII] [SiII]
10.51µm 12.81µm 14.32µm 15.56µm 18.71µm 25.89µm 25.99µm 33.48µm 34.82µm
34.8 eV 21.6 eV 97.1 eV 41.0 eV 23.3 eV 54.9 eV 7.9 eV 23.3 eV 8.2 eV
NGC3521 01 < 3.03 23.80±1.14 < 1.58 4.12±0.88 6.36±0.82 < 1.25 1.65±0.34 12.31±0.84 22.46±1.07
NGC3521 02 < 3.75 36.80±1.52 < 2.08 5.62±0.79 7.87±0.72 < 0.62 1.47±0.26 16.16±1.14 38.58±0.99
NGC3521 03 < 2.41 5.71±0.77 < 1.21 3.32±0.80 3.33±0.30 < 0.98 < 0.43 4.55±0.65 2.92±0.46
NGC3627 00 < 3.03 90.75±1.54 < 2.11 8.87±0.97 40.73±1.25 < 2.02 1.46±0.49 49.50±1.40 56.31±0.89
NGC3627 01 < 3.64 249.90±4.84 < 1.77 15.38±0.86 89.02±1.14 < 2.88 6.06±0.38 133.24±2.00 183.37±2.74
NGC3627 02 < 1.96 18.44±0.94 < 1.23 2.76±0.52 4.69±1.01 0.61±0.22 0.85±0.16 8.88±0.54 22.46±0.81
NGC3938 00 < 2.50 6.34±1.29 < 1.48 < 1.22 3.32±0.68 < 0.62 0.42±0.07 3.83±0.58 6.34±0.44
NGC3938 01 3.59±0.83 3.68±0.88 < 1.67 7.37±0.36 5.10±1.25 < 0.60 < 0.47 4.90±0.67 4.04±0.62
NGC3938 02 1.93±0.66 2.68±0.76 < 1.31 4.31±0.41 4.82±0.72 < 0.48 < 0.44 4.84±0.55 3.25±0.51
NGC4254 00 < 2.73 21.24±1.07 < 1.35 4.81±0.84 8.94±1.46 < 0.76 < 0.92 8.89±0.69 16.10±0.65
NGC4254 01 < 2.42 7.52±0.79 < 1.39 1.82±0.58 4.29±1.08 < 0.71 < 0.65 3.60±0.60 6.70±0.88
NGC4321 00 < 2.39 7.79±0.64 < 1.36 1.40±0.48 2.29±0.79 < 0.60 < 0.73 4.49±0.58 8.61±0.80
NGC4321 01 < 2.22 14.29±1.00 < 1.54 3.61±0.74 8.74±0.85 < 0.68 < 0.89 10.74±0.81 11.14±0.69
NGC4321 02 < 2.42 11.09±0.85 < 1.34 2.78±0.54 4.49±0.94 < 0.85 0.58±0.14 5.27±0.97 9.79±0.88
NGC4631 00 2.60±1.17 8.11±0.75 < 1.48 10.88±1.52 6.29±1.16 0.96±0.36 0.86±0.22 8.45±0.65 10.28±0.68
NGC4631 01 14.11±1.64 213.84±3.97 < 2.21 68.95±1.14 118.14±1.39 3.49±1.13 7.97±0.88 173.60±1.85 199.30±2.52
NGC4631 02 2.13±1.09 11.75±1.40 < 1.56 9.38±1.10 9.97±1.04 0.41±0.11 0.61±0.09 13.05±0.76 12.75±0.45
NGC4736 00 2.30±0.42 65.99±1.28 < 1.22 11.48±0.47 41.98±0.78 < 1.11 2.75±0.55 55.31±0.89 57.72±0.69
NGC4736 01 < 2.35 62.34±1.73 < 1.04 12.87±0.43 40.26±0.64 < 1.04 2.57±0.46 46.43±0.80 50.36±0.53
NGC4736 02 8.26±0.89 62.71±2.28 < 1.17 17.12±0.57 51.14±0.79 < 1.18 3.52±0.63 61.74±0.66 60.38±0.73
NGC5055 00 < 2.76 20.26±1.31 < 1.48 4.26±0.63 10.24±1.07 < 0.47 0.64±0.04 13.58±0.55 15.38±1.04
NGC5194 00 < 2.44 40.28±0.68 < 1.00 2.70±0.50 12.91±0.69 0.50±0.11 1.21±0.30 22.42±0.84 41.77±0.50
NGC5194 01 < 2.94 92.62±1.11 < 1.11 4.55±0.46 35.72±0.69 < 1.13 1.58±0.42 46.62±0.81 31.48±1.52
NGC5194 02 < 2.36 57.60±0.86 < 1.36 6.83±0.66 20.12±0.91 < 1.11 1.44±0.43 32.82±0.67 31.99±0.54
NGC5194 03 < 1.67 22.50±0.64 < 1.11 3.59±0.54 9.63±0.49 0.99±0.29 1.04±0.14 16.73±0.50 26.72±0.50
NGC5194 04 < 2.23 49.83±1.09 < 0.88 7.38±0.58 23.79±0.51 0.60±0.28 1.44±0.43 36.57±0.43 46.06±0.56
NGC5194 05 < 1.97 27.19±0.81 < 0.75 7.03±0.38 13.06±0.79 < 0.62 < 0.55 17.33±0.40 16.12±0.46
NGC5194 06 < 3.14 46.17±1.41 < 1.46 7.22±0.44 21.83±0.67 < 0.68 < 0.63 27.68±0.87 29.53±0.74
NGC5194 07 < 1.94 60.50±1.33 < 1.70 5.34±0.52 22.41±1.00 1.27±0.09 2.66±0.80 34.24±0.78 47.43±0.93
NGC5194 08 < 2.33 37.99±1.31 < 1.75 3.02±0.33 12.53±0.76 < 0.79 0.75±0.17 18.78±0.67 27.84±0.78
NGC5194 09 < 1.87 34.28±0.93 < 1.07 3.57±0.31 9.37±0.85 0.76±0.10 1.91±0.28 16.92±0.58 35.21±0.64
NGC5194 10 < 2.18 9.97±0.85 < 1.59 2.57±0.73 2.91±0.91 < 0.57 < 0.70 6.18±0.68 10.59±0.76
Tololo89 00 21.03±1.09 10.55±1.05 < 1.58 34.66±0.71 20.20±0.89 2.37±0.40 < 0.82 24.82±0.86 9.23±1.25

–30
–
Table 2—Continued
Target [SIV] [NeII] [NeV] [NeIII] [SIII] [OIV] [FeII] [SIII] [SiII]
10.51µm 12.81µm 14.32µm 15.56µm 18.71µm 25.89µm 25.99µm 33.48µm 34.82µm
34.8 eV 21.6 eV 97.1 eV 41.0 eV 23.3 eV 54.9 eV 7.9 eV 23.3 eV 8.2 eV
NGC5408 00 46.51±1.09 6.10±1.09 < 1.82 46.36±0.91 18.14±1.10 6.75±0.79 < 0.98 19.12±1.04 14.34±0.82
NGC5713 00 < 2.19 13.59±0.74 < 1.52 5.12±0.53 6.40±1.46 < 1.07 0.97±0.20 10.48±0.57 17.05±0.67
NGC5713 01 < 2.51 35.85±0.91 < 1.30 8.28±0.74 18.72±0.94 < 1.39 1.81±0.18 25.40±0.85 30.86±0.82
NGC6822 00 120.59±1.25 26.89±0.71 < 1.22 139.85±0.63 96.95±0.87 < 2.04 < 1.20 90.99±0.84 23.58±0.85
NGC6822 01 27.98±1.10 14.26±0.52 < 1.01 50.07±0.71 42.20±0.67 < 0.60 < 0.92 43.68±0.59 9.87±0.48
NGC6822 02 6.24±0.86 4.41±0.46 < 0.79 13.60±0.45 10.61±0.58 < 0.65 < 0.54 14.55±0.49 4.35±0.48
NGC6822 03 < 1.71 3.62±0.48 < 1.17 4.93±0.56 4.27±0.60 < 0.56 < 0.65 7.84±0.41 6.56±0.61
NGC6822 04 9.52±1.28 4.56±0.71 < 1.08 13.71±0.75 9.53±0.65 < 0.50 < 0.49 11.15±0.38 9.97±0.47
NGC6822 05 < 1.88 4.80±0.66 < 1.29 4.19±0.39 4.94±0.62 < 0.73 < 0.68 5.59±0.53 6.40±0.79
NGC6822 06 < 2.16 2.01±0.79 < 1.25 2.79±0.63 1.85±0.74 < 0.42 < 0.40 2.60±0.40 3.54±0.68
NGC6946 00 5.04±0.90 21.15±0.93 < 1.02 22.33±0.64 17.51±0.47 < 0.52 0.62±0.26 18.39±0.51 17.30±0.55
NGC6946 01 11.24±1.07 36.80±0.49 < 1.19 40.78±0.62 37.58±0.75 0.96±0.17 0.88±0.25 49.47±0.58 30.08±0.54
NGC6946 02 1.91±0.34 23.24±0.53 < 1.11 10.51±0.44 16.46±0.62 < 0.43 0.63±0.09 21.30±0.55 17.38±0.39
NGC6946 03 1.76±0.66 24.72±0.62 < 1.11 10.41±0.46 17.91±0.63 < 0.55 0.47±0.19 21.82±0.43 18.73±0.32
NGC6946 04 < 2.05 11.74±0.57 < 0.85 3.59±0.43 7.87±0.64 < 0.46 < 0.54 11.24±0.40 10.01±0.41
NGC6946 05 < 2.35 107.02±0.87 < 1.59 17.82±0.46 56.75±0.74 < 1.11 3.37±0.83 71.92±0.95 77.77±1.17
NGC6946 06 < 3.12 98.13±1.31 < 1.19 8.06±0.60 46.52±0.76 < 0.95 2.96±0.76 54.94±0.81 67.63±0.78
NGC6946 07 < 2.38 58.28±1.12 < 1.44 6.67±0.70 28.11±0.83 < 0.78 2.01±0.48 36.42±0.78 44.61±0.72
NGC6946 08 < 2.32 57.43±1.06 < 1.18 6.75±0.54 28.10±0.77 < 0.86 1.72±0.67 41.55±0.93 46.46±0.98
NGC7793 00 < 2.32 6.15±0.50 < 0.73 5.37±0.46 4.92±0.66 < 0.54 < 0.65 7.46±0.66 7.67±0.85
NGC7793 01 2.32±0.76 11.43±1.05 < 1.60 4.32±0.51 7.23±0.55 < 0.63 0.48±0.13 10.96±0.60 11.19±0.78
NGC7793 02 < 1.55 3.32±0.47 < 1.30 1.62±0.06 2.23±0.60 < 0.54 < 0.54 2.60±0.64 4.50±0.89
NGC7793 03 < 2.79 11.28±0.82 < 1.17 4.92±0.63 7.54±0.65 < 0.54 1.02±0.27 9.06±0.58 11.97±0.99
Note. — Fluxes and their statistical uncertainties are listed in units of 10−9 W m−2 sr−1. Calibration uncertainties are
an additional ∼25%. The 3σ upper limits are provided for nondetections in several key lines. The nuclear targets are listed
first followed by the extranuclear targets.
Note. — The nuclei for eight SINGS galaxies are not listed in this table. No high resolution infrared spectral data were
taken for the optical centers of Holmberg I, Holmberg II, M 81 Dwarf A, M 81 Dwarf B, IC 2574, DDO 154, NGC 3034

–31
–(M 82), and NGC 6822.
aThe infrared emission peaks outside of the field of view of the nuclear spectral maps. The infrared center was thus
observed as an extranuclear target, and the data from those observations are listed further down the table.
bThe Short-High maps are 45′′×33′′ instead of the standard ∼23′′×15′′.

– 32 –
Fig. 1.— Examples of IRS high resolution mapping footprints overlaid onto an 8 µm image
of NGC 4321. Short-High mapping is shown in blue and Long-High mapping is portrayed in
red. Most Short-High and Long-High SINGS maps are carried out over a 3x5 pointing grid,
though NGC 4321 is one of nine galaxies where an expanded 6x10 grid for Short-High was
carried out on the nucleus to better encompass extended circumnuclear emission.

– 33 –
Fig. 2.— High resolution spectra for the SINGS nuclear and extranuclear targets. The
Short-High data span 10–19 µm, while the Long-High data cover 19–37 µm. Note that the
y-axis scalings differ for the lefthand and righthand columns of spectra.

– 34 –
Fig. 2.— Continued
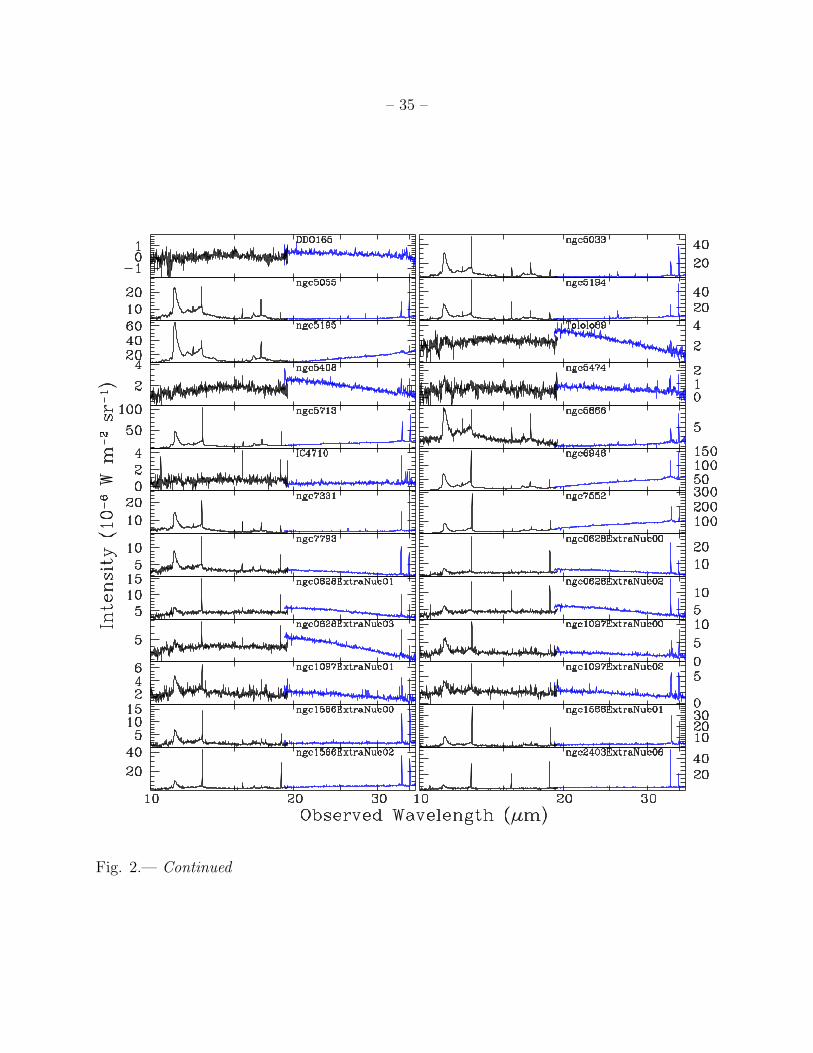
– 35 –
Fig. 2.— Continued

– 36 –
Fig. 2.— Continued

– 37 –
Fig. 2.— Continued

– 38 –
Fig. 2.— Continued

– 39 –
Fig. 3.— Close-up views of several emission features for the nucleus of NGC 5194.

– 40 –
Fig. 4.— The ratio [Ne III]15.56 µm/[Ne II]12.81 µm is displayed as a function of the oxygen
abundance, as derived by Moustakas et al. (2009). The abundances utilize the strong-line
calibration of Kobulnicky & Kewley (2004). The righthand panel excludes the data from
AGN. Each extranuclear target is symbolized as an unfilled (cyan) square, regardless of its
parent nucleus classification. The series of dotted lines are predictions from photoionization
models (Kewley et al. 2001), and in ascending order correspond to ionization parameters of
q = Uc = 2 · 107, 4 · 107, 8 · 107, 1.5 · 108, and 3 · 108 cm s−1 (see § 4.2 for details).

– 41 –
Fig. 5.— The ratio of [O IV] 25.89 µm/[Ne II] 12.81 µm as a function of the 6.2 µm PAH
equivalent width. The lower panel shows only sources with detections for [O IV] 25.89 µm,
[Ne II] 12.81 µm, and the 6.2 µm PAH feature.

– 42 –
Fig. 6.— The ratio [Fe II]25.99 µm/[Ne II]12.81 µm is displayed as a function of the ratio
[Si II]34.82 µm/[S III]33.48 µm.

– 43 –
Fig. 7.— The distribution of nebular electron density as traced by the ratio
[S III]18.71 µm/[S III]33.48 µm using ∼23′′×15′′ apertures.