Electronic structure of early transition metal oxides, Ca1−xSrxVO3 and La1−xCaxVO3: What can we...
8
Electronic structure of early transition metal oxides, Ca 1x Sr x VO 3 and La 1x Ca x VO 3 : What can we learn from photoelectron spectroscopy Kalobaran Maiti a,b , Manju Unnikrishnan a , I.H. Inoue c , D.D. Sarma a, * ,1 a Solid State and Structural Chemistry Unit, Indian Institute of Science, Bangalore 560012, India b Department of Condensed Matter Physics and Materials Science, Tata Institute of Fundamental Research, Homi Bhabha Road, Colaba, Mumbai 400005, India c Correlated Electron Research Center (CERC), AIST Tsukuba Central 4, Tsukuba 305-8562, Japan Abstract Photoemission spectroscopy offers the unique possibility of mapping out the electronic structure of the occupied electron states. However, the extreme surface sensitivity of this technique ensures that only the surface and the near-surface regions of any sample are probed. An important question arises in this context—Is the electronic structure of the surface region the same as that of the bulk? We address this issue using two different series of vanadium oxides, Ca 1x Sr x VO 3 and La 1x Ca x VO 3 . Our results clearly establish that the electronic structure of the surface region is drastically different from that of the bulk in both these cases. We provide a method to separate the two contributions: one arising from the near-surface region and the other representative of the bulk. This separation allows us to deduce some very unusual behaviors of the electronic structures in these systems. Keywords: Electron correlation; Surface and interface states; Photoelectron spectroscopy 1. Introduction The electronic structure of strongly correlated transition metal oxides has attracted a great deal of attention both theoretically [1] and experimentally [2] due to many exotic properties exhibited by these systems such as high temper- ature superconductivity and colossal magnetoresistance. The Hubbard Hamiltonian H= P t ij c ir + c jr +U P n i z n i A pro- vides a simplistic quantitative description of the electron correlation, which displays explicitly the competition between the itinerant behavior of electrons via the hopping amplitude, t and the localization effects due to Coulomb repulsion, U. The bandwidth, W of the system is directly related to t (W~2zt ; z =coordination number). Thus, the effective correlation strength can be expressed as a function of a single parameter, U/W. Experimentally, photoemission spectroscopy has been extensively employed due to its ability to probe the electronic structure directly. While this technique is highly surface sensitive, leading to a substantial contribution from the surface electronic structure, as observed in rare earth intermetallics [3], its extensive use to understand the bulk properties of transition metal (TM) oxides has been based on the implicit assumption of very similar electronic structures at the surface and in the bulk. This is in general a reasonable assumption in many systems, as has often been demonstrated by a good agreement between experimentally obtained photoemission spectra and calculated ones on the basis of the bulk electronic structures [4], most notably for the late (Mn–Ni) transition metal oxides. Interestingly, the early transition metal oxides exhibit a spectacular failure of the assumption of similar surface and bulk electronic structure. Notably, the late transition metal oxides exhibit large covalent mixing of the TM d levels with the ligand p levels. Early TM oxides, however, exhibit a different scenario. Large charge-transfer energy [5], D, defined by the energy required to transfer an * Corresponding author. Tel.: +91 80 2293 2945; fax: +91 80 2360 1310. E-mail address: [email protected] (D.D. Sarma). 1 Also at Jawaharlal Nehru Centre for Advanced Scientific Research, Bangalore, India.
-
Upload
independent -
Category
Documents
-
view
0 -
download
0
Transcript of Electronic structure of early transition metal oxides, Ca1−xSrxVO3 and La1−xCaxVO3: What can we...
Electronic structure of early transition metal oxides, Ca1�xSrxVO3 and
La1�xCaxVO3: What can we learn from photoelectron spectroscopy
Kalobaran Maitia,b, Manju Unnikrishnana, I.H. Inouec, D.D. Sarmaa,*,1
aSolid State and Structural Chemistry Unit, Indian Institute of Science, Bangalore 560012, IndiabDepartment of Condensed Matter Physics and Materials Science, Tata Institute of Fundamental Research, Homi Bhabha Road, Colaba,
Mumbai 400005, IndiacCorrelated Electron Research Center (CERC), AIST Tsukuba Central 4, Tsukuba 305-8562, Japan
Abstract
Photoemission spectroscopy offers the unique possibility of mapping out the electronic structure of the occupied electron states. However,
the extreme surface sensitivity of this technique ensures that only the surface and the near-surface regions of any sample are probed. An
important question arises in this context—Is the electronic structure of the surface region the same as that of the bulk? We address this issue
using two different series of vanadium oxides, Ca1�xSrxVO3 and La1�xCaxVO3. Our results clearly establish that the electronic structure of
the surface region is drastically different from that of the bulk in both these cases. We provide a method to separate the two contributions: one
arising from the near-surface region and the other representative of the bulk. This separation allows us to deduce some very unusual
behaviors of the electronic structures in these systems.
Keywords: Electron correlation; Surface and interface states; Photoelectron spectroscopy
1. Introduction
The electronic structure of strongly correlated transition
metal oxides has attracted a great deal of attention both
theoretically [1] and experimentally [2] due to many exotic
properties exhibited by these systems such as high temper-
ature superconductivity and colossal magnetoresistance.
The Hubbard Hamiltonian H=P
tijcir+cjr+U
PnizniA pro-
vides a simplistic quantitative description of the electron
correlation, which displays explicitly the competition
between the itinerant behavior of electrons via the hopping
amplitude, t and the localization effects due to Coulomb
repulsion, U. The bandwidth, W of the system is directly
related to t (W~2zt; z=coordination number). Thus, the
effective correlation strength can be expressed as a function
* Corresponding author. Tel.: +91 80 2293 2945; fax: +91 80 2360
1310.
E-mail address: [email protected] (D.D. Sarma).1 Also at Jawaharlal Nehru Centre for Advanced Scientific Research,
Bangalore, India.
of a single parameter, U/W. Experimentally, photoemission
spectroscopy has been extensively employed due to its
ability to probe the electronic structure directly. While this
technique is highly surface sensitive, leading to a substantial
contribution from the surface electronic structure, as
observed in rare earth intermetallics [3], its extensive use
to understand the bulk properties of transition metal (TM)
oxides has been based on the implicit assumption of very
similar electronic structures at the surface and in the bulk.
This is in general a reasonable assumption in many systems,
as has often been demonstrated by a good agreement
between experimentally obtained photoemission spectra and
calculated ones on the basis of the bulk electronic structures
[4], most notably for the late (Mn–Ni) transition metal
oxides. Interestingly, the early transition metal oxides
exhibit a spectacular failure of the assumption of similar
surface and bulk electronic structure. Notably, the late
transition metal oxides exhibit large covalent mixing of the
TM d levels with the ligand p levels. Early TM oxides,
however, exhibit a different scenario. Large charge-transfer
energy [5], D, defined by the energy required to transfer an

electron from O p levels to TM d levels, compared to the
hopping strength, t, leads to a substantially reduced overlap
of the ligand levels with the transition metal d levels. This
allows one to investigate the effect of electron correlation as
well as of charge carrier doping in the TM d band with the
ligand levels playing only a minor role. In order to extract
meaningful information from photoemission studies of early
transition metal oxides, it is, however, necessary to separate
the surface and the bulk contribution to the experimentally
obtained spectra.
In this article, we review the detail electronic structure
of a typical early transition metal oxide family,
Ca1�xSrxVO3, as a function of electron interaction
strength, followed by a discussion on another system,
La1�xCaxVO3, with changing carrier concentration. In
Ca1�xSrxVO3, Ca and Sr are homovalent (2+). The V–
O–V bond angle is 1608 in CaVO3 and 1808 in SrVO3 [3].
Thus, the change in composition, x in Ca1�xSrxVO3 leads
to a change in U/W without any change in charge carrier
concentration. This is the simplest strongly correlated
transition metal oxide system, since it remains para-
magnetic down to the lowest temperature measured so
far (T=50 mK), exhibit typical Fermi-liquid behavior and
has nominally just one conduction electron per site of V4+.
On the other hand, the substitution of Ca2+ in place of
La3+ in La1�xCaxVO3 dopes holes in the valence band
without any significant change in V–O–V bond angle [7–
10]. Thus, these compounds are well suited for the
experimental realization of a continuous tuning of U/W
and doping, respectively and consequently, provide good
testing ground for the predictions of the Hubbard model.
Binding energy (eV)
Inte
nsity
(ar
b. u
nits
)
518 516 514 512
0.0
0.2
0.7
x = 1.01
23
hv = 1486.6 eV
Ca1-xSrxVO3
Fig. 1. V 2p3/2 spectra at Al Ka photon energy for different values of x in
Ca1�xSrxVO3.
2. Experimental details
Single crystalline samples of Ca1�xSrxVO3 were pre-
pared by floating zone method and characterized by X-ray
diffraction, Laue photography and thermogravimetric anal-
ysis. Polycrystalline samples of La1�xCaxVO3 were pre-
pared from congruently molten states which gives rise to
large grains with strong inter grain bonding and b1% of the
impurity phases at the grain boundaries. The character-
izations exhibit the samples to be stoichiometric, homoge-
neous and single phasic [6,7]. Experiments were carried out
using monochromatic sources at a base pressure of 2�10�10
mbar with a resolution of 0.45 eV for X-ray photoemission
(XP), and 14 meVand 22 meV with He i and He ii photons,
respectively. Experiments at soft-X-ray energies were
carried out using synchrotron radiation from the VUV
beamline (Elettra, Trieste). The cleanliness of each sample
surface was maintained by repeated in-situ scrapings with an
alumina file or cleaving, thereby exposing fresh sample
surfaces, and was monitored by O 1s and C 1s spectra in
case of the XPS study, as well as by analyzing the spectra in
the 9–12-eV binding-energy region in the UPS study. No
chemical-impurity feature was observed for any of the
compositions studied. Reproducibility of the spectra with
repeated cleaning processes was confirmed for each
composition.
3. Results and discussion
In Fig. 1, the V 2p3/2 core level spectra of Ca1�xSrxVO3
exhibit three distinct features as marked in the figure for
every composition in contrast to the single peak structure,
expected from a homogeneous single-phase V4+ compound.
Least-squared error analysis showed that the positions of the
components, as well as the corresponding full widths at half
maximum (FWHM) remain essentially the same across the
series. Most significantly, the intensity ratio between the
first and the last components are always approximately in
the ratio of 1:1. The energy separations and the spectral
widths of these three components agree with the V 2p3/2signals from V2O3, VO2 and V2O5, suggesting that the
peaks 1, 2 and 3 arise from V3+, V4+ and V5+ entities. The
equal intensities of the V3+ and V5+ signals suggest that a
fraction of V4+ ions spontaneously phase separate,
2V4+YV3++V5+, maintaining the charge balance. Since
the escape depth of the photoelectrons strongly depends on
their kinetic energies, one can tune the surface sensitivity of
the technique by changing the photon energies. We, thus,
investigate V 2p3/2 feature as a function of the photon
energy in Fig. 2. Interestingly, the relative intensity of V4+
signal reduces monotonically with the decrease in photon
energy. This observation establishes that the charge dis-

Binding energy (eV)
Inte
nsity
(ar
b. u
nits
)
518 516 514 512
799.6
1256.6
1486.6
Ca0.3Sr0.7VO3
Binding energy (eV)518 516 514 512
611.5
800.0
1256.6
1486.6
597.8
CaVO3
CaVO3/SrVO3
Ca0.3Sr0.7VO3
Polynomial fit
(E) 0.5
25
20
15
10
5
5 10 15 20 25 30 35
(Kinetic energy)1/2 (eV)1/2
TPP2M
λ (A
ngst
rom
)
(a) (b)
(c)
Fig. 2. V 2p3/2 spectra of (a) CaVO3 and (b) Ca0.3Sr0.7VO3 at different photon energies. All the other compositions exhibit similar trend. (c) Estimated k values
are plotted as a function of the square root of electron kinetic energy. Estimated k values using TPP2M formula are also shown by solid lines. The dashed line
shows the E0.5-behavior at high energies and thin solid line is the polynomial fit at low energies.
proportionation of V4+ to V3+ and V5+ occurs at the sample
surface, while the bulk remains primarily in V4+ state.
The observed differences in the electronic structure of
surface and bulk in these materials may be attributed to a
change in the crystal-field symmetry at the surface and a
difference in the electron correlation strength as described
below. The VO6 octahedra in SrVO3 and CaVO3 are
nearly regular and this octahedral crystal field splits the d
band into a triply degenerate t2g band and a doubly
degenerate eg band. The up- and down-spin t2g bands are
split by a large exchange splitting, Ji1 eV. Therefore, one
electron in the d band occupies the t2g band. The surface,
however, may exhibit a different symmetry. If the surface
layer consists of a V–O layer, one apical oxygen of the
VO6 octahedra will be missing. Alternatively, if Sr/Ca–O
layer is the terminating layer, ensuring an octahedral
arrangement of oxygen around the V ions, a strong
distortion is expected due to the absence of any further
atomic layers. Both scenarios will lead to a significant
deviation in the crystal-field symmetry from the octahedral
(Oh) field towards a D4h symmetry. Thus, the degeneracy
of the t2g band will be lifted to a doubly degenerate egband consisting of dxz and dyz orbitals, and the dxy band
(b2g symmetry). In addition, the absence of periodicity
along the surface normal will lead to a narrowing of the egband. Significant narrowing for the dxz and dyz bands has
indeed been observed by Liebsch [11], while the dxy band
exhibits similar band dispersion as that in the bulk. Such a
band narrowing leads to an enhancement of the effective
electron interaction strength. A larger U/W is known to
induce phase separation, as also observed in other systems
[12]. A phase separation of the type 2d1Yd0+d2 is an
interesting possibility, since both the configurations, d0 and
d2, are closed-shell configurations, representing particu-
larly stable states.
The spectral intensity, q(e) can be expressed as,
q(e)=(1�e�d /k)qs(e)+e�d /kqb(e) where qs(e) and qb(e)denote the surface and bulk responses, d is the thickness
of the surface layer and k is the escape depth of photo-
electrons. Assuming that the cross-sections for V 2p3/2photoionization from the atoms at the surface and in the
bulk are identical, one can estimate d/k experimentally from
the extracted surface and bulk contributions shown in Figs.
1 and 2 using the relation surface/bulk=ed /k�1. The
estimated k values are plotted in Fig. 2(c). While these kvalues exhibit a trend similar to those observed in the
universal curve, they are significantly different from the
values obtained using Tanuma–Powel–Penn relations
(TPP2M) [13].
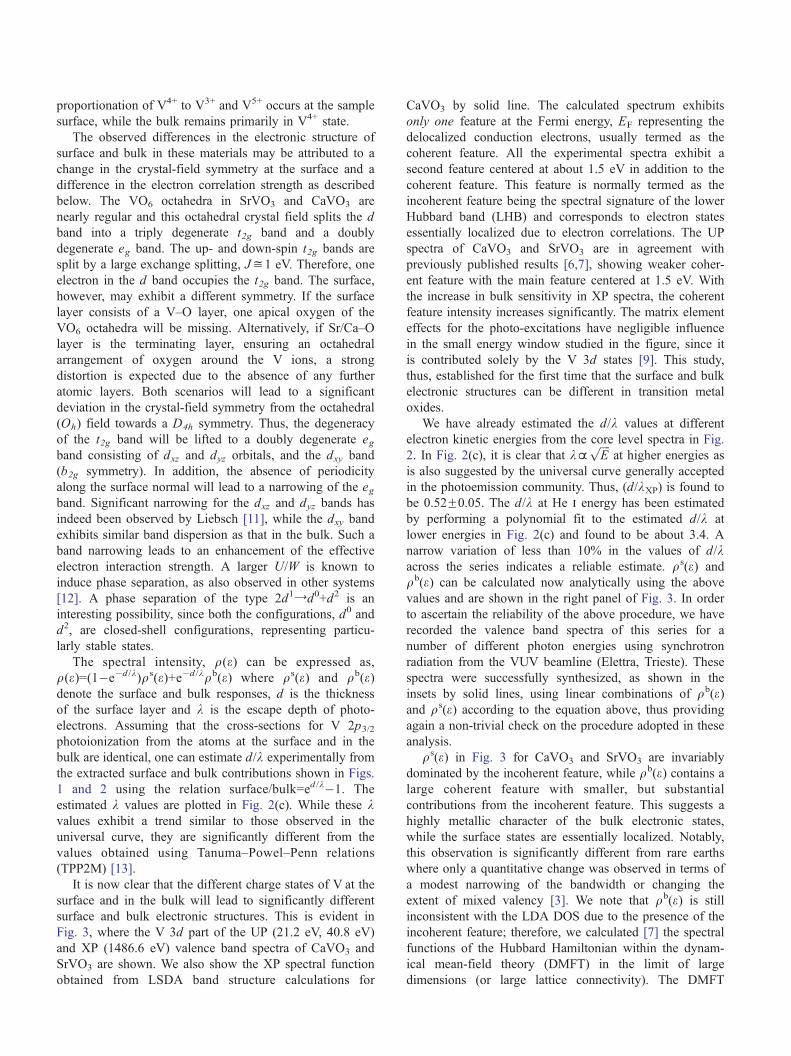
It is now clear that the different charge states of V at the
surface and in the bulk will lead to significantly different
surface and bulk electronic structures. This is evident in
Fig. 3, where the V 3d part of the UP (21.2 eV, 40.8 eV)
and XP (1486.6 eV) valence band spectra of CaVO3 and
SrVO3 are shown. We also show the XP spectral function
obtained from LSDA band structure calculations for
CaVO3 by solid line. The calculated spectrum exhibits
only one feature at the Fermi energy, EF representing the
delocalized conduction electrons, usually termed as the
coherent feature. All the experimental spectra exhibit a
second feature centered at about 1.5 eV in addition to the
coherent feature. This feature is normally termed as the
incoherent feature being the spectral signature of the lower
Hubbard band (LHB) and corresponds to electron states
essentially localized due to electron correlations. The UP
spectra of CaVO3 and SrVO3 are in agreement with
previously published results [6,7], showing weaker coher-
ent feature with the main feature centered at 1.5 eV. With
the increase in bulk sensitivity in XP spectra, the coherent
feature intensity increases significantly. The matrix element
effects for the photo-excitations have negligible influence
in the small energy window studied in the figure, since it
is contributed solely by the V 3d states [9]. This study,
thus, established for the first time that the surface and bulk
electronic structures can be different in transition metal
oxides.
We have already estimated the d/k values at different
electron kinetic energies from the core level spectra in Fig.
2. In Fig. 2(c), it is clear that k~ffiffiffiffiE
pat higher energies as
is also suggested by the universal curve generally accepted
in the photoemission community. Thus, (d/kXP) is found to
be 0.52F0.05. The d/k at He i energy has been estimated
by performing a polynomial fit to the estimated d/k at
lower energies in Fig. 2(c) and found to be about 3.4. A
narrow variation of less than 10% in the values of d/kacross the series indicates a reliable estimate. qs(e) and
qb(e) can be calculated now analytically using the above
values and are shown in the right panel of Fig. 3. In order
to ascertain the reliability of the above procedure, we have
recorded the valence band spectra of this series for a
number of different photon energies using synchrotron
radiation from the VUV beamline (Elettra, Trieste). These
spectra were successfully synthesized, as shown in the
insets by solid lines, using linear combinations of qb(e)and qs(e) according to the equation above, thus providing
again a non-trivial check on the procedure adopted in these
analysis.
qs(e) in Fig. 3 for CaVO3 and SrVO3 are invariably
dominated by the incoherent feature, while qb(e) contains alarge coherent feature with smaller, but substantial
contributions from the incoherent feature. This suggests a
highly metallic character of the bulk electronic states,
while the surface states are essentially localized. Notably,
this observation is significantly different from rare earths
where only a quantitative change was observed in terms of
a modest narrowing of the bandwidth or changing the
extent of mixed valency [3]. We note that qb(e) is still
inconsistent with the LDA DOS due to the presence of the
incoherent feature; therefore, we calculated [7] the spectral
functions of the Hubbard Hamiltonian within the dynam-
ical mean-field theory (DMFT) in the limit of large
dimensions (or large lattice connectivity). The DMFT
Binding energy (eV)
Inte
nsity
(ar
b. u
nits
)
Binding energy (eV)3 2 1 0 3 2 1
143.8 eV
219.6 eV
0
3 2 1 0
1486.6 eV40.8 eV21.2 eV
SrVO3: valence band II
CaVO3: valence band
1486.6 eV40.8 eV21.2 eV
143.8 eV
219.6 eV
3 2 1 0
I
b( ) (expt.)b( ) (caln.)s( ) (expt.)s( ) (caln.)
ρρρρ
εεεε
b( ) (expt.)b( ) (caln.)s( ) (expt.)s( ) (caln.)
ρρρρ
εεεε
LSDA
Fig. 3. Valence band spectra of CaVO3 and SrVO3.
equations are solved using Iterative Perturbation Theory
(IPT) on a Bethe lattice. The theoretical results depend
only on one parameter, U/W. These results are then
multiplied by the Fermi–Dirac function at T=120 K and
convoluted with a Gaussian (FWHM=0.45 eV) to account
for the experimental resolution. The calculated qb(e) (solidlines in Fig. 3) provide a remarkably good representation
of the experimental results for W=2.4 eV (CaVO3) and 3.2
eV (SrVO3), and U=2 eV. The same parameter values
yield for the specific heat coefficient, which is a much
lower energy probe than PES, the values c=3.7 and 5.5 mJ
K�2 mol�1 for SrVO3 and CaVO3. These are in good
agreement with the corresponding experimental values of
6.4 and 7.3 mJ K�2 mol�1. We therefore obtain for the
first time a unified understanding of the physics at two
vastly different energy-scales in this strongly correlated
system based on the Hubbard model.
Since, V5+ ions have 3d0 electronic configuration, qs(e)derives entirely from V3+. Interestingly, qs(e) of CaVO3 in
Fig. 2 has virtually no intensity at EF suggesting an
insulating state, while that of SrVO3 has a finite intensity
at EF signifying a metal. Such a change can possibly be
attributed to a more distorted crystal structure of CaVO3
compared to that in SrVO3. We have simulated qs(e) in each
case within the same DMFT formalism (dashed lines). The
U/W required to simulate these qs(e) are 1.5 and 2 for
SrVO3 and CaVO3, respectively. Thus, there is evidently a
strong enhancement of U/W at the surface compared to
U/W=0.63 and 0.83 for the bulk systems. This marked
enhancement may be due to the reduced atomic coordina-

Binding energy (eV)
Inte
nsity
(ar
b. u
nits
)
3 2 1 EF
0.4
0.3
0.2
La1-xCaxVO3(a)
He spectra
He
He
XPSLa0.6Ca0.4VO3
La0.5Ca0.5VO3
(b)
0.1
0.0
0.5
x3
Fig. 4. (a) Valence band spectra of La1�xCaxVO3 showing insulator to
metal transition. (b) Surface sensitivity dependence by changing photon
energies exhibit signature of different surface and bulk electronic structure.
Binding energy (eV)
Inte
nsity
(ar
b. u
nits
)
3 2 1 EF
La0.7Ca0.3VO3(a)
La0.6Ca0.4VO3
La0.5Ca0.5VO3
(b)
(c)
bulksurfacex = 0simulated
Fig. 5. Surface and bulk electronic structure of (a) La0.7Ca0.3VO3, (b)
La0.6Ca0.4VO3, and (c) La0.5Ca0.5VO3. Solid line represents the LaVO3
spectra and stars show the simulated bulk spectra.
tion at the surface and/or surface reconstruction, which
would give rise to a decrease in W and an increase in U
compared to the bulk.
We now focus on the systematic evolution of doped
Mott–Hubbard systems and critically evaluate whether these
experimental results can also be understood within the
existing paradigms of electronic structure theories. We show
the He i spectra for all the compounds near the V 3d
emission region in Fig. 4(a). Each spectrum is dominated by
the incoherent feature centered at 1.5 eV with no intensity at
EF for x=0.0 and 0.1. The intensity of the coherent peak
increases gradually with increasing x (xz0.2) suggesting a
metal–insulator transition at x=0.2 in agreement with the
transport properties. However, the complete dominance of
the incoherent feature suggests again an overwhelming
presence of correlation effects nearly localizing charge
carriers even in the x=0.5 sample in contrast to the observed
physical properties. The photon energy variation in Fig. 4(b)
indicates again a qualitatively different electronic structure
at the surface and in the bulk as observed in CaVO3.
We have extracted qb(e) and qs(e) in the same way as
described before and plotted in Fig. 5. Open circles
represent qs(e) with the spectra exhibiting a single feature
around 1.5-eV binding energy. No intensity is observed at
EF, suggesting an insulating character for the surface layer
on both samples. It turns out that the surface spectral shape
closely resembles the bulk electronic structure of LaVO3,
which is an antiferromagnetic insulator. For comparison, we
plot the resolution-broadened He i spectrum of LaVO3
(solid curve) shifted by about 0.1 eV to higher binding
energies to match the peak position. The similarity in the
spectral functions of LaVO3 and the extracted surface
spectra of La1�xCaxVO3 compounds is remarkable, which
further establishes the insulating nature of the surface layers
in the latter two materials.
Such an observation may not be unreasonable considering
the previously mentioned possibility that two electrons in the
surface electronic states of the parent compound, LaVO3,
form a completely filled eg up-spin band; this is a stable
electronic ground state. Thus, Ca substitution would tend to
lead to an admixture of d0 and d2 electronic configurations
rather than to a homogeneously occupied fractional valence
configuration. Both the configurations d0 and d2 are closed-
shell configurations, corresponding to band-insulating
phases and therefore represent particularly stable ground
states as compared to that of the d1 electronic state. Such
charge disproportionations (2d1Yd0+d2) at the surface have
indeed been observed in other d1 systems, like CaVO3 and
SrVO3 [7]. Thus, the observation of the insulating surface

Binding energy (meV)
Inte
nsity
(ar
b. u
nits
)
150 100 50 EF
(a) He
La0.6Ca0.4VO3
(b) He
7 K78 K
Inte
nsity
(ar
b. u
nits
)
7 K
78 K
7 K
Binding energy (eV)3 2 1 EF
EF
EF-4
EF+4
EF100 50
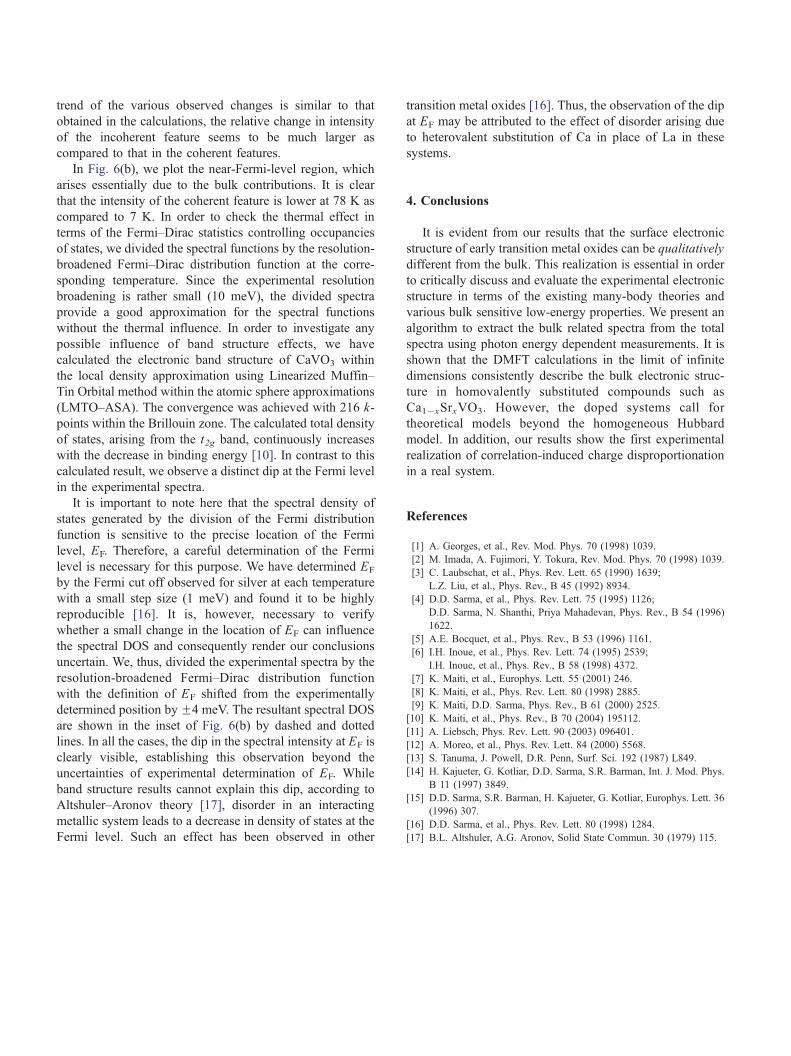
Fig. 6. (a) He II spectra of La0.6Ca0.4VO3 at 78 K and 7 K. (b) Spectra
shown on an expanded scale close to EF. Solid and open circles represent
the 7 K and 78 K spectra, respectively. The spectral functions obtained by
dividing the spectra by the resolution-broadened Fermi–Dirac distribution
function and smoothing are shown by the solid (7 K) and the dashed curves
(78 K), respectively. The inset shows the spectral DOS at 7 K obtained by
dividing the Fermi distribution functions with EF estimated from Ag-Fermi
edge (solid line) and EF shifted byF4 meV (dashed and dotted lines).
electronic structure can be attributed to a phase separation in
the doped compositions, with the tendency towards such a
phase separation being enhanced in the surface layer due to
the different crystal-field symmetry and enhanced electron
correlation as compared to the bulk.
Bulk spectra in Fig. 5 exhibit a systematic increase at EF
with increasing Ca, consistent with increasing conductivity
in the series. However, the V 3d emission is still dominated
by the incoherent feature in all the compositions suggesting
a strong influence of electron correlation. The doping-
dependent spectral function has been calculated within the
single band Hubbard model both by DMFT and exact
diagonalization techniques. These results indeed suggest the
presence of the incoherent and coherent features in the
spectra. However, any reasonable value of U/W with finite
doping shows a much weaker contribution of the incoherent
feature as compared to our experimental results. This
weakened effect of correlation in the presence of large
doping within a single band Hubbard model is under-
standable, since such doping reduces the average number of
electrons per site considerably from 1.0. In the present case,
there are 1.5 electrons per V site even for the highest doped
case (La0.5Ca0.5VO3). An extension of the calculations to
include the multiband nature of the system within the
Hubbard model does not improve the agreement between
experiment and theory [8]. It is thus clear that present
theoretical results based on the homogeneous Hubbard
model to incorporate the strong electron correlations are not
adequate for describing the spectral functions in these doped
systems. It has been observed that calculations including the
inhomogeneities intrinsic to such heterogeneous systems are
more successful in describing the spectral functions of such
systems [14,15]. In these cases, the local electronic
structures of heterogeneous systems will retain their
characteristic features due to the effects of disorder. A
direct check would be to see if the spectral functions
corresponding to the end members generate the spectral
function observed for the intermediate compositions.
We add the bulk spectra of LaVO3 and CaVO3
according to the compositions of the two materials:
I(e)=t2(1�x)qLaVO3
b (e)+xqCaVO3
b (e)b, where x denotes the
extent of doping. The results are shown by stars in Fig. 5.
While there is a mismatch in relative intensities of the
coherent and incoherent features, the presence of large
intensities from the incoherent features is clearly visible in
the simulated spectra in agreement with the extracted bulk
spectra shown for these materials. This finding is quite
significant considering the crudeness of this simulation. It
suggests that the remnants of the electronic structures of
LaVO3 and CaVO3 are somewhat retained in the compounds
with intermediate compositions, as suggested by previous
theoretical results [15]. Thus, the correct description of the
electronic structure in this system needs a proper theoretical
model, which would provide a rigorous basis for under-
standing the physical properties of these heterogeneous
systems.
We now investigate the temperature dependence of the
spectral function close to EF in these highly correlated
metallic systems using high energy resolution. The He ii
spectra of La0.6Ca0.4VO3 collected at 78 K and 7 K are
shown in Fig. 6. The spectra shown were normalized to the
same integrated intensity. The incoherent feature represent-
ing the contributions from both the surface and bulk
electronic structures exhibits significant modifications in
lineshape, while the energy range (3 eV to 12 eV binding
energies) containing essentially O 2p spectral contributions
(not shown here) remains almost unchanged with temper-
ature. This suggests that the changes observed in the V 3d
spectral region in Fig. 6 are intrinsic and cannot be
attributed to the effect of impurities. Temperature-dependent
changes in the spectral lineshape have indeed been found in
various calculations using a dynamical mean-field approach
(DMFT) in the limit of infinite dimensions [1]. While the
trend of the various observed changes is similar to that
obtained in the calculations, the relative change in intensity
of the incoherent feature seems to be much larger as
compared to that in the coherent features.
In Fig. 6(b), we plot the near-Fermi-level region, which
arises essentially due to the bulk contributions. It is clear
that the intensity of the coherent feature is lower at 78 K as
compared to 7 K. In order to check the thermal effect in
terms of the Fermi–Dirac statistics controlling occupancies
of states, we divided the spectral functions by the resolution-
broadened Fermi–Dirac distribution function at the corre-
sponding temperature. Since the experimental resolution
broadening is rather small (10 meV), the divided spectra
provide a good approximation for the spectral functions
without the thermal influence. In order to investigate any
possible influence of band structure effects, we have
calculated the electronic band structure of CaVO3 within
the local density approximation using Linearized Muffin–
Tin Orbital method within the atomic sphere approximations
(LMTO–ASA). The convergence was achieved with 216 k-
points within the Brillouin zone. The calculated total density
of states, arising from the t2g band, continuously increases
with the decrease in binding energy [10]. In contrast to this
calculated result, we observe a distinct dip at the Fermi level
in the experimental spectra.
It is important to note here that the spectral density of
states generated by the division of the Fermi distribution
function is sensitive to the precise location of the Fermi
level, EF. Therefore, a careful determination of the Fermi
level is necessary for this purpose. We have determined EF
by the Fermi cut off observed for silver at each temperature
with a small step size (1 meV) and found it to be highly
reproducible [16]. It is, however, necessary to verify
whether a small change in the location of EF can influence
the spectral DOS and consequently render our conclusions
uncertain. We, thus, divided the experimental spectra by the
resolution-broadened Fermi–Dirac distribution function
with the definition of EF shifted from the experimentally
determined position byF4 meV. The resultant spectral DOS
are shown in the inset of Fig. 6(b) by dashed and dotted
lines. In all the cases, the dip in the spectral intensity at EF is
clearly visible, establishing this observation beyond the
uncertainties of experimental determination of EF. While
band structure results cannot explain this dip, according to
Altshuler–Aronov theory [17], disorder in an interacting
metallic system leads to a decrease in density of states at the
Fermi level. Such an effect has been observed in other
transition metal oxides [16]. Thus, the observation of the dip
at EF may be attributed to the effect of disorder arising due
to heterovalent substitution of Ca in place of La in these
systems.
4. Conclusions
It is evident from our results that the surface electronic
structure of early transition metal oxides can be qualitatively
different from the bulk. This realization is essential in order
to critically discuss and evaluate the experimental electronic
structure in terms of the existing many-body theories and
various bulk sensitive low-energy properties. We present an
algorithm to extract the bulk related spectra from the total
spectra using photon energy dependent measurements. It is
shown that the DMFT calculations in the limit of infinite
dimensions consistently describe the bulk electronic struc-
ture in homovalently substituted compounds such as
Ca1�xSrxVO3. However, the doped systems call for
theoretical models beyond the homogeneous Hubbard
model. In addition, our results show the first experimental
realization of correlation-induced charge disproportionation
in a real system.
References
[1] A. Georges, et al., Rev. Mod. Phys. 70 (1998) 1039.
[2] M. Imada, A. Fujimori, Y. Tokura, Rev. Mod. Phys. 70 (1998) 1039.
[3] C. Laubschat, et al., Phys. Rev. Lett. 65 (1990) 1639;
L.Z. Liu, et al., Phys. Rev., B 45 (1992) 8934.
[4] D.D. Sarma, et al., Phys. Rev. Lett. 75 (1995) 1126;
D.D. Sarma, N. Shanthi, Priya Mahadevan, Phys. Rev., B 54 (1996)
1622.
[5] A.E. Bocquet, et al., Phys. Rev., B 53 (1996) 1161.
[6] I.H. Inoue, et al., Phys. Rev. Lett. 74 (1995) 2539;
I.H. Inoue, et al., Phys. Rev., B 58 (1998) 4372.
[7] K. Maiti, et al., Europhys. Lett. 55 (2001) 246.
[8] K. Maiti, et al., Phys. Rev. Lett. 80 (1998) 2885.
[9] K. Maiti, D.D. Sarma, Phys. Rev., B 61 (2000) 2525.
[10] K. Maiti, et al., Phys. Rev., B 70 (2004) 195112.
[11] A. Liebsch, Phys. Rev. Lett. 90 (2003) 096401.
[12] A. Moreo, et al., Phys. Rev. Lett. 84 (2000) 5568.
[13] S. Tanuma, J. Powell, D.R. Penn, Surf. Sci. 192 (1987) L849.
[14] H. Kajueter, G. Kotliar, D.D. Sarma, S.R. Barman, Int. J. Mod. Phys.
B 11 (1997) 3849.
[15] D.D. Sarma, S.R. Barman, H. Kajueter, G. Kotliar, Europhys. Lett. 36
(1996) 307.
[16] D.D. Sarma, et al., Phys. Rev. Lett. 80 (1998) 1284.
[17] B.L. Altshuler, A.G. Aronov, Solid State Commun. 30 (1979) 115.