X-ray photoelectron spectroscopy analysis of thermal and plasma-treated steel substrates and their...
11
X-ray photoelectron spectroscopy analysis of tribostressed samples in the presence of ZnDTP: a combinatorial approach Michael Eglin a, , Antonella Rossi a,b and Nicholas D. Spencer a a Laboratory for Surface Science and Technology, Department of Materials, Swiss Federal Institute of Technology, ETH Zu ¨rich, CH-8092 Zu ¨rich, Switzerland b Department of Inorganic and Analytical Chemistry, University of Cagliari, INSTM, Cagliari, Italy Received 15 December 2002; accepted 12 April 2003 The influence of load on the chemistry of tribofilms formed on a steel surface in solution of pure di-isopropyl zinc dithiophosphate (i-ZnDTP) in n-decane has been investigated by means of a combinatorial tribological experiment involving X-ray photoelectron spectroscopy. The experiment consisted of the preparation of a set of spatially separated areas, produced under various tribological test conditions, and the subsequent spectroscopic probing of the chemical composition of the tribofilm. The experiment was carried out at room temperature under boundary-lubrication conditions and revealed a physically adsorbed layer of the additive in the non-contact area and a thin (ca. 5 nm), inhomogeneous phosphate film covering the tribostressed areas. The total amount of phosphate present in the tribostressed area was found to increase with increasing load. In the contact areas, iron oxides and metal sulfides have also been detected. KEY WORDS: boundary lubrication, isopropyl ZnDTP, X-ray photoelectron spectroscopy, combinatorial tribochemistry 1. Introduction In a previous paper [1] we presented tribological results obtained by applying a new combinatorial approach to the study of the interaction of a lubricant additive with tribostressed surfaces. In this paper, the combinatorial approach has been combined with imaging XPS (i-XPS) and small-area XPS (SAXPS) in order to characterize the tribochemistry of an additive interacting with steel surfaces. A model compound, di- isopropyl zinc dithiophosphate (i-ZnDTP), was chosen for investigation, since zinc dialkyl dithiophosphates (ZnDTPs) have been the most prominent antiwear additives in lubricating oils for over forty years [2]. ZnDTP was originally added to lubricating oil as an antioxidant, but it was rapidly discovered that it also functioned as a highly effective antiwear and extreme- pressure (EP) additive, and it is an essential ingredient in the vast majority of current commercial lubricant formulations [3]. Although it is one of the most studied additives, its outstanding properties in antiwear film formation are still not completely understood. An important role of ZnDTP in such lubricants is to act as an antiwear agent by forming a protective film on the rubbing surfaces [4]. Much information has been published on the thickness, structure and chemistry of the films as well as the mechanism of film formation under tribological stress. The ability of ZnDTP to function in different ways depending on the nature and severity of the tribological conditions may be one of the reasons for the often divergent results reported in the literature. Several authors have proposed a layered structure of a few 100 nm thickness, consisting of iron oxides, sulfides and poly (thio) phosphates or alkylphos- phates [3,5–7]. It has also been reported that in the mild- wear regime (0.26 GPa contact pressure, 50 Hz, 15 mm stroke length, 60 8C), the wear-reducing action of ZnDTP is mainly due to the rheological properties of the thermally formed polyphosphate glassy films, whereas under severe conditions (1 GPa contact pres- sure, 0.5 m/s, 100 8C), short-chain mixed iron/zinc phosphate glasses are formed [5]. As far as the film-formation mechanism is concerned, it is generally agreed that the molecule interacts only weakly with the steel surface at room temperature, starting to decompose around 50 8C on iron substrate [8]. It has been suggested that upon reaching 100 8C ZnDTP undergoes a thermally activated rearrangement in solution to form a linkage isomer (LI-ZnDTP) [3,7,9] as a precursor to the formation of a long-chain glassy polyphosphate and poly-thiophosphate film on the surface. Due to the thermally activated formation of the LI-ZnDTP, as well as the thermo-oxidative pro- cesses and wear involved in the film formation, the composition of the generated films changes with temperature [3,6]. Without thermal activation, only very thin films are formed in the tribological contact, whereas at higher temperatures the film thickness increases [10]. Recent work from our laboratory using in situ attenuated total reflection infrared spectroscopy (ATR FT-IR) has allowed changes in the additive To whom correspondence should be addressed. E-mail: michael. [email protected] Tribology Letters, Vol. 15, No. 3, October 2003 (# 2003) 199 1023-8883/03/1000–0199/0 # 2003 Plenum Publishing Corporation
-
Upload
independent -
Category
Documents
-
view
0 -
download
0
Transcript of X-ray photoelectron spectroscopy analysis of thermal and plasma-treated steel substrates and their...

X-ray photoelectron spectroscopy analysis of tribostressed samples in
the presence of ZnDTP: a combinatorial approach
Michael Eglina,�, Antonella Rossia,b and Nicholas D. Spencera
aLaboratory for Surface Science and Technology, Department of Materials, Swiss Federal Institute of Technology, ETH Zurich, CH-8092
Zurich, SwitzerlandbDepartment of Inorganic and Analytical Chemistry, University of Cagliari, INSTM, Cagliari, Italy
Received 15 December 2002; accepted 12 April 2003
The influence of load on the chemistry of tribofilms formed on a steel surface in solution of pure di-isopropyl zinc
dithiophosphate (i-ZnDTP) in n-decane has been investigated by means of a combinatorial tribological experiment involving X-ray
photoelectron spectroscopy. The experiment consisted of the preparation of a set of spatially separated areas, produced under
various tribological test conditions, and the subsequent spectroscopic probing of the chemical composition of the tribofilm. The
experiment was carried out at room temperature under boundary-lubrication conditions and revealed a physically adsorbed layer
of the additive in the non-contact area and a thin (ca. 5 nm), inhomogeneous phosphate film covering the tribostressed areas. The
total amount of phosphate present in the tribostressed area was found to increase with increasing load. In the contact areas, iron
oxides and metal sulfides have also been detected.
KEY WORDS: boundary lubrication, isopropyl ZnDTP, X-ray photoelectron spectroscopy, combinatorial tribochemistry
1. Introduction
In a previous paper [1] we presented tribologicalresults obtained by applying a new combinatorialapproach to the study of the interaction of a lubricantadditive with tribostressed surfaces. In this paper, thecombinatorial approach has been combined withimaging XPS (i-XPS) and small-area XPS (SAXPS) inorder to characterize the tribochemistry of an additiveinteracting with steel surfaces. A model compound, di-isopropyl zinc dithiophosphate (i-ZnDTP), was chosenfor investigation, since zinc dialkyl dithiophosphates(ZnDTPs) have been the most prominent antiwearadditives in lubricating oils for over forty years [2].ZnDTP was originally added to lubricating oil as anantioxidant, but it was rapidly discovered that it alsofunctioned as a highly effective antiwear and extreme-pressure (EP) additive, and it is an essential ingredient inthe vast majority of current commercial lubricantformulations [3]. Although it is one of the most studiedadditives, its outstanding properties in antiwear filmformation are still not completely understood. Animportant role of ZnDTP in such lubricants is to actas an antiwear agent by forming a protective film on therubbing surfaces [4]. Much information has beenpublished on the thickness, structure and chemistry ofthe films as well as the mechanism of film formationunder tribological stress. The ability of ZnDTP tofunction in different ways depending on the nature and
severity of the tribological conditions may be one of thereasons for the often divergent results reported in theliterature. Several authors have proposed a layeredstructure of a few 100 nm thickness, consisting of ironoxides, sulfides and poly (thio) phosphates or alkylphos-phates [3,5–7]. It has also been reported that in the mild-wear regime (0.26GPa contact pressure, 50Hz, 15mmstroke length, 60 8C), the wear-reducing action ofZnDTP is mainly due to the rheological properties ofthe thermally formed polyphosphate glassy films,whereas under severe conditions (1GPa contact pres-sure, 0.5m/s, 100 8C), short-chain mixed iron/zincphosphate glasses are formed [5].
As far as the film-formation mechanism is concerned,it is generally agreed that the molecule interacts onlyweakly with the steel surface at room temperature,starting to decompose around 50 8C on iron substrate[8]. It has been suggested that upon reaching 100 8CZnDTP undergoes a thermally activated rearrangementin solution to form a linkage isomer (LI-ZnDTP) [3,7,9]as a precursor to the formation of a long-chain glassypolyphosphate and poly-thiophosphate film on thesurface. Due to the thermally activated formation ofthe LI-ZnDTP, as well as the thermo-oxidative pro-cesses and wear involved in the film formation, thecomposition of the generated films changes withtemperature [3,6]. Without thermal activation, onlyvery thin films are formed in the tribological contact,whereas at higher temperatures the film thicknessincreases [10]. Recent work from our laboratory usingin situ attenuated total reflection infrared spectroscopy(ATR FT-IR) has allowed changes in the additive
�To whom correspondence should be addressed. E-mail: michael.
Tribology Letters, Vol. 15, No. 3, October 2003 (# 2003) 199
1023-8883/03/1000–0199/0 # 2003 Plenum Publishing Corporation

chemistry due to adsorption, as well as reaction filmgrowth, to be followed as a function of temperature andtime [11,12]. The reported ATR FT-IR spectra confirmthermal decomposition of ZnDTP with the formation ofP–O–P species at 150 8C, while a short-chain phosphatefilm has been detected on the iron surface followingtribotests at the same temperature [13].
The detailed chemistry of these films is still con-troversial: older works based on elemental analysis withSEM-EDX showed that the film contained Zn, S, P, Cand O [14]. XPS [15] and AES [16,17] have also beenused to provide chemical differentiation for the differentelements; P was claimed to be present as a phosphateand S as a sulfide, the corresponding cation being zinc oriron. XANES spectroscopy revealed that the chemicalnature of P and S in the tribofilms was different fromthat of the pure ZnDTP substances and depends on thealkyl group used in ZnDTP [18]. With isopropylZnDTP, phosphorus is found to correspond closely tometaphosphate (polyphosphate with a cyclic structure)whereas with n-butyl ZnDTP pyrophosphates arefound. This is important when discussing the resultsobtained from commercial ZnDTP, which often consistof a blend of ZnDTP molecules containing differentalkyl groups [3].
A detailed analysis of the high-resolution XP spectraallows further information to be obtained. From theoxygen O(1s) signal, not only oxide and phosphate canbe distinguished but, due to the substantial chemicalshifts in the signals of the phosphate group, non-bridging oxygen (NBO: PO�; POH, P=O) at 532:2�0:2 eV and bridging oxygen (BO: P–O–P) at 534:4�0:2 eV can be differentiated [19–22], allowing the chainlength of polyphosphates to be estimated [21,23]. Thephosphorus P(2p) signal has been used to distinguishbetween orthophosphates, metaphosphates and poly-phosphates [21,22]. After thermal decomposition ofZnDTP on an iron surface, zinc polyphosphates couldbe detected, whereas only simple phosphates weredetectable after tribological testing at the same tem-perature [22].
The difficulty in assignment of chemical state basedon binding energies alone should not be underestimated.While the sulfur S(2p) signal provides information aboutthe oxidation state of sulfur, and thus sulfates andsulfide can be readily distinguished, it is much moredifficult to identify the cation from the binding energy ofthe S(2p) peak alone. The chemical state of zinc cannotbe identified from the Zn(2p) signal due to the very smallchemical shifts between zinc signals in ZnO, ZnS or Zn-polyphosphates. However, the Zn(LMM) X-ray excitedAuger signal shows a stronger dependency on thechemical environment [15,24]. It has been shown, forexample, that a two-dimensional chemical-state plot ofzinc can effectively distinguish between zinc sulfide andoxide [25]. This method can also be extended todifferentiate between zinc phosphate or polyphosphate
in the contact and non-contact areas of tribostressedsurfaces [26].
Most of the published surface-analytical studies ofZnDTP have been based on the analysis of several mm2;and thus an average chemical composition has beenobtained, despite the well-known fact that the films atthe micron level are inhomogeneous and ‘‘patchy’’ asrevealed by SEM [27] and AFM [28]. Therefore, imagingspectroscopic methods were used to investigate filmsformed during tribological contact in the presence oflubricant additives. Imaging XPS provides quantitativeelemental and chemical state information with a lateralresolution in the submillimeter range [29–31]. Synchro-tron-based photoemission electron microscopy (PEEM)offers higher lateral resolution (micrometer range) withelemental and chemical state information [32], but it isless quantitative. Scanning Auger Microscopy allowselemental mapping with a lateral resolution in the sub-micrometer range [16,33], but chemical-state-inducedAuger shifts are not easy to interpret, even thoughrecent results suggest that it is possible to distinguishbetween oxygen in oxides and in phosphates [34].
So far, the imaging possibilities of these surface-analytical methods were applied to relatively simplesystems, e.g. traditional pin-on-disk tests [32]. To gain abetter insight into the possible tribochemical reactionsof a given lubricant-additive system depending on theapplied tribological conditions, imaging methods can beused in combination with a combinatorial experiment[1]. A combinatorial sample is produced by system-atically varying the parameters defining the tribologicalstress, spatially separated on a single sample. Imagingspectroscopic methods are then used to analyze thecombinatorial sample and extract spectroscopic infor-mation for the various conditions applied. One of theparameters studied is the load dependence of the filmstructure [6,10,35]. It has been reported that higherloads increase the ZnDTP decomposition rate and leadto long-chain polyphosphates [6]. The film thickness ofthe tribofilm increases to a maximum value withincreasing load and may break down upon furtherincrease [10]. The following describes an investigationinto the load dependence of the chemical composition ofthe tribofilms formed in a 1 wt.% solution of i-ZnDTPin decane. These have been analyzed by means of i-XPSand SAXPS.
2. Experimental
2.1. Sample preparation
Steel disks (AISI 52100) were ground using P120,P600 (in tap water) and P1200, P2500 (in ethanol (p.a.))silicon carbide paper, and polished in ethanol using 3; 1;and 1=4�m diamond paste. The surface roughness (Ra)was measured by interferometric methods and alwaysfound to be less than 10 nm. After polishing, the samples
M. Eglin et al./XPS analysis of i-ZnDTP films and the combinatorial approach200

were kept for three days in a desiccator to allow an oxidefilm to grow and thus to provide a reproducible surfacecomposition. The samples were ultrasonically cleaned inethanol and analyzed for surface contamination by XPSimmediately prior to tribotesting. Commercial 4mmball-bearing balls (AISI 52100) were used as a counter-face. They were ultrasonically cleaned in ethanol beforethe tribotest.
2.2. Tribotest
The steel disk was tribostressed in a ball-on-disk setupwith a CETR UMT-2 tribometer (Center for Tribology,Inc., Campbell, CA, USA). This tribometer allows load,rotational velocity and duration of the tribotest to beprogrammed. The tribometer is equipped with a loadcell with a maximum capacity of 5N and a resolution of�5mN in two axes (normal load and friction force).Normal load is applied from the carriage via a spring.The normal load is constantly monitored and adjustedvia a feedback loop moving the carriage up or down.The spring constant was determined to be 2.7N/mm inthe z-direction and 5.7N/mm in the y-direction (frictionforce). The instrument is capable of recording normalload, friction force, rotational position of the disk andthe y-position of the carriage versus time.
As a lubricant, a 1wt% solution of di-isopropyl zincdithiophosphate (i-ZnDTP) in decane was used. Todissolve the additive in the lubricant, the solution wasstirred at 60 8C for 30 min. The tests were carried out atroom temperature ð24� 0:5 �CÞ. The relative humidityof the air was recorded during each test and wasdetermined to be between 22 and 38%. Decane has aboiling point of 174 8C. This fact hindered investigationsat higher temperatures due to problems with evapora-tion.
Prior to the actual tests, the ball was run in at a loadof 5N with a speed of 31.4mm/min for 2 h outside theregion to be analyzed, in order to create a flat spot onthe ball, defining the apparent contact area in thetribotest that followed.
A full tribotest consisted of the formation of five,individual, concentric test areas, each corresponding toa different load. The relative velocity between the balland the disk surface was kept constant at 31.4mm/minfor all the tribostressed areas, while the load waschanged from 0.05 to 5N between the tested areas.The apparent contact pressure was calculated to be 2.8–280MPa using the applied load and the apparentcontact area defined by the flat spot produced duringthe running in. The number of turns of the ball on thedisk was kept constant for each load, in order to impartcomparable tribostress. The ball was moved radially by25�m after each fifth turn. Thus, for each load, 11overlapping wear tracks formed a tribostressed annuluswith a width of >250�m. This allows XPS analysis to be
performed completely within the tribostressed area.After the tribotest, the samples were cleaned incyclohexane in an ultrasonic bath for 30 s and driedunder an argon stream before being introduced into theanalysis chamber.
2.3. XPS
The XPS analyses were performed on a PHI 5700system with an Omni Focus IV lens system. The residualpressure in the spectrometer during the data acquisitionwas always below 5� 10�7 Pa. The X-ray source wasAl K� (1486.6 eV) run at 350W. The diameter of theanalyzed area was 120�m. The spectrometer wasoperated in the fixed analyzer transmission (FAT)mode with a pass energy of 46.95 eV (full width ofhalf-maximum (FWHM) for Agð3d5=2Þ ¼ 1:1 eVÞ. Theinstrument was calibrated using the spectral lines ofAuð4f7=2Þ and Cuð2p3=2Þ at 83.95 eV and 932.63 eV,respectively [36]. Agð3d5=2Þ and Cu(LMM) peak energiesat 368.22 eV and 567.96 eV respectively, were used toverify the linearity of the binding-energy scale. Theaccuracy was �0:05 eV:
Spectroscopic maps were acquired using the imagingcapabilities of the Omni Focus IV lens system. Theanalyzed spot (diameter 120�m) was electrostaticallyrastered over the sample (typically 64� 64 pixels,2� 2mm). For each pixel a full spectrum of the selectedenergy region was acquired. The acquired images wereprocessed with the PHI Multipak (V6.0) software.Spectra can be extracted from the map by selecting aregion of interest and can be used to reconstruct‘‘chemical-state maps’’ with the linear-least-squares(LLS) routine. The correlation between the extractedspectra and the spectrum at each pixel generates a newmap, which shows regions having similar chemical statesof a given element.
From these maps, areas of interest were determinedand analyzed by SAXPS. For curve fitting, CASA XPSsoftware (V2.0, CASA Software Ltd, UK) was used.The spectra were resolved into their components afteran integrated Shirley background subtraction. Curve-fitting parameters (FWHM and Gaussian/Lorenzianratio) were determined from reference spectra. Thespectra were fitted with Gaussian/Lorenzian peaks,keeping the FWHM and the Gaussian/Lorenzian ratioconstant and fitting the energy of the peaks and theirheights using a LLS algorithm. Quantitative analysiswas performed using the photoionization cross-sectionaccording to Scofield [37] and correcting the intensitiesfor the inelastic mean free path, according to Seah andDench [38], as well as the analyzer transmission function[39]. The accuracy of the measurements was estimated tobe �0:1 for all measurements, unless otherwise stated.The results presented in this paper refer to twoindependent experiments.
M. Eglin et al./XPS analysis of i-ZnDTP films and the combinatorial approach 201

2.4. Auger electron spectroscopy
The Auger mapping was performed on a VGESCALAB 200 using an electron gun, which allows2000 A lateral resolution. The electron beam, of energyof 10 keV (inducing a specimen current of 20 nA), wasrastered to produce 128� 128 pixel maps, which wererecorded on an IBM 486 computer.
The Auger maps were corrected for topographicaleffects using the (peak-background)/background algo-rithm.
2.5. Reference compounds
Reference compounds, FePO4:nH2O, ZnS and ZnO(Aldrich) were pressed into pellets and mounted in astandard PHI sample holder. i-ZnDTP was supplied byProf. J.M. Martin. The samples were cooled with liquidnitrogen during measurements to reduce outgassing ofthe compounds. Reference compounds were analyzed byXPS under the same experimental conditions asreported in section 2.3. The results were confirmed byexperiments performed with aperture #3 (0.4mmdiameter) and pass energy 23.5 eV with higher energyresolution.
3. Results
3.1. Tribological results
The coefficient of friction (COF) measured during thetribological test is presented in figure 1 as a function ofthe applied load. The two bars represent two indepen-dent samples. The reported COFs are the valuesaveraged over the last full turn of the disk at theparticular load. It is assumed that, at this time, a
tribological film that is representative for the particularload is formed and thus the COF is a representativevalue for the applied conditions. The error barsrepresent the experimental error, calculated from theerror propagation of the load-cell resolution. Despitethe large experimental error at low loads, a slightdecrease in COF can be seen for larger loads.
The morphology of the wear tracks and the ball usedfor the tribotest were examined with an opticalmicroscope. The ball shows a circular flat spot with adiameter of 150�m. This spot was produced mainlyduring the running-in of the ball and defines theapparent contact area during the tests with differentloads. In the 5 and 1N regions the wear tracks areclearly visible on the disk, but for smaller loads nodifferences can be recognized between the contact andnon-contact areas.
3.2. XPS imaging
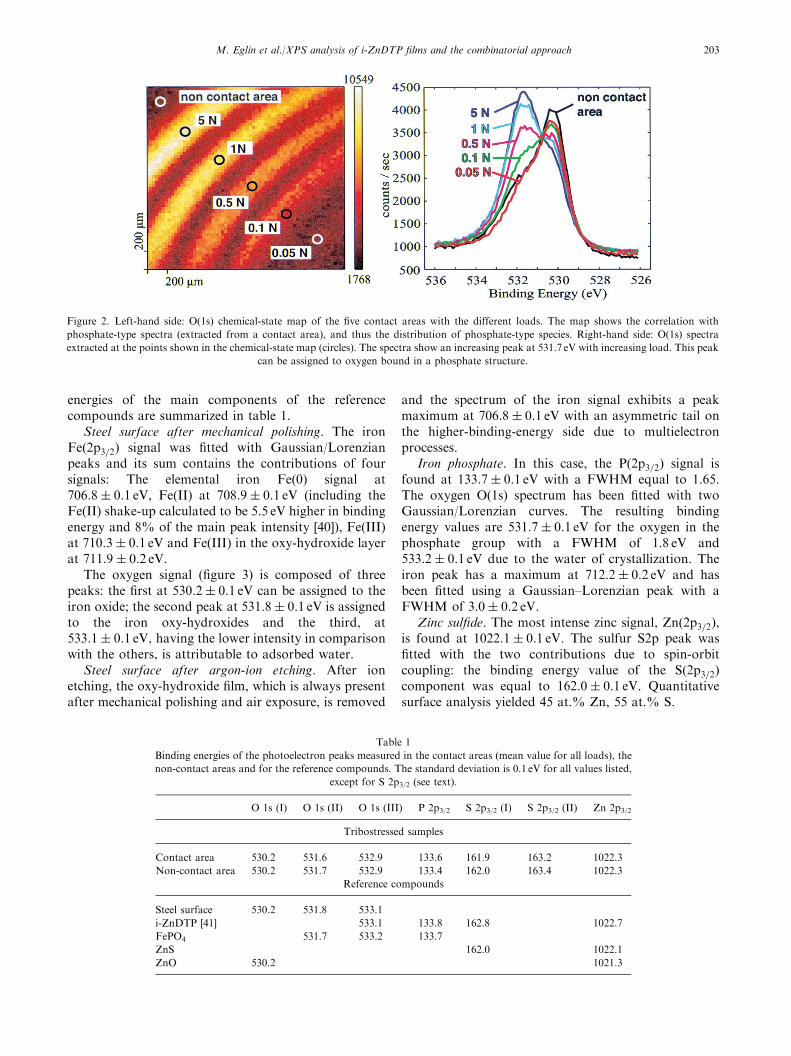
An O(1s) chemical-state map is shown in figure 2.The chemical-state map is calculated using a linear-least-squares routine, fitting the peak shape of an O(1s)spectrum extracted from a contact region to thespectrum in each pixel of the O(1s) map. The spectrumused to calculate the chemical-state map is similar tothat of the 5N load spectrum shown on the right-handside of figure 2, and shows a high correlation in thetribostressed areas, forming arcs of a width of 250�mrunning across the chemical-state map. The tribo-stressed areas are labeled according to their appliedloads.
On the right-hand side of figure 2, spectra extractedfrom different areas of the O(1s) map are shown. Anincrease in the peak intensity can be seen at 531.7 eV asthe applied load increases. In the spectra extracted fromthe non-contact area, a shoulder can be noted at thisbinding-energy value, which is also present in spectrataken on the steel surface prior to tribotesting.
In order to provide more detail on the chemicalspecies present on the surface, SAXPS analysis wasperformed in the areas marked with a circle in the O(1s)map.
3.3. Chemical states of the studied elements
3.3.1. Reference compoundsReference materials, which include the steel surface
after mechanical polishing, steel after argon-ion etching,the compounds iron phosphate, iron sulfide, zinc sulfideand zinc oxide, as well as the i-ZnDTP, were analyzedunder the same analysis conditions used for obtainingthe X-ray photoelectron spectra on the tribostressedsamples, in order to derive the curve-fitting parametersto be used for monitoring the changes in the surfacechemistry of the tribostressed samples. The peak
Figure 1. Coefficient of friction (COF) for various loads. The value
presented is the average of the last full turn during the test at a
particular load. It is assumed that at the end of the test the COF is
representative for the protective film formed under the applied
conditions. The error bars are calculated using error propagation
from the load-cell resolution. The two samples represent two
independent experiments.
M. Eglin et al./XPS analysis of i-ZnDTP films and the combinatorial approach202
energies of the main components of the referencecompounds are summarized in table 1.
Steel surface after mechanical polishing. The ironFeð2p3=2Þ signal was fitted with Gaussian/Lorenzianpeaks and its sum contains the contributions of foursignals: The elemental iron Fe(0) signal at706:8� 0:1 eV, Fe(II) at 708:9� 0:1 eV (including theFe(II) shake-up calculated to be 5.5 eV higher in bindingenergy and 8% of the main peak intensity [40]), Fe(III)at 710:3� 0:1 eV and Fe(III) in the oxy-hydroxide layerat 711:9� 0:2 eV.
The oxygen signal (figure 3) is composed of threepeaks: the first at 530:2� 0:1 eV can be assigned to theiron oxide; the second peak at 531:8� 0:1 eV is assignedto the iron oxy-hydroxides and the third, at533:1� 0:1 eV; having the lower intensity in comparisonwith the others, is attributable to adsorbed water.
Steel surface after argon-ion etching. After ionetching, the oxy-hydroxide film, which is always presentafter mechanical polishing and air exposure, is removed
and the spectrum of the iron signal exhibits a peakmaximum at 706:8� 0:1 eV with an asymmetric tail onthe higher-binding-energy side due to multielectronprocesses.
Iron phosphate. In this case, the Pð2p3=2Þ signal isfound at 133:7� 0:1 eV with a FWHM equal to 1.65.The oxygen O(1s) spectrum has been fitted with twoGaussian/Lorenzian curves. The resulting bindingenergy values are 531:7� 0:1 eV for the oxygen in thephosphate group with a FWHM of 1.8 eV and533:2� 0:1 eV due to the water of crystallization. Theiron peak has a maximum at 712:2� 0:2 eV and hasbeen fitted using a Gaussian–Lorenzian peak with aFWHM of 3:0� 0:2 eV.
Zinc sulfide. The most intense zinc signal, Znð2p3=2Þ,is found at 1022:1� 0:1 eV. The sulfur S2p peak wasfitted with the two contributions due to spin-orbitcoupling: the binding energy value of the Sð2p3=2Þcomponent was equal to 162:0� 0:1 eV. Quantitativesurface analysis yielded 45 at.% Zn, 55 at.% S.
Figure 2. Left-hand side: O(1s) chemical-state map of the five contact areas with the different loads. The map shows the correlation with
phosphate-type spectra (extracted from a contact area), and thus the distribution of phosphate-type species. Right-hand side: O(1s) spectra
extracted at the points shown in the chemical-state map (circles). The spectra show an increasing peak at 531.7 eV with increasing load. This peak
can be assigned to oxygen bound in a phosphate structure.
Table 1
Binding energies of the photoelectron peaks measured in the contact areas (mean value for all loads), the
non-contact areas and for the reference compounds. The standard deviation is 0.1 eV for all values listed,
except for S 2p3/2 (see text).
O 1s (I) O 1s (II) O 1s (III) P 2p3/2 S 2p3/2 (I) S 2p3/2 (II) Zn 2p3/2
Tribostressed samples
Contact area 530.2 531.6 532.9 133.6 161.9 163.2 1022.3
Non-contact area 530.2 531.7 532.9 133.4 162.0 163.4 1022.3
Reference compounds
Steel surface 530.2 531.8 533.1
i-ZnDTP [41] 533.1 133.8 162.8 1022.7
FePO4 531.7 533.2 133.7
ZnS 162.0 1022.1
ZnO 530.2 1021.3
M. Eglin et al./XPS analysis of i-ZnDTP films and the combinatorial approach 203

Zinc oxide. The most intense zinc signal is found at1021:3� 0:1 eV and it exhibits a FWHM of 1:8� 0:1 eV;the oxygen O(1s) signal was measured at 530:2� 0:1 eVand its FWHM is 1:6� 0:1 eV. The quantitative analysiswas checked and resulted in excellent agreement with theexpected ratio of 1 : 1.
i-ZnDTP [41]. The zinc signal, Znð2p3=2Þ, is found at1022:7� 0:1 eV with a FWHM of 1:9� 0:1 eV. Theoxygen signal comprises only one signal, found at533:1� 0:1 eV. Phosphorus and sulfur were also fitted,taking into account the splitting and the branching ratioof the two components. Pð2p3=2Þ is found at 133.8 eV
(FWHM ¼ 1:55 eV) and Sð2p3=2Þ at 162.8 eV(FWHM ¼ 1:7 eV). The atomic concentration wasfound to be 51% C, 15% O, 9% P, 19% S, 5% Znbeing in good agreement with the calculated values(52.1% C, 17.4% O, 8.7% P, 17.4% S, 4.4% Zn).
3.3.2. Surface chemistry after tribological testsHigh-resolution spectra of the O(1s), S(2p), P(2p),
Zn(2p), Zn(3s) and Fe(2p) regions were acquired in thetribostressed areas (see circles in figure 2). For compar-ison, the non-contact area was analyzed as well. The sizeof the analyzed area is 120�m, and thus smaller thanthe width of the contact region. This ensures that onlythe tribostressed area is analyzed and thus the spectro-scopic information is not averaged with spectralcontributions from the non-contact area. In figure 3,the O(1s) peaks for the various loads are displayed. Theycan be curve-fitted using three peaks. For the curvefitting, a Gaussian/Lorenzian function is used, the G/Lratio was kept fixed at 20% Lorenzian and the FWHMat 1.55 eV while the peak position (binding energy) andpeak height were left free to converge. The peakpositions do not shift within the experimental errorð�0:1 eVÞ upon changing the applied load, althoughthey were left free to vary during the curve fitting. Thecomparison of the spectra collected in the variouscontact areas corresponding to different applied loadsshows that the peak at 531.6 eV increases with increasingload. In the same figure, the O1s spectra of the steelsurface immediately prior to tribotesting, together withthe oxygen spectra collected in the non-contact area, arealso displayed. The binding-energy values of the threecomponents are listed in table 1 with the binding-energyvalues of the Pð2p3=2Þ; Sð2p3=2Þ and Znð2p3=2Þ peaks.
The P(2p) and S(2p) peaks were fitted using adoublet, taking into account the theoretical ratio ofthe spin-orbit coupling (1 : 2). The separations of the twopeaks were determined by reference measurements andkept constant for data processing (1.2 eV for sulfur and0.84 eV for phosphorus). The Pð2p3=2Þ is found at133:6� 0:1 eV in the contact regions (independently ofthe applied load) and 133:4� 0:1 eV in the non-contactregion.
The FWHM of the S(2p) peak in the contact areaswere found to be broader (2.5 eV) than those of thereference spectra (ZnS: 2.2 eV). This suggested that morethan one chemical state is present, and thus twodoublets were used for the fit. The signal at lowerbinding energies was found at 161:9� 0:1 eV and thesecond has a peak maximum at 163.2 eV. Due to the lowsulfur content in the non-contact area, the S(2p) spectrahas a low S/N ratio, which makes it difficult to producea proper peak fit. These values show a higher standarddeviation ð�0:2 eVÞ.
In figure 4, an example of an iron Feð2p3=2Þ signalcollected in an area tribostressed with 1N is shown,following a Shirley–Sherwood background subtraction.
Figure 3. O(1s) peaks of the five different loads together with the non-
contact area and the reference spectra of a nascent steel surface. The
signals are fitted with three different peaks, a first at 530.2, a second at
531.6 and a third at 532.9 eV.
M. Eglin et al./XPS analysis of i-ZnDTP films and the combinatorial approach204

The spectra is quite complex because of the super-imposition of the contributions due to the different ironspecies present in the surface film and the substrate. Toextract as much information as possible, a curve-fittingprocedure based on the parameters obtained from thereference spectra and leaving only the heights of thecurves free to vary was adopted. The contribution to themetallic iron (706.8 eV) is fitted with a tail function inorder to avoid an overestimation of the intensity of theother signals. In this case, as for the referencecompounds, the iron in the oxidation state (II), foundat 709.4 eV, has been fitted together with its satellite (at abinding energy 5.5 eV higher than the main peak), whichmight interfere with the signals assigned to iron in aphosphate and/or in a hydroxide. The Fe (III) is presentat 711.1 eV, whereas the signal at 712.4 eV might beassigned to the iron phosphate signal, according to theresults obtained on the reference iron phosphate.
The Zn 2p3=2 signal was always a Gaussian/Lorenziansymmetric curve: the peak position was found at1022.3 eV with a FWHM of 1.9 eV, independent of theapplied load.
3.4. Composition of the tribofilm
In the following, quantitative results obtained fromthe measured XPS intensities (areas of the peaks) arepresented for two independent samples.
In figure 5, the atomic ratio between phosphorus andsulfur is given for the different analyzed regions. Thesum of the spin-orbit contributions (i.e. the total areaunder each signal) of the sulfur and the phosphoruspeaks were used. At higher load the phosphorus-to-sulfur ratio increases. The theoretical ratio betweenphosphorus and sulfur in i-ZnDTP (0.5) is also given infigure 5. This ratio is close to that found in the non-contact area.
As previously seen in figure 3, the O(1s) peak can beresolved into three different peaks. Figure 6 shows theratio between the second component of the O(1s)spectra (at 531.6 eV) and the total amount of phos-phorus. At high loads the ratio is close to 1 : 4, while atlow loads it is higher. The difference between the twosamples increases at low loads.
4. Discussion
Most of the work published so far concerningtribofilms formed from ZnDTPs has focused on experi-ments carried out above 100 8C. It is assumed that thesefilms are a representation for the films produced underreal conditions, since ZnDTPs are usually used inapplications where elevated temperatures are present.However, although even at room temperature a positiveeffect of ZnDTP can be observed, very little has beenpublished on the film structure/formation mechanism of
Figure 5. Atomic ratio of P and S for the various loads, calculated
using the total area under the P and the S(2p) peaks, corrected with the
appropriate sensitivity factors. A substantial increase in P can be seen
with increasing load. The two samples represent two independent
experiments.
Figure 4. Feð2p3=2Þ spectra collected in an area tribostressed under 1N
load. It is possible to observe a contribution at 712.4 eV, which can be
attributed to iron bound to phosphate.
Figure 6. Atomic ratio of O to P for the various loads, calculated
using the second component in the O(1s) spectra (at 531.6 eV, see figure
3), attributed to oxygen bound within phosphate and the total P(2p)
peak. The two samples represent two independent experiments.
M. Eglin et al./XPS analysis of i-ZnDTP films and the combinatorial approach 205

ZnDTP under ambient conditions [10]. Room-tempera-ture measurements are of interest, however, since allmachines in which lubricant additives are used start upfrom room temperature before reaching their operatingconditions. It is also frequently the case that the mostsevere tribological conditions occur during the start-upphase of a machine.
4.1. Tribology and coefficient of friction
Coefficient of friction versus load. The COF valuesmeasured in this work are high at all applied loads. Thisfact substantiates the assumption that the experimentshave been carried out in the boundary lubricationregime [42]. Despite the high experimental error in theCOF at low loads, a slight decrease in COF can be seen.
Coefficient of friction versus time. A decrease in theCOF is detected with time for any given load. Thisdecrease is related to a change in the mechanicalproperties of the surface film and to a change in thesurface composition of the two counterparts. However,with optical microscopy it is difficult to detect wear onthe steel surface for applied loads lower than 1N,although chemical-state maps clearly show the tribo-stressed areas. This indicates that when an effectiveadditive is employed, it is difficult to observe surfacechanges with the traditional microscopic techniques butsurface analytical methods can contribute to thecharacterization of the tribofilms. Many such studieshave been carried out, but one of the limiting factors isthe difficulty of collecting information over a wide-enough range of conditions in order to clarify themechanism of the film formation. Here, the results of thecombinatorial approach provide an insight into theinfluence of the applied load and other parameters onthe chemical composition of the surface film. Differencesrevealed between the contact and the non-contactregions will also be discussed in the following.
4.2. The surface chemistry of the tribofilm
A chemical-state map (figure 2), reconstructed usingthe oxygen signal extracted from the contact area,allows the contact area to be distinguished from thenon-contact area. Moreover, chemical differences can bedetected by looking at the O(1s) signal extracted fromareas within the contact regions that were tribostressedwith different loads. This allows areas of interest to beselected and analyzed further by SAXPS. The resultsobtained reveal that in the regions with different loads,no differences in binding energies can be detected.However, differences in the composition of the surfacefilm can be readily detected.
Non-contact area: Chemical state and composition. Aswas pointed out in a recent paper, i-ZnDTP is weaklyadsorbed on the non-contact area of the sample surface
[31]. The detailed O1s spectra show the main componentto be at 530.2 eV with a second, less-intense peak at531.7 eV, also in the presence of i-ZnDTP. The ironsignal remains virtually unaffected in the presence of thesecond component of the sulfur Sð2p3=2Þ signal at163.4 eV, and the shift of the Pð2p3=2Þ signal to lowerbinding energies (133.4 eV) (compared with the 133.8 eVfound in the pure additive) may suggest that a change inthe structure of the i-ZnDTP has occurred. The presenceof the metallic signal in the iron spectra at 706.9 eVsuggests that the oxy-hydroxide film thickness is lessthan the escape depth of the photoelectrons (i.e.� 5 nm). Thus it can be concluded that in the non-contact area, an atmospherically formed oxy-hydroxidefilm is present, together with a very thin physicallyadsorbed organic layer.
Contact area: Chemical state of the elements andcomposition. The peak at 530:2� 0:1 eV in the O(1s)spectra taken in the contact area of the tribostressedsample arises from iron oxide and is present in allspectra (both on the steel prior to tribotesting andwithin the contact area for all loads). This shows thatthere is always some oxide present in the tribofilm. Asecond oxygen peak is found at 531:6� 0:1 eV. The peakposition is close, within experimental error, to theposition of the iron hydroxides ð531:8� 0:1 eVÞ [43] andto the oxygen of iron phosphate (531:7 eV table 1), alsoin agreement with the literature [44]. The intensity ofthis second peak increases with applied load, as does theamount of phosphorus found in the contact area. Theratio between the oxygen in this chemical state and thetotal phosphorus signal, corrected with the appropriatesensitivity factors, was found to be close to 4 : 1 for highloads and increases at low loads (figure 6). The oxygen-to-phosphorus ratio of 4 : 1 would agree with aphosphate structure, while at lower loads some hydrox-ides might also be present, in addition to the phosphate.The presence of a phosphate might also be supported bythe position of the Pð2p3=2Þ signal found at133:6� 0:1 eV—close to the measured value of thereference iron phosphate at 133.7 eV and 0.2 eV lowerthan the value found for the free i-ZnDTP (table 1).Reference measurements on surfaces tribostressed in thepresence of decane only (no additive) only showed smallchanges in the relative intensities of the different O1ssignal contributions [31]. In this case the ratio of thehydroxide peak to the oxide peak was smaller in thetribostressed area than in the non-contact area, whichsubstantiates our assertion that the O1s peak at 531.6 eVin the contact areas is due to oxygen bound tophosphorus.
As discussed earlier, the binding energies of bridgingoxygen (BO) and non-bridging oxygen (NBO) in theO(1s) spectra of a polyphosphate are separated byapproximately 1.5 eV [19–22]. The O(1s) peak positionsrange between 531.6 and 532.6 eV for NBO and 533.1and 534.1 eV for BO. The differences found in the
M. Eglin et al./XPS analysis of i-ZnDTP films and the combinatorial approach206

literature are probably due to different sample prepara-tion methods. The peak positions of the second O(1s)peak found in the spectra of the contact area are close tothe lower values reported in the literature for NBOoxygen. In addition, a small peak can be detected at532.9 eV, a value which would be rather low for BO.Also, the binding energy of the Pð2p3=2Þ signal at133.6 eV is in agreement with literature values forphosphate (133.4–133.8 eV [22,44]) but does not corre-spond to the literature values for the polyphosphates(134.0–135.0 eV [19–22]). The oxygen-to-phosphorusratio would also be too high for a polyphosphate. Thisleads to the conclusion that only phosphates are formedunder these experimental conditions at the surface andno polyphosphates are detected. This finding is inagreement with the literature, where it is reported thatpolyphosphates are formed thermally on the sample andmodified with the applied tribological stress [5,12]. Thetribological experiments in this work were performed attemperatures where no polyphosphates are thermallyformed, leading to a different film composition. It isimportant to mention that a thin protective film is alsoformed under these conditions.
The peak position of the component of the S(2p)spectra at 161.9 eV is typical for sulfides. Possible speciesformed could be zinc sulfide or iron sulfide, but the peakpositions of the Fe(2p) and the Zn(2p) signal do notprovide any further evidence in this regard. TheZn(LMM) signal (not shown) indicates that the presenceof zinc sulfide can be ruled out, and thus zinc might beavailable to participate in the formation of tribofilms inthe phosphate layer. The use of the two-dimensionalchemical-state plot, using the Zn(2p) and the Zn(LMM)signal, seems to be a powerful tool to obtain moreinformation on the chemical bonds of zinc [26]. Thesecond component of the sulfur peak at 163.2 eV can beassigned to organosulfur species (e.g. thiols). It can beassumed that after the reaction of the phosphoruspresent in the ZnDTP molecule to phosphate, part ofthe sulfur reacts with a metal to form sulfides. Theremaining sulfur may react with alkyl chains to formorganosulfur species. These species are soluble in thelubricant, and only a small amount would stay adsorbedat the surface or become incorporated in the surfacefilm. This leads to the depletion of S in the contact areain comparison to P.
The XPS iron signals detected in the contact regionsare different from those collected on the steel prior totribotesting: only the component at 706.8 eV is alwayspresent. This signal is assigned to the metallic iron of thesteel substrate. The differences in binding energiesbetween the Fe(II) and Fe(III) components of thetribofilms and of the natural oxide film can be explainedtaking into account that in the case of the naturallyformed film the aging of the film resulted in a magnetitefilm, whereas the peak position after tribotest suggeststhe formation of FeO and maghemite, as has already
been found in model alloy studies [45]. Furthermore, thepresence of the peak at 712.4 eV suggests at least apartial removal or reaction of the hydroxides, resultingin the formation of iron phosphate: this is alsosupported by the oxygen-to-phosphorus ratio, which isalmost stoichiometric at higher loads (i.e. 4 : 1). Appar-ently all traces of hydroxides have been removed fromthe surface, since no hydroxide peak can be detected at711.9 eV [46].
The approximate film thickness (including a carbonoverlayer) can be calculated from the attenuation by theoverlying film of the electrons emitted from the metalliciron present in the steel beneath the surface film. It wasfound to be 5:0� 0:2 nm after the 5N test. This filmthickness is significantly smaller than that reported inmost other studies. This may be due to the fact thatmost of these studies have been carried out attemperatures above 80 8C. At these temperatures, butnot below, a thick thermal film is formed on the surface.Under the conditions applied in this study, the contacttemperature and the tribochemical reaction form a thinphosphate film, but the thermal activation is insufficientto form a thick polyphosphate film.
In order to ascertain the degree of homogeneity of thecontact area a Scanning Auger Microscopy O(KLL)map of a 1N contact area (figure 7) has also beencollected on the tribologically stressed samples. It can beseen that the surface composition is not homogenous.The wear tracks are visible, with a regular spacing of25�m, arising probably from the 25�m steps madeduring the tribotest. In Auger microscopy, it is difficultto distinguish between different chemical states, eventhough recently the O(KLL) signal has been applied tothe chemical-state identification of the species present ina tribofilm [34], while in XPS we have to be aware thatwe are averaging over the analyzed area. It can beassumed that changes in the distribution of these areas,as reported in the present work, reflect the loaddependency of the tribofilm.
Figure 7. O (KLL) map of an area tribostressed at a load of 1N. The
intensity of the signal shows a periodicity of 25�m; corresponding to
the step size of the tribotest sequence.
M. Eglin et al./XPS analysis of i-ZnDTP films and the combinatorial approach 207

4.3. Mechanism of film formation
The proposed mechanism of reaction under theseexperimental conditions is the following: in the non-contact area a thin, organic layer (including ZnDTP orLI-ZnDTP) is adsorbed. Due to the mechanical andthermal stress during the tribological contact, theadsorbed species and additive molecules from thesolution react with the iron oxide to form a protectivefilm. This takes place in the region of highest mechanicaland thermal stress. The phosphorus in the ZnDTPreacts with oxygen from the oxide and dissolved oxygenin the oil to form an iron phosphate-containing film,while organosulfur species are released into the solution.Some of these species may react to form sulfides that areincorporated in the film or adsorbed on the surface. Thephosphate film is thin ð<5 nmÞ and inhomogeneous. Thecomposition and amount of phosphate film formed onthe surface depend on the applied load. The higher theload, the more phosphate is found on the surface. Thismay be explained by the fact that the higher the appliedload, the higher the real contact area. The highesttribological and thermal stresses are found in the realcontact area and therefore the tribofilm is formedpreferentially in these areas. The amount and thecomposition of the tribofilm are therefore dependenton the size and the tribological stress in the real contactarea. The proposed film structure is shown in figure 8.
5. Conclusion
The results presented here suggest that in the non-contact area, only physical adsorption of ZnDTP takesplace on the existing oxide layer. In the contact region, areaction occurs due to the tribostress and a thintribofilm is formed. The tribofilm contains iron phos-phate and other reaction products, such as sulfides and
organosulfur species. The amount and composition ofthe tribofilm is dependent on load. The phosphate showsa greater increase with increasing applied load than theother species. No polyphosphate could be detected, dueto the lack of thermal activation.
The combinatorial approach, especially when com-bined with imaging surface spectroscopies, has provenitself to be useful in characterizing the lubricant–additive interaction. It allows the tribochemical reactionoccurring under a variety of tribological conditions tobe characterized, and this approach shows promise as atool for the screening of new antiwear additives.
Acknowledgments
Financial support of the ETH Zurich and ItalianMURST (ex 60% grant to A.R.) is gratefully acknowl-edged. Prof. J.M. Martin (Ecole Centrale de Lyon,France) is thanked for supplying the i-ZnDTP. Prof. B.Elsener (University of Cagliari, Italy) is thanked for hishelp with the AES measurements.
References
[1] M. Eglin, A. Rossi and N.D. Spencer, Tribol. Lett. (this issue).
[2] C.H. Bovington, Chemistry and Technology of Lubricants, eds.
R.M. Mortier and S.T. Orszulik (Blackie and Son, Glasgow and
London, 1997).
[3] A.J. Gellman and N.D. Spencer, J. Eng. Tribol. 216 (2002) 443.
[4] D. Klamann, Lubricants and Related Products (Verlag Chemie,
Weinheim, 1984).
[5] J.M. Martin, Tribol. Lett. 6 (1999) 1.
[6] Z. Yin, M. Kasrai, M. Fuller, G.M. Bancroft, K. Fyfe and K.H.
Tan, Wear 202 (1997) 172.
[7] M.L.S. Fuller, M. Kasrai, G.M. Bancroft, K. Fyfe and K.H. Tan,
Tribol. Int. 31 (1998) 627.
[8] C.H. Bovington and B. Dacre, ASLE Trans. 27 (1984) 252.
[9] R.B. Jones and R.C. Coy, ASLE Trans. 24 (1981) 91.
Figure 8. Model of the tribofilm: a mixed iron/zinc phosphate film is formed on the surface. Due to the absence of thermal activation, the
protective film is only formed in areas with high tribological stress, occurring predominantly at the asperities. Some iron oxide remains in the less-
stressed areas (valleys). Some sulfide is also present. Organosulfur species are formed and remain either dissolved in the oil or adsorbed on the
surface. The total film thickness is approximately 5 nm.
M. Eglin et al./XPS analysis of i-ZnDTP films and the combinatorial approach208

[10] S.H. Choa, K.C. Ludema, G.E. Potter, B.M. Dekoven, T.A.
Morgan and K.K. Kar, Wear 177 (1994) 33.
[11] F.M. Piras, In situ Attenuated Total Reflection Tribometry. PhD
Thesis, presented at the Department of Materials, ETH Zurich,
2002.
[12] F.M. Piras, A. Rossi and N.D. Spencer, in: Proceedings of the
28th Leeds–Lyon Symposium on Tribology, eds. D. Dowson et al.,
Vienna, 2002, p. 199.
[13] F.M. Piras, A. Rossi and N.D. Spencer, Langmuir 18 (2002) 6606.
[14] J.S. Sheasby, T.A. Caughlin, A.G. Blahey and K.F. Laycock,
Tribol. Int. 23 (1990) 301.
[15] R.J. Bird and G.D. Galvin, Wear 37 (1976) 143.
[16] T.P. Debies and W.G. Johnston, ASLE Trans. 23 (1980) 289.
[17] S. Jahanmir, J. Tribol. Trans. ASME 109 (1987) 577.
[18] Z.F. Yin, M. Kasrai, G.M. Bancroft, K.F. Laycock and K.H.
Tan, Tribol. Int. 26 (1993) 383.
[19] E.C. Onyiriuka, J. Non-Crystal. Solids 163 (1993) 268.
[20] R.K. Brow, J. Non-Crystal. Solids 194 (1996) 267.
[21] M. Kasrai, M.L.S. Fuller, M. Scaini, Z. Yin, R.W. Brunner, G.M.
Bancroft, M.E. Fleet, K. Fyfe and K.H. Tan, in: Proceedings of
the 21st Leeds–Lyon Symposium on Tribology, eds. D. Dowson et
al. Leeds, 1994, p. 659.
[22] F.M. Piras, A. Rossi and N.D. Spencer, Tribol. Lett. (in press)
(2003).
[23] R. Gresch, W. Muller-Warmuth and H. Dutz, J. Non-Crystal.
Solids 34 (1979) 127.
[24] S.W. Gaarenstroom and N. Winograd, J. Chem. Phys. 67 (1977)
3500.
[25] C.D. Wagner, L.H. Gale and R.H. Raymond, Anal. Chem. 51
(1979) 466.
[26] A. Rossi, K. Matsumoto, M. Eglin, F.M. Piras and N.D. Spencer,
in preparation.
[27] J.S. Sheasby and Z. Nisenholz, Tribol. Trans. 36 (1993) 741.
[28] J.F. Graham, C. McCague and P.R. Norton, Tribol. Lett. 6
(1999) 149.
[29] N.D. Spencer, in: Proceedings of the JAST Tribology Conference,
Tokyo, 1998, p. 396.
[30] F.M. Piras, A. Rossi and N.D. Spencer, submitted to Surf.
Interface Anal. (2003).
[31] M. Eglin, A. Rossi and N.D. Spencer, in: Proceedings of the 28th
Leeds–Lyon Symposium on Tribology, eds. D. Dowson et al.
Vienna, 2002, p. 49.
[32] G.W. Canning, M.L.S. Fuller, G.M. Bancroft, M. Kasrai, J.N.
Cutler, G. De Stasio and B. Gilbert, Tribol. Lett. 6 (1999) 159.
[33] T. Le Mogne, J.M. Martin and C. Grossiord, Tribol. Series 36
(1999) 413.
[34] J.M. Martin, C. Grossiord, T. Le Mogne, S. Bec and A. Tonck,
Tribol. Int. 34 (2001) 523.
[35] W.A. Glaeser, D. Baer and M. Engelhardt, Wear 162–164 (1993)
132.
[36] M.P. Seah, Surf. Interface Anal. 31 (2001) 721.
[37] J.H. Scofield, J. Elect. Spect. Rel. Phen. (1976) 129.
[38] M.P. Seah and W.A. Dench, Surf. Interface Anal. 1 (1979) 2.
[39] K. Berresheim, M. Matternklosson and M. Wilmers, Fresenius J.
Anal. Chem. 341 (1991) 121.
[40] R.P. Gupta and S.K. Sen, Phys. Rev. B 12 (1975) 15.
[41] M. Eglin, A. Rossi, F.M. Piras and N.D. Spencer, Surface Sci.
Spectra 8 (2001) 97.
[42] G.W. Stachowiak and A.W. Batchelor, Engineering Tribology
(Butterworth–Heinemann, Boston, 2001).
[43] A. Rossi and B. Elsener, Mat. Sci. Forum 185–188 (1995) 337.
[44] D. Schuetzle, R.O. Carter, J. Shyu, R.A. Dickie, J. Holubka and
N.S. McIntyre, Appl. Spect. 40 (1986) 641.
[45] A. Rossi, B. Elsener and G. Puddu, Materials and Corrosion (in
press) (2002).
[46] N.S. McIntyre and D.G. Zetaruk, Anal. Chem. 49 (1977) 1521.
M. Eglin et al./XPS analysis of i-ZnDTP films and the combinatorial approach 209