Why is CA3 more vulnerable than CA1 in experimental models of controlled cortical impact-induced...
28
1 1 Why is CA3 More Vulnerable than CA1 in Experimental Models of Controlled Cortical Impact-Induced Brain Injury? Haojie Mao 1 , Benjamin S. Elkin 2 , Vinay V. Genthikatti 1 , Barclay Morrison III 2 , and King H. Yang 1 1 Biomedical Engineering Department, Wayne State University, Detroit, MI 2 Department of Biomedical Engineering, Columbia University, New York, New York Corresponding Author: King H. Yang, PhD Professor and Director Bioengineering Center Wayne State University 818 W Hancock Detroit, MI 48201 (313) 577-0252 (313) 577-8333 [email protected] Author Addresses: Haojie Mao, Ph.D. Bioengineering Center Wayne State University 818 W Hancock Detroit, MI 48201 (313) 577-3645 (313) 577-8333 [email protected] Benjamin S. Elkin, Ph.D. Department of Biomedical Engineering Columbia University 351 Engineering Terrace 1210 Amsterdam Avenue MC 8904 New York, NY 10027 [email protected] Page 1 of 28 Journal of Neurotrauma Why is CA3 More Vulnerable than CA1 in Experimental Models of Controlled Cortical Impact-Induced Brain Injury? (doi: 10.1089/neu.2012.2520) This article has been peer-reviewed and accepted for publication, but has yet to undergo copyediting and proof correction. The final published version may differ from this proof.
Transcript of Why is CA3 more vulnerable than CA1 in experimental models of controlled cortical impact-induced...

1
1
Why is CA3 More Vulnerable than CA1 in Experimental Models of
Controlled Cortical Impact-Induced Brain Injury?
Haojie Mao1, Benjamin S. Elkin2, Vinay V. Genthikatti1, Barclay Morrison III2, and
King H. Yang1
1Biomedical Engineering Department, Wayne State University, Detroit, MI
2Department of Biomedical Engineering, Columbia University, New York, New York
Corresponding Author:
King H. Yang, PhD Professor and Director Bioengineering Center Wayne State University 818 W Hancock Detroit, MI 48201 (313) 577-0252 (313) 577-8333 [email protected] Author Addresses: Haojie Mao, Ph.D. Bioengineering Center Wayne State University 818 W Hancock Detroit, MI 48201 (313) 577-3645 (313) 577-8333 [email protected] Benjamin S. Elkin, Ph.D. Department of Biomedical Engineering Columbia University 351 Engineering Terrace 1210 Amsterdam Avenue MC 8904 New York, NY 10027 [email protected]
Page 1 of 28
Jour
nal o
f N
euro
trau
ma
Why
is C
A3
Mor
e V
ulne
rabl
e th
an C
A1
in E
xper
imen
tal M
odel
s of
Con
trol
led
Cor
tical
Im
pact
-Ind
uced
Bra
in I
njur
y? (
doi:
10.1
089/
neu.
2012
.252
0)T
his
artic
le h
as b
een
peer
-rev
iew
ed a
nd a
ccep
ted
for
publ
icat
ion,
but
has
yet
to u
nder
go c
opye
ditin
g an
d pr
oof
corr
ectio
n. T
he f
inal
pub
lishe
d ve
rsio
n m
ay d
iffe
r fr
om th
is p
roof
.

2
2
Vinay V. Genthikatti Bioengineering Center Wayne State University 818 W Hancock Detroit, MI 48201 (313) 577-5035 (313) 577-8333 [email protected] Barclay Morrison III, Ph.D. Department of Biomedical Engineering Columbia University 351 Engineering Terrace 1210 Amsterdam Avenue MC 8904 New York, NY 10027 [email protected] King H. Yang, PhD Bioengineering Center Wayne State University 818 W Hancock Detroit, MI 48201 (313) 577-0252 (313) 577-8333 [email protected]
ABSTRACT
One interesting finding of controlled cortical impact (CCI) experiments is that the CA3
region of the hippocampus, which is positioned further from the impact than the CA1
region, reported to be more injured. Current literature has suggested a positive
correlation between brain tissue stretch and neuronal cell loss. However, it’s
counterintuitive to assume that CA3 is stretched more during CCI injury. Recent
mechanical studies of the brain have reported a level of spatial heterogeneity not
previously appreciated – finding that CA1 was significantly stiffer than all other regions
tested and CA3 was one of the most compliant. We hypothesized that mechanical
heterogeneity of anatomical structures could underlie the proposed heterogeneous
mechanical response and hence the pattern of cell death. As such, we developed a 3D
finite element (FE) rat brain model representing detailed hippocampal structures and
simulated various CCI experiments. Four groups of material properties based on recent
experiments were tested. In Group 1, hyperelastic material properties were assigned to
various hippocampal structures with CA3 more compliant than CA1. In Group 2, linear
visco-elastic material properties were assigned to hippocampal structures with CA3
Page 2 of 28
Jour
nal o
f N
euro
trau
ma
Why
is C
A3
Mor
e V
ulne
rabl
e th
an C
A1
in E
xper
imen
tal M
odel
s of
Con
trol
led
Cor
tical
Im
pact
-Ind
uced
Bra
in I
njur
y? (
doi:
10.1
089/
neu.
2012
.252
0)T
his
artic
le h
as b
een
peer
-rev
iew
ed a
nd a
ccep
ted
for
publ
icat
ion,
but
has
yet
to u
nder
go c
opye
ditin
g an
d pr
oof
corr
ectio
n. T
he f
inal
pub
lishe
d ve
rsio
n m
ay d
iffe
r fr
om th
is p
roof
.

3
3
more compliant than CA1. In Group 3, the hippocampus was represented by
homogenous linear visco-elastic material properties. In Group 4, homogeneous
nonlinear hippocampus was adopted. Simulation results demonstrated that for CCI with
5 mm diameter, flat shape impactor, CA3 experienced increased tensile strains over a
larger area and to a greater magnitude than did CA1 for Group 1, which best explained
why CA3 is more sensitive to CCI injury. However, for Group 2, 3, and 4, the total
volume with high strain (>30%) in CA3 was smaller than that in CA1. The FE rat brain
model with detailed hippocampal structures presented here will help to engineer desired
experimental neurotrauma models by virtually characterizing brain biomechanics before
testing.
Key words: Heterogeneous hippocampus injury, controlled cortical impact, rat brain
modeling, brain material, brain injury biomechanics, finite element method
INTRODUCTION
In vivo animal traumatic brain injury (TBI) experiments have demonstrated
heterogeneous injury patterns under various trauma conditions. In controlled cortical
impact (CCI), despite the fact that the CA3 region of the hippocampus is positioned
deeper beneath the impactor and is more resistant to hypoxia-ischemia compared to
CA1 (2000), interestingly, the CA3 region was more injured compared to the CA1 region
(Anderson et al., 2005; Colicos et al., 1996; Kim et al., 2001; Scheff et al., 2005; Varma
et al., 2002). Through stereological analysis, Witgen et al. (2005) reported similar CA1
and CA3 injuries under lateral fluid impact. While with the similar fluid impact device and
stereological estimation, Grady et al. (2003) observed a significant neuronal loss in CA3.
Such regional susceptibility to trauma load may be due to both regional mechanical
responses and cellular/physiological processes. Understanding mechanisms for this
heterogeneous pattern can help TBI researchers to better understand the experimental
CCI model to facilitate the translation of knowledge from in vivo experiments to real
world TBI injuries more efficiently.
In vitro TBI models provide a unique method to directly investigate correlations
between neural responses and mechanical loading such as stretch and shear (e.g.
Geddes and Cargill, 2001; LaPlaca et al., 2005; Morrison et al., 1998). Morrison and his
Page 3 of 28
Jour
nal o
f N
euro
trau
ma
Why
is C
A3
Mor
e V
ulne
rabl
e th
an C
A1
in E
xper
imen
tal M
odel
s of
Con
trol
led
Cor
tical
Im
pact
-Ind
uced
Bra
in I
njur
y? (
doi:
10.1
089/
neu.
2012
.252
0)T
his
artic
le h
as b
een
peer
-rev
iew
ed a
nd a
ccep
ted
for
publ
icat
ion,
but
has
yet
to u
nder
go c
opye
ditin
g an
d pr
oof
corr
ectio
n. T
he f
inal
pub
lishe
d ve
rsio
n m
ay d
iffe
r fr
om th
is p
roof
.

4
4
colleagues started to test whether CA3 was more vulnerable to stretch loadings
compared to CA1 using a well-controlled uniform stretch in vitro experimental TBI model
(Elkin and Morrison, 2007; Morrison et al., 2006; Morrison et al., 2003). Results
demonstrated that under the same stretch-level, cell losses for CA1 and CA3 regions
were similar (Cater et al., 2006). Elkin et al. have recently reported mechanical property
data for the rat brain at a spatial resolution not previously achieved (Elkin et al., 2010;
Elkin et al., 2011). In their studies, the CA1 region was the stiffest brain region measured,
while the CA3 was one of the softest. These studies lead to the question of whether CA3
does, in fact, experience higher tensile strains compared to CA1 during CCI experiments,
despite its deeper location away from impact. The ideal solution is to measure brain
tissue tensile strain under CCI directly, which is currently nearly impossible for high rate
CCI loadings. Alternatively, the next best approach is to use a high resolution 3D finite
element (FE) rat brain model to simulate CCI experiments and predict tissue stretch in
CA1 and CA3 regions during CCI. For these simulations to successfully recreate the in
vivo brain response to CCI, the model requires accurate material definitions. The new
material data (Elkin et al., 2007; 2010; 2011) make it possible to develop a detailed 3D
rat brain model with heterogeneous hippocampus sub-structures, which were not yet
achieved based on the review of available anatomically-detailed 3D rodent brain models
(Baumgartner et al., 2011; Lamy et al., 2013; Levchakov et al., 2006; Mao et al., 2006;
Pleasant et al., 2011; Shreiber et al., 1997; Stemper et al., 2011; Yeoh et al., 2011).
The goal of this study was to first develop a high resolution 3D FE rat brain
model including detailed CA1, CA2, CA3, and dentate gyrus (DG) structures in the
hippocampus. The next goal was to use the model to simulate three CCI experimental
settings. Both homogeneous and heterogeneous material properties of hippocampal
structures were numerically tested to study the effect of recently measured
heterogeneity on regional brain tissue strain responses. This would explain the
Page 4 of 28
Jour
nal o
f N
euro
trau
ma
Why
is C
A3
Mor
e V
ulne
rabl
e th
an C
A1
in E
xper
imen
tal M
odel
s of
Con
trol
led
Cor
tical
Im
pact
-Ind
uced
Bra
in I
njur
y? (
doi:
10.1
089/
neu.
2012
.252
0)T
his
artic
le h
as b
een
peer
-rev
iew
ed a
nd a
ccep
ted
for
publ
icat
ion,
but
has
yet
to u
nder
go c
opye
ditin
g an
d pr
oof
corr
ectio
n. T
he f
inal
pub
lishe
d ve
rsio
n m
ay d
iffe
r fr
om th
is p
roof
.

5
5
stereotypical pattern of cell death observed in CCI with more damage in CA3 compared
to CA1.
METHOD
Rat Brain Model with Detailed Hippocampus Structures
The previously developed and validated 3D FE rat brain model (Mao et al., 2006)
was improved to develop a higher resolution FE rat brain model incorporating
heterogeneous hippocampus structures. Hypermesh 10.0 (Altair, Troy, MI) was used to
divide each hexahedral element of the previous rat brain model (Mao et al., 2006) into
eight hexahedral elements, which increased the total number of hexahedral elements of
rat brain from 255,700 to 2,045,600. 41 coronal images from Bregma -1.72 mm to
Bregma -6.48 mm of the rat brain atlas (Paxinos and Watson, 2005) were digitalized
using Scion image (NIH) to get feature curves for inclusion of a detailed hippocampus,
which were then imported into Hypermesh. The fine 3D hippocampus hexahedral
meshes were then carefully adjusted to match hippocampus sub-structure feature
curves. The developed detailed FE rat brain model includes CA1, CA2, CA3, and DG for
hippocampus, as shown in Figure 1. In total, 2,222,216 elements including 2,045,600
hexahedral and 176,616 quadrilateral shell elements were developed. For 3D
hexahedral elements, 99.1% of elements had Jacobian above 0.4. 0.03% of elements
had a warpage of over 50, 0.01% of elements had an aspect ratio above 8.0, 0.05% of
elements had a minimum angle of less than 25° , 0.08% of elements had a maximum
angle above 160°, and 0.02% of elements had a skew angle above 65°. For 2D
quadrilateral elements, 0.005% of elements had a Jacobian below 0.40, 0.001% of
elements had a warpage above 45, 5% of elements had an aspect ratio over 4, and 0.01%
of elements had a skew angle over 65°. Figure 2 shows one coronal section through
Bregma -3.0 mm indicating the specific region selections for material definition in more
Page 5 of 28
Jour
nal o
f N
euro
trau
ma
Why
is C
A3
Mor
e V
ulne
rabl
e th
an C
A1
in E
xper
imen
tal M
odel
s of
Con
trol
led
Cor
tical
Im
pact
-Ind
uced
Bra
in I
njur
y? (
doi:
10.1
089/
neu.
2012
.252
0)T
his
artic
le h
as b
een
peer
-rev
iew
ed a
nd a
ccep
ted
for
publ
icat
ion,
but
has
yet
to u
nder
go c
opye
ditin
g an
d pr
oof
corr
ectio
n. T
he f
inal
pub
lishe
d ve
rsio
n m
ay d
iffe
r fr
om th
is p
roof
.

6
6
detail. The cerebellum white matter was not defined in the FE rat brain model, as such,
the cerebellum gray matter was used for the entire cerebellum. Regarding mesh density,
Mao et al. (2011) reported that the rat brain model with mesh size less than 0.2 mm
could be deemed as convergent for CCI simulation. The current fine rat model with
typical 0.1 mm element length was considered acceptable.
Material Properties
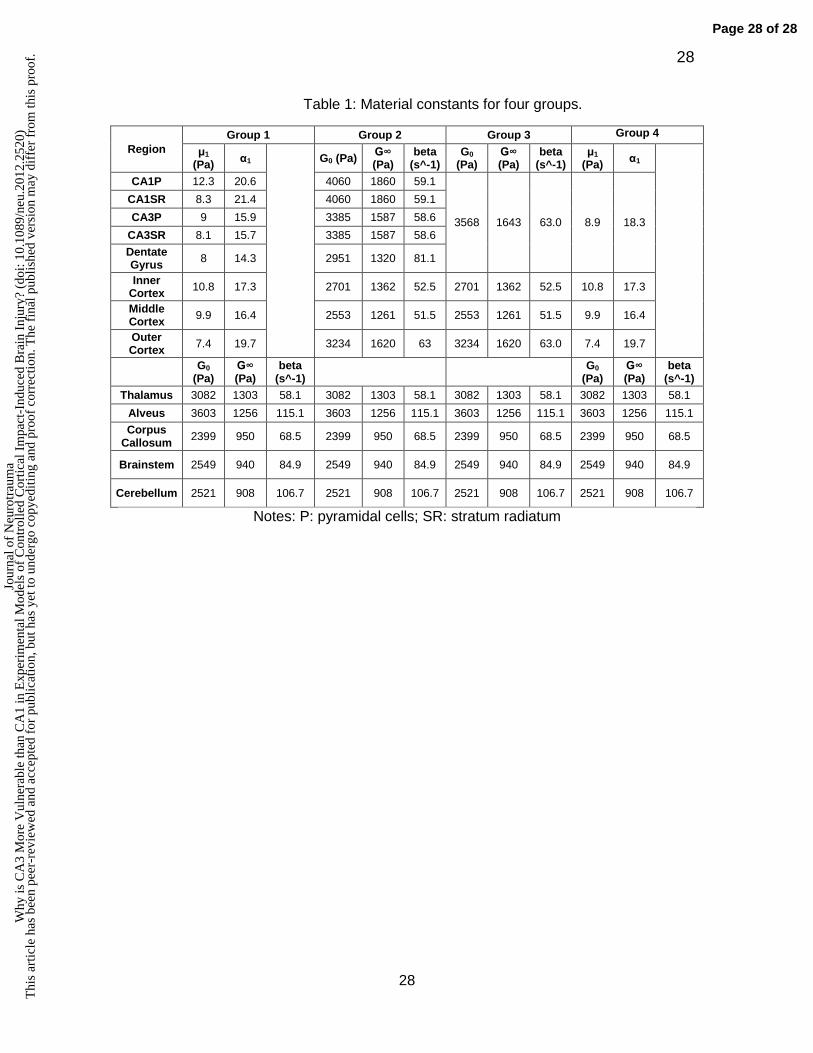
Three sets of simulations were performed with different material properties
specific for the hippocampus. Group 1 consisted of the most recent heterogeneous
nonlinear material properties for the hippocampus (Elkin et al., 2010). Group 2 consisted
of heterogeneous linear viscoelastic material properties for the hippocampus (Elkin et al.,
2011). Group 3 consisted of homogeneous linear viscoelastic material properties for the
hippocampus defined as the average of those in Group 2. Group 4 consisted of
homogeneous nonlinear material properties for the hippocampus based on data for
Group 1. Material properties for other regions of the brain were the same for each
material group. Table 1 lists material constants for various brain regions for each
material group.
Group 1: Heterogeneous nonlinear material properties were implemented with the LS-
DYNA material definition MAT_77_O (MAT_OGDEN_RUBBER). For this material,
hyper-elasticity was described by Equation 1 in which μ and α are parameters
associated with strain energy and for which n was 1 in this study. Material parameters
were derived from experimental results in adult rat brain tissue (Elkin et al., 2010) and
are listed in Table 1.
∑ ∑
(
) (1)
Page 6 of 28
Jour
nal o
f N
euro
trau
ma
Why
is C
A3
Mor
e V
ulne
rabl
e th
an C
A1
in E
xper
imen
tal M
odel
s of
Con
trol
led
Cor
tical
Im
pact
-Ind
uced
Bra
in I
njur
y? (
doi:
10.1
089/
neu.
2012
.252
0)T
his
artic
le h
as b
een
peer
-rev
iew
ed a
nd a
ccep
ted
for
publ
icat
ion,
but
has
yet
to u
nder
go c
opye
ditin
g an
d pr
oof
corr
ectio
n. T
he f
inal
pub
lishe
d ve
rsio
n m
ay d
iffe
r fr
om th
is p
roof
.

7
7
Group 2: Heterogeneous linear viscoelastic material properties were implemented with a
Kelvin-Maxwell model using the LS-DYNA material definition MAT_061: MAT_KELVIN-
MAXWELL_VISCOELASTIC, shown in equation 2. The short term shear modulus (G0),
long term shear modulus (G∞), and decay constants (β) for different hippocampus
structures as well as other brain regions for all simulation groups were defined according
to recently reported experimental data (Elkin et al., 2011). One decay term was sufficient
to describe the mechanical behavior of the tissue over the short time scales relevant to
the simulations.
( ) ( ) (2)
Group 3: Homogeneous linear viscoelastic properties were implemented in LS-DYNA as
for Group 2 with material definition MAT_061. In this group, the hippocampal material
properties were homogeneous. The short term shear modulus was defined as 3568 Pa,
the long term shear modulus as 1643 Pa, and the decay constant as 63 s-1, representing
the average of hippocampal sub-structure properties in Group 2. In calculating average
material properties, no weighting factor was used to account for differences in regional
volumes.
Group 4: Homogeneous nonlinear material properties were implemented in LS-DYNA as
for Group 1 with material definition MAT_77_O (MAT_OGDEN_RUBBER). In this group,
the hippocampal material properties were homogeneous where μ was defined as 8.9 Pa
and α was defined as 18.3 in Equation 1 for all regions of the hippocampus. These
material parameters represent a least squares fit of the Ogden model to the measured
strain-dependent modulus averaged across all adult hippocampal regions from Elkin et
al., 2010
Page 7 of 28
Jour
nal o
f N
euro
trau
ma
Why
is C
A3
Mor
e V
ulne
rabl
e th
an C
A1
in E
xper
imen
tal M
odel
s of
Con
trol
led
Cor
tical
Im
pact
-Ind
uced
Bra
in I
njur
y? (
doi:
10.1
089/
neu.
2012
.252
0)T
his
artic
le h
as b
een
peer
-rev
iew
ed a
nd a
ccep
ted
for
publ
icat
ion,
but
has
yet
to u
nder
go c
opye
ditin
g an
d pr
oof
corr
ectio
n. T
he f
inal
pub
lishe
d ve
rsio
n m
ay d
iffe
r fr
om th
is p
roof
.

8
8
Simulation of CCI Experiment:
CCI simulation: The CCI simulation was defined carefully to accurately represent
experimental settings. A 6.0 mm diameter craniectomy was simulated over the left
fronto-parietal cortex, with the center 3.0 mm posterior to Bregma and 3.0 mm lateral to
the midline. A flat impactor tip (5.0 mm diameter) of the CCI device was positioned over
the dura mater at a 15º angle and impacted the brain at a velocity of 6 m/s to a depth of
2.0 mm. Figure 3 shows the relative position between impactor and CA1/CA3 in the
CCI simulation. Due to computational costs, the CCI simulation was solved for the first 5
msec, during which time the peak tissue strains were reached. Because strain
magnitude was reported to be positively correlated to neuronal loss (e.g. Elkin and
Morrison, 2007; Mao et al., 2010; Morrison et al., 2003), the rest of strain history after 5
ms was not simulated. To investigate hippocampus responses under various CCI
settings, 4 mm diameter, flat impactor and 5 mm diameter, sphere impactor were
simulated.
RESULTS
Approximately 142 hours were required to finish up to 5 ms of a CCI simulation
with linear viscoelastic material using four AMD Opteron ™ 2380 Processors. Using
Ogden nonlinear materials, a slightly shorter length of time of 138 hours was needed.
Figures 4-6 show a typical strain distribution in CA1 and CA3 at various time points
when the peak strains were experienced. Because simulations with different material
groups demonstrated a heterogeneous strain pattern and local peak-strains did not
occur at the same time point across all groups, multiple time points were selected for
Figures 4-6. With a homogeneous linear visco-elastic hippocampus (Group 3), the
volume of the CA1 region experiencing high strains (>30%) was 0.77 mm3, which was
larger than 0.16 mm3 in CA3. Using heterogeneous linear visco-elastic material
Page 8 of 28
Jour
nal o
f N
euro
trau
ma
Why
is C
A3
Mor
e V
ulne
rabl
e th
an C
A1
in E
xper
imen
tal M
odel
s of
Con
trol
led
Cor
tical
Im
pact
-Ind
uced
Bra
in I
njur
y? (
doi:
10.1
089/
neu.
2012
.252
0)T
his
artic
le h
as b
een
peer
-rev
iew
ed a
nd a
ccep
ted
for
publ
icat
ion,
but
has
yet
to u
nder
go c
opye
ditin
g an
d pr
oof
corr
ectio
n. T
he f
inal
pub
lishe
d ve
rsio
n m
ay d
iffe
r fr
om th
is p
roof
.

9
9
properties for the hippocampus (Group 2), the volume of the CA3 region with high
strains was 0.46 mm3, which was larger than that in CA3 of Group 3, but still lower than
0.89 mm3 in CA1. For the simulation with a heterogeneous nonlinear hippocampus
(Group 1), the volume of the CA3 region with high strains was 1.77 mm3, which was
larger than 1.65 mm3 in CA1. For the simulation with a homogeneous nonlinear
hippocampus (Group 4), the CA3 region with high strains was 0.97 mm3, which was
smaller than 1.19 mm3 for CA1.
Figure 7 summarizes all the peak strains for 12 CCI cases. CA1 experienced the
highest strains for Group 1 with heterogeneous nonlinear hippocampus for all different
CCI settings. The peak strains in this region were not affected much when using either
homogeneous or heterogeneous linear visco-elastic materials (Group 2 or Group 3). In
contrast, when using the nonlinear material (Group 1), the peak CA1 strain close to the
caudal rim of the impactor was increased from 32% to 46%. The peak CA3 strain
through the impactor center was increased from 42% to 62%, and the peak CA3 strain
close to the posterior rim of the impactor was increased from 28% to 53%. Such
increases were smaller when using homogeneous nonlinear materials of Group 4. The
time histories of tissue strains for the CA1 and CA3 regions beneath the impact center
and close to the caudal (posterior) rim of the impactor are shown in Figure 8. Strains
were calculated by averaging strains from four elements so as to avoid strains in one
element from biasing the reported results. The elements at caudal rim were selected at -
5.3 mm to Bregma for 5 mm diameter impactor; and -4.8 mm to Bregma for 4 mm
diameter impactor. The ratio of CA3 to CA1 strain further demonstrated the effect of
material heterogeneity and material laws, with the CA3 strain at the caudal rim of the
impactor increasing to the greatest degree with the Group 1 material properties (Figure
9).
Page 9 of 28
Jour
nal o
f N
euro
trau
ma
Why
is C
A3
Mor
e V
ulne
rabl
e th
an C
A1
in E
xper
imen
tal M
odel
s of
Con
trol
led
Cor
tical
Im
pact
-Ind
uced
Bra
in I
njur
y? (
doi:
10.1
089/
neu.
2012
.252
0)T
his
artic
le h
as b
een
peer
-rev
iew
ed a
nd a
ccep
ted
for
publ
icat
ion,
but
has
yet
to u
nder
go c
opye
ditin
g an
d pr
oof
corr
ectio
n. T
he f
inal
pub
lishe
d ve
rsio
n m
ay d
iffe
r fr
om th
is p
roof
.

10
10
DISCUSSION
In this study, we developed a 3D FE rat brain model with detailed hippocampal
structures to investigate the consequence of recently determined heterogeneous
material properties on the pattern of tissue strain due to the CCI injury model within the
hippocampus. The specification of nonlinear and time-dependent material behaviors
critically altered the pattern of hippocampal strain when the impactor was held in position
after striking the exposed cortex (Figures 4-7). The inclusion of a nonlinear
heterogeneous hippocampus (Group 1) resulted in greater tensile strains in CA3 than in
CA1, which may provide a biomechanical explanation for why CA3 is more vulnerable
than CA1 during CCI. Using heterogeneous linear viscoelastic material properties for the
hippocampus (Group 2), strains in CA3 were elevated compared to the homogenous
case (Group 3), but the volume of CA3 experiencing large strains (>30%) was still
smaller than that for CA1. The major reason that strains in CA3 were much larger with
nonlinear materials (Group 1) compared to linear viscoelastic materials (Group 2) is that
the CA3 was much softer than CA1 under larger tensile strain loading (Elkin et al., 2010).
Another reason could be due to the differences between Ogden materials and linear
viscoelastic materials in LS-DYNA. These results suggest that the choice of material
properties affects the predicted strain field in response to CCI and that accurate
representation of both the heterogeneity and nonlinear viscoelasticity of the
hippocampus can more accurately predict the experimentally observed pattern of brain
damage.
FE predictions are inevitably model-dependent. Hyperelastic or linear viscoelastic
material laws with different material constants have been used for rodent brain models in
the past (Baumgartner et al., 2011; Levchakov et al., 2006; Mao et al., 2006; Pleasant et
al., 2011; Stemper et al., 2011; Yeoh et al., 2011). In this study, care was taken to
Page 10 of 28
Jour
nal o
f N
euro
trau
ma
Why
is C
A3
Mor
e V
ulne
rabl
e th
an C
A1
in E
xper
imen
tal M
odel
s of
Con
trol
led
Cor
tical
Im
pact
-Ind
uced
Bra
in I
njur
y? (
doi:
10.1
089/
neu.
2012
.252
0)T
his
artic
le h
as b
een
peer
-rev
iew
ed a
nd a
ccep
ted
for
publ
icat
ion,
but
has
yet
to u
nder
go c
opye
ditin
g an
d pr
oof
corr
ectio
n. T
he f
inal
pub
lishe
d ve
rsio
n m
ay d
iffe
r fr
om th
is p
roof
.

11
11
minimize the bias of brain stiffness across the four groups of material properties
simulated. Material parameters for Group 1 were derived from experiments on adult rat
brain tissue that probed the nonlinear elastic material behavior (Elkin et al., 2010). For
Group 2, linear viscoelastic parameters were derived from experimental data (Elkin et al.,
2011; Elkin et al., Manuscript in preparation). Once determined, these material
properties were not altered to tune the FE model to produce a desired output, which is
often done when attempting to fit simulations to experimental, histological data. For
Group 3 with homogeneous hippocampus, the short term shear modulus, long term
shear modulus, and decay constant were averaged from those used in Group 2.
Furthermore, heterogeneity in other anatomical regions such as cortex, corpus callosum,
and thalamus were identical for all three simulations.
Group 1 & 4 with Ogden nonlinear materials demonstrated biphasic strain peaks.
A slight second peak was also observed for CA1 at the impactor posterior rim for Group
2 with heterogeneous viscoelastic materials. The second peak strains in Group 1 were
much higher than those in Group 4, indicating that material heterogeneity played an
important role in regional strain responses. Meanwhile, differences between linear
viscoelastic material and Ogden nonlinear viscoelastic material indicated that the
biphasic strain pattern was also related to the material model. Ideally, a material model
which can represent both viscoelastic and nonlinear characteristics with damping control
is desired. Nevertheless, this study demonstrated that a heterogeneous hippocampus
model with nonlinear materials was critical to predict hippocampus mechanical
responses, which explained the vulnerability of CA3 observed experimentally
The ratios between CA3 and CA1 peak strain further demonstrated the effect of
material heterogeneity in the hippocampus. For regions beneath the center of the
impactor, strain in CA3 was slightly lower than that in CA1 when modeling a
Page 11 of 28
Jour
nal o
f N
euro
trau
ma
Why
is C
A3
Mor
e V
ulne
rabl
e th
an C
A1
in E
xper
imen
tal M
odel
s of
Con
trol
led
Cor
tical
Im
pact
-Ind
uced
Bra
in I
njur
y? (
doi:
10.1
089/
neu.
2012
.252
0)T
his
artic
le h
as b
een
peer
-rev
iew
ed a
nd a
ccep
ted
for
publ
icat
ion,
but
has
yet
to u
nder
go c
opye
ditin
g an
d pr
oof
corr
ectio
n. T
he f
inal
pub
lishe
d ve
rsio
n m
ay d
iffe
r fr
om th
is p
roof
.

12
12
homogeneous hippocampus (Figure 9, Group 3). For regions beneath the caudal rim of
the impactor, CA3 strains generally were larger than CA1 strains. The maximum ratio
obtained in this region was 2.6 for Group 1 simulations. It should be noted that strains in
the cortex and thalamus were not affected appreciably by the hippocampal material
heterogeneity in terms of peak values and regions of high strains when using same
material constitutive models. These findings highlighted the importance of adopting a
high-resolution FE mesh of the rat brain with advanced hippocampual material
heterogeneity to study tissue biomechanics in the hippocampus. In terms of the
mechanical response of the cortex and thalamus, a lower resolution model can still
provide accurate predictions.
In the rat brain model, brain elements were connected without any sliding. Future
in vivo quantifications of structure tethering, such as bonding strength between
hippocampus and surrounding tissues, can be combined with this model to examine how
the tethering strength affect brain regional strain responses. The effect of hippocampal
cell layer orientations was not considered in this study. For future studies, a sub-
modeling approach can be introduced to study how dorsal hippocampal cells
(perpendicular to the impact direction) and ventral hippocampal cells (parallel to the
impact direction) affect hippocampus regional strains.
CONCLUSION
A 3D rat brain model with two million hexahedral elements was developed to
thoroughly investigate region- and time-dependent CA1 and CA3 strain patterns during
CCI at a cost of long computational time. Material heterogeneity of the hippocampus was
found to be critical for FE model predictions. Representation of a heterogeneous
hippocampus with nonlinear material properties predicted a large region of high strains
in CA3, which provides a biomechanical explanation to the long-standing question as to
Page 12 of 28
Jour
nal o
f N
euro
trau
ma
Why
is C
A3
Mor
e V
ulne
rabl
e th
an C
A1
in E
xper
imen
tal M
odel
s of
Con
trol
led
Cor
tical
Im
pact
-Ind
uced
Bra
in I
njur
y? (
doi:
10.1
089/
neu.
2012
.252
0)T
his
artic
le h
as b
een
peer
-rev
iew
ed a
nd a
ccep
ted
for
publ
icat
ion,
but
has
yet
to u
nder
go c
opye
ditin
g an
d pr
oof
corr
ectio
n. T
he f
inal
pub
lishe
d ve
rsio
n m
ay d
iffe
r fr
om th
is p
roof
.

13
13
why CA3 is damaged to a greater extent compared to CA1 despite its deeper position
from impact in CCI.
Acknowledgement
We appreciate Dr. Michelle LaPlaca’s help in describing CCI experiments. We
thank Mr. Amandeep Gill, Mr. Gurdeep Jandir, Mr. Amrinder Singh, and Mr. Chintan
Shelat for their help in part of meshing and simulation. We acknowledge Mr. Abrar Wazir
for proofreading. This work was supported in part by the National Highway Traffic Safety
Administration (DTNH22-08-C-00088).
References:
Anderson, K.J., K.M. Miller, I. Fugaccia, and S.W. Scheff. 2005. Regional distribution of fluoro-jade B staining in the hippocampus following traumatic brain injury. Experimental neurology 193:125-130.
Baumgartner, D., M. Lamy, R. Willinger, and J. Davidsson. 2011. A finite element model of the rat brain for injury investigation. Computer Methods in Biomechanics and Biomedical Engineering 14, No. S1:273 - 274.
Cater, H.L., L.E. Sundstrom, and B. Morrison, 3rd. 2006. Temporal development of hippocampal cell death is dependent on tissue strain but not strain rate. J Biomech 39:2810-2818.
Colicos, M.A., C.E. Dixon, and P.K. Dash. 1996. Delayed, selective neuronal death following experimental cortical impact injury in rats: possible role in memory deficits. Brain research 739:111-119.
Elkin, B.S., E.U. Azeloglu, K.D. Costa, and B. Morrison, 3rd. 2007. Mechanical heterogeneity of the rat hippocampus measured by atomic force microscope indentation. J Neurotrauma 24:812-822.
Elkin, B.S., A. Ilankovan, and B. Morrison, 3rd. 2010. Age-dependent regional mechanical properties of the rat hippocampus and cortex. J Biomech Eng 132:011010.
Elkin, B.S., A.I. Ilankovan, and B. Morrison. 2011. A Detailed Viscoelastic Characterization of the P17 and Adult Rat Brain. J Neurotrauma 110525140842040.
Elkin, B.S., and B. Morrison, 3rd. 2007. Region-specific tolerance criteria for the living brain. Stapp Car Crash J 51:127-138.
Geddes, D.M., and R.S. Cargill, 2nd. 2001. An in vitro model of neural trauma: device characterization and calcium response to mechanical stretch. J Biomech Eng 123:247-255.
Kim, B.T., V.L. Rao, K.A. Sailor, K.K. Bowen, and R.J. Dempsey. 2001. Protective effects of glial cell line-derived neurotrophic factor on hippocampal neurons after traumatic brain injury in rats. Journal of neurosurgery 95:674-679.
Kreisman, N.R., S. Soliman, and D. Gozal. 2000. Regional differences in hypoxic depolarization and swelling in hippocampal slices. J Neurophysiol 83:1031-1038.
Page 13 of 28
Jour
nal o
f N
euro
trau
ma
Why
is C
A3
Mor
e V
ulne
rabl
e th
an C
A1
in E
xper
imen
tal M
odel
s of
Con
trol
led
Cor
tical
Im
pact
-Ind
uced
Bra
in I
njur
y? (
doi:
10.1
089/
neu.
2012
.252
0)T
his
artic
le h
as b
een
peer
-rev
iew
ed a
nd a
ccep
ted
for
publ
icat
ion,
but
has
yet
to u
nder
go c
opye
ditin
g an
d pr
oof
corr
ectio
n. T
he f
inal
pub
lishe
d ve
rsio
n m
ay d
iffe
r fr
om th
is p
roof
.

14
14
Lamy, M., D. Baumgartner, N. Yoganandan, B.D. Stemper, and R. Willinger. 2013. Experimentally validated three-dimensional finite element model of the rat for mild traumatic brain injury. Med Biol Eng Comput 51:353-365.
LaPlaca, M.C., D.K. Cullen, J.J. McLoughlin, and R.S. Cargill, 2nd. 2005. High rate shear strain of three-dimensional neural cell cultures: a new in vitro traumatic brain injury model. J Biomech 38:1093-1105.
Levchakov, A., E. Linder-Ganz, R. Raghupathi, S.S. Margulies, and A. Gefen. 2006. Computational studies of strain exposures in neonate and mature rat brains during closed head impact. J Neurotrauma 23:1570-1580.
Mao, H., X. Jin, L. Zhang, K.H. Yang, T. Igarashi, L.J. Noble-Haeusslein, and A.I. King. 2010. Finite element analysis of controlled cortical impact-induced cell loss. J Neurotrauma 27:877-888.
Mao, H., L. Zhang, K.H. Yang, and A.I. King. 2006. Application of a finite element model of the brain to study traumatic brain injury mechanisms in the rat. Stapp Car Crash J 50:583-600.
Morrison, B., 3rd, H.L. Cater, C.D. Benham, and L.E. Sundstrom. 2006. An in vitro model of traumatic brain injury utilising two-dimensional stretch of organotypic hippocampal slice cultures. J Neurosci Methods 150:192-201.
Morrison, B., 3rd, H.L. Cater, C.C. Wang, F.C. Thomas, C.T. Hung, G.A. Ateshian, and L.E. Sundstrom. 2003. A tissue level tolerance criterion for living brain developed with an in vitro model of traumatic mechanical loading. Stapp Car Crash J 47:93-105.
Morrison, B., 3rd, D.F. Meaney, and T.K. McIntosh. 1998. Mechanical characterization of an in vitro device designed to quantitatively injure living brain tissue. Ann Biomed Eng 26:381-390.
Paxinos, G., and C. Watson. 2005. The Rat Brain in Stereotaxic Coordinates. Elsevier Academic Press, San Diego.
Pleasant, J.M., S.W. Carlson, H. Mao, S. Scheff, K.H. Yang, and K.E. Saatman. 2011. Rate of Neurodegeneration in the Mouse Controlled Cortical Impact Model is Influenced by Impactor Tip Shape: Implications for Mechanistic and Therapeutic Studies. J Neurotrauma 28:2245-2262.
Scheff, S.W., D.A. Price, R.R. Hicks, S.A. Baldwin, S. Robinson, and C. Brackney. 2005. Synaptogenesis in the hippocampal CA1 field following traumatic brain injury. Journal of neurotrauma 22:719-732.
Shreiber, D.I., A.C. Bain, and D.F. Meaney. 1997. In Vivo Thresholds for Mechanical Injury to the Blood-Brain Barrier. In 41th Stapp Car Crash Conference. Lake Buena Vista, Florida, USA. SAE Paper No. 973335.
Stemper, B.D., D. Baumgartner, N. Yoganandan, M. Lamy, and R. Willinger. 2011. Tissue-level Stresses within the Brain During Rotationally-Induced MTBI: A Three-Dimensional Finite Element Modle of the Rat Coupled with Experiments Journal of neurotrauma 28:A-59.
Varma, M.R., C.E. Dixon, E.K. Jackson, G.W. Peters, J.A. Melick, R.P. Griffith, V.A. Vagni, R.S. Clark, L.W. Jenkins, and P.M. Kochanek. 2002. Administration of adenosine receptor agonists or antagonists after controlled cortical impact in mice: effects on function and histopathology. Brain Res 951:191-201.
Yeoh, S., V. Mathur, and K.L. Monson. 2011. Vascular injury and cortical deformation in a model of brain contusion. In ASME 2011 Summer Bioengineering Conference. ASME, Nemacolin Woodlands Resort, Famington, Pennsylvania, USA.
Page 14 of 28
Jour
nal o
f N
euro
trau
ma
Why
is C
A3
Mor
e V
ulne
rabl
e th
an C
A1
in E
xper
imen
tal M
odel
s of
Con
trol
led
Cor
tical
Im
pact
-Ind
uced
Bra
in I
njur
y? (
doi:
10.1
089/
neu.
2012
.252
0)T
his
artic
le h
as b
een
peer
-rev
iew
ed a
nd a
ccep
ted
for
publ
icat
ion,
but
has
yet
to u
nder
go c
opye
ditin
g an
d pr
oof
corr
ectio
n. T
he f
inal
pub
lishe
d ve
rsio
n m
ay d
iffe
r fr
om th
is p
roof
.
15
15
Figure 1: Detailed rat brain model. A: Global view of the rat brain model; B: Coronal
sections.
Page 15 of 28
Jour
nal o
f N
euro
trau
ma
Why
is C
A3
Mor
e V
ulne
rabl
e th
an C
A1
in E
xper
imen
tal M
odel
s of
Con
trol
led
Cor
tical
Im
pact
-Ind
uced
Bra
in I
njur
y? (
doi:
10.1
089/
neu.
2012
.252
0)T
his
artic
le h
as b
een
peer
-rev
iew
ed a
nd a
ccep
ted
for
publ
icat
ion,
but
has
yet
to u
nder
go c
opye
ditin
g an
d pr
oof
corr
ectio
n. T
he f
inal
pub
lishe
d ve
rsio
n m
ay d
iffe
r fr
om th
is p
roof
.

16
16
Figure 2: Region selections for material definitions. CC:corpus callosum, DG:Dentate
gyrus.
Page 16 of 28
Jour
nal o
f N
euro
trau
ma
Why
is C
A3
Mor
e V
ulne
rabl
e th
an C
A1
in E
xper
imen
tal M
odel
s of
Con
trol
led
Cor
tical
Im
pact
-Ind
uced
Bra
in I
njur
y? (
doi:
10.1
089/
neu.
2012
.252
0)T
his
artic
le h
as b
een
peer
-rev
iew
ed a
nd a
ccep
ted
for
publ
icat
ion,
but
has
yet
to u
nder
go c
opye
ditin
g an
d pr
oof
corr
ectio
n. T
he f
inal
pub
lishe
d ve
rsio
n m
ay d
iffe
r fr
om th
is p
roof
.

17
17
Page 17 of 28
Jour
nal o
f N
euro
trau
ma
Why
is C
A3
Mor
e V
ulne
rabl
e th
an C
A1
in E
xper
imen
tal M
odel
s of
Con
trol
led
Cor
tical
Im
pact
-Ind
uced
Bra
in I
njur
y? (
doi:
10.1
089/
neu.
2012
.252
0)T
his
artic
le h
as b
een
peer
-rev
iew
ed a
nd a
ccep
ted
for
publ
icat
ion,
but
has
yet
to u
nder
go c
opye
ditin
g an
d pr
oof
corr
ectio
n. T
he f
inal
pub
lishe
d ve
rsio
n m
ay d
iffe
r fr
om th
is p
roof
.

18
18
Figure 3: Two views showing complete 3D rat brain and 3D impactor for CCI simulations.
A: Transparent view showing relative position between impactor and hippocampus
structures; B: Caudal (posterior) view showing how the impactor was offset from midline
and perpendicular to the 3D brain surface.
Page 18 of 28
Jour
nal o
f N
euro
trau
ma
Why
is C
A3
Mor
e V
ulne
rabl
e th
an C
A1
in E
xper
imen
tal M
odel
s of
Con
trol
led
Cor
tical
Im
pact
-Ind
uced
Bra
in I
njur
y? (
doi:
10.1
089/
neu.
2012
.252
0)T
his
artic
le h
as b
een
peer
-rev
iew
ed a
nd a
ccep
ted
for
publ
icat
ion,
but
has
yet
to u
nder
go c
opye
ditin
g an
d pr
oof
corr
ectio
n. T
he f
inal
pub
lishe
d ve
rsio
n m
ay d
iffe
r fr
om th
is p
roof
.

19
19
Figure 4: CA1, CA3, and DG strain contours for CCI case with 5 mm diameter, flat
impactor. CA3 experienced largest areas of high strains when using Group 1
heterogeneous nonlinear materials. Brain model was slightly rotated along rostral-caudal
axis to better demonstrate strain contours. These time points were selected when the
maximum areas of large strain elements were observed compared to nearby time points.
DG: dentate gyrus.
Page 19 of 28
Jour
nal o
f N
euro
trau
ma
Why
is C
A3
Mor
e V
ulne
rabl
e th
an C
A1
in E
xper
imen
tal M
odel
s of
Con
trol
led
Cor
tical
Im
pact
-Ind
uced
Bra
in I
njur
y? (
doi:
10.1
089/
neu.
2012
.252
0)T
his
artic
le h
as b
een
peer
-rev
iew
ed a
nd a
ccep
ted
for
publ
icat
ion,
but
has
yet
to u
nder
go c
opye
ditin
g an
d pr
oof
corr
ectio
n. T
he f
inal
pub
lishe
d ve
rsio
n m
ay d
iffe
r fr
om th
is p
roof
.

20
20
Page 20 of 28
Jour
nal o
f N
euro
trau
ma
Why
is C
A3
Mor
e V
ulne
rabl
e th
an C
A1
in E
xper
imen
tal M
odel
s of
Con
trol
led
Cor
tical
Im
pact
-Ind
uced
Bra
in I
njur
y? (
doi:
10.1
089/
neu.
2012
.252
0)T
his
artic
le h
as b
een
peer
-rev
iew
ed a
nd a
ccep
ted
for
publ
icat
ion,
but
has
yet
to u
nder
go c
opye
ditin
g an
d pr
oof
corr
ectio
n. T
he f
inal
pub
lishe
d ve
rsio
n m
ay d
iffe
r fr
om th
is p
roof
.

21
21
Figure 5: CA1, CA3, and DG strain contours for CCI case with 4 mm diameter, flat
impactor. CA3 experienced largest areas of high strains when using Group 1
heterogeneous nonlinear materials. Brain model was slightly rotated along rostral-caudal
axis to better demonstrate strain contours. These time points were selected when the
maximum areas of large strain elements were observed compared to nearby time points.
DG: dentate gyrus.
Page 21 of 28
Jour
nal o
f N
euro
trau
ma
Why
is C
A3
Mor
e V
ulne
rabl
e th
an C
A1
in E
xper
imen
tal M
odel
s of
Con
trol
led
Cor
tical
Im
pact
-Ind
uced
Bra
in I
njur
y? (
doi:
10.1
089/
neu.
2012
.252
0)T
his
artic
le h
as b
een
peer
-rev
iew
ed a
nd a
ccep
ted
for
publ
icat
ion,
but
has
yet
to u
nder
go c
opye
ditin
g an
d pr
oof
corr
ectio
n. T
he f
inal
pub
lishe
d ve
rsio
n m
ay d
iffe
r fr
om th
is p
roof
.

22
22
Figure 6: CA1, CA3, and DG strain contours for CCI case with 5 mm diameter, sphere
diameter. CA3 experienced largest areas of high strains when using Group 1
heterogeneous nonlinear materials. Brain model was slightly rotated along rostral-caudal
axis to better demonstrate strain contours. These time points were selected when the
maximum areas of large strain elements were observed compared to nearby time points.
DG: dentate gyrus.
Page 22 of 28
Jour
nal o
f N
euro
trau
ma
Why
is C
A3
Mor
e V
ulne
rabl
e th
an C
A1
in E
xper
imen
tal M
odel
s of
Con
trol
led
Cor
tical
Im
pact
-Ind
uced
Bra
in I
njur
y? (
doi:
10.1
089/
neu.
2012
.252
0)T
his
artic
le h
as b
een
peer
-rev
iew
ed a
nd a
ccep
ted
for
publ
icat
ion,
but
has
yet
to u
nder
go c
opye
ditin
g an
d pr
oof
corr
ectio
n. T
he f
inal
pub
lishe
d ve
rsio
n m
ay d
iffe
r fr
om th
is p
roof
.

23
23
Page 23 of 28
Jour
nal o
f N
euro
trau
ma
Why
is C
A3
Mor
e V
ulne
rabl
e th
an C
A1
in E
xper
imen
tal M
odel
s of
Con
trol
led
Cor
tical
Im
pact
-Ind
uced
Bra
in I
njur
y? (
doi:
10.1
089/
neu.
2012
.252
0)T
his
artic
le h
as b
een
peer
-rev
iew
ed a
nd a
ccep
ted
for
publ
icat
ion,
but
has
yet
to u
nder
go c
opye
ditin
g an
d pr
oof
corr
ectio
n. T
he f
inal
pub
lishe
d ve
rsio
n m
ay d
iffe
r fr
om th
is p
roof
.

24
24
Figure 7: Summary of peak strains for 12 CCI cases. For all CCI cases with various
impactor diameters and shapes, using Group 1 nonlinear, heterogeneous materials, CA3
experienced the highest strains. Meanwhile, different material laws (Group 1&4 vs.
Group2&3) affected peak strain magnitudes, with nonlinear material property
(MAT_77_O) induced high strains due to larger dynamic motion allowed for brain tissue.
DG: dentate gyrus.
Page 24 of 28
Jour
nal o
f N
euro
trau
ma
Why
is C
A3
Mor
e V
ulne
rabl
e th
an C
A1
in E
xper
imen
tal M
odel
s of
Con
trol
led
Cor
tical
Im
pact
-Ind
uced
Bra
in I
njur
y? (
doi:
10.1
089/
neu.
2012
.252
0)T
his
artic
le h
as b
een
peer
-rev
iew
ed a
nd a
ccep
ted
for
publ
icat
ion,
but
has
yet
to u
nder
go c
opye
ditin
g an
d pr
oof
corr
ectio
n. T
he f
inal
pub
lishe
d ve
rsio
n m
ay d
iffe
r fr
om th
is p
roof
.

25
25
Page 25 of 28
Jour
nal o
f N
euro
trau
ma
Why
is C
A3
Mor
e V
ulne
rabl
e th
an C
A1
in E
xper
imen
tal M
odel
s of
Con
trol
led
Cor
tical
Im
pact
-Ind
uced
Bra
in I
njur
y? (
doi:
10.1
089/
neu.
2012
.252
0)T
his
artic
le h
as b
een
peer
-rev
iew
ed a
nd a
ccep
ted
for
publ
icat
ion,
but
has
yet
to u
nder
go c
opye
ditin
g an
d pr
oof
corr
ectio
n. T
he f
inal
pub
lishe
d ve
rsio
n m
ay d
iffe
r fr
om th
is p
roof
.

26
26
Figure 8: Tissue strain histories in the hippocampus through the center of the impactor
and in a coronal section near the posterior (caudal) rim of the impactor. These time
histories were selected from 4 elements which experienced the highest strains during
CCI. Under different CCI loading conditions, peak strains occurred at different elements.
Page 26 of 28
Jour
nal o
f N
euro
trau
ma
Why
is C
A3
Mor
e V
ulne
rabl
e th
an C
A1
in E
xper
imen
tal M
odel
s of
Con
trol
led
Cor
tical
Im
pact
-Ind
uced
Bra
in I
njur
y? (
doi:
10.1
089/
neu.
2012
.252
0)T
his
artic
le h
as b
een
peer
-rev
iew
ed a
nd a
ccep
ted
for
publ
icat
ion,
but
has
yet
to u
nder
go c
opye
ditin
g an
d pr
oof
corr
ectio
n. T
he f
inal
pub
lishe
d ve
rsio
n m
ay d
iffe
r fr
om th
is p
roof
.

27
27
Figure 9: Ratio of CA3 strain over CA1 strain at impactor center and impactor caudal rim.
Page 27 of 28
Jour
nal o
f N
euro
trau
ma
Why
is C
A3
Mor
e V
ulne
rabl
e th
an C
A1
in E
xper
imen
tal M
odel
s of
Con
trol
led
Cor
tical
Im
pact
-Ind
uced
Bra
in I
njur
y? (
doi:
10.1
089/
neu.
2012
.252
0)T
his
artic
le h
as b
een
peer
-rev
iew
ed a
nd a
ccep
ted
for
publ
icat
ion,
but
has
yet
to u
nder
go c
opye
ditin
g an
d pr
oof
corr
ectio
n. T
he f
inal
pub
lishe
d ve
rsio
n m
ay d
iffe
r fr
om th
is p
roof
.
28
28
Table 1: Material constants for four groups.
Region
Group 1 Group 2 Group 3 Group 4
μ1 (Pa)
α1
G0 (Pa) G∞ (Pa)
beta (s^-1)
G0 (Pa)
G∞ (Pa)
beta (s^-1)
μ1 (Pa)
α1
CA1P 12.3 20.6 4060 1860 59.1
3568 1643 63.0 8.9 18.3
CA1SR 8.3 21.4 4060 1860 59.1
CA3P 9 15.9 3385 1587 58.6
CA3SR 8.1 15.7 3385 1587 58.6
Dentate Gyrus
8 14.3 2951 1320 81.1
Inner Cortex
10.8 17.3 2701 1362 52.5 2701 1362 52.5 10.8 17.3
Middle Cortex
9.9 16.4 2553 1261 51.5 2553 1261 51.5 9.9 16.4
Outer Cortex
7.4 19.7 3234 1620 63 3234 1620 63.0 7.4 19.7
G0
(Pa) G∞ (Pa)
beta (s^-1)
G0 (Pa)
G∞ (Pa)
beta (s^-1)
Thalamus 3082 1303 58.1 3082 1303 58.1 3082 1303 58.1 3082 1303 58.1
Alveus 3603 1256 115.1 3603 1256 115.1 3603 1256 115.1 3603 1256 115.1
Corpus Callosum
2399 950 68.5 2399 950 68.5 2399 950 68.5 2399 950 68.5
Brainstem 2549 940 84.9 2549 940 84.9 2549 940 84.9 2549 940 84.9
Cerebellum 2521 908 106.7 2521 908 106.7 2521 908 106.7 2521 908 106.7
Notes: P: pyramidal cells; SR: stratum radiatum
Page 28 of 28
Jour
nal o
f N
euro
trau
ma
Why
is C
A3
Mor
e V
ulne
rabl
e th
an C
A1
in E
xper
imen
tal M
odel
s of
Con
trol
led
Cor
tical
Im
pact
-Ind
uced
Bra
in I
njur
y? (
doi:
10.1
089/
neu.
2012
.252
0)T
his
artic
le h
as b
een
peer
-rev
iew
ed a
nd a
ccep
ted
for
publ
icat
ion,
but
has
yet
to u
nder
go c
opye
ditin
g an
d pr
oof
corr
ectio
n. T
he f
inal
pub
lishe
d ve
rsio
n m
ay d
iffe
r fr
om th
is p
roof
.