Who Will Prove Most Vulnerable to the Pullback in Liquidity?
10
Who Will Prove Most Vulnerable to the Pullback in Liquidity? As central banks wind down their quantitative easing, we see vulnerabilities in pockets of the equity market, especially in the US. OCTOBER 8, 2021 ERIN MILES JASON CHEAL © 2021 Bridgewater Associates, LP
-
Upload
khangminh22 -
Category
Documents
-
view
3 -
download
0
Transcript of Who Will Prove Most Vulnerable to the Pullback in Liquidity?
Who Will Prove Most Vulnerable to the Pullback in Liquidity?As central banks wind down their quantitative easing, we see vulnerabilities in pockets of the equity market, especially in the US.
OCTOBER 8, 2021
ERIN MILESJASON CHEAL
© 2021 Bridgewater Associates, LP

1© 2021 Bridgewater Associates, LP
With central banks around the world winding down quantitative easing, the extraordinary push of liquidity of the past two years is now set to wane. Most central banks intend only to lean
against the wind, pulling back gradually to ensure the recovery remains on stable footing. They may succeed, but that doesn’t mean that there won’t be vulnerable pockets in markets that start to feel the pinch of tightening long before the economic outlook begins to turn.
So, who will prove most vulnerable to the pullback in liquidity? While global equity markets are potentially vulnerable, US equities are particularly exposed. A decade of extremely easy liquidity has driven down discount rates, a mechanical support for equity market multiples that drove duration to secular highs. This poses a risk as rates begin to rise, especially for companies with very strong priced-in earnings growth and cash flows far in the future. Companies have also grown reliant on the ongoing flow of ample liquidity: a growing cohort is borrowing to deploy buybacks and support earnings-per-share, and a significant and growing tail of the market is cash flow negative and relying on ongoing new investments to finance their business. With less money flowing into the system, that funding will be harder to come by.
For many companies, ongoing strength in economic activity will be a support that counters the impact of tightening liquidity. We expect that to be particularly true in markets like Japan and Europe, which are comprised of more cyclical industries and have some of the post-COVID economic bounce still ahead. By comparison, we see more risks for the US market, which has benefited more significantly from ample liquidity in recent years, faces greater pressure to tighten given growing inflation risks, and is already through most of the post-COVID rebound.
The charts below show measures of the concepts we described for the US. As shown, the share of the US market that is highly exposed to liquidity has shot up in recent years, while the share highly exposed to growth has declined. A lot of this shift reflects the growing dominance of tech in the US.
...Highly Sensitive to Liquidity ...Highly Sensitive to Growth
Share of US Equities...
0%
10%
20%
30%
40%
50%
60%
70%
70 80 90 00 10 20
0%
10%
20%
30%
40%
50%
60%
70%
70 80 90 00 10 20
2© 2021 Bridgewater Associates, LP
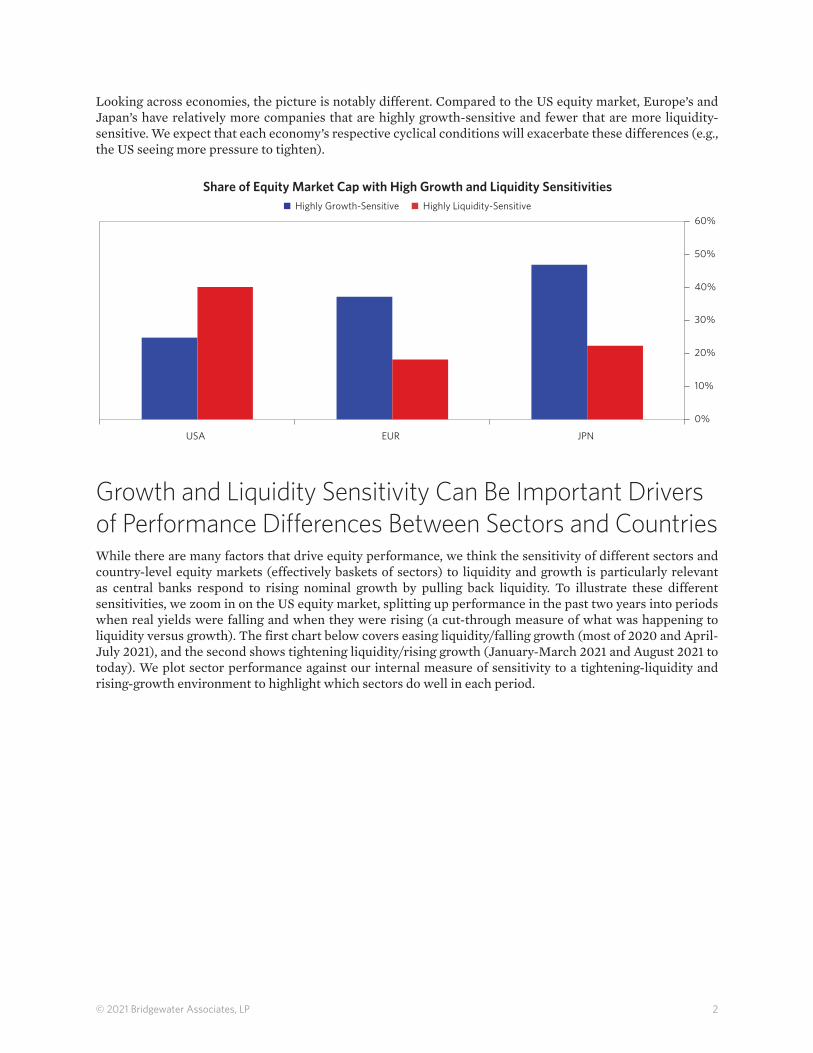
Looking across economies, the picture is notably different. Compared to the US equity market, Europe’s and Japan’s have relatively more companies that are highly growth-sensitive and fewer that are more liquidity-sensitive. We expect that each economy’s respective cyclical conditions will exacerbate these differences (e.g., the US seeing more pressure to tighten).
Share of Equity Market Cap with High Growth and Liquidity Sensitivities
0%
10%
20%
30%
40%
50%
60%
USA EUR JPN
Highly Growth-Sensitive Highly Liquidity-Sensitive
Growth and Liquidity Sensitivity Can Be Important Drivers of Performance Differences Between Sectors and CountriesWhile there are many factors that drive equity performance, we think the sensitivity of different sectors and country-level equity markets (effectively baskets of sectors) to liquidity and growth is particularly relevant as central banks respond to rising nominal growth by pulling back liquidity. To illustrate these different sensitivities, we zoom in on the US equity market, splitting up performance in the past two years into periods when real yields were falling and when they were rising (a cut-through measure of what was happening to liquidity versus growth). The first chart below covers easing liquidity/falling growth (most of 2020 and April-July 2021), and the second shows tightening liquidity/rising growth (January-March 2021 and August 2021 to today). We plot sector performance against our internal measure of sensitivity to a tightening-liquidity and rising-growth environment to highlight which sectors do well in each period.

3© 2021 Bridgewater Associates, LP
As shown, performance generally directionally aligned with what we would expect. In the major periods of falling real yields (generally periods of falling growth and rising liquidity), we saw tech sectors outperform and more cyclical sectors underperform.
Easy Liquidity/Falling Growth:Average US Monthly Sector Returns During Falling Real Yields (Past 2 Years)
-4%
-3%
-2%
-1%
0%
1%
2%
3%
4%
5%
6%
7%Sector Excess Returns
IT Manuf
Internet SvcsSoftware
Restaurants
Utilities Publishing
Semis Mining & Metals
ComputerSvcs
Food & Drug Retail
Chemicals
Construction
HH Durables
Oil
BanksHotels
Airlines
-2.0 -1.5 -1.0 -0.5 0.0 0.5 1.0 1.5 2.0 2.5Relatively better o�in tightening-liquidity + rising-growth environment
Relatively worse o�in tightening-liquidity + rising-growth environment
Low-duration cyclicals such as banks and resources sectors, as well as sectors hit hard by COVID, such as airlines and hotels,underperformed
Tech industries such as IT manufacturers,internet services, and software epitomize high-duration companies andstable earnings and have outperformed when yields have fallen over the past two years
Sector Exposure to a Tightening-Liquidity + Rising-Growth Environment
And then, during recent periods of rising real yields, performance looked like the mirror opposite.
Tightening Liquidity/Rising Growth:Average US Monthly Sector Returns During Rising Real Yields (Past 2 Years)
Sector Excess Returns
-2.0 -1.5 -1.0 -0.5 0.0 0.5 1.0 1.5 2.0 2.5Relatively better o in tightening-liquidity + rising-growth environment
Relatively worse o in tightening-liquidity + rising-growth environment
Meanwhile, low-duration cyclicals have benefited from rising earnings expectations and less discount ratedrag, and have outperformed
The same group oftech industries hasunderperformedduring periods of rising real yields in 2021
Sector Exposure to a Tightening-Liquidity + Rising-Growth Environment
-4%
-2%
0%
2%
4%
6%
8%
10%
IT Manuf
InternetSvcs
Software
Utilities
Publishing
Semis
ComputerSvcs
Food & Drug Retail
Broadcasting
IT Components
Business Svcs
ChemicalsConstruction
HH Durables
Retailers
Oil
Banks
Hotels
Airlines

4© 2021 Bridgewater Associates, LP
The Performance Difference Between US and Global Equities Has Increasingly Aligned with Relative Exposure to Growth and LiquidityThe differences in sectoral sensitivities to growth and liquidity inherently bubble up to differences in performance between equity markets at the country level. In the chart below, we show US performance relative to the rest of the developed world against our measure of liquidity (a combination of measures that assess pressure on rates, funding markets, etc.). The cross-country differences shown above really began growing substantially at the beginning of the last decade, when tech began its rise to dominance in the United States. This was roughly the same time that we started to see differential equity performance line up closely with swings in liquidity. This doesn’t mean that this was the only thing going on or that the same will necessarily be true looking ahead; relative conditions in each country often differ, investor flows swing one way or another, etc. Still, the recent relationship has been interesting and aligns with the relative exposure we see across these markets. In particular, in recent months, as markets have begun to process the higher likelihood of a pullback in liquidity, we have again seen the US start to underperform.
US vs Dev Wld ex-US Equity Returns (Y/Y) Liquidity Gauge
-4
-3
-2
-1
0
1
2
3
4
-40%
-30%
-20%
-10%
0%
10%
20%
30%
40%
1980 1990 2000 2010 2020
Relationship running ~40%correlation in period when US grewrelatively more liquidity-sensitiveand less growth-sensitive
Below, we describe what has driven the growing sensitivity of US equities to liquidity in more detail.

5© 2021 Bridgewater Associates, LP
The Decline in Discount Rates and Strong Growth Expec-tations Supported an Increase in Equity DurationToday, equity market duration—and thus, sensitivity to liquidity—is at highs last seen in the ’90s tech bubble. This in part reflects the fact that, over the past 20 years, secularly declining interest rates mechanically increased the value of corporate cash flows further in the future. In addition, low interest rates, ample liquidity, and limited alternatives supported a surge in market capitalization of innovative industries. The level of earnings growth expectations for the market as a whole today has increased substantially in recent years, further lengthening duration.
US Equity Duration (Years) US Real Long RatesAnalyst Long-Term US EPS
Growth Expectations
7
8
9
10
11
12
13
14
70 80 90 00 10 20-2%
-1%
0%
1%
2%
3%
4%
5%
6%
70 80 90 00 10 200%
5%
10%
15%
70 80 90 00 10 20
3

6© 2021 Bridgewater Associates, LP
US Companies Have Grown Increasingly Reliant on Liquidity to Fund Earnings-Per-Share GrowthOver the past decade, massive liquidity production has been enormously beneficial to US companies. Large companies changed their capital structure, issued debt, bought back their stock, and financed M&A, significantly boosting earnings-per-share growth. As shown on the left chart below, the share of US companies that have boosted earnings-per-share via buybacks has increased significantly in recent years. You can also see here that recent periods of tightening liquidity (2013 and 2018) drove brief pullbacks from this trend of rising buybacks.
In addition, liquidity has poured into innovative companies, many of which seek to “grow at all costs” and run significant cash flow deficits effectively financed by issuing equity. While these companies are still a relatively small share of the listed equity market (about 6%), their share has grown as they have increasingly gone public, and they represent a real vulnerability to the high-flying growth segment of the market.
Share of US Equities with HighBuyback Activity
Share of US Equities with OngoingFinancing Needs
0%
5%
10%
15%
20%
25%
30%
35%
70 80 90 00 10 200%
2%
4%
6%
8%
10%
12%
70 80 90 00 10 20

7© 2021 Bridgewater Associates, LP
US Equities Have Less Cyclical Upside in a Rising Nominal Growth Environment Today Relative to HistoryCorporate revenues in the US are also less likely to respond to stronger growth conditions today. Over the past decade, some of the sectors most exposed to rising nominal growth—such as resources and financials—have lost significant share, and tech companies have taken their place. Though tech company revenues are still cyclical, it’s not to the same degree.
US Market Cap Shares by SectorFinancialsResources Tech
Other Cyclicals Other Non-Cyclicals
0%
5%
10%
15%
20%
25%
30%
35%
40%
70 80 90 00 10 200%
5%
10%
15%
20%
25%
30%
35%
40%
70 80 90 00 10 20
0%
5%
10%
15%
20%
25%
30%
35%
40%
70 80 90 00 10 200%
5%
10%
15%
20%
25%
30%
35%
40%
70 80 90 00 10 20
0%5%10%15%20%25%30%35%40%45%
70 80 90 00 10 20

8© 2021 Bridgewater Associates, LP
In addition, over time the cyclicality of tech sales has declined. This reflects an underlying shift in the nature of tech businesses, with tech sales today increasingly composed of software and cloud products rather than electronic capital goods and intermediate inputs.
0%
2%
4%
6%
8%
10%
12%
14%
16%
70 80 90 00 10 20
Tech Sales VolatilityRolling 5yr
Long-Term Avg
Tech Sales BetaRolling 5yr (vs Market ex-Tech)
Long-Term Avg
0.0
0.5
1.0
1.5
2.0
2.5
3.0
70 80 90 00 10 20
Operating leverage is a significant driver of cyclical swings in earnings. The higher the level of margins, the lower the operating leverage effect. For instance, if you assume fully fixed costs, a 1% increase in sales translates to 10% earnings growth for a company with a 10% margin, while the same sales growth translates to 20% earnings growth for a company with a 5% margin. As shown in the chart on the left below, after 30 years of secularly increasing profit margins, the share of companies with low operating leverage now represents almost 40% of market capitalization. A significant degree of the secular increase in margins came from tech companies. This was both because their margins increased markedly (shown in the chart on the right) and because high-margin tech companies gained share.
Share of US Equities with LowOperating Leverage
Operating Margin Level (Smoothed)Non-Financials ex-Tech Tech
0%
10%
20%
30%
40%
50%
70 80 90 00 10 200%
4%
8%
12%
16%
20%
24%
70 80 90 00 10 20
US margins haveexpanded secularly,led by tech

9© 2021 Bridgewater Associates, LP
Important Disclosures and Other InformationThis research paper is prepared by and is the property of Bridgewater Associates, LP and is circulated for informational and educational purposes only. There is no consideration given to the specific investment needs, objectives or tolerances of any of the recipients. Additionally, Bridgewater’s actual investment positions may, and often will, vary from its conclusions discussed herein based on any number of factors, such as client investment restrictions, portfolio rebalancing and transactions costs, among others. Recipients should consult their own advisors, including tax advisors, before making any investment decision. This report is not an offer to sell or the solicitation of an offer to buy the securities or other instruments mentioned.
Bridgewater research utilizes data and information from public, private and internal sources, including data from actual Bridgewater trades. Sources include, the Australian Bureau of Statistics, Bloomberg Finance L.P., Capital Economics, CBRE, Inc., CEIC Data Company Ltd., Clarus Financial Technology, Conference Board of Canada, Consensus Economics Inc., Corelogic, Inc., CoStar Realty Information, Inc., CreditSights, Inc., Credit Market Analysis Ltd., Dealogic LLC, DTCC Data Repository (U.S.), LLC, Ecoanalitica, Energy Aspects, EPFR Global, Eurasia Group Ltd., European Money Markets Institute – EMMI, Evercore, Factset Research Systems, Inc., The Financial Times Limited, GaveKal Research Ltd., Global Financial Data, Inc., Harvard Business Review, Haver Analytics, Inc., The Investment Funds Institute of Canada, ICE Data Derivatives UK Limited, IHS Markit, Impact-Cubed, Institutional Shareholder Services, Informa (EPFR), Investment Company Institute, International Energy Agency (IEA), Investment Management Association, JP Morgan, Lipper Financial, Mergent, Inc., Metals Focus Ltd, Moody’s Analytics, Inc., MSCI, Inc., National Bureau of Economic Research, Organisation for Economic Cooperation and Development (OCED), Pensions & Investments Research Center, Qontigo GmbH, Quandl, Refinitiv RP Data Ltd, Rystad Energy, Inc., S&P Global Market Intelligence Inc., Sentix GmbH, Spears & Associates, Inc., State Street Bank and Trust Company, Sustainalytics, Totem Macro, United Nations, US Department of Commerce, Verisk-Maplecroft, Vigeo-Eiris (V.E), Wind Information(HK) Company, Wood Mackenzie Limited, World Bureau of Metal Statistics, and World Economic Forum. While we consider information from external sources to be reliable, we do not assume responsibility for its accuracy.
The views expressed herein are solely those of Bridgewater as of the date of this report and are subject to change without notice. Bridgewater may have a significant financial interest in one or more of the positions and/or securities or derivatives discussed. Those responsible for preparing this report receive compensation based upon various factors, including, among other things, the quality of their work and firm revenues.