X-ray Photoelectron Spectroscopic Study of Some Organic ...
24
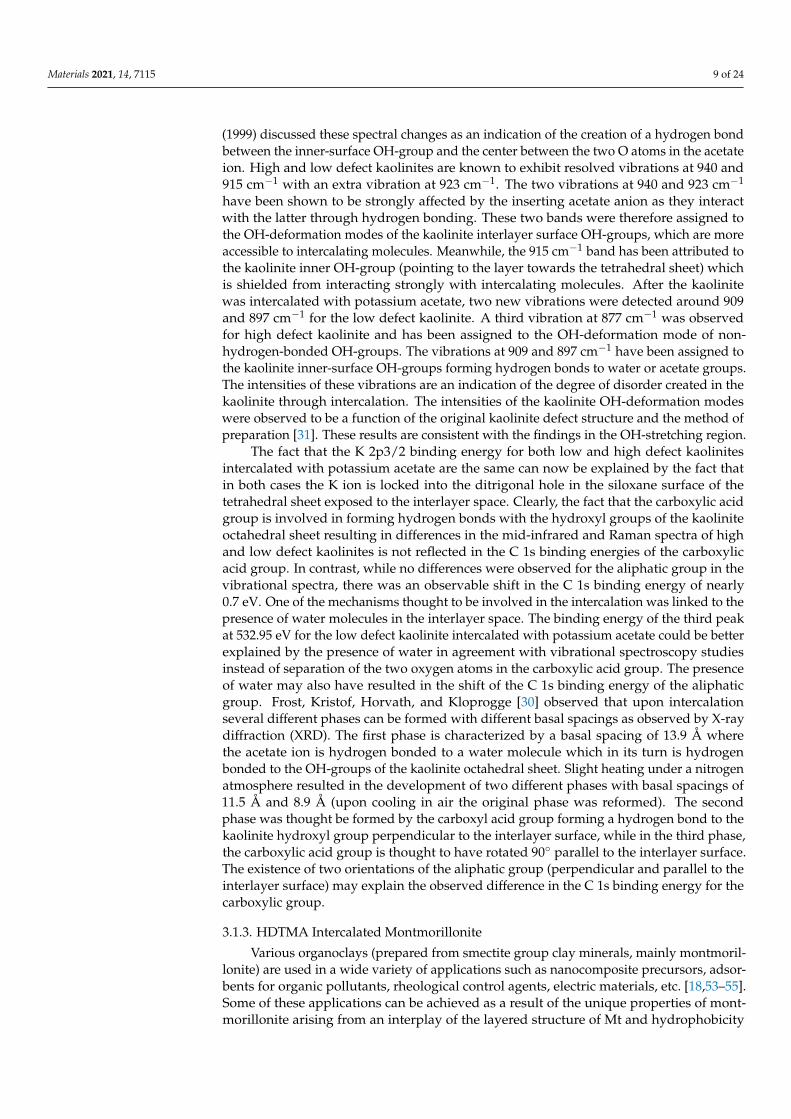
materials Article X-ray Photoelectron Spectroscopic Study of Some Organic and Inorganic Modified Clay Minerals † J. Theo Kloprogge 1,2 , Concepcion P. Ponce 2 and Danilo O. Ortillo 2, * Citation: Kloprogge, J.T.; Ponce, C.P.; Ortillo, D.O. X-ray Photoelectron Spectroscopic Study of Some Organic and Inorganic Modified Clay Minerals. Materials 2021, 14, 7115. https://doi.org/10.3390/ma14237115 Academic Editor: Myroslav Sprynskyy Received: 1 October 2021 Accepted: 18 November 2021 Published: 23 November 2021 Publisher’s Note: MDPI stays neutral with regard to jurisdictional claims in published maps and institutional affil- iations. Copyright: © 2021 by the authors. Licensee MDPI, Basel, Switzerland. This article is an open access article distributed under the terms and conditions of the Creative Commons Attribution (CC BY) license (https:// creativecommons.org/licenses/by/ 4.0/). 1 School of Earth and Environmental Sciences, The University of Queensland, Brisbane, QLD 4072, Australia; [email protected] 2 Department of Chemistry, College of Arts and Sciences, University of the Philippines Visayas, Miagao, Iloilo 5023, Philippines; [email protected] * Correspondence: [email protected]; Tel.: +63-9195735106 † This paper is dedicated to Barry J. Wood (25 May 2021), who for 50 years was the surface analysis/XPS specialist at the University of Queensland. Abstract: Layered clay systems intercalated with inorganic and organic compounds were analyzed to highlight how XPS can provide information on the different environments surrounding a partic- ular atom as well as provide discernments on the size, coordination, and structural and oxidative transformations of the intercalating/pillaring compounds. XPS data on the intercalation of urea and K-acetate in low- and high-defect kaolinite revealed the interaction of the intercalating group NH 2 with the siloxane functional groups in the interlayer surface. The intercalation of HDTMA in Mt demonstrated the use of XPS in monitoring the change in conformation assumed by alkylammonium intercalating compounds in Mt with increasing CEC. Studies on the pillaring of Mt by Al 13 and Ga 13 by XPS allowed determination of the coordination of the pillaring compound within the Mt layer. Lastly, the intercalation of hexacyanoferrate in hydrotalcite demonstrated the capability of XPS in following changes in the oxidation state of the iron compound. These were gleaned from interpretation of the shifts in binding energies and presence of multiplet splitting in the XPS of the component elements of the minerals or the intercalating compounds. Keywords: X-ray photoelectron spectroscopy; clay intercalation; pillared clays; kaolinite; montmoril- lonite; hydrotalcite 1. Introduction Clay minerals can host a large number of functional organic and inorganic systems through a process called intercalation. These intercalated systems can impart new and/or unique properties that afford wide ranging applications of these modified clay minerals in various fields such as in environmental remediation technologies [1]; cosmetics and pharmaceutical science [2]; material science [3]; carbon dioxide capture and storage [4]; and abiogenesis [5] to name a few. The driving forces of the intercalation process includes intermolecular forces of interactions between the clay mineral interlayer surfaces and the intercalating molecule (e.g., hydrogen-bonding, ion-dipole interactions, and van der Waals attractions) [6]. The formation of coordinate bonding can also drive intercalation as in the case with aniline intercalated in Ca 2+ , Cu 2+ , Fe 3+ -exchanged montmorillonite [7]. In some instances, the acid-base behavior of clay interlayer surfaces or the intercalating compound drives the intercalation process [8,9]. Understanding and control of the above-mentioned interactions of the clay minerals with the intercalating or with the pillaring compound relies on the researchers’ abilities to use innovative approaches in probing these interactions. Physicochemical characterizations of different types of intercalated and pillared clays have been carried out using various spectroscopic techniques to monitor insertion or in- tercalation of specific compounds into raw clays. Raman and FTIR techniques are widely available to probe the structure and structural changes in intercalated and pillared clay Materials 2021, 14, 7115. https://doi.org/10.3390/ma14237115 https://www.mdpi.com/journal/materials
-
Upload
khangminh22 -
Category
Documents
-
view
1 -
download
0
Transcript of X-ray Photoelectron Spectroscopic Study of Some Organic ...

materials
Article
X-ray Photoelectron Spectroscopic Study of Some Organic andInorganic Modified Clay Minerals †
J. Theo Kloprogge 1,2 , Concepcion P. Ponce 2 and Danilo O. Ortillo 2,*
�����������������
Citation: Kloprogge, J.T.; Ponce, C.P.;
Ortillo, D.O. X-ray Photoelectron
Spectroscopic Study of Some Organic
and Inorganic Modified Clay
Minerals. Materials 2021, 14, 7115.
https://doi.org/10.3390/ma14237115
Academic Editor:
Myroslav Sprynskyy
Received: 1 October 2021
Accepted: 18 November 2021
Published: 23 November 2021
Publisher’s Note: MDPI stays neutral
with regard to jurisdictional claims in
published maps and institutional affil-
iations.
Copyright: © 2021 by the authors.
Licensee MDPI, Basel, Switzerland.
This article is an open access article
distributed under the terms and
conditions of the Creative Commons
Attribution (CC BY) license (https://
creativecommons.org/licenses/by/
4.0/).
1 School of Earth and Environmental Sciences, The University of Queensland, Brisbane, QLD 4072, Australia;[email protected]
2 Department of Chemistry, College of Arts and Sciences, University of the Philippines Visayas, Miagao,Iloilo 5023, Philippines; [email protected]
* Correspondence: [email protected]; Tel.: +63-9195735106† This paper is dedicated to Barry J. Wood (25 May 2021), who for 50 years was the surface analysis/XPS
specialist at the University of Queensland.
Abstract: Layered clay systems intercalated with inorganic and organic compounds were analyzedto highlight how XPS can provide information on the different environments surrounding a partic-ular atom as well as provide discernments on the size, coordination, and structural and oxidativetransformations of the intercalating/pillaring compounds. XPS data on the intercalation of urea andK-acetate in low- and high-defect kaolinite revealed the interaction of the intercalating group NH2
with the siloxane functional groups in the interlayer surface. The intercalation of HDTMA in Mtdemonstrated the use of XPS in monitoring the change in conformation assumed by alkylammoniumintercalating compounds in Mt with increasing CEC. Studies on the pillaring of Mt by Al13 andGa13 by XPS allowed determination of the coordination of the pillaring compound within the Mtlayer. Lastly, the intercalation of hexacyanoferrate in hydrotalcite demonstrated the capability ofXPS in following changes in the oxidation state of the iron compound. These were gleaned frominterpretation of the shifts in binding energies and presence of multiplet splitting in the XPS of thecomponent elements of the minerals or the intercalating compounds.
Keywords: X-ray photoelectron spectroscopy; clay intercalation; pillared clays; kaolinite; montmoril-lonite; hydrotalcite
1. Introduction
Clay minerals can host a large number of functional organic and inorganic systemsthrough a process called intercalation. These intercalated systems can impart new and/orunique properties that afford wide ranging applications of these modified clay mineralsin various fields such as in environmental remediation technologies [1]; cosmetics andpharmaceutical science [2]; material science [3]; carbon dioxide capture and storage [4];and abiogenesis [5] to name a few. The driving forces of the intercalation process includesintermolecular forces of interactions between the clay mineral interlayer surfaces and theintercalating molecule (e.g., hydrogen-bonding, ion-dipole interactions, and van der Waalsattractions) [6]. The formation of coordinate bonding can also drive intercalation as in thecase with aniline intercalated in Ca2+, Cu2+, Fe3+-exchanged montmorillonite [7]. In someinstances, the acid-base behavior of clay interlayer surfaces or the intercalating compounddrives the intercalation process [8,9]. Understanding and control of the above-mentionedinteractions of the clay minerals with the intercalating or with the pillaring compound relieson the researchers’ abilities to use innovative approaches in probing these interactions.
Physicochemical characterizations of different types of intercalated and pillared clayshave been carried out using various spectroscopic techniques to monitor insertion or in-tercalation of specific compounds into raw clays. Raman and FTIR techniques are widelyavailable to probe the structure and structural changes in intercalated and pillared clay
Materials 2021, 14, 7115. https://doi.org/10.3390/ma14237115 https://www.mdpi.com/journal/materials

Materials 2021, 14, 7115 2 of 24
minerals through monitoring the characteristic vibrational frequencies of functional groupspresent and the changes they undergo [10,11]. For example, FTIR, in conjunction with dataon water vapor pressure dependence of d-spacing in Na- and Ca-montmorillonite (Mt), wasused to distinguish various hydration states of the Mt mineral [12]. The validation of theuse of FTIR vibrational frequencies to distinguish various hydrogen bonding environmentsin dry (0 W), 1 W, and 2 W interlayers in Mt provides a facile and accessible technique tounderstand the geochemical and technological reactions of water film-bearing Mt. Mid-IRand IR techniques were also used to probe the structural and surface properties of Mt modi-fied with organic compounds [11,13]. Slaný, Jankovic, and Madejová intercalated in Na-Mta series of primary alkylamines (C1-C19) and their ammonium salts [11]. Their results,especially those of the near-IR (NIR) vibrational frequencies, show that the head-groupstructure (e.g., NH2 or NH3
+) as well as the counterpart anions (chloride or the Mt layer)influenced the shape and position of the N-H vibrational frequencies as a consequence ofthe different H-bonding natures in the compounds studied [11]. They also showed that NIRvibrational frequencies are sensitive to the conformational changes of the alkylchains inthe Mt layer and were able to distinguish groups differing in the trans/gauche conformerratio [11]. Another technique used to study structural changes in clay minerals is X-raydiffraction (XRD). The technique is used to semi-quantitatively determine mineral contentand in particular changes in basal spacing, (d(001)), which is a measure of the size andorientation of the organic molecule or of the inorganic pillar in the interlayer space [14,15].Changes in d(001) of layered clays are often used to confirm successful intercalation oforganic compounds [11,16–18]. Basal spacing values were also employed to conjecture thatlong chain alkylammonium ions were packed as monolayer, bilayer, pseudotrimolecularlayer, or paraffin-type monolayer within 2:1 clay minerals [15]. While vibrational frequen-cies and X-ray diffraction techniques are undoubtedly efficient and accessible techniquesto probe the intercalation of inorganic and organic molecules in clays, x-ray photoelectronspectroscopy (XPS), also known as electron spectroscopy for chemical analysis (ESCA), is acomplementary technique that can be used to determine the chemical composition of thesemodified clay materials [19–26]. Though generally considered a surface analysis technique,more than 90% of the signal comes from the bulk of the sample analyzed, hence it makesit a strong potential analytical tool for the analysis of clay minerals that are generally inthe nanometer size range. High energy X-rays applied to the samples can initiate coreexcitations that can provide information about the structure and electronic properties oftransition in the intercalated and pillared clay catalysts. The technique had been applied tostudy the effects of an element’s oxidation state, type of bonding, coordination number,and nearest neighbors on its binding energies [22]. Several examples of these applicationsare enumerated below. Schampera et al. [25] presented the use of XPS to study the inter-calation of hexadecylpyridinium cation on bentonite clays and concluded that at smallsurfactant concentrations, the organic molecules are arranged as monolayers with the alkylchains parallel to the clay surface, whereas at higher surfactant concentrations the organicmolecules are more disorderly with some alkyl chains assuming a tilted orientation relativeto the surface. Raeburn, Ilton, and Veblen [27] used the technique along with factor analysisto quantitatively analyze the Fe(III)/ΣFe of biotite single crystals by monitoring the Fe 3pphotoelectron peak. XPS was also used to systematically determine the average oxidationstates of manganese in birnessites, layered minerals which have applications as catalystsin biomemitic water-oxidation processes [28]. Ilton et al., who conducted this study, haveshown that: (1) Mn 3p and Mn 3s lines are accurate in determining the oxidation stateregardless of Mn bonding environment of Mn; (2) the Mn 2p3/2 line is useful when fitparameters are fine tuned to the mineral/compound under study to address the sensitivityof the line to the Mn bonding environment; and (3) the accuracy of the Mn 3s multipletsplitting is questionable for birnessite contrary to its common use in establishing oxidationsates of Mn in monovalent oxides [28]. The effect of nearest neighbors on binding energieshas been explored by Gonzalez-Elipe et al. [29] by measuring the photoelectron bindingenergies of Si, O, Al, and Mg natural phyllosilicates with various degrees of isomorphic

Materials 2021, 14, 7115 3 of 24
substitution in either the octahedral or tetrahedral layers. When such substitutions inthe tetrahedral sheet result to an excess negative charge, the binding energies of AlT, Si,and O decrease in a linear fashion [29]. These few examples demonstrate that the localinformation provided by XPS cannot always be obtained by other techniques, such asRaman and infrared spectroscopy. This information may manifest as shifts in bindingenergy or as multiplet splitting due to slightly different environments around a particularatom. Despite providing researchers with a unique tool to directly study the chemistryat the surface of minerals, monitor interfacial interactions, and allow for a better under-standing of the local structures and changes in the mineral structures upon intercalationand pillaring, there are limited papers focusing on its applications beyond confirming thatintercalation/pillaring occurred.
In this study, XPS studies of selected 2-dimensional clay model systems are show-cased: urea and K-acetate intercalated kaolinite [30–33], hexadecyltrimethylammonium(HDTMA) intercalated montmorillonite [34–36], Al13 and Ga13-pillared montmorillonite,and hexacyanoferrate intercalated hydrotalcite as an example of a so-called intercalatedanionic clay [37–42]. These are all widely studied and are well suited to highlight how XPSreveal subtleties in the environments around the intercalating organic molecules or theinorganic pillaring agents since data on the widely used Raman, IR, and XRD techniquesare readily available for comparison.
2. Materials and Methods2.1. Urea and K-Acetate Intercalated Kaolinite
All chemicals used in this study were analytical grade unless otherwise stated. A lowdefect and a high defect kaolinite sample from Hungary, specifically from Kiralyhegy andSzeg, respectively, are reported in this paper. The urea intercalated kaolinite samples wereprepared by mixing 300 mg kaolinite with a 9.0 M urea aqueous solution at 65◦C for 80 h.Following the heating step, the excess solution was decanted and the intercalated waskaolinite removed from the remaining solution by centrifugation [32].
The potassium-acetate intercalated kaolinite was prepared by mixing 300 milligramsof kaolinite with 30 mL of 7.2 M saturated K-acetate solution and shaking for 80 h in aconstant temperature bath at ambient temperature and separated from the excess solutionas described above [43].
2.2. Hexadecyltrimethylammonium (HDTMA) Intercalated Montmorillonite
A montmorillonite (Mt) sample from Hebei province, China, was purified by sedimen-tation. This particular Mt sample has the general formula [Na0.05Ca0.18Mg0.10][Al1.58Fe0.03-Mg0.39][Si3.77Al0.23]O10(OH)2·nH2O. Only the <2-µm fraction was collected and dried at90 ◦C. The Mt was ground and sieved through 200 mesh and sealed in a glass tube foruse. This Mt has a 57.9 meq/100 g cation exchange capacity (CEC). Hexadecyltrimethy-lammonium bromide (HDTMABr) with a purity of 99% from YuanJu Chem. Co., China,was used without any further purification as the surfactant to intercalate the Mt with.First, an Na-exchanged montmorillonite (Na–Mt) was prepared by mixing 9.4 g Mt and0.6 g Na2CO3 in 100 mL of deionized water and stirring at 80 ◦C for 3 h. Then, the result-ing Na–Mt was separated by centrifugation and washed with deionized water until thepH of the solution was 7. The Na–Mt was dried at 105 ◦C, ground and sieved through200 mesh and stored in a sealed bottle. The intercalation of the Mt was performed byfirstly suspending 2.5 g of Na–Mt in about 300 mL of deionized water followed by the slowaddition of the desired amount of HDTMABr. The concentrations of HDTMA+ used wereequivalent to 0.5 CEC, 0.7 CEC, 1.0 CEC, 1.5 CEC, 2.0 CEC, and 2.5 CEC of Mt, respectively.Samples are labeled as 0.5CEC-Mt, 0.7CEC-Mt, etc. The reaction mixtures were stirred for10 h at 80 ◦C. All intercalated Mt were washed free of Br− anions (tested by AgNO3) usingdeionized water, dried at 90 ◦C, and ground in an agate mortar [34].

Materials 2021, 14, 7115 4 of 24
2.3. Pillared Clays
Na–Mt SWy-2 from the Source Clay Repository of the Clay Mineral Society wassubjected to gravity sedimentation and decantation to obtain < 2 µm fractions thenwashed 4 times with 1 M NaCl solution. The excess electrolyte was then removedby washing five times with deionized water. Meanwhile, aluminum tridecamer, Al13[(AlO4Al12(OH)24(H2O)12)7+], solutions were prepared as follows: 0.2 M Na OH (MerckKGaA, Darmstadt, Germany) solution was injected at a rate of 0.015 mL/s using a Gilsonpump (capillary diameter of 0.5 mm) below the surface of an 0.5 M Al(NO3)3 (MerckKGaA, Darmstadt, Germany) solution, while vigorously stirring until the OH/Al molarratio was 2.4. These solutions, which comprised approximately 70% Al13 polymer [44],were then rapidly added under vigorous stirring to specified volumes of clay suspensionscontaining 20 g of solid/l to attain ratios of 5.5 and 20 meq Al/ g clay. Ion exchange wascontinued for 12 h after which the intercalated clays were washed five times with deionizedwater, followed by air- or freeze-drying and calcination at 973 K to obtain the final pillaredclay [42].
The preparation of Al12Ga-pillared clay and Ga13-pillared clay employed Miles Mt(Miles, Queensland, Australia) and followed a procedure analogous to that of the Al13-pillared clay. First, a 0.1 M solution of NaOH was pumped peristaltically at a rate of0.01 mL/min to a vigorously stirred Ga(NO3)3 (Merck, KGaA, Darmstadt, Germany) atambient temperature. The ratio of OH/Ga in the prepared solution was 2:1. The Al12Gaand Ga13 solutions were then added to the aqueous Mt suspensions under continuousstirring for 4 h and then allowed to stand for 5 days. The intercalated clays were washed5 times with deionized water and separated using a centrifuge. The solids were subse-quently dried in air at ambient temperature. Finally, the samples were heated at 2 K/minand calcined at 723 K for 8 h to obtain the final pillared clay [39].
2.4. Hexacyanoferrate Intercalated Hydrotalcite
Hexacyanoferrate intercalated hydrotalcite was prepared following the proceduredescribed by Frost et al. [37]. Briefly, aluminum and magnesium nitrates were dissolvedin freshly decarbonated water to obtain a final concentration of [Al3+] = 0.25 M and[Mg2+] = 0.75 M. The mixed solution was purged with N2 for 20 min. In another vessel, amixture of sodium hydroxide ([OH−] = 2 M) and the desired anion (hexacyanoferrate(II),[Fe(CN)6]4−, and hexacyanoferrate(III), [Fe(CN)6]3−), at the appropriate concentrationwere prepared and concurrently purged with N2 for 20 min as the cationic mixture (allcompounds used were obtained from Merck KGaA, Darmstadt, Germany). The cationicsolution was pumped peristaltically to the anions at 40 mL/min. The pH of the mixturewas maintained above 9 with the addition of 0.1M NaOH. The precipitate was then aged at75 ◦C for 18 h under a N2 atmosphere and subsequently washed thoroughly with ambienttemperature decarbonated water to dissolve remaining nitrates and dried in a vacuumdesiccator for several days [37].
2.5. X-ray Photoelectron Spectroscopy (XPS)
The XPS spectra were collected using a Kratos AXIS Ultra (Kratos Analytical, Manch-ester, U.K.) equipped with a monochromatic 225 W Al X-ray source under ultrahighvacuum conditions. Preliminary scans were performed with instrument set at 0 to 1200 eVsurvey scan, dwell time of 100 milliseconds, pass energy of 160 eV, and step size of 1 eVwith 1 sweep. High resolution analyses were then performed by increasing the number ofsweeps, lowering the pass energy to 20 eV at steps of 100 meV and increasing the dwelltime to 250 milliseconds. The adventitious C 1s C-C peak at 284.8 eV was used to chargecorrect all spectra.

Materials 2021, 14, 7115 5 of 24
3. Results and Discussion3.1. Clays Intercalated with Organic Molecules
Kaolinite has frequently been depicted as a clay mineral that has a low capacityto expand, contrary to the swellable 2:1 clay minerals—smectites, which include mont-morillonite, saponite, etc. Its crystal structure can be described as a repetition of layerscomprising a single Al(O2OH) octahedral sheet attached to a single SiO4 tetrahedral sheet.Within this layer structure, four different OH-groups in the octahedral sheet are present.Three of these OH-groups point out of the layer’s octahedral sheet and form hydrogenbonds with the next layer’s siloxane surface of the tetrahedral sheet. These OH-groups arecalled the inner surface (or on occasion called outer) OH-groups. The last OH-group isoriented into the free space between the tetrahedral and octahedral sheets and is calledthe inner OH-group. Currently, various organic molecules such as urea (NH2-C=O-NH2)and potassium acetate (K-CH3CO2) have been identified with suitable proportions andbonding characteristics that can be intercalated in the kaolinite interlayer space. Inter-calation of these molecules can occur through various mechanisms contingent upon thelocations of the interactions between the organic molecule and the kaolinite interlayersurfaces. The reactive organic guest molecule penetrates into the interlayer space betweenadjacent kaolinite layers. This disrupts the hydrogen bonds between the inner-surfaceOH-groups of the Al octahedral sheet and the oxygen atoms of the Si tetrahedral sheet.The intercalated organic molecule can then interact through hydrogen bonding with themore hydrophobic siloxane surface and/or with the more hydrophilic OH-groups of theoctahedral sheet. Much of these interactions in intercalated structures have been elucidatedby mid-infrared and Raman spectroscopy (see refs. [11,33,45–47]), but XPS can potentiallyprovide additional information.
3.1.1. Urea Intercalated Kaolinite
Urea, CO(NH2)2, is an amide with two –NH2 groups joined by a carbonyl functionalgroup. In its pure form, urea is characterized by a single C 1s peak and a single N 1s peakas both NH2 groups are identical. For poly(urea) the C=O C 1s peak has been observed atbinding energy (BE) = 288.8 eV and the N 1s at 399.9 eV [48].
The XPS survey scan of urea intercalated Szeg kaolinite is characterized by the Aland Si peaks associated with the kaolinite structure in addition to a complex C 1s andN 1s of the intercalated urea (Figure 1). Only a single C 1s peak and no N 1s peak wasobserved for pure kaolinite [47,49]. The N 1s high resolution spectrum of the intercalatedurea is characterized by a strong single peak at BE = 400.31 eV with a minor peak at398.54 eV which is probably related to a small amount of urea adsorbed on the Szegkaolinite crystal’s external surface (Figure 2a). In comparison, the intercalated N 1s peak forthe Kiralyhegy kaolinite was observed at a slightly lower binding energy of 399.93 eV. TheC 1s high resolution spectrum consists of several peaks (Figure 2b). The peak at 289.67 eVis associated with the intercalated urea, while a second peak at a slightly lower bindingenergy of 288.61 eV is probably related to the urea adsorbed on the external surface. Thepeaks at ca. 284.8 and 286.3 are due to adventitious C 1s C-C peak present in all surfaces.For the Kiralyhegy kaolinite, the urea C 1s peaks were observed at 0.1 eV higher bindingenergies. The kaolinite layer structure shows minor effects because of the intercalation. TheAl 2p3/2 shifts from 74.53 eV to 74.67 eV which is basically within the experimental errorof the XPS instrument. In contrast, the Si 2p3/2 shows a larger shift upon intercalationfrom 102.76 eV to 100.34 eV. Interestingly, this is opposite to what one would expect basedon earlier infrared and Raman spectroscopic results which indicates a hydrogen bond ofthe C=O with the OH-groups of the octahedral sheet where the Al is located and there isonly minor interaction with the siloxane surface [50].

Materials 2021, 14, 7115 6 of 24Materials 2021, 14, x FOR PEER REVIEW 6 of 24
Figure 1. XPS survey scan between 1200 and 0 eV of (top) Szeg kaolinite and (bottom) urea intercalated Szeg kaolinite
showing beside the Al and Si peaks of the kaolinite a complex C 1s and N 1S of the intercalated urea in the bottom figure.
Al 2p
Si 2s
Al 2s
Si 2p
O 1s
C 1s
O Auger
Arb
itrary U
nit
s
1200 900 600 300 0
Binding Energy (eV)
Al 2p
Si 2p
Al 2s
Si 2s
C 1s
N 1s
O 1s
Arb
itra
ry U
nit
s
1200 900 600 300Binding Energy (eV)
Figure 1. XPS survey scan between 1200 and 0 eV of (top) Szeg kaolinite and (bottom) urea intercalated Szeg kaoliniteshowing beside the Al and Si peaks of the kaolinite a complex C 1s and N 1S of the intercalated urea in the bottom figure.

Materials 2021, 14, 7115 7 of 24Materials 2021, 14, x FOR PEER REVIEW 7 of 24
(a) (b)
Figure 2. XPS high resolution spectra of intercalated Szeg kaolinite (a) N 1s and (b) C 1s showing both intercalated and
adsorbed urea peaks. The XPS high resolution spectra of Kiralyhegy kaolinite show similar features and are not shown
here.
Ledoux and White [12] have used IR techniques in probing the interactions of inter-
calated urea with functional groups in kaolinite. They have suggested that urea interacted
with inner-surface OH-groups. They studied the possible orientations of the transition
moments in intercalated urea molecules by looking at the IR pleochroism of urea interca-
lated kaolinite after heating at 110 °C for 5 h. A one-dimensional Fourier-projection of the
urea intercalated kaolinite indicated an alignment of the intercalated urea molecules with
one NH2 group located near the siloxane surface O atoms and the remaining NH2 and CO
groups were in the vicinity of the inner-surface OH-groups. As a result, the urea interca-
lated in kaolinite now has NH2 groups in different environments.
The splitting of the Raman band at 3620 cm−1 (assigned to the inner OH-stretching
vibration) into two separate vibrations at 3615 and 3621 cm−1, which was observed when
Frost et al. [1] cooled urea-intercalated kaolinite to −196 °C, strongly indicated two differ-
ent types of interactions of urea. One is the formation of hydrogen bonds between the C=O
group and the inner surface OH-groups and another is between the NH2 groups with the
tetrahedral sheet’s siloxane surface; the other NH2 group remained free, supporting the
observations by Ledoux and White [12]. It is also possible that the vibration at 3620 cm−1
at ambient temperature was a result of a strong overlap of the vibrations of the inner OH-
group and of the C=O which is hydrogen bonded with the inner-surface OH-group. An-
other explanation is supported by the observed C-N stretching region, where the vibration
at 1009 cm−1 at ambient temperature moved to 1014 cm−1 together with a broad shoulder
at 1004 cm−1 upon decreasing the temperature to −196 °C. This is indicative of two different
NH2 groups in the urea molecule after intercalation. Thus, Frost et al. [1] posited that at
ambient temperature, the urea only formed a bond to the siloxane surface. When the tem-
perature was decreased to −196 °C, the C=O group of the urea and the OH-groups moved
so close to each other that they were able to form a new hydrogen bond. Based on this
information, it can be concluded that the observation of two different environments for
the NH2 groups in the intercalated kaolinite is not large enough to be observed in the N
1s high resolution spectrum, although the influence of the NH2 group on the siloxane layer
may explain the shift in the Si 2p3/2 by around 2 eV.
3.1.2. K-Acetate Intercalated Kaolinite
Potassium acetate (CH3COOK), the potassium salt of acetic acid, is a hygroscopic
solid at 273 K. XPS analysis of acetic acid adsorbed on ice by Křepelová, Bartels-Rausch,
Brown, Bluhm, and Ammann [23] showed the C 1s of the CH3 group at 285.5 eV and the
COO- group at 289. 3 eV, while the two O 1s peaks were observed at 532.3 and 533.7 eV.
N-C=O adsorbed
N-C=O intercalated
Arb
itra
ry U
nit
s
404 402 400 398 396
Binding Energy (eV)
intercalatedN-C=O
N-C=O adsorbed
Arb
itra
ry U
nit
s
294 291 288 285 282
Binding Energy (eV)
Figure 2. XPS high resolution spectra of intercalated Szeg kaolinite (a) N 1s and (b) C 1s showing both intercalated andadsorbed urea peaks. The XPS high resolution spectra of Kiralyhegy kaolinite show similar features and are not shown here.
Ledoux and White [12] have used IR techniques in probing the interactions of interca-lated urea with functional groups in kaolinite. They have suggested that urea interactedwith inner-surface OH-groups. They studied the possible orientations of the transitionmoments in intercalated urea molecules by looking at the IR pleochroism of urea inter-calated kaolinite after heating at 110 ◦C for 5 h. A one-dimensional Fourier-projection ofthe urea intercalated kaolinite indicated an alignment of the intercalated urea moleculeswith one NH2 group located near the siloxane surface O atoms and the remaining NH2and CO groups were in the vicinity of the inner-surface OH-groups. As a result, the ureaintercalated in kaolinite now has NH2 groups in different environments.
The splitting of the Raman band at 3620 cm−1 (assigned to the inner OH-stretchingvibration) into two separate vibrations at 3615 and 3621 cm−1, which was observed whenFrost et al. [1] cooled urea-intercalated kaolinite to −196 ◦C, strongly indicated two differ-ent types of interactions of urea. One is the formation of hydrogen bonds between the C=Ogroup and the inner surface OH-groups and another is between the NH2 groups with thetetrahedral sheet’s siloxane surface; the other NH2 group remained free, supporting theobservations by Ledoux and White [12]. It is also possible that the vibration at 3620 cm−1
at ambient temperature was a result of a strong overlap of the vibrations of the innerOH-group and of the C=O which is hydrogen bonded with the inner-surface OH-group.Another explanation is supported by the observed C-N stretching region, where the vi-bration at 1009 cm−1 at ambient temperature moved to 1014 cm−1 together with a broadshoulder at 1004 cm−1 upon decreasing the temperature to −196 ◦C. This is indicative oftwo different NH2 groups in the urea molecule after intercalation. Thus, Frost et al. [1]posited that at ambient temperature, the urea only formed a bond to the siloxane surface.When the temperature was decreased to −196 ◦C, the C=O group of the urea and theOH-groups moved so close to each other that they were able to form a new hydrogenbond. Based on this information, it can be concluded that the observation of two differentenvironments for the NH2 groups in the intercalated kaolinite is not large enough to beobserved in the N 1s high resolution spectrum, although the influence of the NH2 groupon the siloxane layer may explain the shift in the Si 2p3/2 by around 2 eV.
3.1.2. K-Acetate Intercalated Kaolinite
Potassium acetate (CH3COOK), the potassium salt of acetic acid, is a hygroscopicsolid at 273 K. XPS analysis of acetic acid adsorbed on ice by Krepelová, Bartels-Rausch,Brown, Bluhm, and Ammann [23] showed the C 1s of the CH3 group at 285.5 eV and theCOO- group at 289. 3 eV, while the two O 1s peaks were observed at 532.3 and 533.7 eV.Comparable results were published by Kong et al. [51] for sodium acetate, but with only asingle O 1s peak for COO− at 531.5 eV. The low defect kaolinite from Kiralyhegy and the

Materials 2021, 14, 7115 8 of 24
high defect kaolinite from Szeg show increased C 1s peaks and the appearance of K 2p andK 2s peaks after intercalation with K-acetate survey scans. For the Kiralyhegy kaolinite, K2p3/2 was observed at 292.62 eV with the C 1s for CH3 at 285.79 eV and COO− at 288.10 eV(Figure 3). The O 1s clearly showed the presence of two peaks at 530.92 eV and 532.11 eVcompared with one peak at 531.93 eV for pure Kiralyhegy kaolinite.
Materials 2021, 14, x FOR PEER REVIEW 8 of 24
Comparable results were published by Kong et al. [51] for sodium acetate, but with only
a single O 1s peak for COO− at 531.5 eV. The low defect kaolinite from Kiralyhegy and the
high defect kaolinite from Szeg show increased C 1s peaks and the appearance of K 2p
and K 2s peaks after intercalation with K-acetate survey scans. For the Kiralyhegy kaolin-
ite, K 2p3/2 was observed at 292.62 eV with the C 1s for CH3 at 285.79 eV and COO− at
288.10 eV (Figure 3). The O 1s clearly showed the presence of two peaks at 530.92 eV and
532.11 eV compared with one peak at 531.93 eV for pure Kiralyhegy kaolinite.
(a) (b)
Figure 3. High resolutions XPS spectra of potassium-intercalated Kiralyhegy kaolinite showing (a) C 1s and K 2p and (b)
O 1s.
Both the Si 2p3/2 and Al 2p3/2 are slightly shifted (less than 0.2 eV) to lower binding
energies but the difference is so small that it is within the experimental error of the XPS
instrument. For the Szeg kaolinite, the K 2p3/2 was observed at 292.61 eV with the C 1s
for the CH3 group at 285.11 eV and for the COO- group at 288.15 eV. The O 1s clearly
showed the presence of a strong peak at 530.90 eV and two weak peaks at 532.0.6 and
532.95 eV compared with one peak at 531.78 eV for pure Szeg kaolinite. Both the Si 2p3/2
and Al 2p3/2 exhibited any shift upon intercalation. The difference between high defect
(Kiralyhegy) and low defect (Szeg) kaolinite on the intercalation of potassium acetate re-
sults in some differences in the binding energies of the elements of the potassium acetate.
The K 2p3/2 is not affected by the difference in kaolinite defect structure as well as the C
1s for the carboxylic acid group. The aliphatic group however is showing a difference in
binding energy of 0.68 eV. The other difference is observed in the O 1s where there are
only two peaks present in the intercalated high defect kaolinite and three peaks in the
intercalated low defect kaolinite. The main peak at 530.9 eV is related to the O 1s of the
kaolinite structure and is shifted by about 1 eV compared with the pure kaolinites. The
low defect kaolinite structure seems to result in a better ordering of the potassium acetate
in the interlayer space allowing to observe the two oxygen atoms in the carboxylic acid
group separately.
The intercalation of kaolinite with potassium acetate has been extensively studied by
infrared and Raman spectroscopy [50]. Intercalation with potassium acetate produced a
new Raman active vibration at 3605 cm−1. There was no observable change in intensity in
the stretching vibration assigned to the inner OH-, but a substantial broadening was ob-
served relative to the starting kaolinite. It is conceivable that the K cation has the right size
to occupy the ditrigonal hole of the siloxane sheet (tetrahedral sheet) of the kaolinite, thus
affecting the polarization of the inner OH-groups [52]. The vibrations attributed to the
inner-surface OH-groups strongly decreased in intensity after intercalation with potas-
sium acetate pointing to the formation of hydrogen bonds with the carboxylic acid group
C 1s COO
C 1s CH3
K 2p3/2
K 2p1/2
x 102
10
20
30
40
50
60
CP
S
296 292 288 284 280
Binding Energy (eV)
O 1s COO
O 1s kaolinitex 10
3
2
4
6
8
10
CP
S
537 534 531 528
Binding Energy (eV)
Figure 3. High resolutions XPS spectra of potassium-intercalated Kiralyhegy kaolinite showing (a) C 1s and K 2p and(b) O 1s.
Both the Si 2p3/2 and Al 2p3/2 are slightly shifted (less than 0.2 eV) to lower bindingenergies but the difference is so small that it is within the experimental error of the XPSinstrument. For the Szeg kaolinite, the K 2p3/2 was observed at 292.61 eV with the C1s for the CH3 group at 285.11 eV and for the COO- group at 288.15 eV. The O 1s clearlyshowed the presence of a strong peak at 530.90 eV and two weak peaks at 532.0.6 and532.95 eV compared with one peak at 531.78 eV for pure Szeg kaolinite. Both the Si 2p3/2and Al 2p3/2 exhibited any shift upon intercalation. The difference between high defect(Kiralyhegy) and low defect (Szeg) kaolinite on the intercalation of potassium acetateresults in some differences in the binding energies of the elements of the potassium acetate.The K 2p3/2 is not affected by the difference in kaolinite defect structure as well as theC 1s for the carboxylic acid group. The aliphatic group however is showing a differencein binding energy of 0.68 eV. The other difference is observed in the O 1s where there areonly two peaks present in the intercalated high defect kaolinite and three peaks in theintercalated low defect kaolinite. The main peak at 530.9 eV is related to the O 1s of thekaolinite structure and is shifted by about 1 eV compared with the pure kaolinites. Thelow defect kaolinite structure seems to result in a better ordering of the potassium acetatein the interlayer space allowing to observe the two oxygen atoms in the carboxylic acidgroup separately.
The intercalation of kaolinite with potassium acetate has been extensively studied byinfrared and Raman spectroscopy [50]. Intercalation with potassium acetate produced anew Raman active vibration at 3605 cm−1. There was no observable change in intensityin the stretching vibration assigned to the inner OH-, but a substantial broadening wasobserved relative to the starting kaolinite. It is conceivable that the K cation has the rightsize to occupy the ditrigonal hole of the siloxane sheet (tetrahedral sheet) of the kaolinite,thus affecting the polarization of the inner OH-groups [52]. The vibrations attributedto the inner-surface OH-groups strongly decreased in intensity after intercalation withpotassium acetate pointing to the formation of hydrogen bonds with the carboxylic acidgroup of the acetate ion. The mid-infrared spectrum of potassium acetate intercalatedkaolinite showed a comparable but distinctly weaker and broader vibration. Frost et al.
Materials 2021, 14, 7115 9 of 24
(1999) discussed these spectral changes as an indication of the creation of a hydrogen bondbetween the inner-surface OH-group and the center between the two O atoms in the acetateion. High and low defect kaolinites are known to exhibit resolved vibrations at 940 and915 cm−1 with an extra vibration at 923 cm−1. The two vibrations at 940 and 923 cm−1
have been shown to be strongly affected by the inserting acetate anion as they interactwith the latter through hydrogen bonding. These two bands were therefore assigned tothe OH-deformation modes of the kaolinite interlayer surface OH-groups, which are moreaccessible to intercalating molecules. Meanwhile, the 915 cm−1 band has been attributed tothe kaolinite inner OH-group (pointing to the layer towards the tetrahedral sheet) whichis shielded from interacting strongly with intercalating molecules. After the kaolinitewas intercalated with potassium acetate, two new vibrations were detected around 909and 897 cm−1 for the low defect kaolinite. A third vibration at 877 cm−1 was observedfor high defect kaolinite and has been assigned to the OH-deformation mode of non-hydrogen-bonded OH-groups. The vibrations at 909 and 897 cm−1 have been assigned tothe kaolinite inner-surface OH-groups forming hydrogen bonds to water or acetate groups.The intensities of these vibrations are an indication of the degree of disorder created in thekaolinite through intercalation. The intensities of the kaolinite OH-deformation modeswere observed to be a function of the original kaolinite defect structure and the method ofpreparation [31]. These results are consistent with the findings in the OH-stretching region.
The fact that the K 2p3/2 binding energy for both low and high defect kaolinitesintercalated with potassium acetate are the same can now be explained by the fact thatin both cases the K ion is locked into the ditrigonal hole in the siloxane surface of thetetrahedral sheet exposed to the interlayer space. Clearly, the fact that the carboxylic acidgroup is involved in forming hydrogen bonds with the hydroxyl groups of the kaoliniteoctahedral sheet resulting in differences in the mid-infrared and Raman spectra of highand low defect kaolinites is not reflected in the C 1s binding energies of the carboxylicacid group. In contrast, while no differences were observed for the aliphatic group in thevibrational spectra, there was an observable shift in the C 1s binding energy of nearly0.7 eV. One of the mechanisms thought to be involved in the intercalation was linked to thepresence of water molecules in the interlayer space. The binding energy of the third peakat 532.95 eV for the low defect kaolinite intercalated with potassium acetate could be betterexplained by the presence of water in agreement with vibrational spectroscopy studiesinstead of separation of the two oxygen atoms in the carboxylic acid group. The presenceof water may also have resulted in the shift of the C 1s binding energy of the aliphaticgroup. Frost, Kristof, Horvath, and Kloprogge [30] observed that upon intercalationseveral different phases can be formed with different basal spacings as observed by X-raydiffraction (XRD). The first phase is characterized by a basal spacing of 13.9 Å wherethe acetate ion is hydrogen bonded to a water molecule which in its turn is hydrogenbonded to the OH-groups of the kaolinite octahedral sheet. Slight heating under a nitrogenatmosphere resulted in the development of two different phases with basal spacings of11.5 Å and 8.9 Å (upon cooling in air the original phase was reformed). The secondphase was thought be formed by the carboxyl acid group forming a hydrogen bond to thekaolinite hydroxyl group perpendicular to the interlayer surface, while in the third phase,the carboxylic acid group is thought to have rotated 90◦ parallel to the interlayer surface.The existence of two orientations of the aliphatic group (perpendicular and parallel to theinterlayer surface) may explain the observed difference in the C 1s binding energy for thecarboxylic group.
3.1.3. HDTMA Intercalated Montmorillonite
Various organoclays (prepared from smectite group clay minerals, mainly montmoril-lonite) are used in a wide variety of applications such as nanocomposite precursors, adsor-bents for organic pollutants, rheological control agents, electric materials, etc. [18,53–55].Some of these applications can be achieved as a result of the unique properties of mont-morillonite arising from an interplay of the layered structure of Mt and hydrophobicity

Materials 2021, 14, 7115 10 of 24
of an intercalated surfactant. Intercalation of a hydrophobic surfactant brings about anexpansion of the interlayer space of the clay minerals. Numerous studies have shown thatthe d-spacings, which is a direct measure of the distance between the two siloxane surfacesin the interlayer space, of the organoclays depends on how long the alkyl chains and howpacked the surfactants are within the interlayer space of clay minerals (see, e.g., [56–58]).The XPS survey scan is characterized by the peaks associated with N 1s, C 1s and Br 3s, Br3p, and Br 3d (Figure 4). The high resolution scans show a single N 1s peak with a bindingenergy of 402.06 and two major C 1s peaks at 284.8 eV associated with the C-C bonds and285.75 eV associated with the 4 C-N carbon atoms with a ratio of 77 to 23 atom%, which isclose to the theoretical ratio of 79 to 21 atom%. The Br 3d shows not one but two differentBr- environments. Most of the Br- has a Br 3d5/2 binding energy of 67.19 eV, while a smallamount has a slightly higher binding energy of 68.10 eV
Materials 2021, 14, x FOR PEER REVIEW 10 of 24
55]. Some of these applications can be achieved as a result of the unique properties of
montmorillonite arising from an interplay of the layered structure of Mt and hydrophobi-
city of an intercalated surfactant. Intercalation of a hydrophobic surfactant brings about
an expansion of the interlayer space of the clay minerals. Numerous studies have shown
that the d-spacings, which is a direct measure of the distance between the two siloxane
surfaces in the interlayer space, of the organoclays depends on how long the alkyl chains
and how packed the surfactants are within the interlayer space of clay minerals (see, e.g.,
[56–58]). The XPS survey scan is characterized by the peaks associated with N 1s, C 1s and
Br 3s, Br 3p, and Br 3d (Figure 4). The high resolution scans show a single N 1s peak with
a binding energy of 402.06 and two major C 1s peaks at 284.8 eV associated with the C-C
bonds and 285.75 eV associated with the 4 C-N carbon atoms with a ratio of 77 to 23
atom%, which is close to the theoretical ratio of 79 to 21 atom%. The Br 3d shows not one
but two different Br- environments. Most of the Br- has a Br 3d5/2 binding energy of 67.19
eV, while a small amount has a slightly higher binding energy of 68.10 eV
(a) (b)
(c) (d)
Figure 4. (a) XPS survey scan of HDTMABr from 500 to 0 ev, (b) high resolution spectrum of C 1s, (c) high resolution
spectrum of N 1s, and (d) high resolution spectrum of Br 3d.
An earlier paper by He, Frost, Bostrom, Yuan, Duong, Yang, Xi, and Kloprogge [34]
demonstrated that the amount of HDTMA intercalated in montmorillonite resulted in dif-
ferent orientations of the surfactant in the interlayer space. Increases in the XRD basal
spacings showed that for the HDTMA intercalated montmorillonite there exist five dis-
tinct HDTMA arrangements formed within the montmorillonite interlayer space. These
arrangements are lateral monolayer, lateral bilayer, pseudotrilayer, paraffin monolayer,
C 1s
Br 3s
Br 3p Br 3dN 1s
Arb
itra
ry U
nit
s
500 450 400 350 300 250 200 150 100 50 0
Binding Energy (eV)
C 1s C-O
C 1s C-N
C 1s C-C
Arb
itra
ry U
nit
s
289 288 287 286 285 284 283 282
Binding Energy (eV)
N 1s
Arb
itra
ry U
nit
s
406 405 404 403 402 401 400 399
Binding Energy (eV)
Br 2 3d3/2
Br 2 3d5/2
Br 3d3/2
Br 3d5/2
Arb
itra
ry U
nit
s
75 72 69 66 63
Binding Energy (eV)
Figure 4. (a) XPS survey scan of HDTMABr from 500 to 0 ev, (b) high resolution spectrum of C 1s, (c) high resolutionspectrum of N 1s, and (d) high resolution spectrum of Br 3d.
An earlier paper by He, Frost, Bostrom, Yuan, Duong, Yang, Xi, and Kloprogge [34]demonstrated that the amount of HDTMA intercalated in montmorillonite resulted indifferent orientations of the surfactant in the interlayer space. Increases in the XRD basalspacings showed that for the HDTMA intercalated montmorillonite there exist five dis-tinct HDTMA arrangements formed within the montmorillonite interlayer space. Thesearrangements are lateral monolayer, lateral bilayer, pseudotrilayer, paraffin monolayer,and paraffin bilayer, which are assumed by HDTMA as the CEC increased from 0.5 to2.5 (Figure 5). The HDTMA arrangement was clearly affected by the packing density of

Materials 2021, 14, 7115 11 of 24
HDTMA within the montmorillonite interlayer space. Transmission and scanning electronmicroscopy have shown that the intercalated Mt with lower HDTMA packing density pri-marily exhibited less ordered layer stacking with a number of bent intercalated molecules.In contrast, montmorillonite with higher HDTMA packing densities consisted mainly of amuch more ordered layer stacking with less bent intercalated molecules. The variation ininterlayer space height from layer to layer was observed in all intercalated Mt, but moreobvious variation was observed in the intercalated Mt with lower HDTMA packing densitythan the one with higher packing density.
Materials 2021, 14, x FOR PEER REVIEW 11 of 24
and paraffin bilayer, which are assumed by HDTMA as the CEC increased from 0.5 to 2.5
(Figure 5). The HDTMA arrangement was clearly affected by the packing density of
HDTMA within the montmorillonite interlayer space. Transmission and scanning elec-
tron microscopy have shown that the intercalated Mt with lower HDTMA packing density
primarily exhibited less ordered layer stacking with a number of bent intercalated mole-
cules. In contrast, montmorillonite with higher HDTMA packing densities consisted
mainly of a much more ordered layer stacking with less bent intercalated molecules. The
variation in interlayer space height from layer to layer was observed in all intercalated Mt,
but more obvious variation was observed in the intercalated Mt with lower HDTMA pack-
ing density than the one with higher packing density.
Figure 5. Increase in basal spacing of the HDTMA intercalated montmorillonite as function of the amount of HDTMA
relative to the cation exchange capacity of the montmorillonite (CEC), showing the change from lateral monolayer (1) to
lateral bilayer (2), pseudotrilayer (3), paraffin monolayer (4), and finally to paraffin bilayer (5). 0 = Na-montmorillonite.
Data used from [34].
The C 1s high resolution spectra of HDTMA intercalated montmorillonite (HDTMA-
Mt) exhibited a considerable peak broadening with small shifts in binding energy, point-
ing to more than one type of HDTMA–Mt interaction. The C-C peak remained at 284.8 eV,
while the C-N peak showed a shift towards lower binding energies with increasing
HDTMA loading (Figure 6).
Figure 5. Increase in basal spacing of the HDTMA intercalated montmorillonite as function of the amount of HDTMArelative to the cation exchange capacity of the montmorillonite (CEC), showing the change from lateral monolayer (1) tolateral bilayer (2), pseudotrilayer (3), paraffin monolayer (4), and finally to paraffin bilayer (5). 0 = Na-montmorillonite.Data used from [34].
The C 1s high resolution spectra of HDTMA intercalated montmorillonite (HDTMA-Mt) exhibited a considerable peak broadening with small shifts in binding energy, pointingto more than one type of HDTMA–Mt interaction. The C-C peak remained at 284.8 eV, whilethe C-N peak showed a shift towards lower binding energies with increasing HDTMAloading (Figure 6).

Materials 2021, 14, 7115 12 of 24Materials 2021, 14, x FOR PEER REVIEW 12 of 24
(a) (b)
Figure 6. (a) Example of a XPS C 1s high resolution scan showing both the C-C and C-N peaks (0.5 CEC-Mt), and (b) shift
in binding energy of the C-N peak as function of the amount of HDTMA intercalated in Mt.
The changes in the C 1s high resolution C-N peaks of HDTMA–Mt indicate that the
molecular environment surrounding HDTMA has a major influence on the observed
binding energy. In all the described arrangements of the HDTMA within the Mt interlayer
space, the headgroups (nitrogen) of the alkyl chains are located near the Mt siloxane sur-
face. This is expected as the negatively charged Mt siloxane surface strongly interacts with
the positively charged headgroups of the HDTMA. HDTMA–Mt with lower surfactant
packing density has the intercalated alkyl chains oriented parallel to the siloxane surfaces
in the interlayer space and are well separated. In this type of orientation, repulsions be-
tween the HDTMA hydrocarbon groups and the Mt siloxane surface dominate since the
interactions of the well separated hydrocarbon chains are extremely weak. An increase in
the HDTMA packing density makes the intermolecular interaction among the HDTMA
alkyl chains become the main force; the hydrocarbon chain rotates from parallel to the
siloxane surface within the Mt interlayer space to an orientation that is at slight angle to
the siloxane surface leading to an increase in the basal spacing as shown by XRD [34]. A
further increase in the packing density of HDTMA makes the interaction between the
HDTMA alkyl chains become stronger causing the arrangement of the alkyl chains to be-
come more orderly as suggested by infrared and Raman spectroscopy [35]. Infrared spec-
troscopy has shown that both the antisymmetric and symmetric CH2 stretching vibrations
shifted to lower wavenumbers with increasing HDTMA density in the interlayer space of
Mt. This indicated the effect of increased conformation order. The antisymmetric CH2
stretching vibration was more susceptible to the conformational ordering. The antisym-
metric and symmetric CH2 stretching vibrations, on the other hand, were strongly affected
by the HDTMA density and orientation. FTIR spectra obtained using pressed KBr disks
showed that the splitting of the methylene scissoring and rocking absorption vibrations
was strongly dependent on HTDMA density and chain conformation. Two pairs of well
resolved vibrations (the first pair at 730 and 720 cm−1 and the second pair at 1473 and 1463
cm−1) were observed in the HDTMA–Mt with relative higher densities of HDTMA, where
the confined HDTMA was present as an essentially all-trans conformation in a paraffin or
paraffin bilayer orientation. Similar observations were made using Raman spectroscopy.
The local environment of the HDTMA within the intercalated Mt clearly hinge on their
loaded amounts with the trimethylammonium heads becoming closer to each other, re-
sulting in the shift of the C 1s binding energy of the C–N bond.
When high-resolution scans of N 1s were performed for 0.5, 0.7, and 1.0 CEC-Mt, the
spectra exhibited a single 1s transition with a slight increase in the binding energy (ca. 1.5
eV) compared with HDMTABr. This indicated that the molecular environment around
C-C
C-N
x 102
5
10
15
20
25
30
35
40
CP
S
288 287 286 285 284 283 282 281 280 279
Binding Energy (eV)
Figure 6. (a) Example of a XPS C 1s high resolution scan showing both the C-C and C-N peaks (0.5 CEC-Mt), and (b) shift inbinding energy of the C-N peak as function of the amount of HDTMA intercalated in Mt.
The changes in the C 1s high resolution C-N peaks of HDTMA–Mt indicate thatthe molecular environment surrounding HDTMA has a major influence on the observedbinding energy. In all the described arrangements of the HDTMA within the Mt interlayerspace, the headgroups (nitrogen) of the alkyl chains are located near the Mt siloxane surface.This is expected as the negatively charged Mt siloxane surface strongly interacts with thepositively charged headgroups of the HDTMA. HDTMA–Mt with lower surfactant packingdensity has the intercalated alkyl chains oriented parallel to the siloxane surfaces in theinterlayer space and are well separated. In this type of orientation, repulsions between theHDTMA hydrocarbon groups and the Mt siloxane surface dominate since the interactionsof the well separated hydrocarbon chains are extremely weak. An increase in the HDTMApacking density makes the intermolecular interaction among the HDTMA alkyl chainsbecome the main force; the hydrocarbon chain rotates from parallel to the siloxane surfacewithin the Mt interlayer space to an orientation that is at slight angle to the siloxane surfaceleading to an increase in the basal spacing as shown by XRD [34]. A further increase inthe packing density of HDTMA makes the interaction between the HDTMA alkyl chainsbecome stronger causing the arrangement of the alkyl chains to become more orderly assuggested by infrared and Raman spectroscopy [35]. Infrared spectroscopy has shownthat both the antisymmetric and symmetric CH2 stretching vibrations shifted to lowerwavenumbers with increasing HDTMA density in the interlayer space of Mt. This indicatedthe effect of increased conformation order. The antisymmetric CH2 stretching vibration wasmore susceptible to the conformational ordering. The antisymmetric and symmetric CH2stretching vibrations, on the other hand, were strongly affected by the HDTMA densityand orientation. FTIR spectra obtained using pressed KBr disks showed that the splittingof the methylene scissoring and rocking absorption vibrations was strongly dependent onHTDMA density and chain conformation. Two pairs of well resolved vibrations (the firstpair at 730 and 720 cm−1 and the second pair at 1473 and 1463 cm−1) were observed in theHDTMA–Mt with relative higher densities of HDTMA, where the confined HDTMA waspresent as an essentially all-trans conformation in a paraffin or paraffin bilayer orientation.Similar observations were made using Raman spectroscopy. The local environment ofthe HDTMA within the intercalated Mt clearly hinge on their loaded amounts with thetrimethylammonium heads becoming closer to each other, resulting in the shift of the C 1sbinding energy of the C–N bond.
When high-resolution scans of N 1s were performed for 0.5, 0.7, and 1.0 CEC-Mt, thespectra exhibited a single 1s transition with a slight increase in the binding energy (ca.1.5 eV) compared with HDMTABr. This indicated that the molecular environment around

Materials 2021, 14, 7115 13 of 24
the intercalated HDTMA is different from that in bulk state HDTMABr. With increasingHDTMA loading, the binding energy shifts to lower values closer to that of bulk HDTMABr(Figure 7a). The atom% ratio of N/Si can be used as a measure of the amount of HDTMAintercalated in Mt (Figure 7b). The N/Si ratio shows a nearly linear increase as would beexpected for the intercalation without any excess HDTMA present adsorbed on the externalMt surfaces. In contrast to earlier work by He, Zhou, Frost Ray, Wood Barry, Duong Loc,and Kloprogge [36], no second N 1s peak was observed at high HDTMA loading that theyinterpreted as externally adsorbed HDTMA on Mt.
Materials 2021, 14, x FOR PEER REVIEW 13 of 24
the intercalated HDTMA is different from that in bulk state HDTMABr. With increasing
HDTMA loading, the binding energy shifts to lower values closer to that of bulk
HDTMABr (Figure 7a). The atom% ratio of N/Si can be used as a measure of the amount
of HDTMA intercalated in Mt (Figure 7b). The N/Si ratio shows a nearly linear increase as
would be expected for the intercalation without any excess HDTMA present adsorbed on
the external Mt surfaces. In contrast to earlier work by He, Zhou, Frost Ray, Wood Barry,
Duong Loc, and Kloprogge [36], no second N 1s peak was observed at high HDTMA load-
ing that they interpreted as externally adsorbed HDTMA on Mt.
(a) (b)
Figure 7. (a) Shift in the N 1s binding energy (eV) of HDTMA intercalated in Mt as function of amount of HDTMA inter-
calated and (b) N/Si ratio determined from the atom% of N 1s and Si 2p3/2 high resolution spectra as function of the
amount of HDTMA intercalated in Mt.
In the survey scans of the HDTMA–Mt, a very weak Br 3d peak was observed in the
XPS spectrum of 2.0 CEC-Mt. The intensity of the Br 3d peak distinctly increased in the
spectrum of 2.5 CEC-Mt. Figure 8 displays the high-resolution Br 3d high resolution spec-
tra of 2.0 and 2.5 CEC-Mt. The signal is weak due to the fact that the Br is only present in
very low concentrations and the release of photoelectrons is a statistical process depend-
ing on their release from beneath sample surface. Nevertheless, important details can still
be extracted from the spectra. Similar to the HDTMABr Br 3d high resolution spectrum
(Br 3d5/2 at 67.19 eV and 68.10 eV), the intercalated HDTMA is also characterized by two
different Br 3d5/2 signals at 65.38 eV and a smaller peak at 66.33 eV for 2.0CEC-Mt and at
65.33 eV and 65.99 eV (Figure 8). It is clear from these observations that at high HDTMA
intercalation volumes some of the counterion Br− is also included in the Mt interlayer
space, although the restraints of the interlayer space result in a significant shift in the bind-
ing energies compared with pure HDTMABr. The fact that the peaks are broad with low
intensity and poor resolution suggests that the concentration of Br− in the HDTMA–Mt is
limited and spatially disordered.
Figure 7. (a) Shift in the N 1s binding energy (eV) of HDTMA intercalated in Mt as function of amount of HDTMAintercalated and (b) N/Si ratio determined from the atom% of N 1s and Si 2p3/2 high resolution spectra as function of theamount of HDTMA intercalated in Mt.
In the survey scans of the HDTMA–Mt, a very weak Br 3d peak was observed in theXPS spectrum of 2.0 CEC-Mt. The intensity of the Br 3d peak distinctly increased in thespectrum of 2.5 CEC-Mt. Figure 8 displays the high-resolution Br 3d high resolution spectraof 2.0 and 2.5 CEC-Mt. The signal is weak due to the fact that the Br is only present invery low concentrations and the release of photoelectrons is a statistical process dependingon their release from beneath sample surface. Nevertheless, important details can still beextracted from the spectra. Similar to the HDTMABr Br 3d high resolution spectrum (Br3d5/2 at 67.19 eV and 68.10 eV), the intercalated HDTMA is also characterized by twodifferent Br 3d5/2 signals at 65.38 eV and a smaller peak at 66.33 eV for 2.0CEC-Mt and at65.33 eV and 65.99 eV (Figure 8). It is clear from these observations that at high HDTMAintercalation volumes some of the counterion Br− is also included in the Mt interlayerspace, although the restraints of the interlayer space result in a significant shift in thebinding energies compared with pure HDTMABr. The fact that the peaks are broad withlow intensity and poor resolution suggests that the concentration of Br− in the HDTMA–Mtis limited and spatially disordered.

Materials 2021, 14, 7115 14 of 24Materials 2021, 14, x FOR PEER REVIEW 14 of 24
(a) (b)
Figure 8. XPS Br 3d high resolution spectra of (a) 2.0CEC-Mt and (b) 2.5CEC-Mt showing two distinctly different Br−
positions labeled Br 1 and Br 2 in the HDTMA-intercalated Mt.
3.2. Al- and Ga-Pillared Montmorillonite
Pillared clays (Pilc) form a group of microporous materials prepared through ion ex-
change of mainly montmorillonite (though other smectites such as saponite, beidellite,
and hectorite have also been used) with highly charged metallic complexes followed by a
calcination process. Producing suitable Pilc for catalytic applications necessitates compre-
hensive knowledge of the structure of the precursor clay mineral and the molecule that
serves as pillar. Equally important is knowing and understanding where the oxidic pillars
are located and what are their size and shape in the final calcined Pilc. These structure-
property aspects of Pilc remain poorly understood despite the vast amount of research
conducted over the past several decades in the field of Pilc structures. In this section, XPS
is used to probe the pillaring of montmorillonites (Mt) with Al and Ga polyoxocations to
gain more information on the pillaring process and the resulting Pilc. These are chosen as
the model systems since pillaring of Mt by polyoxocations has been researched for more
than 5 decades. Al13-montmorillonites are the most created Pilc. This is largely due to the
large basal d-spacing created by Al polyoxocation in the Pilc as well as its relative stability
at high temperatures even up to temperatures where the clay layers start to break down
due to dehydroxylation (loss of the octahedral OH-groups). This high temperature stabil-
ity is also exhibited by the very similar Al12Ga-Pilc. The Al13, Al12Ga, and Ga13 have equiv-
alent structural form—all consisting of a Keggin structure with the central AlIVO4 or
GaIVO4 tetrahedron caged by twelve AlVI octahedra with H2O and OH-groups producing
similar basal d-spacings in the final Pilc [10,59–65].
3.2.1. Al13 Pillared Montmorillonite
The XPS spectroscopic results for montmorillonite SWy-2 used in the pillaring stud-
ies was described by Kloprogge and Wood [47]. Pillaring with Al13 results in a strong in-
crease in the amount of total Al in the Pilc structure with the Si/Al ratio decreasing from
2.34 for the starting Mt to 0.96 for the Pilc. Based on these ratios, it is possible to calculate
that of the total Al in the Pilc about 40% is due to Al in the octahedral sheet of the Mt,
while 60% is due to the pillar structure in the Mt interlayer space. Given a total of 4 Si
atoms per unit cell for Mt it is possible to calculate the theoretical number of pillars as-
suming that 13 Al atoms are present in each pillar. Based on the Si and Al atom% for the
Mt and Pilc, an average of one pillar per five unit cells was present in the Pilc. The Si 2p3/2
peak in the Si 2p high resolution scan shifted from 102.51 eV for Mt to 99.68 eV for the
Pilc. This shift can be explained by the fact that upon calcination of the intercalated Al13-
Br 1 3d3/2
Br 2 3d5/2
Br 2 3d3/2
Br 1 3d5/2
x 101
6
8
10
12
14
16
18
20
22
CP
S
70 68 66 64 62
Binding Energy (eV)
Br 1 3d3/2Br 2 3d5/2
Br 2 3d3/2
Br 1 3d5/2
x 101
10
15
20
25
30
35
CP
S
70 68 66 64 62
Binding Energy (eV)
Figure 8. XPS Br 3d high resolution spectra of (a) 2.0CEC-Mt and (b) 2.5CEC-Mt showing two distinctly different Br−
positions labeled Br 1 and Br 2 in the HDTMA-intercalated Mt.
3.2. Al- and Ga-Pillared Montmorillonite
Pillared clays (Pilc) form a group of microporous materials prepared through ionexchange of mainly montmorillonite (though other smectites such as saponite, beidellite,and hectorite have also been used) with highly charged metallic complexes followedby a calcination process. Producing suitable Pilc for catalytic applications necessitatescomprehensive knowledge of the structure of the precursor clay mineral and the moleculethat serves as pillar. Equally important is knowing and understanding where the oxidicpillars are located and what are their size and shape in the final calcined Pilc. Thesestructure-property aspects of Pilc remain poorly understood despite the vast amountof research conducted over the past several decades in the field of Pilc structures. Inthis section, XPS is used to probe the pillaring of montmorillonites (Mt) with Al and Gapolyoxocations to gain more information on the pillaring process and the resulting Pilc.These are chosen as the model systems since pillaring of Mt by polyoxocations has beenresearched for more than 5 decades. Al13-montmorillonites are the most created Pilc. Thisis largely due to the large basal d-spacing created by Al polyoxocation in the Pilc as well asits relative stability at high temperatures even up to temperatures where the clay layersstart to break down due to dehydroxylation (loss of the octahedral OH-groups). Thishigh temperature stability is also exhibited by the very similar Al12Ga-Pilc. The Al13,Al12Ga, and Ga13 have equivalent structural form—all consisting of a Keggin structurewith the central AlIVO4 or GaIVO4 tetrahedron caged by twelve AlVI octahedra with H2Oand OH-groups producing similar basal d-spacings in the final Pilc [10,59–65].
3.2.1. Al13 Pillared Montmorillonite
The XPS spectroscopic results for montmorillonite SWy-2 used in the pillaring studieswas described by Kloprogge and Wood [47]. Pillaring with Al13 results in a strong increasein the amount of total Al in the Pilc structure with the Si/Al ratio decreasing from 2.34for the starting Mt to 0.96 for the Pilc. Based on these ratios, it is possible to calculate thatof the total Al in the Pilc about 40% is due to Al in the octahedral sheet of the Mt, while60% is due to the pillar structure in the Mt interlayer space. Given a total of 4 Si atoms perunit cell for Mt it is possible to calculate the theoretical number of pillars assuming that 13Al atoms are present in each pillar. Based on the Si and Al atom% for the Mt and Pilc, anaverage of one pillar per five unit cells was present in the Pilc. The Si 2p3/2 peak in the Si2p high resolution scan shifted from 102.51 eV for Mt to 99.68 eV for the Pilc. This shiftcan be explained by the fact that upon calcination of the intercalated Al13-Mt new oxidebonds are formed between the Al in the pillar structure and the siloxane surface throughinversion of some Al tetrahedra into the Mt interlayer space [66,67].

Materials 2021, 14, 7115 15 of 24
The single Al 2p at 74.58 eV for Mt split into a strong peak at 71.78 eV and a smallerpeak at 72.89 eV (Figure 9). The smaller peak is probably associated with the octahedral Alin the Mt layer, while the strong peak can be assigned to the Al in the pillar. Even though theAl in the octahedral sheet is relatively shielded from the newly formed structure throughthe oxygen bond to the tetrahedral sheets, it still shows an influence of the structural changeon the binding energy. It has been suggested that the structure of the pillar resembles thatof corundum (Al2O3) but the Al 2p binding energy for corundum is 74.1 eV [20], which issignificantly higher than observed here for the pillar.
Materials 2021, 14, x FOR PEER REVIEW 15 of 24
Mt new oxide bonds are formed between the Al in the pillar structure and the siloxane
surface through inversion of some Al tetrahedra into the Mt interlayer space [66,67].
The single Al 2p at 74.58 eV for Mt split into a strong peak at 71.78 eV and a smaller
peak at 72.89 eV (Figure 9). The smaller peak is probably associated with the octahedral
Al in the Mt layer, while the strong peak can be assigned to the Al in the pillar. Even
though the Al in the octahedral sheet is relatively shielded from the newly formed struc-
ture through the oxygen bond to the tetrahedral sheets, it still shows an influence of the
structural change on the binding energy. It has been suggested that the structure of the
pillar resembles that of corundum (Al2O3) but the Al 2p binding energy for corundum is
74.1 eV [20], which is significantly higher than observed here for the pillar.
(a) (b)
Figure 9. XPS Al 2p high resolution spectra of (a) Mt and (b) Al13-Pilc after calcination.
Kloprogge, Frost, and Fry [41] showed that the infrared spectrum of the OH-stretch-
ing region of montmorillonite is depicted by two vibrations at 3628 and 3363 cm−1 at-
tributed to the octahedral sheet’s M–OH and interlayer H2O OH-stretching modes. New
vibrations appear at 3682 and 3538 cm−1 and the interlayer H2O OH band moved to 3200
cm−1 when Mt is intercalated with Al13. The new vibrations are attributed to the OH-
stretching modes of the Al–OH and Al–H2O groups of the Al13 complex. The interlayer
H2O band strongly decreased in intensity as a result of the intercalation with Al13. Calci-
nation caused the loss of any residual interlayer water. The transformation of the Al13
Keggin structure caused the disappearance of the Al–OH stretching vibration at 400–500
°C. Between 400 and 500 °C, the OH-stretching vibration of the Al–H2O group was re-
placed by two new vibrations at 3574 and 3505 cm−1. This is indicative of rearrangements
within the Al13 structure. These vibrations were still visible at 800 °C albeit with a signifi-
cant decrease in intensity. Nonetheless, this indicated that a few structural OH-groups
remained in the newly formed pillar structure, contrary to the common belief that these
were completely converted into aluminum oxide. These bands were thought to possibly
represent OH bridges between neighboring partially dehydroxylated Al13 complexes. The
M–OH vibration was observed over the entire temperature range from room temperature
up to 800 °C without position shifts, though with diminishing intensity [35]. These infra-
red emission spectroscopic results fit with the observed Al 2p binding energy for Al in the
pillar, showing that the structure is not the same as that observed in corundum.
3.2.2. Ga13 Pillared Montmorillonite
The work of Duong et al. [39] on the distribution of Ga in Ga13-pillared montmorillo-
nites showed that the XRD profile upon intercalation of the Ga13 exchanged Mt from Miles,
Queensland had a basal spacing of about 19.9 Å compared with 14 Å for the starting Mt,
Al oct Mt
x 101
10
20
30
40
50
60
CP
S
78 76 74 72 70
Binding Energy (eV)
Al oct Mt
Al pillar
x 101
10
15
20
25
30
CP
S
78 75 72 69
Binding Energy (eV)
Figure 9. XPS Al 2p high resolution spectra of (a) Mt and (b) Al13-Pilc after calcination.
Kloprogge, Frost, and Fry [41] showed that the infrared spectrum of the OH-stretchingregion of montmorillonite is depicted by two vibrations at 3628 and 3363 cm−1 attributedto the octahedral sheet’s M–OH and interlayer H2O OH-stretching modes. New vibrationsappear at 3682 and 3538 cm−1 and the interlayer H2O OH band moved to 3200 cm−1 whenMt is intercalated with Al13. The new vibrations are attributed to the OH-stretching modesof the Al–OH and Al–H2O groups of the Al13 complex. The interlayer H2O band stronglydecreased in intensity as a result of the intercalation with Al13. Calcination caused the lossof any residual interlayer water. The transformation of the Al13 Keggin structure caused thedisappearance of the Al–OH stretching vibration at 400–500 ◦C. Between 400 and 500 ◦C,the OH-stretching vibration of the Al–H2O group was replaced by two new vibrationsat 3574 and 3505 cm−1. This is indicative of rearrangements within the Al13 structure.These vibrations were still visible at 800 ◦C albeit with a significant decrease in intensity.Nonetheless, this indicated that a few structural OH-groups remained in the newly formedpillar structure, contrary to the common belief that these were completely converted intoaluminum oxide. These bands were thought to possibly represent OH bridges betweenneighboring partially dehydroxylated Al13 complexes. The M–OH vibration was observedover the entire temperature range from room temperature up to 800 ◦C without positionshifts, though with diminishing intensity [35]. These infrared emission spectroscopic resultsfit with the observed Al 2p binding energy for Al in the pillar, showing that the structure isnot the same as that observed in corundum.
3.2.2. Ga13 Pillared Montmorillonite
The work of Duong et al. [39] on the distribution of Ga in Ga13-pillared montmoril-lonites showed that the XRD profile upon intercalation of the Ga13 exchanged Mt fromMiles, Queensland had a basal spacing of about 19.9 Å compared with 14 Å for the start-ing Mt, which slightly decreased upon calcination to 17.9 Å similar to Al13-Pilc. Earlieranalytical work using energy dispersive X-ray analysis (EDX) has shown that that mean

Materials 2021, 14, 7115 16 of 24
atom ratio of Si/Ga was about 4.25 [39]. Compared with Mt SWy-2, this indicates a threetimes higher pillar density in the Miles Al13- and Ga13-Pilc, which is probably the result ofa higher layer charge in the Miles Mt compared with SWy-2.
Figure 10 shows the XPS survey scan of the Ga13 pillared montmorillonite. The Gapeaks are clearly identifiable, though there is significant interference with some otherelements as the high resolution scans show. Ga 3d overlaps with O 2s, while Ga 3p overlapswith Si 2p (Figure 11). The ratio of Si/Ga obtained from the XPS scans is significantly lowerat 1.61 compared with the earlier reported EDX value of 4.25, indicating nearly three timesthe amount of Ga. As shown above, there is significant overlap with several of the Gapeaks with Si and O in the XPS spectra. Similarly, there is interference in the EDX patternsas well with Ga overlapping with, for example, Mg, introducing uncertainty in that valueas well. Similar to the Al13-Pilc, the Si 2p3/2 has shifted to lower binding energy by about2 eV, while the corresponding Al 2p has shifted to lower binding energy by about 1 eV,both of which are significantly smaller than for the Al13-Pilc. This may be related to thefact that a different starting Mt was used with different amounts of substitutions resultingin different layer charges as indicated by the differences in the Si/Al ratio for Al13-Pilc inthe previous section compared with the Si/Ga ratio here. This is supported by the fact thatthe cation exchange capacity (CEC) for the Miles Mt is significantly higher than that ofSWy-2 [39].
Materials 2021, 14, x FOR PEER REVIEW 16 of 24
which slightly decreased upon calcination to 17.9 Å similar to Al13-Pilc. Earlier analytical
work using energy dispersive X-ray analysis (EDX) has shown that that mean atom ratio
of Si/Ga was about 4.25 [39]. Compared with Mt SWy-2, this indicates a three times higher
pillar density in the Miles Al13- and Ga13-Pilc, which is probably the result of a higher layer
charge in the Miles Mt compared with SWy-2.
Figure 10 shows the XPS survey scan of the Ga13 pillared montmorillonite. The Ga
peaks are clearly identifiable, though there is significant interference with some other el-
ements as the high resolution scans show. Ga 3d overlaps with O 2s, while Ga 3p overlaps
with Si 2p (Figure 11). The ratio of Si/Ga obtained from the XPS scans is significantly lower
at 1.61 compared with the earlier reported EDX value of 4.25, indicating nearly three times
the amount of Ga. As shown above, there is significant overlap with several of the Ga
peaks with Si and O in the XPS spectra. Similarly, there is interference in the EDX patterns
as well with Ga overlapping with, for example, Mg, introducing uncertainty in that value
as well. Similar to the Al13-Pilc, the Si 2p3/2 has shifted to lower binding energy by about
2 eV, while the corresponding Al 2p has shifted to lower binding energy by about 1 eV,
both of which are significantly smaller than for the Al13-Pilc. This may be related to the
fact that a different starting Mt was used with different amounts of substitutions resulting
in different layer charges as indicated by the differences in the Si/Al ratio for Al13-Pilc in
the previous section compared with the Si/Ga ratio here. This is supported by the fact that
the cation exchange capacity (CEC) for the Miles Mt is significantly higher than that of
SWy-2 [39].
Figure 10. XPS survey scan of Ga13 pillared montmorillonite.
Ga Auger
Ga 3s
Si 2pGa 3p
Al 2p
Ga 3dO 1s
C 1s
Ga 2p
x 103
10
20
30
40
50
60
CP
S
1200 900 600 300
Binding Energy (eV)
Figure 10. XPS survey scan of Ga13 pillared montmorillonite.

Materials 2021, 14, 7115 17 of 24Materials 2021, 14, x FOR PEER REVIEW 17 of 24
(a) (b)
(c)
Figure 11. XPS high resolution scans of (a) Ga 2p3/2. (b) Ga 3d showing overlap with O 1s and (c) Ga 3p showing overlap
with Si 2p.
The Ga 2p3/2, 3p, and 3d high resolution spectra all show a single peak indicating
that after calcination the Ga environment of all Ga atoms is very similar. Compared with
gallium-substituted boehmite, (Al,Ga)OOH, with all Ga in octahedral coordination where
the Ga 2p3/2 occurred at 1117.8 eV [21], the Ga in the Ga13-Pilc is observed at a higher
binding energy of 1119.1 eV. In the previous section it was discussed how the Al13 pillars
after calcination still contained some hydroxyl groups, which is probably also the case in
the Ga13 pillars here, but not enough to shift the Ga 2p3/2 to a binding energy similar to
that in Ga-substituted boehmite. Montarges et al. [68] used Ga K-edge X-ray adsorption
to study Ga13-Pilc to probe the local environment of Ga atoms Ga13-Mt. Their analysis of
the first nearest neighbors (oxygen atoms neighbors) revealed a reduction in the average
Ga-OH distances after calcination. This was interpreted as due to the dehydroxylation of
the polycation pillars in Ga13-Pilc. For the second nearest gallium atom neighbors, the Fou-
rier transforms pointed to the initial existence of the central GaIV of the Ga13 polycations.
Their signal contribution, however, disappeared upon calcination in accordance with the
observed XPS results in this study. The 71Ga Nuclear Magnetic Resonance (NMR) spectra
of partly hydrolyzed Ga3+ solutions exhibited a peak at 176 ppm, assigned to the central
GaIV of the Ga13 polymer [40,69,70]. The 71Ga solid state Magic Angle Spinning (MAS)
NMR spectra of Ga13-Pilc at 25 °C and calcined 150 °C showed a tetrahedral peak at 172.6
ppm and an octahedral signal at 30.1 ppm. Upon calcination at 300 °C, these signals were
no longer observed. Instead, a very broad signal at ~0 ppm was observed indicating that
x 102
12
14
16
18
20
22
24
CP
S
1124 1120 1116 1112
Binding Energy (eV)
Ga 3d3/2
Ga 3d5/2O 2s
30
40
50
60
70
80
90
100
110
120
130
140
150
CP
S
26 24 22 20 18
Binding Energy (eV)
Ga 3p1/2 Ga 3p3/2
Si 2p1/2Si 2p3/2
x 101
5
10
15
20
25
30
35
40
45
50
CP
S
108 105 102 99
Binding Energy (eV)
Figure 11. XPS high resolution scans of (a) Ga 2p3/2. (b) Ga 3d showing overlap with O 1s and (c) Ga 3p showing overlapwith Si 2p.
The Ga 2p3/2, 3p, and 3d high resolution spectra all show a single peak indicatingthat after calcination the Ga environment of all Ga atoms is very similar. Compared withgallium-substituted boehmite, (Al,Ga)OOH, with all Ga in octahedral coordination wherethe Ga 2p3/2 occurred at 1117.8 eV [21], the Ga in the Ga13-Pilc is observed at a higherbinding energy of 1119.1 eV. In the previous section it was discussed how the Al13 pillarsafter calcination still contained some hydroxyl groups, which is probably also the case inthe Ga13 pillars here, but not enough to shift the Ga 2p3/2 to a binding energy similar tothat in Ga-substituted boehmite. Montarges et al. [68] used Ga K-edge X-ray adsorption tostudy Ga13-Pilc to probe the local environment of Ga atoms Ga13-Mt. Their analysis of thefirst nearest neighbors (oxygen atoms neighbors) revealed a reduction in the average Ga-OH distances after calcination. This was interpreted as due to the dehydroxylation of thepolycation pillars in Ga13-Pilc. For the second nearest gallium atom neighbors, the Fouriertransforms pointed to the initial existence of the central GaIV of the Ga13 polycations.Their signal contribution, however, disappeared upon calcination in accordance with theobserved XPS results in this study. The 71Ga Nuclear Magnetic Resonance (NMR) spectraof partly hydrolyzed Ga3+ solutions exhibited a peak at 176 ppm, assigned to the centralGaIV of the Ga13 polymer [40,69,70]. The 71Ga solid state Magic Angle Spinning (MAS)NMR spectra of Ga13-Pilc at 25 ◦C and calcined 150 ◦C showed a tetrahedral peak at 172.6ppm and an octahedral signal at 30.1 ppm. Upon calcination at 300 ◦C, these signals were
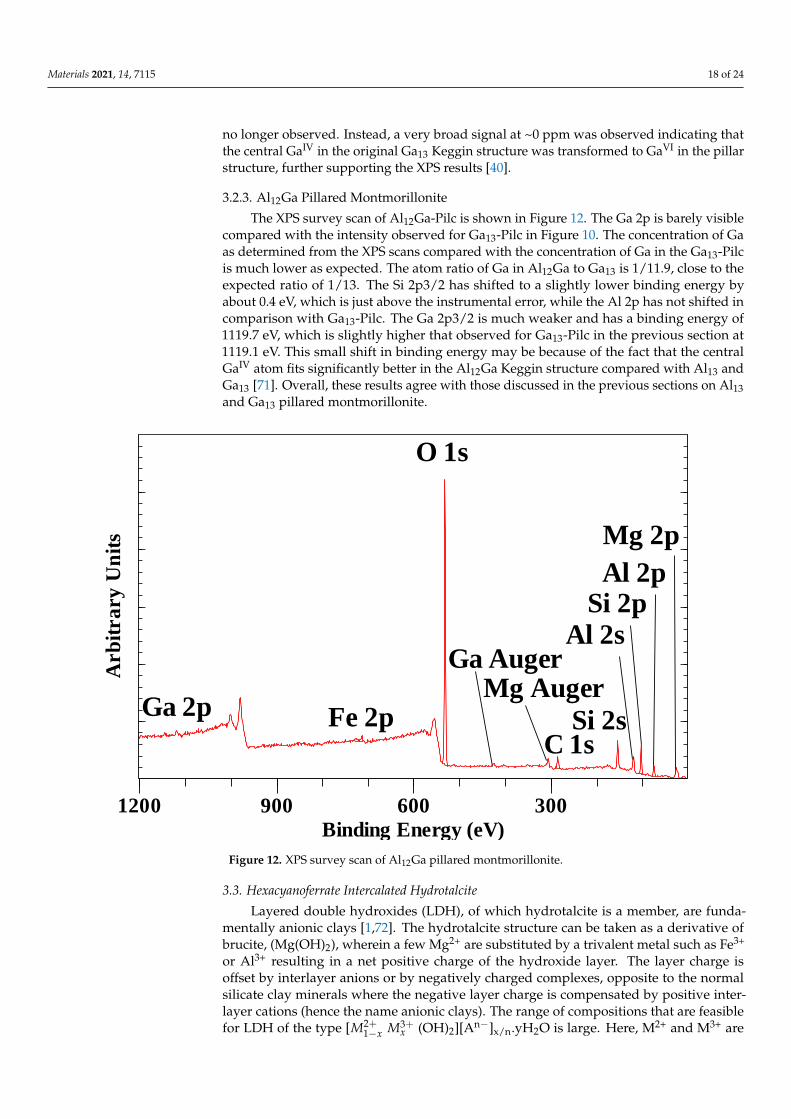
Materials 2021, 14, 7115 18 of 24
no longer observed. Instead, a very broad signal at ~0 ppm was observed indicating thatthe central GaIV in the original Ga13 Keggin structure was transformed to GaVI in the pillarstructure, further supporting the XPS results [40].
3.2.3. Al12Ga Pillared Montmorillonite
The XPS survey scan of Al12Ga-Pilc is shown in Figure 12. The Ga 2p is barely visiblecompared with the intensity observed for Ga13-Pilc in Figure 10. The concentration of Gaas determined from the XPS scans compared with the concentration of Ga in the Ga13-Pilcis much lower as expected. The atom ratio of Ga in Al12Ga to Ga13 is 1/11.9, close to theexpected ratio of 1/13. The Si 2p3/2 has shifted to a slightly lower binding energy byabout 0.4 eV, which is just above the instrumental error, while the Al 2p has not shifted incomparison with Ga13-Pilc. The Ga 2p3/2 is much weaker and has a binding energy of1119.7 eV, which is slightly higher that observed for Ga13-Pilc in the previous section at1119.1 eV. This small shift in binding energy may be because of the fact that the centralGaIV atom fits significantly better in the Al12Ga Keggin structure compared with Al13 andGa13 [71]. Overall, these results agree with those discussed in the previous sections on Al13and Ga13 pillared montmorillonite.
Materials 2021, 14, x FOR PEER REVIEW 18 of 24
the central GaIV in the original Ga13 Keggin structure was transformed to GaVI in the pillar
structure, further supporting the XPS results [40].
3.2.3. Al12Ga Pillared Montmorillonite
The XPS survey scan of Al12Ga-Pilc is shown in Figure 12. The Ga 2p is barely visible
compared with the intensity observed for Ga13-Pilc in Figure 10. The concentration of Ga
as determined from the XPS scans compared with the concentration of Ga in the Ga13-Pilc
is much lower as expected. The atom ratio of Ga in Al12Ga to Ga13 is 1/11.9, close to the
expected ratio of 1/13. The Si 2p3/2 has shifted to a slightly lower binding energy by about
0.4 eV, which is just above the instrumental error, while the Al 2p has not shifted in com-
parison with Ga13-Pilc. The Ga 2p3/2 is much weaker and has a binding energy of 1119.7
eV, which is slightly higher that observed for Ga13-Pilc in the previous section at 1119.1
eV. This small shift in binding energy may be because of the fact that the central GaIV atom
fits significantly better in the Al12Ga Keggin structure compared with Al13 and Ga13 [71].
Overall, these results agree with those discussed in the previous sections on Al13 and Ga13
pillared montmorillonite.
Figure 12. XPS survey scan of Al12Ga pillared montmorillonite.
3.3. Hexacyanoferrate Intercalated Hydrotalcite
Layered double hydroxides (LDH), of which hydrotalcite is a member, are funda-
mentally anionic clays [1,72]. The hydrotalcite structure can be taken as a derivative of
brucite, (Mg(OH)2), wherein a few Mg2+ are substituted by a trivalent metal such as Fe3+ or
Al3+ resulting in a net positive charge of the hydroxide layer. The layer charge is offset by
interlayer anions or by negatively charged complexes, opposite to the normal silicate clay
minerals where the negative layer charge is compensated by positive interlayer cations
(hence the name anionic clays). The range of compositions that are feasible for LDH of the
type [𝑀1−𝑥2+ 𝑀𝑥
3+ (OH)2][An−]x/n.yH2O is large. Here, M2+ and M3+ are octahedrally-coordi-
nated di and trivalent cations within the hydroxide layers while An− is the exchangeable
interlayer anion. The values of x are typically between 0.17 and 0.33.
Si 2sC 1s
Al 2s
Al 2pSi 2p
Mg 2p
Mg AugerGa Auger
O 1s
Fe 2pGa 2p
Arb
itra
ry
Un
its
1200 900 600 300
Binding Energy (eV)
Figure 12. XPS survey scan of Al12Ga pillared montmorillonite.
3.3. Hexacyanoferrate Intercalated Hydrotalcite
Layered double hydroxides (LDH), of which hydrotalcite is a member, are funda-mentally anionic clays [1,72]. The hydrotalcite structure can be taken as a derivative ofbrucite, (Mg(OH)2), wherein a few Mg2+ are substituted by a trivalent metal such as Fe3+
or Al3+ resulting in a net positive charge of the hydroxide layer. The layer charge isoffset by interlayer anions or by negatively charged complexes, opposite to the normalsilicate clay minerals where the negative layer charge is compensated by positive inter-layer cations (hence the name anionic clays). The range of compositions that are feasiblefor LDH of the type [M2+
1−x M3+x (OH)2][An−]x/n.yH2O is large. Here, M2+ and M3+ are
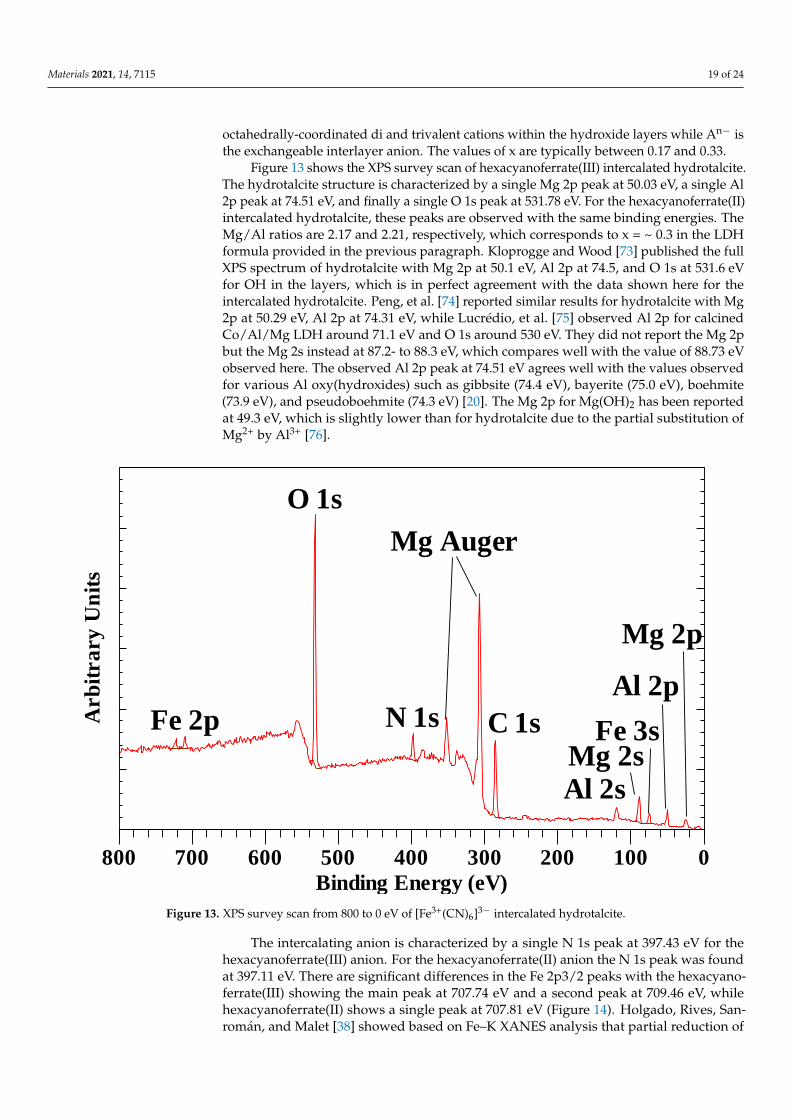
Materials 2021, 14, 7115 19 of 24
octahedrally-coordinated di and trivalent cations within the hydroxide layers while An− isthe exchangeable interlayer anion. The values of x are typically between 0.17 and 0.33.
Figure 13 shows the XPS survey scan of hexacyanoferrate(III) intercalated hydrotalcite.The hydrotalcite structure is characterized by a single Mg 2p peak at 50.03 eV, a single Al2p peak at 74.51 eV, and finally a single O 1s peak at 531.78 eV. For the hexacyanoferrate(II)intercalated hydrotalcite, these peaks are observed with the same binding energies. TheMg/Al ratios are 2.17 and 2.21, respectively, which corresponds to x = ~ 0.3 in the LDHformula provided in the previous paragraph. Kloprogge and Wood [73] published the fullXPS spectrum of hydrotalcite with Mg 2p at 50.1 eV, Al 2p at 74.5, and O 1s at 531.6 eVfor OH in the layers, which is in perfect agreement with the data shown here for theintercalated hydrotalcite. Peng, et al. [74] reported similar results for hydrotalcite with Mg2p at 50.29 eV, Al 2p at 74.31 eV, while Lucrédio, et al. [75] observed Al 2p for calcinedCo/Al/Mg LDH around 71.1 eV and O 1s around 530 eV. They did not report the Mg 2pbut the Mg 2s instead at 87.2- to 88.3 eV, which compares well with the value of 88.73 eVobserved here. The observed Al 2p peak at 74.51 eV agrees well with the values observedfor various Al oxy(hydroxides) such as gibbsite (74.4 eV), bayerite (75.0 eV), boehmite(73.9 eV), and pseudoboehmite (74.3 eV) [20]. The Mg 2p for Mg(OH)2 has been reportedat 49.3 eV, which is slightly lower than for hydrotalcite due to the partial substitution ofMg2+ by Al3+ [76].
Materials 2021, 14, x FOR PEER REVIEW 19 of 24
Figure 13 shows the XPS survey scan of hexacyanoferrate(III) intercalated hy-
drotalcite. The hydrotalcite structure is characterized by a single Mg 2p peak at 50.03 eV,
a single Al 2p peak at 74.51 eV, and finally a single O 1s peak at 531.78 eV. For the hexa-
cyanoferrate(II) intercalated hydrotalcite, these peaks are observed with the same binding
energies. The Mg/Al ratios are 2.17 and 2.21, respectively, which corresponds to x = ~ 0.3
in the LDH formula provided in the previous paragraph. Kloprogge and Wood [73] pub-
lished the full XPS spectrum of hydrotalcite with Mg 2p at 50.1 eV, Al 2p at 74.5, and O 1s
at 531.6 eV for OH in the layers, which is in perfect agreement with the data shown here
for the intercalated hydrotalcite. Peng, et al. [74] reported similar results for hydrotalcite
with Mg 2p at 50.29 eV, Al 2p at 74.31 eV, while Lucrédio, et al. [75] observed Al 2p for
calcined Co/Al/Mg LDH around 71.1 eV and O 1s around 530 eV. They did not report the
Mg 2p but the Mg 2s instead at 87.2- to 88.3 eV, which compares well with the value of
88.73 eV observed here. The observed Al 2p peak at 74.51 eV agrees well with the values
observed for various Al oxy(hydroxides) such as gibbsite (74.4 eV), bayerite (75.0 eV),
boehmite (73.9 eV), and pseudoboehmite (74.3 eV) [20]. The Mg 2p for Mg(OH)2 has been
reported at 49.3 eV, which is slightly lower than for hydrotalcite due to the partial substi-
tution of Mg2+ by Al3+ [76].
Figure 13. XPS survey scan from 800 to 0 eV of [Fe3+(CN)6]3− intercalated hydrotalcite.
The intercalating anion is characterized by a single N 1s peak at 397.43 eV for the
hexacyanoferrate(III) anion. For the hexacyanoferrate(II) anion the N 1s peak was found
at 397.11 eV. There are significant differences in the Fe 2p3/2 peaks with the hexacyanofer-
rate(III) showing the main peak at 707.74 eV and a second peak at 709.46 eV, while hexa-
cyanoferrate(II) shows a single peak at 707.81 eV (Figure 14). Holgado, Rives, Sanromán,
and Malet [38] showed based on Fe–K XANES analysis that partial reduction of the Fe(III)
in the hexacyanoferrate intercalated hydrotalcite had occurred. In addition, Idemura et al.
[77] showed the reduction of iron in hexacyanoferrate(III) complexes by Mössbauer spec-
troscopy. Yamashita and Hayes [26] observed that the Fe 2p3/2 for Fe(II) has a binding
energy of about 1 eV lower than Fe(III) in their oxides. Similar results have been reported
C 1s
Mg Auger
Mg 2sFe 3s
Al 2s
Mg 2p
Al 2pN 1s
O 1s
Fe 2pArb
itra
ry
Un
its
800 700 600 500 400 300 200 100 0
Binding Energy (eV)
Figure 13. XPS survey scan from 800 to 0 eV of [Fe3+(CN)6]3− intercalated hydrotalcite.
The intercalating anion is characterized by a single N 1s peak at 397.43 eV for thehexacyanoferrate(III) anion. For the hexacyanoferrate(II) anion the N 1s peak was foundat 397.11 eV. There are significant differences in the Fe 2p3/2 peaks with the hexacyano-ferrate(III) showing the main peak at 707.74 eV and a second peak at 709.46 eV, whilehexacyanoferrate(II) shows a single peak at 707.81 eV (Figure 14). Holgado, Rives, San-román, and Malet [38] showed based on Fe–K XANES analysis that partial reduction of

Materials 2021, 14, 7115 20 of 24
the Fe(III) in the hexacyanoferrate intercalated hydrotalcite had occurred. In addition,Idemura et al. [77] showed the reduction of iron in hexacyanoferrate(III) complexes byMössbauer spectroscopy. Yamashita and Hayes [26] observed that the Fe 2p3/2 for Fe(II)has a binding energy of about 1 eV lower than Fe(III) in their oxides. Similar results havebeen reported for thin iron oxide films [19] and iron sodium glasses [78]. Based on this,it can be concluded that the Fe 2p3/2 peak at 707.74 eV is due to Fe(II) due to partialreduction in the initial Fe(III) observed at 709.46 eV.
Materials 2021, 14, x FOR PEER REVIEW 20 of 24
for thin iron oxide films [19] and iron sodium glasses [78]. Based on this, it can be con-
cluded that the Fe 2p3/2 peak at 707.74 eV is due to Fe(II) due to partial reduction in the
initial Fe(III) observed at 709.46 eV.
(a) (b)
Figure 14. XPS high resolution scans of (a) hexacyanoferrate(III) intercalated hydrotalcite and (b) hexacyanoferrate(II)
intercalated hydrotalcite.
4. Conclusions
XPS was used to probe the local environments of intercalating or pillaring organic
and inorganic molecules within the interlayer surface of different types of clay minerals
and a layered double hydroxide (LDH or “anionic clay”). The preparation of these inter-
calated systems is dependent on the desired applications by optimizing and enhancing
the properties of the resulting products. Understanding the size, location, and structural
changes of the pillaring/intercalating compound within the clay mineral interlayer space
is important as it would impact the properties of the final modified clay. Raman and in-
frared spectroscopy together with XRD are the commonly used analytical techniques to
these intercalated systems. Yet, there are additional insights that can be provided by XPS
that cannot be obtained using these techniques as shown in this study. XPS of urea-inter-
calated kaolinite exhibited a significant shift of the Si 2p3/2 binding energy by 2 eV reveal-
ing the influence of NH2 on the siloxane group, which is contrary to observations from
Raman and IR that urea only interacted with the -OH groups of the octahedral sheet where
aluminum is located. XPS survey of K-acetate intercalated high- and low-defect kaolinite
showed that the K 2p3/2 peak was unaffected by the kaolinite defect structure and inter-
preted as having the K ion in both cases locked in the ditrigonal hole of the siloxane sur-
face of the tetrahedral sheet exposed to the interlayer space. There were observed differ-
ences in the binding energies of the aliphatic group and the O 1s of the kaolinite structure
of the two types of kaolinite where the low defect kaolinite is said to promote better or-
dering of K-acetate in the interlayer space to warrant the observation of the two oxygen
atoms in carboxylic acid separately. In the intercalation of montmorillonite with HDTMA,
the peak broadening and small shift in binding energies corroborates information pro-
vided by other techniques on the different types of orientation adopted by HDTMA
within the interlayer space of montmorillonite with varying CEC values. XPS of Ga13- and
Al13- and Al12Ga-pillared montmorillonite provided insights into the coordination of the
pillaring compound within the Mt layer and the transformations they underwent upon
calcination as well as the size of the polycation that fits better in the Keggin structure of
the pillar. Lastly, for hexacyanoferrate intercalated hydrotalcite, XPS revealed changes in
the oxidation state of the iron in the intercalating molecule. It is clear from these examples
that shifts in binding energies and presence of multiple peaks in XPS can provide infor-
Fe 2 2p3/2
Fe 2p3/2
Fe 2p1/2
Arb
itra
ry
Un
its
728 724 720 716 712 708 704
Binding Energy (eV)
Fe 2p3/2
Fe 2p1/2
Arb
itra
ry
Un
its
728 724 720 716 712 708 704
Binding Energy (eV)
Figure 14. XPS high resolution scans of (a) hexacyanoferrate(III) intercalated hydrotalcite and (b) hexacyanoferrate(II)intercalated hydrotalcite.
4. Conclusions
XPS was used to probe the local environments of intercalating or pillaring organicand inorganic molecules within the interlayer surface of different types of clay mineralsand a layered double hydroxide (LDH or “anionic clay”). The preparation of these inter-calated systems is dependent on the desired applications by optimizing and enhancingthe properties of the resulting products. Understanding the size, location, and structuralchanges of the pillaring/intercalating compound within the clay mineral interlayer space isimportant as it would impact the properties of the final modified clay. Raman and infraredspectroscopy together with XRD are the commonly used analytical techniques to theseintercalated systems. Yet, there are additional insights that can be provided by XPS thatcannot be obtained using these techniques as shown in this study. XPS of urea-intercalatedkaolinite exhibited a significant shift of the Si 2p3/2 binding energy by 2 eV revealing theinfluence of NH2 on the siloxane group, which is contrary to observations from Raman andIR that urea only interacted with the -OH groups of the octahedral sheet where aluminumis located. XPS survey of K-acetate intercalated high- and low-defect kaolinite showedthat the K 2p3/2 peak was unaffected by the kaolinite defect structure and interpretedas having the K ion in both cases locked in the ditrigonal hole of the siloxane surface ofthe tetrahedral sheet exposed to the interlayer space. There were observed differences inthe binding energies of the aliphatic group and the O 1s of the kaolinite structure of thetwo types of kaolinite where the low defect kaolinite is said to promote better orderingof K-acetate in the interlayer space to warrant the observation of the two oxygen atomsin carboxylic acid separately. In the intercalation of montmorillonite with HDTMA, thepeak broadening and small shift in binding energies corroborates information providedby other techniques on the different types of orientation adopted by HDTMA within theinterlayer space of montmorillonite with varying CEC values. XPS of Ga13- and Al13- andAl12Ga-pillared montmorillonite provided insights into the coordination of the pillaringcompound within the Mt layer and the transformations they underwent upon calcinationas well as the size of the polycation that fits better in the Keggin structure of the pillar.

Materials 2021, 14, 7115 21 of 24
Lastly, for hexacyanoferrate intercalated hydrotalcite, XPS revealed changes in the oxida-tion state of the iron in the intercalating molecule. It is clear from these examples thatshifts in binding energies and presence of multiple peaks in XPS can provide informationon the different environments surrounding a particular atom. Each element produces aspecific XPS signal which can be correlated to its electronic configuration which can also bequantified in relation to its sampling volume. Size, coordination, and structural transfor-mations of the intercalating/pillaring compounds and the changes in their oxidation statesprovide useful information that can be used to design intercalated systems with a specifictype of interaction to enhance the desired properties of these modified systems. Whencoupled with FTIR, RAMAN, and XRD, the overall information that can be generated forthese modified systems provides a stronger handle on the synthesis and quality of newmaterials produced.
Author Contributions: J.T.K. did the conceptualization; designed the methodology; and performedthe measurements/investigations, validation, and formal analysis. He also secured the resources,curated data, and supervised the junior researchers. J.T.K., C.P.P. and D.O.O. prepared the originaldraft and reviewed and edited the manuscript. All authors have read and agreed to the publishedversion of the manuscript.
Funding: This research received no external funding.
Institutional Review Board Statement: Not applicable.
Informed Consent Statement: Not applicable.
Acknowledgments: The authors acknowledge the facilities and the scientific and technical assistanceof the Australian Microscopy & Microanalysis Research Facility at the Centre for Microscopy andMicroanalysis, The University of Queensland. The authors also acknowledge the provision of libraryresources and access to journals by the University of the Philippines System.
Conflicts of Interest: The authors declare no conflict of interest.
References1. Lee, S.M.; Tiwari, D. Organo and inorgano-organo-modified clays in the remediation of aqueous solutions: An overview. Appl.
Clay Sci. 2012, 59-60, 84–102. [CrossRef]2. Kim, M.H.; Choi, G.; Elzatahry, A.; Vinu, A.; Bin Choy, Y.; Choy, J.-H. Review of Clay-drug Hybrid Materials for Biomedical
Applications: Administration Routes. Clays Clay Miner. 2016, 64, 115–130. [CrossRef] [PubMed]3. Schoonheydt, R.A. Reflections on the material science of clay minerals. Appl. Clay Sci. 2016, 131, 107–112. [CrossRef]4. Michels, L.; Fossum, J.O.; Rozynek, Z.; Hemmen, H.; Rustenberg, K.; Sobas, P.A.; Kalantzopoulos, G.N.; Knudsen, K.D.; Janek, M.;
Plivelic, T.S.; et al. Intercalation and Retention of Carbon Dioxide in a Smectite Clay promoted by Interlayer Cations. Sci. Rep.2016, 5, 8775. [CrossRef] [PubMed]
5. Negrón-Mendoza, A.; Ramos-Bernal, S. The Role of Clays in the Origin of Life. In Origins; Springer: Dordrecht, The Netherlands,2006; Volume 6, pp. 181–194. [CrossRef]
6. Lagaly, G.; Ogawa, M.; Dékány, I. Clay Mineral–Organic Interactions. In Developments in Clay Science; Bergaya, F., Lagaly, G., Eds.;Elsevier: Amsterdam, The Netherlands, 2013; Chapter 10.3; Volume 5, pp. 435–505.
7. Janíková, V.; Jóna, E.; Janik, R.; Pavlík, V.; Ondrušová, D.; Durceková, M. Formation of coordination compounds with aniline inthe interlayer space of Ca2+-, Cu2+- and Fe3+-exchanged montmorillonite. Chem. Pap. 2016, 70, 131–134. [CrossRef]
8. Mnasri, S.; Hamdi, N.; Frini-Srasra, N.; Srasra, E. Acid–base properties of pillared interlayered clays with single and mixed Zr–Aloxide pillars prepared from Tunisian-interstratified illite–smectite. Arab. J. Chem. 2017, 10, 1175–1183. [CrossRef]
9. Park, S.-J.; Seo, D.-I.; Lee, J.-R. Surface Modification of Montmorillonite on Surface Acid–Base Characteristics of Clay and ThermalStability of Epoxy/Clay Nanocomposites. J. Colloid Interface Sci. 2002, 251, 160–165. [CrossRef]
10. Kloprogge, J.T. Infrared and Raman Spectroscopies of Pillared Clays. In Developments in Clay Science; Gates, W.P., Kloprogge, J.T.,Madejová, J., Bergaya, F., Eds.; Elsevier: Amsterdam, The Netherlands, 2017; Chapter 12; Volume 8, pp. 411–446.
11. Slaný, M.; Jankovic, L’.; Madejová, J. Structural characterization of organo-montmorillonites prepared from a series of primaryalkylamines salts: Mid-IR and near-IR study. Appl. Clay Sci. 2018, 176, 11–20. [CrossRef]
12. Yesilbas, M.; Holmboe, M.; Boily, J.-F. Cohesive Vibrational and Structural Depiction of Intercalated Water in Montmorillonite.ACS Earth Space Chem. 2017, 2, 38–47. [CrossRef]
13. Lazorenko, G.; Kasprzhitskii, A.; Yavna, V. Comparative Study of the Hydrophobicity of Organo-Montmorillonite Modified withCationic, Amphoteric and Nonionic Surfactants. Minerals 2020, 10, 732. [CrossRef]

Materials 2021, 14, 7115 22 of 24
14. Zhou, X.; Liu, D.; Bu, H.; Deng, L.; Liu, H.; Yuan, P.; Du, P.; Song, H. XRD-based quantitative analysis of clay minerals usingreference intensity ratios, mineral intensity factors, Rietveld, and full pattern summation methods: A critical review. Solid EarthSci. 2018, 3, 16–29. [CrossRef]
15. Lagaly, G. Interaction of alkylamines with different types of layered compounds. Solid State Ionics 1986, 22, 43–51. [CrossRef]16. Bilgiç, C.; Yazıcı, D.T.; Karakehya, N.; Çetinkaya, H.; Singh, A.; Chehimi, M.M. Surface and interface physicochemical aspects of
intercalated organo-bentonite. Int. J. Adhes. Adhes. 2014, 50, 204–210. [CrossRef]17. Martins, M.G.; Martins, D.O.T.A.; de Carvalho, B.L.C.; Mercante, L.A.; Soriano, S.; Andruh, M.; Vieira, M.D.; Vaz, M.G.F. Synthesis
and characterization of montmorillonite clay intercalated with molecular magnetic compounds. J. Solid State Chem. 2015, 228,99–104. [CrossRef]
18. Madejová, J.; Jankovic, L’.; Slaný, M.; Hronský, V. Conformation heterogeneity of alkylammonium surfactants self-assembled onmontmorillonite: Effect of head-group structure and temperature. Appl. Surf. Sci. 2020, 503, 144125. [CrossRef]
19. Graat, P.C.J.; Somers, M.A.J. Simultaneous determination of composition and thickness of thin iron-oxide films from XPS Fe 2pspectra. Appl. Surf. Sci. 1996, 100–101, 36–40. [CrossRef]
20. Kloprogge, J.T.; Duong, L.V.; Wood, B.J.; Frost, R.L. XPS study of the major minerals in bauxite: Gibbsite, bayerite and (pseudo-)boehmite. J. Colloid Interface Sci. 2006, 296, 572–576. [CrossRef]
21. Kloprogge, J.T.; Wood, B.J. Systematic XPS study of gallium-substituted boehmite. J. Mater. Sci. 2016, 51, 5436–5444. [CrossRef]22. Koppelman, M.H.; Dillard, J.G. The Application of X-Ray Photoelectron Spectroscopy (XPS or ESCA) to the Study of Mineral
Surface Chemistry. In Developments in Sedimentology; Mortland, M.M., Farmer, V.C., Eds.; Elsevier: Amsterdam, Th Netherlands,1979; Volume 27, pp. 153–166.
23. Krepelová, A.; Bartels-Rausch, T.; Brown, M.A.; Bluhm, H.; Ammann, M. Adsorption of Acetic Acid on Ice Studied by Ambient-Pressure XPS and Partial-Electron-Yield NEXAFS Spectroscopy at 230–240 K. J. Phys. Chem. A 2013, 117, 401–409. [CrossRef]
24. Naranjo, P.M.; Sham, E.L.; Castellón, E.R.; Sánchez, R.M.T.; Torres, E.M.F. Identification and Quantification of the InteractionMechanisms Between the Cationic Surfactant HDTMA-Br and Montmorillonite. Clays Clay Miner. 2013, 61, 98–106. [CrossRef]
25. Schampera, B.; Solc, R.; Woche, S.; Mikutta, R.; Dultz, S.K.; Guggenberger, G.; Tunega, D. Surface structure of organoclays asexamined by X-ray photoelectron spectroscopy and molecular dynamics simulations. Clay Miner. 2015, 50, 353–367. [CrossRef]
26. Yamashita, T.; Hayes, P. Analysis of XPS spectra of Fe2+ and Fe3+ ions in oxide materials. Appl. Surf. Sci. 2008, 254, 2441–2449.[CrossRef]
27. Raeburn, S.P.; Ilton, E.S.; Veblen, D.R. Quantitative determination of the oxidation state of iron in biotite using X-ray photoelectronspectroscopy: II. In situ analyses. Geochim. Cosmochim. Acta 1997, 61, 4531–4537. [CrossRef]
28. Ilton, E.S.; Post, J.E.; Heaney, P.J.; Ling, F.T.; Kerisit, S.N. XPS determination of Mn oxidation states in Mn (hydr)oxides. Appl. Surf.Sci. 2016, 366, 475–485. [CrossRef]
29. Gonzalez-Elipe, A.R.; Espinos, J.P.; Munuera, G.; Sanz, J.; Serratosa, J.M. Bonding-state characterization of constituent elements inphyllosilicate minerals by XPS and NMR. J. Phys. Chem. 1988, 92, 3471–3476. [CrossRef]
30. Frost, R.L.; Kristóf, J.; Horváth, E.; Kloprogge, J.T. Raman spectroscopy of potassium acetate-intercalated kaolinites over thetemperature range 25–300 ◦C. J. Raman Spectrosc. 2001, 32, 271–277. [CrossRef]
31. Frost, R.L.; Kristóf, J.; Horváth, E.; Kloprogge, J.T. Modification of kaolinite surfaces through intercalation with potassium acetate,II. J. Colloid Interface Sci. 1999, 214, 109–117. [CrossRef]
32. Frost, R.L.; Kristof, J.; Rintoul, L.; Kloprogge, J.T. Raman spectroscopy of urea and urea-intercalated kaolinites at 77 K. Spectrochim.Acta Part A 2000, 56, 1681–1691. [CrossRef]
33. LeDoux, R.L.; White, J.L. Infrared studies of hydrogen bonding interaction between kaolinite surfaces and intercalated potassiumacetate, hydrazine, formamide, and urea. J. Colloid Interface Sci. 1966, 21, 127–152. [CrossRef]
34. He, H.; Frost, R.L.; Bostrom, T.; Yuan, P.; Duong, L.; Yang, D.; Xi, Y.; Kloprogge, J.T. Changes in the morphology of organoclayswith HDTMA+ surfactant loading. Appl. Clay Sci. 2006, 31, 262–271. [CrossRef]
35. He, H.; Frost, R.L.; Xhu, J. Infrared study of HDTMA+ intercalated montmorillonite. Spectrochim. Acta Part A Mol. Biomol.Spectrosc. 2004, 60, 2853–2859. [CrossRef]
36. He, H.; Zhou, Q.; Frost Ray, L.; Wood Barry, J.; Duong Loc, V.; Kloprogge, J.T. A X-ray photoelectron spectroscopy study ofHDTMAB distribution within organoclays. Spectrochimica acta. Part A, Molecular and biomolecular spectroscopy 2007, 66, 1180–1188.[CrossRef]
37. Frost, R.L.; Musumeci, A.W.; Bouzaid, J.; Adebajo, M.O.; Martens, W.N.; Kloprogge, J.T. Intercalation of hydrotalcites withhexacyanoferrate(II) and (III)—A thermoRaman spectroscopic study. J. Solid State Chem. 2005, 178, 1940–1948. [CrossRef]
38. Holgado, M.J.; Rives, V.; Sanromán, M.S.; Malet, P. Hexacyanoferrate-interlayered hydrotalcite. Solid State Ion. 1996, 92, 273–283.[CrossRef]
39. Duong, L.; Bostrom, T.; Kloprogge, T.; Frost, R. The distribution of Ga in Ga-pillared montmorillonites: A transmission electronmicroscopy and microanalysis study. Microporous Mesoporous Mater. 2005, 82, 165–172. [CrossRef]
40. Kloprogge, J.T.; Booy, E.; Jansen, J.B.H.; Geus, J.W. The Effect of Thermal Treatment on the Properties of Hydroxy-Al andHydroxy-Ga Pillared Montmorillonite and Beidellite. Clay Miner. 1994, 29, 153–167. [CrossRef]
41. Kloprogge, J.T.; Frost, R.L.; Fry, R. Infrared emission study of the thermal transformation mechanism of Al13-pillared clay. Analyst1999, 124, 381–384. [CrossRef]

Materials 2021, 14, 7115 23 of 24
42. Kloprogge, J.T.; Welters, W.J.J.; Booy, E.; de Beer, V.H.J.; van Santen, R.A.; Geus, J.W.; Jansen, J.B.H. Catalytic activity of nickelsulfide catalysts supported on Al-pillared montmorillonite for thiophene hydrodesulfurization. Appl. Catal. A Gen. 1993, 97,77–85. [CrossRef]
43. Frost, R.L.; Kristofb, J.; Paroz, G.N.; Tran, T.H.T.; Kloprogge, J.T. The Role of Water in the Intercalation of Kaolinite with PotassiumAcetate. J. Colloid Interface Sci. 1998, 204, 227–236. [CrossRef]
44. Kloprogge, J.T.; Seykens, D.; Jansen, J.B.H.; Geus, J.W. A 27Al nuclear magnetic resonance study on the optimalization of thedevelopment of the Al13 polymer. J. Non-Crystalline Solids 1992, 142, 94–102. [CrossRef]
45. Kloprogge, J.T. (Ed.) The Application of Vibrational Spectroscopy to Clay Minerals and Layered Double Hydroxides; Clay MineralsSociety: Chantilly, VA, USA, 2005. [CrossRef]
46. Kloprogge, J.T. Raman and Infrared Spectroscopies of Intercalated Kaolinite Groups Minerals. In Developments in Clay Science;Gates, W.P., Kloprogge, J.T., Madejová, J., Bergaya, F., Eds.; Elsevier: Amsterdam, The Netherlands, 2017; Chapter 11; Volume 8,pp. 343–410.
47. Kloprogge, J.T.; Wood, B.J. Baseline studies of the Clay Minerals Society Source Clays by X-ray Photoelectron Spectroscopy. ClaySci. 2018, 22, 85–94.
48. Beamson, G.; Briggs, D. High Resolution XPS of Organic Polymers: The Scienta ESCA300 Database; Wiley: Chichester, UK, 1992.49. Kloprogge, J.T.; Wood, B.J. Chemical bonding and electronic structures of the Al2Si2O5(OH)4 polymorphs kaolinite, dickite,
nacrite and halloysite by X-ray Photoelectron Spectroscopy. Clay Sci. 2015, 19, 39–44.50. Kloprogge, J.T. Spectroscopic Methods in the Study of Kaolin Minerals and Their Modifications; Springer Nature: Cham, Switzerland,
2018; p. 428.51. Kong, X.; Castarède, D.; Boucly, A.; Artiglia, L.; Ammann, M.; Bartels-Rausch, T.; Thomson, E.S.; Pettersson, J.B.C. Reversibly
Physisorbed and Chemisorbed Water on Carboxylic Salt Surfaces Under Atmospheric Conditions. J. Phys. Chem. C 2020, 124,5263–5269. [CrossRef]
52. Cruz, M.D.R.; Duro, F.I.F. New data on the kaolinite-potassium acetate complex. Clay Miner. 1999, 34, 565–577. [CrossRef]53. Tsai, Y.-T.; Chiou, J.-Y.; Liao, C.-Y.; Chen, P.-Y.; Tung, S.-H.; Lin, J.-J. Organically modified clays as rheology modifiers and
dispersing agents for epoxy packing of white LED. Compos. Sci. Technol. 2016, 132, 9–15. [CrossRef]54. Zabihi, O.; Ahmadi, M.; Khayyam, H.; Naebe, M. Fish DNA-modified clays: Towards highly flame retardant polymer nanocom-
posite with improved interfacial and mechanical performance. Sci. Rep. 2016, 6, 38194. [CrossRef]55. Kim, B.H.; Jung, J.H.; Hong, S.H.; Kim, J.W.; Choi, H.J.; Joo, J. Physical characterization of emulsion intercalated polyaniline–clay
nanocomposite. Curr. Appl. Phys. 2001, 1, 112–115. [CrossRef]56. Chanra, J.; Budianto, E.; Soegijono, B. Surface modification of montmorillonite by the use of organic cations via conventional ion
exchange method. In Proceedings of the IOP Conference Series: Materials Science and Engineering, Semarang, Indonesia, 7–8September 2018; Volume 509, p. 012057. [CrossRef]
57. Karaca, S.; Gürses, A.; Korucu, M.E. Investigation of the Orientation of Ions in the Interlayer of CTAB Pillared Montmorillonite. J.Chem. 2013, 2013, 274838. [CrossRef]
58. Ltifi, I.; Ayari, F.; Chehimi, D.B.H.; Ayadi, M.T. Physicochemical characteristics of organophilic clays prepared using twoorgano-modifiers: Alkylammonium cation arrangement models. Appl. Water Sci. 2018, 8, 91. [CrossRef]
59. Kloprogge, J.T. Synthesis of Smectites and Porous Pillared Clay Catalysts: A Review. ChemInform 2010, 29, 5–41. [CrossRef]60. Baloyi, J.; Ntho, T.; Moma, J. Synthesis and application of pillared clay heterogeneous catalysts for wastewater treatment:
A review. RSC Adv. 2018, 8, 5197–5211. [CrossRef]61. Figueras, F. Pillared Clays as Catalysts. Catal. Rev. 1988, 30, 457–499. [CrossRef]62. Rinaldi, N.; Kristiani, A. Physicochemical of pillared clays prepared by several metal oxides. In Proceedings of the AIP Conference
Proceedings, Yogyakarta, Indonesia, 15–16 November 2016. [CrossRef]63. Gil, A.; Korili, S.A.; Trujillano, R.; Vicente, M.A. A review on characterization of pillared clays by specific techniques. Appl. Clay
Sci. 2011, 53, 97–105. [CrossRef]64. Kloprogge, J.T.; Duong, L.V.; Frost, R.L. A review of the synthesis and characterisation of pillared clays and related porous
materials for cracking of vegetable oils to produce biofuels. Environ. Earth Sci. 2005, 47, 967–981. [CrossRef]65. Cardona, Y.; Vicente, M.A.; Korili, S.A.; Gil, A. Progress and perspectives for the use of pillared clays as adsorbents for organic
compounds in aqueous solution. Rev. Chem. Eng. 2021. Available online: https://www.degruyter.com/document/doi/10.1515/revce-2020-0015/html (accessed on 22 November 2021). [CrossRef]
66. Plee, D.; Borg, F.; Gatineau, L.; Fripiat, J.J. High-resolution solid-state aluminum-27 and silicon-29 nuclear magnetic resonancestudy of pillared clays. J. Am. Chem. Soc. 1985, 107, 2362–2369. [CrossRef]
67. Schutz, A.; Stone, W.E.E.; Poncelet, G.; Fripiat, J.J. Preparation and Characterization of Bidimensional Zeolitic Structures Obtainedfrom Synthetic Beidellite and Hydroxy-Aluminum Solutions. Clays Clay Miner. 1987, 35, 251–261. [CrossRef]
68. Montarges, E.; Michot, L.; Ildefonse, P. Structural Studies of Hydroxy-Ga Pillared Clays by Ga K-Edge X-Ray Absorption. J. Phys.IV 1997, 7, 822–830. [CrossRef]
69. Bradley, S.M.; Kydd, R.A.; Yamdagni, R. Detection of a new polymeric species formed through the hydrolysis of gallium(III) saltsolutions. J. Chem. Soc. Dalton Trans. 1990, 413–417. [CrossRef]
70. Bradley, S.M.; Kydd, R.A.; Yamdagni, R. Comparison of the hydrolyses of gallium(III) and aluminium(III) solutions by nuclearmagnetic resonance spectroscopy. J. Chem. Soc. Dalton Trans. 1990, 2653–2656. [CrossRef]

Materials 2021, 14, 7115 24 of 24
71. Bradley, S.M.; Kydd, R.A.; Yamdagni, R.; Fyfe, C.A. Clays. In Expanded Clays and Other Microporous Solids; Occelli, M.L., Robson,H.E., Eds.; Springer: Boston, MA, USA, 1992; pp. 13–31.
72. Rives, V. Layered Double Hydroxides: Present and Future; Nova Science Publishers: Huntington, NY, USA, 2001.73. Kloprogge, J.T.; Wood, B.J. Carbonates and Borates: Carbonates. In Handbook of Mineral Spectroscopy; Kloprogge, J.T., Wood, B.J.,
Eds.; Elsevier: Amsterdam, The Netherlands, 2020; Chapter 5; pp. 135–173. [CrossRef]74. Peng, C.; Yu, J.; Zhao, Z.; Dai, J.; Fu, J.; Zhao, M.; Wang, W. Synthesis and Properties of a Clean and Sustainable Deicing Additive
for Asphalt Mixture. PLoS ONE 2015, 10, e0115721. [CrossRef] [PubMed]75. Lucrédio, A.F.; Tremiliosi-Filho, G.; Assaf, E.M. Co/Mg/Al hydrotalcite-type precursor, promoted with La and Ce, studied by
XPS and applied to methane steam reforming reactions. Appl. Surf. Sci. 2009, 255, 5851–5856. [CrossRef]76. Kloprogge, J.T.; Wood, B.J. Oxides and Hydroxides: Oxides. In Handbook of Mineral Spectroscopy; Kloprogge, J.T., Wood, B.J., Eds.;
Elsevier: Amsterdam, The Netherlands, 2020; Chapter 4. [CrossRef]77. Idemura, S.; Suzuki, E.; Ono, Y. Electronic State of Iron Complexes in the Interlayer of Hydrotalcite-Like Materials. Clays Clay
Miner. 1989, 37, 553–557. [CrossRef]78. Mekki, A.; Holland, D.; McConville, C.F.; Salim, M. An XPS study of iron sodium silicate glass surfaces. J. Non-Cryst. Solids 1996,
208, 267–276. [CrossRef]


![N-[4-(3-methyl-3-mesityl-cyclobutyl)-thiazol-2-yl]-succinamic acid: X-ray structure, spectroscopic characterization and quantum chemical computational studies](https://static.fdokumen.com/doc/165x107/632d25baa00d0388c2095a8a/n-4-3-methyl-3-mesityl-cyclobutyl-thiazol-2-yl-succinamic-acid-x-ray-structure.jpg)