Performance of a first generation X-band photoelectron rf gun
21
Performance of a first generation X-band photoelectron rf gun C. Limborg-Deprey, * C. Adolphsen, D. McCormick, M. Dunning, K. Jobe, H. Li, T. Raubenheimer, A. Vrielink, T. Vecchione, F. Wang, and S. Weathersby SLAC National Accelerator Laboratory, Menlo Park, California 94025, USA (Received 24 August 2015; published 4 May 2016) Building more compact accelerators to deliver high brightness electron beams for the generation of high flux, highly coherent radiation is a priority for the photon science community. A relatively straightforward reduction in footprint can be achieved by using high-gradient X-band (11.4 GHz) rf technology. To this end, an X-band injector consisting of a 5.5 cell rf gun and a 1-m long linac has been commissioned at SLAC. It delivers an 85 MeV electron beam with peak brightness somewhat better than that achieved in S-band photoinjectors, such as the one developed for the Linac Coherent Light Source (LCLS). The X-band rf gun operates with up to a 200 MV=m peak field on the cathode, and has been used to produce bunches of a few pC to 1.2 nC in charge. Notably, bunch lengths as short as 120 fs rms have been measured for charges of 5 pC (∼3 × 10 7 electrons), and normalized transverse emittances as small as 0.22 mm-mrad have been measured for this same charge level. Bunch lengths as short as 400 (250) fs rms have been achieved for electron bunches of 100 (20) pC with transverse normalized emittances of 0.7 (0.35) mm-mrad. We report on the performance and the lessons learned from the operation and optimization of this first generation X-band gun. DOI: 10.1103/PhysRevAccelBeams.19.053401 I. INTRODUCTION There has long been an interest in having compact electron sources for a variety of accelerator applications such as FELs, electron scattering experiments, imaging and radiation therapy. In particular, large-scale X-ray Free Electron Lasers (XFELs), which are the ultimate tunable microscopes to probe matter on the atomic scale, have drive linacs that range from a few hundreds of meters to about kilometer in length. Currently, they are based on three rf technologies: 1.3 GHz, 24 MV=m, superconducting L-Band [1], 2.86 GHz, 17 MV=m, room-temperature S-Band [2–4], and 5.7 GHz, 35 MV=m, room temperature C-Band at SACLA [5] and SwissFEL [6]. For the future, there is interest in reducing the linac length to the 100-m level [7–9] by using room temperature, high gradient (70–100 MV=m), 11.4 GHz X-Band tech- nology that was developed for the NLC/GLC programs in the 1990’ s and early 2000’ s [10] while still delivering the high brightness electrons needed to produce high peak intensity photon bunches [11]. Other promising very-high gradient (1–10 GV=m) accelerator technologies—laser generated plasma wakefield acceleration [12] and beam generated plasma acceleration [13]—are being developed. The beam quality, reproducibility and stability are however still far from that needed to drive FELs. As an offshoot of the ∼100 M $ X-band program at SLAC, an X-band gun was built in the mid-2000s for a compact Compton source that was to be used for a medical application [14]. This was done during a period when the LCLS S-band gun was being developed and there was much interest in photoinjectors based on pulsed rf tech- nology. This first X-band gun operated with up to a 200 MV=m cathode peak field, but a detailed beam characterization was never performed as the program ended early. In the late 2000s, there was renewed interest in X-band technology from the experience with the X-band harmonic linearizer used at LCLS and planned elsewhere [15,16], the desire by laboratories to fit next generation light sources into existing lab space [17,18] and applications for compact gamma-ray Compton sources [19]. However, unlike S-band and C-band technology at that time, commercial high power klystrons were not available (one company makes them today), and a low-emittance X-band demonstration linac did not exist. To address this second issue, that is, showing that high gradient acceleration and low emittance bunches are simultaneously achievable, an all X-band injector was built in the Next Linear Collider Test Area (NLCTA) at SLAC, which has four high power X-band sources (each producing up to 200 MW, 250 ns long pulses). Called the X-Band Test Area (XTA), this accel- erator runs parallel to the original beamline at the downstream end of the accelerator enclosure, but it is only about 7 m long. The rf gun presently in operation at XTA is denoted “Mark-0, ” and is basically a copy of the 5.5 cell original * [email protected] Published by the American Physical Society under the terms of the Creative Commons Attribution 3.0 License. Further distri- bution of this work must maintain attribution to the author(s) and the published article’s title, journal citation, and DOI. PHYSICAL REVIEW ACCELERATORS AND BEAMS 19, 053401 (2016) 2469-9888=16=19(5)=053401(21) 053401-1 Published by the American Physical Society
-
Upload
khangminh22 -
Category
Documents
-
view
1 -
download
0
Transcript of Performance of a first generation X-band photoelectron rf gun

Performance of a first generation X-band photoelectron rf gun
C. Limborg-Deprey,* C. Adolphsen, D. McCormick, M. Dunning, K. Jobe, H. Li,T. Raubenheimer, A. Vrielink, T. Vecchione, F. Wang, and S. WeathersbySLAC National Accelerator Laboratory, Menlo Park, California 94025, USA
(Received 24 August 2015; published 4 May 2016)
Building more compact accelerators to deliver high brightness electron beams for the generation of highflux, highly coherent radiation is a priority for the photon science community. A relatively straightforwardreduction in footprint can be achieved by using high-gradient X-band (11.4 GHz) rf technology. To thisend, an X-band injector consisting of a 5.5 cell rf gun and a 1-m long linac has been commissioned atSLAC. It delivers an 85 MeV electron beam with peak brightness somewhat better than that achieved inS-band photoinjectors, such as the one developed for the Linac Coherent Light Source (LCLS). TheX-band rf gun operates with up to a 200 MV=m peak field on the cathode, and has been used to producebunches of a few pC to 1.2 nC in charge. Notably, bunch lengths as short as 120 fs rms have been measuredfor charges of 5 pC (∼3 × 10⁷ electrons), and normalized transverse emittances as small as 0.22 mm-mradhave been measured for this same charge level. Bunch lengths as short as 400 (250) fs rms have beenachieved for electron bunches of 100 (20) pC with transverse normalized emittances of 0.7 (0.35) mm-mrad.We report on the performance and the lessons learned from the operation and optimization of this firstgeneration X-band gun.
DOI: 10.1103/PhysRevAccelBeams.19.053401
I. INTRODUCTION
There has long been an interest in having compactelectron sources for a variety of accelerator applicationssuch as FELs, electron scattering experiments, imagingand radiation therapy. In particular, large-scale X-ray FreeElectron Lasers (XFELs), which are the ultimate tunablemicroscopes to probe matter on the atomic scale, have drivelinacs that range from a few hundreds of meters to aboutkilometer in length. Currently, they are based on threerf technologies: 1.3 GHz, 24 MV=m, superconductingL-Band [1], 2.86 GHz, 17 MV=m, room-temperatureS-Band [2–4], and 5.7 GHz, 35 MV=m, room temperatureC-Band at SACLA [5] and SwissFEL [6].For the future, there is interest in reducing the linac
length to the 100-m level [7–9] by using room temperature,high gradient (70–100 MV=m), 11.4 GHz X-Band tech-nology that was developed for the NLC/GLC programsin the 1990’s and early 2000’s [10] while still deliveringthe high brightness electrons needed to produce high peakintensity photon bunches [11]. Other promising very-highgradient (1–10 GV=m) accelerator technologies—lasergenerated plasma wakefield acceleration [12] and beamgenerated plasma acceleration [13]—are being developed.The beam quality, reproducibility and stability are howeverstill far from that needed to drive FELs.
As an offshoot of the ∼100 M $ X-band program atSLAC, an X-band gun was built in the mid-2000s for acompact Compton source that was to be used for a medicalapplication [14]. This was done during a period when theLCLS S-band gun was being developed and there wasmuch interest in photoinjectors based on pulsed rf tech-nology. This first X-band gun operated with up to a200 MV=m cathode peak field, but a detailed beamcharacterization was never performed as the programended early.In the late 2000s, there was renewed interest in X-band
technology from the experience with the X-band harmoniclinearizer used at LCLS and planned elsewhere [15,16], thedesire by laboratories to fit next generation light sourcesinto existing lab space [17,18] and applications for compactgamma-ray Compton sources [19]. However, unlike S-bandand C-band technology at that time, commercial highpower klystrons were not available (one company makesthem today), and a low-emittance X-band demonstrationlinac did not exist. To address this second issue, that is,showing that high gradient acceleration and low emittancebunches are simultaneously achievable, an all X-bandinjector was built in the Next Linear Collider Test Area(NLCTA) at SLAC, which has four high power X-bandsources (each producing up to 200 MW, 250 ns longpulses). Called the X-Band Test Area (XTA), this accel-erator runs parallel to the original beamline at thedownstream end of the accelerator enclosure, but it is onlyabout 7 m long.The rf gun presently in operation at XTA is denoted
“Mark-0,” and is basically a copy of the 5.5 cell original
Published by the American Physical Society under the terms ofthe Creative Commons Attribution 3.0 License. Further distri-bution of this work must maintain attribution to the author(s) andthe published article’s title, journal citation, and DOI.
PHYSICAL REVIEW ACCELERATORS AND BEAMS 19, 053401 (2016)
2469-9888=16=19(5)=053401(21) 053401-1 Published by the American Physical Society

design (using leftover parts), but with a race-track shapedcoupling cell to minimize undesired quadrupole head-taileffects in the electron bunch. The idea was to use this gunto debug the XTA before a new, more optimized design,call the Mark-1 (see Fig. 1) was deployed. The new gundesign was developed in collaboration with LLNL, and has5.6 cells, a race-rack coupler, elliptical contoured irises, anrf coupling that better balances pulsed heating with cavityfill time and a larger mode separation [20]. Two Mark-1guns were built, one that was to be used in XTA (but nowwould require additional funding to test), and one that wasoperated at LLNL, although without optimizing the beamemittance [19]. In this paper, we report on the performanceof the Mark-0 gun at XTA.
Besides providing a general demonstration of lowemittance, high gradient acceleration, the XTA was alsoto serve as a test area for X-band rf guns targeted forcompact FELs and Inverse Compton Scattering sources.Calculations indicate that the maximum peak brightnessfrom an X-band gun with a peak cathode field of200 MV=m is close to an order of magnitude larger thanthat from the standard 2.9 GHz S-band technology wherethe gun typically operates with a peak acceleration field of120 MV=m. This improvement comes from a reduction ofthe bunch length by a factor of three to four and from areduction in the product of the horizontal and verticalemittances by another factor of about two. Note that thecathode field during photo-emission in the LCLS gun,
FIG. 1. Mark-1 5.6 cell X-band gun. (a) Photo of the X-band gun: an S-band gun cathode is shown on the right for comparison,(b) CAD model of the gun, (c) cross section of the gun (d) the pi-mode longitudinal field (Ez) along the axis.
C. LIMBORG-DEPREY et al. PHYS. REV. ACCEL. BEAMS 19, 053401 (2016)
053401-2

which represents the state-of-the-art in S-band guns, is60 MV=m at an injection phase of 30 degrees from thezero-crossing. For the “Mark-0” X-band gun, the launchphase is 50 degrees and the field at emission is 150 MV=m.
II. THE XTA
A. The rf gun
The basic geometry of the Mark-0 gun is the same as thatfor the Mark-1 gun. A Computer Aided Design (CAD)model is shown in Fig. 1(b). Two input power couplingports are located 180 degrees apart on the sides of thedownstream most cell. The shape of the inner contour ofthis cell has been modified from cylindrical to that of aracetrack to restore at best the cylindrical symmetry of theelectromagnetic fields. This compensation in the geometrysuppresses the undesired quadrupole mode which wouldotherwise degrade the emittance. A profile of the longi-tudinal electric field (Ez) along the symmetry axis is plottedin Fig. 1(c) for the pi-mode, which is used for capture andacceleration. The next nearest mode frequency is 12 MHzand 25 MHz away from the pi-mode frequency, respec-tively, for the Mark-0 and the Mark-1 guns.The cathode is brazed to the first cell, which is 0.5=0.6
as long as the standard cells in the Mark-0/Mark-1 guns.The cathode is consequently non-demountable. The exper-imental data reported in this paper were taken with theMark-0 gun. Awater cooling channel is brazed to the backof the cathode and is visible in Fig. 1(a). The coppercathode diameter is consequently as large as the cellinternal diameter of 21.8 mm. However the irises separatingthe cells limit the aperture along the gun to 8 mm, and thecathode region accessible by the laser is limited to a disk ofapproximately 7 mm.
B. The XTA beamline and power distribution
A photo of the XTA is shown in Fig. 2 and a schematic isgiven in Fig. 3. To power the XTA, a single rf source, an
XL4 klystron, is utilized to deliver power both to the rf gun,where the electrons are generated and first accelerated, andto the single accelerator structure. The klystron provides upto 50 MWof X-band rf power in a 1.5 μs long pulse, whichis compressed in 40 m long SLED-II lines [21] up to200 MW in a 250 ns long pulse. The maximum klystronrepetition rate is 60 Hz, although we generally ran at 10 Hzto limit beam-induced radiation.Approximately 20% of the power is attenuated in a
circular-waveguide transport line that runs from theSLED-II output on the roof of the NLCTA enclosure tothe XTA beamline. This power is then split via a 6 dBhybrid with 75% going to the accelerator structure and 25%to an adjustable power splitter before the gun. A highpower, remotely-controllable, TE01-mode phase shifterwith a 90 degree phase adjustment range is located in
FIG. 2. X-Band test area beamline. The 1.05 m long copper accelerator structure is seen in the middle of the photo, and one of threephase shifters is visible on the wall. The apparent curvature of the beamline is an artefact of the wide-view camera lens.
FIG. 3. Schematic of the XTA. PS1, 2, and 3 are rf phaseshifters, YAGS is an yttrium aluminum garnet screen, OTRS is anoptical transition radiation screen, TCAV is an X-band deflectingcavity (powered by a different RF source) and RMO is the RFmaster oscillator.
PERFORMANCE OF A FIRST GENERATION … PHYS. REV. ACCEL. BEAMS 19, 053401 (2016)
053401-3

the transmission line that powers the accelerator. In thetransmission line feeding the gun, the power is first split bymeans of a 3 dB hybrid and then each half passes through aphase shifter of the same design as used for the accelerator.These two lines recombine by means of another 3 dBhybrid and the power is transported to the gun. These twophase shifters can also be remotely controlled, allowing thephase and amplitude of the gun rf to be varied over a rangeof 90 degrees in phase and more than 20 dB in power (theunused power is absorbed in a load). The three phaseshifters are shown in Fig. 4.
The transmission loss from the splitter to the gun isexpected to be about 15%, so a maximum of 17% of theSLED-II output power can reach the gun. To produce apeak field of 200 M=m on the cathode with a 180 ns squareinput pulse, 17 MW is required at the input to the gun. Wetune the gun line phase shifters to achieve the desiredcathode field with typically 140 MW to 180 MW ofSLED-II output power, of which 75 MW to 97 MW powersthe 1.05 m long, ‘T105’ accelerator structure for thesubsequent bunch acceleration. Generation and accelera-tion of photoelectron bunches up to 85 MeV have beendemonstrated in the gun plus accelerator section, which isonly 1.8 m long.Inferring the cathode gradient based on the SLED-II
power has much uncertainty due to unknown rf mismatchesin the waveguides runs, setting accuracy of the gun phaseshifters and nonideal rf pulse shapes. As discussed inSec. IV B 2, comparing laser-to-beam relative-time-of-arrival (RTOA) measurements to predications is probablythe best calibration of the cathode field in the gun (given theabsence of a dedicated high resolution spectrometer atthe gun exit) and indicates that a 15.3 MW power at thegun input , available from a 150 MW SLED-II pulse in oursystem, produces a 190 MV=m cathode peak field.
C. Laser and cathode quantum efficiency
The XTA laser system consists of an Elite regenerativeamplifier from Coherent that is fed by a Ti∶Sa Tsunamioscillator from Spectra Physics. It delivers 4 mJ IR pulsesat 600 Hz. After recompression and conversion to UV at266 nm, pulses of up to 300 μJ were available on the lasertable adjacent to the accelerator. A high reflectivity mirrorwas used to direct the 50 to 60 fs long pulses to the cathode
FIG. 4. Three high power phase shifters: the top two (coppercylinders with bellows on each end) are used to adjust the powergoing to the gun, and the third phase shifter (below the other two)is installed on the branch line that feeds the linac structure (in thephoto, it is obscured by a metal support plate).
FIG. 5. Schematic of XTA laser system.
C. LIMBORG-DEPREY et al. PHYS. REV. ACCEL. BEAMS 19, 053401 (2016)
053401-4

where the pulse energy was as high as 240 μJ. A schematicof the laser system is shown in Fig. 5.The highly energetic laser pulses had to be used with
caution—they damaged optics and accelerator componentson several occasions. Having higher quantum efficiency(QE) would have facilitated the operation. With a non-demountable cathode, laser cleaning of the cathode surfacewould have been the most appropriate means to improvethe QE. However, given the risk involved, this was notattempted.The QE of the Mark-0 gun cathode was relatively low
with values of 2 × 10⁻⁵ at best in the good regions of thecathode. However, it was large enough to commission therf gun and beamline and generate bunches ranging from afew pC up to 1.2 nC.
III. BEAM DYNAMICS IN THE X-BAND GUN
The advantages of using high gradient fields in the gunand during the initial acceleration of the electrons are thatthe charge density on the cathode surface can be higher andthe electrons will reach relativistic velocities more rapidly,reducing the effects of space charge forces. Simulationsshow that these benefits can increase the peak bunchbrightness by close to an order of magnitude when usingX-band technology compared with S-band technology.
A. Advantages of a high cathode field gradient
In Fig. 6(a), the increase in the energy of an electron in agun (expressed by γ) is shown during the first 33 ps ofacceleration, during which the electrons travel several mmbeyond the cathode. Also shown in Fig. 6(b) are the fieldswitnessed by the electron and its longitudinal positionversus time. For this calculation, the S-band gun is assumedto operate with a 120 MV=m cathode field and the X-bandgun with a 200 MV=m field, which are near the upperlimits for reliable operation at these two frequencies (atthese field levels, breakdown events occur rarely). Thesefield values are assumed in the following discussion unlessnoted otherwise. As described in [22], the transverse spacecharge force has a 1=γ2 dependence and the primarydetrimental space charge effect occurs in the region whereγ is less than about two. As seen in Fig. 6(a), γ reaches thislevel roughly twice as fast in the X-band case.
B. Beam dynamics in the presence of space charge
Due to the rapid increase in γ the bunch length is frozen1–3 mm downstream of the cathode, approximately 1 mmfor low space charge and 3 mm for high space charge. Fornegligible or low space charge, the electron bunch lengthdepends strongly on the initial laser-to-rf phase andthe final bunch lengths are similar for X-band and S-band.
FIG. 6. (a) Evolution of γ with time for a single electron in a 200 MV=m X-band gun (blue) and a 120 MV=m S-band gun (magenta)for different initial rf phases, (b) corresponding longitudinal electric field seen by the electron and (c) distance from cathode as afunction of time.
PERFORMANCE OF A FIRST GENERATION … PHYS. REV. ACCEL. BEAMS 19, 053401 (2016)
053401-5

The electron bunch is compressed (via velocity bunching)with respect to the initial laser pulse length when running atphases near the rf zero crossing. For intermediate spacecharge levels, the beam in an X-band gun still behavessimilarly to that in the low space charge regime, withmoderate or no compression, whereas the beam in theS-band gun already behaves as that in the high space chargeregime, in which no bunch compression occurs. Largerinitial phases in the high space charge regime give shorterbunches in general as the freezing process is more rapidsince the cathode field is closer to maximum. Accordingly,the X-band gun achieves bunch lengths which are 2 to 4times smaller than for the S-Band gun for similar laser spotsizes and bunch charges in this regime.The high field present in the X-band gun also allows
operation at higher charges for smaller laser spot sizes [23].The space charge limit equation, which is the directconsequence of Gauss’s law, is given in Eq. (1), whereE is the cathode field, Q the charge and r the laser spotradius. With an increase in the cathode field by a factor oftwo, the spot size radius can be reduced by a square root oftwo for the same charge and thus the initial emittance isreduced by this same factor. However, this scaling onlyapplies for small spot sizes near the cathode surface. Forlarger spot sizes, nonlinear focusing effects in an X-bandgun are stronger than in an S-band gun, which leads totransverse emittance degradation (i.e., the emittance doesnot scale with r).
E ¼ σ
εo¼ Q
εoπr2ð1Þ
In addition, Eq. (1) is valid as long as the aspect ratioof the laser pulse is similar to that of a “pancake”. For atime-elongated laser profile, i.e., “cigar shape,” the spacecharge limit can be violated [23,24]. The current limit isthen defined by the Child-Langmuir law with the chargeproportional to the 3=2 power of the product of radius timesacceleration field as described in Equation (2) of [23].
C. Beam dynamics at very low charge
To illustrate how the final bunch length varies with theinitial laser-to-rf phase and the laser spot size, simulationswere performed using ASTRA [25] for the case of a 30 fCbunch charge. These simulations were originally performedto illustrate the advantage using an X-band gun for ultra-fast electron diffraction (UED) applications for which anextremely small divergence and short bunch length isdesired for a charge as large as possible. As an example,for a laser spot size of 25 μm in radius, which produces aninitial 11 nm transverse emittance bunch assuming athermal emittance of 0.9 mm-mrad per mm laser spot size,the resulting bunch lengths exiting the X-band gun can beas small as 25 fs rms, much shorter than 42 fs rms, theminimum an S-band gun can produce for this laser spot
size. Figure 7 illustrates this and other examples—themagenta curves correspond to low space charge, the blueand red curves to moderate space charge and the green onesto high space charge.
D. Beam dynamics at intermediate charge
A beam parameter optimization was done for both anX-band and S-band injector using the space charge codeASTRA for bunches of 20 pC, which was the typical bunchcharge used to commission the XTA, and a typical chargeused in XFELs. The X-band injector beamline was similarto that of the XTA but with the linac accelerator structurelocated 0.55 m from the cathode, instead of 0.85 m. TheS-band injector was basically the first 5 m of the LCLSinjector which includes a 1.6 cell S-band gun operatedwith a 120 MV=m cathode field and a 3 m long linacoperated at 18 MV=m and located 1.4 m from the cathode.Extensive simulations were run for the LCLS design andcan be found in [26].The optimizations were done in the “blow-out” regime
assuming FWHM laser pulse lengths of 60 fs, 120 fs and180 fs (at XTA, laser pulse lengths between 60 fs and 120 fswere used). Both the laser-to-rf injection phase and thesolenoid field amplitude were varied in an extensive 2Dscan for each laser pulse length. The process was repeatedfor individual laser transverse spot sizes varying from aradius of 70 μm to 1 mm.Figure 8 shows plots of the minimum emittance, the
corresponding bunch length and highest peak brightness forthese scans versus laser spot size radius. The peak bright-ness is defined as the charge in pC times the inverse of theproduct of the rms bunch length in ps and the square ofthe 95% transverse normalized emittance in mm-mrad. Themaximum peak brightness of the X-band system is 6 timeslarger than that for S-band. However the spectral brightness
FIG. 7. RMS bunch length versus laser-to-rf phase for differentlaser pulse durations and spot sizes, but a fixed 30 fC charge(i.e., 2 × 10⁵ electrons) calculated at a distance 0.2 m from thecathode.
C. LIMBORG-DEPREY et al. PHYS. REV. ACCEL. BEAMS 19, 053401 (2016)
053401-6

increase is smaller because the uncorrelated energy spreadin the X-band gun is larger for a similar charge. Howeverthis is not important for FEL applications as the sliceenergy spread needs to be increased anyway to suppressmicrobunching.
E. Beam dynamics at high charge
A similar optimization was done for 100 pC bunchcharges. Again, laser pulse lengths of 60 fs, 120 fs and180 fs FWHM were used. The results are summarized inFig. 9. In this case, the maximum peak brightness is10 times larger at X-band than at S-band.Both the 20 pC and 100 pC cases were optimized for
short laser pulses in the blow-out pancake regime, i.e., withan aspect ratio of the laser pulse length to laser transversespot dimension close to or smaller than unity. Slightlysmaller transverse emittances can be achieved with cigar-shaped laser pulses as a transverse spot size smaller than thelimit inferred from Eq. (1) can be generated [23]. Howeverthe reduction in emittance is very small, usually only for thecore slices, and is achieved at the expense of a much longerbunch length.
IV. OPERATION OF THE X-BANDGUN AND LINAC
A. Dark current from the rf gun
We first note that we use the term “dark current” to referto the net electron charge from field emission that iscaptured/accelerated during a pulse.It had been generally believed that a high gradient rf gun
would be of limited use due to high levels of dark currentsthat would be coaccelerated. The Mark-0 gun producesdark currents at the level of hundreds of pC, but we canstill achieve relatively “clean,” low emittance, low charge(a few pC) electron bunches. For our nominal operatingconditions, the dark current is limited to a few tens of pCafter acceleration in the linac where the 6 mm diameterbeam tubes at each end of the 1 m long accelerator structureact as collimators. The transmitted dark current has a wideenergy spread and transverse size, and thus can be furthercollimated if necessary.The gun dark current comes primarily from the cathode
and is believed to be enhanced by the surface roughness.The cathode roughness can be characterized on twodistance scales. On the 1 micron scale, the roughness is
FIG. 8. Results from charge parameter scans as a function of the laser spot size radius for 20 pC bunches where the blue crosses are forX-band (200 MV=m cathode field) and the red circles are for S-band (120 MV=m cathode field): (a) minimum 95% transverseemittance, (b) minimum bunch length, (c) maximum peak brightness.
FIG. 9. Results from 100 pC bunch charge parameter scans as a function of the laser spot size radius where the blue crosses are forX-band (200 MV=m cathode field) and the red circles are for S-band (120 MV=m cathode field}: (a) minimum 95% transverseemittance, (b) minimum bunch length and (c) maximum peak brightness.
PERFORMANCE OF A FIRST GENERATION … PHYS. REV. ACCEL. BEAMS 19, 053401 (2016)
053401-7

on the order of 100 nm rms due to the machining finish(unfortunately, it was not possible to diamond fly cut thecathode to reduce this). At the 10-100 micron scale, thereare divots and spikes, probably 1-10 microns in height anddepth, generated from rf breakdown and laser induceddamage. Images of the cathode are shown in Fig. 10. Theroughness is believed to contribute to the somewhat largerthermal emittance that was measured (see Sec. VI B). Also,emission and thermal emittance can vary by factors oftwo with grain orientation [27]. Unless the cathode isdismantled from the gun and the surface analyzed, therelative effects of roughness and grain orientation on thegun performance would be hard to evaluate. A zoomedimage [Fig. 10(c)] of the illuminated cathode shows strongvariations in the surface topology at a scale of typically100 μm, but also down to 20 μm or less.Dark current emission is described by the Fowler-
Nordheim equation, and electrons originating near the
cathode center are readily captured in the gun. Theaccelerated dark current as a function of peak field onthe cathode was measured with a Faraday cup located0.56 m away from the cathode and is plotted in Fig. 11. Thedark current energy distribution was centered at 4 MeV forcathode gradients above 190 MV=m, where we typicallyran. These data were taken using 147 ns long, square rfinput pulses, during which the cathode field reached 91%of its long-pulse limit. The gun solenoid was adjusted tomaximize the captured dark current at each power level andthe gun was operated a temperature of 50 °C, about 3 °Cbelow the on-resonance value. Using a simplified form ofthe Fowler-Nordheim equation [28], a field enhancementfactor (beta) of 55 was obtained, which is similar to betavalues derived from field emission in X-band accelerators[29,30]. It should be noted, however, that the fraction ofemitted electrons that are captured varies with gradient.Figure 11 shows both a power law and the Fowler-Nordheim equation fit to the data.
FIG. 10. Cathode surface images taken through the extraction mirror (opposite to the injection mirror) using a camera just outside ofthe vacuum chamber. (a) This image was taken using visible light after the gun was rf conditioned but before the first photoelectron beamwas generated. The surface already appears damaged at this stage. (b) Cathode surface imaged with visible light after 2 years ofoperation of the gun. The center circle of bright spots fills the entire 7 mm diameter cathode. (c) Zoomed area of the cathode imageshown in (b).
FIG. 11. Integrated dark current as a function of cathodegradient with 147 ns long rf pulses measured 0.56 m from thecathode.
FIG. 12. Dark current as a function of gun temperature at twodifferent SLED-II power levels with 147 ns pulses.
C. LIMBORG-DEPREY et al. PHYS. REV. ACCEL. BEAMS 19, 053401 (2016)
053401-8

The field amplitudes and phases in the 6 cells of the rfgun vary with temperature for a given input power, whichchanges how much dark current is produced and captured.In particular, as the temperature increases, the rf matchchanges and the cathode field decreases relative to the fieldsin the downstream cells. As a consequence, the dark currentdecreases, as can be seen in Fig. 12.Not only was the cathode damaged, but the iris edges
were as well, in particular when the laser energy densityexceeded the ablation threshold and the laser was mis-steered, hitting the coupler iris. The small (8 mm) irisdiameters of the gun made the laser setup challenging.The amount of copper removed was large enough to shiftthe resonant frequency by 4 MHz (equivalent to a 19 °Ctemperature change), resulting in a field profile that wasno longer flat at the resonant frequency, but instead lowerat the cathode end relative to the downstream end. All butthe emittance data were taken before the main detuningoccurred.
B. Measurements of the beam energy and gun gradient
1. Direct energy measurement
Figure 13 shows the expected energy of a single electronexiting the gun versus rf phase with respect to the laser arrivalfor various cathode field gradients. At XTA, the beam energywas measured by deflecting it just after the gun with acorrector magnet and observing the downstream change inposition. We did this using both horizontal and verticalcorrector magnets located 20 cm upstream of a YttriumAluminum Garnet (YAG) profile monitor, and the resultsare shown inFig. 14. The energies inferred from the horizontaland vertical kicks agree well. The calibration of the correctorswas accuratelymeasured at theSLACMagneticMeasurementFacility. The magnetic field versus current curve exhibits a
relatively large hysteresis, with a 10% difference in slopeswhen cycling the magnet up or down. The agreement inthe energy data for the two planes could only be obtainedafter accounting for this hysteresis. Note that measuring thebunch centroid at a cathode gradient of 170 MV=m wasdifficult as the dark current obscured the photoelectronbeam, and thus the error bars on these data are larger.The rf phase is arbitrarily chosen to be zero when the
beam first appears for a 170 MV=m cathode field. For asingle particle, this would correspond to the rf zero-crossing, whereas for our measurements, it is delayed asthe applied field has to overcome image charge fieldsbefore the beam is accelerated. Accordingly, the phasedelay is larger for the lower gradient data, and the beam
FIG. 13. Calculated single electron energy from the X-bandgun versus the cathode rf phase at the laser arrival time for variouscathode gradients. Zero phase corresponds to the rf zero-crossing.
FIG. 14. Bunch energy versus rf-to-laser phase measured afterthe gun at different cathode gradients using either the horizontal(data points with crosses) or vertical corrector magnets (datapoints with circles). The gradient is based on the SLED-II powerlevel with the expectation that 150 MW, corresponding to15.3 MW at the gun input, yields a 190 MV=m cathode field(as discussed below).
FIG. 15. Simulated RTOA versus rf phase relative to the laserarrival for different cathode gradients.
PERFORMANCE OF A FIRST GENERATION … PHYS. REV. ACCEL. BEAMS 19, 053401 (2016)
053401-9
turn-on occurs at a larger phase, as can be seen in Fig. 14.Given this caveat, the agreement of the data with theexpectations is reasonable.
2. Gun gradient inferred from relative timeof arrival measurements
The relative time of arrival (RTOA) of the electron bunchwith respect to the rf phase was measured using the phaseof the signal from an X-band single-cell cavity locatedjust upstream of the accelerator structure. This monopoleTM010 mode cavity has a 12.85 GHz resonant frequencyand was nominally used to provide a beam-to-rf referencephase when analyzing the dipole signals from the asso-ciated dipole cavity (i.e., as part of an rf BPM). Thisfrequency was chosen to be offset from 11.424 GHz so asnot to “see” dark current and to allow locking to the masteroscillator with “simple” rf multiply/divide steps. The signalwas processed via in-phase and in-quadrature (I&Q) analogdemodulation electronics to extract phase and amplitude.Such RTOA measurements are usually performed at low
energy, a few hundred keV, to determine the electron beamenergy, but not for MeV beams as was done here.The beam phase was measured with respect to the master
rf clock which consists of a crystal oscillator at 476 MHz.This master signal is multiplied to 2.856 GHz and then to11.424 GHz. The jitter of the 2.856 GHz reference signalwas measured to be 70 fs rms. A signal source analyzer(SSA), which itself has two reference crystal oscillators,was used for this measurement. The laser oscillator waslocked to this 2.856 GHz reference signal.The RTOA predictions and measurements are plotted in
Fig. 15 and Fig. 16, respectively, and compared in Fig. 17.For the measurements, the beam-to-rf phase from themonopole cavity signal is plotted as a function of thelaser-to-rf phase. This phase comparison is shown forvarious cathode gradients. The best fit to the 150 MW,corresponding to 15.3 MW at the gun input, data are the190 MV=m predictions, which is roughly the expectedcathode gradient for this power (as noted above, variousuncertainties make it hard to accurately predict the gradientbased on the SLED-II power).For each rf phase, 50 RTOA samples were recorded. The
variation of these data are a result of the (a) laser timing jitterwith respect to the rf master source, (b) rf phase jitter withrespect to the rf master source, (c) noise in the processingelectronics (down-mixing of 12.85 GHz to reconstitutephase), and (d) fluctuations in the rf gun field amplitude.While a more detailed discussion of these sources is beyondthe scope of this paper, it is worth noting that the RTOAjitter is smallest (about 0.5 deg X-Band or 125 fs—see theerror bars in right-most plot in Fig. 16) at the minimumRTOAwhere the rf phase jitter has a negligible effect. Thisjitter is comparable to that of the laser timing, indicating thatthe other contributions are not large.
C. Operation of the high gradient linac
The T105 X-band traveling wave accelerator used atXTA was upgraded after a few months of operation. Thenewer version has input and output couplers with rounderedges at the waveguide openings—the sharp edges in the
FIG. 16. Measured relative time of arrival (converted to phase at11.424 GHz) versus rf phase relative to the laser arrival fordifferent SLED-II power levels. The RF pulse length was 140 ns.
FIG. 17. (a) RTOA measurements at 150 MW compared with simulations at gradients of 190 MV=m and 200 MV=m, (b) zoom-in ofthe data near the RTOA minimum. RMS fluctuations were calculated using the 50 sample points.
C. LIMBORG-DEPREY et al. PHYS. REV. ACCEL. BEAMS 19, 053401 (2016)
053401-10
original version had limited its gradient to around70 MV=m due to pulsed heating effects. The newer versionis capable of running to up about 90 MV=m with a lowbreakdown rate (<1 in 106 pulses), and also has racetrackshaped couplers and provisions for attaching rf BPMs ateach end.The new T105 was conditioned to 80 MV=m. At this
gradient, no dark current (<few pC with 120 ns pulses) wasmeasured on a Faraday Cup located 3.7 m downstream of it.The transverse deflector cavity (not powered at the time)was likely a factor in reducing any current—it is located at1.5 m downstream of the structure and its 6 mm apertureacts as a collimator.It was verified that the 1.05 m active-length structure
achieved an 81 MV=m gradient (power-limited) usingthe downstream spectrometer. Most of the emittancemeasurements were done at beam energies of 67 MeVand 75 MeV. A second klystron could be added to the sameHV modulator for this rf station, and the power combinedto increase the gradient if desired.
V. SHORT BUNCH GENERATION
A. Simulations
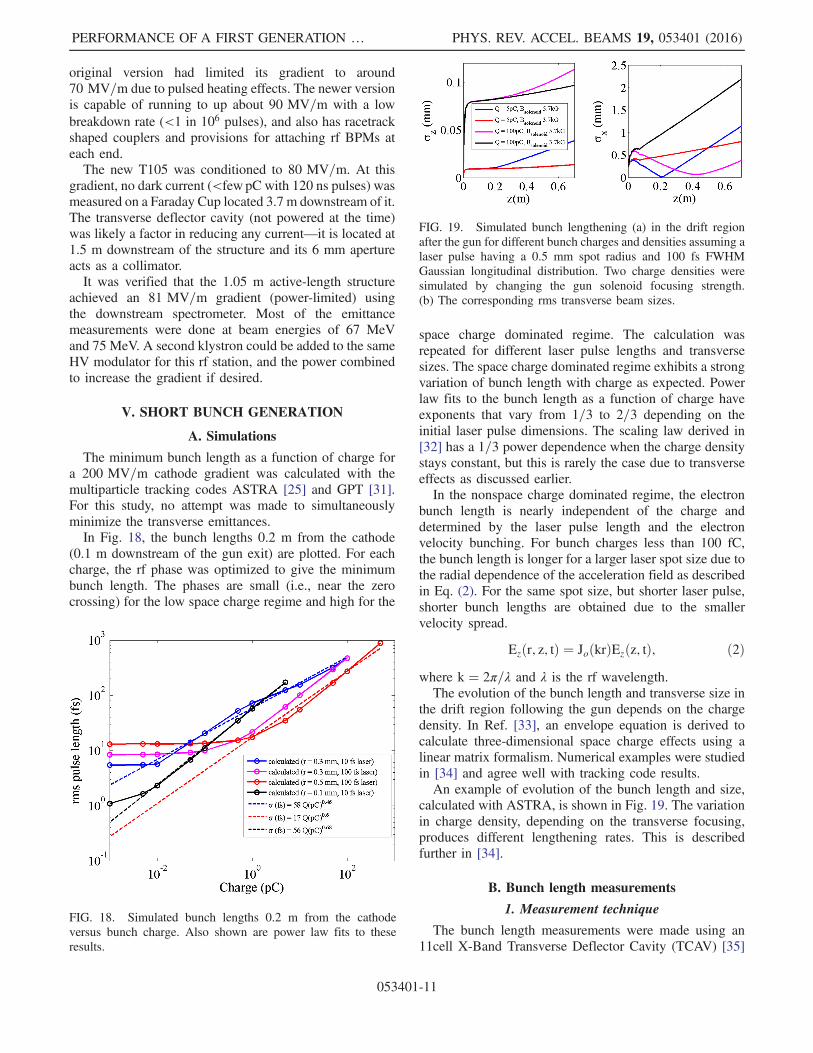
The minimum bunch length as a function of charge fora 200 MV=m cathode gradient was calculated with themultiparticle tracking codes ASTRA [25] and GPT [31].For this study, no attempt was made to simultaneouslyminimize the transverse emittances.In Fig. 18, the bunch lengths 0.2 m from the cathode
(0.1 m downstream of the gun exit) are plotted. For eachcharge, the rf phase was optimized to give the minimumbunch length. The phases are small (i.e., near the zerocrossing) for the low space charge regime and high for the
space charge dominated regime. The calculation wasrepeated for different laser pulse lengths and transversesizes. The space charge dominated regime exhibits a strongvariation of bunch length with charge as expected. Powerlaw fits to the bunch length as a function of charge haveexponents that vary from 1=3 to 2=3 depending on theinitial laser pulse dimensions. The scaling law derived in[32] has a 1=3 power dependence when the charge densitystays constant, but this is rarely the case due to transverseeffects as discussed earlier.In the nonspace charge dominated regime, the electron
bunch length is nearly independent of the charge anddetermined by the laser pulse length and the electronvelocity bunching. For bunch charges less than 100 fC,the bunch length is longer for a larger laser spot size due tothe radial dependence of the acceleration field as describedin Eq. (2). For the same spot size, but shorter laser pulse,shorter bunch lengths are obtained due to the smallervelocity spread.
Ezðr; z; tÞ ¼ JoðkrÞEzðz; tÞ; ð2Þwhere k ¼ 2π=λ and λ is the rf wavelength.The evolution of the bunch length and transverse size in
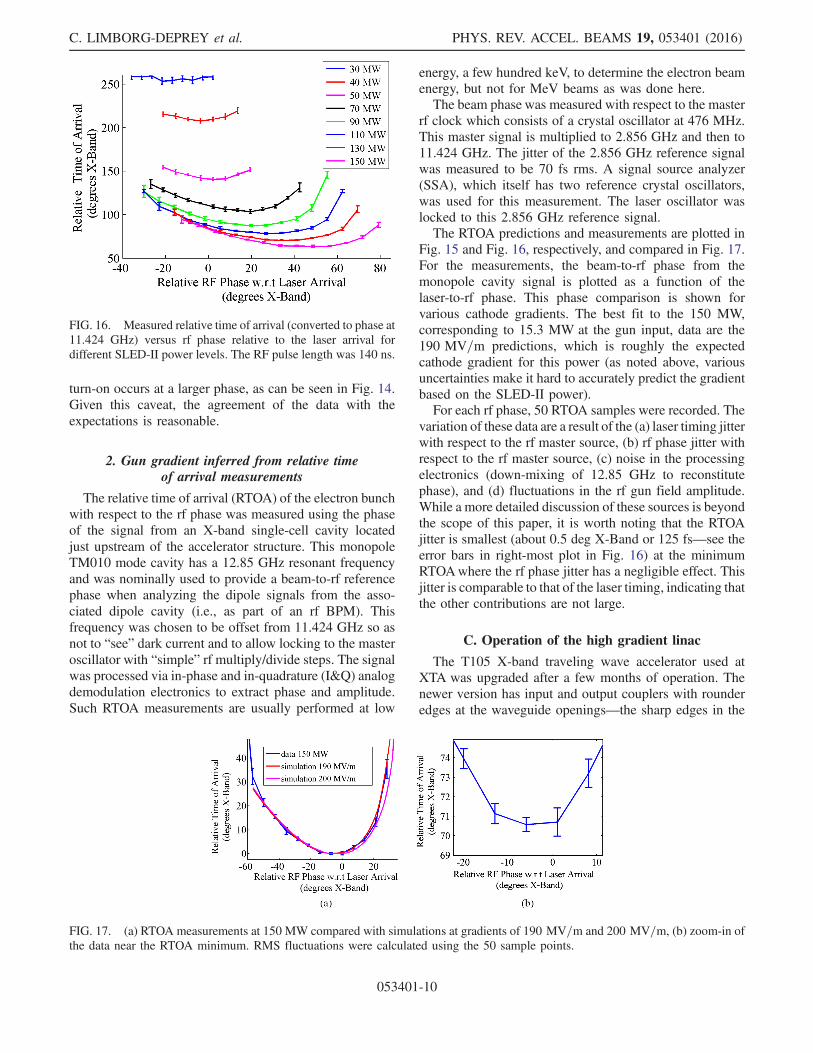
the drift region following the gun depends on the chargedensity. In Ref. [33], an envelope equation is derived tocalculate three-dimensional space charge effects using alinear matrix formalism. Numerical examples were studiedin [34] and agree well with tracking code results.An example of evolution of the bunch length and size,
calculated with ASTRA, is shown in Fig. 19. The variationin charge density, depending on the transverse focusing,produces different lengthening rates. This is describedfurther in [34].
B. Bunch length measurements
1. Measurement technique
The bunch length measurements were made using an11cell X-Band Transverse Deflector Cavity (TCAV) [35]
FIG. 18. Simulated bunch lengths 0.2 m from the cathodeversus bunch charge. Also shown are power law fits to theseresults.
FIG. 19. Simulated bunch lengthening (a) in the drift regionafter the gun for different bunch charges and densities assuming alaser pulse having a 0.5 mm spot radius and 100 fs FWHMGaussian longitudinal distribution. Two charge densities weresimulated by changing the gun solenoid focusing strength.(b) The corresponding rms transverse beam sizes.
PERFORMANCE OF A FIRST GENERATION … PHYS. REV. ACCEL. BEAMS 19, 053401 (2016)
053401-11

that was powered by a separate rf station from that whichpowers the gun and accelerator. The deflector gives anangular kick in the vertical plane, which results in a verticaldisplacement Δy that is a function of the position of theelectrons along the bunch, z. This displacement depends onthe vertical betatron functions βTCAV at the TCAVand βOTRat the observation point (OTR screen in this case), and onthe betatron phase advance between them, ψTCAV-OTR. Witha cavity transverse field of Vo, a bunch with momentum pcand emittance that transits the cavity at the rf zero crossingis kicked differentially as:
ΔyðzÞ ¼ eVopc
ffiffiffiffiffiffiffiffiffiffiffiffiffiffiffiffiffiffiffiβTcavβOTR
psinψTcav−OTR
�2π
λz
�ð3Þ
and the bunch vertical size at the screen is,
σ2y;tot ¼ εβOTR
þ βTcavβOTR
�eVopc
sinψTcav−>OTR�2π
λ
��2
σ2z :
ð4Þ
An example of the beam profile measured with thedeflector being powered is shown in Fig. 20(a), and withthe power off in Fig. 20(b). The first term on the right-handside of Eq. (4) is determined from the deflector-off bunchsize, and the factor multiplying the square of the bunchlength is determined by operating the cavity with the beamnear the rf zero-crossing, and varying the deflector rf phaseto calibrate the screen length scale in degrees of X-band.With this information and the “streaked” beam size, thebunch length is computed.
2. Measurements with the deflector cavity
The procedure outlined above was used to compute thebunch lengths plotted in Fig. 21. The red-cross data points
were measured for an electron beam generated using a60 fs FWHM laser pulse and a 1 mm spot radius. Thecurves in the plot are simulations assuming the same laserduration, spot radii of 0.5 mm and 1 mm, a gun solenoidfield of 5.7 kG and a cathode field of 200 MV=m. Theagreement is fairly good. The first series of measurements,performed in 2013 and plotted with the black crosses,were done at the early stage of the commissioning whenthe RF phase was drifting and the laser timing wasunstable with few degree rms jitter. At that time, the laserpulse duration had not been measured accurately. Thus, itis not surprising that the agreement is better in the latermeasurements.A set of measurements was also made with the goal of
maximizing the peak current. The best result was 270 Awith 290 pC in a 460 fs rms long bunch (one of the black
FIG. 20. (a) Streaked beam profile, and (b) beam profile with the deflector off.
FIG. 21. Bunch lengths measured at the transverse deflectorversus bunch charge, and simulated data as described in the text.Two additional simulated data points, in purple, show the bunchlength when a 20-cm long RF compressor is used.
C. LIMBORG-DEPREY et al. PHYS. REV. ACCEL. BEAMS 19, 053401 (2016)
053401-12

data points) and could be reproduced on several occasionsonce the linac was tuned and reasonable stability wasachieved. Higher peak currents are expected for higherbunch charges. Although the RF gun has produced up to1.2 nC (7.2 × 10⁹ electrons) bunches, despite a QE in thelow 10−5 scale, no attempt to optimize the bunch lengthwas made at that time.A data point in Fig. 21 of particular interest for UED is
the one with 5 pC charge (3 × 10⁷ electrons) where a125 fs rms long bunch was measured. Other injectors haveachieved this performance using an S-band photocathoderf gun, but they required an additional rf accelerator forcompression [36]. Our 10-cm long photocathode rf gunalone suffices to produce such short bunch lengths.Note that the bunch length becomes “frozen” in the linac
structure as close as 10 cm downstream of the structureentrance. Accordingly, smaller bunch lengths would beachieved if the linac was positioned closer to the cathode,for instance at z ¼ 0.6 m. This also would produce smallertransverse emittances. In our beamline, the linac could notbe located that close to the gun as space was needed forlaser injection and diagnostics.The purple circles in Fig. 21 are results from simulations
to investigate how short a bunch could be achieved in abeamline similar to the XTA but with a 20 cm long X-bandstructure upstream of the linac to provide an energy chirpfor velocity bunch compression. The simulations show thatpeak currents of up to 1.5 kA are possible with 20 pCbunches.
3. Short bunch THz production
With such short bunches, we expected that coherentoptical transition radiation (COTR) in the THz regimecould be generated. A 1 μm thick sheet of aluminum foil
was inserted at the end of the beamline for this purpose.The light was collected in a pyro-detector and the ampli-tude of the signal measured to determine the total radiationenergy. The COTR light propagated out of the high vacuumenvironment into air through a z-cut quartz window of50 cm diameter, which has low attenuation and a largeopening to maximize THz radiation collection. The lightwas then guided using a 6 cm long copper cone beforebeing collected into a pyro-detector that was locatedapproximately 15 cm from the source. The pyro-detectorwas calibrated using IR light and produced a 33 mV signalper μJ of light without any additional amplification. For abunch charge of 300 pC, 2 μJ of energy was collected asshown in Fig. 22. This value is consistent with a pulselength of 400 fs rms and transverse source dimensionsof 100 μm rms in both planes—the predicted radiationspectrum is peaked at 0.2 THz.When transition radiation is emitted coherently, the
energy is proportional to the square of the number ofparticles. By varying the radius of the laser spot, whichvaries the bunch charge, we verified that the collectedenergy is linear with the square of the charge, as shownin Fig. 23.
VI. TRANSVERSE EMITTANCEMEASUREMENTS
A. Emittance measurement setupand emittance optimization
Transverse emittances were measured downstream ofthe accelerator structure by varying the strength of aquadrupole magnet while recording the profile of the lightproduced from an optical transition radiation (OTR) screenlocated 1.6 m downstream of the quadrupole magnet. Theresolution of the system was limited by the camera lens andis estimated to be 15 μm rms using a standard resolutiontest pattern known as a United States Air Force (USAF)
FIG. 22. Example of the signal (in orange) from thepyro-detector.
FIG. 23. Variation of the pyro-detector signal with the square ofthe bunch charge.
PERFORMANCE OF A FIRST GENERATION … PHYS. REV. ACCEL. BEAMS 19, 053401 (2016)
053401-13
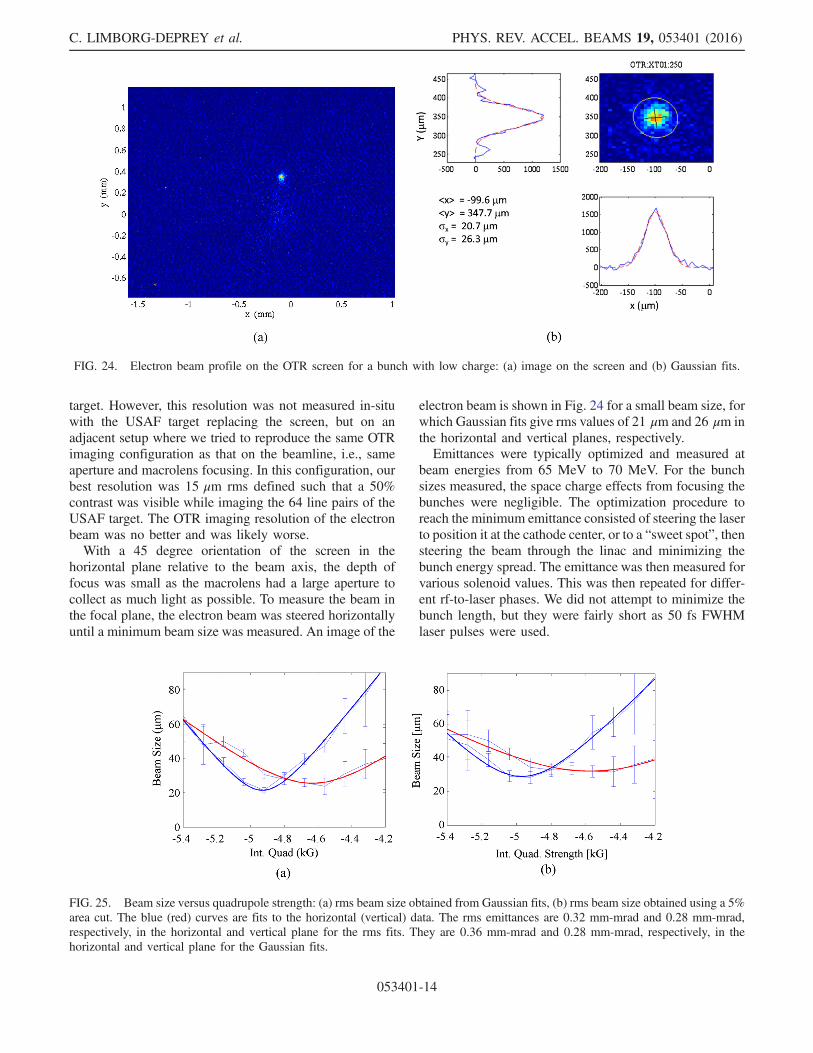
target. However, this resolution was not measured in-situwith the USAF target replacing the screen, but on anadjacent setup where we tried to reproduce the same OTRimaging configuration as that on the beamline, i.e., sameaperture and macrolens focusing. In this configuration, ourbest resolution was 15 μm rms defined such that a 50%contrast was visible while imaging the 64 line pairs of theUSAF target. The OTR imaging resolution of the electronbeam was no better and was likely worse.With a 45 degree orientation of the screen in the
horizontal plane relative to the beam axis, the depth offocus was small as the macrolens had a large aperture tocollect as much light as possible. To measure the beam inthe focal plane, the electron beam was steered horizontallyuntil a minimum beam size was measured. An image of the
electron beam is shown in Fig. 24 for a small beam size, forwhich Gaussian fits give rms values of 21 μm and 26 μm inthe horizontal and vertical planes, respectively.Emittances were typically optimized and measured at
beam energies from 65 MeV to 70 MeV. For the bunchsizes measured, the space charge effects from focusing thebunches were negligible. The optimization procedure toreach the minimum emittance consisted of steering the laserto position it at the cathode center, or to a “sweet spot”, thensteering the beam through the linac and minimizing thebunch energy spread. The emittance was then measured forvarious solenoid values. This was then repeated for differ-ent rf-to-laser phases. We did not attempt to minimize thebunch length, but they were fairly short as 50 fs FWHMlaser pulses were used.
FIG. 24. Electron beam profile on the OTR screen for a bunch with low charge: (a) image on the screen and (b) Gaussian fits.
FIG. 25. Beam size versus quadrupole strength: (a) rms beam size obtained from Gaussian fits, (b) rms beam size obtained using a 5%area cut. The blue (red) curves are fits to the horizontal (vertical) data. The rms emittances are 0.32 mm-mrad and 0.28 mm-mrad,respectively, in the horizontal and vertical plane for the rms fits. They are 0.36 mm-mrad and 0.28 mm-mrad, respectively, in thehorizontal and vertical plane for the Gaussian fits.
C. LIMBORG-DEPREY et al. PHYS. REV. ACCEL. BEAMS 19, 053401 (2016)
053401-14
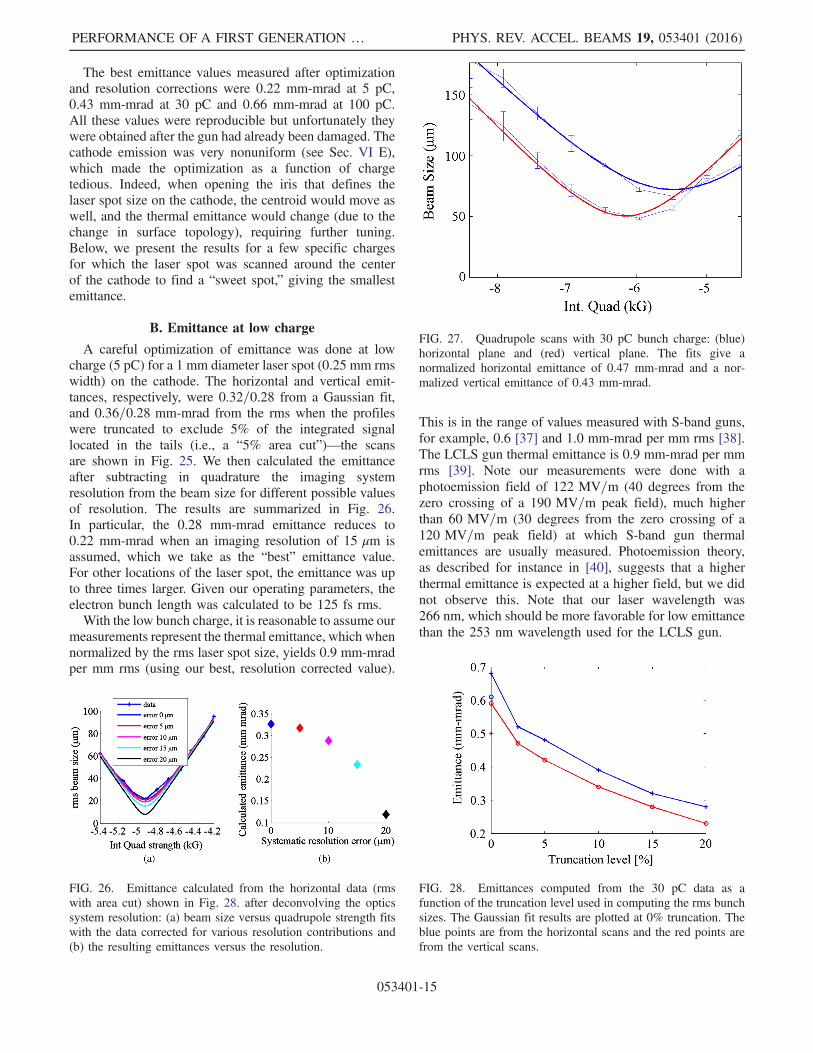
The best emittance values measured after optimizationand resolution corrections were 0.22 mm-mrad at 5 pC,0.43 mm-mrad at 30 pC and 0.66 mm-mrad at 100 pC.All these values were reproducible but unfortunately theywere obtained after the gun had already been damaged. Thecathode emission was very nonuniform (see Sec. VI E),which made the optimization as a function of chargetedious. Indeed, when opening the iris that defines thelaser spot size on the cathode, the centroid would move aswell, and the thermal emittance would change (due to thechange in surface topology), requiring further tuning.Below, we present the results for a few specific chargesfor which the laser spot was scanned around the centerof the cathode to find a “sweet spot,” giving the smallestemittance.
B. Emittance at low charge
A careful optimization of emittance was done at lowcharge (5 pC) for a 1 mm diameter laser spot (0.25 mm rmswidth) on the cathode. The horizontal and vertical emit-tances, respectively, were 0.32=0.28 from a Gaussian fit,and 0.36=0.28 mm-mrad from the rms when the profileswere truncated to exclude 5% of the integrated signallocated in the tails (i.e., a “5% area cut”)—the scansare shown in Fig. 25. We then calculated the emittanceafter subtracting in quadrature the imaging systemresolution from the beam size for different possible valuesof resolution. The results are summarized in Fig. 26.In particular, the 0.28 mm-mrad emittance reduces to0.22 mm-mrad when an imaging resolution of 15 μm isassumed, which we take as the “best” emittance value.For other locations of the laser spot, the emittance was upto three times larger. Given our operating parameters, theelectron bunch length was calculated to be 125 fs rms.With the low bunch charge, it is reasonable to assume our
measurements represent the thermal emittance, which whennormalized by the rms laser spot size, yields 0.9 mm-mradper mm rms (using our best, resolution corrected value).
This is in the range of values measured with S-band guns,for example, 0.6 [37] and 1.0 mm-mrad per mm rms [38].The LCLS gun thermal emittance is 0.9 mm-mrad per mmrms [39]. Note our measurements were done with aphotoemission field of 122 MV=m (40 degrees from thezero crossing of a 190 MV=m peak field), much higherthan 60 MV=m (30 degrees from the zero crossing of a120 MV=m peak field) at which S-band gun thermalemittances are usually measured. Photoemission theory,as described for instance in [40], suggests that a higherthermal emittance is expected at a higher field, but we didnot observe this. Note that our laser wavelength was266 nm, which should be more favorable for low emittancethan the 253 nm wavelength used for the LCLS gun.
FIG. 26. Emittance calculated from the horizontal data (rmswith area cut) shown in Fig. 28. after deconvolving the opticssystem resolution: (a) beam size versus quadrupole strength fitswith the data corrected for various resolution contributions and(b) the resulting emittances versus the resolution.
FIG. 27. Quadrupole scans with 30 pC bunch charge: (blue)horizontal plane and (red) vertical plane. The fits give anormalized horizontal emittance of 0.47 mm-mrad and a nor-malized vertical emittance of 0.43 mm-mrad.
FIG. 28. Emittances computed from the 30 pC data as afunction of the truncation level used in computing the rms bunchsizes. The Gaussian fit results are plotted at 0% truncation. Theblue points are from the horizontal scans and the red points arefrom the vertical scans.
PERFORMANCE OF A FIRST GENERATION … PHYS. REV. ACCEL. BEAMS 19, 053401 (2016)
053401-15
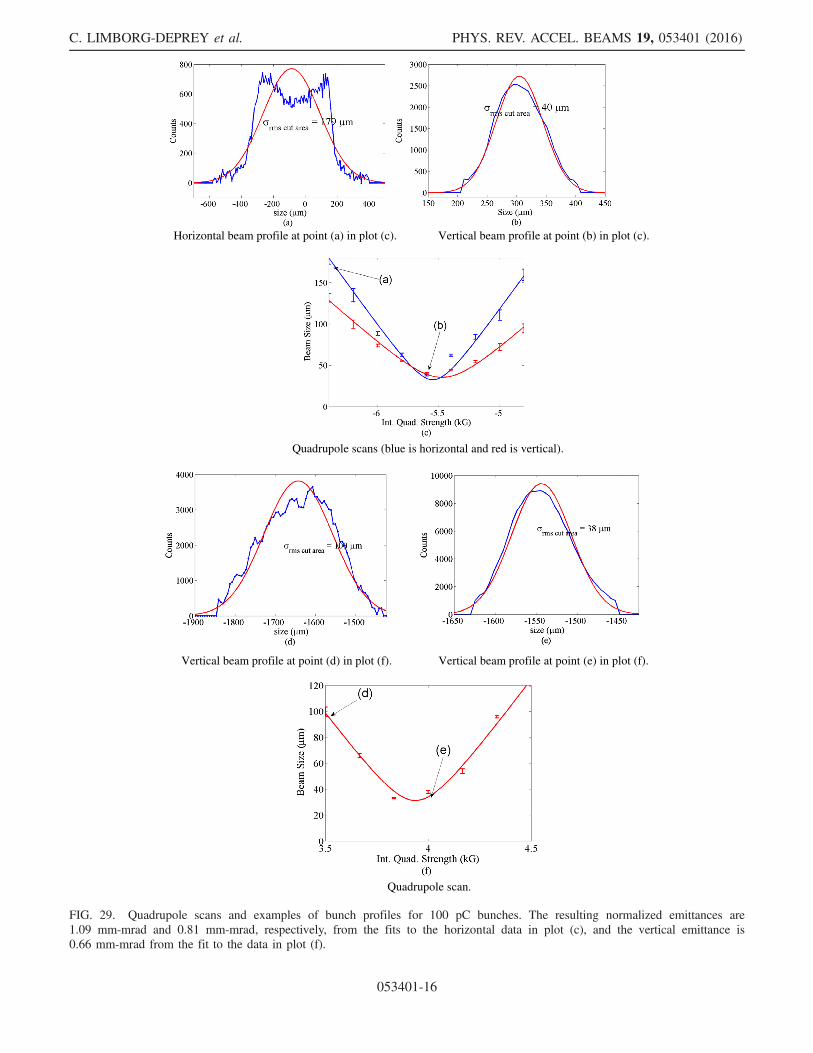
Quadrupole scans (blue is horizontal and red is vertical).
Vertical beam profile at point (d) in plot (f). Vertical beam profile at point (e) in plot (f).
Quadrupole scan.
Horizontal beam profile at point (a) in plot (c). Vertical beam profile at point (b) in plot (c).
FIG. 29. Quadrupole scans and examples of bunch profiles for 100 pC bunches. The resulting normalized emittances are1.09 mm-mrad and 0.81 mm-mrad, respectively, from the fits to the horizontal data in plot (c), and the vertical emittance is0.66 mm-mrad from the fit to the data in plot (f).
C. LIMBORG-DEPREY et al. PHYS. REV. ACCEL. BEAMS 19, 053401 (2016)
053401-16
A preliminary study of photoemission using 400 nmlight (second harmonic of the IR laser) instead of 266 nmlight (third harmonic) was done at low charge. Bunchesshorter than 200 fs rms were achieved and the detailsare reported in [41]. Somewhat smaller emittances wereobtained: 0.25 mm-mrad in both planes for 7 pC bunches.These values were computed from the rms bunch sizes(5% area cut) without deconvolving the optical systemresolution.
C. Emittance at intermediate charge
The best emittance achieved with 30 pC bunches was0.43 mm-mrad (based on rms beam sizes with a 5% areacut) using a 300 μm laser spot size radius (see Fig. 27).This is a factor of two worse than the best value obtained insimulations for the present XTA geometry, i.e., with thelinac located at 0.85 m from the cathode. For an idealmachine assuming a thermal emittance of 0.9 mm-mrad permm rms laser spot size, a 160 μm laser spot size radius, alinac located 0.55 m from the cathode and optimallaser shaping, the best simulated emittance (ε100%) is0.1 mm-mrad. Given the low QE of our cathode, we wereunable to produce enough charge to get measurable OTRsignals for this laser radius.For those interested in a measure of the central slice
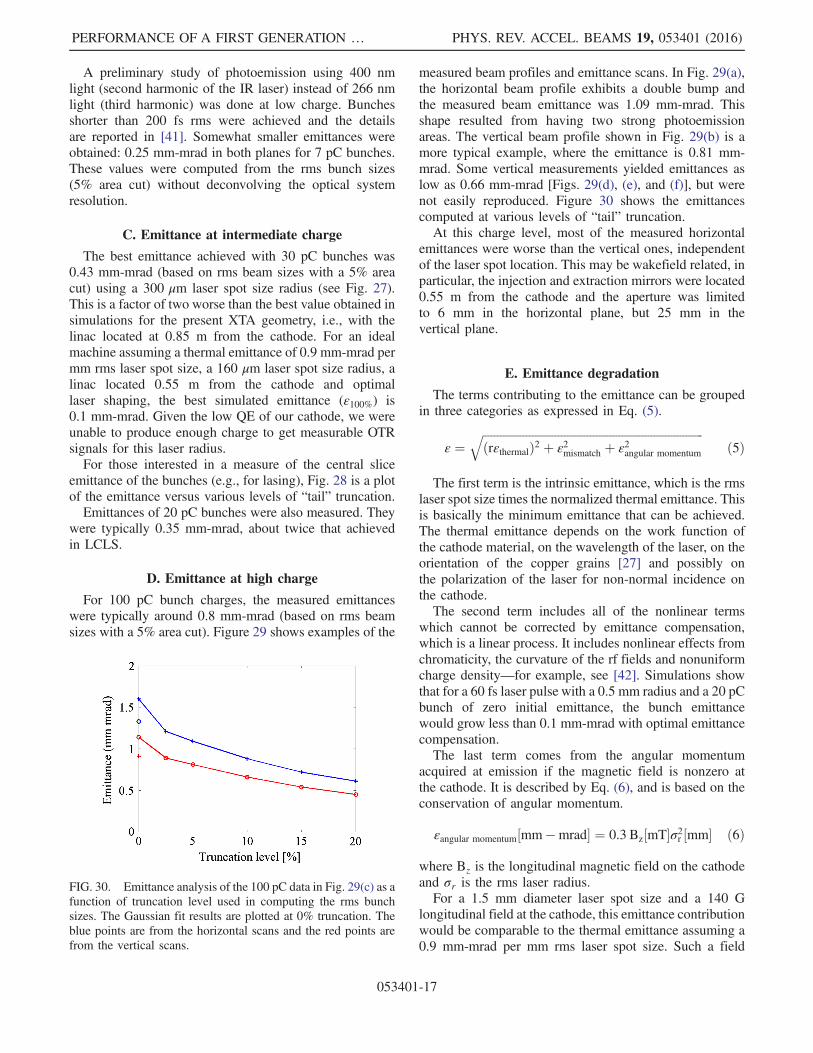
emittance of the bunches (e.g., for lasing), Fig. 28 is a plotof the emittance versus various levels of “tail” truncation.Emittances of 20 pC bunches were also measured. They
were typically 0.35 mm-mrad, about twice that achievedin LCLS.
D. Emittance at high charge
For 100 pC bunch charges, the measured emittanceswere typically around 0.8 mm-mrad (based on rms beamsizes with a 5% area cut). Figure 29 shows examples of the
measured beam profiles and emittance scans. In Fig. 29(a),the horizontal beam profile exhibits a double bump andthe measured beam emittance was 1.09 mm-mrad. Thisshape resulted from having two strong photoemissionareas. The vertical beam profile shown in Fig. 29(b) is amore typical example, where the emittance is 0.81 mm-mrad. Some vertical measurements yielded emittances aslow as 0.66 mm-mrad [Figs. 29(d), (e), and (f)], but werenot easily reproduced. Figure 30 shows the emittancescomputed at various levels of “tail” truncation.At this charge level, most of the measured horizontal
emittances were worse than the vertical ones, independentof the laser spot location. This may be wakefield related, inparticular, the injection and extraction mirrors were located0.55 m from the cathode and the aperture was limitedto 6 mm in the horizontal plane, but 25 mm in thevertical plane.
E. Emittance degradation
The terms contributing to the emittance can be groupedin three categories as expressed in Eq. (5).
ε ¼ffiffiffiffiffiffiffiffiffiffiffiffiffiffiffiffiffiffiffiffiffiffiffiffiffiffiffiffiffiffiffiffiffiffiffiffiffiffiffiffiffiffiffiffiffiffiffiffiffiffiffiffiffiffiffiffiffiffiffiffiffiffiffiffiffiffiffiffiffiffiffiffiffiffiffiffiðrεthermalÞ2 þ ε2mismatch þ ε2angular momentum
qð5Þ
The first term is the intrinsic emittance, which is the rmslaser spot size times the normalized thermal emittance. Thisis basically the minimum emittance that can be achieved.The thermal emittance depends on the work function ofthe cathode material, on the wavelength of the laser, on theorientation of the copper grains [27] and possibly onthe polarization of the laser for non-normal incidence onthe cathode.The second term includes all of the nonlinear terms
which cannot be corrected by emittance compensation,which is a linear process. It includes nonlinear effects fromchromaticity, the curvature of the rf fields and nonuniformcharge density—for example, see [42]. Simulations showthat for a 60 fs laser pulse with a 0.5 mm radius and a 20 pCbunch of zero initial emittance, the bunch emittancewould grow less than 0.1 mm-mrad with optimal emittancecompensation.The last term comes from the angular momentum
acquired at emission if the magnetic field is nonzero atthe cathode. It is described by Eq. (6), and is based on theconservation of angular momentum.
εangular momentum½mm −mrad� ¼ 0.3Bz½mT�σ2r ½mm� ð6Þ
where Bz is the longitudinal magnetic field on the cathodeand σr is the rms laser radius.For a 1.5 mm diameter laser spot size and a 140 G
longitudinal field at the cathode, this emittance contributionwould be comparable to the thermal emittance assuming a0.9 mm-mrad per mm rms laser spot size. Such a field
FIG. 30. Emittance analysis of the 100 pC data in Fig. 29(c) as afunction of truncation level used in computing the rms bunchsizes. The Gaussian fit results are plotted at 0% truncation. Theblue points are from the horizontal scans and the red points arefrom the vertical scans.
PERFORMANCE OF A FIRST GENERATION … PHYS. REV. ACCEL. BEAMS 19, 053401 (2016)
053401-17
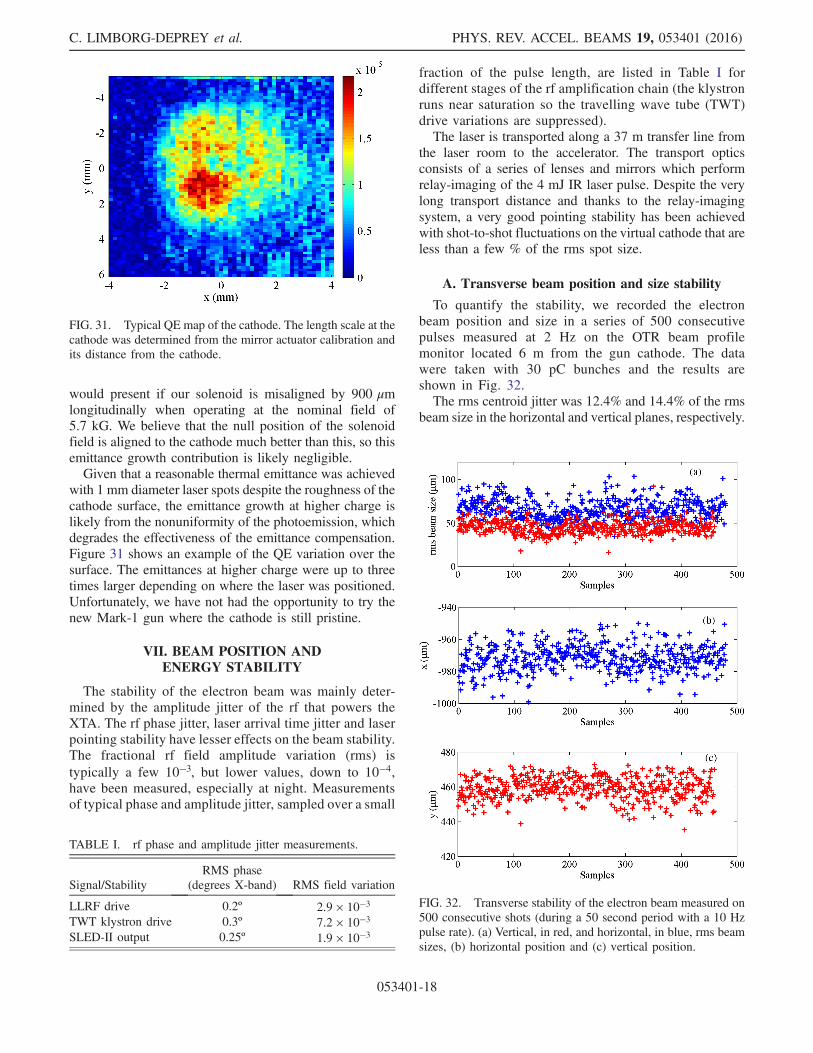
would present if our solenoid is misaligned by 900 μmlongitudinally when operating at the nominal field of5.7 kG. We believe that the null position of the solenoidfield is aligned to the cathode much better than this, so thisemittance growth contribution is likely negligible.Given that a reasonable thermal emittance was achieved
with 1 mm diameter laser spots despite the roughness of thecathode surface, the emittance growth at higher charge islikely from the nonuniformity of the photoemission, whichdegrades the effectiveness of the emittance compensation.Figure 31 shows an example of the QE variation over thesurface. The emittances at higher charge were up to threetimes larger depending on where the laser was positioned.Unfortunately, we have not had the opportunity to try thenew Mark-1 gun where the cathode is still pristine.
VII. BEAM POSITION ANDENERGY STABILITY
The stability of the electron beam was mainly deter-mined by the amplitude jitter of the rf that powers theXTA. The rf phase jitter, laser arrival time jitter and laserpointing stability have lesser effects on the beam stability.The fractional rf field amplitude variation (rms) istypically a few 10−3, but lower values, down to 10−4,have been measured, especially at night. Measurementsof typical phase and amplitude jitter, sampled over a small
fraction of the pulse length, are listed in Table I fordifferent stages of the rf amplification chain (the klystronruns near saturation so the travelling wave tube (TWT)drive variations are suppressed).The laser is transported along a 37 m transfer line from
the laser room to the accelerator. The transport opticsconsists of a series of lenses and mirrors which performrelay-imaging of the 4 mJ IR laser pulse. Despite the verylong transport distance and thanks to the relay-imagingsystem, a very good pointing stability has been achievedwith shot-to-shot fluctuations on the virtual cathode that areless than a few % of the rms spot size.
A. Transverse beam position and size stability
To quantify the stability, we recorded the electronbeam position and size in a series of 500 consecutivepulses measured at 2 Hz on the OTR beam profilemonitor located 6 m from the gun cathode. The datawere taken with 30 pC bunches and the results areshown in Fig. 32.The rms centroid jitter was 12.4% and 14.4% of the rms
beam size in the horizontal and vertical planes, respectively.
FIG. 31. Typical QE map of the cathode. The length scale at thecathode was determined from the mirror actuator calibration andits distance from the cathode.
TABLE I. rf phase and amplitude jitter measurements.
Signal/StabilityRMS phase
(degrees X-band) RMS field variation
LLRF drive 0.2º 2.9 × 10⁻³TWT klystron drive 0.3º 7.2 × 10⁻³SLED-II output 0.25º 1.9 × 10⁻³
FIG. 32. Transverse stability of the electron beam measured on500 consecutive shots (during a 50 second period with a 10 Hzpulse rate). (a) Vertical, in red, and horizontal, in blue, rms beamsizes, (b) horizontal position and (c) vertical position.
C. LIMBORG-DEPREY et al. PHYS. REV. ACCEL. BEAMS 19, 053401 (2016)
053401-18

In absolute terms, rms transverse jitter was 8.2 μm and6.5 μm in the horizontal and vertical planes, respectively.Results from simple tracking studies are presented inFig. 33, which assume the laser is displaced by 300 μmwith respect to the electrical center of gun cathode (i.e., wetypically could not run with the laser centered since thisarea had low QE). They show that for rf field amplitudevariations of a few 10−3, beam position variations compa-rable to those measured (as shown in Fig. 33) occur. Notethat the effect is very nonlinear and similar transverseposition offsets are obtained for rf amplitude variations of1.25 × 10−3 and 5 × 10⁻³. To get a similar variation in
transverse position due to rf phase jitter, aþ=−6 degreechange is needed, which is much larger than that observed.The energy at the gun exit scales with the gun gradient,and since the solenoidal focal length scales as the square ofthe energy, the variation in focal length is twice as largeas the field variation.
B. Energy stability
The bunch energy stability was measured by recordingthe motion of the beam in the spectrometer. The transversemotion was larger than the transverse beam size (which wasnot the case upstream of the spectrometer) so this motion
FIG. 33. (a) Simulated trajectories along beamline for various changes in the rf field amplitude—the reference trajectory correspondsto a 200 MV=m cathode field, a laser offset of 300 μm and an 88 MV=m acceleration gradient. (b–d) Zoomed-in views of thetrajectories at two z locations and the beam energy variation just after the gun.
FIG. 34. Energy stability measured from the beam centroid jitter on the spectrometer screen: (a) 50 samples for each spectrometermagnet setting and (b) energy jitter relative to the nominal 80 MeV beam energy.
PERFORMANCE OF A FIRST GENERATION … PHYS. REV. ACCEL. BEAMS 19, 053401 (2016)
053401-19

was dominated by energy fluctuations. Note that no verticalmotion was observed within the resolution of the screen.The stability of the spectrometer power supply is better than10−4 so this was not a factor. The measurements are shownin Fig. 34 where 50 samples were recorded at a 2 Hz rate forseven settings of spectrometer bend magnet. By varying themagnetic field, we calibrated the position-vs-energy on thescreen.The energy jitter is below 0.1% rms, which is consistent
with the rf field amplitude jitter. The rf phase jitter producesvery small energy variations as a 1 degree jitter wouldgenerate no more than a 1.4 × 10⁻⁴ energy jitter when thebunch is on crest.
VIII. CONCLUSION
In summary, we were able to measure the basic perfor-mance of an all-X-band injector with the Mark-0 gun, whichwas originallymeant to be used only for debugging purposes.We routinely delivered electron beams up to 85 MeV in acompact system extending over less than 2 m, including agun and an accelerator powered by a single X-band(11.424 GHz) klystron. The dark current charge was nomore than a few tens of pC downstream of the linac for acathode field of 200 MV=m. Bunch lengths as short as125 fs rms were measured for bunch charges of 5 pC. Bunchlengths of 465 fs rms were measured for 300 pC bunches,corresponding to a ∼300 A peak current. The thermalemittances measured were comparable to those in S-bandgunswith∼0.9 mm-mrad permm rms laser spot. Emittancesmeasured at 20 pCwere typically 0.35mm-mrad, larger thanin the LCLS injector, where they typically are 0.2 mm-mrad.However, in this case our bunch lengths are 3 times shorterthan that in theLCLS injector. For a 100pCbunch charge, thetransverse emittance was typically 0.7 mm-mrad, againlarger than that in LCLS (typically 0.4 mm-mrad) but ourbunch lengths were 3 times shorter. So the peak brightnessof our bunches are comparable to those of the LCLS injectorfor both 20 pC and 100 pC operation.The laser to electron beam relative stability was less than
50 fs rms if used in a pump-probe configuration [43].The transverse beam stability was routinely on the order of10% of the bunch size. The energy jitter was typically atthe 10−3 level.As noted, the gun cathode surface was damaged due to
laser ablation and rf breakdown, which made the QEvariation large over the laser spot size. We believe thisis the reason why the bunch emittances measured at 30 pCand 100 pC were 2–4 times larger than expected. The lowerQE also limited our ability to decrease the laser spot size totry to achieve even lower emittances at low charge.Overall, we are encouraged by these results and hope that
the Mark-1 gun will eventually be tested now that it is mucheasier to setup and tune the beams at XTA, especially withthe aid of several feedback systems that were added. Also, abetter support/positioning system for the gun, solenoid and
mirror chamber were built but never installed—these wouldmake it much less likely to incur laser damage.
ACKNOWLEDGMENTS
We thank E. Jongewaard, V. Dolgashev, S. Tantawi,A. Vlieks, and M. Fazio for providing useful informationand support, and thank the NLCTA operations staff for theirefforts to maintain and improve the facility. We thank thelaser group, in particular A. Miahnahri, I. Makasyuk andW. Polzin. Finally, we thank Alan Fischer for helping withinstrumentation and calculations for the THz measurements.This work was supported by the U.S. Department of EnergyContract No. DE-AC02-76SF00515.
[1] M. Altarelli, DESY Report No. 2006-097.[2] P. Emma, First lasing and operation of an ångstrom-
wavelength free-electron laser, Nat. Photonics 4, 641(2010).
[3] R. Akre, Commissioning the Linac Coherent Light Sourceinjector, Phys. Rev. ST Accel. Beams 11, 030703 (2008).
[4] I. Hwang, FEL simulation of the 0.1-nm Hard X-ray fromthe PAL-XFEL, J. Korean Phys. Soc. 64, 212 (2014).
[5] T. Tanaka, Riken Harima Institute SCSS X-FEL Concep-tual Design Report, 2005.
[6] R. Gante, Paul Scherrer Institute Swiss FEL CDR Report,2010.
[7] G. D’Auria, The X-band technology for FELs (XbFEL),2014.
[8] A. Latina, in International Workshop on Future LinearColliders (LCWS14), 2014.
[9] Y. Sun, X-band rf driven free electron laser driver withoptics linearization, Phys. Rev. ST Accel. Beams 17,110703 (2014).
[10] C. Adolphsen, Stanford Report No. SLAC-PUB-1124,2005.
[11] Y. Sun, Low-charge, hard x-ray free electron laser drivenwith an X-band injector and accelerator, Phys. Rev. STAccel. Beams 15, 030703, 2012.
[12] W. Leemans, Multi-GeV Electron Beams from Capillary-Discharge-Guided Subpetawatt Laser Pulses in the Self-Trapping Regime, Phys. Rev. Lett. 113, 245002 (2014).
[13] M. Litos, High-efficiency acceleration of an electron beamin a plasma wakefield accelerator, Nature (London) 515, 92(2014).
[14] A. E. Vlieks, Recent measurements and plans for the SLACCompton X-ray source, AIP Conf. Proc. 807, 481 (2006).
[15] P. Emma, SLAC National Laboratory Report No. SLAC-TN, 2001.
[16] V. Dolgashev and J. Wang, RF design of X-band RFdeflector for femtosecond diagnostics of LCLS electronbeam, AIP Conf. Proc. 1507, 682 (2012).
[17] W. C. Fang, R&D of X-Band accelerating structure forcompact FEL at SINAP, in Proceedings of LINAC 2014(JACoW, Geneva, Switzerland, 2014).
[18] G. D’Auria, X-Band Technology for FEL sources,in Proceedings of LINAC 2014 (JACoW, Geneva,Switzerland, 2014).
C. LIMBORG-DEPREY et al. PHYS. REV. ACCEL. BEAMS 19, 053401 (2016)
053401-20

[19] R. A. Marsh, G. G. Anderson, S. G. Anderson, C. P. J.Barty, and D. J. Gibson, X-Band RF Photoinjector forLaser Compton X-Ray and Gamma-Ray Sources, inProceedings of 6th International Particle AcceleratorConference (Richmond, Virginia, USA, 2015).
[20] R. Marsh, Modeling and design of an X-band rf photo-injector, Phys. Rev. ST Accel. Beams 15, 102001 (2012).
[21] C. Nantista, Stanford University Report No. SLAC-PUB6145, 1993.
[22] K. Kim, Rf and space charge effects in laser driven rfelectron guns, Nucl. Instrum. Methods Phys. Res., Sect. A275, 201 (1989).
[23] D. Filipetto, Maximum current density and beam bright-ness achievable by laser-driven electron sources, Phys.Rev. ST Accel. Beams 17, 024201 (2014).
[24] R. Li, Nanometer emittance ultralow charge beams from rfphotoinjectors, Phys. Rev. ST Accel. Beams 15, 090702(2012).
[25] K. Floettmann, ASTRA, DESY, Hamburg, Germany.[26] C. Limborg, in Proceedings of the 8th European Particle
Accelerator Conference, Paris, 2002 (EPS-IGA andCERN, Geneva, 2002).
[27] T. Vecchione, Simulating single crystal copper photo-cathode emittance, in Proceedings of FEL 2015 (Daejeon,Korea, 2015).
[28] R. H. Fowler and L. Nordheim, Electron Emission inIntense Electric Fields, in Proceedings of the Royal Societyof London. Series A, Containing Papers of a Mathematicaland Physical Character, Vol. 119 (The Royal Society,1928), pp. 173–181.
[29] L. Laurent, Pulsed RF Breakdown studies ReportNo. SLAC-PUB-8409, 2000.
[30] C. Adolphsen, Stanford University Report No. SLAC–PUB–9906, 2003.
[31] S. B. van der Geer and M. J. de Loos, General ParticleTracer, GPT, http://www.pulsar.nl/gpt.
[32] J. C. Rosenzweig, in 1995 Particle Accelerator Conference(IEEE Publishing, Piscataway, New Jersey, 1996).
[33] C. K. Allen and N. D. Pattengale, Los Alamos NationalLaboratory, Report No. LA-UR-02-4979 (unpublished).
[34] C. Limborg et al., A modified quadscan technique foremittance measurement of space charge dominatedbeams, in Proceedings Particle Accelerator Conference(2006).
[35] V. Dolgashev, Design and application of multimegawattX-band deflectors for femtosecond electron beam diag-nostics, Phys. Rev. ST Accel. Beams 17, 102801 (2014).
[36] T. Van, Oudheusden, Compression of SubrelativisticSpace-Charge-Dominated Electron Bunches for Single-Shot Femtosecond Electron Diffractionon, Phys. Rev. Lett.105, 264801 (2010).
[37] C. P. Hauri, Intrinsic Emittance Reduction of an ElectronBeam from Metal Photocathodes, Phys. Rev. Lett. 104,234802 (2010).
[38] H. G. Qiang, Experimental investigation of thermal emit-tance components of copper photocathode, Phys. Rev. STAccel. Beams 15, 040102 (2012).
[39] Y. Ding et al., Measurements and simulations of ultra-lowemittance and ultra-short electron beams in the linaccoherent light source, Phys. Rev. Lett. 102, 254801(2009).
[40] D. Dowell and J. Schmerge, Quantum efficiency andthermal emittance of metal photocathodes, Phys. Rev.ST Accel. Beams 12, 119901 (2009).
[41] H. Li, C. Limborg-Deprey, C. Adolphsen, D. McCormick,M. Dunning, K. Jobe, T. Raubenheimer, A. Vrielink, T.Vecchione, F. Wang, and S. Weathersby, Two-photonphotoemission from a copper cathode in a compactX-band photo injector, Phys. Rev. Accel. Beams 19,023401 (2016).
[42] C. Limborg, Maximizing brightness in photo injectors, inThe Physics and Applications of High Brightness Beamsedited by L. Palumbo, J. Rosenzweig and L. Serafini(World Scientific, 2005).
[43] C. Limborg-Deprey et al., An X-Band Photoelectron RFGun for an Ultrafast Electron Diffraction Source, inProceedings of the Conference on Femtosecond ElectronImaging and Spectroscopy, FEIS 2013, Key West, FL,USA, edited by P.W. Hawkes, Advances in Imaging andElectron Physics Vol. 191 (Academic Press, UK, 2015.
PERFORMANCE OF A FIRST GENERATION … PHYS. REV. ACCEL. BEAMS 19, 053401 (2016)
053401-21