Strengthening Regenerated Cellulose Fibers Sourced ... - MDPI
Upload
jainhospitalsCategory
view
3download
0
Journal of Analytical and Applied Pyrolysis, 8 (1985) 359-389 Elsevier Science Publishers B.V., Amsterdam - Printed in The Netherlands
359
THERMAL, MORPHOLOGICAL, X-RAY AND SPECTROSCOPIC STUDIES ON CELLULOSE AND ITS ESTERS
RAJESH K. JAIN, KRISHAN LAL and HARI L. BHATNAGAR *
Department of Chemistry, Kurukshetra University, Kurukshetra 132 119 (India)
SUMMARY
The kinetics of the thermal decomposition of cellulose and its esters (acetate, propionate, benzoate, p-toluyate, (Y- and /3-naphthoate and 9-anthroate), a phenoxy ester (phenoxyace- tate) and chloro esters (chloroacetate, chloropropionate and chlorobenzoate) in air were studied by thermogravimetry and differential thermal analysis from ambient temperature to 65O’C. From the resulting data, various thermodynamic parameters for different stages of thermal degradation of cellulose and its esters have been obtained following the methods of Freeman and Carroll, Broido, Dave and Chopra, and Chattetjee. The activation energies for the decomposition of cellulose and its esters were found to be in the range 85-240 kJ mol-‘, but the free energies of activation are almost the same, viz., 165-180 kJ mol-‘, indicating that the basic steps in the thermal degradation of cellulose and its esters are the same. A mechanism for the thermal degradation of cellulose esters is proposed. The IR spectra of the pyrolysis residues of cellulose esters indicate that dehydration takes place and a compound containing carbonyl groups is formed. X-Ray diffraction studies of cellulose and its esters showed that the acetylation of cellulose results in a more amorphous structure, which, on heat treatment up to 210°C, results in a sharp increase in the crystalline structure. This results in an increase in the decomposition temperature of the acetylated product of cellulose. Scanning electron microscopy studies of cellulose esters indicated that the fibrillar reaction sites have mostly reacted.
INTRODUCTION
Thermal, morphological and X-ray diffraction studies help in our under- standing of the mechanisms that renders cellulose and its derivatives more resistant to heat and flame. The thermal degradation of cellulose [l] itself has been extensively investigated both in air and in inert atmospheres, but few attempts have been made to study the kinetics of the decomposition of cellulose and its esters. Scotney [2] analysed the fractionated volatile prod- ucts arising from the stepwise thermal degradation of cellulose triacetate but no attempt was made to study the kinetics of the reaction.
In this study, cellulose samples treated with various aliphatic and aromatic acids were obtained and the kinetics of the thermal degradation [3-61 of
0165-2370/85/$03.30 0 1985 Elsevier Science Publishers B.V.

360
cellulose and its esters in air were studied from ambient temperature to 650°C using thermogravimetry (TG), differential thermogravimetry (DTG) and differential thermal analysis (DTA) techniques. The structure and morphology of cellulose and its esters were studied by X-ray diffraction and scanning electron microscopy techniques.
EXPERIMENTAL
The following samples of cellulose and its esters were selected: (i) cellulose (Schleicher & Schiill, Dassel, F.R.G.), dried to a constant weight in vacua at 60°C; (ii) cellulose acetate (BDH Chemicals, Poole, Great Britain), extracted with methanol in a Soxhlet apparatus and dried in vacua at 60°C; (iii) cellulose propionate, prepared by treating cellulose with propionic anhydride and anhydrous sodium propionate in pyridine at 60°C for 48 h, extracted with methanol in a Soxhlet apparatus and dried in vacua over P,O,,; (iv) cellulose benzoate; (v) cellulose p-toluyate; (vi) cellulose a-naphthoate; (vii) cellulose P-naphthoate; (viii) cellulose 9-anthroate; (ix) cellulose pheno- xyacetate; (x) cellulose chloroacetate; (xi) cellulose chloropropionate; and (xii) cellulose chlorobenzoate. Samples iv-xii were obtained by treating cellulose with the respective acid chloride (reagent grade) in pyridine and the products were extracted with methanol in a Soxhlet apparatus. The purified material was dried in vacua at 60°C over P,O,,. The reaction temperature for samples iv-ix and xii was kept at 95°C for 12, 12, 20, 20, 24, 8 and 20 h, respectively, and for samples x and xi it was kept at 60°C for 8 and 16 h, respectively. The samples were characterized by their IR spectra.
Acyl contents
Acetyl, propionyl, benzoyl, p-toluyl, a-naphthoyl, P-naphthoyl, 9-an- throyl and phenoxyacetyl contents were determined by the ASTM method [7] using duplicate samples. The chloroacetyl, chloropropionyl and chloro- benzoyl contents were obtained from the percentage of chlorine present in the samples. The degrees of substitution (DS) of the different samples determined from the percentage acyl contents are given in Table 1.
Thermal analysis
The DTA, TG and DTG thermograms were obtained using a Netzsch (F.R.G.) Model 409 thermoanalyser. The DTA and TG curves were run under a dynamic air (dried) atmosphere at a flow-rate of 100 ml min-1 and at a scanning rate of 10°C mm-‘.

361
Infrared spectroscopy
For the IR studies (Beckman IR-20 spectrophotometer), 2% charred samples of cellulose esters were prepared by the KBr technique. The charred samples were prepared by heating them in a DTA cell. Heating was stopped at the desired temperature and the residues were allowed to cool and quickly transferred into a stoppered sample container.
X-Ray diffraction
The X-ray diffraction patterns were obtained using Ni-filtered Cu Ka radiation from a Philips 1009 stabilized X-ray generator at 20 mA and 20 kV. Amounts of 100 mg of the fibrous samples were cut into fine powder, passed through a 300-mesh screen, and made into a 5 mm long x 1 mm diameter cylindrical pellet with the aid of a die. The X-ray beam through a collimator of diameter 0.5 mm was allowed to fall on the samples. The film-to-sample distance was fixed at 63 mm and the exposure times, with double coated Indu (no screen) X-ray film, were 6 h in each instance.
Scanning electron microscopy
Scanning electron microscopy (SEM) observations were made using a Philips PSEM-500 instrument operated at an emission current of 20 kV and 20 PA with the specimen position tilted at 33.5” and at a pressure of about 10e5 mmHg. Samples for SEM were mounted on metal stubs with adhesive tape and were sputtered with gold.
RESULTS AND DISCUSSION
Thermal studies
DTA, TG and DTG thermograms of samples i-xii were obtained in a dynamic air medium and are shown in Figs. 1-12, respectively. The peak temperatures (with initiation and termination) for the thermal degradation of cellulose and its esters are given in Table 1.
Esterified cellulose samples give thermograms distinct from that of the pure cellulose sample. There is almost no endotherm associated with the evaporation of moisture. This is reasonable as the moisture-absorbing capac- ity of the cellulose product decreases when the moisture-holding hydroxy groups are replaced by ester groups. For cellulose acetate with a high degree of substitution (DS 2.31) there is a sharp endotherm at 344°C which may be due to melting and decomposition of the compound. At 378OC there is a large exotherm, which may be due to the oxidation of the volatile products.

362
The last large exotherm, peaking at 506°C represents the oxidation of the charred residue. For cellulose propionate (DS 1.52) a small endotherm at 316°C (melting point) is followed by a large exotherm at 360°C which may be due to the oxidation of the volatile products.
For cellulose benzoate, p-toluylate, a-naphthoate and P-naphthoate, the DTA thermograms show two endotherms followed by two exotherms. For cellulose benzoate, the lower first endotherm beginning at 190°C ending at 348°C and peaking at 319°C may be associated with the melting process.
100 200 300 400 500
TEMPERATURE/‘C
Fig. 1. Thermal analysis of cellulose in air.
600
25 F.
TG ,: ‘\ -.-._._
DTG
-“‘\..._..._ 0
100 200 300 ii
1EMPERATUREF.C 1
400 500 600
Fig. 2. Thermal analysis of cellulose acetate in air.

363
The second endotherm may be due to the formation and evaporation of volatile products. The exotherm at 386°C is due to the oxidation of volatile products and the last exotherm respresents the oxidation of the charred residual products. Similar endotherms and exotherms were obtained for cellulose p-toluylate and (Y- and P-naphthoate. The shape, size and tempera- ture of the endotherm vary, depending on the nature of the substituent groups in the cellulose matrix. For cellulose 9-anthroate (DS 0.61), owing to a small degree of substitution, the compound, in the initial stages, behaved like cellulose. The first and second exotherms are the same as the low-tem-
25 TG
.fl---
!? 20 - s
::
E” 15- .
: 0 a’
’ lo DTA -----____----+’ I
(L
I” 5- =;
4
0 100 200 300 LOO 500 600
TEMPERATUREI’C
Fig. 3. Thermal analysis of cellulose propionate in air.
25 TG 0
I
20 - DTG -.-...--.-.-._,_._
E” IS-
:
5 w
3 lo- DTA
---_-___-----__
P
0
100 200 300 LOO 500 600
TEMPERATURE f ‘C
Fig. 4. Thermal analysis of cellulose benzoate in air.
364
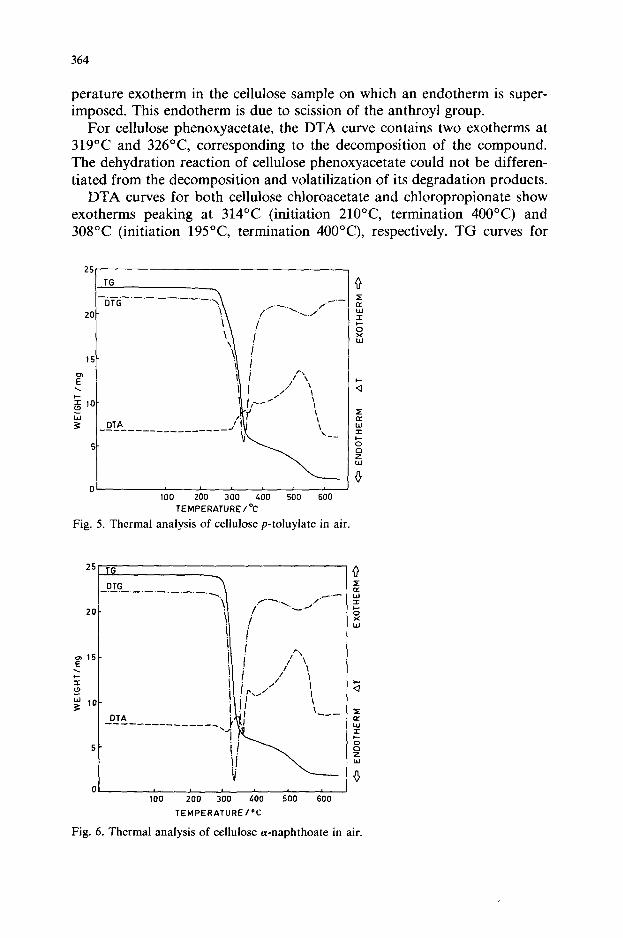
perature exotherm in the cellulose sample on which an endotherm is super- imposed. This endotherm is due to scission of the anthroyl group.
For cellulose phenoxyacetate, the DTA curve contains two exotherms at 319°C and 326°C corresponding to the decomposition of the compound. The dehydration reaction of cellulose phenoxyacetate could not be differen- tiated from the decomposition and volatilization of its degradation products.
DTA curves for both cellulose chloroacetate and chloropropionate show exotherms peaking at 314°C (initiation 210°C termination 400°C) and 308°C (initiation 195°C termination 4OO”C), respectively. TG curves for
15-
E” \ c 5 lo-
ci 3 DTA __-_--_________---
0 100 200 300 LOO 500 600
TEMPERATURE / “C
Fig. 5. Thermal analysis of cellulose p-toluylate in air.
25 TG
DTG -.-.-.- ._.__ -.-._._,
zo-
F l5
: 5 3
2 lo-
DTA -----m--w____-_
5-
0 100 200 300 400 500 600
TEMPERATUREI’C
Fig. 6. Thermal analysis of cellulose a-naphthoate in air.

365
these compounds also show the beginning of weight loss at 210°C and 195°C respectively. This indicates that the endotherms due to dehydration in these instances are overshadowed by exothermic effects due to decomposi- tion of the compounds. The corresponding exotherms for cellulose acetate and propionate appear at 378°C and 36O”C, respectively. This shows that the incorporation of chlorine into cellulose acetate and propionate lowers the decomposition temperature and thus increases the production of char, water, etc., at the expense of the combustible materials. For cellulose chlorobenzo- ate, the exotherm appears at 371°C. The corresponding temperature for
257
TG 0
P
fi 20 -
5
DTG :: -.-.- - -‘-‘-‘-‘N ./.- w
r 15-
:
2 a’
w 3 lo-
I
cl
E s- z
DTA ---- z
i 0
100 200 300 LOO 500 600
TE_MPERATUFjEI’C
Fig. 7. Thermal analysis of cellulose /3-naphthoate in air.
25-
TG
01
100 200 300 LOO 500 600
TEMPERATURE /oc
Fig. 8. Thermal analysis of cellulose 9-anthroate in air.
366
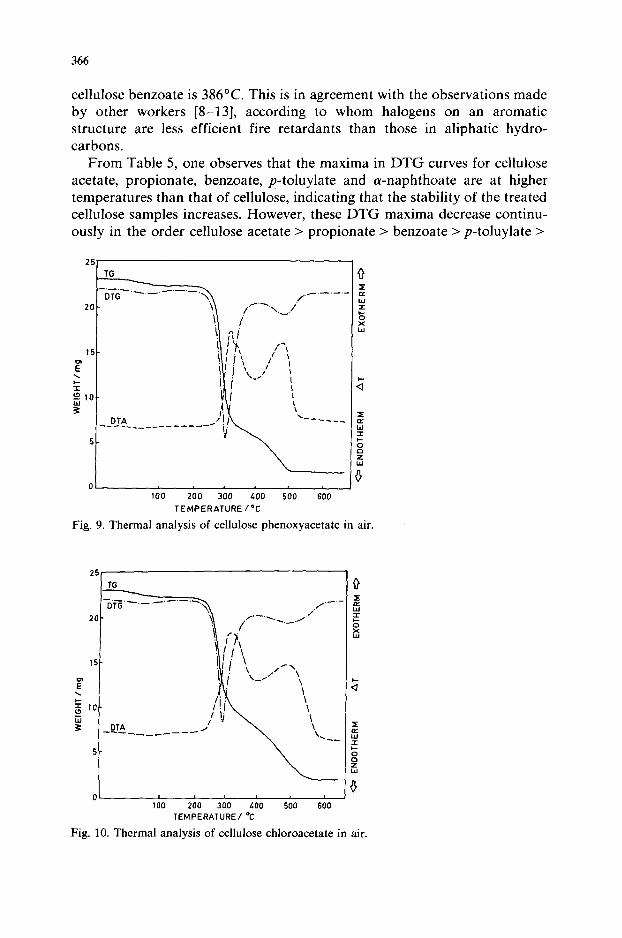
cellulose benzoate is 386°C. This is in agreement with the observations made by other workers [8-131, according to whom halogens on an aromatic structure are less efficient fire retardants than those in aliphatic hydro- carbons.
From Table 5, one observes that the maxima in DTG curves for cellulose acetate, propionate, benzoate, p-toluylate and cY-naphthoate are at higher temperatures than that of cellulose, indicating that the stability of the treated cellulose samples increases. However, these DTG maxima decrease continu- ously in the order cellulose acetate > propionate > benzoate > p-toluylate >
100 200 300 LOO 500 600
TEMPERATURE /‘C
Fig. 9. Thermal analysis of cellulose phenoxyacetate in air.
15-
z
: 3 lo-
ci 3 DTA ---____----
5-
0 100 200 300 LOO 500 600
TEMPERATURE/ “C
Fig. 10. Thermal analysis of cellulose chloroacetate in air.
367
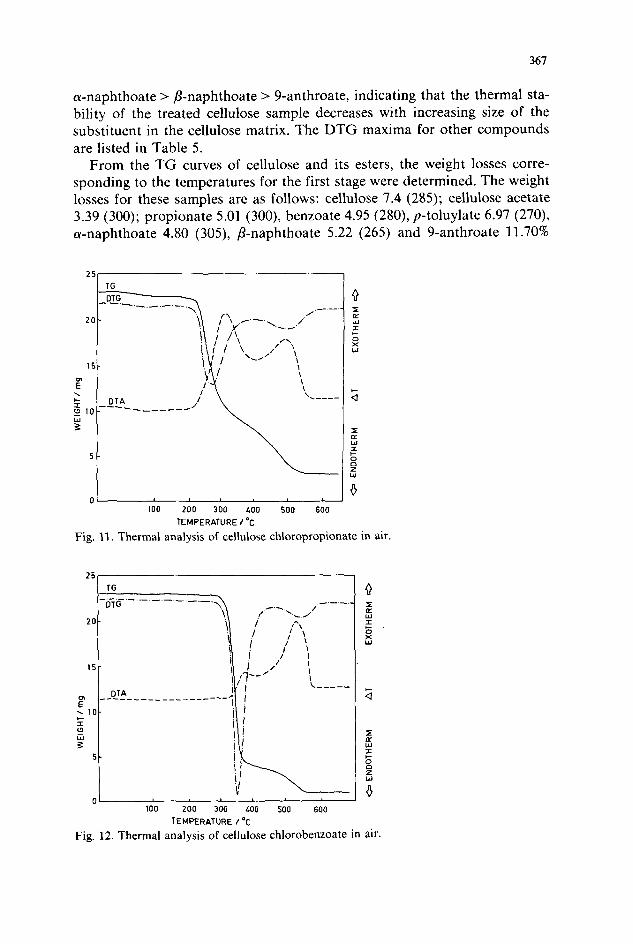
a-naphthoate > P-naphthoate > 9-anthroate, indicating that the thermal sta- bility of the treated cellulose sample decreases with increasing size of the substituent in the cellulose matrix. The DTG maxima for other compounds are listed in Table 5.
From the TG curves of cellulose and its esters, the weight losses corre- sponding to the temperatures for the first stage were determined. The weight losses for these samples are as follows: cellulose 7.4 (285); cellulose acetate 3.39 (300); propionate 5.01 (300), benzoate 4.95 (280), p-toluylate 6.97 (270), a-naphthoate 4.80 (305), /?-naphthoate 5.22 (265) and 9-anthroate 11.70%
25
TG
5-
0 0
100 200 300 LOO 500 600
TEMPERATURE /‘c
Fig. II. Thermal analysis of cellulose chloropropionate in air.
100 200 300 LOO 500 600
TEMPERATURE 1 ‘C
Fig. 12. Thermal analysis of cellulose chlorobenzoate in

368
TABLE 1
Peak temperatures in the DTA thermograms for cellulose and its esters, phenoxyacetate and chloro esters in air
Sample Compound No.
Degree DTA curve Nature of the
of sub- Initiation Peak Termination DTA peak
stitution temp. temp. temp.
(“0 (“C) (“C)
i
ii
. . 111
iv
V
vi
vii
. . . Vlll
ix
X
xi
xii
Cellulose -
Cellulose acetate
2.31
Celfulose propionate
1.52
Cellulose benzoate
1.73
Cellulose p-toluylate
1.46
Cellulose 1.34 n-naphthoate
Cellulose 1.50
/3-naphthoate
Cellulose 9-anthroate
0.61
Cellulose 0.75 phenoxyacetate Cellulose 0.16 chloroacetate Cellulose 0.53
chloropropionate Cellulose 2.28 chlorobenzoate
260 274 280 Exo (small)
280 314 325 Endo (large)
325 350 405 Exo (large)
405 468 520 Exo (large)
278 289 292 Exo (small)
292 344 373 Endo (large)
373 378 425 Exo (large)
425 506 560 Exo (large)
285 308 310 Exo (small)
310 316 320 Endo (small)
320 360 410 Exo (large)
410 470 525 Exo (large)
190 319 348 Endo (large)
348 370 375 Endo (large)
375 386 430 Exo (small)
430 543 610 Exo (large)
280 302 333 Endo (small)
333 356 362 Endo (small)
362 373 405 Exo (large)
405 522 600 Exo (large)
260 315 348 Endo (large)
348 368 372 Endo (large)
372 384 405 Exo (small)
405 521 590 Exo (large)
280 310 342 Endo (small)
342 361 368 Endo(large) 368 380 403 Exo (small)
403 520 600 Exo (large) 232 263 270 Exo (small) 270 281 290 Endo (small)
290 304 340 Exo (large)
340 370 400 Endo (large)
400 514 600 Exo (large) 260 319,326 395 Exo (large)
395 477 540 Exo (large) 220 314 400 Exo (large) 400 482 580 Exo (large)
195 308 400 Exo (large)
400 488 575 Exo (large)
327 371 407 Exo (large) 407 521 575 Exo (large)
(265°C). As the treated cellulose samples were not fully substituted with ester groups, the weight losses shown above at the temperatures mentioned correspond to dehydration of the compound. The elimination of acid from the compound starts after dehydration, as is evident from the increase in weight loss at higher temperatures. However, for cellulose 9-anthroate, the higher weight loss indicates that the dehydration is accompanied by elimina- tion of acid from the compound to some extent. The weight losses for the second stage (where the stage ends) for cellulose and its esters (except cellulose 9-anthroate) lie in the range 76-80% in the temperature range 410-440°C. The weight loss for cellulose 9-anthroate at 430°C was found to be 58.3%. This was expected, as the degree of substitution of this compound is 0.61 and the compound has eliminated the acid in the first stage also.
(10&T-I/AlogW)/K-’
0 0.8 1.6 2.4 3. 2 I I I I I I 1 po
- -4.0
? - -12.0 F
3
- -36.0
J_ 42.0
5 -4.0
5 Q -8.0
5
6 -12.0
a” - -16.0
-20.0 0 0.4 0.8 1.2 1.6
(103.AT -‘/AlogW )/K -’
.-I
2.0
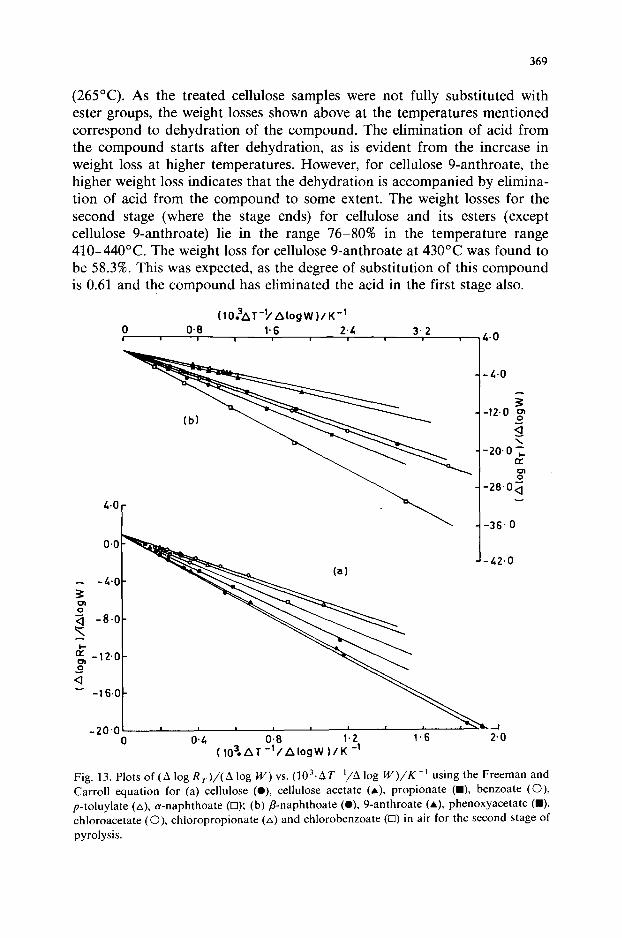
Fig. 13. Plots of (A log Rr)/(A log W) vs. (103.ATm’/A log tV)/K-’ using the Freeman and Carroll equation for (a) cellulose (o), cellulose acetate (A), propionate (m), benzoate (0) p-toluylate (A), a-naphthoate (0); (b) ,!3-naphthoate (0) 9-anthroate (A), phenoxyacetate (M). chloroacetate (O), chloropropionate (A) and chlorobenzoate (0) in air for the second stage of
pyrolysis.

370
The weight versus temperature curves for cellulose and its esters, pheno- xyacetate and chloro esters are shown in Figs. l-12. The initial but small weight loss due to adsorbed moisture, observed in some instances, was neglected. The kinetic parameters for the elimination of acid and dehydra- tion (first stage), decomposition (second stage) and oxidation of char residue (third stage) for cellulose and treated cellulose samples were determined using the procedure described by Freeman and Carroll [3] (from the TG curve), Broido [4] (from the TG curve) and Dave and Chopra [5] (from the DTG curve). The Freeman and Carroll method was applied to the decom- position stage only. The values of the activation energy, E,, the frequency factor, 2, and the order of reaction, n, were calculated from the plots of A log R,/A log W vs. A(l/T)/A log W (Freeman and Carroll method), ln[ln(l/_v)] vs. l/T (Broido method) and In k, vs. l/T (Dave and Chopra method) for the stages of different temperature ranges.as described earlier [14]. Linear plots were obtained in each instance. As an illustration, plots of A log R,/A log W vs. A(l/T)/A log W for the decomposition stage for cellulose and treated cellulose samples are shown in Fig. 13.
First stage of thermal degradation
Table 2 gives the activation energies and frequency factors for the first stage of the thermal degradation of cellulose and its esters, phenoxyacetate and chloro esters. It can be seen that the activation energies for cellulose esters are less than that for cellulose; the magnitude of the decrease depends on the degree of substitution and the nature of the substituent.
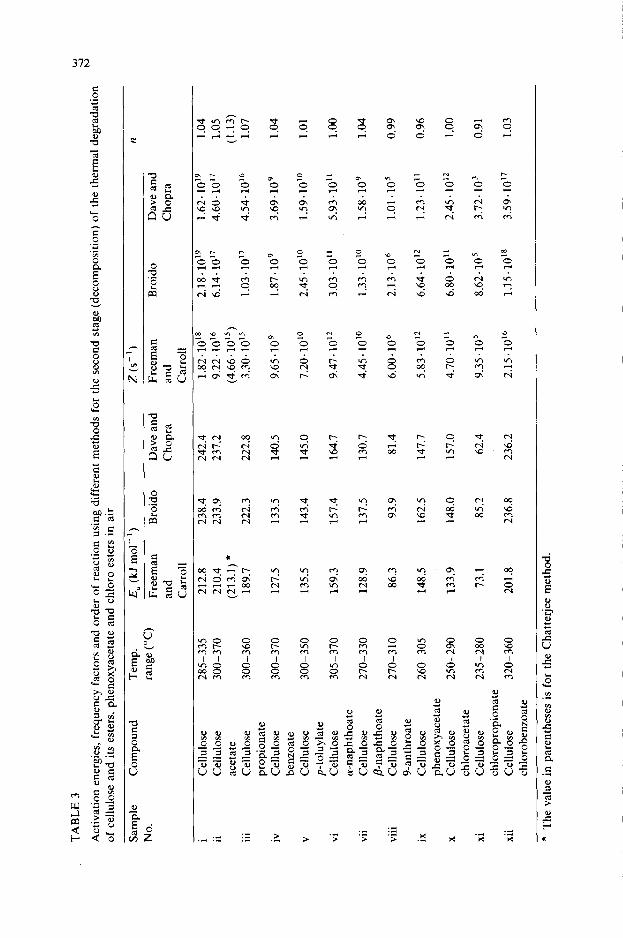
Second stage of thermal degradation
Table 3 gives the activation energies, frequency factors and order of reaction for the second stage (decomposition) of thermal degradation. In order to compare the activation energies and order of reaction obtained by Freeman and Carroll [3], Broido [4] and Dave and Chopra [5] with those of the Chatterjee [6] method, TG thermograms from two different initial weights for a sample of cellulose acetate (Fig. 2) were obtained and the data were analysed for the decomposition. The results were in good agreement with those obtained from the Freeman and Carroll method. Both these methods gave a value of about unity for the order of reaction.
An inspection of the DTA and DTG peaks for cellulose and its esters indicates that although the decomposition temperature and maximum de- gradation rates are higher for cellulose esters than for pure cellulose, the activation energies for the second stage of degradation of cellulose esters are lower than that of cellulose. The decrease in the activation energies for cellulose esters is due to the fact that the primary hydroxy group that participates in the reaction of laevoglucosan formation is now blocked on

371
esterification and prevents the formation of laevoglucosan because of steric hindrance between carbons 1 and 6. Also, the oxidation of the primary hydroxy group not only introduces steric hindrance but also weakens the whole cellulose ring structure.
For cellulose acetate and propionate, the decrease in activation energies is small. The activation energy decreases from 238 kJ mol-’ for cellulose to 133 kJ mol-’ for cellulose benzoate. This indicates that when the hydroxy group of cellulose is replaced with an aromatic ester group, the modified cellulose will be more susceptible to thermal degradation. Similar observa- tions can be made for other cellulose esters, namely, p-toluylate, (Y- and P-naphthoate and 9-anthroate. For cellulose phenoxyacetate (DS 0.75), the activation energy was 162 kJ mol-‘.
The following observations may be made for cellulose chloroesters. Al- though the degree of substitution for cellulose chloroacetate is small (DS 0.16), the decrease in activation energy is higher, i.e., from 238 kJ mol-’ for cellulose to 148 kJ mol-’ for cellulose chloroacetate. For cellulose chloro-
TABLE 2
Activation energies and frequency factors using different methods for the first stage of the thermal degradation of cellulose and its esters, phenoxyacetate and chloro esters in air
Sample Compound Temp. range E, (kJ mol-‘) z (SK’) No. (“C) Broido Dave and Broido Dave and
i ii
240-285 172.1
Chopra
180.9
Chopra
1.36.1013 3.37.10’3
. . . 111
iv
V
vi
vii
. . . Vlll
ix
X
xi
xii
Cellulose Cellulose acetate Cellulose propionate Cellulose benzoate Cellulose p-toluylate Cellulose a-naphthoate Cellulose /3-naphthoate Cellulose 9-anthroate Cellulose phenoxyacetate Cellulose chloroacetate Cellulose chloropropionate Cellulose chlorobenzoate
240-300 83.9 _ 6.51.103 -
250-300 133.0 151.7 4.64.10’ 8.03.109
255-300 117.2 127.6 5.06.10’ 3.21. lo8
255-300 96.5 _ 1.17.106 -
260-305 141.7 _ 2.19.109 -
225-270 140.4 141.8 4.19.1o’O 1.40.10’”
225-270 171.9 _ 1.28.1014 -
215-260 135.1 179.3 l.31.10’” 1.15. lOI
210-250 121.8 165.5 1.63.109 1.49.10’3
200-235 192.5 181.5 1.99.10” 4.91.10’5
280-320 207.8 207.3 3.11.10r5 1.05.10’5
TA
BL
E
3 w
Act
ivat
ion
ener
gies
, fr
eque
ncy
fact
ors
and
orde
r of
re
actio
n us
ing
diff
eren
t m
etho
ds
for
the
seco
nd
stag
e (d
ecom
posi
tion)
of
th
e th
erm
al
degr
adat
ion
G
of
cellu
lose
an
d its
est
ers,
ph
enox
yace
tate
an
d ch
loro
es
ters
in
ai
r
Sam
ple
No.
i ii . . .
111
iv
V vi
vii . . .
VIII
ix
X xi
xii
Com
poun
d T
emp.
E
, (k
J m
ol-‘
) z
(SK
’)
n
rang
e (“
C)
Free
man
B
roid
o D
ave
and
Free
man
B
roid
o D
ave
and
and
Cho
pra
and
Cho
pra
Car
roll
Car
roll
Cel
lulo
se
285-
335
212.
8 23
8.4
242.
4 1.
s2.1
0’*
2.18
.10’
9 1.
62.1
0’9
1.04
C
ellu
lose
30
0-37
0 21
0.4
233.
9 23
7.2
9.22
. lO
i 6.
14.1
0”
4.60
. lO
I 1.
05
acet
ate
(213
.1)
* (4
.66.
1015
) (1
.13)
C
ellu
lose
30
0-36
0 18
9.7
222.
3 22
2.8
3.30
.10’
5 1.
03.1
0”
4.54
.10’
6 1.
07
prop
iona
te
Cel
lulo
se
300-
370
127.
5 13
3.5
140.
5 9.
65.
lo9
1.87
.109
3.
69,
lo9
1.04
benz
oate
C
ellu
lose
30
0-35
0 13
5.5
143.
4 14
5.0
7.20
.10”
2.
45.1
0”
1.59
.1o’
O
1.01
p-to
luyl
ate
Cel
lulo
se
305-
370
159.
3 15
7.4
164.
7 9.
47.1
0’2
3.03
.10”
59
3.10
” 1
.oo
wna
phth
oate
C
ellu
lose
27
0-33
0 12
8.9
137.
5 13
0.7
4.45
.10’
0 1.
33.1
o’O
1.
58.
lo9
1.04
/I-n
apht
hoat
e C
ellu
lose
27
0-31
0 86
.3
93.9
81
.4
6.00
.106
2.
13.1
06
1.01
~10s
0.
99
9-an
thro
ate
Cel
lulo
se
260-
305
148.
5 16
2.5
147.
7 5.
83.1
0’*
6.64
.10’
* 1.
23.1
0”
0.96
phen
oxya
ceta
te
Cel
lulo
se
250-
290
133.
9 14
8.0
157.
0 4.
70.1
0”
6.80
. IO
” 2.
45 *
lOI*
1 .
oo
chlo
roac
etat
e C
ellu
lose
23
5-28
0 73
.1
85.2
62
.4
9.35
. lo
5 8.
62.
lo5
3.72
.103
0.
91
chlo
ropr
opio
nate
C
ellu
lose
32
0-36
0 20
1.8
236.
8 23
6.2
2.15
- 10
16
1.15
.101
8 3.
59 1
10”
1.03
chlo
robe
nzoa
te
l
The
va
lue
in
pare
nthe
ses
is f
or
the
Cha
tterj
ee
met
hod.

373
propionate, owing to the high degree of substitution compared with cellulose chloroacetate, the decrease in activation energy is high. This shows that the incorporation of halogen into the cellulose matrix decreases the flammability of the polymer composition. For cellulose chlorobenzoate, the activation energy is of the same order of magnitude as for cellulose, indicating that the incorporation of halogens into the aromatic structure is of little use as far as flame retardancy is concerned.
Third stage of thermal degradation
High-temperature exotherms between 400 and 600°C (oxidation of char residue) in air are fairly comparable except for the shift in the range of temperatures for cellulose esters, phenoxyacetate and chloro esters. The activation energies and frequency factors for the third stage (oxidation of char residue) are given in Table 4.
The entropies of activation, AS*, and the free energies of activation, AG*, at 600 K for the decomposition stage of cellulose and its esters, phenoxyace-
TABLE 4
Activation energies and frequency factors using different methods for the third stage of the thermal degradation of cellulose and its esters, phenoxyacetate and chloro esters in air
Sample Compound No.
Temp. range E, (kJ mol-‘) z (s-l)
PC) Broido Dave and Broido Dave and Chopra Chopra
i ii
111
iv
V
vi
vii
. . Vlll
ix
X
xi
xii
Cellulose Cellulose
acetate Cellulose propionate Cellulose benzoate Cellulose p-toluylate Cellulose cu-naphthoate Cellulose fl-naphthoate Cellulose 9-anthroate Cellulose phenoxyacetate Cellulose chloroacetate Cellulose chloropropionate Cellulose chlorobenzoate
425-500 187.1 187.2 1.03~10” 4.79.10’0 440-520 201.3 201.8 2.49.10” 1.22.10”
440-500
470-560
450-560
460-550
460-575
450-520 199.0 197.8
430-500 178.6 167.6
420-550 102.2 126.2
410-520
470-545
233.2 226.3
134.7 148.9
159.3 156.6
141.6 163.8
132.6 134.7
121.4 147.4
214.7 243.0
2.18.1Or4 3.14.10r3
1.95. lo6 1.04.10’
1.18.10’ 4.28.10’
8.76 ’ lo6 1.80.108
1.76.106 1.59.106
7.46.10” 3.08.10”
1.92-10” 1.90.109
3.53.104 1.31 .106
1.20.106 5.36.10’
9.70.10” 3.56.1013

TA
BL
E
5
DT
G
max
ima,
en
trop
ies
and
free
en
ergi
es
of a
ctiv
atio
n fo
r th
e se
cond
st
age
of t
he
ther
mal
de
grad
atio
n of
cel
lulo
se
and
its e
ster
s,
phen
oxya
ceta
te
and
2
chlo
ro
este
rs
in
air
Sam
ple
No.
C
ompo
und
AG
* (k
J m
ol-‘
) at
600
K
Cha
r yi
eld
at 7
75 K
(w
eigh
t W
)
DT
G
max
ima
(“C
)
AS*
(J
deg
g’
mol
-‘)
at 6
00 K
Free
man
B
roid
o D
ave
and
and
Cho
pra
Car
roll
Free
man
an
d C
arro
ll
Bro
ido
Dav
e an
d C
hopr
a
321.
90
.5
111.
2 10
8.7
153.
5 16
6.7
172.
2
355
65.7
81
.5
79.1
16
5.9
180.
0 18
4.7
(40.
9) *
(1
83.5
) 35
1 38
.1
66.6
59
.8
161.
9 17
7.3
181.
9
i ii . Ill iv
V vi
vii . .
Vll
l
ix
X xi
xii
Cel
lulo
se
Cel
lulo
se
acet
ate
Cel
lulo
se
prop
iona
te
Cel
lulo
se
benz
oate
C
ellu
lose
p-
tolu
ylat
e C
ellu
lose
a-
naph
thoa
te
Cel
lulo
se
fi-n
apht
hoat
e C
ellu
lose
9-
anth
roat
e C
ellu
lose
ph
enox
yace
tate
C
ellu
lose
ch
loro
acet
ate
Cel
lulo
se
chlo
ropr
opio
nate
C
ellu
lose
ch
loro
benz
oate
7.76
12
.08
10.9
7
350
- 67
.1
-81.
5 -
75.9
16
3.2
177.
4 18
1.1
15.7
4
344
-51.
2 -
60.1
-
63.8
16
1.2
174.
5 17
8.3
14.7
3
340
- 10
.6
- 39
.2
- 33
.7
160.
7 17
6.0
179.
9 15
.86
320
- 55
.2
-65.
2 -
82.9
15
7.0
171.
6 17
5.5
17.0
3
300
- 12
9.3
- 13
7.9
- 16
3.2
158.
8 17
1.7
174.
4 30
.71
305
- 14
.7
- 13
.6
- 46
.7
152.
3 16
5.7
170.
7 8.
93
289
- 35
.6
- 32
.5
-21.
9 15
0.2
162.
5 16
5.4
16.6
1
271
- 14
4.7
- 14
5.4
- 19
0.7
154.
9 16
7.4
171.
8 19
.30
355
53.6
86
.7
77.0
16
4.6
179.
8 18
5.0
16.0
4
* T
he
valu
e in
par
enth
eses
is
for
th
e C
hatte
rjee
m
etho
d.

375
tate and chloro esters were calculated as described earlier [14] and are given in Table 5. For pure cellulose and cellulose aliphatic esters, the entropies of activation are positive whereas for cellulose aromatic esters, phenoxyacetate and aliphatic chloro esters, they are negative. However, the low values of the entropies of activation are compensated by the values of the enthalpies of activation, leading to almost the same value (1633180 kJ mol-‘) for the free energy of activation (Broido method). This shows that the basic step in the decomposition stage in the thermal degradation of cellulose esters, pheno- xyacetate and chloro esters is the same.
Thermal degradation mechanism of cellulose esters
In the mass spectrum of cellobiose acetate [15] there is an abundant fragment at m/z 28 and 44, indicating the production of CO and CO,. The significant constituent of the volatile fractions appeared at m/z 60 and 18, which may be due to acetic acid and water. Similar observations were also made by Scotney [2] during the stepwise thermal degradation of cellulose triacetate. In particular, the early evolution of large amounts of carbon oxides at the onset of degradation indicates the extensive breakdown of the pyranose ring. Scotney [2] also found large amounts of acetic acid formed and an unsaturated nature of the tarry material in the thermal degradation of cellulose triacetate. Based on these observations, he assumed that deacety- lation in the polymer chain was one of the principal decomposition processes. As there is a P-hydrogen atom available for each acyl group, the elimination of the acid can be represented [16] by
/R
H>y_c 1 ““=“p _* >c=c< /R
+ H-O-CC\\ 0
I I
Further, it was shown that the acetate groups attached to the secondary carbon atoms (C, and C,) are more readily eliminated than that attached to a primary carbon atom (C,), and so in each ring it is probable that the first carbon atom taking part in the thermal degradation is either the C, or the C, atom.
Based on the foregoing evidence, the following mechanism for the thermal degradation of cellulose esters is proposed (Fig. 14).
As elimination of both of the “secondary” hydroxy groups would lead to complete decomposition of the ring, it is proposed that dehydration of the polymer chain is also accompanied by elimination of the acid to a small extent. The formation of unsaturated tarry residue can be rationalized by assuming that the products of dehydration plus elimination of the acid may have undergone cleavage at the 1.6glycosidic linkage of pyranose rings to give some unstable products, which would further eliminate CO, CO,,
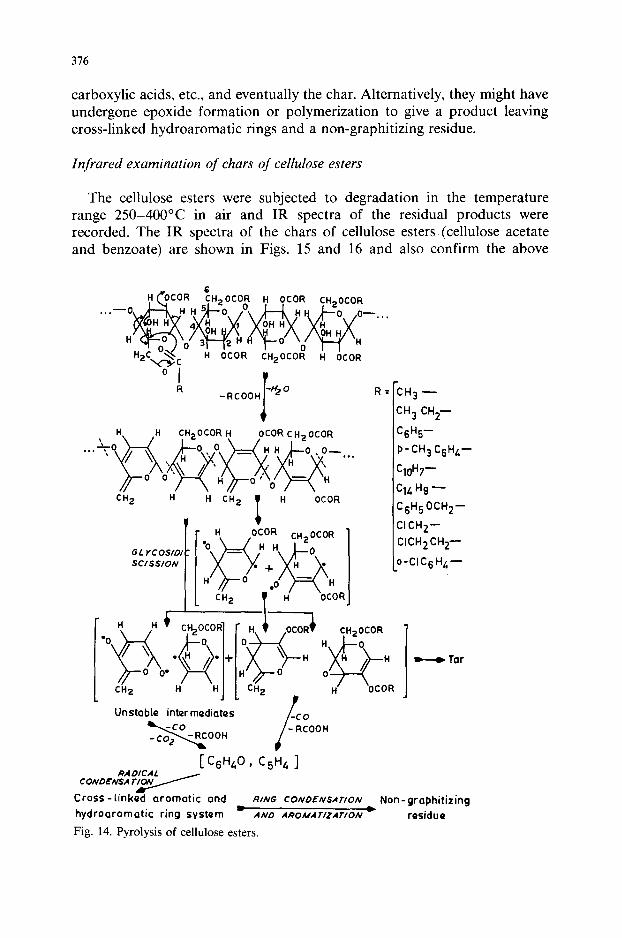
376
carboxylic acids, etc., and eventually the char. Alternatively, they might have undergone epoxide formation or polymerization to give a product leaving cross-linked hydroaromatic rings and a non-graphitizing residue.
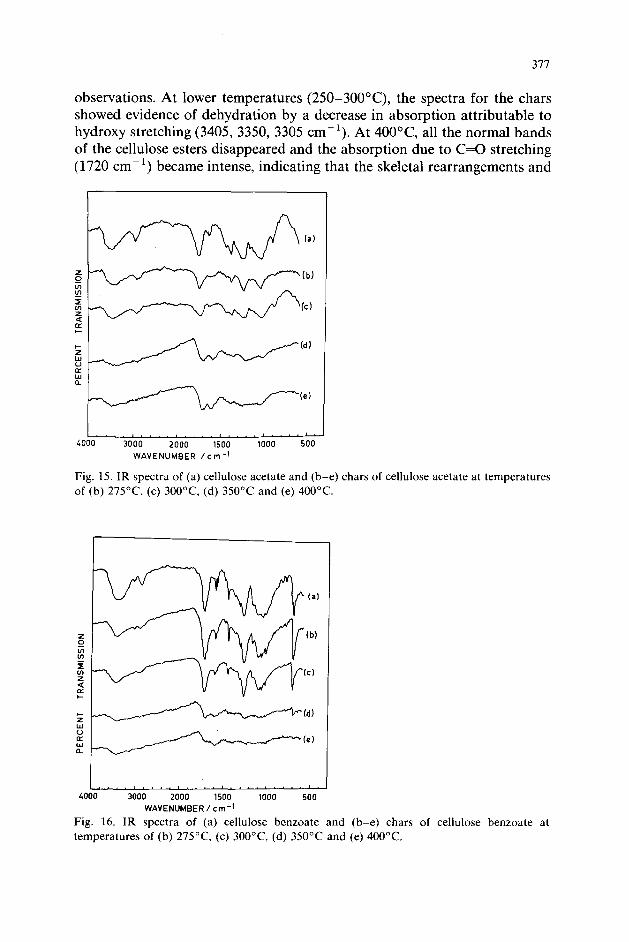
Infrared examination of chars of cellulose esters
The cellulose esters were subjected to degradation in the temperature range 250-400°C in air and IR spectra of the residual products were recorded. The IR spectra of the chars of cellulose esters (cellulose acetate and benzoate) are shown in Figs. 15 and 16 and also confirm the above
“h -RCOOH
-H2 0 I
tL rcosfol SCISSION
R= CH3- 1 CH3 CH2-
C6H5-
P- CH3 C6H4-
C10H7-
Cl4 H9 -
C6H5 OCHZ-
Cl CH2-
CICH2CH2-
o-CICgH4-
Unstable intermediates
*OOH
-co
/
- RCOOH
rCSH40 ’ C5”4 1
CONDENSA r/w “OY
Cross -linked aromatic and RING CONDENSATION
hydroaromatic ring system AND AROA4ATfZATfON *
Non- graphitizing
residue
Fig. 14. Pyrolysis of cellulose esters.
377
observations. At lower temperatures (250-3OO”C), the spectra for the chars showed evidence of dehydration by a decrease in absorption attributable to hydroxy stretching (3405, 3350, 3305 cm-‘). At 400°C, all the normal bands of the cellulose esters disappeared and the absorption due to C=O stretching (1720 cm-‘) became intense, indicating that the skeletal rearrangements and
LOO0 3000 2000 1500 1000 500
WAVENUMBER /cm-’
Fig. 15. IR spectra of (a) cellulose acetate and (b-e) chars of cellulose acetate at temperatures
(b) 275”C, (c) 3OO”C, (d) 350°C and (e) 400°C.
J LOO0 3000 2000 1500 1000 500
WAVENUMBER_/ cm-’
Fig. 16. IR spectra of (a) cellulose benzoate and (b-e) chars of cellulose benzoate at temperatures of (b) 275”C, (c) 3OO”C, (d) 350°C and (e) 400°C.

378
Fig. 17. X-Ray diffraction pattern of cellulose.
Fig. 18. X-Ray diffraction pattern of cellulose acetate.

379
the evolution of the volatile products commence at higher temperatures. At this temperature, the absorption band at 1640 cm-’ shifted to 1600 cm-’ (due to conjugated C=C), suggesting the formation of more C=C bonds in the residue from cellulose esters.
X-Ray studies on cellulose and its esters
The crystal structure of cellulose and its esters obtained on acetylation, propionylation, benzoylation and a-naphthoylation is indicated in Figs. 17-21. The values of d,,, calculated for the various samples are given in Table 6.
From the examination of the X-ray diffraction patterns and the d-values of various planes, it is evident that pure cellulose gives characteristic sharp rings corresponding to different planes, i.e., 101, 101, 002 and 004. For derivatives of cellulose, i.e., cellulose esters, the rings become diffuse, indicat- ing that the crystallinity is affected to varying extents depending on the nature of the substituent and the degree of substitution. For cellulose acetate (DS 2.31), the hydroxy groups are blocked and the loss of crystallinity seems to be maximal, with the result that it reduces to the amorphous form. On the other hand, cellulose propionate (DS 1.52) undergoes a much smaller loss of crystallinity compared with cellulose acetate with a higher degree of substitu- tion (DS 2.31). However, for other cellulose esters containing aromatic rings
Fig. 19. X-Ray diffraction pattern of cellulose propionate.

380
Fig. 20. X-Ray diffraction pattern of cellulose benzoate.
Fig. 21. X-Ray diffraction pattern of cellulose a-naphthoate.

381
the situation is different. Cellulose benzoate (DS 1.73) undergoes a smaller loss of crystallinity than cellulose a-naphthoate (DS 1.34). In the latter instance, the decrease in the d-values for the 101, 101 and 002 planes indicate that cellulose I is converted into cellulose II. The bulky group of a-naphthoate might have resulted into the instability and conversion into cellulose II.
The acetylation of cellulose results in an amorphous X-ray diffraction pattern, because the stability of the polymer increases as the DS increases in the cellulose, as explained by Watanabe et al. [17] for the X-ray diffraction of highly acetylated cellulose products. They concluded that the heteroge- neous acetylation of cellulose gives cellulose triacetate with a highly amorphous structure, which, on heat treatment of up to 210°C for 15 min, yields a 75% crystalline structure of cellulose triacetate. This explains why there is no decrease in the decomposition temperature in the acetylated product of cellulose. Acetylation of cellulose and subsequently the effect of heat treatment on cellulose triacetate may be described as follows:
cellulose tr1acetate I *
cellulose .
/’ (amorphous) tr1acetate I
cca 75% CrystallIne)
cellulose a cellulose tnacetate II triacetate
(amorphous) (CrystallIne F
The degree of substitution of other cellulose esters was lower than that of cellulose acetate. Therefore, the stability of these esters was lower than that of cellulose acetate. as shown in Tables 1 and 5.
TABLE 6
d-Values of various planes for cellulose and its esters
Sample Compound Degree of d (nm) No.
i ii
. Ill
iv
vi
substitution (101, ioi) too21 (004)
Cellulose 0.585 0.410 0.268 Cellulose 2.31 0.660 0.335 0
acetate Cellulose 1.52 0.603 0.389 0
. propionate Cellulose 1.73 0.586 0.400 0
benzoate Cellulose 1.46 0.417 0.320 0
a-naphthoate

382
Scanning electron microscopy of cellulose and its esters
When viewed in an SEM micrograph, a cellulose fibre is seen as having a twisted, convoluted, ribbon-like structure with a furrowed surface (Fig. 22a,b). Thus at x 800 magnification, the SEM micrograph (Fig. 22a) reveals convoluted cotton cellulose fibres, although some fibrils are visible. How- ever, at X 1600 magnification (Fig. 22b), the fibrils are clearly visible. These fibrils are potential reactive sites for a chemical reaction to take place with cellulose. The smooth surface generally offers greater resistance to chemical reaction.
Chemical treatment of cellulose is always accompanied by massive de- gradation and tearing of the fibres, and as a result highly irregular shaped or serrated SEM micrographs are observable. This can be best seen by observ- ing the cellulose acetate fibres (DS 2.31) in the middle portion of the specimen (Fig. 23a,b). Highly lacerated fibres can be seen in the middle. It can easily be seen that in none of the SEM micrographs of chemically treated cellulose is any fibrillar structure discernible. This indicates that the fibrillar reaction sites have reacted.
As mentioned earlier with regard to X-ray diffraction studies, heat treat- ment of cellulose triacetate at up to 210°C for 15 min results in a sharp increase in the crystalline structure, as evidenced in the SEM micrographs of cellulose acetate (Fig. 23c,d), where the fibre is seen to be fairly oriented. On heating at 250°C for 15 min (Fig. 23e,f), the surface seems to become smoother and probably it is forming a film. This can be seen in the cellulose acetate SEM micrographs (Fig. 23g,h) on further heating at 275°C and 300°C for 15 min, respectively.
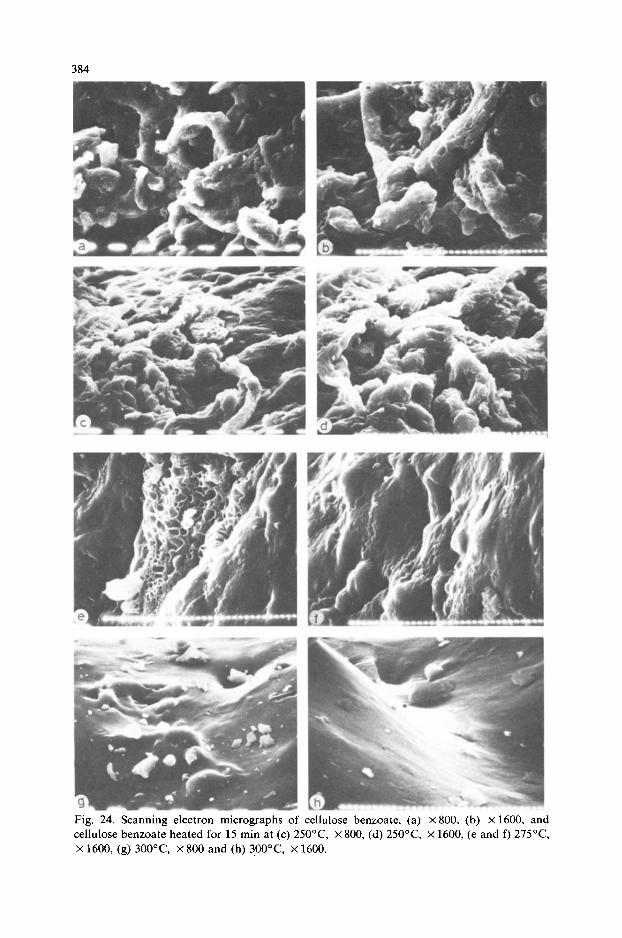
SEM studies of cellulose benzoate (DS 1.73) at magnifications of x800 and X 1600 (Fig. 24a,b) show that the fibrous structure of cellulose is partially maintained and the reacted fibres are jagged and torn. Heat treatment of cellulose benzoate at 250°C for 15 min shows that the fibre
Fig. 22. Scanning electron micrographs of cellulose, (a) X 800 and (b) X 160”
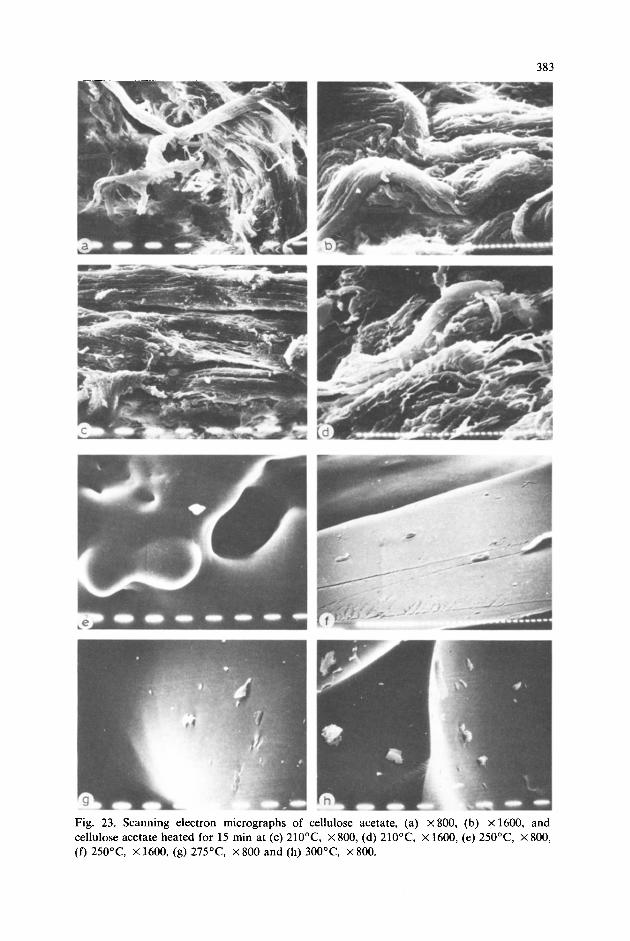
Fig. 23. Scanning electron micrographs of cellulose acetate, (a) X80& (b) X1600, and cellulose acetate heated for 15 min at (c) 21O”C, X 800, (d) 21O”C, X 1600, (e) 25OT, X 800, (f) 25OT, x 1600, (g) 275”C, X 800 and (h) 300°C, X 800.
384
Fig. 24. Scanning electron micrographs of cellulose benzoate, (a) X 800, (b) X 1600, and cellulose benzoate heated for 15 min at (c) 25O”C, X 800, (d) 250°C X 1600, (e and f) 275°C x 1600, (g) 3OO”C, x 800 and (h) 3OO”C, x 1600.

385
Fig. 25. Scanning electron micrographs of celluiose ff-naphthoate, (a) X 1200, (b) X 800, (c) x 1600, and cellulose a-naphthoate heated for 15 min at (d) 250°C X 800, (e) 25O”C, X 1600, (f) 275T, X 800, (g) 275”C, X 1600 and (h) 300°C, X 800.

386
becomes more twisted (Fig. 24c,d) and at 275°C the evolution of gas is visible (Fig. 24e,f). At 300°C near the peak temperature (319°C) in the DTA curve of cellulose benzoate, a sort of state of melting is visible (Fig. 24g,h) and the process of gas evolution is still continuing.
However, fairly interesting features are observed for cellulose (Y- and P-naphthoate (DS 1.34 and 1.50, respectively). The SEM micrographs (Figs. 25a and 26a) at the edge of the sample show the cross-section of reacted material and indicate compactness of the layering. However, in the middle portion of the sample, considerable alignment of the fibres takes place (Figs. 25b,c and 26b). This feature should impart mechanical and optical properties to the fabric in addition to the other desirable properties.
The SEM micrographs of cellulose a-naphthoate heat treated at 250°C for 15 min (Fig. 25d,e) show considerable smoothening of the surface and evolution of gas, which continues at 275°C also (Fig. 25f,g). At 300°C (near the peak temperature of the DTA curve), the process of film forming starts (Fig. 25h), as observed with cellulose acetate.
Cellulose propionate (DS 1.52) was studied by SEM at magnifications of x 800 and X1600. The SEM micrographs of this compound (Fig. 27a,b)
Fig. 26. Scanning electron micrographs of cellulose P-naphthoate, (a) X 800 and (b) X 1600.
Fig. 27. Scanning electron micrographs of cellulose propionate, (a) X 800 and (b) X 1600.

387
show that the fibrils have disappeared and in their place a sort of jagged tubular structure is observable. This can be clearly seen in Fig. 27a, where a tubular structure in some portion of the treated cellulose propionate is observable. At X 1600 magnification (Fig. 27b) the reacted fibrils appear as a swollen projection on the jagged tubular morphological structure of cellulose propionate.
Inspection of cellulose propionate SEM micrographs indicates that this compound should show fairly good spinnability. Further, it can be seen from earlier discussions that propionylated cellulose shows a decrease in the activation energy for thermal degradation. It also gives almost double the char yield at 775 K compared with untreated cellulose.
The SEM studies of cellulose p-toluylate (DS 1.46) show that the fibrils
Fig. 28. Scanning electron micrograph of cellulose p-toluylate, x 800.
Fig. 29. Scanning electron micrograph of cellulose phenoxyacetate, X 800.

Fig. 30. Scanning ;.lectron micrograph of cellulose chloropropional te. x800.
Fig. 31. Scanning electron micrograph of cellulose chlorobenzoate, x 800.
have disappeared, as with cellulose benzoate (Fig. 28). However, the fibrous form has been retained. This could help the spinnability of the fibre.
The SEM micrograph of cellulose phenoxyacetate (DS 0.75) shows consid- erable degradation at the microfibrillar sides (Fig. 29). Similarly, cellulose chloropropionate (DS 0.53) and chlorobenzoate (DS 2.28) show the same type of serrated morphological structures (Figs. 30 and 31) as seen earlier with cellulose benzoate and phenoxyacetate. The microfibrils have reacted to a large extent.
389
ACKNOWLEDGEMENTS
One of the authors (R.K.J.) is grateful to the authorities of Kurukshetra University, Kurukshetra, and the United States Department of Agriculture for a Fellowship award.
REFERENCES
1 C. Fairbridge, R.A. Ross and S.P. Sood, J. Appl. Polym. Sci., 22 (1978) 497, and references cited therein.
2 A. Scotney, Eur. Polym. J., 8 (1972) 163. 3 E.S. Freeman and B. Carroll, J. Phys. Chem., 62 (1958) 394. 4 A. Broido, J. Polym. Sci., Part A-2, 7 (1969) 1761. 5 N.G. Dave and S.K. Chopra, Z. Phys. Chem., 48 (1966) 257. 6 P.K. Chatterjee, J. Polym. Sci., Part A, 3 (1965) 4253. 7 T. Murakami and E. Ishii, Bunseki Kagaku, 12 (1963) 657. 8 W.J. Sauber and G.A. Patten, Sot. Plast. Eng. Tech. Pap., 5, No. 63 (1959). 9 A.J. Hammerl, SPI (Society of the Plastics Industry) Preprint Book, 17th Annual Techni-
cal and Management Conference, Reinforced Plastics Division, Section 12-H, 1962. 10 P. Robitschek, J. Cell. Plast., 1 (1965) 395.
11 S.S. Feuer and A.F. Torres, Chem. Eng. N.Y., 69 (1962) 138. 12 J.T. Horeczy, Sot. Plast. Eng. Tech. Pap. Session, 20 (1974) 379. 13 M. Lewin, H. Guttmann and D. Derfler, J. Appl. Polym. Sci., 27 (1982) 3199. 14 R.K. Jain, K. La1 and H.L. Bhatnagar, Makromol. Chem., 183 (1982) 3003. 15 R.K. Jain, K. La1 and H.L. Bhatnagar, Cellul. Chem. Technol., submitted for publication. 16 N. Grassie, J. Polym. Sci., 48 (1960) 79. 17 S. Watanabe, M. Takai and J. Hayashi, J. Polym. Sci., Part C, 23 (1968) 825.
Copyright © 2022 FDOKUMEN