The Separation and Characterisation of Sorbitan Esters Using
244
THE UNIVERSITY OF HULL The Separation and Characterisation of Sorbitan Esters Using Gas and Liquid Chromatographic Techniques Being a Thesis Submitted for the Degree of Doctor of Philosophy In the University of Hull by Julie Louise Humphrey, BSc., MSc. November 2007
-
Upload
khangminh22 -
Category
Documents
-
view
0 -
download
0
Transcript of The Separation and Characterisation of Sorbitan Esters Using

THE UNIVERSITY OF HULL
The Separation and Characterisation of Sorbitan Esters Using
Gas and Liquid Chromatographic Techniques
Being a Thesis Submitted for the Degree of
Doctor of Philosophy
In the University of Hull
by
Julie Louise Humphrey, BSc., MSc.
November 2007

ii
This thesis is dedicated in memory of my wonderful mum Joyce Cooper
12.01.38 to 28.07.08

Acknowledgements:
I wish to thank Croda Chemicals Europe for giving me the opportunity to carry out
this work and Dr R W Humble for his belief in me, his help, advice and initiating the
research which enabled me to do a PhD.
I also wish to thank my friends and colleagues at Croda for their help, support and
technical assistance, especially with the reaction procedures. In particular I wish to
thank Graham Atkinson for his continuous encouragement which helped me complete
the writing up and also proof reading the thesis and offering valuable advice, Dr C
Howarth for the samples he prepared for the early work and Jenny Morley for her help
with the literature review and obtaining the many papers required.
I also wish to thank Dr Tom McCreedy my university supervisor for providing
guidance, keeping me motivated over the many years this work has taken to complete
and for taking the time to proof read the thesis. Also Dr Ruth Wellock for her support
and advice, especially with writing up the thesis.
Finally I would like to thank my family for their constant love, support and
encouragement and looking after Dylan while I completed the writing up. Special
love and thanks to my husband Chris and boys Dylan and Ashton.
iii

i
Abstract
The aim of the work carried out, was to develop an analytical method for
characterising sorbitan ester surfactants, which could be used to monitor their
manufacture and establish structure activity relationships. HPLC was the first
analytical technique used, however despite evaluating various stationary and mobile
phases a repeatable method could not be found. High temperature GC with splitless
injection was then tried. A range of single polyol esters of varying fatty acid chain
lengths were prepared and analysed to establish the ester species that would elute
from the column. Using optimised conditions for the injector, detector and final oven
temperature of 380°C and a DB1-ht column, it was found that all possible ester
species elute for the short chain fatty acid esters studied. However as the chain length
increases the number of ester species eluting decreases, for the longer fatty acid chain
length esters based on oleic and stearic acid the sorbitan and sorbitol tri esters are the
largest esters to elute. HT-GC analysis of a range of manufactured sorbitan mono
esters based on palmitic, stearic and oleic acid was successful with all the mono ester
species separated and identified and these separated from the di and tri esters.
Validation of the method with sorbitan mono oleate showed that the method was
precise and therefore a suitable method for characterising sorbitan mono esters. HT-
GC with on-column injection was also investigated and it was found that for the
longer chain fatty acid esters more ester species eluted than when using splitless
injection. Validation would be required to establish the precision of the method,
however it may also be a suitable method for characterising sorbitan esters.

vii
Contents:
Abstract i
Dedication ii
Acknowledgements iii
Abbreviations iv
Contents vii
1 Introduction 1
1.1 What are Surfactants? 1
1.2 Polyol Esters 3
1.3 Chemistry and Manufacture of Sorbitan Esters 5
1.4 Chromatography 11
1.4.1 Gas Chromatography 13
1.4.2 High Performance Liquid Chromatography 15
1.5 Analysis of Polyol Esters 17
1.5.1 Thin Layer Chromatography (TLC) 17
1.5.2 High Performance Size Exclusion Chromatography 24
1.5.3 High performance Liquid Chromatography (HPLC) 25
1.5.4 HPLC and Evaporative Light Scattering Detectors 31
1.5.5 Capillary Supercritical Fluid Chromatography 36
1.5.6 Gas Chromatography 38
1.6 Conclusion 44
2 Initial HPLC Work for the Analysis of Sorbitan Mono-oleate 46
2.1 Samples 46
2.2 Analysis of Samples for Polyol Profile and Ester Distribution 48
2.2.1 Polyol profile 48
2.2.2 GPC Analysis 50
2.3 Solubility Study 52
2.4 Column Selection 55
2.4.1 Reverse Phase Chromatography 56
2.4.2 Normal Phase Chromatography – Isocratic 57
2.4.2.1 Silica Column 58
2.4.2.2 Cyano Column 61
viii
2.4.2.3 Diol and Amino Columns 62
2.4.3 Normal Phase Chromatography – Gradient Elution 64
2.5 Conclusion 66
3 TLC Analysis – for the Screening of Mobile Phases for HPLC 83
3.1 Experimental 84
3.2 Amino Plates 85
3.3 Cyano Plates 86
3.4 Silica and Diol Plates 86
3.5 Conclusions from TLC Screening 87
4 Further HPLC Analysis of Sorbitan Mono-oleate 97
4.1 Hexane/IPA Gradients 97
4.2 Hexane/THF Gradients 101
4.3 Hexane/THF Gradients with Various Runtimes 104
4.4 Precision 104
5
Initial Gas Chromatography Analysis – Analysis of Polyol
Esters Based on Caprylic Acid Using Split/Splitless Injection
109
5.1 Initial Analysis 110
5.1.1 Sample Derivatisation 110
5.1.2 Instrumentation 110
5.1.3 Column Selection 110
5.1.4 GC Conditions 112
5.1.5 Analysis 112
5.2 Optimisation of GC Conditions 114
5.2.1 Oven Temperature 114
5.2.2 Ramp Rate 117
5.2.3 Injection Temperature 118
5.2.4 Optimised Conditions 119
5.3 Peak Identification of Sorbitan Caprylate 119
5.3.1 Analysis of Starting Material 119
5.3.2 Peak Identification of Ester Species 120
5.3.2.1 Preparation of Polyol Esters of Caprylic Acid 120
5.3.2.2 GC Analysis of Polyol Esters of Caprylic Acid 125
ix
5.4 Identification of Peaks in Manufacture Sorbitan Caprylate 128
6 GC Analyis of Sorbitan Esters Using Split/Splitless Injection 130
6.1 Preparation of Polyol Esters 130
6.1.1 Isosorbide Esters 130
6.1.2 Sorbitan Esters 131
6.1.3 Sorbitol Esters 133
6.2 GC Analysis 134
6.2.1 Polyol Esters of Decanoic Acid 135
6.2.2 Polyol Esters of Lauric Acid 138
6.2.3 Polyol Esters of Myristic Acid 141
6.2.4 Polyol Esters of Palmitic Acid 143
6.2.5 Polyol Esters of Stearic Acid 145
6.2.6 Polyol Esters of Oleic Acid 145
6.2.7 Capacity Factor 149
6.2.8 Summary of GC Analysis of Polyol Esters Using a DB1 152
-ht Column with a Final Oven Temperature of 380°C
6.3 Optimising GC Conditions 155
6.3.1 DB1-ht Column, Injector and Final Oven Temperature 155
of 400°C
6.3.2 HT5 Column 156
6.3.2.1 GC Conditions 1 156
6.3.2.2 GC Conditions 2 157
6.3.2.3 GC Conditions 3 158
6.3.3 Conclusions from Optimisation Investigation 158
6.4 GC Analysis of CH130.8 and Real Crill Samples 159
6.4.1 GC Analysis of Sorbitan Mono Oleate Prepared from 160
High Purity Oleic Acid
6.4.2 Analysis of Real Samples 161
6.4.2.1 Standard Croda Analysis of Sorbitan Esters 163
6.4.2.2 GC Analysis of Manufactured Sorbitan Mono 164
Ester Samples
6.4.3 Summary 175
6.5 Limited Validation 176
7 GC Analysis of Sorbitan Esters Using On-Column Injection: 186

x
7.1 Analysis using On-Column Injection 186
7.1.1 Gas Chromatograph 186
7.1.2 GC Column 187
7.1.3 Operating Temperature 187
7.2 GC Analysis of Polyol Esters 188
7.2.1 Samples 188
7.2.2 Polyol Esters of Caprylic Acid 188
7.2.3 Polyol Esters of Decanoic Acid 191
7.2.4 Polyol Esters of Lauric Acid 194
7.2.5 Polyol Esters of Myristic Acid 196
7.2.6 Polyol Esters of Palmitic Acid 198
7.2.7 Polyol Esters of Stearic Acid 200
7.2.8 Polyol Esters of Oleic Acid 203
7.2.9 Capacity Factor 205
7.2.10 Summary of the Use of On-Column Injection for 208
Analysis of High Purity Polyol Esters
7.2.11 Comparison of Results Using On-Column and Splitless 209
7.3 Optimising GC Conditions 211
7.3.1 Final Oven Temperature of 430°C 211
7.3.2 Final Oven Temperature of 450°C 212
7.4 GC Analysis of Real Sorbitan Mono Ester Samples 214
7.4.1 Analysis of Manufactured Sorbitan Mono Ester Samples 214
7.4.2 Summary 222
8 Conclusion and Further Work 225
8.1 Conclusions 225
8.2 Further Work 229
9 References 230

iv
Abbreviations
Α Selectivity Factor
AV Acid Value
CSFC Capillary Supercritical Fluid Chromatography
dc Column Internal Diameter
DCM Dichloromethane
ECD Electron Capture Detector
ELSD Evaporative Light Scattering Detector
F Flow Rate
FID Flame Ionisation Detector
FPD Flame Photometric Detector
GC Gas Chromatography
GC-MS Gas Chromatography-Mass Spectrometry
GLC Gas Liquid Chromatography
GPC Gel Permeation Chromatography
HETP Height Plate Equivalent
HLB Hydrophilic Lipophilic Balance
HPLC High Performance Liquid Chromatography
HPSEC High Performance Size Exclusion Chromatography
HPTLC High Performance Thin Layer Chromatography
H2SO4 Sulphuric Acid
HT-GC High Temperature Gas Chromatography
IPA Isopropanol
IR Infra Red

v
k' Capacity Factor
KOH Potassium Hydroxide
L Length
LC Liquid Chromatography
MeOH Methanol
MM Molecular Mass
MS Mass Spectrometry
MSD Mass Spectrometer Detector
MW Molecular Weight
N Theoretical Plates
NARP Non-Aqueous Reverse Phase
N/D None Detected
NMR Nuclear Magnetic Resonance
NPD Nitrogen Phosphorus Detector
PID Photo Ionisation Detector
PSS Programmable Split/Splitless
PT Programmed Temperature
QC Quality Control
R2 R-squared Value
RID Refractive Index Detector
RSD Relative Standard Deviation
SD Standard Deviation
SEC Size Exclusion Chromatography
SFC Super Critical Fluid Chromatography
SMO Sorbitan Mono Oleate
vi
SPE Sucrose Poly Esters
TG Triglyceride
TCD Thermal Conductivity Detector
THF Tetrahydrofuran
TLC Thin Layer Chromatography
TMS Trimethylsilyl
to Time taken for mobile phase/unretained solute to pass through a
column
tr Retention time of a component
UV Ultra Violet
V Volume
W Weight
W1/2 Peak width at half height

1
1. Introduction:
The aim of the research was to develop an analytical method for characterising the
composition of sorbitan ester surfactants produced by Croda. Croda is a speciality
chemicals company, selling a range of naturally derived products. Sorbitan esters are
non-ionic surfactants produced by the esterification of sorbitol and fatty acids, very
little information is available in the literature regarding compositional analysis of
sorbitan esters. This lack of information may be due to the complex nature of the
esters, meaning no suitable analytical methods are available, or analytical techniques
have been developed for this analysis but have been developed by industry and remain
confidential. Due to the lack of information on sorbitan ester analysis, analysis of
other polyol esters has also been reviewed, to aid in the development of an analytical
method for characterising sorbitan esters.
1.1 What are Surfactants?
Surfactant is a shortened form of the term surface active agent and indicates the nature
of these compounds, they are a group of compounds that have the ability to modify
the interface between two phases. Surfactants consist of a hydrophilic and a
hydrophobic group (1), the hydrophobic group is a non-polar hydrocarbon, of not less
than 10 carbon atoms, which is bonded to a polar or ionic group, which is the
hydrophilic part of the molecule. Surfactants concentrate at the surface of an aqueous
solution and alter its surface property. A single surfactant molecule will seek the
surface, because the hydrophobic tail will be repelled by the water and the hydrophilic
part will be in the water phase. Further molecules will seek the surface or walls of
vessels until both are full, then micelles will form, which are clusters of molecules

2
arranged with the hydrophobic part towards the centre and the hydrophilic part out.
The degree of surface activity and application depends on the hydrophilic and
hydrophobic groups. Surfactants can be classified according to the nature of their
hydrophilic part and include anionic, cationic, non-ionic and amphoteric compounds.
A requirement in surfactancy application is the balance between water and oil
solubility. Griffin (2) found it possible to quantify the relationship between the
hydrophilic and hydrophobic part on an empirical basis in terms of the hydrophile-
lipophile balance (HLB), a value which increases in indirect proportion to the overall
polarity of the molecule. The HLB is used to establish the application of a surfactant
as shown in table 1.1 (3). Low HLB values indicate relatively oil soluble materials
with strong lipophilic characteristics and high values indicate hydrophilic
characteristics which are water soluble materials. Surfactants have many applications
including textile, metal and leather processing, agriculture, detergents, polymers,
cosmetics, pharmaceuticals and food due to the wide range of HLB values.
HLB RANGE APPLICATION
<3 Surface Film
3-6 Water-in-oil emulsifier
7-9 Wetting Agent
8-15 Oil-in water emulsifier
13-15 Detergent
15-18 Solubiliser
Table 1.1: HLB Range and Application of Surfactants

3
1.2 Polyol Esters:
The sorbitan ester surfactants being studied can be classified as polyol esters. Polyol
fatty acid esters are non-ionic and they contain a residue of a polyhydroxy compound
as the hydrophilic portion in the ester, in combination with hydrophobic groups
derived from fatty acids. Polyol esters are one of the most common surfactant types,
partly because esterification is an easy chemical reaction to carry out and polyols such
as glycerol, sorbitol and other sugars are readily available. Also a wide variety of
fatty acids ensure a range of products can be made for many applications, with both
saturated and unsaturated fatty acids of varying chain lengths being used.
The simplest polyol ester is derived from ethylene glycol which has two hydroxyl
groups, when reacted with fatty acid it yields a mixture of mono and diesters, plus
unreacted acid and diol, the reaction is shown in figure 1.1.
Figure 1.1: Reaction of Ethylene Glycol and Fatty Acid to Produce Mono and Di
Esters
R = alkyl group of the fatty acid
Polyol esters are usually grouped according to their hydrophilic group (4). The major
polyol esters manufactured are derived from glycerol, glycol or polyethylene and
sorbitan. The reaction of the residual hydroxyl groups in polyol esters with ethylene
H H H H H H | | | | | | 2 H – C – C – H + 3 RCOOH H – C – C - H + H – C – C - H | | | | | | OH OH OH OOCR RCOO OOCR Ethylene Glycol Mono Ester Di Ester

4
oxide to give products with higher hydrophilic properties, is common in the chemical
industry, fats and oils and sorbitan esters are routinely ethoxylated.
Glycerol esters are polyol esters that can consist of mono, di and triglycerides (as
shown in figure 1.2) and the volume produced is the most of all the polyol esters, they
are of commercial significance because monoglycerides and diglycerides are major
emulsifiers used in the food and cosmetic industry. The volume of sorbitan esters
manufactured is less than glycerol esters, however they are one of the most common
esters produced from the higher members of the polyol series.
CH2OOCR CH2OOCR CH2OOCR | | | CHOH CHOH CHOOCR | | | CH2OH CH2OOCR CH2OOCR
Monoglyceride Diglyceride Triglyceride
Figure 1.2 Structures of Mono, Di and Triglycerides
R = alkyl group
Sucrose esters are polyol esters, produced from the reaction of sucrose and fatty acid,
however the volume of sucrose esters sold by industry is relatively small. Sucrose is a
disaccharide with eight hydroxyl groups, however it has a high melting point and has
a tendency to caramelise rather than melt, making processing difficult. Also due to
the eight hydroxyl groups present on sucrose, typical esterification results in mono to
penta esters which are very hydrophobic and have limited application potential.
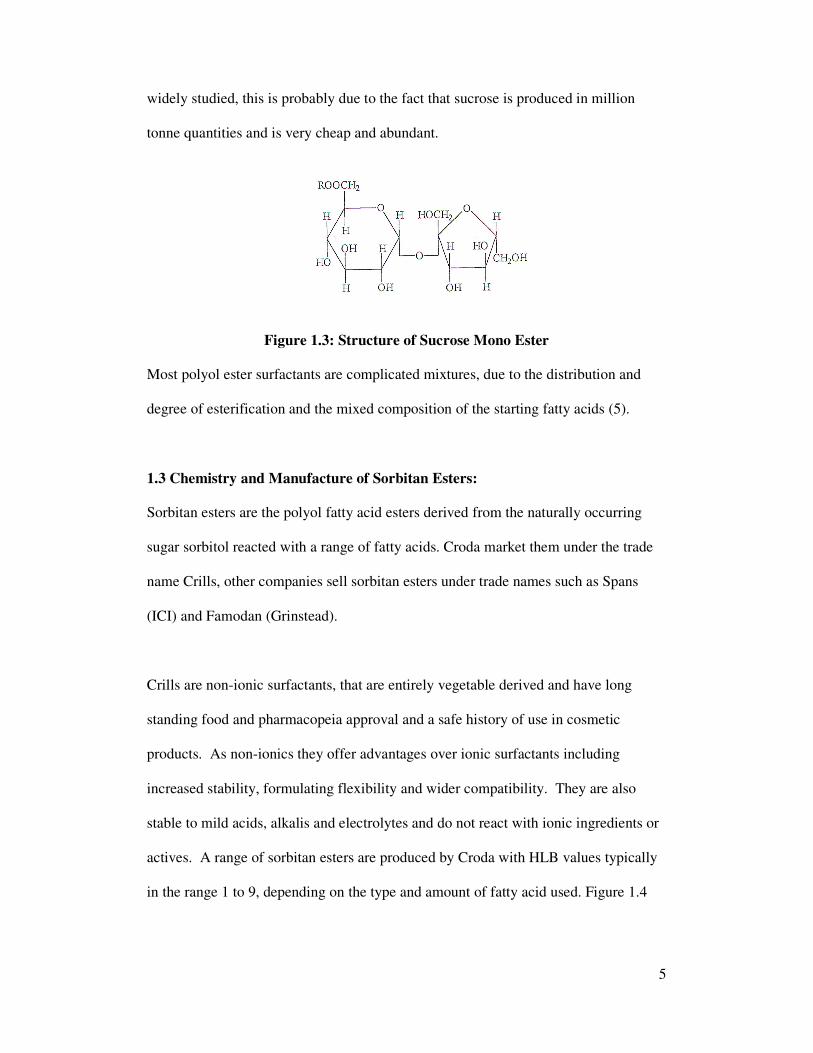
Figure 1.3 shows the structure of a sucrose mono ester. However despite production
problems and the limited use, the production and analysis of sucrose esters has been
5
widely studied, this is probably due to the fact that sucrose is produced in million
tonne quantities and is very cheap and abundant.
Figure 1.3: Structure of Sucrose Mono Ester
Most polyol ester surfactants are complicated mixtures, due to the distribution and
degree of esterification and the mixed composition of the starting fatty acids (5).
1.3 Chemistry and Manufacture of Sorbitan Esters:
Sorbitan esters are the polyol fatty acid esters derived from the naturally occurring
sugar sorbitol reacted with a range of fatty acids. Croda market them under the trade
name Crills, other companies sell sorbitan esters under trade names such as Spans
(ICI) and Famodan (Grinstead).
Crills are non-ionic surfactants, that are entirely vegetable derived and have long
standing food and pharmacopeia approval and a safe history of use in cosmetic
products. As non-ionics they offer advantages over ionic surfactants including
increased stability, formulating flexibility and wider compatibility. They are also
stable to mild acids, alkalis and electrolytes and do not react with ionic ingredients or
actives. A range of sorbitan esters are produced by Croda with HLB values typically
in the range 1 to 9, depending on the type and amount of fatty acid used. Figure 1.4

6
shows the chemical structure of a sorbitan mono ester, where R is the alkyl group of
the fatty acid.
Figure 1.4: Chemical Structure of Sorbitan Mono Ester (6)
Table 1.2 shows the standard range of sorbitan esters manufactured by Croda (6).
Crill 1 is the most hydrophilic of the Crill range and is soluble in many fatty
compositions and solvents and can act as a co emulsifier in oil in water emulsions. In
contrast Crill 4, 43, 45 and 6 used alone act as effective water in oil emulsifiers.
TRADE NAME
DESCRIPTION FATTY
ACID
HLB
Crill 1 Sorbitan monolaurate Lauric 8.6
Crill 2 Sorbitan monopalmitate Palmitic 6.7
Crill 3 Sorbitan monostearate Stearic 4.7
Crill 4 Sorbitan monooleate Oleic 4.3
Crill 41 Sorbitan tristearate Stearic 2.1
Crill 43 Sorbitan sesquioleate Oleic 3.7
Crill 45 Sorbitan trioleate Oleic 1.8
Crill 6 Sorbitan monoisostearate Stearic 4.7
Crill 65 Sorbitan triisostearate Stearic 1.8
Table 1.2: Standard Range of Sorbitan Esters Manufactured by Croda

7
Crillets are polyethoxylated partial esters of sorbitol, sorbitan and isosorbide and
various HLB values can be obtained by using Crills and Crillets together in various
ratios, this then allows the emulsification of many oils and waxes. Figure 1.5 shows a
polyethoxylated sorbitan mono ester, where R is the alkyl group of fatty acid and (x +
y + z) is the total number of moles of ethylene oxide
Figure 1.5: Chemical Structure of Polyethoxylated Sorbitan Mono Ester (6)
Crills are derived from the sugar sorbitol which dehydrates to other polyols. Sorbitol
esters are not commercially available, however sorbitol monoester if it could be
manufactured would have a greater water affinity due to the number of free hydroxyl
groups and therefore would be a more versatile surfactant compound. The production
of sorbitol mono esters would be difficult to obtain by standard chemical esterification
due to cyclisation and dehydration of the sorbitol to other polyols and the production
of a range of esters. The specificity of the enzyme lipases permits selective
esterification of primary alcohols and therefore the use of enzymes in the synthesis of
sorbitol mono oleate has been carried out (7). The study showed that a high sorbitol
conversion resulted in a low percentage of monoesters in the total esters and to obtain
80% monoester in the final product conversion of the oleic acid and sorbitol was 40
and 60% respectively. However the study showed that a high percentage sorbitol
8
mono oleate product can be prepared, although it is not used for manufacture of
sorbitol esters and commercial implications would have to be considered.
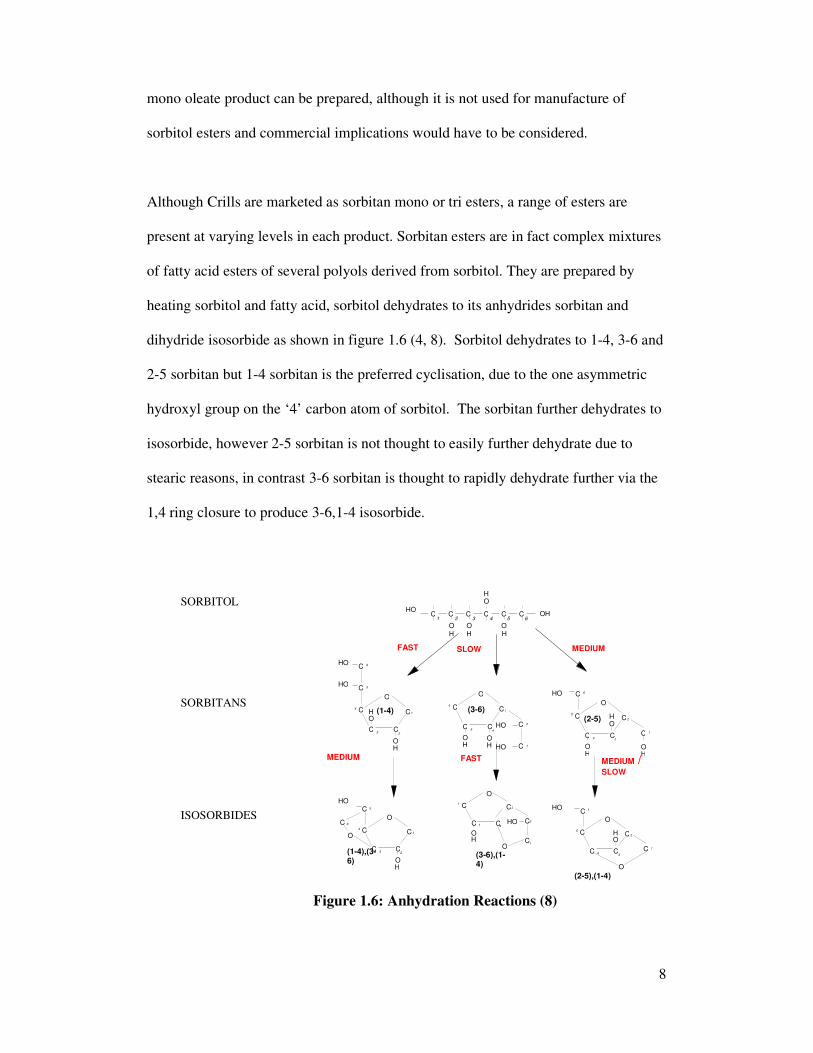
Although Crills are marketed as sorbitan mono or tri esters, a range of esters are
present at varying levels in each product. Sorbitan esters are in fact complex mixtures
of fatty acid esters of several polyols derived from sorbitol. They are prepared by
heating sorbitol and fatty acid, sorbitol dehydrates to its anhydrides sorbitan and
dihydride isosorbide as shown in figure 1.6 (4, 8). Sorbitol dehydrates to 1-4, 3-6 and
2-5 sorbitan but 1-4 sorbitan is the preferred cyclisation, due to the one asymmetric
hydroxyl group on the ‘4’ carbon atom of sorbitol. The sorbitan further dehydrates to
isosorbide, however 2-5 sorbitan is not thought to easily further dehydrate due to
stearic reasons, in contrast 3-6 sorbitan is thought to rapidly dehydrate further via the
1,4 ring closure to produce 3-6,1-4 isosorbide.
H
CCCCCCHO
OH O O O
O H
H HH
1 2 3 4 5 6
C
C
C
C
C
C
O
O
H
2
1 O
H
3
4
HO
HO 5
6
(1-4)
C C
C
C
C
CO
O
2
1 O
3
4
HO 5
6
C
C
C
C
C
C O
O H
3
2
4
5
HO
1
6
O H
O H
(2-5)
C
C
C
C
C
C
O
O
H
3
2
4
5
HO
1
6
O
2
1
C
C
C
C
C
C
O
O H
4
3
5
6
HO
HO 2
1 O H
(3-6)
C
C C
C C
C
O
O
4
3
5
6
HO O H
FAST MEDIUM
MEDIUM FAST MEDIUM / SLOW
SLOW
(1-4),(3-6)
(3-6),(1-4)
(2-5),(1-4)
SORBITOL
SORBITANS
ISOSORBIDES
Figure 1.6: Anhydration Reactions (8)

9
The three possible polyols can then be esterified with a range of fatty acids of varying
chain lengths, to give a range of esters. The fatty acids used are usually a mixed
feedstock and may contain both saturated and unsaturated fatty acids, with chain
lengths ranging from C8 to C24. The polyol is esterified at the most accessible
hydroxyl group, for sorbitol this is the two end primary hydroxyl groups therefore the
mono and di esters will predominate. However sorbitol has six hydroxyl groups,
therefore it could be possible to produce a hexa ester. Sorbitan has four hydroxyl
groups available for esterification, however due to stearic hindrance and fatty acid
ratios hexa esters are unlikely, the presence of 3-6 sorbitan esters are also unlikely due
to its rapid dehydration to isosorbide. Isosorbide can produce both mono and di
esters, di esters are formed in preference to mono esters when a ratio of 1:1 isosorbide
to fatty acid is used.
Esterification Fatty acid + Sorbitol Sorbitol Esters + Water Dehydration Esterification Fatty acid + Sorbitan Sorbitan Esters + Water Dehydration Esterification Fatty acid + Isosorbide Isosorbide Esters + Water
Figure 1.7: Reaction Scheme

10
The complexity of Crills is therefore due to:
- the range of polyols
- degree of esterification of these polyols
- mixed composition of the starting fatty acid
- positional isomers of the starting fatty acids esterified with the hydroxyl groups.
Crills are prepared in either a one or two stage process (9). The one stage process
involves reaction of sorbitol and fatty acid to sorbitan ester, with dehydration and
esterification occurring simultaneously, using a base catalyst at 230°C. In the two
stage process sorbitan esters are prepared by the acid catalysed controlled dehydration
of sorbitol at 130°C and then esterification of the resulting polyols with the specified
fatty acid under base catalysis at 230°C. Text books (10) indicate that esterification
proceeds by acidic catalysis and that alkali esterification is impossible, however
esterification occurs because autoesterification occurs at 150 to 250°C, hydrogen ions
arise due to dissociation of the carboxylic acid. Therefore the catalyst is not
catalysing the esterification but transesterification.
Both sorbitol and fatty acids are natural products therefore can vary depending on the
source. The raw material specification and initial selection of molar ratios are
important in simplifying the process. The complexity of the mixtures makes
determination of the precise composition impossible. Simple analytical techniques
are currently used including acid value, hydroxyl value and saponification value and
these define the reaction end point but not the product and are used for production
control. However an analytical method which will establish the composition of Crills
is important for the comparison of emulsifier’s performances. When a suitable

11
analytical method has been developed, a relationship between the composition of
sorbitan esters and their application can be established. This relationship can then be
used by Croda to design the next generation of emulsifiers.
1.4 Chromatography
Chromatography is an analytical technique used to separate, isolate and quantify
components in a mixture. It is a very powerful technique available to analysts
because it can separate a mixture and quantify components in one step. Samples can
be gaseous, liquid or solid and can range from simple mixtures of two or three
components to complex mixtures containing very different chemical compounds.
Chromatography includes a diverse but related group of methods including thin layer
chromatography (TLC), gas chromatography (GC), high performance liquid
chromatography (HPLC), supercritical fluid chromatography (SFC) and size
exclusion chromatography (SEC).
All chromatographic systems consist of a stationary and mobile phase and the
components to be separated are distributed between the two phases. The stationary
phase is a solid or liquid supported on a solid and the mobile phase a gas, liquid or
supercritical fluid. The mobile phase moves across the stationary phase and carries
the components with it, different components travel at different rates and this leads to
separation, components that partition strongly into the stationary phase spend a
greater amount of time in it and are separated from components that stay
predominantly in the mobile phase and pass through the system faster. Separation can
depend on properties such as boiling point, polarity, electric charge and size of
molecules.

12
The retention factor, also known as the capacity factor is a term used in
chromatography to describe the migration rate of an analyte through a column and is
defined as
k' = tr – to/to
where tr is the retention time of a component and to is the time taken for the mobile
phase to pass through the column. By controlling the capacity factor, separation can
be improved. In GC changing the temperature or stationary phase can alter the
capacity factor and in LC the composition of the mobile phase or changing the
stationary phase can effect the capacity factor.
Another parameter important in chromatography is the selectivity factor and describes
the separation of two compounds and is expressed as
α = (tr)b – to/(tr)a – to
where (tr)a is the retention time of component A and (tr)b is the retention time of
component B, with A eluting before B. The selectivity factor can be changed by
altering the mobile phase composition, column temperature or changing the stationary
phase.
It is also useful in chromatography to measure the column efficiency. The plate
model is used which considers the column to contain a number of theoretical plates
where the sample equilibrates between the mobile phase and stationary phase in these
plates (11). The column efficiency is commonly described by height plate equivalent
(HETP), the smaller the better and number of theoretical plates (N), with the more
plates the better.
HETP = L/N
13
where L is the length of the column
N =5.55(tr)2/w1/2
2
where w1/2 is the peak width at half height.
Both GC and LC are commonly used techniques in the laboratory. GC is a sensitive
technique but is limited to the determination of analytes that are readily volatilised
without decomposition. LC is suitable for non-volatile compounds or thermally
fragile ones, however irreversibly adsorbed compounds are not detected and it can
require the use of expensive solvents and solvent waste is generated.
1.4.1 Gas Chromatography
Gas Chromatography is a chromatography technique used to analyse complex
mixtures of volatile organic and inorganic components. The mobile phase is a gas and
the stationary phase is usually a liquid on a solid support or sometimes a solid
adsorbent. Separation occurs due to partitioning of the solute between the moving gas
and stationary phase. A GC system consists of a carrier gas supply which is typically
helium, nitrogen or hydrogen of high purity, injector, column, column oven and a
detector.
The injector is a used to introduce a small quantity of sample onto the column. A
split/splitless injector uses a syringe to inject the sample into a liner in the injection
port which is at a higher temperature than the least volatile component in the mixture,
the carrier gas moves all of the sample into the column in the splitless mode or a small
proportion in the split mode, with the rest going to the split vent. In contrast on-
column injection involves the direct injection of the sample onto the column. Other

14
methods of introducing the sample onto the column include headspace, purge and trap
and pyrolysis.
Columns can be short large diameter packed columns or long narrow capillary
columns. The selection of the correct column is important for good separation, a large
number of columns are available with a range of stationary phases, internal diameters,
film thicknesses and column lengths. Many different interactions occur between the
analyte and functional group of the stationary phase, non-polar stationary phases will
preferentially retain non-polar compounds. When the non-polar groups of a column
are replaced with polar functional groups, the selectivity of the column changes to
polar compounds. Polyethylene glycol columns are very polar and therefore are
highly selective to polar compounds. The column is contained in a column oven
which maintains the temperature of the column because temperature effects retention,
the oven also allows the use of temperature programmes.
A range of detectors are available for GC including the flame ionisation detector
(FID), thermal conductivity detector (TCD), flame photometric detector (FPD), photo
ionisation detector (PID), electron capture detector (ECD), nitrogen phosphorus
detector (NPD) and mass spectrometer detector (MSD). The FID is a common
universal detector and detects most organic compounds and therefore has many uses,
it has been used to analyse a number of esters including sucrose esters (12), galactose
and xylose esters (13) and is widely used for triglyceride analysis (14, 15). The ECD
is a specific, highly sensitive detector, sensitive to halogens, organometallic
compounds, nitriles, or nitro compounds, it is used widely in the analysis of pesticides
(16, 17) and polychlorinated biphenyls (18, 19). The NPD is another specific detector

15
and detects compounds containing nitrogen or phosphorus and therefore is useful for
the detection of organophosphate pesticides (20, 21). The MSD is another universal
detector and can be used in the full scan mode were the whole molecular weight range
is scanned or in the selective ion monitoring mode in which ions that are abundant and
specific to the analyte are used which increases the sensitivity of the detector. Due to
the amount of carrier gas and fact that the GC operates at high pressure and the mass
spectrometer under vacuum, an interface is required to link the GC and MS, a range of
interfaces are available including separator interfaces such as the effusion separator,
jet separator and membrane separator, as well as splitter interfaces and direct
interfaces. The MSD has been used to analyse a range of surfactant compounds
including primary and secondary alcohols (22), polyethoxylated surfactants (23),
steryl esters (24) and nonylphenol ethoxylates (25).
1.4.2 High Performance Liquid Chromatography (HPLC)
HPLC is a chromatography technique which uses liquid as the mobile phase and a
solid or liquid on a solid support as the stationary phase. HPLC depends on selective
interactions occurring between the mobile and stationary phase, this can lead to the
technique having great resolving power. A HPLC system consists of a number of
components including the mobile phase, injector, pump, column and detector. The
mobile phase is important because it effects separation and the pump is used to pass a
constant flow of the mobile phase through the system in either an isocratic or gradient
mode. The injector in HPLC is simple in contrast to GC and typically consists of an
injection valve and the sample loop. The sample is dissolved in the mobile phase
before injection into the sample loop. The sample is drawn into a syringe and injected

16
into the loop via the injection valve. A rotation of the valve rotor closes the valve and
opens the loop in order to inject the sample into the stream of the mobile phase.
There are two types of liquid chromatography depending on the polarity of the
stationary and mobile phase. Normal Phase LC has a polar column of silica or a
bonded phase, with a non polar solvent. Polar compounds stick longer to the column
than non polar compounds which will pass through quickly. Reverse phase
chromatography has a non polar column, the silica is typically modified with alkyl
chains typically 8 to 18 carbons in length and a polar solvent is used. Elution order is
the opposite to normal phase with polar molecules passing through quickly because
they are more soluble in the mobile phase and non-polar compounds more attracted to
the stationary phase and therefore having longer retention times. The retention can be
altered for both by altering the mobile phase polarity or stationary phase packing.
A number of detectors are available for use with HPLC. The UV detector is a
commonly used detector for a range of organic compounds including esters such as
polyglycerol esters (26), triglycerides (27) and sorbitan esters (28, 29). The sample
flows from the column and into the light path of the flow cell and UV radiation is
absorbed and a reduced signal is observed by the detector. Different UV detectors are
available including single wavelength, variable wavelength and diode array detectors.
The major problem with UV detectors is that the sample must contain a UV absorbing
component. The refractive index detector is another detector used but can only be
used with an isocratic mobile phase. Fluorescence and chemiluminescent detectors are
highly sensitive and very specific detectors used with HPLC. The evaporative light
scattering detector detects any compound in a sample less volatile than the mobile

17
phase, regardless of functional group, gradient mobile phases can be used and solvent
peaks are eliminated and therefore is considered as a universal detector. HPLC
coupled to a mass spectrometer has become a popular method because it is highly
sensitive, selective and universal and therefore has been used to analyse a large range
of compounds. It has been used to analyse a range of non-ionic surfactants including
fatty alcohol ethoxylates (30, 31), alkylphenol ethoxylates (32, 33), ethoxylated
sorbitan esters (34, 35), saccharide surfactants (36), polyglycerol fatty acid esters (37)
as well as triglycerides in a range of matrices (38, 39 and 40) and simultaneous
analysis of different surfactants (41, 42). However an interface is required because the
LC solutes are eluted in large amounts of solvent at atmospheric pressure and this
must be removed before the eluent enters into the MS which is under vacuum.
Interfaces (43) include particle beam, moving belt, thermospray, electrospray and
atmospheric pressure chemical ionization.
1.5 Analysis of Polyol Esters:
Various chromatographic techniques have been used to analyse a range of polyol
esters in an attempt to establish compositional information and have been reviewed to
assist in the development of an analytical method for characterising sorbitan esters.
1.5.1 Thin Layer Chromatography (TLC):
TLC is a chromatography technique consisting of a stationary phase which is typically
a thin layer of adsorbent material immobilised on a flat sheet and an organic solvent
as the mobile phase. The sample is dissolved in solvent and placed at the base of the
sheet and the mobile phase is drawn up the sheet by capillary action. The different
18
components in the mixture move up the plate at different rates due to differences in
their partitioning behaviour between the mobile liquid phase and the stationary phase.
The advantages of TLC include its simplicity and speed, it is also an inexpensive
technique compared to High Performance Liquid Chromatography (HPLC) and Gas
Chromatography (GC). TLC has been used to analyse polyol esters and in particular
sucrose esters.
TLC was used by Gee in 1962 (44) to separate mixtures of sucrose esters, as well as
sucrose and raffinose. The technique of qualitative and quantitative silica gel
chromatography on glass strips was rapid, with definitive separation of the
compounds obtained. A number of different solvents were tried but the best
separation for sucrose esters was obtained with toluene/ethyl acetate/95 % ethanol
(10:5:5 v/v/v). The plates were developed with dichlorofluorescein indicator solution,
esters appeared as yellow spots on an orange background when illuminated with a
longwave Ultra Violet (UV) lamp. A spot corresponding to sucrose was obtained, as
well as a long spot representing sucrose mono esters and 4-5 spots representing
sucrose diesters, faster moving spots were thought to be sucrose esters with a higher
degree of esterification than the di ester. The separated components were then eluted
from the silica gel and the sucrose content measured using a colorimetric procedure to
obtain a quantitative measurement.
Another quantitative TLC method (45) separated the sucrose ester components into
mono, di, tri and higher esters. Again individual components were extracted from the
plate and quantified colorimetrically using anthrone reagent. The method was also

19
found to be applicable to the analysis of raffinose esters of fatty acids with some
modifications.
However both of those quantitative TLC methods for the analysis of sucrose esters
relied on elution of esters from TLC plates, followed by reaction of the esters with a
colour-producing reagent. The scraping of each zone of component was the accuracy
determining process. Weiss et al. (46) attempted to improve the quantitative
procedure to better evaluate ester distribution and isomer formation. The sucrose
esters were separated on a silica gel plate containing calcium sulphate using
toluene/ethyl acetate/95 % ethanol (2:1:1 v/v/v) as the solvent system for mono to
tetra esters, further separation of lower esters was achieved using two-dimensional
TLC in which the solvent was chloroform/methanol. Petroleum ether/ethyl
acetate/glacial acetic acid was found to separate higher esters. Detection of the
sucrose esters was obtained using urea-phosphoric acid. The photometrically
determined density of each spot on the plate was found to be proportional to the
sucrose content, the ester content was then determined using a calculation. Positional
isomers were observed at each level of substitution but could not be separated from
each other for quantitative evaluation.
The emulsifying properties of different sucrose monoesters have been found to
depend on the number and kind of different isomers. Therefore an effective analytical
method is essential during synthesis, purification and structural studies. Separation of
structural isomers of sucrose monostearate by TLC was carried out by Torres et al.
(47) with six of the eight possible isomers differentiated by specific colour
development with a visualising agent. The TLC plate of sucrose monostearate showed

20
five well-resolved components, which exhibited different colours. Component 1
appeared as a greyish/blue spot, components 2 and 3 were unresolved and appeared
pinkish/brown, although when lower quantities of sample were used, these could be
resolved. Component 4 was a blue spot and 5, 6 and 7 different shades of purple.
HPLC and GC were also used to analyse the sucrose monostearate sample. HPLC
gave baseline separation of three main peaks and the monoesters with different acyl
chain lengths were separated. GC also resolved monoesters with different acyl chain
lengths and partially separated the isomers. This study showed what separation of
isomers is possible, however only concentrated on the mono esters. For sorbitan
esters all of the esters would be of importance.
Sucrose polyesters (SPE) are mixtures of esters made up of sucrose esterified with 6,
7 or 8 moles of fatty acid. When sucrose polyesters were growing in importance in
food technology, a study was carried out using chromatographic techniques to isolate,
characterise and quantify sucrose polyester mixtures, to gain information on the
mixtures (48). TLC and TLC flame-ionization detection (FID) as well as reversed
phase HPLC were used. Pure fractions of sucrose polyesters of olive oil were
obtained by column chromatography, using Infrared and nuclear magnetic resonance
spectroscopy to identify them. The lowest polarity fraction contained octa esters,
which appeared on the TLC-FID chromatogram as a single peak, two other fractions
due to the hepta and hexa esters each gave more than one peak by TLC-FID. Both
TLC-FID and HPLC were found to be appropriate techniques for quantification of
SPE mixtures of hexa, hepta and octa esters of sucrose and no significant difference in
the values by the techniques was noted. Reproducibility was excellent for sucrose
octa esters and the maximum coefficient of variation was 7 % for sucrose hexa esters

21
analysed by TLC-FID. The work showed that analytical techniques are available for
quantitative analysis of polyesters. The chromatographic techniques were also thought
to be suitable for characterising SPE/Triglyceride mixtures.
The leaf surface chemistry of tobacco is important for plant biology as well as flavour
and aromatic characteristics, research has also indicated that sucrose esters also act as
antimicrobial agents and could be a potential cancer preventative agent of a new type.
Therefore the analysis of sucrose esters found on tobacco leaves has also been
important and researched thoroughly. TLC with scanning densitometry was used for
the quantification of primary and secondary metabolites of Nicotina tabacum leaf
surface components (49), with one of the components of interest being sucrose esters.
A single development with isopropanol (IPA)/chloroform/methylene chloride/hexane
(7/8/6/79 v/v/v/v) and silica gel was used and quantification with 30 % sulphuric acid
followed by densitometry. The results were semi-quantitative but quantitative for all
secondary metabolites with the exception of the sucrose esters. Observation of the
scanning densitometry trace also showed the sucrose esters as one peak, the possible
ester species have not been separated and therefore the method is unsuitable for
characterisation of the sorbitan esters. However the work concluded that quantitative
TLC is a useful tool in plant breeding and other research programmes interested in
rapid screening of chemical traits in a large number of samples.
However more recently sucrose esters from the surface of tobacco plant leaves were
analysed using High Performance TLC (HPTLC) silica gel plates (50), with
n-hexane/ethyl acetate (1:3 v/v) used as the developing solvent and aniline
diphenylamine as a detection reagent. Offline TLC-Mass Spectrometry was used for
22
detection and identification of the compounds. The chromatograms obtained showed a
number of brownish bands and differences are noted in chromatograms of sugar esters
from different tobaccos. It was stated that more work is required to identify
components and that to date no TLC procedure by which sucrose esters of tobacco
leaf surface can be resolved and quantified exists, therefore emphasising the difficulty
of the analysis of polyol esters.
The review highlighted that TLC has been widely investigated for sucrose esters, but
has been used less for other polyol esters, although in 1969 Sahasrabudhe and Chadha
(51) described a procedure for separation, identification and quantitative estimation of
mono, di, tri esters of sorbitol and its anhydrides. The lipid classes were separated by
liquid partition column chromatography and the fractions analysed by Gas Liquid
Chromatography (GLC) as trimethylsilyl ethers, the individual mono and di fatty acid
esters and polyols eluted, however higher esters did not and the mono and di esters
appeared as broad unresolved peaks. TLC was therefore used to analyse the samples
and fractions from the column chromatography used for identification. Absorbosil
plates were used and two mobile phases were required. Benzene/methanol (6:4 v/v)
was used to separate the polyols and four distinct spots were observed when viewed
under a UV light following spraying with 2,6 dichlorofluroscein (1 % in ethanol).
Esters however were separated using benzene/ethyl ether/methanol (75:20:5 v/v/v),
the largest esters identified were tri esters and they eluted as one spot at the top of the
plate. In contrast the di ester of sorbitan was found to give three distinct spots,
although no identification of the isomers was possible. In contrast the isosorbide and
sorbitan mono esters each appeared as one spot. Further work was required for
23
identification of the components and no quantitation was possible using this
technique.
More recently a quantitative TLC method has been used for sorbitan esters by
Smidrkal et al. (9). TLC-FID was used to monitor the two stage synthesis of sorbitan
esters. A series of sorbitan fatty acid esters with various fatty acid to sorbitol ratios
were prepared and the course of the reaction and composition of the final products
was determined by TLC-FID. Chromrod SII rods and chloroform-benzene-ethanol
developing system were used, the rods were detected by FID. The TLC-FID
chromatogram showed four groups of peaks, the highest retardation factor was
exhibited by the tri esters, followed by a compact group of four peaks due to the di
esters and unreacted fatty acid, two additional not completely separated peaks were
present due to the mono esters and two other small peaks closest to the start belonged
to isosorbide and sorbitan. The molar ratio of oleic acid and sorbitol was varied at
0.6, 1.2 and 2.4 and the ratio of different esters calculated with time using this method
and significant differences were noted. It was therefore concluded that the method is
suitable for the preparation of sorbitan esters on an industrial scale.
The review showed that TLC has been used for the analysis of polyol esters with
varying success. Quantification has proved difficult, but new advances such as TLC-
FID have made it easier. Also due to the complex nature of polyol esters,
identification has also been difficult.

24
1.5.2 High Performance Size Exclusion Chromatography (HPSEC):
HPSEC is a technique that separates molecules based on their effective molecular size
and shape. The stationary phases are porous particles with closely controlled pore
size, molecules of comparable size to the mobile phase diffuse through the entire
network. Larger molecules are excluded from narrower parts and very large
molecules are excluded completely. HPSEC is a method used by Croda for
analysing a range of esters including sorbitan esters (52) and is particularly useful for
sorbitan mono oleate, however when used to analyse sorbitan mono laurate many of
the components are found to coelute, therefore less information is obtained, although
it is still used for comparative purposes (53). The advantages of HPSEC are that very
little sample preparation is required and it is very rapid, however only partial
separation of various ester species has been possible.
Other polyol esters have been analysed using HPSEC, in 1976, Birch and Crowe (54)
used HPSEC, to determine sucrose polyesters in faeces and diet. The samples were
freeze-dried, extracted with ethyl ether and analysed by HPSEC. The sucrose
polyesters, were found to elute as a single peak before anything else in the sample and
were then quantified by refractive index detector. The method was found to be quick
and accurate and a linear response was found over a wide concentration range,
however separation of the various ester species was not achieved.
HPSEC was used for monitoring the enzymic synthesis of sucrose, glucose, fructose
and sorbitol esters (55), using a tetrahydrofuran (THF) mobile phase and refractive
index detector (RID). A number of chromatograms were obtained for the various
esters produced by enzymic synthesis and these were compared to chromatograms
25
obtained for esters produced by chemical reaction. The chromatogram obtained for
the sucrose-oleic acid ester produced by a chemical reaction showed peaks due to the
mono, di, tri and tetra esters although the tri and tetra esters showed coelution. In
contrast the sucrose ester produced using the enzyme only showed a mono ester peak.
Therefore indicating that HPSEC is useful for comparative purposes but separation of
the various ester species is limited.
HPSEC has also been used to characterise sucrose polyester – triglyceride (TG)
mixtures (56). A RID was used, with 100 Å and 500 Å PLgel column connected in
series and THF as the mobile phase. The SPE and TG were separated, each appearing
as a well resolved peak, with minor compounds present not being detected, allowing
quantification of the mixture.
HPSEC has some uses for the analysis of polyol esters, including comparative
analysis, however due to the lack of separation of all the individual ester species the
use is limited.
1.5.3 High Performance Liquid Chromatography (HPLC):
HPLC is a chromatography technique which uses liquid as the mobile phase and a
solid or liquid on a solid support as the stationary phase. HPLC depends on selective
chemical interactions occurring between the mobile and stationary phase, this can lead
to the technique having great resolving power and consequently has been used for the
analysis of a number of polyol esters.

26
Aitzetmuller (57) studied the applications of the moving wire detector for Liquid
Chromatography (LC) of fats and fatty acid derived oleochemicals in 1975. A range
of samples were analysed with this detector, including food emulsifiers, which are a
mixture of UV-transparent compounds, varying widely in polarity towards silica gel,
making a gradient elution necessary, which meant at the time UV and RID couldn’t be
used. In carrying out this study he was the first to elute sorbitan esters by LC, with a
number of partially resolved peaks observed. The work showed the broad range of
applications of the detector.
Garti and Aserin have studied the use of HPLC to analyse a number of polyol esters
used as food emulsifiers, including polyglycerol, sucrose and sorbitan esters.
Polyglycerol esters are important food emulsifiers and are available commercially as a
mixture of various isomers. As with other polyol esters analysis is important during
production, to ensure there is no batch to batch variation, to compare emulsifiers from
different suppliers and to determine if emulsifiers used in food products are
compatible with regulations. Polyglycerol esters are mixtures of hundreds of
individual chemical compounds, with differing degrees of esterification of the polyol,
chain length of the fatty acid, degree of unsaturation, as well as positional isomers. In
1981 they attempted (26) to analyse a wide range of polyglycerol –poly–fatty acid
esters without the need for derivatisation. A 25 cm column packed with 10 µm
Lichrosorb Diol was used and the isomers were eluted using a gradient based on a
hexane/IPA mixture over 60 minute. The method separated the monoglycerol and
polyglycerol monoesters as well as polyglycerol polyesters. However observation of
the chromatograms obtained shows that although the first few peaks, identified as the

27
short chain polyols gave well resolved sharp peaks, later peaks were broad and the
analysis ambiguous.
Kaufman and Garti (58) used a reversed phase C18 column and isocratic mobile phase
to analyse the composition of sucrose fatty acid esters. The method developed for the
quantitative analysis of mono-, di-, tri- and higher isomers, used methanol and
isopropanol as the eluent and both UV and RI detection. Both detectors were found to
give similar results but the RI detector was less sensitive. The method was simple and
rapid but as observed with the polyglycerol esters the mono and di esters resulted in
sharper peaks, than the higher esters, which appeared as small broad peaks. An
alternative method using methanol and water improved the separation of the mono
and di isomers, with elution taking ~40 minutes compared to ~10 minutes using the
methanol/IPA mobile phase, however esters greater than diesters were not eluted with
the alternative mobile phase.
HPLC analysis of sucrose esters was also attempted by Jaspers et al. (59), the work of
Kaufman and Garti was tried but similar results could not be obtained, highlighting
the complexity of ester analysis. It was found that the method used by Garti resulted
in the monoesters eluting with the solvent. Therefore the composition of the eluent
was changed to methanol/water (85/15 v/v) and the monoesters determined. Using
methanol/ethyl acetate/water (65/25/10 v/v/v) diesters were separated. These methods
enabled information about the amount of mono and di esters in the product to be
ascertained, as well as the ratio between sucrose monopalmitate and sucrose
monostearate and the number of the most important structural isomers. However a

28
complete separation of all possible di esters was not possible and higher esters were
not eluted.
In 1983 Garti et al. (28) investigated the use of HPLC with a RP-18 column and no
pre-treatment to analyse sorbitan esters. Very little quantitative work had been carried
out on sorbitan esters prior to this. Eluents based on IPA/water were used and the best
separation was obtained using IPA/water (85/15 v/v) as the mobile phase and UV
detection. The chromatogram obtained for Span 80 (sorbitan mono oleate) is shown
in figure 1.8. The identification shown in the chromatogram was attempted using
fractions thought to be pure esters, collected by column fractionation. The
chromatogram shows three peaks with the mono and di esters giving partially
resolved peaks followed by a small broad peak thought to be the tri esters.
Mono
esters
Di esters
Tri esters
Figure 1.8: HPLC Chromatogram of Span 80 Obtained by Garti et al. (28)
29
When the water content of the mobile phase was greater than 15 %, the mono and di
esters were found to appear as several peaks due to the different isomers, but the tri
esters did not elute. Quantitation was attempted for a range of sorbitan esters but due
to the absence of pure standards was carried out by assuming their response factor
were close to those obtained for glycerol esters.
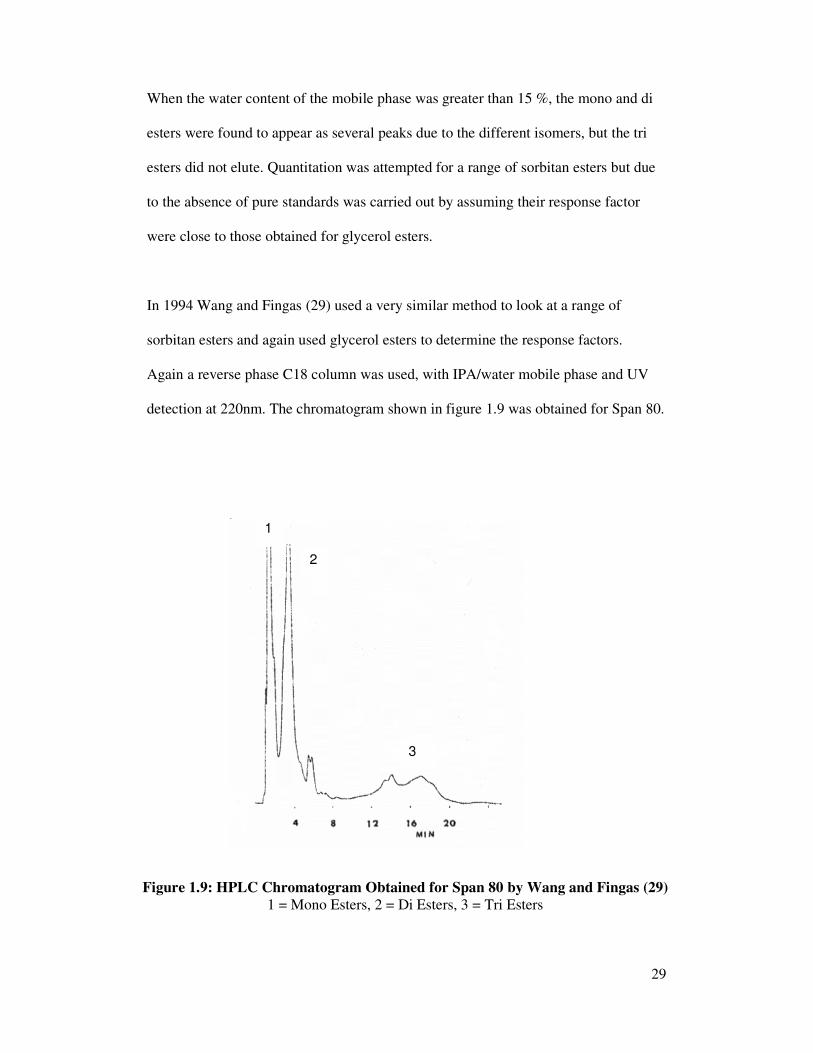
In 1994 Wang and Fingas (29) used a very similar method to look at a range of
sorbitan esters and again used glycerol esters to determine the response factors.
Again a reverse phase C18 column was used, with IPA/water mobile phase and UV
detection at 220nm. The chromatogram shown in figure 1.9 was obtained for Span 80.
1
2
3
Figure 1.9: HPLC Chromatogram Obtained for Span 80 by Wang and Fingas (29)
1 = Mono Esters, 2 = Di Esters, 3 = Tri Esters
30
Again single components were not separated but separation of mono, di and tri esters
were, indicated on the chromatogram by 1, 2 and 3, respectively. Due to the lack of
availability of pure standards the identification of the peaks was assumed based on the
correlation of retention times with the degree of esterification, molecular weights and
comparison with glycerides of fatty acids and similar surfactants. The limitation of the
method as with the previous method is that elution of the high poly esters is not
complete and these are probably retained on the column, which will result in a short
life span of the column. Also as the retention time of the components increases the
peaks become broader.
HPLC has also been used for the analysis of glycerol esters (60). Non aqueous
reversed phase HPLC was developed using a linear gradient of methanol/IPA and UV
detection for separation of molecular species of 45 synthesised tri and diglycerides.
The elution order was found to depend on the polarity of the fatty acid constituent,
with elution time increasing as polarity decreased. For both tri and diglycerides
elution corresponded with chain length, degree of unsaturation and presence of polar
groups. It was also found that other structural features affect elution, with a
triglyceride containing cis-fatty acids eluting slightly earlier than its isomer containing
trans fatty acids. This work emphasises the difficulties of analysing complex mixtures
and the various factors that can affect separation.
In 2006 reversed phase HPLC was used for profiling medium chain glycerides which
are used to solubilise drugs (61). The ratio of C8 and C10 fatty acids along with the
ratio of monoglycerides, diglycerides and triglycerides significantly impact the overall
solubilising properties, therefore an analytical method for characterising the
31
glycerides is necessary. Existing methods did not have the desired selectivity,
simplicity or adequate characterisation. A reversed phase HPLC method was used
with acetonitrile/water mobile phase and UV detection, it was optimised for
selectivity, sensitivity and efficiency and was successfully applied to characterise
commercial samples. The method allows adequate quantification of individual
components, total monoglycerides, diglycerides, triglycerides, free fatty acids and C8
vs C10 ratios and therefore shows full characterisation of the medium chain
glycerides, which is what is required for sorbitan esters. However sorbitan esters
typically have fatty acids with a longer chain length.
1.5.4 HPLC and Evaporative Light Scattering Detectors:
A versatile detector was needed for HPLC to complement UV detection and to detect
solutes that do not absorb UV radiation or do so at an inconvenient wavelength. RI
detectors although less sensitive had been considered universal, but cannot be used
with gradients and is effected by temperature therefore its use is limited. Both UV
and RI detectors also yield a solvent front, which results in fast eluting solutes being
obliterated (62). Lipids are vital products of large economic consequence and
analysis is difficult due to the complex nature of the mixtures and the number of
isomers and homologous. Due to the range of polarity of the various components,
gradient elution LC allows separation of many samples but this precludes the use of
an RI detector. However most triglycerides have no chromophore active above 210
nm, which makes UV detection difficult. Therefore GC had to be used but high
molecular weight triglycerides are difficult by this technique and phospholipids
impossible because they cannot withstand high temperatures. Highlighting the need
for an alternative detector for HPLC analysis of lipids.

32
Evaporative light scattering detectors (ELSD) were first considered in 1978, but it was
not until 1986 that a version came out using a spray chamber and drift tube and this
was commercialised by S.E.D.E.R.E (62). ELSD’s cannot detect highly volatile
solutes and cannot be used with non-volatile solvents or buffers, therefore are not
fully universal. However the advantages of ELSD’s (63) include the fact that they
detect any compound in a sample less volatile than the mobile phase, regardless of
functional group, gradient mobile phases can be used and solvent peaks are
eliminated. Also it is a more sensitive detector than both UV and RI and has improved
baseline stability due to reduced temperature fluctuations.
Studies have been carried out describing both the theoretical aspects (64, 65) and
applications of the ELSD. Stolyhwo et al. (66) studied the qualitative and quantitative
properties of the ELSD, when in an early stage of development and found it to
compare favourably to the RI detector. It was also found that the detector response
per unit mass of sample was constant for compounds belonging to a given chemical
group, but was not linear, although handling the data for quantitative analysis was
easily achieved. Robinson and Macrae (67) compared the ELSD to the RI detector,
UV detector, moving wire detector and IR detector for the analysis of complex
triglycerides also in the early stages of the ELSD development. It was found to be
promising due to its gradient compatibility and insensitivity to eluting solvent
composition.
The ELSD has been widely used to analyse polyol esters such as monoglycerides and
diglycerides (68), triglycerides (67, 69, 70, 71 and 72), polyglycerol fatty acid esters

33
(73) and sucrose esters (74) as well as other lipids (75, 76, and 77), steroids (78) and
surfactants (79).
Mancini et al. (63) studied the performance of three ELSD’s, the Alltech Varex K111,
Polymer PL-EMD950 and Sedex 45 to analyse triglycerides and phospholipids. The
linearity for all the detectors was indicated by regression coefficients and was greater
than 0.98 in the range 0-250 µg triglyceride injected and 0-25 ng for the phospholipid.
However the three instruments assayed did show differences in behaviour regarding
repeatability, linearity, sensitivity and detectability.
Liu et al. (68) determined monoglycerides and diglycerides by HPLC with ELSD,
using a normal phase column and without derivatization. The 1,3 diglycerol was
resolved from the 1,2 positional isomer, although some 1,3 of low molecular weight
was found to interfere with the 1,2 diglycerides of high molecular weight. For
monoglycerides the separation between 1- (and 3-) acyl and 2-acylglycerols was
optimised only between those pairs with identical fatty acyl groups. The response
was not found to be linear, so a linear log/log calibration curve was established.
However it was concluded that the universal nature of the ELSD makes the method
applicable to oils and emulsifiers containing both saturated and unsaturated fatty acyl
moieties.
Polyglycerol fatty acid esters are complex mixtures and compounds can appear as
diastereoisomers due to stereogenic carbons, therefore the correlation between
structure and performance is not easily determined. Polyglycerol fatty acid esters
along with fatty ethers were analysed by LC on porous graphitic carbon and octadecyl

34
silica with ELSD and using Mass Spectrometry (MS) for identification (73). The
work showed that with ELSD the response value becomes different when the eluent
composition changes, indicating care is required for comparing the response of
various compounds in gradient elution. However the work concluded that an
octadecyl bonded phase column and ELSD is a suitable method to control the purity
of polyglycerol esters, but the porous graphitic carbon column was required for
diastereoisomer analysis.
The ELSD was widely used for triglyceride analysis when initially developed and has
continued to be used for their analysis. Improvements of the functional properties of
vegetable oils have been obtained by altering the fatty acid composition, therefore
knowledge of the kind and quantities of individual triglycerides is important. In the
past quantitative triglyceride analysis by HPLC was difficult due to the fact they do
not have strong chromatophoric groups resulting in absorbance problems for UV
detectors and the fact gradient solvent systems are needed for the resolution of
triglycerides. However use was made of the FID, for the analysis of triglycerides in
vegetable oils and allowed quantitation without the need for detector response,
because quantification was based on area percent. However due to the lack of
commercial availability of the FID Neff et al. (80) used gradient reverse phase HPLC
with ELSD for determining the quantitative composition of genetically modified
soybean oil, using a newer ELSD with improved linear detection compared to older
models. It was demonstrated that ELSD produced quantitative results without the
need for response factors for the reverse phase HPLC of triglycerides. The oils
showed considerable variation in triglyceride species amount. The analysis showed
analysis precision with a standard deviation for triplicate analysis per soybean oil

35
triglyceride of 0.0 to 0.3 % per triglyceride species. The samples were also analysed
by HPLC-FID which is no longer commercially available and the data supported the
use of HPLC-ELSD in place of HPLC-FID.
Triglycerides with medium chain fatty acids in the sn1- and sn3- positions and
unsaturated long chain fatty acids in the sn2 positions have been reported as
alternatives to medium chain triglycerides for treatment of patients with lipid
malabsorption. Enzymic methods for synthesis of these triglycerides was appealing.
However the positional distribution of acyl groups in the triglyceride must be known
as well as the particular number of linoleic acids incorporated at a specific glycerol
position. HPLC-ELSD (81) was used for the separation of glyceride positional
isomers using silver ion chromatography and a solvent system of n-hexane, 2-
propanol, ethyl acetate and acetonitrile. Satisfactory separation of triglyceride
positional isomers according to number and the position of linoleic acid was obtained.
Good separation of the two positional isomers diglyceride 1,3 dicaprylin and 1,2
dicaprylin was also obtained.
Improved separation of sucrose ester isomers has also been achieved using gradient
HPLC and ELSD (74). Sucrose has eight hydroxyl groups therefore 255 different
isomers are possible from mono to octa esters, although not all hydroxyl groups are
equally as reactive. TLC, GC and HPLC have been used for the separation of the
different components of sucrose fatty acid esters. Moh et al.(74) felt all previous
work was inadequate and used HPLC with a binary gradient to separate sucrose mono
and di esters with different acyl chain lengths (C16 and C18), the mono esters
resolved in three to six peaks and the di esters in fourteen to eighteen. The method

36
offered advantages over other analysis in terms of improved resolution and
simultaneous separation of mono and di esters. Therefore making it possible to
determine the approximate composition of mono and di esters of sucrose esters in one
analysis. However quantification of higher esters was based on an estimate and the
chromatograms do not show the elution of the higher esters.
The review highlights that HPLC-ELSD has many uses and that the ELSD is an
alternative to the UV detector, particularly for compounds which do not absorb in the
UV region. Early problems of non linear detection appears to have been resolved in
newer ELSD models. HPLC with ELSD may be suitable for sorbitan ester analysis.
1.5.5 Capillary Supercritical Fluid Chromatography:
Capillary Supercritical Fluid Chromatography (CSFC) is a chromatographic technique
which uses supercritical fluids as the mobile phase and a narrow bore capillary
column with immobilised stationary phase. The high solvating power of the
supercritical fluids enables elution of higher molecular weight components at
temperatures much lower than those used for high temperature GC. Wang and Fingas
(82) investigated the use of capillary supercritical fluid chromatography parallel to
HPLC for the analysis of sorbitan esters. The chromatography was performed on a
SB-Biphenyl –30 column equipped with an integrated on column frit restrictor and
detection was by FID operated at 350°C. SFC grade carbon dioxide was used as the
mobile phase and separation was achieved using an isothermal linear pressure
programme. The sorbitan esters were separated into five groups, consisting of starting
materials, mono-, di-, tri- and tetra esters, with each group consisting of a number of
peaks representing different isomers. The chromatogram obtained for Span 80 is

37
shown in figure 1.10, the numbers 0 to 4 represent the starting material and sorbitan
mono, di, tri and tetra esters respectively. Each group consists of a number of
partially unresolved peaks, however it was felt to be considerably better than that
obtained by HPLC.
As with previous work on sorbitan esters, assumptions were made with identification
due to the lack of availability of pure standards and quantitation was carried out using
response factors based on those obtained for a range of glycerides. It was concluded
that in comparison to HPLC, CSFC broadens the scope of the technique to higher
molecular weight sorbitan polyesters while maintaining high separation efficiency.
CSFC was used by Hunt et al. (83) to analyse a sample of sorbitan laurate, which
resulted in a chromatogram with a number of partially resolved peaks. Super critical
fluid extraction of parts of the sample matrix was used to investigate the composition
Figure 1.10: Capillary SFC Chromatogram Obtained for Span 80
by Wang and Fingas (82)
0 = Starting Material, 1 = Mono Esters, 2 = Di Esters, 3= Tri Esters, 4 = Tetra Esters

38
of the matrix, by separating it in to constituent fractions that were easier to analyse.
The main fractions were analysed by CSFC and this showed that they were simpler
than the original sample. The fractions were analysed by 13C NMR and this showed
that fractionation into four distinct classes occurred, including cyclic monoesters,
cyclic di and tri esters, linear esters and a highly polar unidentified fraction. The
study demonstrated that supercritical fluid extraction can be used for sample
preparation for characterisation of complex mixtures.
1.5.6 Gas Chromatography (GC):
Gas Chromatography is a chromatography technique used to analyse complex
mixtures of volatile organic and inorganic components, separation occurs due to
partitioning of the solute between the moving gas and stationary phase and has been
used to analyse polyol esters.
In 1965 Suffis et al. (84) presented a GC method for the analysis of some non-ionic
surfactants as trimethyl silyl ether derivatives, the hydroxyl groups contained in the
surfactant was reacted with hexamethyldisilazone and trimethylchlorosilane to give a
more volatile compound suitable for GC analysis using a packed column.
Comparison of derivatised surfactants to non derivatised showed the significant
improvement derivatisation made. The work concentrated largely on glycerides,
although the technique was also tried with several sorbitan esters, resulting in a
number of partially resolved peaks being observed. However no attempt was made to
assign the peaks, therefore it is uncertain which components eluted and which did not.

39
GC has also been used to determine sucrose fatty acid esters as TMS derivatives (85).
The method involved degradation of the sucrose esters to sucrose and fatty acids, with
each then being determined by GC after derivatization. Therefore no separation of the
various esters was obtained using this method, just the ratio of the sucrose and the
various fatty acids.
Uematsu et al. (12) used GC to determine sucrose ester, however only the mono esters
were of interest, therefore higher esters were removed by column chromatography.
The resulting mono esters were acetylated and then analysed by conventional GC with
a wide bore column and splitless injection. The GC work found that sucrose mono
esters of C12, C14, C16, C18 and C18-1 are used as food additives.
A combined LC-GC technique was used (37) for the analysis of polyglycerol fatty
acid esters, which are non-ionic surfactants with various applications in the food,
cosmetic and the pharmaceutical industry. The samples were fractionated by LC and
pure standards of monoester and diesters of diglycerol and triglycerol were obtained,
using LC-MS for confirmation. Confirmation of most di esters and cyclic glycerol
were proposed. Isolation of the pure esters and subsequent GC analysis indicated that
many components coelute and therefore it is necessary to prefractionate by LC to
characterise esters correctly and therefore is a lengthy method. However the work
concluded that in combination with other chemical analyses a complete profile of the
chemical composition of polyglycerol fatty acid esters can be obtained.
GC and GC-MS have been used to analyse a range of crude galactose and xylose
monoesters prepared by lipase catalysis (13). The chromatogram obtained for

40
galactose fatty acid esters showed sharp well resolve peaks for both the fatty acid and
galactose, however only three very broad peaks were observed, which were identified
as esters. It is possible that other esters were produced but were not volatile enough to
be eluted from the GC column. GC analysis of food grade sorbitan esters was
undertaken to establish a reference point and again only the starting materials were
well resolved. The GC chromatogram obtained for sorbitan mono laurate showed a
range of unidentified partially resolved peaks in addition to the fatty acid peaks,
however for sorbitan mono oleate, the early eluting components were identified as
fatty acids, later eluting components thought to be due to polyol esters were not
identified. GC analysis revealed the presence of a large number of individual
components (up to 65), many were identified by mass spectrometry as various isomers
of sorbitan, isosorbide and their mono and di esters. Ten isomers of sorbitan were
identified based on their molecular ions. This analysis was carried out using a
maximum oven temperature of 300°C and injection and detector temperature of
285°C.
Giacometti et al. (86) monitored the esterification of sorbitol and lauric acid by GC,
with and without previous sorbitol cyclisation, although only the concentration of
residual fatty acid was determined using GC. The samples were derivatised to produce
trimethylsilyl ether and ester derivatives suitable for GC analysis and then analysed
using a packed column, injection and detector at 240°C and a maximum oven
temperature of 220°C. The chromatogram obtained for sorbitan mono laurate showed
characteristic sharp peaks for sorbitan and lauric acid and broader peaks for the mono
esters but no higher esters were observed, this is probably because they are
insufficiently volatile to elute from the column. However the results confirmed the

41
possibility of monitoring lauric acid and sorbitol esterification via GC determination
of lauric acid concentration.
High temperature-GC (HT-GC) starts at the upper working temperature of
conventional GC (330-350°C) it has been made possible by the combination of
thermostable bonded stationary phases with a range of columns capable of
withstanding the elevated temperatures. HT-GC has been used to characterise high
boiling petroleum products, triglycerides, sterol esters and polyglycerols plus other
high molecular weight samples including antioxidants and stabilisers (87). Apolar
and medium polar gum phases can be operated at temperatures of 400 to 420°C,
allowing the analysis of thermally stable organic compounds with molecular weights
as high as 1700 amu.
HT-GC and high oven temperature cold on column injection has been used to analyse
triglycerides (88) because qualitative and quantitative determination of triglyceride
mixtures is important in a variety of fields. An important aspect is quantitative loss of
triglycerides in HT-GC by thermal decomposition or polymerisation. The quality of
the column and the injection technique are critical for high precision and accuracy.
HT-GC was used to analyse tranesterified cocoa butter, cold on-column injection was
used with a high oven temperature, however this involved modification of the cold
on-column injector with a secondary cooling. The oven temperature was 300°C,
increased to 340°C after injection. The analysis showed good repeatability and
accuracy and illustrated the potential of the technique.

42
Cold on-column and programmed temperature (PT) split/splitless injections have been
used for a number of HT-GC analysis. Losses above nC60 were observed with PT
splitless injection, thought to be due to purging the PT inlet too soon, therefore
resulting in incomplete sample vapourisation and this was also found with hot
splitless injection. An investigation was carried out to compare cold on-column and
PT split/splitless injection for the analysis of polywax 655, n-30 hydrocarbons and
triglycerides. PT split injection was preferred over PT splitless for materials above
C62 and it has advantages over cold on-column injection for cleaning. It was found
(89) that PT split and cold on-column sampling gave equivalent recoveries of
materials up to C78, but optimisation of programmed temperature splitless sampling
is required. The thermal effects in the column of pure triglycerides were also part of
the investigation by varying the temperature programme rate and the gas velocity for a
synthetic mixture of triglycerides. Little effect was noted on recoveries by changing
the temperature but changing the gas velocity did. A higher linear velocity and thinner
stationary phase was found to improve elution of sensitive compounds at temperatures
of 400°C, however a reason for the losses is not clear but it is thought it may be due to
decomposition.
HT-GC has also been used to analyse sucrose esters (90), the samples were silylated
prior to analysis on a number of commercially available high temperature columns,
with separation according to boiling point on non-polar phases. A temperature
programme was used with a start temperature of 70°C, held for 4 minutes and then
increased at 10°C/min to a final temperature of 400°C. The study found the
aluminium-clad and HT-polyimide columns to be less suitable compared to the glass
and metal columns because of their limited stability at high temperature. The method
43
was found to be considerably better than conventional GC and the range of
compounds amenable to GC widened. However the method was limited to
compounds with volatilities less than that of sucrose hexalaurate (MM = 1597.2) and
tristearate (MM = 1501.2). However an alternative derivatisation method may extend
the range of esters which HT-GC may be applicable to and make it possible to analyse
sorbitan esters by HT-GC.
In 1998 Aichholz and Lurbeer (91) investigated the separation of triglycerides by HT-
GC using seven different stationary phases. The main limitation of HT-GC is the
thermal degradation of triglycerides with a high degree of unsaturation. Three
triglycerides were analysed on the seven phases to establish elution order and
temperature, three columns were found to offer the best separation and these columns
had a dependence on retention on the number of double bonds. It was noted that the
elution temperature of individual lipid species could vary significantly depending on
the stationary phase. Seed oil of Jatropha multifida was then analysed to illustrate the
selectivity of two selected stationary phases (SOP-50 and OV-225-OH). OV-225-OH
makes possible both reduced retention time for neutral lipids and increased selectivity
for separation of species possessing the same acyl number but different unsaturation,
however the drawback was an upper temperature of 380°C, because above this
extensive column bleed resulted. The study concluded that the problem of thermal
decomposition of highly unsaturated triglycerides cannot be resolved with the
stationary phases used in the study.
In 2000 Pereira and Aquino (92) evaluated nine high temperature commercial
capillary columns (aluminium clad and polyimide –coated fused silica) for their

44
thermal stability, activity and dependence on column temperature. A Grob mixture
was analysed, along with a mixture containing a range of triglycerides with masses
ranging from 218 daltons for triacetin to 1059.8 daltons for tribehenin. The columns
were operated using a temperature programme with a maximum temperature of 400°C
held for 20 minutes for the triglycerides, however not all columns were able to elute
tribehnin. The work showed that the column bleed was higher in columns with a
greater quantity of phenyl groups in the stationary phase and when the stability of the
capillary external coating was reviewed, it was found that it was poor for the
aluminium clad columns. The results also showed that high temperature, high
resolution GC capillary columns can be used at high temperatures up to 420°C, but
not with long isothermal temperatures. It was felt further development of more stable
and inert capillary columns would be required to push GC to its limit of 420°C.
However it was concluded that commercial high temperature capillary columns can be
used at 390 – 420°C without major problems, except a decrease in column lifetime
and that this opens up a new window for molecular masses that can be analysed. It
was felt this was very important for various fields of science and the discovery of new
compounds.
The review that has been carried out on HT-GC indicates it may be a possible
technique for the separation of the various components found in sorbitan esters.
1.6 Conclusion:
The literature reviewed highlights the complexity of analysing polyol esters and
specifically sorbitan esters, which are to be investigated in this study. However
despite the difficulties encountered polyol fatty acid esters have widespread

45
applications and this leads to the continued research in to the synthesis and analysis of
these ester products.
HPLC is to be the first chromatographic technique to be selected for separating the
various components of sorbitan esters, because unlike GC it is not limited by sample
volatility and thermal stability. As sorbitan esters do not contain a chromaphore it is
felt that the use of an evaporative light scattering detector for HPLC rather than a UV
detector may be advantageous.
Although TLC was found to be relatively successful for the analysis of sucrose esters,
TLC has limitations in that the mobile phase moves by capillary forces and therefore
is not as controlled as with GC or HPLC. Also TLC is not one of the better techniques
for quantitation and for accurate work expensive scanning equipment is required.
GC will be the second analytical technique investigated, the development of HT-GC
has resulted in the characterisation of high molecular weight complex components
including triglycerides and sucrose esters and therefore may be suitable for sorbitan
esters.

46
2. Initial HPLC Work for the Analysis of Sorbitan Mono Oleate:
HPLC is a popular method of chromatography because it is not limited by volatility or
stability of compounds and is used for separation, identification and quantification of
compounds. HPLC was therefore the initial analytical technique selected for the
separation of sorbitan esters. Sorbitan esters are expected to have a range of
components of varying size and polarity and therefore volatility, it was initially
thought that due to this GC may be problematic. Sorbitan mono oleate is a major
sorbitan ester manufactured by Croda based on oleic acid. It is used in a number of
health and personnel care applications as well as the emulsion explosives market. An
analytical technique which gives more information on the structure of sorbitan esters
is required to follow the manufacturing process of sorbitan esters and it may lead to a
better understanding of structure activity relationships.
2.1 Samples:
The sample of interest in this experiment sorbitan mono oleate (SMO), is usually
manufactured from sorbitol and fatty acids which gives a range of polyol esters, the
fatty acid feedstock used also contains a range of fatty acids. The product is therefore
a complex material with a large number of components, for this work a sample of
SMO was produced from a high purity fatty acid feedstock to give material with a
similar polyol profile and ester distribution as the manufactured material but
simplified by not having a mixed fatty acid feedstock and therefore making analysis
more straight forward.

47
Before beginning HPLC method development, it is important to know information
concerning sample composition and properties, which may include the number of
components present, chemical structure of compounds, molecular weight of
compounds, pKa values of compounds, concentration range of compounds in the
sample of interest and sample solubility.
Sorbitan esters are known to consist of a large range of components of varying
polarity and molecular weight, present at varying concentrations. It was therefore felt
necessary to gain some information about the single polyol esters of oleic acid prior to
HPLC analysis of a sample containing them. Samples of isosorbide oleate, sorbitan
oleate, isosorbide dioleate and sorbitol oleate were therefore prepared from high
purity oleic acid by Dr C Howarth (Croda). The samples were also to be used as
standards to aid identification of components found in the sample of sorbitan mono
oleate prepared from high purity oleic acid.
A sample of manufactured sorbitan mono oleate prepared from a mixed fatty acid
feedstock was also obtained, so comparison could be made to the high purity fatty
acid mixed polyol material.
48
2.2 Analysis of Samples for Polyol Profile and Ester Distribution:
The current methods used by Croda to gain information about the composition of the
sorbitan ester samples are polyol profiles and Gel Permeation Chromatography (GPC)
and therefore were carried out on the samples detailed in chapter 2.1.
2.2.1 Polyol Profile:
The polyol profile determines the levels of sorbitol, sorbitan and isosorbide present in
a sample. The sorbitan ester is saponified, the fatty acids removed and the polyols
derivatised for subsequent GC analysis. The procedure used is:
3 ± 0.1 g sample weighed into a 250 ml flat bottomed flask and 35 ml methanolic
KOH (50 g KOH in 1000 ml anhydrous methanol) reagent added and refluxed for 45
minutes. To the above mixture 35 ml MeOH/H2SO4 reagent added (100 g H2SO4 in
1000 ml anhydrous methanol) and refluxed for a further 45 minutes, then 120 ml
water added. This is transferred to a 500 ml separating funnel and washed with 3 x
100 ml diethyl ether, discarding the ether layer. The resulting aqueous layer is
neutralised to pH 6.5 – 7.5 and evaporated to dryness using a rotary evaporator.
To the above residue 5 ml pyridine and 10 ml acetic anhydride are added and brought
to the boil, shaking to dislodge any residue adhering to the sides of the flask and
refluxed for 1 hour. 0.3 µl of the resulting mixture is injected on to the GC using the
following conditions:
Column: TAP-CB, 0.25 mm id, length 25 m
Detector type: FID
Injection temperature: 350°C
Detector temperature: 380°C
Initial oven temperature: 120°C

49
Final oven temperature: 260°C
Ramp rate: 8°C/minute
Carrier gas: Helium
The polyol profiles of the samples detailed in chapter 2.1 were determined and they
were found to contain (%):
SMO ex
Croda
SMO Sorbitan
Oleate
Isosorbide
Dioleate
Sorbitol
Oleate
Isosorbide
Oleate
Isosorbide ~23 ~13 ~5 >99 ND >99
Sorbitan ~75 ~78 ~91 ND <1 <0.5
Sorbitol ~2 ~9 ~4 <1 >99 <0.5
ND = None Detected
Table 2.1: Polyol Profiles of Polyol Ester Samples
The analysis confirmed that the material prepared from high purity oleic acid with a
mixed polyol profile did have a mixture of polyols and was similar to the
manufactured sorbitan mono oleate, although it contained slightly different levels of
isosorbide and sorbitol. The isosorbide and sorbitol ester samples were found to
contain essentially one polyol and the sorbitan oleate prepared to have a high sorbitan
content, was found to contain >90 % sorbitan. The material was produced by
dehydration of sorbitol, however 100 % conversion to sorbitan did not occur, although
the material does still contain a high level of sorbitan.
50
2.2.2 GPC Analysis:
GPC separation is based on the size of the components, it is regularly used by Croda
to determine the ester distribution of sorbitan mono esters. From this the sorbitan
mono:isosorbide mono ester and higher:mono ester ratios are calculated, because they
are believed to give information on the degree of dehydration and esterification.
The samples detailed in chapter 2.1 were analysed using the following conditions:
LC System: Gilson pump
Philips PU4026 refractive index detector
Columns: Two 300 x 7.8 mm Waters Styragel columns (HR1.0 and
HR0.5) connected in series
Injection volume: 20 µl
Mobile Phase: Tetrahydrofuran (HPLC grade)
Flow rate: 0.875 ml/min
The columns used are Waters Styragel columns which are packed with high
performance fully porous highly cross linked styrene divinylbenzene copolymer
particles. The HR range selected are used for high resolution analysis of low
molecular weight polymers, oligomers, additives etc. The HR 1.0 column has an
effective molecular weight of 100 to 5000 daltons and the HR0.5 an effective range of
0 to 1000 daltons.
The samples analysed were quantified based on area normalisation, without any
response factors being taken into consideration.

51
Using area normalisation the samples were found to contain (%);
SMO ex
Croda
SMO Sorbitan
Oleate
Isosorbide
Dioleate
Sorbitol
Oleate
Isosorbide
Oleate
Tri/higher ~25 ~35 ~45 - 25 to 30 -
Di esters ~35 ~40 ~35 ~88 ~30 50 to 55
Sorbitol mono esters - - - - 25 to 30
Sorbitan mono esters 15 to 20 ~15 ~15 - - -
Isosorbide mono esters ~10 ~6 ~3 - - ~25
Acid ~5 ~1 ~1 - ~15 ~15
Sorbitan ~2 ~2 ~2 - - -
Isosorbide 2 to 3 ~1 <1 - - ~1
Others - - - ~12 - -
Table 2.2: Results of GPC Analysis of Polyol Ester Samples
The mixed polyol high purity fatty acid sorbitan mono oleate was found to have a
similar ester distribution to the manufactured material. The high sorbitan SMO was
also similar, this is due to a mixture of polyols being present despite sorbitan levels
being higher than in manufactured material. The isosorbide dioleate was found to
have a high level of di esters and the isosorbide oleate a mixture of mono and di esters
as well as starting material. The sorbitol oleate contained a range of esters and free
acid.
From the polyol and GPC analysis it is apparent that sorbitan esters will consist of a
range of components of varying polarity, present at varying concentrations, as
expected.

52
2.3 Solubility Study:
The solubility of the various polyol oleate esters present in sorbitan mono oleate has
not been investigated and for HPLC the sample must be soluble in the mobile phase
and if a gradient is used, remain soluble throughout the entire eluent composition.
Due to the fact solubility of the sample is important, a study was carried out to
establish the solubility of various polyol oleate esters in a range of solvents used for
HPLC analysis. It was envisaged that the sample to be analysed by HPLC would be
prepared at 0.1 % in solvent, therefore a higher concentration was used for the
solubility study to ensure solubility at 0.1%.
A solubility study was carried out on all the samples described in chapter 2.1 prepared
from high purity oleic acid, as well as isosorbide and sorbitol (ex Aldrich) which are
starting materials and therefore could be present in the material and a sorbitan mono
oleate manufactured by Croda using a mixed fatty acid feedstock. 0.25 % solutions
were prepared of each sample using the following solvents hexane (Fisher – HPLC
grade), dichloromethane (Fisher – HPLC grade), tetrahydrofuran (VWR – HPLC
grade), ethyl acetate (Fisher – HPLC grade), acetonitrile (Fisher – HPLC grade),
isopropanol (Fisher – HPLC grade), methanol (Fisher- HPLC grade) and water (Ronil
– HPLC grade). A visual observation was made of each solution to establish if the
sample was soluble, dispersable, partially soluble or insoluble in the solvent.
The solubility of each sample in each solvent is shown in table 2.3.

53
The results show that:
- all the samples in the study, with the exception of sorbitol were soluble in
isopropanol and tetrahydrofuran. These are therefore good solvents to select for the
initial HPLC analysis.
- a number of the samples were also soluble in hexane, which could be used as the
less polar solvent to alter the polarity of the mobile phase.
- the polyol ester samples were found to be dispersible in water, but not fully soluble
as expected, this is due to the fact the molecules consist of a hydrophilic portion
which will be soluble in the water and a hydrophobic portion which will not.

SMO
Ex Croda
SMO
Sorbitan
Oleate
Isosorbide
Dioleate
Sorbitol
Oleate
Isosorbide
Oleate
Isosorbide Sorbitol
Hexane √ √ √ √ X √ X X
Dichloromethane √ √ √ √ X √ √ X
Tetrahydrofuran √ √ √ √ √ √ √ X
Ethyl acetate √ √ X √ X √ √ X
Acetonitrile P P P √ √ P X X
Isopropanol √ √ √ √ √ √ √ X
Methanol X X X X X X √ √
Water D D D D D D √ √
D – dispersible P – partially √- complete solubility X - insoluble
Table 2.3: Solubility of a Range of Samples in Commonly Used HPLC Solvents

55
2.4. Column Selection:
The choice of column and mobile phase is important in the development of a HPLC
method. A number of columns are available including reversed and normal phases.
Sorbitan mono oleate, prepared from high purity (>99 %) oleic acid was chosen for
the initial work because it has a similar polyol and ester distribution to a commercial
SMO, but is simplified by not having a mixed composition of fatty acids. The
separation obtained for the sample using a range of columns and mobile phases was to
be compared and from this information the best column and mobile phase selected for
further investigation.
The following was used for the initial HPLC analysis:
LC System: HP1050
HP Interface 35900E
Sedere Sedex 75 ELSD (Gain 6, P 2.2 bar, Temperature 35°C)
Injection volume: 20 µl
Flow rate: 1 ml/min
Separation of the various components was to be compared using various conditions,
with no identification considered.
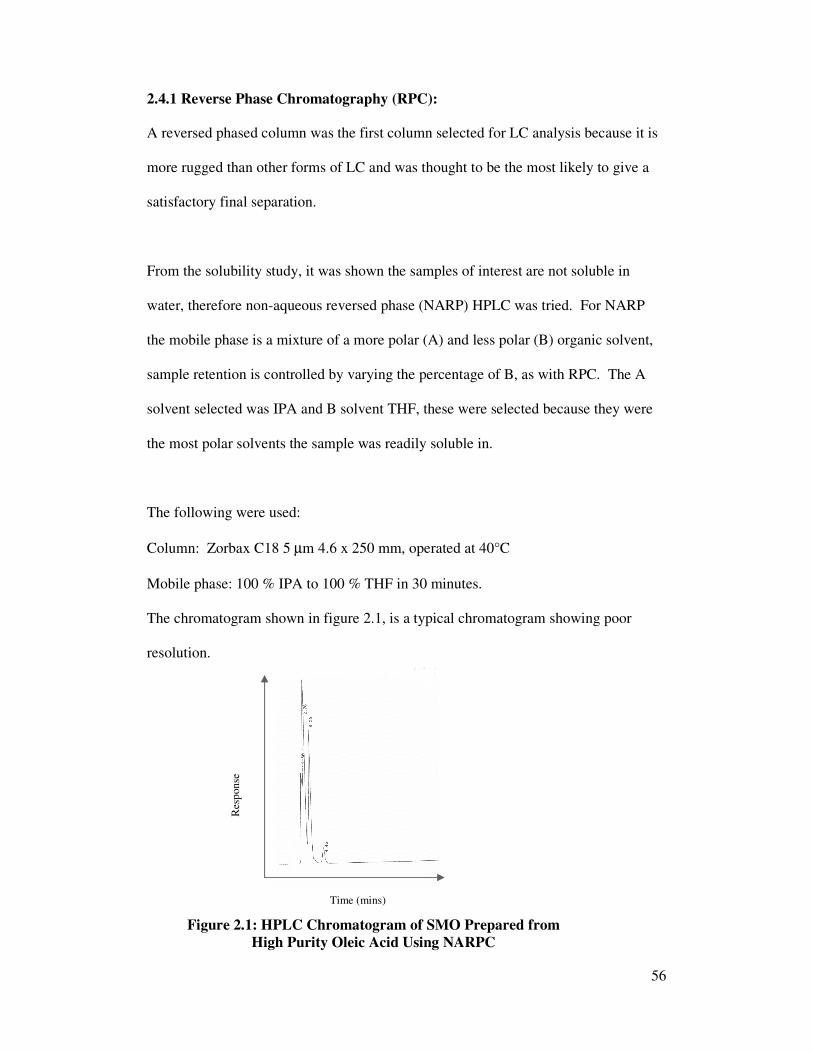
56
2.4.1 Reverse Phase Chromatography (RPC):
A reversed phased column was the first column selected for LC analysis because it is
more rugged than other forms of LC and was thought to be the most likely to give a
satisfactory final separation.
From the solubility study, it was shown the samples of interest are not soluble in
water, therefore non-aqueous reversed phase (NARP) HPLC was tried. For NARP
the mobile phase is a mixture of a more polar (A) and less polar (B) organic solvent,
sample retention is controlled by varying the percentage of B, as with RPC. The A
solvent selected was IPA and B solvent THF, these were selected because they were
the most polar solvents the sample was readily soluble in.
The following were used:
Column: Zorbax C18 5 µm 4.6 x 250 mm, operated at 40°C
Mobile phase: 100 % IPA to 100 % THF in 30 minutes.
The chromatogram shown in figure 2.1, is a typical chromatogram showing poor
resolution.
Figure 2.1: HPLC Chromatogram of SMO Prepared from
High Purity Oleic Acid Using NARPC
Time (mins)
Res
ponse
57
Four peaks are observed all of which are eluted in less than 5 minutes. The sample is
known to have considerably more components than this, which indicates components
are coeluting. Reversed phase separation involves a partitioning of the solutes
between the non-polar stationary phase and polar mobile phase. The equilibrium
constant for this is called the partition ratio or coefficient and is defined as K =
Cs/Cm, where Cs is the concentration of the analyte in the stationary phase and Cm
the concentration in the mobile phase. The components in the sample have favoured
the mobile phase and passed through the system with little partitioning occurring. To
increase retention and therefore resolution of the components present in the sample a
more polar mobile phase is required, however this would require the use of another
solvent, such as methanol or ideally water, which the sample is not soluble in.
Therefore it would appear that if sorbitan mono oleate components are to be separated
by HPLC, normal phase will have to be used.
2.4.2 Normal Phase Chromatography – Isocratic:
In normal phase the stationary phase is more polar than the mobile phase, a commonly
used packing is silica. Separation using bonded stationary phases have started
replacing many that were carried out on silica columns, because they show less tailing
and respond more rapidly to changes in mobile phase composition. They can also
show different selectivities depending on the polar bonded group and gradient elution
can be used. Weakly polar bonded phases include diol and cyano, where as more
polar types contain amino groups. Cyano is one of the most commonly used bonded
phases, due to its rugged packing, followed by diol and amino, however amino
columns are less stable than the others (93). Sorbitan mono oleate prepared from high

58
purity oleic acid was analysed using a range of normal phase columns and mobile
phases.
2.4.2.1 Silica Column
Due to the wide range of polarity expected in the sample, it would be ideal to change
the polarity of the mobile phase during the separation, however gradient elution is
avoided with silica columns, particularly if the two solvents are very different in
polarity, due to solvent demixing.
The sorbitan mono oleate prepared from high purity oleic acid under investigation
was found to be soluble in hexane and isopropanol, the sample was therefore analysed
using a series of mobile phases based on hexane/IPA. In this approach the first
mobile phase selected was the most polar, so that long run times were not involved,
the amount of hexane was increased sequentially to decrease the polarity of the
solvent and therefore increase the retention of the solutes. The effect of polarity on
separation could then be observed.
A similar approach was carried out with hexane/THF, because the sample is also
readily soluble in tetrahydrofuran.
A 250 x 4.6 mm silica column, operated at room temperature (20°C) was used with
the following isocratic mobile phases hexane/IPA 20/80 v/v , 50/50 v/v, 80/20 v/v,
85/15 v/v, 90/10 v/v, 95/5 v/v and hexane/THF 20/80 v/v, 50/50 v/v, 80/20 v/v, 85/15
v/v, 90/10 v/v.
59
Hexane/IPA series:
The chromatograms obtained for the sample of sorbitan mono oleate prepared from
high purity oleic acid and analysed using hexane/IPA as the mobile phase in varying
ratios can be seen in figures 2.2 and 2.3. Using the most polar mobile phase
hexane/IPA 20/80 v/v, essentially no separation was obtained, one broad peak is
obtained with a smaller peak eluting later, however both eluted in less than 5 minutes.
The components of the sample have not been well retained by the column. It can be
seen that by increasing the hexane concentration and therefore decreasing the polarity
of the mobile phase, some adsorption occurs and slightly better separation is obtained
up to hexane/IPA 90/10 v/v when a number of partially resolved peaks are obtained.
The number of peaks observed is still significantly less than the number of
components expected in a sample of SMO, indicating a large number of components
are coeluting.
When a mobile phase of hexane/IPA 95/5 v/v was used to elute the sample, the
number of peaks decreased, this is probably due to the mobile phase not being polar
enough and components being adsorbed strongly by the column and not eluted.
Hexane/THF:
The chromatograms obtained using the series of mobile phases based on hexane/THF
are shown in figures 2.4 and 2.5. As observed with the previous mobile phase,
essentially no separation of the various components was obtained with the most polar
mobile phase, but separation began to increase as the polarity of the mobile phase
decreased, up to hexane/THF 85/15 v/v. With a mobile phase of hexane/THF 85/15
v/v distinct groups of partially resolved peaks can be seen, with a broad peak observed
60
later (~20 minutes). The peaks obtained using hexane/THF 90/10 v/v are well
resolved, however the number of peaks is less than with the previous mobile phase,
indicating that components are being retained by the column.
Using the two series of mobile phases with a silica column, the best separation for the
SMO sample was obtained using a mobile phase of hexane/THF 85/15 v/v, however
the peaks were not base line resolved.
Capacity Factor:
The capacity factor (k') describes the migration rate of an analyte through a column,
the capacity factor for the first peak observed using the various mobile phases was
calculated. The first peak was selected because no identification of the components
was attempted, therefore if other peaks were selected there would be uncertainty that
they were due to the same component and comparison of the capacity factor for a
solute with differing mobile phases was required. The capacity factor requires the
retention time of an unretained solute, because an ELSD was used the solvent was not
detected, therefore it was necessary to estimate it (94) using the equation
to ~ 0.5L dc2/F
where L is the length of the column (cm), dc is the internal diameter of the column
(cm) and F is the flow rate (ml/min). The capacity factors for the first peak to elute
using the various mobile phases are shown in table 2.4.
The k' values for all the mobile phases are small, indicating retention times are short
for the first eluting component. When k' is less than one, elution occurs so rapidly,
obtaining an accurate retention time can be difficult, as observed for the first

61
component. Ideal separation is performed under conditions in which k' for solutes in
a mixture lie in the range 2 to 10, values of 20 to 30 results in the elution time being
too long (95). The k' values obtained are also all very similar indicating that changing
the mobile phase has had no or little effect on the retention of the first eluting
components.
Mobile Phase Capacity Factor
Hexane/IPA 20/80 v/v 0.3
Hexane/IPA 50/50 v/v 0.4
Hexane/IPA 80/20 v/v 0.3
Hexane/IPA 85/15 v/v 0.3
Hexane/IPA 90/10 v/v 0.2
Hexane/IPA 95/5 v/v 0.2
Hexane/THF 20/80 v/v 0.2
Hexane/THF 50/50 v/v 0.3
Hexane/THF 80/20 v/v 0.3
Hexane/THF 85/15 v/v 0.3
Hexane/THF 90/10 v/v 0.3
Table 2.4: Capacity Factor of the First Eluting Peak Using
A Range of Mobile Phases
2.4.2.2 Cyano Column:
A cyano column was the first bonded phase column selected to investigate, because it
is believed to be the most rugged and it is one of the most extremes of the bonded
phases discussed compared to silica. A Supelco 4.6 x 250 mm cyano column was
installed to the HPLC system. As a direct comparison to silica was required, the same
series of mobile phases were used.
Figures 2.6 and 2.7 show the chromatograms obtained using the various mobile
phases based on hexane/IPA and figures 2.8 and 2.9 the chromatograms obtained
using the hexane/THF series. It can be seen that the chromatography is poor with
essentially no separation achieved with any of the mobile phases.
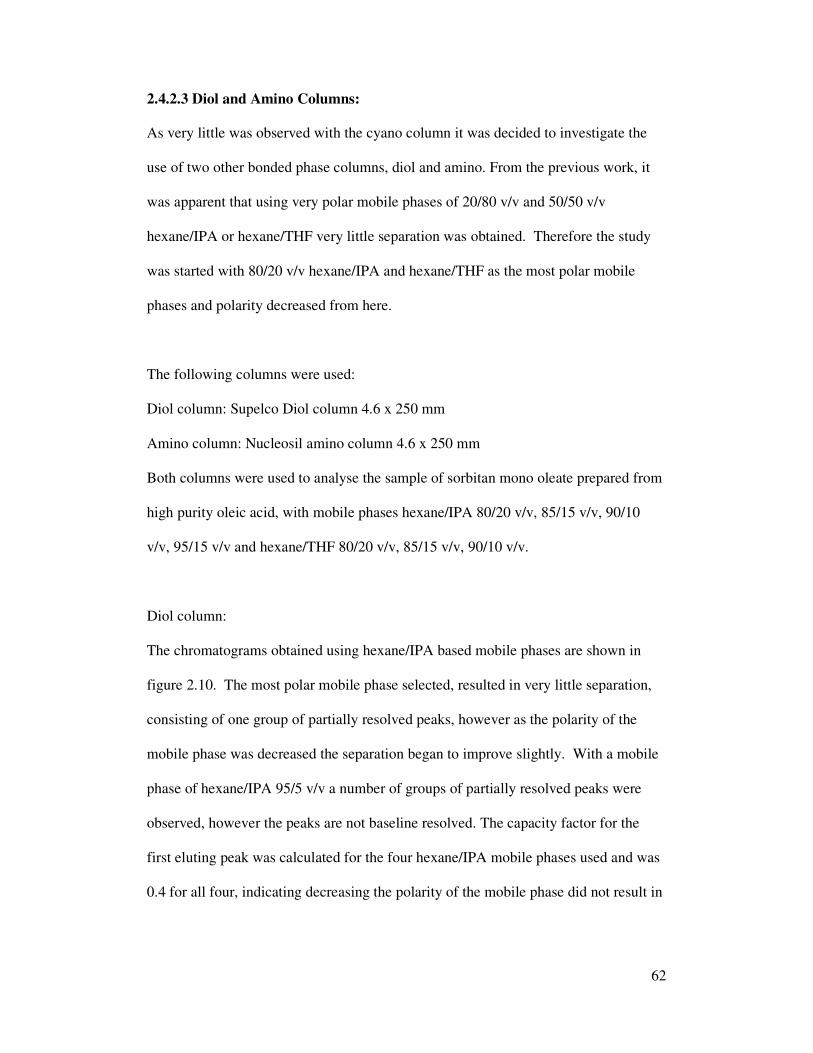
62
2.4.2.3 Diol and Amino Columns:
As very little was observed with the cyano column it was decided to investigate the
use of two other bonded phase columns, diol and amino. From the previous work, it
was apparent that using very polar mobile phases of 20/80 v/v and 50/50 v/v
hexane/IPA or hexane/THF very little separation was obtained. Therefore the study
was started with 80/20 v/v hexane/IPA and hexane/THF as the most polar mobile
phases and polarity decreased from here.
The following columns were used:
Diol column: Supelco Diol column 4.6 x 250 mm
Amino column: Nucleosil amino column 4.6 x 250 mm
Both columns were used to analyse the sample of sorbitan mono oleate prepared from
high purity oleic acid, with mobile phases hexane/IPA 80/20 v/v, 85/15 v/v, 90/10
v/v, 95/15 v/v and hexane/THF 80/20 v/v, 85/15 v/v, 90/10 v/v.
Diol column:
The chromatograms obtained using hexane/IPA based mobile phases are shown in
figure 2.10. The most polar mobile phase selected, resulted in very little separation,
consisting of one group of partially resolved peaks, however as the polarity of the
mobile phase was decreased the separation began to improve slightly. With a mobile
phase of hexane/IPA 95/5 v/v a number of groups of partially resolved peaks were
observed, however the peaks are not baseline resolved. The capacity factor for the
first eluting peak was calculated for the four hexane/IPA mobile phases used and was
0.4 for all four, indicating decreasing the polarity of the mobile phase did not result in

63
a longer retention of the early eluting component. Also as seen with the silica column
the k' value for the first eluting component was small, indicating little retention.
The chromatograms obtained using hexane/THF based mobile phases are shown in
figure 2.11. Using hexane/THF 80/20 v/v two groups of two peaks are detected, as the
mobile phase becomes less polar more resolution is obtained and the best separation
observed was using hexane/THF 90/10 v/v, nine peaks are observed however the
shape of the peaks indicate that they consist of a number of coeluting components.
The capacity factor was again determined for the first eluting component and was 0.4
for the 80/20 v/v and 85/15 v/v mobile phases and 0.5 for the 90/10 v/v, indicating
that slightly longer retention occurred with the 90/10 v/v mobile phase than with the
other two.
Amino Column:
Using the amino column and the hexane/IPA mobile phases very little separation of
the various components in the sample is achieved as shown in figure 2.12. When
hexane/IPA 95/5 v/v was used it appears that fewer peaks are observed than with the
previous mobile phase (hexane/IPA 90/10 v/v) indicating that not everything is
eluting from the column. Using hexane/THF essentially no separation is achieved
with any of the mobile phase choices, the chromatograms are shown in figure 2.13.
One major peak is observed followed by a few smaller peaks for all three mobile
phases studied. The k' value for the first eluting major peak was found to be small and
similar for all the mobile phases, therefore again the changes in mobile phase had no
effect on the retention of this component.

64
2.4.3 Normal Phase Chromatography – Gradient Elution:
Limited separation was obtained for the SMO sample using isocratic normal phase
chromatography. Due to the range of polarity expected in the sample, changing the
polarity of the solvent during the separation using gradient elution was felt to be
advantageous. This was investigated for the bonded phase columns only because
silica columns can not be used with a gradient due to solvent demixing.
The amino, cyano and diol columns previously used were operated at room
temperature with the following gradients:
i) 100 % Hexane for 5 minutes to 100 % IPA in 30 minutes
100 % IPA held for 5 minutes
ii) 100 % Hexane for 5minutes to 50/50 v/v hexane/ IPA in 30 minutes
to 100 % IPA in 5 minutes (held for 5 minutes)
iii) 100 % Hexane for 5 minutes to 100 % THF in 30 minutes
100 % THF held for 5 minutes
Amino Column:
The chromatograms obtained for the amino column using the initial gradients are
shown in figure 2.14. Using the two gradients based on hexane/IPA very little
separation was obtained, with only one major peak observed, with a capacity factor of
3.8 with the first gradient and 4.1 with the second gradient tried. The decrease in
mobile phase polarity did increase the retention slightly but observation of the
chromatogram showed it did not result in an increase in separation of components,
because both gradients only showed a few small peaks after the main peak. However
using the hexane/THF gradient a number of groups of partially resolved peaks were

65
observed, with a capacity factor of 0.4 for the first peak observed, showing that
retention is very different to the IPA gradients because with the hexane/THF gradient
the first component has little retention
Cyano Column:
The chromatograms obtained for the sorbitan mono oleate sample with a cyano
column are shown in figure 2.15. The chromatography obtained was found to be
poor. The mobile phases using hexane and IPA show a small broad peak followed by
a group of peaks thought to consist of a number of partially separated components.
The hexane and THF mobile phases show four groups of partially resolved peaks.
However the sample is thought to consist of a number of components indicating very
little separation is obtained. The baseline for all three chromatograms is also noisy.
Diol Column:
The chromatograms obtained for the sorbitan mono oleate with the diol column are
shown in figure 2.16. Using the first hexane/IPA gradient, some separation was
observed, with three small broad peaks observed followed by two groups of peaks.
Using a slightly less polar gradient the separation is increased slightly with the second
group of peaks better resolved than with the first gradient. However the hexane/THF
gradient gives better separation, again three peaks are observed before 10 minutes and
then a group of peaks, which appear to consist of partially resolved components. The
capacity factor for the first eluting component was 0.4 for all three gradients,
indicating the differing polarities had no effect on retention of the first eluting
components, however observation of the chromatograms shows differences in later
eluting components with the different gradients, however due to the lack of

66
identification of the peaks the capacity factor was not calculated for the other peaks
due to uncertainty that the capacity factor for the same component was being
determined and compared.
2.5 Conclusion:
From the preliminary work carried out using a range of columns to analyse the sample
of sorbitan mono oleate, prepared from high purity (>99 %) oleic acid it can be
concluded that:
i) A reverse phase column is not suitable. From the solubility study it was
established that the expected components are not soluble in water and
therefore water could not be used as a solvent in the mobile phase. However
using non-aqueous reverse phase (NARP) HPLC, all the components eluted in
less then 5 minutes, with very little separation.
ii) The cyano column gave poor chromatography, with both isocratic and gradient
mobile phases and therefore is also an unsuitable column.
iii) Using the silica column, minimal separation was achieved, although with
hexane/THF 85/15 v/v, two distinct groups of partially resolved peaks, with a
few smaller peaks were observed. However when the polarity was decreased
further in an attempt to increase absorption and therefore separation, less
peaks were observed, indicating components were being retained by the
column.
iv) Although little separation was achieved using the amino column with both the
isocratic and hexane/IPA gradients, some separation was achieved using the
hexane/THF based gradient. Therefore this may merit pursuing further.

67
v) With the diol column and the isocratic mobile phases 95/5 v/v hexane/IPA and
90/10 v/v hexane/THF, groups of partially resolved peaks were observed.
Some separation was also obtained with all three of the screening gradients.
The diol column appears from the initial work to be the most promising, although the
amino column using a hexane/THF gradient may also be worth pursuing. The HPLC
chromatograms obtained with the amino and diol columns and hexane/THF gradient
is already superior to that reported in the literature.
The following pages are chromatograms detailed earlier in the text. No identification
of the peaks has been attempted, because the object of the study was to examine
separation rather than identify components.

68
min2.5 5 7.5 10 12.5
mAU
0
250
500
750
1000
1250
1500
1750
2000
Hexane/IPA 20/80 v/v
min5 10 15
mAU
0
200
400
600
800
1000
1200
1400
Hexane/IPA 50/50 v/v
min5 10 15 20 25
mAU
100
200
300
400
500
600
700
Hexane/IPA 80/20 v/v
Figure 2.2: HPLC Chromatograms of Sorbitan Mono Oleate Prepared from
High Purity Oleic Acid Analysed Using a Silica Column
and Hexane/IPA Mobile Phases
Time
Time
Time
Sig
nal
S
ignal
S
ignal

69
min5 10 15 20 25
mAU
0
100
200
300
400
500
600
700
Hexane/IPA 85/15 v/v
min5 10 15 20 25
mAU
100
200
300
400
500
600
Hexane/IPA 90/10 v/v
min5 10 15 20 25
mAU
0
200
400
600
800
1000
Hexane/IPA 95/5 v/v
Figure 2.3: HPLC Chromatograms of Sorbitan Mono Oleate Prepared from High Purity
Oleic Acid, Analysed Using a Silica Column and Hexane/IPA Mobile Phases
Time
Sig
nal
S
ign
al
Time
Sig
nal
Time
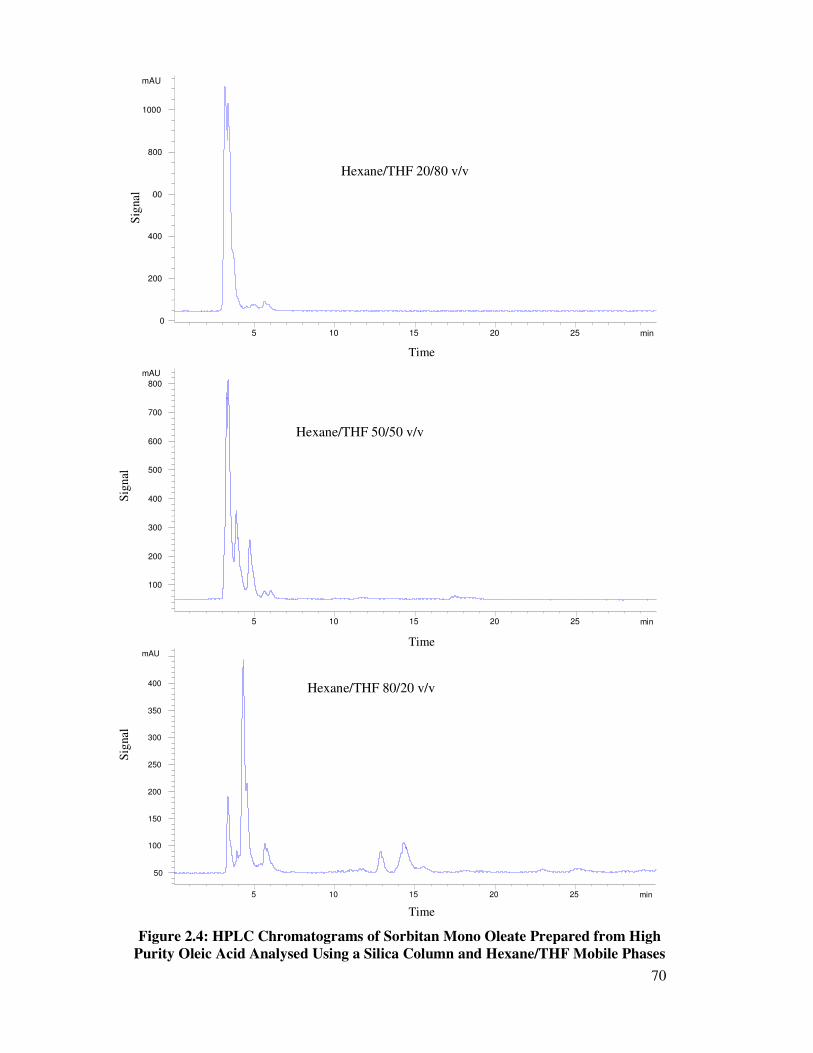
70
min5 10 15 20 25
mAU
0
200
400
600
800
1000
min5 10 15 20 25
mAU
100
200
300
400
500
600
700
800
min5 10 15 20 25
mAU
50
100
150
200
250
300
350
400
Hexane/THF 20/80 v/v
Hexane/THF 80/20 v/v
Hexane/THF 50/50 v/v
Figure 2.4: HPLC Chromatograms of Sorbitan Mono Oleate Prepared from High
Purity Oleic Acid Analysed Using a Silica Column and Hexane/THF Mobile Phases
Time
Sig
nal
Time
Sig
nal
Time
Sig
nal

71
min5 10 15 20 25
mAU
50
75
100
125
150
175
200
225
Hexane/THF 85/15 v/v
min10 20 30 40
mAU
50
100
150
200
250
Hexane/THF 90/10 v/v
Figure 2.5: HPLC Chromatograms of Sorbitan Mono Oleate
Prepared from High Purity Oleic Acid
Analysed Using a Silica Column and Hexane/THF Mobile Phases
Time
Sig
nal
Time
Sig
nal

72
min2.5 5 7.5 10 12.5
mAU
0
250
500
750
1000
1250
1500
1750
min5 10 15
mAU
0
200
400
600
800
1000
1200
min5 10 15
mAU
50
100
150
200
250
300
350
400
450
Hexane/IPA 20/80 v/v
Hexane/IPA 50/50 v/v
Hexane/IPA 80/20 v/v
Figure 2.6: HPLC Chromatograms of Sorbitan Mono Oleate Prepared from
High Purity Oleic Acid Analysed Using a Cyano Column
and Hexane/IPA Mobile Phases
Time
Time
Time
Sig
nal
S
ignal
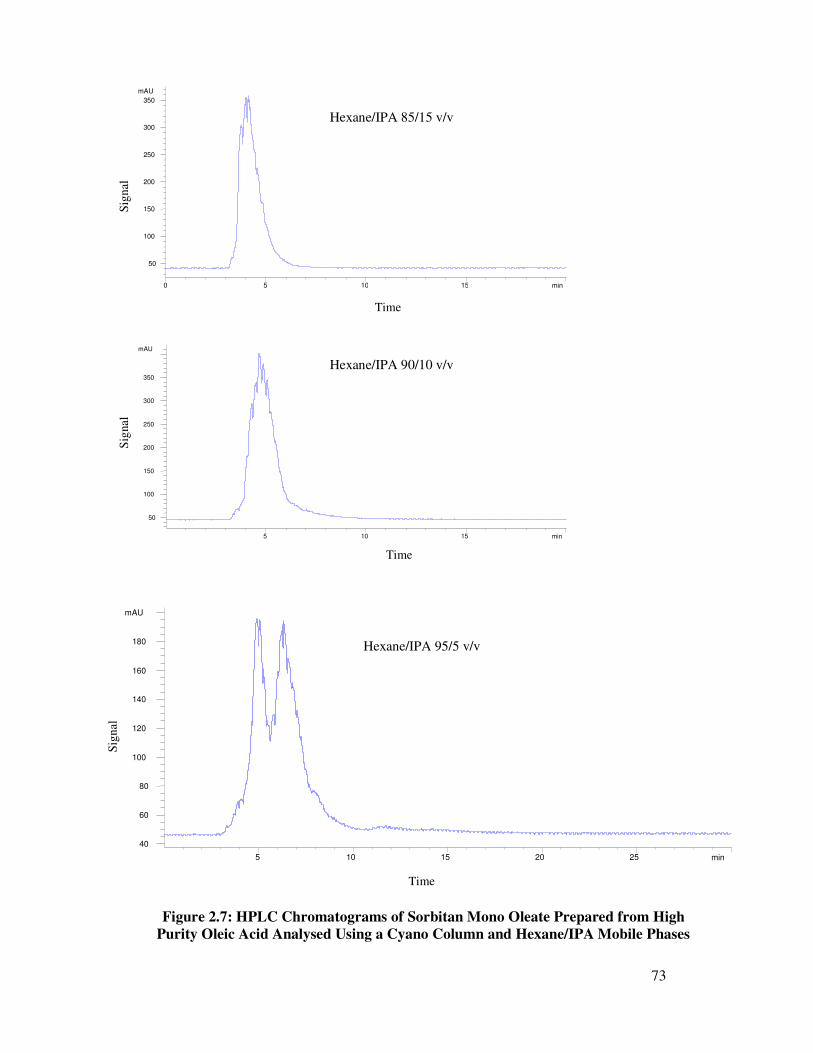
73
min0 5 10 15
mAU
50
100
150
200
250
300
350
min5 10 15
mAU
50
100
150
200
250
300
350
min5 10 15 20 25
mAU
40
60
80
100
120
140
160
180
Figure 2.7: HPLC Chromatograms of Sorbitan Mono Oleate Prepared from High
Purity Oleic Acid Analysed Using a Cyano Column and Hexane/IPA Mobile Phases
Hexane/IPA 85/15 v/v
Hexane/IPA 90/10 v/v
Hexane/IPA 95/5 v/v
Time
Time
Sig
nal
S
ignal
S
ign
al
Time

74
min5 10 15 20 25
mAU
50
100
150
200
250
300
Hexane 50/THF50
min5 10 15 20 25
mAU
100
200
300
400
500
min5 10 15 20 25
mAU
50
100
150
200
250
300
Hexane /THF 20/80 v/v
Hexane/ THF 80/20 v/v
Figure 2.8: HPLC Chromatograms of Sorbitan Mono Oleate Prepared from
High Purity Oleic Acid Analysed Using a Cyano Column and Hexane/THF
Mobile Phases
Time
Sig
nal
S
ign
al
Time
Time
Sig
nal
Hexane/THF 50/50 v/v

75
min5 10 15
mAU
50
100
150
200
250
300
min5 10 15 20 25
mAU
50
100
150
200
250
300
350
400
Figure 2.9: HPLC Chromatograms of Sorbitan Mono Oleate Prepared from High
Purity Oleic Acid Analysed Using a Cyano Column
and Hexane/THF Mobile Phases
Hexane/THF 85/15 v/v
Hexane/THF 90/10 v/v
Time
Time
Sig
nal
S
ign
al

76
min5 10 15
mAU
0
250
500
750
1000
1250
1500
1750
2000
min5 10 15 20 25
mAU
0
200
400
600
800
1000
1200
1400
1600
min5 10 15
mAU
0
200
400
600
800
1000
min5 10 15 20 25
mAU
100
200
300
400
500
600
Hexane/IPA 80/20 v/v
Hexane/IPA 85/15 v/v
Hexane/IPA 90/10 v/v
Hexane/IPA 95/5 v/v
Figure 2.10: HPLC Chromatograms of Sorbitan Mono Oleate Prepared
from High Purity Oleic Acid Analysed Using a Diol Column and
Hexane/IPA Mobile Phases
Time
Sig
nal
Time
Sig
nal
Time
Sig
nal
S
ignal
Time
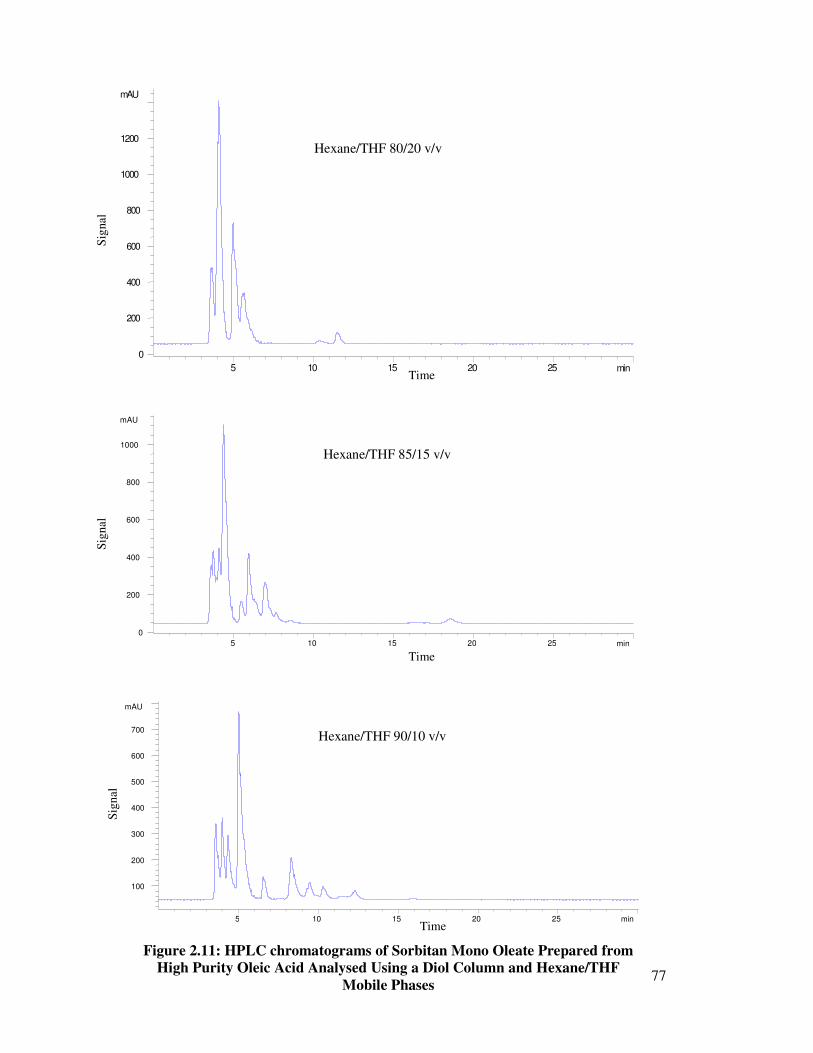
77
min5 10 15 20 25
mAU
0
200
400
600
800
1000
1200
min5 10 15 20 25
mAU
0
200
400
600
800
1000
min5 10 15 20 25
mAU
100
200
300
400
500
600
700
Hexane/THF 80/20 v/v
Hexane/THF 85/15 v/v
Hexane/THF 90/10 v/v
Figure 2.11: HPLC chromatograms of Sorbitan Mono Oleate Prepared from
High Purity Oleic Acid Analysed Using a Diol Column and Hexane/THF
Mobile Phases
Time
Sig
nal
S
ign
al
Time
Sig
nal
Time

78
min5 10 15
mAU
100
200
300
400
500
min5 10 15 20 25
mAU
100
200
300
400
500
600
700
min5 10 15 20 25
mAU
100
200
300
400
500
600
min5 10 15 20 25
mAU
100
200
300
400
500
600
Hexane/IPA 80/20 v/v
Hexane/IPA85/15 v/v
Hexane/IPA 90/10 v/v
Hexane/IPA 95/5 v/v
Figure 2.12: HPLC Chromatograms of Sorbitan Mono Oleate Prepared from
High Purity Oleic Acid Analysed Using an Amino Column and Hexane/IPA
Mobile Phases
Sig
nal
Time
Sig
nal
Time
Sig
nal
Time
Time
Sig
nal

79
min5 10 15 20 25
mAU
50
100
150
200
250
300
350
min10 20 30
mAU
50
100
150
200
250
300
350
min10 20 30
mAU
50
100
150
200
250
Hexane/THF 80/20 v/v
Hexane/THF 85/15 v/v
Hexane/THF 90/10 v/v
Figure 2.13: HPLC Chromatograms of Sorbitan Mono Oleate Prepared from High
Purity Oleic Acid Analysed Using an Amino Column and Hexane/THF Mobile Phases
Time
Sig
nal
Time
Sig
nal
S
ign
al
Time
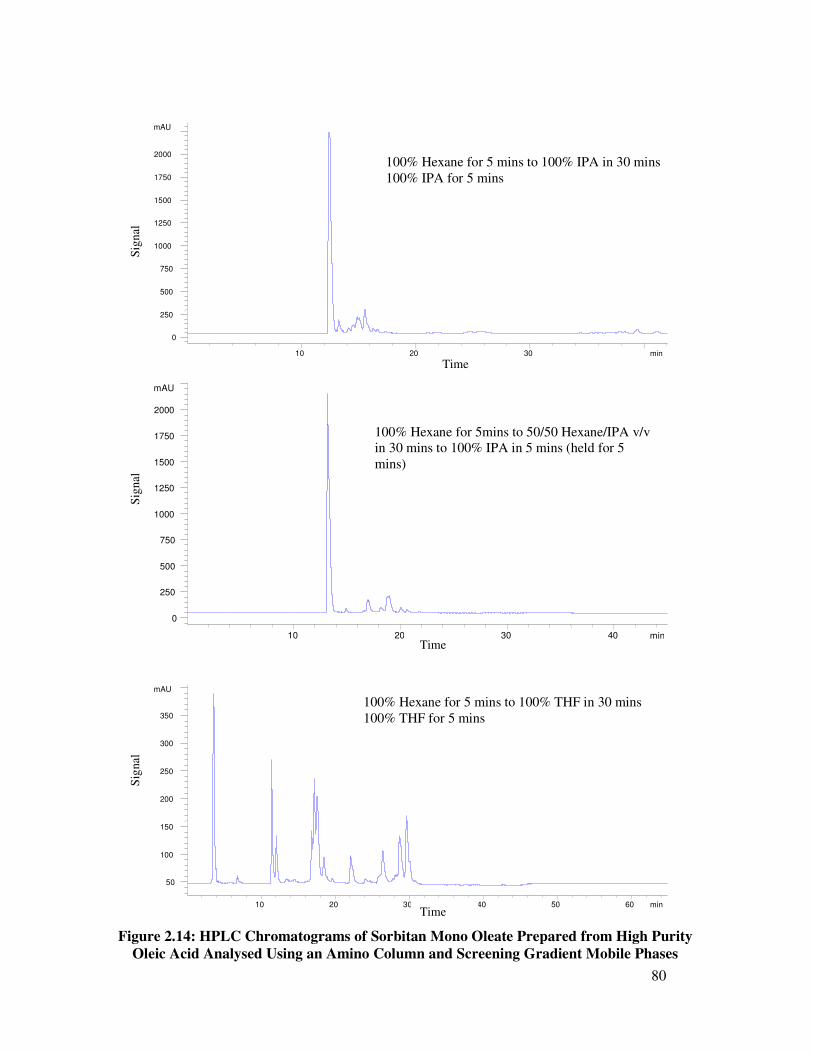
80
min10 20 30 40 50 60
mAU
50
100
150
200
250
300
350
Figure 2.14: HPLC Chromatograms of Sorbitan Mono Oleate Prepared from High Purity
Oleic Acid Analysed Using an Amino Column and Screening Gradient Mobile Phases
100% Hexane for 5 mins to 100% THF in 30 mins
100% THF for 5 mins
min10 20 30
mAU
0
250
500
750
1000
1250
1500
1750
2000
100% Hexane for 5 mins to 100% IPA in 30 mins
100% IPA for 5 mins
min10 20 30 40
mAU
0
250
500
750
1000
1250
1500
1750
2000
100% Hexane for 5mins to 50/50 Hexane/IPA v/v
in 30 mins to 100% IPA in 5 mins (held for 5
mins)
Time
Sig
nal
S
ign
al
Time
Time
Sig
nal

81
min10 20 30
mAU
100
200
300
400
500
600
700
min10 20 30 40
mAU
50
100
150
200
250
300
350
min0 10 20 30
mAU
50
100
150
200
250
300
Figure 2.15: HPLC Chromatograms of Sorbitan Mono Oleate Prepared
from High Purity Oleic Acid Analysed Using a Cyano Column and
Screening Gradient Mobile Phases
100% Hexane for 5 mins to 100% IPA in 30 mins
100% IPA for 5 mins
100% Hexane for 5 mins to 50/50 v/v Hexane/IPA in 30
mins to 100% IPA in 5 mins (held for 5 mins)
100% Hexane for 5 mins to 100% THF in 30 mins
100% THF for 5 mins
Time
Sig
nal
S
ignal
Time
Sig
nal
Time
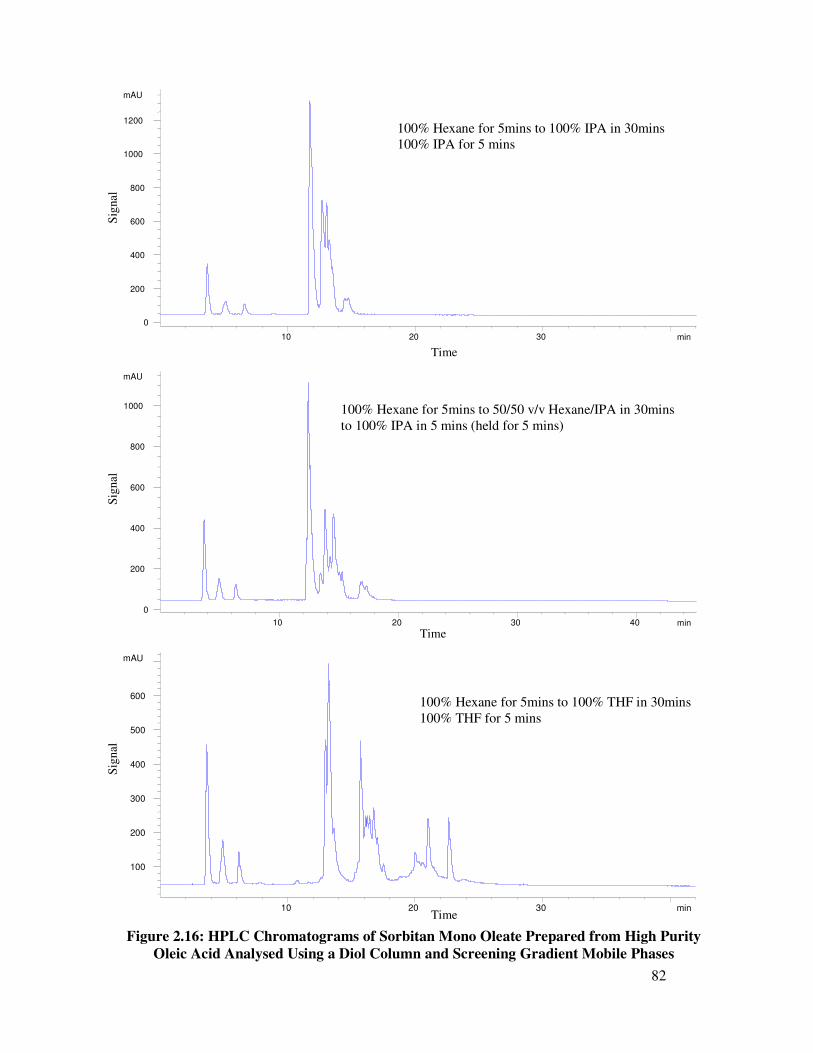
82
min10 20 30
mAU
0
200
400
600
800
1000
1200
min10 20 30 40
mAU
0
200
400
600
800
1000
min10 20 30
mAU
100
200
300
400
500
600
100% Hexane for 5mins to 100% IPA in 30mins
100% IPA for 5 mins
100% Hexane for 5mins to 50/50 v/v Hexane/IPA in 30mins
to 100% IPA in 5 mins (held for 5 mins)
100% Hexane for 5mins to 100% THF in 30mins
100% THF for 5 mins
Figure 2.16: HPLC Chromatograms of Sorbitan Mono Oleate Prepared from High Purity
Oleic Acid Analysed Using a Diol Column and Screening Gradient Mobile Phases
Time
Sig
nal
Time
Sig
nal
Time
Sig
nal

83
3. TLC Analysis for the Selection of Mobile Phases for HPLC:
TLC is a simple, rapid and inexpensive method of separation. TLC can only be used
in an isocratic mode and although the process of separation is different to HPLC, it is
thought to serve well as a pilot procedure for HPLC. TLC allows the detection of all
the components in the sample including the strongly retained ones, therefore it is
useful for solvent selection for HPLC. Solvent which will remove strongly absorbed
components from the top of a HPLC column can be found and can be used to clean
the column between sample injections. Due to the variation in number of peaks
observed from the analysis carried out in chapter 2 and therefore the uncertainty of
whether all the possible components eluted from the columns, it was felt TLC analysis
of the sorbitan esters, using normal phase plates that correlated to the HPLC columns
already investigated, would be useful prior to further HPLC method development, to
establish if material was being strongly retained.
Normal phase plates are strongly polar and generally the interaction in the mobile
phase is complimentary to those in the stationary phase, therefore dispersive solvents
are selected. To reduce solute retention, the polar interactions between the solutes and
mobile phase must be increased, to compete with the polar interactions between the
solute and stationary phase. This is achieved by increasing the polarity of the mobile
phase, this will also absorb to the stationary phase deactivating it. For this reason a
range of commonly used solvents and blends of varying polarity were investigated.

84
3.1 Experimental:
1 % solutions of the following samples were prepared in IPA and 0.5 µl applied onto
the TLC plates (10 x 10 cm).
1 – Manufactured Sorbitan Mono Oleate
2 – Sorbitan Mono Oleate prepared from high purity oleic acid
3 – Sorbitan Oleate, high sorbitan content, prepared from high purity oleic acid
4 – Isosorbide Dioleate, prepared from high purity oleic acid
5 – Sorbitol Oleate, prepared from high purity oleic acid
6 – Isosorbide Oleate, prepared from high purity oleic acid
7 – Oleic Acid
The numbers allocated to the samples above have also been used to identify the
samples on the TLC plates in figures 3.1 to 3.8. Esters containing essentially one
polyol were also analysed to try and establish the Rf of the individual components
expected in manufactured sorbitan esters, if separation was obtained.
The TLC plates used for the screening experiments were TLC Aluminium sheet, silica
gel 60 (Merck), HPTLC - Diol F254 (Merck), HPTLC – CN (Techware), HPTLC –
NH2 (Techware) which correlate to the stationary phases used in the HPLC work
(chapter 2).
The solvent systems used were hexane (Fisher – HPLC grade), toluene (Fisher –
HPLC grade), diethyl ether (Fisher – HPLC grade), dichloromethane (Fisher – HPLC
grade), tetrahydrofuran (VWR – HPLC grade), ethyl acetate (Fisher – HPLC grade),
acetonitrile (Fisher – HPLC grade), isopropanol (Fisher – HPLC grade), methanol
85
(Fisher – HPLC grade), DCM/methanol 80/20 v/v, hexane/THF 50/50, hexane/IPA
50/50 v/v.
The solvent system selected was added to the tank, lined with filter paper to achieve
saturation and the plate placed into it. The solvent was allowed to ascend 7 – 8 cm
and then the plate was developed by dipping in phosphomolybdic acid solution
and then drying with a hot-air drier. Phosphomolybdic acid was selected because it
gives blue spots against a green/yellow background for a large range of organic
compounds and the colour remains stable for long periods. Visual inspections of the
developed plates were made, to establish if separation of a range of components had
been achieved.
3.2 Amino Plates:
The TLC plates obtained for the samples analysed with the amino plates are shown in
figures 3.1 and 3.2. It can be seen that using hexane as the solvent no separation was
obtained for any of the samples, all the components were absorbed strongly to the
stationary phase and remained at the origin. The other solvents resulted in streaks
rather than distinct spots across all or the majority of the plate for most samples under
analysis, this may be due to the large number of components in the samples. All of
the solvents tried show some components strongly absorbed and remaining at the
origin for all samples. The oleic acid (sample 7) showed a spot that remained at the
origin using all the solvents, no movement was observed with any solvent indicating it
is strongly attracted to the sorbent. If this was repeated with HPLC, material would
be retained by the column and would lead to a very short lifetime of the column.
Therefore although the amino HPLC column looked worth investigating further, from
86
the work detailed in chapter 2, TLC shows that it may have severe limitations if
material is retained by the column.
3.3 Cyano Plates:
The TLC plates obtained for the samples with the cyano plates are shown in figures
3.3 and 3.4.
The non-polar solvent (hexane) resulted in components being strongly retained by the
stationary phase and no separation obtained for any sample. With the more polar
solvents components showed less affinity for the stationary phase and solubilised in
the mobile phase and eluted to the solvent front. However using the mid range
polarity solvents, particularly toluene and dichloromethane (DCM), distinct spots
were observed showing separation of various components in the samples, although
identification of the spots was not possible.
3.4 Silica and Diol Plates:
Both the silica and diol plates showed a range of separation with distinct spots
observed, the chromatograms obtained are shown in figures 3.5 to 3.8. The
chromatographic behaviour of the plates are similar, which will probably be due to the
fact the retention mechanism occurring is similar. Both plates have hydroxyl groups,
in the diol plate the functional groups are alcoholic residues and with silica the active
sites are silanol groups.
Some separation of the polyol esters (samples 1 – 6) was obtained with most solvents,
although identification of the spots in the SMO (sample 1) using the single polyol

87
esters was not possible. With hexane everything remained at the origin and with THF
all the components eluted to the solvent front. With toluene and dichloromethane
some material remained at the origin and if this occurred on the column would result
in a shorter lifetime of the column. If the behaviour seen is reproduced with HPLC,
THF will be a useful solvent to ensure all components are eluted from the column,
prior to the next injection. And hexane may be useful for varying the polarity of the
mobile phase. With the diol plate isopropanol also removes material from the origin
and therefore may be another useful solvent.
3.5 Conclusions from TLC Screening:
TLC did not result in separation of all of the various components of sorbitan esters
with any of the plates and mobile phases tried. When separation of some of the
components was obtained, identification of the various spots was not possible.
The TLC analysis showed that:
- with amino plates some components always remain at the origin. If this is
repeated with HPLC the component will be retained by the column and a true
composition of the sample will not be obtained. The column lifetime will also be
shorter.
- with the cyano column most solvents eluted all components to the solvent front,
but DCM and toluene gave some separation of the various components in the
esters. However initial HPLC work concluded that the cyano column was not a
viable stationary phase.
- very similar separation was obtained with the diol and silica plates, this is
probably due to similar retention mechanisms occurring. TLC did not result in

88
separation of all the various components and identification of the various spots
was not possible.
Using the information obtained from the solubility study, initial HPLC study and the
TLC study it appears that a diol stationary phase HPLC column is the one worth
pursuing with THF and IPA as polar solvents and hexane as the non polar solvent.
The diol and silica stationary phases on TLC gave similar results but for HPLC the
diol stationary phase would be favoured because gradients can be used.

89
Hexane Toluene
Diethyl ether Dichloromethane
Tetrahydrofuran Ethyl acetate
Figure 3.1: TLC Chromatograms of Polyol Esters of Oleic Acid Using Amino plates
and Various Mobile Phases
1 2 3 4 5 6 7 1 2 3 4 5 6 7
1 2 3 4 5 6 7 1 2 3 4 5 6 7
1 2 3 4 5 6 7 1 2 3 4 5 6 7
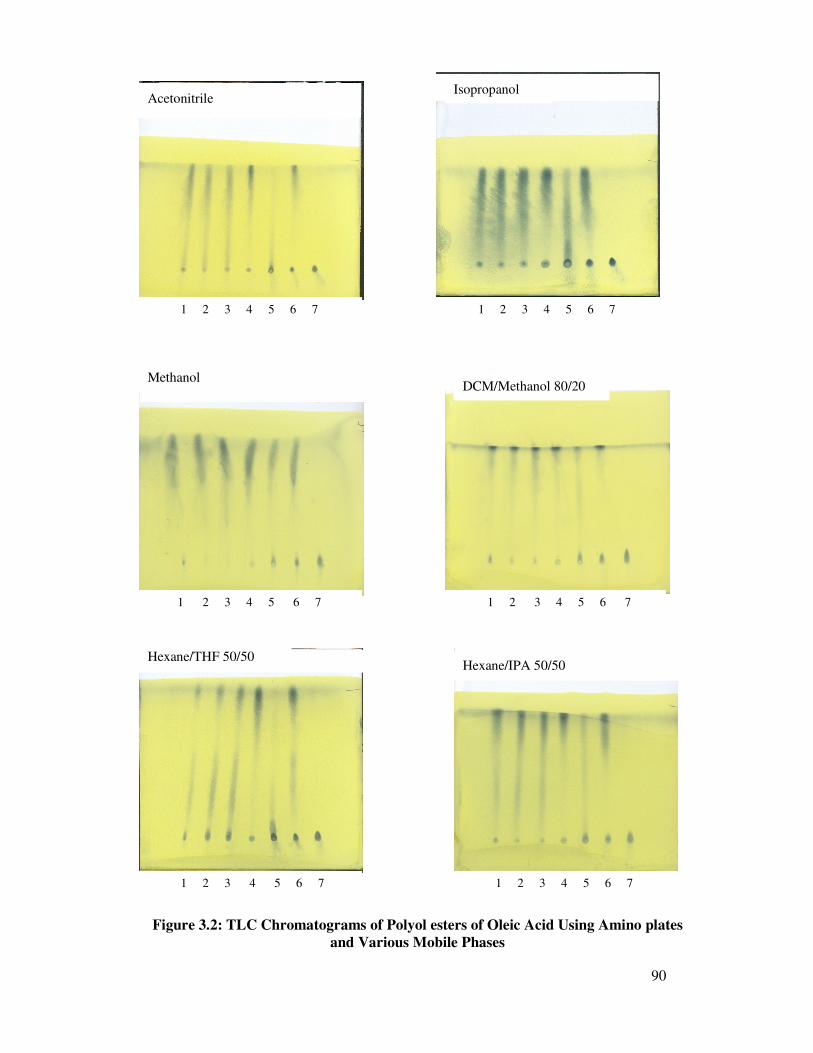
90
Figure 3.2: TLC Chromatograms of Polyol esters of Oleic Acid Using Amino plates
and Various Mobile Phases
Acetonitrile Isopropanol
Methanol DCM/Methanol 80/20
v/v
Hexane/THF 50/50 Hexane/IPA 50/50
1 2 3 4 5 6 7 1 2 3 4 5 6 7
1 2 3 4 5 6 7 1 2 3 4 5 6 7
1 2 3 4 5 6 7 1 2 3 4 5 6 7

91
Hexane Toluene
Diethyl ether
Dichloromethane
Ethyl acetate
Figure 3.3 TLC Chromatograms of Polyol Esters of Oleic Acid Using Cyano Plates and
Various Mobile Phases
Tetrahydrofuran
1 2 3 4 5 6 7 1 2 3 4 5 6 7
1 2 3 4 5 6 7 1 2 3 4 5 6 7
1 2 3 4 5 6 7 1 2 3 4 5 6 7

92
Acetonitrile Isopropanol
Methanol DCM/Methanol 80/20
Hexane/THF 50/50
Figure 3.4: TLC Chromatograms of Polyol Esters of Oleic Acid Using Cyano
Plates and Various Mobile Phases
Hexane/IPA 50/50
1 2 3 4 5 6 7 1 2 3 4 5 6 7
1 2 3 4 5 6 7 1 2 3 4 5 6 7
1 2 3 4 5 6 7 1 2 3 4 5 6 7

93
Hexane Toluene
Diethyl ether Dichloromethane
Tetrahydrofuran
Ethyl acetate
Figure 3.5: TLC Chromatograms of Polyol Esters of Oleic Acid Using Diol Plates and
Various Mobile Phases
1 2 3 4 5 6 7 1 2 3 4 5 6 7
1 2 3 4 5 6 7 1 2 3 4 5 6 7
1 2 3 4 5 6 7 1 2 3 4 5 6 7

94
Acetonitrile Isopropanol
Methanol DCM/Methanol 80/20
Hexane/THF 50/50
Hexane/IPA 50/50
Figure 3.6: TLC Chromatograms of Polyol Esters of Oleic Acid Using Diol Plates
and Various Mobile Phases
1 2 3 4 5 6 7 1 2 3 4 5 6 7
1 2 3 4 5 6 7 1 2 3 4 5 6 7
1 2 3 4 5 6 7 1 2 3 4 5 6 7

97
4. Further HPLC Analysis of Sorbitan Mono Oleate Prepared from High Purity
Oleic Acid:
The initial HPLC work detailed in chapter 2 was used to establish the best column for
separation of the various components in sorbitan mono oleate. The work showed that
normal phase chromatography was required for any separation to occur and of the
various columns tried the best column appeared to be a diol column with a gradient
solvent system. TLC was investigated as a screening tool for HPLC in chapter 3 and
the diol stationary phase again appeared to be one of the best, the solvents that looked
the most promising with the diol stationary phase were THF and IPA. Hexane
showed no separation and was therefore felt to be good as the non-polar solvent.
From the solubility study carried out in chapter 2 on a range of polyol esters based on
oleic acid the esters were also found to be soluble in these solvents.
Sorbitan mono oleate prepared from high purity oleic acid was therefore analysed
using the diol column and gradient elutions based on hexane/IPA and hexane/THF.
4.1 Hexane/IPA Gradients:
Two hexane/IPA based gradient mobile phases were tried in chapter 2 which started
with a low polarity by using 100 % hexane and the polarity increased over 30 minutes
to 100 % IPA or 50/50 v/v hexane/IPA. The resulting chromatograms showed very
little separation, both showed three small peaks, followed by a large peak and then a
group of partially resolved peaks. The mobile phases were therefore too polar and
components in the sample were favouring the mobile phase and passing through the
column with little separation. It was therefore felt less polar gradients were required
to increase retention of the components. The first gradient tried was:
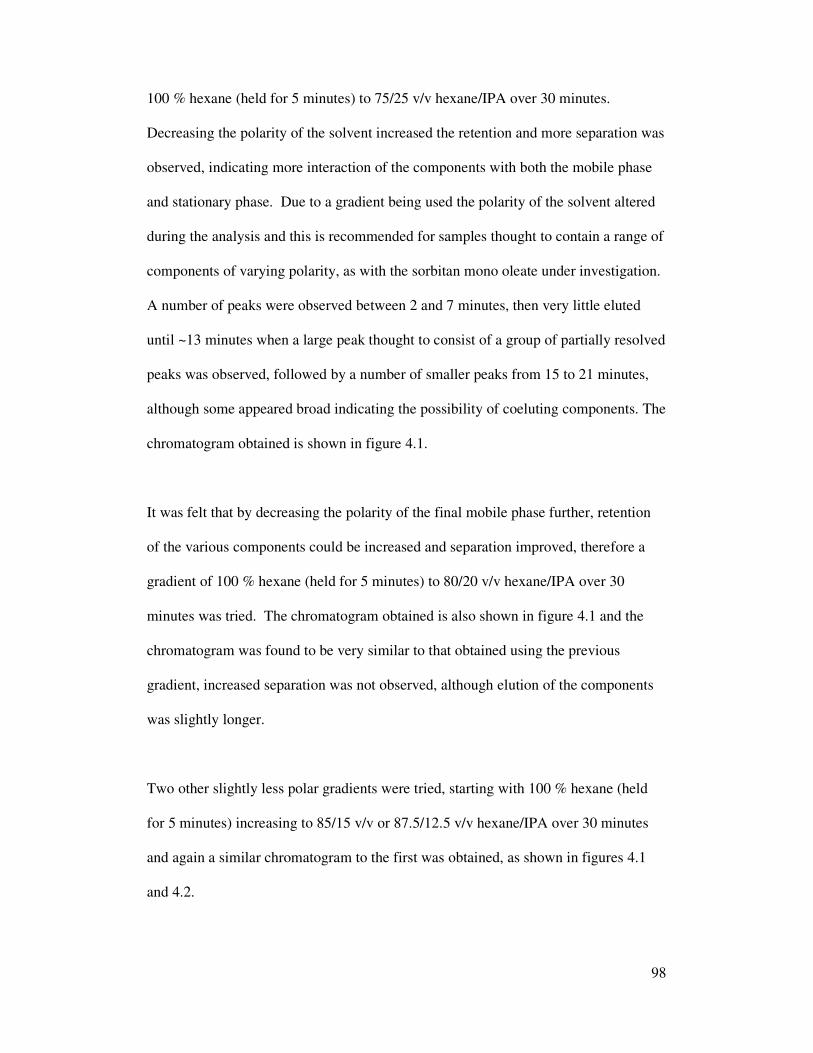
98
100 % hexane (held for 5 minutes) to 75/25 v/v hexane/IPA over 30 minutes.
Decreasing the polarity of the solvent increased the retention and more separation was
observed, indicating more interaction of the components with both the mobile phase
and stationary phase. Due to a gradient being used the polarity of the solvent altered
during the analysis and this is recommended for samples thought to contain a range of
components of varying polarity, as with the sorbitan mono oleate under investigation.
A number of peaks were observed between 2 and 7 minutes, then very little eluted
until ~13 minutes when a large peak thought to consist of a group of partially resolved
peaks was observed, followed by a number of smaller peaks from 15 to 21 minutes,
although some appeared broad indicating the possibility of coeluting components. The
chromatogram obtained is shown in figure 4.1.
It was felt that by decreasing the polarity of the final mobile phase further, retention
of the various components could be increased and separation improved, therefore a
gradient of 100 % hexane (held for 5 minutes) to 80/20 v/v hexane/IPA over 30
minutes was tried. The chromatogram obtained is also shown in figure 4.1 and the
chromatogram was found to be very similar to that obtained using the previous
gradient, increased separation was not observed, although elution of the components
was slightly longer.
Two other slightly less polar gradients were tried, starting with 100 % hexane (held
for 5 minutes) increasing to 85/15 v/v or 87.5/12.5 v/v hexane/IPA over 30 minutes
and again a similar chromatogram to the first was obtained, as shown in figures 4.1
and 4.2.

99
5 1 0 1 5 2 0 25 3 0
m A U
0
20 0
40 0
60 0
80 0
1 00 0
1 20 0
5 10 15 20 25 30
mAU
100
200
300
400
500
600
700
min5 10 15 20 25 30
mAU
100
200
300
400
500
600
100% Hexane for 5 mins to
75/25 v/v Hexane IPA in 30 mins
100% Hexane for 5 mins to
80/20 v/v Hexane IPA in 30 mins
100% Hexane for 5 mins to
85/15 v/v Hexane IPA in 30 mins
Figure 4.1: HPLC Chromatograms Obtained for Sorbitan Mono Oleate Prepared from
High Purity Oleic Acid Using a Diol Column and Gradient Mobile Phases Based on
Hexane/IPA
Sig
nal
Time
Time
Sig
nal
Time
Sig
nal

100
min5 10 15 20 25 30
mAU
100
200
300
400
500
600
700
800
min5 10 15 20 25 30
mAU
0
200
400
600
800
Figure 4.2: HPLC Chromatograms Obtained for Sorbitan Mono Oleate
Prepared from High Purity Oleic Acid Using a Diol Column and
Gradient Mobile Phases Based on Hexane/IPA
100% Hexane for 5 mins to
87.5/12.5 v/v Hexane/IPA in 30
mins
100% Hexane for 5 mins to
90/10 v/v Hexane/IPA in 30 mins
Time
Sig
nal
Time
Sig
nal

101
The final gradient based on hexane/IPA tried was 100 % hexane (held for 5 minutes)
to 90/10 v/v hexane/IPA over 30 minutes and the resulting chromatogram is shown in
figure 4.2. The chromatogram shows five peaks which elute in less than 6 minutes,
this is very different to the other chromatograms obtained with hexane/IPA gradients
which showed more peaks over a longer time. The lack of peaks indicates that the
mobile phase is not polar enough and a large number of components have been
adsorbed to the column rather than dissolving in the mobile phase and being eluted.
The capacity factor was determined for the first eluting peak with the different
gradients, however the retention time of this component was found to be the same as
the estimated value for the unretained solute and therefore a k' value of 0 was
calculated, indicating no retention of the first component or components. Decreasing
the mobile phase polarity can increase retention of a solute in normal phase
chromatography, however this was not observed for the early eluting components
with the hexane/IPA gradients.
4.2 Hexane/THF Gradients:
The other solvent which looked possible as a mobile phase for separation of sorbitan
ester species was THF from the initial work detailed in chapters 2 and 3. The initial
gradient based on hexane and THF detailed in chapter 2 (chromatogram fig. 2.16)
showed a number of peaks, although a number of groups of partially resolved peaks
were noted, rather than base line resolved peaks. It was felt that by using a less polar
final solvent, retention and therefore separation could be improved. The first gradient
tried was 100 % hexane (held for 5 minutes) increased to 50/50 v/v hexane/THF over
30 minutes, the chromatogram obtained is shown in figure 4.3. The chromatogram
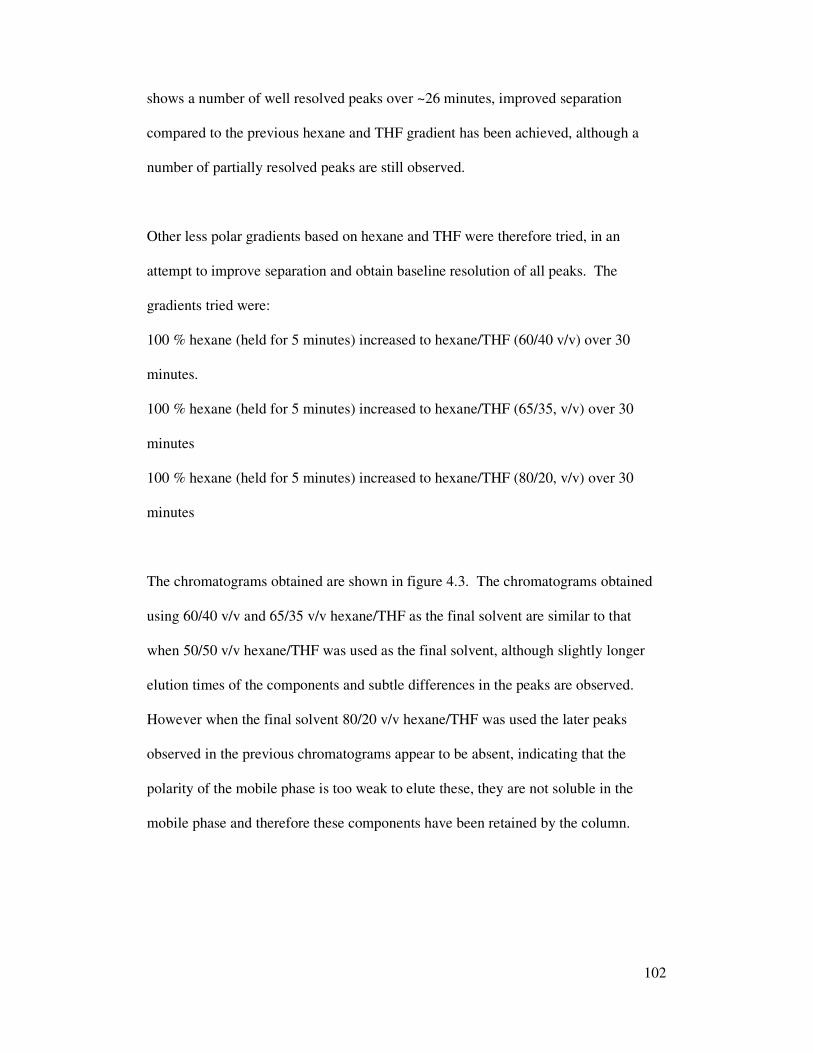
102
shows a number of well resolved peaks over ~26 minutes, improved separation
compared to the previous hexane and THF gradient has been achieved, although a
number of partially resolved peaks are still observed.
Other less polar gradients based on hexane and THF were therefore tried, in an
attempt to improve separation and obtain baseline resolution of all peaks. The
gradients tried were:
100 % hexane (held for 5 minutes) increased to hexane/THF (60/40 v/v) over 30
minutes.
100 % hexane (held for 5 minutes) increased to hexane/THF (65/35, v/v) over 30
minutes
100 % hexane (held for 5 minutes) increased to hexane/THF (80/20, v/v) over 30
minutes
The chromatograms obtained are shown in figure 4.3. The chromatograms obtained
using 60/40 v/v and 65/35 v/v hexane/THF as the final solvent are similar to that
when 50/50 v/v hexane/THF was used as the final solvent, although slightly longer
elution times of the components and subtle differences in the peaks are observed.
However when the final solvent 80/20 v/v hexane/THF was used the later peaks
observed in the previous chromatograms appear to be absent, indicating that the
polarity of the mobile phase is too weak to elute these, they are not soluble in the
mobile phase and therefore these components have been retained by the column.
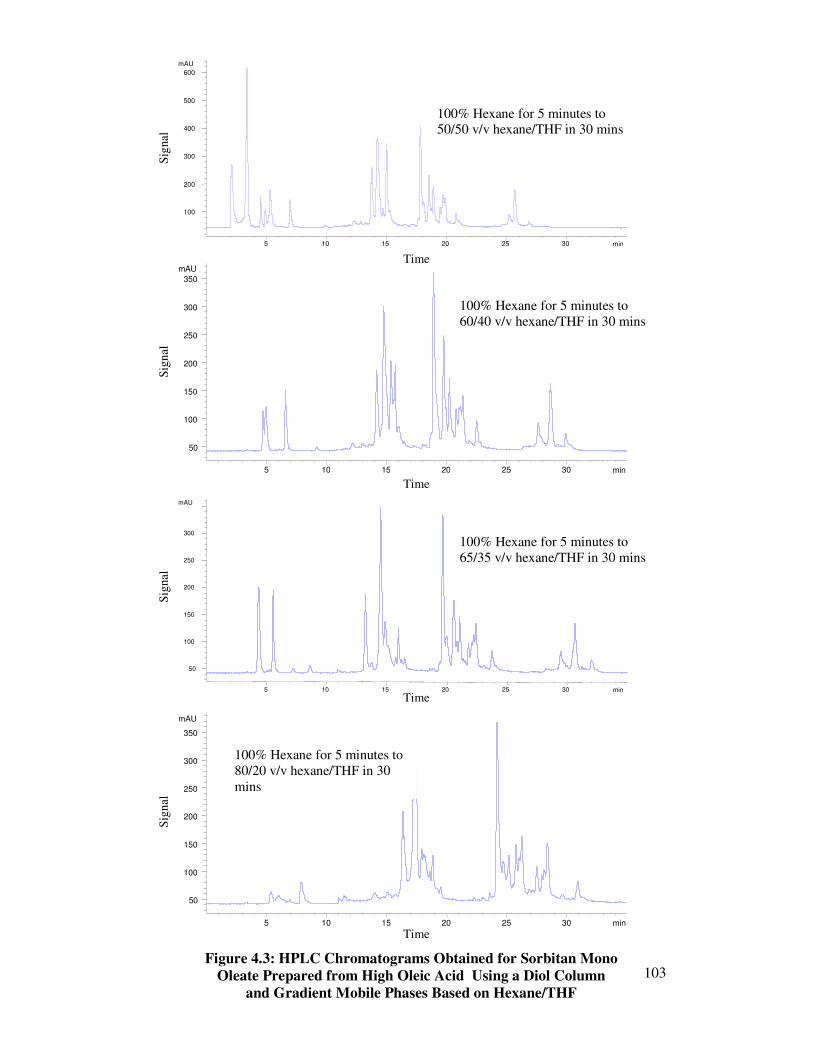
103
min5 10 15 20 25 30
mAU
100
200
300
400
500
600
min5 10 15 20 25 30
mAU
50
100
150
200
250
300
350
min5 10 15 20 25 30
mAU
50
100
150
200
250
300
min5 10 15 20 25 30
mAU
50
100
150
200
250
300
350
100% Hexane for 5 minutes to
80/20 v/v hexane/THF in 30
mins
100% Hexane for 5 minutes to
65/35 v/v hexane/THF in 30 mins
100% Hexane for 5 minutes to
60/40 v/v hexane/THF in 30 mins
100% Hexane for 5 minutes to
50/50 v/v hexane/THF in 30 mins
Figure 4.3: HPLC Chromatograms Obtained for Sorbitan Mono
Oleate Prepared from High Oleic Acid Using a Diol Column
and Gradient Mobile Phases Based on Hexane/THF
Time
Sig
nal
S
ign
al
Time
Sig
nal
Time
Time
Sig
nal
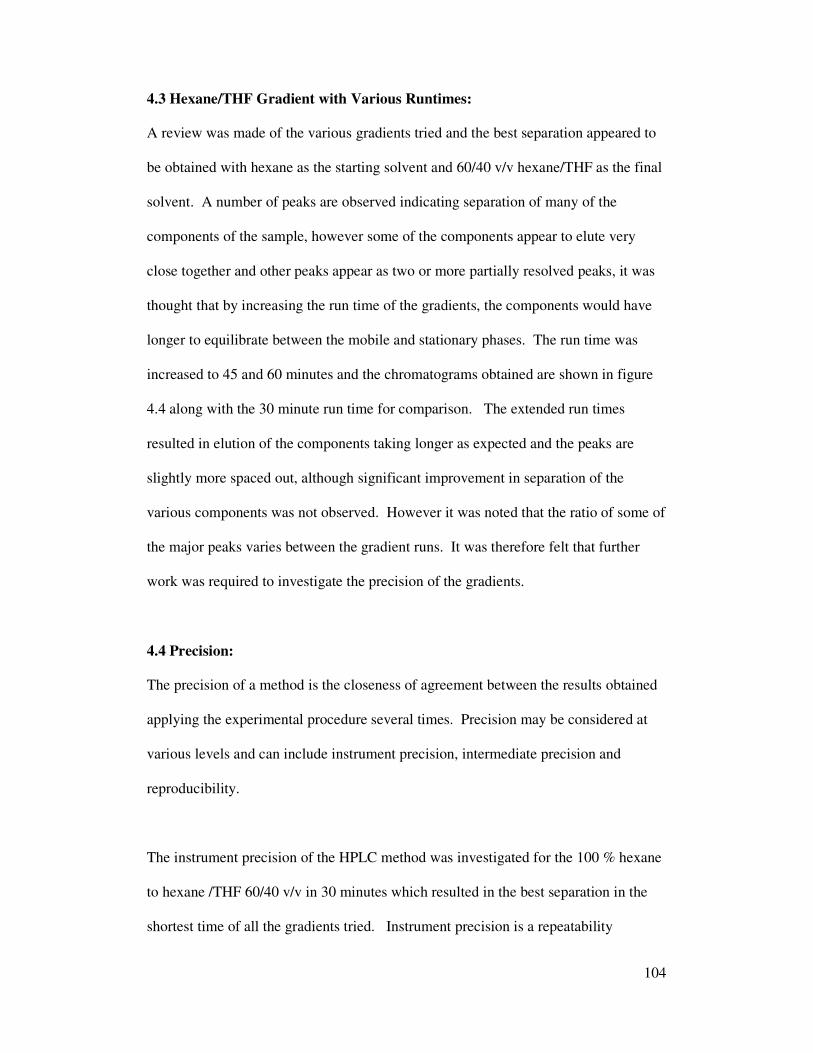
104
4.3 Hexane/THF Gradient with Various Runtimes:
A review was made of the various gradients tried and the best separation appeared to
be obtained with hexane as the starting solvent and 60/40 v/v hexane/THF as the final
solvent. A number of peaks are observed indicating separation of many of the
components of the sample, however some of the components appear to elute very
close together and other peaks appear as two or more partially resolved peaks, it was
thought that by increasing the run time of the gradients, the components would have
longer to equilibrate between the mobile and stationary phases. The run time was
increased to 45 and 60 minutes and the chromatograms obtained are shown in figure
4.4 along with the 30 minute run time for comparison. The extended run times
resulted in elution of the components taking longer as expected and the peaks are
slightly more spaced out, although significant improvement in separation of the
various components was not observed. However it was noted that the ratio of some of
the major peaks varies between the gradient runs. It was therefore felt that further
work was required to investigate the precision of the gradients.
4.4 Precision:
The precision of a method is the closeness of agreement between the results obtained
applying the experimental procedure several times. Precision may be considered at
various levels and can include instrument precision, intermediate precision and
reproducibility.
The instrument precision of the HPLC method was investigated for the 100 % hexane
to hexane /THF 60/40 v/v in 30 minutes which resulted in the best separation in the
shortest time of all the gradients tried. Instrument precision is a repeatability
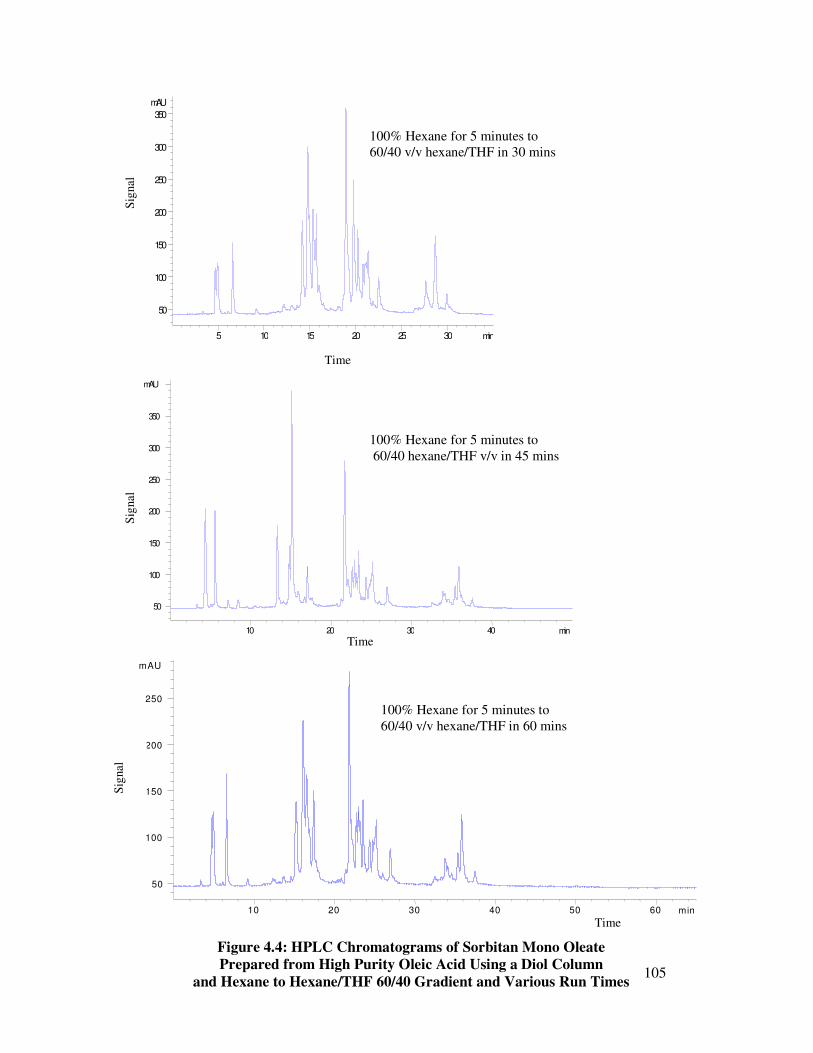
105
min10 20 30 40
mAU
50
100
150
200
250
300
350
100% Hexane for 5 minutes to
60/40 hexane/THF v/v in 45 mins
min5 10 15 20 25 30
mAU
50
100
150
200
250
300
350
100% Hexane for 5 minutes to
60/40 v/v hexane/THF in 30 mins
min10 20 30 40 50 60
mAU
50
100
150
200
250
100% Hexane for 5 minutes to
60/40 v/v hexane/THF in 60 mins
Figure 4.4: HPLC Chromatograms of Sorbitan Mono Oleate
Prepared from High Purity Oleic Acid Using a Diol Column
and Hexane to Hexane/THF 60/40 Gradient and Various Run Times
Time
Sig
nal
Time
Sig
nal
S
ignal
Time

106
measurement and indicates the ability of the instrumental method to obtain the same
answers for the same sample over a short period of time. A precise method is
required to have confidence in the results obtained.
A solution containing sorbitan mono oleate at 0.1 % was prepared and injected onto
the column three times from the same vial to establish precision. The chromatograms
obtained for the first and last injection obtained are shown in figure 4.5. The third
injection shows a group of peaks at ~ 11 minutes, which is absent in the first injection.
The first injection shows a group of three peaks around 15 minutes, the third peak is a
single peak, however the third injection chromatogram shows this peak as a doublet.
The ratio of the peaks are also different in the two chromatograms, for example the
ratios of the two major peaks observed at ~15.5 and ~19.5 minutes are 1:1.1 for
injection 1 and 1:0.6 for injection 3 and the ratio of two adjacent peaks at ~19.5 and
~20.5 minutes are 1:0.4 for injection 1 and 1:0.6 for injection 3. It can be concluded
that the two chromatograms show major differences. The chromatogram obtained for
the second injection showed differences to the chromatograms obtained for the first
and third injection.
Repeat injections from the same solution were made on a different day and again
chromatograms showing significant differences for the same sample were obtained,
therefore it was concluded that this gradient method was not precise. Other gradients
tried were also checked for precision and were also shown not to be precise
If the gradients do not provide precise results for the same sample on the same day,
HPLC is not a suitable QC technique and therefore not worth pursuing further for the

107
analysis of sorbitan esters outside a research environment and an alternative method
of analysis should be tried.

108
Figure 4.5: Repeat Injection of Sorbitan Mono Oleate Prepared from High Purity Oleic Acid
using Diol Column and Gradient of
100% Hexane to 60/40 Hexane/THF in 30 minutes
Injection 1
Injection 3
Time
Sig
nal
Time
Sig
nal
109
5. Initial Gas Chromatography Analysis
Analysis of Polyol Esters Based on Caprylic Acid Using Split/Splitless Injection:
Gas chromatography is a very useful analytical tool, which is routinely used in a large
number of laboratories. It offers rapid and high resolution separation of a wide range
of compounds, with the only restriction that the analyte should have sufficient
volatility. The analyte needs to be in the gas phase so that it can be transported
through the column. For any retention of the solute molecule to take place, the solute
molecule must dissolve in the stationary phase for a finite period of time before re-
emerging from the liquid surface into the vapour state.
From the work detailed in chapters 2 to 4 it was found that HPLC is unsuccessful for
the analysis of sorbitan mono-oleate. GC is another routinely used technique within
Croda, therefore would be a good method to use for sorbitan ester analysis
particularly sorbitan mono oleate, if suitable. However due to the high molecular size
of the polyol esters of oleic acid being investigated it was uncertain whether they
would be sufficiently volatile to analyse by GC. It was therefore felt necessary to
carry out an investigation using a smaller chain fatty acid ester, which would have a
smaller molecular size and therefore be more volatile. This would establish if any
polyol esters based on sorbitol can be analysed by GC, prior to the analysis of the less
volatile larger esters. The ester selected was sorbitan caprylate, which is the sorbitan
ester with the shortest fatty acid chain length manufactured by Croda. It is
manufactured from a high purity fatty acid (~98 % caprylic acid) and therefore will
have fewer ester species than esters prepared from a mixed fatty acid feed stock.

110
5.1 Initial Analysis:
5.1.1 Sample Derivatisation:
The sample chosen was a sorbitan caprylate manufactured by Croda Singapore.
Derivatisation is used widely in GC to improve thermal stability, change the
separation properties of the compound by adjusting the volatility or introducing a
detector orientated tag into the molecule. It was felt necessary to derivatise the sample
under study to increase the volatility. Acetylation was chosen because this is the
derivatisation used for polyol esters, reducing the polarity of the hydroxyl group. The
sample (2 g) was taken and acetylated with pyridine (5 ml) and acetic anhydride (10
ml), refluxed for approximately 1 hour on a sand bath. The resulting sample was then
analysed by GC.
5.1.2 Instrumentation:
The GC used for this analysis was a Hewlett Packard 5890 GC fitted with a
split/splitless injector and flame ionization detector (FID). This is a routinely, readily
available GC within Croda. It was felt it would be suitable for sorbitan ester analysis
because by using the splitless injection there is total transfer of the sample onto the
column and this is commonly used for less volatile analytes in a low boiling point
solvent. The detector selected is a universally used detector for organic compounds
which is both robust and sensitive.
5.1.3 Column Selection:
The majority of analysis can be performed on non polar stationary phases, e.g. DB1,
DB5 columns and are good starting points when little information is known about the
expected separation. These are preferred stationary phases because they have higher
111
maximum operating temperatures and are more durable. The separation relies on
dispersive interactions so separation is according to the volatility of the components in
the sample.
However due to the high molecular weight of sorbitan esters and therefore low
volatility it was felt that high temperature GC (HT-GC) would be necessary, this starts
at the upper working limit of conventional GC columns. Some non-polar and medium
polar gum phases can be operated at temperatures greater than 400°C.
The initial stationary phase selected was therefore a non polar column but one that can
be used for HT-GC. The DB1-ht column was selected, this is a 100 %
dimethylpolysiloxane column which is specially processed for extended temperatures
up to 400°C, compared to a standard DB-1 column which has a maximum operating
temperature of 350°C.
Resolution is proportional to the square root of the efficiency and therefore doubling
the length of the column results in about 40 % improvement in resolution. However
doubling the length of the column doubles the analysis time, increases column bleed
and decreases sensitivity. Therefore due to the study being carried out to establish if
the ester species of sorbitan caprylate would elute from the column and if any
separation of the sorbitan ester could be achieved it was felt that a 15 metre column
would be sufficient and decrease the analysis time in comparison to a 30 or 60 metre
column. The column diameter selected was a 0.32 mm i.d as these along with 0.25
mm columns are the most commonly used.

112
The film thickness used was 0.1µm, this is the only commercially available thickness.
This is a thin film used for separating low volatile components relatively quickly,
which is required for sorbitan ester analysis.
5.1.4 GC Conditions:
Temperature markedly influences GC retention because it changes the partition
coefficient. Retention decreases with increasing column temperature. The
dependence of GC retention on vapour pressure means that mixtures containing a
wide range of boiling points can not be analysed using an isothermal run because the
volatile components may elute and be well resolved but the higher boiling materials
would only be eluted with long retention times and very broad peaks. Due to the
number of possible components within the sample under investigation it was felt
necessary to use an oven temperature programme. In contrast an injector temperature
needed to be selected that was sufficient to volatilise the components but not degrade
them.
5.1.5 Analysis:
The first analysis carried out was to establish if the ester species would elute from the
column. A high starting temperature was selected and a temperature programme with
the final temperature of the column being the maximum operating temperature of the
column.
The conditions used were:
Initial temperature: 200°C
Ramp rate: 10 °C/minute
Final temperature: 400°C

113
Injector temperature: 300°C
Detector temperature: 400°C
Injection volume: 1 µl
Carrier Gas: Helium
Flow Rate: 1 ml/min
The chromatogram obtained is shown in figure 5.1 and shows that some separation of
the various components was obtained however they eluted very close together, with
all the components eluting within 12 minutes.
Figure 5.1: GC Chromatogram of a Manufactured Sample of Sorbitan
Caprylate, Analysed Using an Oven Temperature of 200°C to 400°C, With
a Ramp Rate of 10°C/min
Sig
nal
(p
A)
Time (mins)

114
5.2 Optimisation of GC Conditions:
5.2.1 Oven Temperature
From the chromatogram obtained using the initial GC oven conditions it was evident
that components of sorbitan esters based on caprylic acid could be eluted from a GC
column and that further investigation was worthwhile. However from the
chromatogram it was apparent that the column temperature was too high to allow
adequate separation of the early eluting components, therefore a lower starting
temperature was selected for the next separation. Also because all the components
were eluted in the first half of the temperature programme it was felt unnecessary to
go to the maximum operating temperature of the column for the next analyses,
therefore the final temperature was reduced slightly along with the detector
temperature.
The sorbitan caprylate was analysed using the following conditions:
Initial temperature: 150°C
Ramp rate: 10°C/minute
Final temperature: 380°C
Injector temperature: 300°C
Detector temperature: 380°C
The chromatogram obtained is shown in figure 5.2.
The chromatogram shows better separation of the components compared to the
previous conditions, a number of well spaced groups of peaks are seen, with good
peak shapes. The peak after the solvent peak appears as partially resolved peaks
indicating that the column starting temperature could still be too high to allow
adequate separation of the early eluting components in the mixture. It is therefore
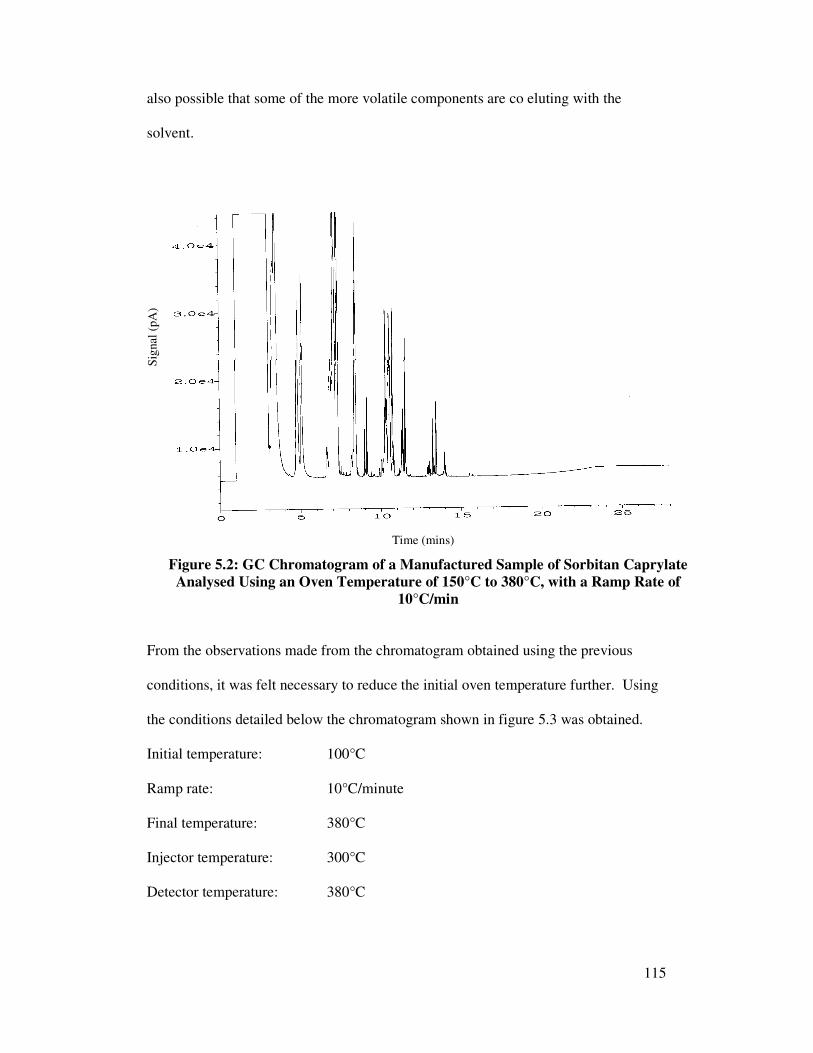
115
also possible that some of the more volatile components are co eluting with the
solvent.
From the observations made from the chromatogram obtained using the previous
conditions, it was felt necessary to reduce the initial oven temperature further. Using
the conditions detailed below the chromatogram shown in figure 5.3 was obtained.
Initial temperature: 100°C
Ramp rate: 10°C/minute
Final temperature: 380°C
Injector temperature: 300°C
Detector temperature: 380°C
Figure 5.2: GC Chromatogram of a Manufactured Sample of Sorbitan Caprylate
Analysed Using an Oven Temperature of 150°C to 380°C, with a Ramp Rate of
10°C/min
Time (mins)
Sig
nal
(p
A)

116
The chromatogram shows a series of well spaced peaks with good peak shape. The
series of peaks observed in figure 5.2 are present but elute later and are more spaced
out. Also the partially resolved peak observed after the solvent peak using the
previous conditions is absent and has been replaced by a single peak well separated
from the solvent peak and a group of peaks at 8-10 minutes. Reducing the initial
temperature has allowed sufficient separation of the early components and the use of
the temperature programme has not resulted in later eluting components occurring as
broad peaks but as sharp resolved ones.
Using an initial oven temperature of 100°C is also beneficial, so that refocusing of the
sample at the beginning of the column can occur.
Figure 5.3: GC Chromatogram of a Manufactured Sample of Sorbitan
Caprylate, Analysed Using an Oven Temperature of 100°C to 380°C, With a
Ramp Rate of 10°C/min
Time (mins)
Sig
nal
(p
A)

117
5.2.2 Ramp Rate:
The previous three GC chromatograms were obtained using a ramp rate of
10°C/minute, the next investigation was to observe the effect altering the ramp rate
has on the chromatography. The last oven conditions detailed were used and ramp
rates of 8°C and 5°C were used instead of 10°C. The chromatograms obtained are
shown in figure 5.4.
The chromatograms are similar to that in figure 5.3, but the peaks are more spaced
out. Altering the ramp rate has not had an adverse effect on the peak shapes, however
using a ramp rate of 5°C has increased the runtime to almost an hour. Using 8°C has
increased the analysis time slightly but the peaks are better separated, therefore this
ramp rate was selected for further work. The capacity factor for the first eluting
component at each ramp rate was determined and compared, the values obtained are
shown in table 5.1 below.
Ramp Rate (°C) Capacity Factor
5 2.1
8 1.4
10 1.1
Table 5.1: Capacity Factor of First Eluting Component
Using Various Temperature Ramp Rates
The results show that as the ramp rate increases the capacity factor decreases,
indicating less retention as expected. It is likely that the later eluting components will
behave similar.
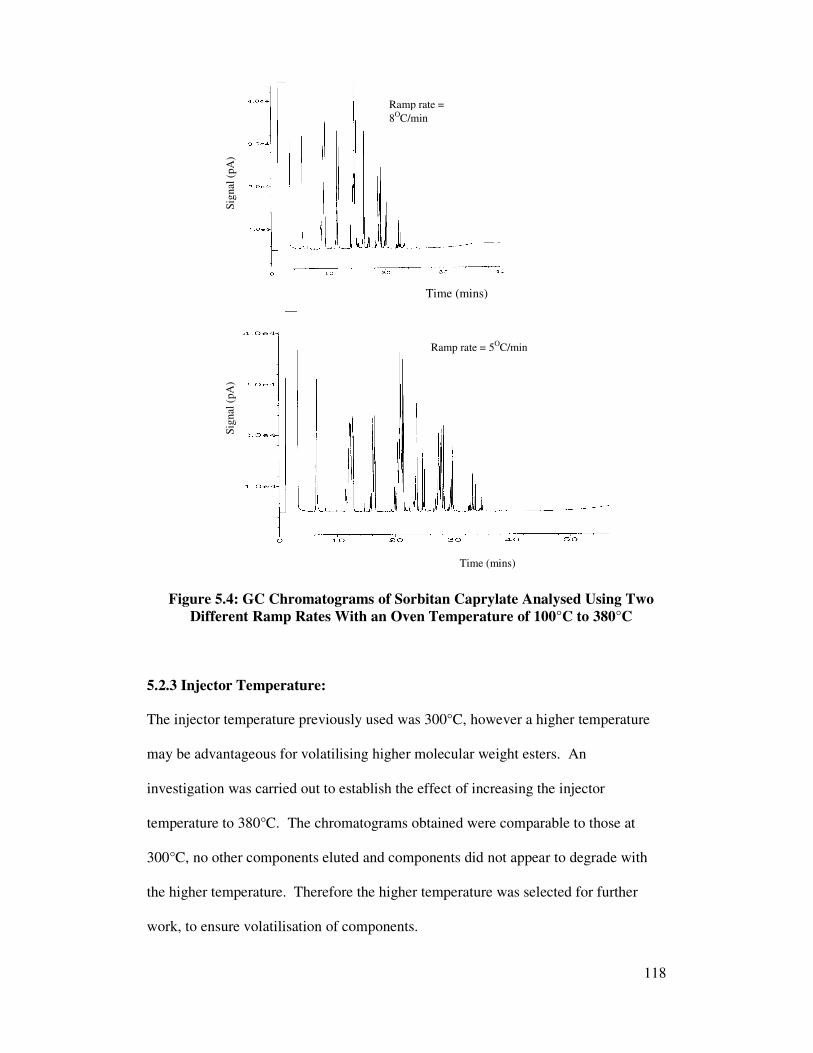
118
5.2.3 Injector Temperature:
The injector temperature previously used was 300°C, however a higher temperature
may be advantageous for volatilising higher molecular weight esters. An
investigation was carried out to establish the effect of increasing the injector
temperature to 380°C. The chromatograms obtained were comparable to those at
300°C, no other components eluted and components did not appear to degrade with
the higher temperature. Therefore the higher temperature was selected for further
work, to ensure volatilisation of components.
Ramp rate =
8OC/min
Ramp rate = 5OC/min
Figure 5.4: GC Chromatograms of Sorbitan Caprylate Analysed Using Two
Different Ramp Rates With an Oven Temperature of 100°C to 380°C
Time (mins)
Sig
nal
(pA
)
Time (mins)
Sig
nal
(pA
)

119
5.2.4 Optimised Conditions:
From this initial study the conditions used for further investigation were:
Initial oven temperature: 100°C
Ramp rate: 8°C/min
Final temperature: 380°C held for 5 minutes
Injector temperature: 380°C
Detector temperature: 380°C
5.3 Peak Identification of Sorbitan Caprylate:
5.3.1 Analysis of Starting Materials:
An investigation into the retention time of the starting materials used to produce
sorbitan caprylate was carried out. These are the lowest molecular weight components
and therefore will be the first to elute, by acetylating them and analysing them using
the final GC conditions detailed in chapter 5.2.2, it would be possible to establish their
retention time. If no peaks were detected it would indicate that the temperature
programme was still too high and they were co eluting with the solvent peak and that
more method development was required.
The sorbitan caprylate used for the initial study was prepared from the polyol sorbitol
and caprylic acid, during manufacture the sorbitol would have been dehydrated
resulting in other polyols, sorbitan and isosorbide. Therefore the starting materials are
sorbitol, sorbitan, isosorbide and caprylic acid, high purity isosorbide, sorbitol and
caprylic acid were purchased and acetylated (as detailed in chapter 5.1.1). Sorbitan
can not be purchased therefore an alternative approach was necessary. By carrying out
a polyol profile of the sorbitan caprylate sample as detailed in chapter 2.2, the three

120
acetylated polyols would result. Using the chromatograms obtained for the pure
isosorbide and sorbitol the retention time of sorbitan could also be established. The
chromatograms obtained are shown in figure 5.5, peaks are observed for all starting
materials indicating that the initial oven temperature is sufficient to separate them
from the solvent. Residual polyols may be present in real manufactured sorbitan ester
samples and therefore they can now be identified if the same GC conditions are used.
If polyols and caprylic acid can be separated from the solvent it is assumed that other
components in the sorbitan caprylate can, because they will have a larger molecular
weight and therefore will be less volatile and have a longer elution time.
5.3.2 Peak Identification of Esters Species:
5.3.2.1 Preparation of Polyol Esters of Caprylic Acid:
The retention time of the starting materials of sorbitan caprylate was possible because
pure material is readily available from chemical suppliers except sorbitan which was
established from the polyol profile of sorbitan caprylate. However pure samples of the
ester species present in the sorbitan caprylate are not available, it was therefore
necessary to produce samples. Samples were prepared containing one polyol and
using high purity caprylic acids, in an attempt to aid identification of the peaks and
establish which esters eluted.
Isosorbide caprylate esters:
The ratio of isosorbide: caprylic acid used was 1:1 w/w. From previous work
(Rachael Shaddick MSc. Project (96)) carried out it was found that at this ratio both
mono and di esters are produced, with some residual isosorbide and that the
isosorbide di ester is produced in preference to the isosorbide mono ester. Therefore
121
from the material prepared it is the intention that the retention times of both the
isosorbide esters species can be established.
182.6 g isosorbide (98 % ex Aldrich) and 180.3 g caprylic acid (98+ % ex. Aldrich)
were reacted in the presence of 0.1 % Fascat 4100 as a catalyst at 190°C for 6 hours.
The reaction was followed by taking samples at various time intervals and
determining the acid value (AV). The reaction was complete when the AV fell to 3,
which indicated that the fatty acid had reacted with the isosorbide.
Sorbitol caprylate esters:
The reaction was carried out at low temperature to prevent the dehydration of the
sorbitol to the other known polyols. The ratio of sorbitol: acid chloride used was
1:1.5 w/w, this is slightly higher than the ratio used in the preparation of sorbitan
esters. This was used in an attempt to prepare some higher esters and establish if they
can be eluted from the GC column.
10.9 g sorbitol (99+ % ex Aldrich) was dissolved in 100 ml pyridine and placed in an
ice bath, 14.6 g octanoyl chloride (99 % ex Aldrich) added drop wise over ~20
minutes. The mixture was left stirring overnight and then the pyridine was removed
using a rotary evaporator.
Sorbitan esters:
Unfortunately sorbitan can not be purchased therefore it was not possible to prepare a
sample of sorbitan esters by reacting sorbitan and fatty acid. It was necessary to react
sorbitol and fatty acid under conditions that would result in sorbitan being the main
122
polyol. Previous work carried out by C Newbould at Croda showed that the optimum
laboratory condition for cyclisation of sorbitol to sorbitan was 195°C.
The first stage in the preparation of the sorbitan caprylate was therefore to prepare the
polyol species required at 195°C. This was then followed by esterification of the
resulting polyols with the acids at a higher temperature.
The ratio of sorbitol: acid used was 1:1.3 w/w which is a typical ratio used in the
preparation of sorbitan esters.
260 g sorbitol syrup (70 % ex Croda) was cyclised by heating to 195 °C for 2 hours in
the presence of 0.9 g hypophosphorus acid and 187.2 g octanoic acid. Then esterified
at 215°C for 2 hours using 1.34 g sodium hydroxide as the catalyst. The apparatus
used is shown in figure 5.6.

Acetylated Caprylic Acid Acetylated Isosorbide
Acetylated Sorbitol
Acetylated Polyols
Sorbitol
Isosorbide
Sorbitan
Figure 5.5: GC Chromatograms of Acetylated Starting Materials used in the Preparation of Sorbitan Caprylate
Time (mins) Time (mins)
Time (mins) Time (mins)
Sig
nal
(p
A)
Sig
nal
(p
A)
Sig
nal
(p
A)
Sig
nal
(p
A)

124
The polyols present in the resulting sample was determined by carrying out a polyol
profile and was found to contain:
Isosorbide ~12 %
Sorbitan ~87 %
Sorbitol <1 %
This shows that the sorbitol had been fully dehydrated to sorbitan and isosorbide, with
sorbitan being the predominant polyol.
Figure 5.6: Laboratory Equipment used for the Preparation of Sorbitan Caprylate

125
5.3.2.2 GC Analysis of Polyol Esters of Caprylic Acid:
The three samples prepared were acetylated and analysed by GC using the details
described in 5.1.1 and 5.2.4.
Isosorbide caprylate - the chromatogram obtained (figure 5.7) has three major peaks,
from analysis of the starting materials the first peak can be assigned as isosorbide, the
two other peaks are assumed to be the mono and di caprylic esters of isosorbide.
This indicates that both caprylic esters of isosorbide are sufficiently volatile to elute
using the conditions selected.
Sorbitol Caprylate - the chromatogram obtained is shown in figure 5.8, the retention
time of sorbitol is 10.5 minutes and was established from the work detailed in chapter
5.3.1. A large peak at 15.7 minutes is thought to be due to sorbitol mono caprylate the
Isosorbide Di
Caprylate
Isosorbide Mono
Caprylate
Isosorbide
Figure 5.7: GC Chromatogram of Isosorbide Caprylate
Time (mins)
Sig
nal
(p
A)
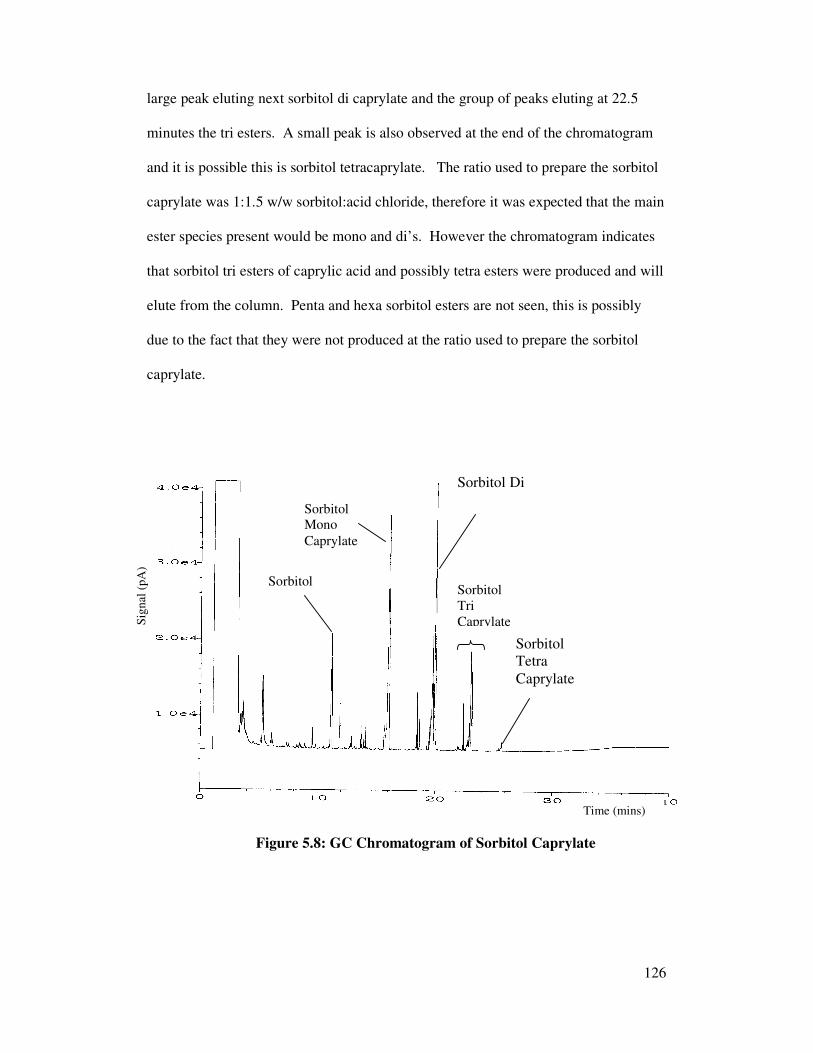
126
large peak eluting next sorbitol di caprylate and the group of peaks eluting at 22.5
minutes the tri esters. A small peak is also observed at the end of the chromatogram
and it is possible this is sorbitol tetracaprylate. The ratio used to prepare the sorbitol
caprylate was 1:1.5 w/w sorbitol:acid chloride, therefore it was expected that the main
ester species present would be mono and di’s. However the chromatogram indicates
that sorbitol tri esters of caprylic acid and possibly tetra esters were produced and will
elute from the column. Penta and hexa sorbitol esters are not seen, this is possibly
due to the fact that they were not produced at the ratio used to prepare the sorbitol
caprylate.
Sorbitol
Sorbitol
Mono
Caprylate
Sorbitol Di
Caprylate
Sorbitol
Tri
Caprylate
Figure 5.8: GC Chromatogram of Sorbitol Caprylate
Sorbitol
Tetra
Caprylate
Time (mins)
Sig
nal
(p
A)

127
Sorbitan capylate - the chromatogram obtained is shown in figure 5.9. The polyol
profile of the sample showed that the sample was essentially sorbitan but did contain
some isosorbide, the retention times obtained for the isosorbide and isosorbide esters
was established in figure 5.7. These peaks were identified in the sorbitan caprylate
chromatogram, however these were not of interest in this chromatogram, this sample
was analysed to establish if sorbitan ester species of caprylic acid will elute from the
GC column. The chromatogram shows that the sorbitan ester species appear as
groups of peaks, this may be due to a number of different isomers. The peak due to
sorbitan was determined from the analysis of the starting materials, three other groups
of peaks are observed which are thought to correspond to mono, di and tri esters, as
shown in the chromatogram.
Sorbitan
Sorbitan Mono
Sorbitan Di
Sorbitan Tri
Caprylate
Figure 5.9: GC Chromatogram of Sorbitan Caprylate
Time (mins)
Sig
nal
(p
A)

128
5.4 Identification of the Peaks in the Manufactured Sorbitan Caprylate Sample:
Using the information gained from the analysis of the starting materials and the
samples prepared containing one polyol, identification of the peaks in the
manufactured sample of sorbitan caprylate has been attempted.The chromatogram
obtained with labeled peaks is shown in figure 5.10. This shows that a chromatogram
for sorbitan caprylate has been attainable with different species separated and
identified. The largest ester species detected were tri esters, although these were
small compared to the other ester species, however this is as expected because the
material would be manufactured at a ratio of 1:1.3 w/w sorbitol: acid. The
chromatogram also shows peaks corresponding to the starting polyols, these will be in
excess due to the production of di and tri esters.
The peak identification is based on the species expected to be produced and their size
and volatility. GC-MS could be used to confirm these identifications, however this
technique was not readily available when the work was carried out.
From this work it can be concluded that GC analysis is a highly successful technique
for the analysis of sorbitan caprylate, with information obtained on the various ester
species present. It would therefore be advantageous to carry out further investigation
on GC analysis of esters prepared from higher molecular weight fatty acids.

Isosorbide
Sorbitol Mono
Caprylate Sorbitol
Sorbitan
Isosorbide
Mono
Caprylate
Sorbitan Di
Caprylate
Sorbitol Di
Caprylate
Isosorbide Di
Caprylate
Sorbitol Tri Caprylate
Sorbitan Tri
Caprylate
Figure 5.10: GC Chromatogram of Sorbitan Caprylate Manufactured at Croda Singapore
Sorbitan Mono
Caprylate
Time (mins)
Sig
nal
(pA
)

130
6. GC Analysis of Sorbitan Esters Using Split/Splitless Injection:
From the initial GC study (chapter 5) it was apparent that GC is a suitable method of
analysis for sorbitan caprylate, with a large number of the possible ester species of
sorbitan caprylate being eluted from the column. However it was felt that further
investigation was required to establish the effect increasing the fatty acid chain
lengths of sorbitan esters has on retention, because this will make the molecules larger
and less volatile. A study was carried out, by increasing the fatty acid chain length by
two carbon atoms at a time for each of the polyol esters. The largest esters
investigated were those based on stearic and oleic acid. The samples were analysed
using the same GC conditions used for the polyol esters of caprylic acid and the
resulting chromatograms obtained observed to establish if the various ester
components could be eluted form the GC column or not.
6.1 Preparation of Polyol Esters:
The first stage of the study was to prepare each of the polyol esters from high purity
fatty acid feed stocks.
6.1.1 Isosorbide Esters:
Isosorbide esters of decanoic acid to stearic acid were prepared as detailed in the
chapter 5.3.2.1.
In all cases the isosorbide used was 98 % ex. Aldrich (MW = 146.14) and high purity
fatty acids were used. The ratio of isosorbide: acid used was 1:1 w/w and the
quantities for each of the isosorbide fatty acid esters prepared are detailed in table 6.1.

131
Isosorbide
Decanoate
Isosorbide
Laurate
Isosorbide
Myristate
Isosorbide
Palmitate
Isosorbide
Stearate
Acid purity 96 % 98 % 99.5 % 95 % 95 %
Acid MW 172.3 200.3 228.4 256.4 284.5
Acid used/(g) 258.4 240.0 275.0 256.4 194.7
Moles of acid 1.5 1.2 1.2 1.0 0.7
Isosorbide used/(g) 219.2 175.0 176.0 146.1 100.0
Catalyst used/(g) 0.5 0.4 0.5 0.4 0.3
Table 6.1: Quantities used for the Preparation of Various Isosorbide Esters
The C10 – C14 acids were supplied by Aldrich and the C16 and C18 by Avocado.
All of the isosorbide fatty acids prepared were analysed by GPC (as detailed in
chapter 2.3) and all showed three major peaks thought to correspond to free
isosorbide, isosorbide mono ester and isosorbide di ester as expected.
6.1.2 Sorbitan Esters:
Sorbitan esters were prepared using the same acids used to prepare the isosorbide
esters and 70 % sorbitol syrup (ex Croda). They were prepared using the method
detailed in section 5.3.2.1 for sorbitan esters, the ratio of sorbitol: acid was 1:1.3 w/w,
which is a typical ratio used in the preparation of sorbitan esters at Croda. The
following chemicals were used as shown in table 6.2.

132
Sorbitan
Decanoate
Sorbitan
Laurate
Sorbitan
Myristate
Sorbitan
Palmitate
Sorbitan
Stearate
Sorbitol Syrup/(g) 260 220 195 175 175
Moles of Sorbitol 1 0.9 0.8 0.7 0.7
Fatty Acid /(g) 224.0 220.0 222.7 224.3 248.9
Moles of fatty acid 1.3 1.1 1.0 0.9 0.9
Hypophosphorus acid
(50%) /(g)
0.2 0.9 0.2 0.2 0.2
Sodium hydroxide/(g) 0.7 1.3 0.7 0.6 0.6
Table 6.2: Quantities used for the Preparation of Various Sorbitan Esters
The intention was to dehydrate the sorbitol to sorbitan and esterify this to produce
samples containing high levels of sorbitan esters. Polyol profiles for each of the
samples prepared were carried out (as detailed in 2.2) to establish if this had been
achieved, table 6.3 shows that the samples were found to contain:
Sorbitan
Decanoate
Sorbitan
Laurate
Sorbitan
Myristate
Sorbitan
Palmitate
Sorbitan
Stearate
Isosorbide ~5 % ~22 % ~7 % ~3 % ~5 %
Sorbitan ~90 % ~76 % ~93 % ~80 % ~76 %
Sorbitol ~5 % ~2 % N/D ~17 % ~19 %
Table 6.3: Polyol Profiles of Sorbitan Decanoate to Stearate

133
The polyol profiles show that esters containing only sorbitan as the polyol were not
prepared, however all the samples prepared did contain a high level of sorbitan and
consequently it is assumed high levels of sorbitan esters.
6.1.3 Sorbitol Esters:
Sorbitol esters were produced from sorbitol (99+ % ex. Aldrich, MW = 182) and acid
chloride, using a ratio of 1:1.5 w/w sorbitol: acid chloride, all the acid chlorides were
purchased from Aldrich. The sorbitol esters were prepared using the method detailed
in chapter 5.3.2.1 for sorbitol esters, but using the chemicals detailed in table 6.4.
Sorbitol
Decanoate
Sorbitol
Laurate
Sorbitol
Myristate
Sorbitol
Palmitate
Sorbitol
Stearate
Acid Chloride purity 98 % 98 % 97 % 98 % 99 %
Acid chloride MW 190.7 218.8 246.8 274.9 302.9
Acid chloride used/(g) 18.1 19.6 22.2 24.7 13.6
Moles of acid chloride 0.09 0.09 0.09 0.09 0.045
Sorbitol used/(g) 10.9 10.9 10.9 10.9 5.5
Moles of sorbitol 0.06 0.06 0.06 0.06 0.03
Table 6.4: Quantities used to Produce Various Sorbitol Esters Using a Ratio of
1:1.5 w/w Sorbitol:Acid Chloride
Sorbitol esters were also produced using a ratio of 1:3 w/w sorbitol:acid chloride.
Sorbitol mono to hexa esters can be produced, hexa esters with all six hydroxyl
groups esterified will be the largest ester produced for each of the acids being
investigated and therefore will be the least volatile and the last to elute from the
column. At a higher ratio it was thought that the higher esters might be produced and
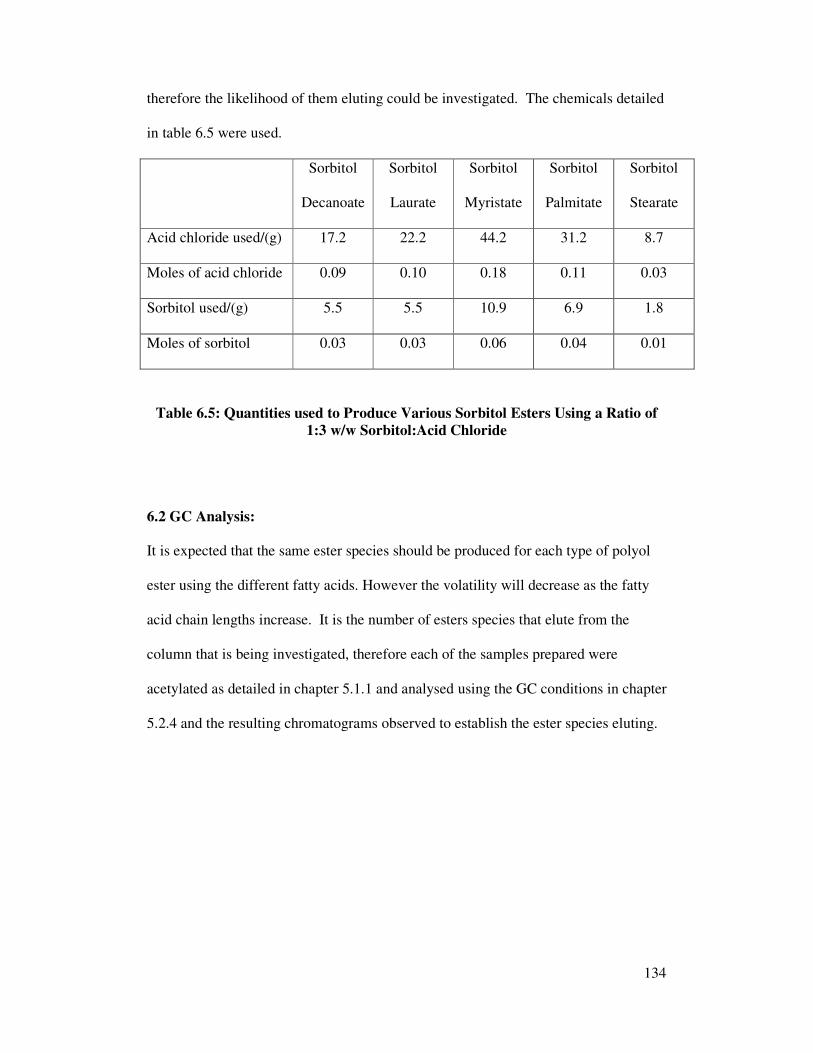
134
therefore the likelihood of them eluting could be investigated. The chemicals detailed
in table 6.5 were used.
Sorbitol
Decanoate
Sorbitol
Laurate
Sorbitol
Myristate
Sorbitol
Palmitate
Sorbitol
Stearate
Acid chloride used/(g) 17.2 22.2 44.2 31.2 8.7
Moles of acid chloride 0.09 0.10 0.18 0.11 0.03
Sorbitol used/(g) 5.5 5.5 10.9 6.9 1.8
Moles of sorbitol 0.03 0.03 0.06 0.04 0.01
Table 6.5: Quantities used to Produce Various Sorbitol Esters Using a Ratio of
1:3 w/w Sorbitol:Acid Chloride
6.2 GC Analysis:
It is expected that the same ester species should be produced for each type of polyol
ester using the different fatty acids. However the volatility will decrease as the fatty
acid chain lengths increase. It is the number of esters species that elute from the
column that is being investigated, therefore each of the samples prepared were
acetylated as detailed in chapter 5.1.1 and analysed using the GC conditions in chapter
5.2.4 and the resulting chromatograms observed to establish the ester species eluting.

135
6.2.1 Polyol Esters of Decanoic Acid:
The chromatograms obtained for each of the polyol esters of decanoic acid are shown
in figure 6.1.
The isosorbide decanoate chromatogram shows three major peaks well resolved from
each other, the first peak is due to isosorbide, which was established from previous
analysis of the starting materials. The other two peaks will be due to the mono and di
esters of isosorbide, this correlates with the information obtained from GPC analysis.
Both of the possible ester species of isosorbide decanoate were produced and both
eluted from the GC column using the conditions selected.
The sorbitan decanoate gave a more complex chromatogram, this is due to the fact
that the sample probably contains some isosorbide and sorbitol esters, because from
the polyol profile it was established that some isosorbide and sorbitol were present,
100 % conversion of the sorbitol to sorbitan did not occur. The chromatogram shows
that some residual sorbitan is present, again the retention time was established from
the polyol profile chromatograms. Three other large groups of peaks are observed
that have a similar profile to the sorbitan, it is assumed that these are due to sorbitan
mono, di and tri decanoate species, with the tri ester being the last of these groups
because it will have three fatty acid groups and therefore will be the largest of these
sorbitan ester species and as a consequence will be the least volatile. A small group
of peaks is visible with a retention time of ~30 minutes, it is possible that this is due to
sorbitan tetra decanoate.

Figure 6.1: GC Chromatograms of Polyol Esters of Decanoic Acid, Acetylated and Analysed Using a DB1-ht Column,
Injector at 380°C, Detector at 380°C and Oven Temperature 100°C to 380°C at 8°C/min 1 = Isosorbide, 2 = Isosorbide mono decanoate, 3 = Isosorbide di decanoate, 4 = Sorbitan, 5 = Sorbitan mono decanoate, 6 = Sorbitan di
decanoate, 7 = Sorbitan tri decanoate, 8 = Sorbitan tetra decanoate, 9 = Sorbitol, 10 = Sorbitol mono decanoate, 11 = Sorbitol di decanoate,
12 = Sorbitol tri decanoate, 13 = Sorbitol tetra decanoate, 14 = Sorbitol penta decanoate, 15 = Sorbitol hexa decanoate
Sorbitan
Decanoate
Isosorbide
Decanoate
2 3
1
12
4
5
6
7
8
Sorbitol Decanoate
(1:1.5 w/w)
9 10
12 13
14
15
12
11
13
14
11
Sorbitol
Decanoate
(1:3 w/w)
Sorbitan
Decanoate
Time (mins) Time (mins)
Time (mins) Time (mins)
Sig
nal
(pA
)
Sig
nal
(pA
) S
ignal
(pA
)
Sig
nal
(pA
)
137
The ratio of sorbitol to acid used for preparation of this sample was 1:1.3 which is a
usual stochiometry used in the production of sorbitan esters, at this reaction ratio it is
assumed that very little tetra ester will be produced. However there is evidence that a
small amount may have been produced and eluted from the column.
Two chromatograms of sorbitol decanoate are shown in figure 6.1 one for the sample
produced when a ratio of 1:1.5 w/w sorbitol: decanoyl chloride was used and the other
for the sample produced at 1:3 w/w ratio. A ratio of 1:1.5 w/w is a more typical ratio
used in manufacture, however a higher ratio was also used, it was thought that at a
higher ratio there was a greater possibility of producing higher esters e.g. sorbitol
penta and hexa decanoate and establishing if they would elute from the GC column.
The chromatogram obtained for the 1:1.5 w/w reaction ratio shows some unreacted
sorbitol, followed by the two major peaks of the chromatogram and thought to
correspond to sorbitol mono and di decanoate, at the ratio used it was assumed that
these would be the major species produced. However three other smaller but well
defined later eluting peaks are also observed, thought to be due to the tri, tetra and
penta ester species. Due to the ratio of acid to sorbitol used in the preparation these
will be at a lower concentration than the other ester species, however their presence
does account for the unreacted sorbitol.
In contrast to this chromatogram, the chromatogram obtained for the sorbitol
decanoate produced with a ratio of 1:3 w/w starting material shows no unreacted
sorbitol and only a very small peak at the retention time expected for sorbitan mono
decanoate. Two dominant peaks are observed thought to be sorbitol di and tri
decanoate, two smaller peaks elute after these and will probably be due to the tetra

138
and penta ester species, with a ratio of 1:3 w/w it was expected that the tri ester would
be the main ester species produced.
At the 1:1.5 w/w ratio a small peak is detected at the end of the chromatogram that
could be due to sorbitol hexa decanaote, however this is not as evident with the higher
ratio material. The work does show that it is possible for all sorbitol ester species to
be eluted from the column using the conditions selected.
The chromatograms obtained for the polyol esters of decanoic acid show that all of
the possible ester species can be eluted to some degree.
6.2.2 Polyol Esters of Lauric Acid:
The chromatograms obtained for the polyol esters based on lauric acid are shown in
figure 6.2. The chromatogram obtained for isosorbide laurate is very similar to that
obtained for isosorbide decanoate, showing three peaks corresponding to unreacted
isosorbide, isosorbide mono ester and isosorbide di ester. Although this
chromatogram shows less unreacted isosorbide and the two ester species have a
slightly longer retention time, this will be due to the larger size of the fatty acid used,
making these isosorbide esters less volatile than the isosorbide esters of decanoic acid.
The sorbitan laurate chromatogram shows a peak at the beginning of the
chromatogram with the retention time of unreacted isosorbide followed by a group of
peaks due to unreacted sorbitan. The polyol profile carried out on the sorbitan laurate
sample prepared showed that it has 22 % isosorbide and two peaks with the same
retention times of isosorbide mono and di laurate are observed. However three groups
139
of peaks are also observed which will correspond to sorbitan mono, di and tri esters of
lauric acid.
The chromatogram for the sorbitol laurate sample produced with a stochiometry of
1:1.5 w/w shows residual sorbitol, a peak due to sorbitol mono ester and the largest
peak due to sorbitol di ester, two later eluting peaks are observed due to the tri and
tetra ester. A small peak thought to be due to the penta ester is also seen. In contrast
to the chromatogram obtained for sorbitol laurate prepared from a ratio of 1:1.5 w/w
starting material, the chromatogram obtained for the material produced from a
reaction of 1:3 w/w shows considerably less peaks. No unreacted sorbitol peak is
observed and the sorbitol mono ester peak is very small, three peaks are observed
after the small mono ester peak, these are thought to be the di, tri and tetra sorbitol
ester species, with the di ester being the largest. No penta ester peak is observed at
this ratio indicating that it was not produced, at 1:1.5 w/w ratio a penta ester peak is
detected indicating that it will elute from the column.

Figure 6.2: GC Chromatograms of Polyol Esters of Lauric Acid, Acetylated and Analysed Using a DB1-ht Column,
Injector at 380°C, Detector at 380°C and oven temperature 100°C to 380°C at 8°C/min 1 = Isosorbide, 2 = Isosorbide mono laurate, 3 = Isosorbide di laurate, 4 = Sorbitan, 5 = Sorbitan mono laurate,
6 = Sorbitan di laurate, 7 = Sorbitan tri laurate, 8 = Sorbitol, 9 = Sorbitol mono laurate,
10 = Sorbitol di laurate, 11 = Sorbitol tri laurate, 12 = Sorbitol tetra laurate, 13 = Sorbitol penta laurate
Sorbitol Laurate
(1:1.5 w/w)
Sorbitol Laurate
(1:3 w/w)
4
5 6
7
8 9 10
11
12
Isosorbide Laurate
1
2 3
9
10
11
12
Sorbitan
Laurate
13
Sig
nal
(pA
)
Sig
nal
(pA
)
Time (mins)
Time (mins)
Sig
nal
(pA
)
Sig
nal
(pA
)
Time (mins) Time (mins)

141
6.2.3 Polyol Esters of Myristic Acid:
The chromatograms are shown in figure 6.3.
The isosorbide myristate chromatogram shows three peaks due to the unreacted
isosorbide and the mono and di ester species, as with the other isosorbide esters
investigated. Both of the possible ester species of isosorbide myristate are sufficiently
volatile to elute from a DB1-ht column using the conditions selected.
The sorbitan myristate chromatogram shows four groups of peaks due to unreacted
sorbitan and sorbitan mono, di and tri myristate. Peaks due to isosorbide and its esters
are also seen, this chromatogram is again very similar to that for sorbitan laurate,
although the esters for myristic acid have a slightly longer retention time due to the
decreased volatility. A very small group of peaks are just evident at the end of the
chromatogram which could possibly be sorbitan tetra myristate.
The chromatogram for the sorbitol myristate prepared at a 1:1.5 w/w shows three
major peaks after the residual sorbitol thought to be due to the mono, di and tri esters,
a very small peak is visible after these and is probably due to the tetra ester species.
The chromatogram obtained for sorbitol myristate prepared with a stochiometry of 1:3
w/w shows only two large peaks thought to be the di and tri esters, as in the previous
chromatogram a small peak is observed after the tri ester peak thought to be the tetra
ester. There is no evidence of any higher sorbitol esters on either chromatogram. The
tetra esters elute when the GC is at its final temperature used, therefore the
temperature is probably insufficient to elute any higher esters which will be less
volatile.

Isosorbide
Myristate
Sorbitan
Myristate
Sorbitol
Myristate
(1:1.5 w/w)
Sorbitol Myristate
(1:3)
Figure 6.3: GC Chromatograms of Polyol Esters of Myristic Acid, Acetylated and Analysed Using a DB1-ht Column,
Injector at 380°C, Detector at 380°C and Oven Temperature 100°C to 380°C at 8°C/min 1 = Isosorbide, 2 = Isosorbide mono myristate, 3= Isosorbide di myristate, 4 = Sorbitan 5 = Sorbitan mono myristate,
6 = Sorbitan di myristate, 7= Sorbitan tri myristate, 8 =Sorbitol, 9 = Sorbitol mono myristate,
10 = Sorbitol di myristate, 11 = Sorbitol tri myristate, 12 = Sorbitol tetra myristate
1
2 3
8 9
10 11
12
4
6
7
5
9
10
11
12
Sorbitol
Myristate
(1:3 w/w)
Time (mins)
Sig
nal
(pA
)
Sig
nal
(pA
)
Time (Mins)
Sig
nal
(p
A)
Sig
nal
(pA
)
Time (mins) Time (mins)
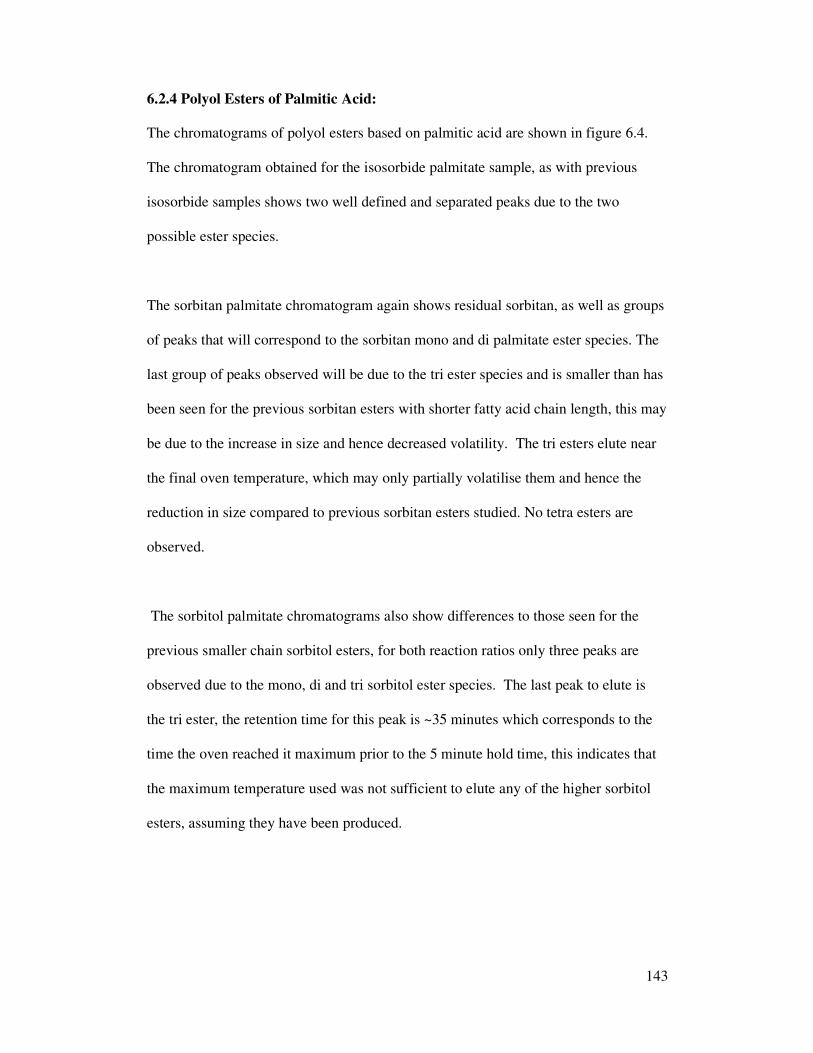
143
6.2.4 Polyol Esters of Palmitic Acid:
The chromatograms of polyol esters based on palmitic acid are shown in figure 6.4.
The chromatogram obtained for the isosorbide palmitate sample, as with previous
isosorbide samples shows two well defined and separated peaks due to the two
possible ester species.
The sorbitan palmitate chromatogram again shows residual sorbitan, as well as groups
of peaks that will correspond to the sorbitan mono and di palmitate ester species. The
last group of peaks observed will be due to the tri ester species and is smaller than has
been seen for the previous sorbitan esters with shorter fatty acid chain length, this may
be due to the increase in size and hence decreased volatility. The tri esters elute near
the final oven temperature, which may only partially volatilise them and hence the
reduction in size compared to previous sorbitan esters studied. No tetra esters are
observed.
The sorbitol palmitate chromatograms also show differences to those seen for the
previous smaller chain sorbitol esters, for both reaction ratios only three peaks are
observed due to the mono, di and tri sorbitol ester species. The last peak to elute is
the tri ester, the retention time for this peak is ~35 minutes which corresponds to the
time the oven reached it maximum prior to the 5 minute hold time, this indicates that
the maximum temperature used was not sufficient to elute any of the higher sorbitol
esters, assuming they have been produced.
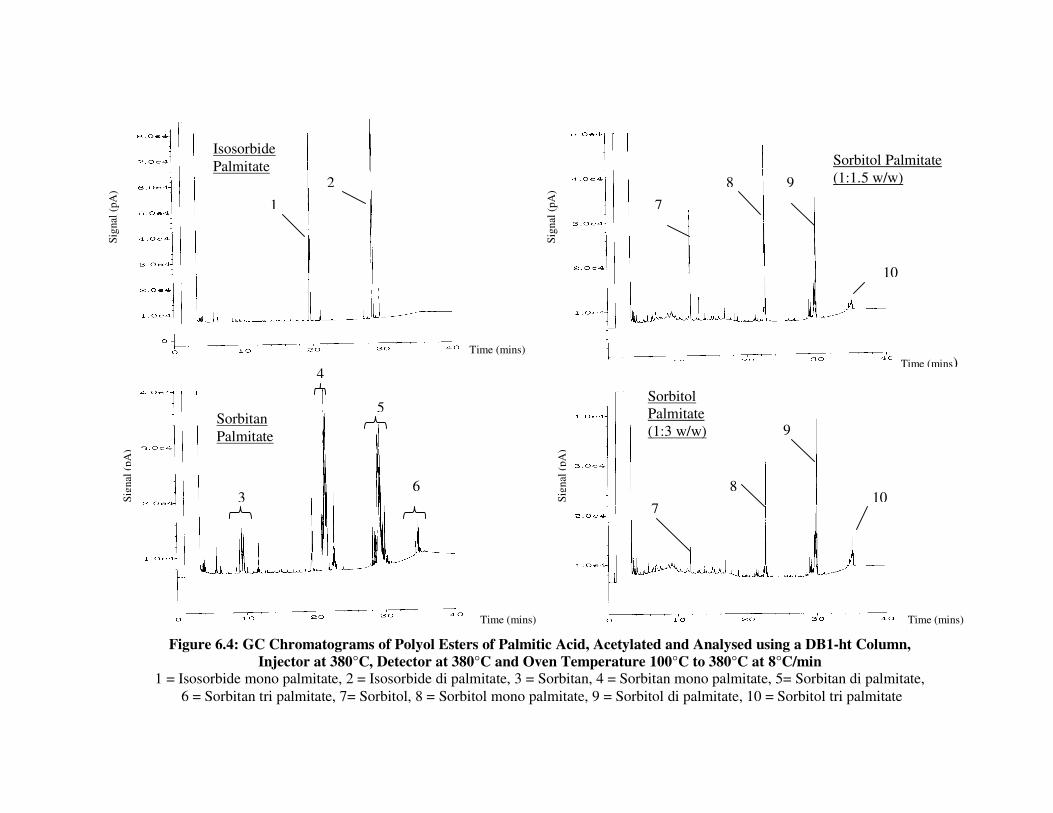
Isosorbide
Palmitate
Sorbitan
Palmitate
Sorbitol Palmitate
(1:1.5 w/w)
Sorbitol
Palmitate
(1:3 w/w)
Figure 6.4: GC Chromatograms of Polyol Esters of Palmitic Acid, Acetylated and Analysed using a DB1-ht Column,
Injector at 380°C, Detector at 380°C and Oven Temperature 100°C to 380°C at 8°C/min
1 = Isosorbide mono palmitate, 2 = Isosorbide di palmitate, 3 = Sorbitan, 4 = Sorbitan mono palmitate, 5= Sorbitan di palmitate,
6 = Sorbitan tri palmitate, 7= Sorbitol, 8 = Sorbitol mono palmitate, 9 = Sorbitol di palmitate, 10 = Sorbitol tri palmitate
1
2
3
4
5
6
7
8 9
10
7
8
9
10
Sig
nal
(pA
)
Sig
nal
(pA
)
Time (mins) Time (mins)
Sig
nal
(pA
)
Time (mins) Time (mins)
Sig
nal
(pA
)

145
6.2.5 Polyol Esters of Stearic Acid:
The chromatograms are shown in figure 6.5, as expected the two isosorbide ester
species of the isosorbide stearate elute. The sorbitan stearate chromatogram shows
peaks thought to be due to sorbitan mono and di ester species. The tri ester peak is
very small, sorbitan tri esters have been observed for all the other shorter fatty acid
sorbitan esters, indicating that at the ratio of starting materials used and the specified
conditions tri esters would be produced. It is probable that the GC conditions are not
sufficient to fully elute the larger sorbitan tri stearate. No tetra ester peaks are
observed, unlike sorbitan decanoate to myristate.
The chromatogram of the sorbitol esters of stearic acid also show less peaks than the
previous sorbitol esters prepared and analysed. At a ratio of 1:1.5 w/w, peaks are
observed for the mono and di ester and at 1:3 w/w only the di ester peak is observed.
At 1:3 w/w starting material ratio the tri ester is expected to be the major component
and this is not observed, this is probably due to the fact it is insufficiently volatile to
elute from the column using the GC temperature used.
6.2.6 Polyol Esters of Oleic Acid:
The previous GC work on polyol esters (chapters 5 and 6.1 to 6.2.5) was carried out
on saturated fatty acid esters, this is because saturated fatty acids are readily available
at high purity commercially in contrast to unsaturated fatty acids. However the initial
HPLC work was carried out on sorbitan mono oleate and this is one of Croda’s major
Crills produced and therefore one that would be regularly analysed, if a method was
developed.

Isosorbide
Stearate
Sorbitan
Stearate
Sorbitol
Stearate
(1:1.5 w/w)
Sorbitol Stearate
(1:3 w/w)
Figure 6.5: GC Chromatograms of Polyol Esters of Stearic Acid, Acetylated and Analysed using a DB1-ht Column,
Injector at 380°C, Detector at 380°C and Oven Temperature 100°C to 380°C at 8°C/min 1 = Isosorbide mono stearate, 2 = Isosorbide di stearate, 3 = Sorbitan, 4 = Sorbitan mono stearate, 5 = Sorbitan di stearate,
6 = Sorbitan tri stearate, 7 = Sorbitol, 8 = Sorbitol mono stearate, 9 = Sorbitol di stearate
1
2
3
4
5
6
7 8
9
8
9
Sig
nal
(pA
)
Sig
nal
(pA
)
Time (mins) Time (mins)
Time (mins)
Sig
nal
(pA
)
Time (mins)
Sig
nal
(pA
)

147
Isosorbide oleate, sorbitan oleate (~90% sorbitan) and sorbitol oleate prepared from
high purity oleic acid were therefore also acetylated and analysed. These samples are
those detailed in chapter 2, prepared for the initial HPLC work on sorbitan mono
oleate. The comparison of saturated and unsaturated C18 fatty acid esters can be
established, by comparing the chromatograms obtained for the polyol esters based on
oleic and stearic acid.
The chromatograms obtained for polyol esters of oleic acid are shown in figure 6.6.
The chromatogram obtained for isosorbide oleate shows two major peaks, the first
will correspond to isosorbide mono oleate and the later isosorbide di oleate. Around
these major peaks are a number of smaller peaks, these will be isosorbide esters of
different acids, because the purity of the acid was not as high as that purchased from
Aldrich and Avocado for the other esters. Oleic acid is an unsaturated acid and is
more difficult to obtain at high purity than the other fatty acids used in the
investigation which are all saturated.
The chromatogram for the sorbitan esters shows a small group of peaks due to
unreacted sorbitan and two later eluting groups of peaks thought to be due to sorbitan
mono and di oleate. A single peak before the sorbitan mono oleate peak is isosorbide
mono oleate. In the preparation of the sample the conversion from sorbitol to sorbitan
also resulted in some isosorbide, this was determined in the polyol profile of the
sample carried out and detailed in chapter 2.2.

148
Figure 6.6: GC Chromatograms of Polyol Esters of Oleic Acid, Acetylated and
Analysed Using a DB1-ht Column, Injector at 380°C, Detector at 380°C and
Oven Temperature 100°C to 380°C at 8°C/min 1 = Isosorbide mono oleate, 2 = Isosorbide di oleate, 3 = Sorbitan,
4 = Sorbitan mono oleate, 5 = Sorbitan di oleate, 6 = Sorbitan tri oleate,
7 = Sorbitol, 8 = Sorbitol mono oleate, 9 = Sorbitol di oleate
Isosorbide
Oleate
1
2
Sorbitan
Oleate
3
4 5
6
Sorbitol
Oleate
7 8
9
Sig
nal
(pA
)
Sig
nal
(pA
) S
ignal
(pA
)
Time (mins)
Time (mins)
Time (mins)

149
The sorbitol oleate chromatogram shows peaks thought to be due to mono and di
esters, no higher esters are observed, probably because the higher esters are not
sufficiently volatile. Higher esters were expected to be produced because they were
produced for the smaller chain sorbitol esters.
Comparison of chromatograms in figures 6.5 and 6.6, show that the same number of
ester species elute for the esters based on a C18 saturated and unsaturated fatty acid.
Although the retention time for the esters based on oleic acid are slightly shorter than
those based on stearic acid.
6.2.7 Capacity Factor
Effect of Chain Length
The capacity factor was determined for isosorbide mono ester and sorbitol mono ester
with the varying saturated fatty acids and the values are listed in table 6.6 below.
Capacity Factor
Fatty Acid Chain Length Isosorbide Mono Ester Sorbitol Mono Ester
C8 5.0 7.0
C10 6.0 7.8
C12 6.7 8.4
C14 7.6 9.1
C16 8.3 9.8
C18 9.1 10.5
Table 6.6: Capacity Factor of Isosorbide and Sorbitol Mono Esters With
Varying Fatty Acid Chain Lengths
The capacity factor for these two esters was determined because they appear as single
peaks, sorbitan monoesters appear as groups of peaks due to the varying isomers and

150
obtaining a retention time would be difficult. The value for the isosorbide mono ester
is smaller than that for the sorbitol mono ester of the same fatty acid as expected, due
to the different volatilities and therefore the retention on the column. For both esters
studied the capacity factor increases with increasing fatty acid chain length.
The plot of the data is shown in figure 6.7. For both esters studied the capacity factor
increases with increasing fatty acid chain length, this was as expected because as the
fatty acid chain length of the ester increases the volatility will decrease and the ester
will be retained longer. The R2 value of the line for the isosorbide mono esters is
0.9976 and for the sorbitol mono esters 0.9992, indicating a linear relationship
between the capacity factor and fatty acid chain length of the esters. It is assumed a
similar effect would be observed for the higher esters.
R2 = 0.9992
R2 = 0.9976
0
2
4
6
8
10
12
8 9 10 11 12 13 14 15 16 17 18
Fatty Acid Chain Length (C)
Cap
acit
y F
acto
r
Isosorbide Mono Ester
Sorbitol Mono Ester
Figure 6.7: Graph Showing Capacity Factor of Isosorbide and
Sorbitol Mono Esters With Varying Fatty Acid Chain Lengths

151
Effect of Number of Ester Groups:
The GC analysis of the high purity esters showed that for sorbitol decanoate all
possible ester species elute from the GC column. The capacity factor for sorbitol and
each of the possible sorbitol decanoate esters was determined. All the possible
sorbitol ester species did not elute for esters prepared with longer fatty acids, however
the capacity factor was determined for the esters that did elute. The values obtained
are shown in table 6.7 below.
Capacity Factor
Ester Groups C10 C12 C14 C16 C18
0 4.7 4.7 4.7 4.7 4.7
1 7.8 8.4 9.1 9.7 10.4
2 10.1 11.2 12.3 13.2 14.4
3 11.9 13.3 14.6 15.5 N/D
4 13.4 15.0 16.5 N/D N/D
5 14.6 16.4 N/D N/D N/D
6 15.5 N/D N/D N/D N/D
N/D – Not detected
Table 6.7: Capacity Factor of Sorbitol Ester Species Analysed
Using Splitless Injection
The results show that for a specific fatty acid, as the number of ester groups on the
sorbitol increases, the capacity factor increases. This was expected because as the
number of ester groups increases, the volatility will decrease and therefore the
retention on the column will increase
Plotting the data graphically shows that it is curved for each of the sorbitol fatty acid
esters studied and is shown in figure 6.8.

152
6.2.8 Summary of GC Analysis of Polyol Esters using a DB1-ht Column with a
Final Oven Temperature of 380°C:
From the investigation carried out it was found that all of the isosorbide ester
chromatograms showed peaks corresponding to the mono and di esters. Both
isosorbide esters for all fatty acids investigated eluted from the GC column. The
sorbitan ester chromatograms showed that sorbitan mono and di esters for all the fatty
acids eluted from the GC column using the selected GC conditions. Peaks thought to
correspond to tri esters are observed for sorbitan decanoate to sorbitan palmitate but
are smaller for the larger fatty acids of stearic and oleic acid. The tri ester was
observed for the sorbitan esters of decanoate to palmitate and because all the esters
were prepared using the same conditions it is assumed that the tri ester would be
0
2
4
6
8
10
12
14
16
18
0 1 2 3 4 5 6
Number of Ester Groups
Cap
acit
y F
acto
r
C10
C12
C14
C16
C18
Figure 6.8: Graph Showing Capacity Factor of Sorbitol
Esters Analysed Using Splitless Injection
153
produced for the larger fatty acid esters. However due to the larger sizes may not be
sufficiently volatile to fully elute from the column.
As with the isosorbide and sorbitan esters, peaks for the sorbitol mono and di esters of
all the fatty acids were observed on the chromatograms. However as the fatty acid
chain length increased the number of esters eluting decreased. For decanoic acid a
small peak corresponding to sorbitol hexa decanoate was observed, but a hexa ester
was not observed for any of the larger fatty acids. The largest esters observed for
lauric acid was the penta esters and for myristic acid the tetra esters, although they
were small. When a ratio of 1:3 w/w sorbitol: acid chloride was used it was expected
that the tri ester would be the major peak observed, however for the larger fatty acids
no tri ester peaks are observed, this indicates that the esters are not sufficiently
volatile to elute from the column under the conditions detailed. Table 6.8 shows the
esters detected using the conditions detailed in chapter 5.2.4.
The work indicates that GC with splitless injection may be a suitable method of
analysis for characterising the sorbitan mono ester range of Crills produced by Croda.
At the ratio of 1 sorbitol:1.3 fatty acid used in the manufacture of the mono ester
range, it is likely that the mono and di esters will be produced and these can be eluted
from the GC column and identified for all the fatty acids investigated. However the
method will not be suitable for the tri ester range of Crills, which are produced with a
sorbitol to fatty acid ratio to give the higher esters, which can not be eluted from the
GC column using the conditions used in the study.
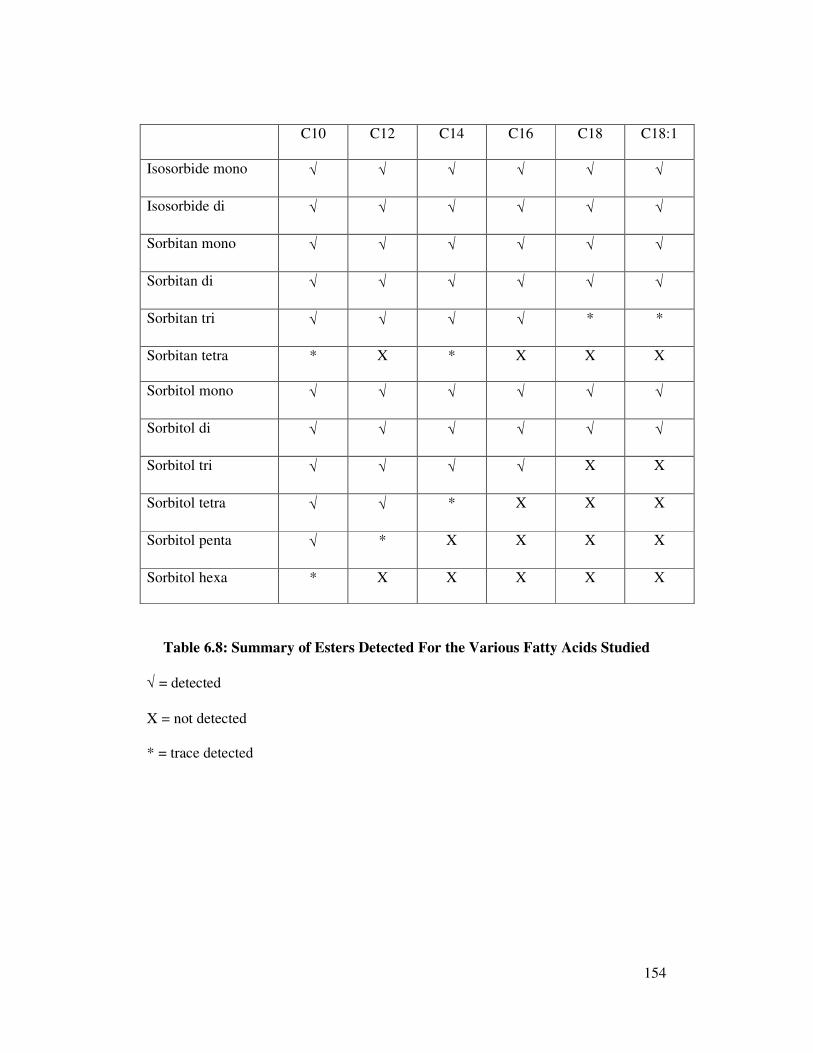
154
C10 C12 C14 C16 C18 C18:1
Isosorbide mono √ √ √ √ √ √
Isosorbide di √ √ √ √ √ √
Sorbitan mono √ √ √ √ √ √
Sorbitan di √ √ √ √ √ √
Sorbitan tri √ √ √ √ * *
Sorbitan tetra * X * X X X
Sorbitol mono √ √ √ √ √ √
Sorbitol di √ √ √ √ √ √
Sorbitol tri √ √ √ √ X X
Sorbitol tetra √ √ * X X X
Sorbitol penta √ * X X X X
Sorbitol hexa * X X X X X
Table 6.8: Summary of Esters Detected For the Various Fatty Acids Studied
√ = detected
X = not detected
* = trace detected

155
6.3 Optimising GC Conditions:
The work carried out on the various polyol esters showed that a large number of the
polyol esters would elute from the GC column. However as the fatty acid chain
length increased the number of ester species that eluted decreased. Therefore it was
decided to investigate other conditions including the use of higher temperatures and
higher temperatures with an alternative column in an attempt to elute more ester
species.
6.3.1 DB1-ht Column, Injector and Final Oven Temperature of 400°C:
The work detailed in chapter 6.1 and 6.2 used an injection and final oven temperature
of 380°C, increasing the injector and oven temperature to 400°C may be sufficient to
volatilise some of the polyol esters which did not volatilise at 380°C, therefore
increasing the number of polyol esters that elute from the GC column and are detected.
The 400°C final oven temperature selected is the upper limit of the DB1-ht column.
The following GC conditions were used to analyse all of the high purity polyol esters
prepared:
Injection temperature: 400°C
Detector temperature: 400°C
Initial oven temperature: 100°C
Ramp rate: 8 °C/min
Final oven temperature: 400°C, held for 5 minutes
Total analysis time: 42.5 minutes
The chromatograms obtained for each of the polyol esters were reviewed and
compared to those obtained in chapter 6.2 when an injector temperature and final

156
oven temperature of 380°C was used. The increased temperature had no effect on the
number of esters detected, the chromatograms obtained were comparable to those in
figures 6.1 – 6.6, but with a slightly longer run time.
6.3.2 HT5 Column:
The use of the increased injector and final oven temperature of 400°C with a DB1-ht
column had no significant effect on the esters eluted from the column, therefore the
use of an alternative GC column with a higher operating temperature was investigated.
The column selected was an aluminium clad HT5 column, which is a unique high
temperature phase, suited for simulated distillation and petroleum applications. This
column has the highest maximum operating temperature available with a maximum
operating temperature up to 480°C. An extensive programme of work was
undertaken using this column. The dimensions of the column used were 12 m x 0.32
mm x 0.1 µm.
6.3.2.1 GC Conditions 1:
The polyol esters of caprylic, stearic and oleic acid were analysed using the GC
conditions detailed in 6.3.1. These are the fatty acid esters with the shortest and
longest chain lengths, the extremes were studied to establish if any differences in
chromatograms were seen using the two different columns with the same operating
conditions. The chromatograms obtained for the various esters using the DB1-ht and
HT-5 column were visually compared and found to be comparable, the number of
esters eluted and resolution obtained were similar for each sample on the two different
columns. The columns are both non-polar and the same operating conditions were
used, therefore the chromatograms were expected to be similar.

157
The capacity factor was determined for isosorbide mono caprylate and stearate and
sorbitol mono caprylate and stearate using the two different columns with the same
operating conditions and the values obtained are shown in table 6.9.
Capacity Factor
DB1-ht Column HT5 Column
Isosorbide Mono Caprylate 5.0 6.2
Sorbitol Mono Caprylate 7.0 8.5
Isosorbide Mono Stearate 10.1 11.2
Sorbitol Mono Stearate 11.5 12.5
Table 6.9: Capacity Factors for Isosorbide and Sorbitol Esters of Caprylic and
Stearic Acid Using the Same GC Conditions on DB1-ht and HT5 Columns
The k' values obtained are slightly higher with the HT5 column compared to the
DB1-ht column, indicating longer retention times, however the HT5 column offers
the possibility of using higher temperatures and therefore is worth pursuing further, to
establish if more ester species can be eluted with higher temperatures.
6.3.2.2 GC Conditions 2:
A higher final oven temperature and detector temperature were used with the HT5
column in an attempt to elute more esters. An injector temperature of 400°C was used
as before because this is the maximum injection temperature possible for the HP5890
GC used.
The following GC conditions were used to analyse all the polyol ester samples
Injector temperature: 400°C

158
Detector temperature: 430°C
Initial oven temperature: 100°C
Ramp Rate: 8°C/minute
Final oven temperature 430°C
The chromatograms obtained were compared to those obtained in chapter 6.2 and it
was found that the increase in the final oven temperature had no effect on the number
of esters eluted.
6.3.2.3 GC Conditions 3:
A final oven temperature and detector temperature of 450°C were tried, which are the
maximum for the GC.
Injector temperature: 400°C
Detector temperature: 450°C
Initial oven temperature: 100°C
Ramp Rate: 8 °C/minute
Final oven temperature 450°C
The above conditions were used to analyse all the polyol esters, however the
chromatograms obtained were still found to be similar to those obtained with the
DB1-ht column and maximum temperatures of 380°C. The increased oven and
detector temperature had no effect on the number of ester species eluted.
6.3.3 Conclusions from Optimisation Investigation:
The investigations carried out using the DB1-ht column and higher temperatures and
the HT5 column found that no more ester species could be eluted then those eluted

159
using the DB1-ht column and injection and final oven temperature of 380°C. The
injection temperature of the GC is limited to 400°C and may be part of the reason.
The HT5 column is stated to be suitable for use up to 480°C, however it was found to
go very brittle and had a tendency to break, the column could not withstand the high
temperatures used for any length of time and therefore would be of limited use for
regular analysis of polyol esters. Due to the HT5 column also offering no advantage
for the separation of polyol esters of various fatty acids compared to the DB1-ht
column further work reverted to the DB1-ht column which is more stable and the
conditions detailed in chapter 6.2.
6.4 GC Analysis of Sorbitan Mono Oleate Prepared from High Purity Oleic Acid
and Manufactured Sorbitan Mono Ester Samples:
The results obtained in chapters 5 and 6.2 have shown that GC has the potential as an
analytical method for comparison of a range of sorbitan mono esters manufactured by
Croda, although as the chain length of the fatty acid used increases it is not possible to
elute all of the higher ester species. Only samples containing essentially one polyol
and prepared from high purity fatty acid feed stocks have been analysed, with the
exception of sorbitan caprylate (chapter 5) when a sample of material manufactured
on the plant was analysed, although this is produced from a high purity fatty acid
feedstock. Therefore more complex samples were analysed including SMO prepared
from high purity oleic acid and manufactured sorbitan mono ester samples that have
varying polyols and fatty acids.
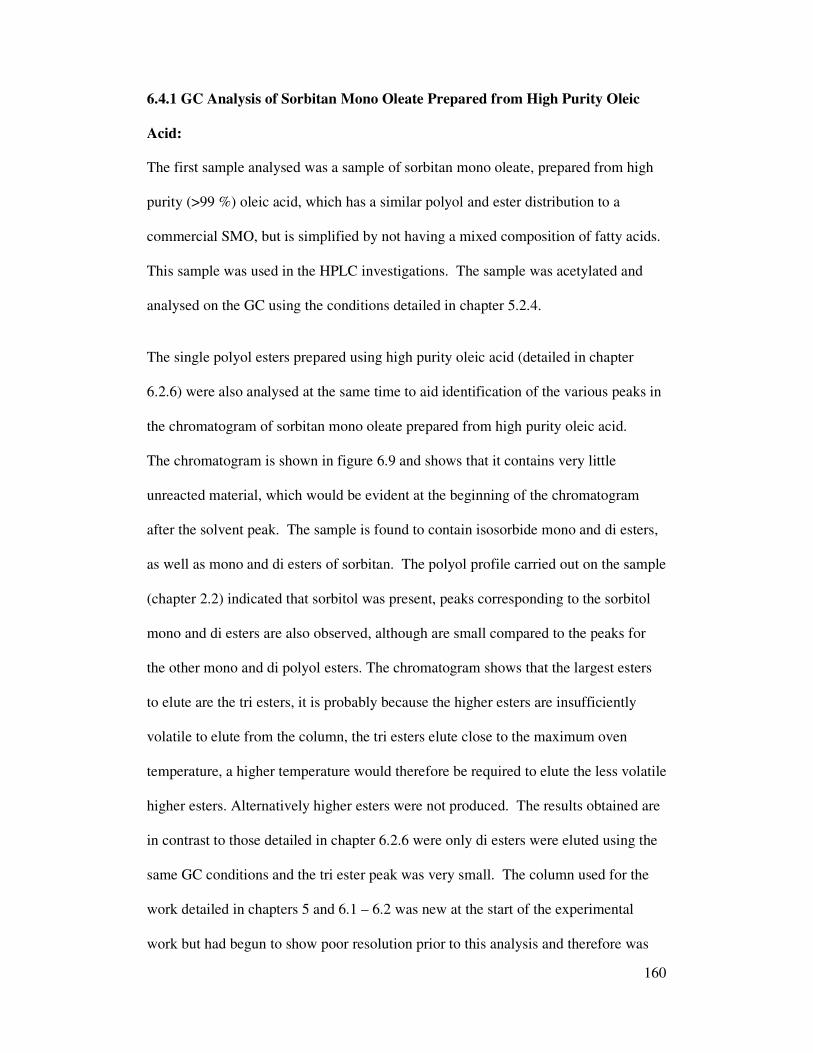
160
6.4.1 GC Analysis of Sorbitan Mono Oleate Prepared from High Purity Oleic
Acid:
The first sample analysed was a sample of sorbitan mono oleate, prepared from high
purity (>99 %) oleic acid, which has a similar polyol and ester distribution to a
commercial SMO, but is simplified by not having a mixed composition of fatty acids.
This sample was used in the HPLC investigations. The sample was acetylated and
analysed on the GC using the conditions detailed in chapter 5.2.4.
The single polyol esters prepared using high purity oleic acid (detailed in chapter
6.2.6) were also analysed at the same time to aid identification of the various peaks in
the chromatogram of sorbitan mono oleate prepared from high purity oleic acid.
The chromatogram is shown in figure 6.9 and shows that it contains very little
unreacted material, which would be evident at the beginning of the chromatogram
after the solvent peak. The sample is found to contain isosorbide mono and di esters,
as well as mono and di esters of sorbitan. The polyol profile carried out on the sample
(chapter 2.2) indicated that sorbitol was present, peaks corresponding to the sorbitol
mono and di esters are also observed, although are small compared to the peaks for
the other mono and di polyol esters. The chromatogram shows that the largest esters
to elute are the tri esters, it is probably because the higher esters are insufficiently
volatile to elute from the column, the tri esters elute close to the maximum oven
temperature, a higher temperature would therefore be required to elute the less volatile
higher esters. Alternatively higher esters were not produced. The results obtained are
in contrast to those detailed in chapter 6.2.6 were only di esters were eluted using the
same GC conditions and the tri ester peak was very small. The column used for the
work detailed in chapters 5 and 6.1 – 6.2 was new at the start of the experimental
work but had begun to show poor resolution prior to this analysis and therefore was

161
replaced with another DB1-ht column with the same dimensions but from a different
batch. The increase in ester species detected using columns from the same
manufacturer but different batches shows that if the method was used routinely, a
system suitability would be required prior to analysis of samples, to ensure the
column eluted the maximum number of ester species possible.
6.4.2 Analysis of Real Samples:
The analysis of the sorbitan mono oleate sample prepared from high purity oleic acid
was successful, therefore a number of real sorbitan ester samples produced by Croda
were also analysed by GC, they were:
Sorbitan mono laurate
Sorbitan mono palmitate
Sorbitan mono stearate
Sorbitan mono oleate
These are part of the range of sorbitan mono esters produced by Croda and vary in
fatty acid feedstock used.

1
2
3
4
5
6
7
Figure 6.9: GC Chromatogram of Sorbitan Mono Oleate Made Using High Purity Oleic Acid
1 = Isosorbide mono oleate, 2 = Sorbitan mono oleate, 3 = Sorbitol mono oleate, 4 = Isosorbide di oleate
5 = Sorbitan di oleate, 6 = Sorbitol di oleate, 7 = Sorbitan tri oleate
Sig
nal
(pA
)
Time (mins)
163
6.4.2.1 Standard Croda Analysis of Sorbitan Esters:
The samples were analysed using Croda’s standard methods to establish the usual
information on them including AV, hydroxyl value, ester distribution (GPC), polyol
profile and lipid profile.
Acid value is defined as the number of milligrams of potassium hydroxide required to
neutralise the free acids in 1 gram of the sample. Therefore gives an indication of any
free acid, this is usually low because the acid reacts to form esters, by following the acid
value during production it is possible to establish when the acid has reacted and the
reaction can be stopped.
Hydroxyl value is the number of milligrams of potassium hydroxide required to
neutralize the amount of acetic acid capable of combining, by acetylation, with 1 g of
the test sample. It gives an indication of the free hydroxyl groups. Each sorbitan
ester has a specification for the hydroxyl value which must be met.
Ester Distribution is determined by GPC as detailed in chapter 2.2.2. This is an LC
separation based on molecular size and gives an indication of the ester species present.
It is routinely used to give an indication of the ester species present, although is only
possible for some sorbitan esters and resolution is limited with tri and higher esters
eluting as one peak.
Polyol profiles determine the level of each polyol present in a sorbitan ester and is
carried out as detailed in chapter 2.2.

164
Fatty acid profiles give information on the range of fatty acid used to prepare the esters.
The sorbitan esters are saponified and the resulting fatty acids are converted to methyl
esters and subsequently analysed by GC.
The results obtained for the sorbitan mono ester samples can be found in table 6.10 and
the GPC chromatograms are shown in figure 6.10.
6.4.2.2 GC Analysis of Manufactured Sorbitan Mono Esters Samples:
The samples were analysed by GC using the method detailed in chapter 5.2.2. The
single high purity polyol esters were also analysed to aid identification of the peaks in
the manufactured samples.
Sorbitan Mono Laurate:
The chromatogram obtained for sorbitan mono laurate is shown in figure 6.11. The
chromatogram shows a large number of peaks which indicates a large number of
components present and shows the complex nature of the material. The fatty acid
profile for sorbitan mono laurate shows that the fatty acid feedstock is mixed and
despite the material being called sorbitan monolaurate, lauric acid constitutes less than
50 % of the fatty acids, the fatty acids present range from caprylic acid (C8:0) to
linoleic acid (C18:2). The fatty acid range used for the production of sorbitan mono
laurate is more varied than for the other sorbitan esters and is the reason for the
complex nature of the material. The polyol profile showed that the material contained
only isosorbide and sorbitan, the sorbitol had been fully dehydrated and therefore the
chromatogram could have been more complex if sorbitol esters were also present.
165
The standard results are typical of sorbitan mono laurate. Analysis of manufactured
sorbitan mono laurate by GPC has not been possible due to the large number of
components resulting in poor resolution and no identification of components being
possible. The GC chromatogram shows that manufactured sorbitan mono laurate is
too complex to analyse and characterise by GC, there are too many peaks and
insufficient resolution to make identification of components possible. The large
number of components present in the sorbitan mono laurate is due to the large range
of fatty acids used. However it may be possible to use the GC chromatogram as a
‘finger print’ type analysis for comparison of different samples.
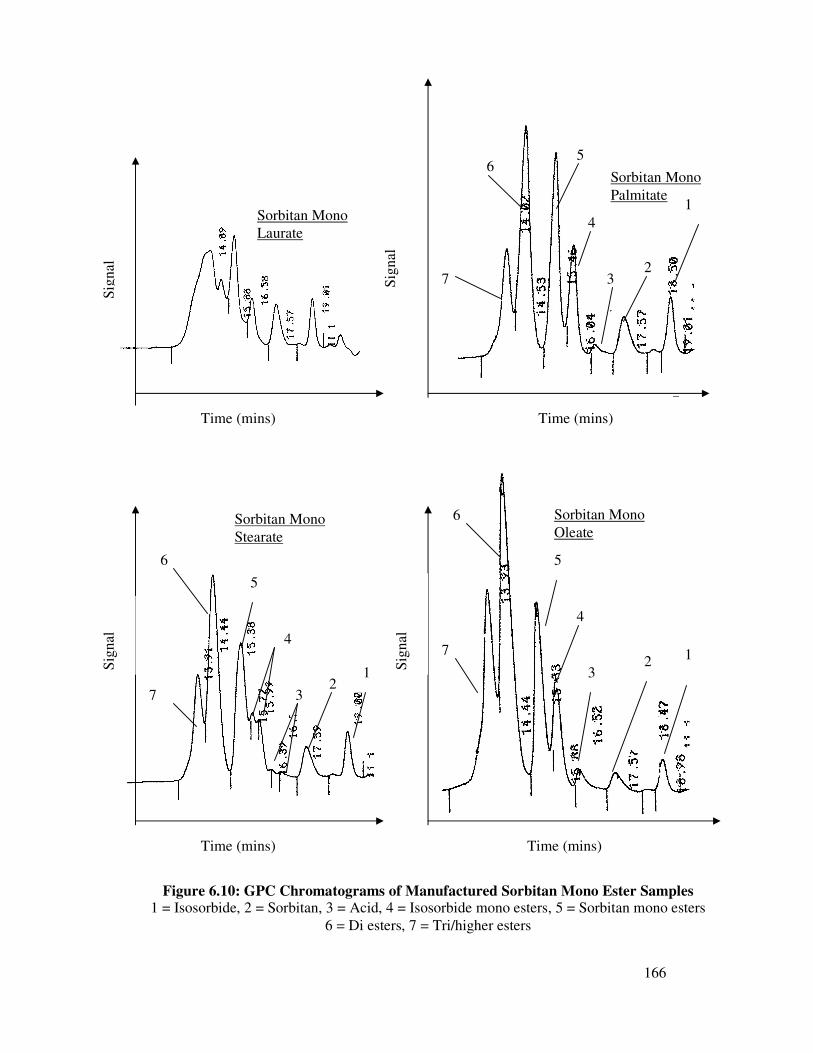
166
Sorbitan Mono
Stearate
Sorbitan Mono
Oleate
Sorbitan Mono
Palmitate
Sorbitan Mono
Laurate
Figure 6.10: GPC Chromatograms of Manufactured Sorbitan Mono Ester Samples 1 = Isosorbide, 2 = Sorbitan, 3 = Acid, 4 = Isosorbide mono esters, 5 = Sorbitan mono esters
6 = Di esters, 7 = Tri/higher esters
1 2
3
4
5
6
7
1 2
3
4
5
6
7
1
2 3
4
5 6
7
Time (mins) Time (mins)
Time (mins) Time (mins)
Sig
nal
Sig
nal
Sig
nal
Sig
nal

167
Sorbitan
Mono
Laurate
Sorbitan
Mono
Palmitate
Sorbitan
Mono
Stearate
Sorbitan
Mono
Oleate
Acid Value 5.4 5.6 9.4 6.4
Hydroxyl value 336 284 246 191
Polyol Profile (%)
Isosorbide 27 24 19 20
Sorbitan 73 76 77 79
Sorbitol N/D N/D 4 N/D
Ester Distribution (%) *
Tri/higher esters 15 20 30
Di esters 30 35 35
Sorbitan mono esters 25 20 17
Isosorbide mono esters 15 8 10
Acid 3 3 4
Sorbitan 6 3.5 2
Isosorbide 5 2.5 2
Fatty acid Profile (%):
C8:0 2 N/D N/D N/D
C10:0 4.3 N/D N/D N/D
C12:0 47.5 0.8 N/D 0.2
C14:0 21.6 1.6 2.6 2.2
C16:0 11.6 93.7 42.9 4.8
C16:1 N/D N/D N/D 4.3
C18:0 3.5 3.2 49 1.7
C18:1 8.3 N/D 0.4 77.3
C18:2 1.2 N/D N/D 2.6
C20:0 N/D N/D 0.6 N/D
C20:1 N/D N/D N/D 0.6
C22:0 N/D N/D 0.1 N/D
Others N/D 0.7 4.4 6.3
Table 6.10: Standard Analysis of Manufactured Sorbitan Mono Ester Samples
* Not possible due to poor resolution and peak identification not possible

Figure 6.11: GC Chromatogram of Manufactured Sorbitan Mono Laurate
Time (mins)
Sig
nal
(pA
)

169
Sorbitan Mono Palmitate:
The standard analysis carried out showed that the sorbitan mono palmitate sample
contained only isosorbide and sorbitan as with the sorbitan mono laurate, however the
fatty acid feed stock was found to be less varied with palmitic acid being the major
constituent (94 %). The chromatogram was therefore expected to have less peaks
than the sorbitan mono laurate and this was found to be the case, the chromatogram
obtained is shown in figure 6.12. It is similar to that obtained for sorbitan mono oleate
prepared from high purity oleic acid but the esters have a slightly shorter retention
time, this will be because they are more volatile due to being based on a shorter fatty
acid, also there is evidence of unreacted polyols at the beginning of the
chromatogram. The chromatogram shows that the sample contains isosorbide and
sorbitan mono and di esters. The largest esters to elute were the tri esters, the highest
esters that could be present in the sample would be sorbitan tetra esters due to no
sorbitol being present, however it is uncertain if tetra esters would be produced at the
ratio of 1:1.3 w/w sorbitol:acid used in the production of this material and it is
probable they would not elute from the column even if they were produced.
The GC analysis shows that it may offer advantages over GPC analysis because the
mono esters are baseline resolved unlike with GPC. Also the di and tri esters are well
separated by GC but not by GPC.
Sorbitan Mono Stearate:
The routine analysis indicated that all three polyols are present in the sample,
although sorbitol is only present at a low level. The fatty acid profile showed that the
esters were prepared from a mixed feedstock containing largely palmitic and stearic

170
acid in almost equal quantities. Due to two major fatty acids being used the
chromatogram was expected to be more complex than that of the sorbitan mono
palmitate, the esters present in sorbitan mono palmitate were expected along with
esters based on stearic acid. The chromatogram obtained is shown in figure 6.13, the
mono ester region has doublets due to esters of the two main acids. Two isosorbide
mono ester peaks are identified, with the shorter chain length, more volatile,
isosorbide mono palmitate eluting prior to isosorbide mono stearate. Two sorbitan
mono ester group of peaks are also seen.
The di and tri ester regions do not show distinct doublets due to the different fatty
acids but the peak area is broader than when the esters are prepared from essentially
one fatty acid, as in sorbitan mono palmitate. Due to the fatty acid feedstock, esters
based on palmitic and stearic acid could be produced as well as esters with mixed
fatty acids. As observed with sorbitan mono oleate prepared from high purity oleic
acid and manufactured sorbitan mono palmitate the highest esters eluted are thought
to be tri esters, it is possible that this consists of sorbitan and sorbitol tri esters of both
acids and mixed acid esters.
Again it appears that GC analysis may offer advantages over GPC, largely due to the
baseline separation of the various mono ester species which is not possible with GPC.

1
3
4
2
5
Figure 6.12: GC Chromatogram of Manufactured Sorbitan Mono Palmitate 1 = Isosorbide mono plamitate, 2 = Sorbitan mono palmitate, 3 = Isosorbide di palmitate,
4 = Sorbitan di palmitate, 5 = Sorbitan tri palmitate
S
ignal
(pA
)
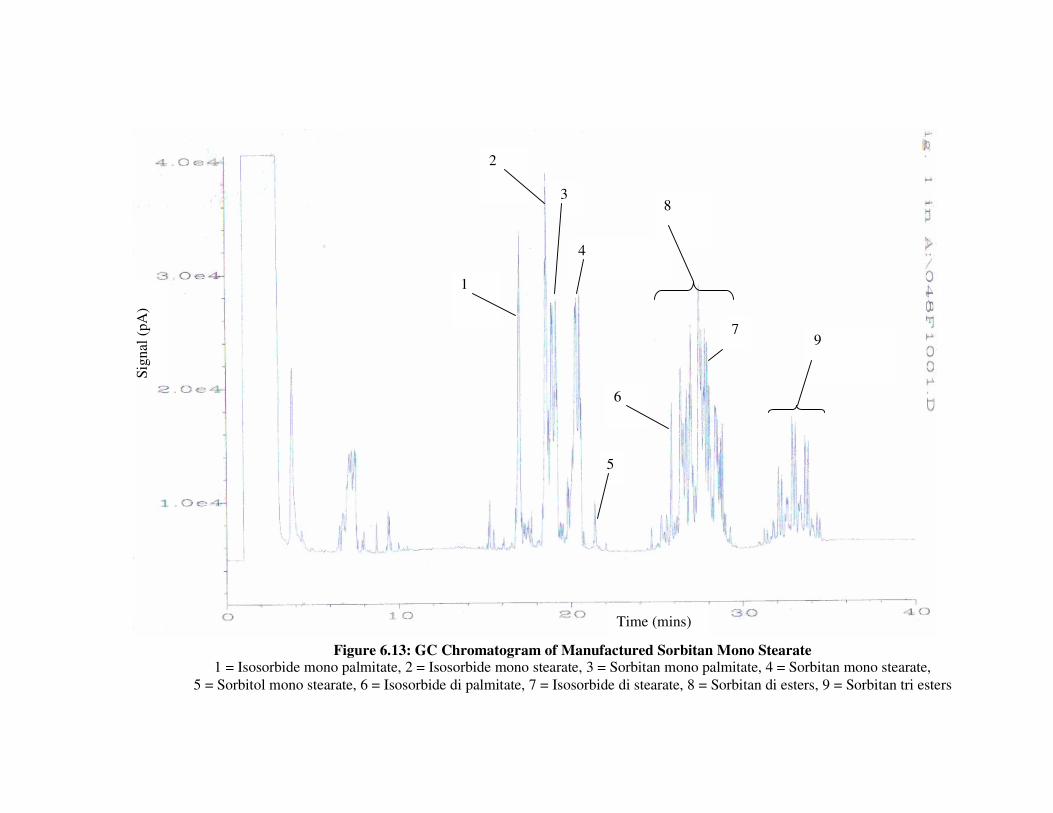
Figure 6.13: GC Chromatogram of Manufactured Sorbitan Mono Stearate 1 = Isosorbide mono palmitate, 2 = Isosorbide mono stearate, 3 = Sorbitan mono palmitate, 4 = Sorbitan mono stearate,
5 = Sorbitol mono stearate, 6 = Isosorbide di palmitate, 7 = Isosorbide di stearate, 8 = Sorbitan di esters, 9 = Sorbitan tri esters
1
2
3
4
6
7
5
9
8
Sig
nal
(pA
)
Time (mins)

173
Sorbitan Mono Oleate:
The chromatogram obtained for sorbitan mono oleate is shown if figure 6.14, it is
similar to that obtained for sorbitan mono oleate prepared from high purity oleic acid
although the di and tri ester peaks are broader due to the mixed fatty acid feedstock,
esters based on oleic acid could be present as well as mixed fatty acid esters. A single
peak due to isosorbide mono oleate is evident followed by a group of peaks thought to
be sorbitan mono oleate. The di esters of isosorbide and sorbitan are also observed
followed by a group of peaks thought to be the sorbitan tri oleate esters. The polyol
profile indicated that no sorbitol was present, that it had been fully dehydrated,
therefore sorbitol esters were not expected and were not seen. The largest esters
possible would therefore be sorbitan tetra esters, however these were not seen with the
other sorbitan mono ester samples, the largest esters to elute from the column were
again sorbitan tri esters.
As seen with sorbitan mono palmitate and sorbitan mono stearate GC may be a
possible alternative to GPC analysis for determining ester distributions for sorbitan
mono oleate.

1 2
3
4
5
Figure 6.14: GC Chromatogram of Manufactured Sorbitan Mono Oleate
1 = Isosorbide mono oleate, 2 = Sorbitan mono oleate, 3 = Isosorbide di oleate, 4 = Sorbitan di oleate, 5 = Sorbitan tri esters
Time (mins)
Sig
nal
(pA
)

175
6.4.3 Summary:
The work carried out shows that GC with splitless injection can successfully be used
for the analysis of a number of sorbitan mono ester samples, although due to the
complex nature of sorbitan mono laurate characterisation is not possible. It was found
that it is not possible to elute all the ester species from the GC column for the higher
fatty acid chain length esters, however a number of esters do elute with the tri esters
being the largest to elute for the real samples analysed. It was found that the various
mono ester species are well resolved and these are well separated from the di and tri
esters which are well separated from each other, therefore comparison of these ester
species between samples would be possible. Currently the best method available for
comparison of differences in ester species in manufactured sorbitan mono ester
samples is GPC, however it does appear that GC may offer advantages over it due to
better resolution of the various esters, although further work including work on
repeatability is required.

176
6.5 Limited Validation:
Validation is the assessment of a method to ensure that it is fit for purpose. Validation
ensures that results obtained are reliable, consistent and there is confidence in the
results, this is carried out prior to routine use of the analytical procedure. A number
of characteristics can be assessed including specificity, linearity, precision, accuracy,
limit of detection, limit of quantification and robustness. The characteristics used are
dependent on the method and its proposed application. The GC work carried out on
the high purity esters and real samples showed that GC was successful in the analysis
of sorbitan mono esters and could be used routinely to give information about material
made. Therefore a limited validation programme was performed.
The accuracy of an analytical procedure expresses the closeness of the determined
value with the true value. The samples to be analysed by this GC method are complex
mixtures and currently it is not possible to establish the true value of each component
and therefore determination of accuracy would not be possible. Also the method under
investigation will involve the comparison of peak areas of different samples and
therefore this characteristic is not relevant. The linearity verifies that the sample for
analysis is in the concentration range were the analyte response is linearly
proportional to concentration. It is not possible to investigate this parameter in the
timescale given due to the complex nature of the samples and it is not envisaged that
there will be major differences between the concentration of components in the
samples. The method is for comparison of samples, the samples will be analysed at
concentrations where the limit of detection and quantification will also be unnecessary.
Therefore the two important parameters to be investigated were specificity and
precision.

177
Specificity demonstrates that the analytical procedure is specific for an analyte, in the
case of the method under study, it is important no peaks will coelute with those of the
sample. The GC method investigates all of the various components of the sample, the
only other things present which may give a response that cannot be distinguished from
the analytes will be from the acetylating reagents. Analysis of these showed no peaks
that would interfere with those of the sample. Therefore the method is specific to the
analytes in the sample.
Precision is a measure of how close the data values are to each other under stipulated
conditions and is usually stated in terms of standard deviation (SD) and relative
standard deviation (RSD). This validation characteristic can be considered at various
levels. Instrument precision is obtained by making repeat injections of a sample
solution and tests the performance of the chromatographic instrument. Analysis
precision is obtained by analysis of a sample which has been independently prepared
according to the procedure over several days, using one laboratory and one piece of
equipment. Intermediate precision is obtained when analysis is performed by multiple
analysts, using multiple instruments on multiple days in one laboratory. Only one
instrument was available for the study therefore intermediate precision was not
investigated, along with reproducibility which involves multiple laboratories.
The precision study was performed on sorbitan mono oleate prepared from high purity
oleic acid, this samples has the mixed polyol composition of a real sample but will be
simpler than a real sorbitan mono oleate sample manufactured on a plant at Croda
because of the putiy of the acid. A real SMO sample manufactured at Croda was also
analysed for precision.

178
Instrument precision – the sample was acetylated as detailed in chapter 5.1.1 and the
resulting solution injected six times on to the GC using the GC conditions detailed in
chapter 5.2.4.
The chromatograms obtained were integrated and due to the complex nature of the
samples not all peaks were investigated for precision, the first major eluting peak
(isosorbide mono oleate) and the last eluting peaks (tri esters) were used for the
precision investigation. An assumption was made that if the first and last peaks were
precise the others also would be. The peak areas obtained were investigated, this gives
an indication that the same amount of sample is being injected each time to give a
similar peak area. The area percentages were also considered because this will relate
the two esters under investigation to the other components in the mixture.
The results obtained using peak area were:
SMO (High purity acid) Manufactured SMO
Injection Isosorbide Mono- Tri Ester Isosorbide Mono- Tri Ester
Peak Area Peak Area Peak Area Peak Area
1 274471 214226 419459 335907
2 277478 203191 395930 360259
3 281423 167758* 420532 365864
4 273085 232028 399558 374845
5 270108 256893 421265 376553
6 275145 250475 422128 390735
Average 275285 231363 413145 367361
SD 3868 22939 12017 18595
RSD (%) 1.4 9.9 2.9 5.1
Table 6.11: Peak Areas Obtained for the Two Esters Investigated for Instrument
Precision, SMO Prepared From High Purity Oleic Acid and Manufactured SMO
*This value was found to be an outlier using the Dixon Q test and therefore was
rejected.

179
The acceptance criteria for precision, depends very much on the type of analysis.
While for compound analysis in pharmaceutical quality control precision of better
than 1 % RSD is easily achieved, for more complex samples the precision RSD is
much higher because the precision is dependent on the sample matrix, the
concentration of the analyte and on the analytical technique and therefore it can vary
between 2 % and more than 20 %. Due to the complex nature of the samples under
investigation the RSD values obtained for instrument precision are thought to be
acceptable, all were <20 %. This indicated that there was little variation in the peak
areas between injections, this was particularly evident for the isosorbide mono oleate
peak which had RSD of 1 % for the SMO prepared from high purity oleic acid and 3
% for the manufactured SMO. The RSD was greater for the tri ester peak, indicating
more variation, however this may be due to the fact that this is a group of peaks and
integration was more difficult.

180
The results obtained when studying the area percent were:
SMO (high purity acid) Manufactured SMO
Injection Isosorbide Mono- Tri Ester Isosorbide Mono- Tri Ester
Area % Area % Area % Area %
1 9.2 7.2 13.3 10.7
2 9.3 6.8 12.4 11.3
3 9.4 5.6* 13.0 11.3
4 8.9 7.6 12.0 11.2
5 8.6 8.2 12.5 11.2
6 8.5 7.8 12.4 11.5
Average 9.0 7.5 12.6 11.2
SD 0.4 0.5 0.5 0.3
RSD (%) 4.2 7.2 3.7 2.4
Table 6.12: Area Percentages Obtained for the Two Esters Investigated for
Instrument Precision, SMO Prepared From High Purity Oleic Acid and
Manufactured SMO
* This value was found to be an outlier using the Dixon Q test and therefore was
rejected.
Using the area percentages for the peaks the RSD are comparable to when the peak
areas were used, showing little variation between injections, this indicated that the
other components also showed little variation. The area percent results show that the
two esters considered are only a small proportion of the components in the sample,
both being <20 % of total components in SMO prepared from high purity oleic acid
and <25 % in manufactured SMO.
The results show that when a sample is prepared and injected on the GC several times
there is little variation, the chromatograms obtained are similar.

181
The chromatograms obtained for each injection were overlaid for both samples under
investigation and visual inspection showed that the chromatograms for each injection
are very similar. All of the peaks looked comparable not just those for the isosorbide
mono ester and tri ester peaks used in the precision investigation. The chromatograms
obtained for the sorbitan mono oleate prepared from high purity oleic acid are shown
in figure 6.15.
Analysis Precision:
To determine the analysis precision of the method each sample was independently
prepared five times as detailed in chapter 5.1.1 and then analysed as detailed in 5.2.4.
The analysis was carried out over several days.
As for instrument precision, the chromatograms obtained were integrated and the peak
area and area percent considered for the isosorbide mono oleate and tri ester peaks to
establish the analysis precision.

Figure 6.15: Overlaid GC Chromatograms of SMO Prepared from High Purity Oleic Acid for Instrument
Precision Study
Time (mins)
Sig
nal
(pA
)

183
Using peak area the following results were obtained:
SMO (high purity acid) Manufactured SMO
Injection Isosorbide Mono- Tri Ester Isosorbide Mono- Tri Ester
Peak Area Peak Area Peak Area Peak Area
1 285523 299243 398679 293419
2 278455 313224 371552 303462
3 330451 342777 388544 256314
4 289290 307539 409224 310339
5 276876 252963 419459 313645
Average 292119 303149 397492 295436
SD 22022 32500 18537 23199
RSD (%) 7.5 10.7 4.7 7.9
Table 6.13: Peak Areas Obtained for the Two Esters Investigated for Analysis
Precision
The RSD values are <20 % and therefore are thought to be acceptable considering the
complex nature of the samples. The samples were acetylated using the same weight
of sample and volume of acetylating reagents and this has resulted in the peak areas
investigated being very similar despite the sample being independently prepared for
each injection. There is little variation in the peak areas, which infers that the esters
are being fully acetylated each time.

184
Using Area percent the results in table 6.14 were obtained.
SMO (high purity acid Manufactured SMO
Injection Isosorbide Mono- Tri Ester Isosorbide Mono- Tri Ester
Area % Area % Area % Area %
1 10.6 11.1 13.6 10
2 10 11.3 13.8 11.3
3 9.7 10.1 13.3 8.8
4 9.7 10.3 13.5 10.2
5 9.6 8.8 13.1 9.8
Average 9.9 10.3 13 10
SD 0.4 1.0 0.3 0.9
RSD (%) 4.1 9.6 2.0 8.9
Table 6.14: Area Percentages obtained for the Two Esters Investigated for
Analysis Precision
The area percent result gave acceptable RSDs, with all being ≤10 %, indicating little
variation in the results obtained from the independently prepared sample as when
peak area was used. The area percent would be the parameter used for the analysis,
because the object of the method is comparison between peaks of different samples
and using this parameter removes any discrepancies that would occur due to varying
weights/volumes used and/or losses.
The chromatograms obtained for each of the independently prepared sample were
overlaid and the chromatograms showed that each of the injections for the
independently prepared sample are very similar for all the components not just the
isosorbide mono oleate and tri esters, as with instrument precision. The procedure can
therefore be considered to be precise.

185
Conclusion of limited validation:
The results obtained from this limited validation show that the method is specific and
precise for sorbitan mono oleate. If a sample is prepared and injected several times on
the GC there will be very little difference in the results because the GC analysis is
repeatable. Also if the same weights and volumes are used to independently prepare a
sample there is very little variation in the peak area results because the acetylation
method is also repeatable. Both parts of the method are precise indicating that the
method is suitable for the analysis of samples, with repeatable analysis being possible.
186
7. GC Analysis of Sorbitan Esters Using On-Column Injection:
The work detailed in chapter 6 showed that GC analysis was a success for the analysis
of sorbitan mono esters including sorbitan mono oleate, which could not be analysed
successfully by HPLC due to lack of repeatability, in contrast the GC analysis of
SMO was found to be repeatable. However it was found that as the fatty acid chain
length of the polyol esters increased the number of ester species eluting decreased and
as a consequence a number of ester species of SMO are not detected by GC. It was
felt that the limitation of the method may be a consequence of using a split/splitless
injector which may not have resulted in complete transfer of material onto the column
despite using the maximum operating temperature for the injector.
Therefore an investigation into the use of an alternative injection technique was felt to
be worthwhile, due to the purchase of GC’s capable of on-column injection by Croda.
This technique applies the liquid sample directly to the column and is therefore
thought to eliminate the errors associated with flash vaporisation techniques. The
high boiling compounds with lower volatility are placed on the front of the column,
therefore the problem of them not reaching the column due to incomplete vaporisation
by other injection methods is eliminated. A study was therefore to be carried out
similar to that detailed in chapter 6 but using on-column injection.
7.1 Analysis using On-Column Injection:
7.1.1 Gas Chromatograph:
The GC used is a Perkin Elmer Autosystem XL fitted with a FID and uses a
programmable split/splitless (PSS) on-column mode. An hourglass liner and the oven
programme mode are used, a 0.53 mm id column is used and is inserted into the hour
187
glass liner, a special syringe is required that has a needle outside diameter of 0.47
mm, this enables the syringe to enter the column and deposit the sample directly onto
the column.
7.1.2 GC Column:
The GC columns used for the GC work detailed in chapters 5 and 6 were a DB1-ht
column and a HT5 column. The DB1-ht is not commercially available with an
internal diameter of 0.53 mm which is required for on-column work and previous
work found the HT5 column to become very brittle with high temperatures. It was
therefore necessary to find a column that was suitable for on-column analysis. The
column selected was a WCOT ultimetal 10 m x 0.53 mm with coating HT SIMDIST
CB, which is an unbreakable inert ultimetal capillary column guaranteed to a
maximum temperature of 450°C. It is only available with 0.53 mm id and therefore is
suitable for on-column analysis.
7.1.3 Operating Temperature:
The maximum operating temperature using the DB1-ht column was 400°C and this
upper temperature was the starting point for the on-column work, with an initial
temperature of 100°C.
Initial temperature: 100°C
Ramp rate: 8°C/min
Final temperature: 400°C (held for 5 mins)
Detector temperature: 400°C
Carrier gas: Helium
Flow rate: 1 ml/min

188
Injection volume: 1 µl
7.2 GC Analysis of Polyol Esters
7.2.1 Samples:
The previous work using the DB1-ht and HT5 columns was a study to find out the
ester species which would elute from the column as the fatty acid chain length of the
polyol esters increased and therefore became less volatile. A similar approach was
therefore carried out with the on-column analysis, starting with the polyol esters of
caprylic acid and finishing with the polyol esters of stearic and oleic acid. The
samples used were those prepared and detailed in chapters 2, 5.3, 6.1 and 6.2.6, with
each being acetylated as detailed in chapter 5.1.1 and analysed using the GC
conditions detailed in 7.1.
Note: It was only possible to analyse sorbitol laurate prepared at 1:1.5 w/w
sorbitol:acid chloride due to insufficient sample of the 1:3 w/w ratio material. Due to
lack of availability of the lauryl chloride starting material preparation of more was not
possible.
7.2.2 Polyol Esters of Caprylic Acid:
The chromatograms obtained for each of the polyol esters of caprylic acid are shown
in figure 7.1.
The isosorbide caprylate chromatogram shows three major peaks well resolved from
each other. The first peak to elute just after the solvent peak is due to isosorbide. The
two other peaks will be due to isosorbide mono caprylate and isosorbide di caprylate,
with the di ester being the last to elute because it is larger and therefore will be less
189
volatile. Two smaller peaks are also observed and will probably be isosorbide mono
and di esters of a larger fatty acid produced due to the starting material only being 98
% pure. The chromatogram shows that both possible isosorbide esters of caprylic
acid will elute from the column and be detected using on-column injection.
The sorbitan caprylate chromatogram shows that unreacted isosorbide and sorbitan
are present, this was expected because the polyol profile of the sample showed that it
was essentially sorbitan but did contain some isosorbide (chapter 5.3.2). A peak
elutes after the unreacted polyols and will be due to isosorbide mono caprylate, the
retention time of this peak is the same as that of isosorbide mono caprylate seen in the
previous chromatogram. The next large peaks to elute are groups of peaks and are
thought to correspond to sorbitan mono, di and tri caprylate. A small group of peaks
are also observed between 22 and 23 minutes and could be due to sorbitan tetra
caprylate. The work has therefore shown that it is also possible to elute all the
possible sorbitan caprylate ester species using on-column injection.

Figure 7.1: GC Chromatograms of Polyol Esters of Caprylic Acid, Acetylated and Analysed Using an On-Column Injector,
Detector at 400°C and Oven Temperature 100°C to 400°C at 8°C/min 1 = Isosorbide, 2 = Isosorbide mono caprylate, 3 = Isosorbide di caprylate, 4 = Sorbitan,
5 = Sorbitan mono caprylate, 6 = Sorbitan di caprylate, 7 = Sorbitan tri caprylate, 8 = Sorbitan tetra caprylate,
9 = Sorbitol, 10 = Sorbitol mono caprylate, 11 = Sorbitol di caprylate, 12 = Sorbitol tri caprylate,
13 = Sorbitol tetra caprylate, 14 = Sorbitol penta caprylate, 15 = Sorbitol hexa caprylate
Isosorbide Caprylate
Sorbitan Caprylate
Sorbitol Caprylate
(1:1.5 w/w)
Sorbitol Caprylate
(1:3 w/w)
1 2
3
9
10
11
12
13
15
14
9
10
11 12
13
14
15
4
5
6
7
8
1
2
Time (mins) Time (mins)
Time (mins) Time
(mins)
Res
ponse
(m
V)
Res
ponse
(m
V)
Res
ponse
(m
V)
Res
ponse
(m
V)
191
Two chromatograms are shown for sorbitol caprylate, one for the sample prepared
with a ratio of 1:1.5 w/w sorbitol:octanoyl chloride and the other 1:3 w/w. The
chromatogram obtained for the material prepared at a 1:1.5 w/w ratio shows a broad
peak thought to be due to unreacted sorbitol followed by six peaks thought to be
sorbitol mono, di, tri, tetra, penta and hexa caprylate and therefore showing that all
possible sorbitol caprylate esters were prepared and eluted from the column. The
largest peaks are due to the mono and di ester as expected at a preparation ratio of 1
sorbitol:1.5 octanoyl chloride, the tri ester peak is considerably smaller and the last
three peaks smaller still. The chromatogram obtained for sorbitol caprylate prepared
using 1:3 w/w ratio shows a very small peak due to free sorbitol and then again peaks
corresponding to all six possible sorbitol esters of caprylic acid. The largest peaks are
due to the di and tri esters and will be due to the increase in the octanoyl chloride
compared to the previous sample. The tetra, penta and hexa peaks are also large
compared to the previous chromatogram.
The study showed that all the possible polyol ester species of caprylic acid will elute
from the column when using on-column injection.
7.2.3 Polyol Esters of Decanoic Acid:
The chromatograms obtained for each of the polyol esters of decanoic acid are shown
in figure 7.2.
The chromatogram obtained for the isosorbide decanoate shows peaks that correspond
to free isosorbide and isosorbide mono and di ester.

-
Figure 7.2: GC Chromatograms of Polyol Esters of Decanoic Acid, Acetylated and Analysed Using an On-Column Injector,
Detector at 400°C and Oven Temperature 100°C to 400°C at 8°C/min 1 = Isosorbide, 2 = Isosorbide mono decanoate, 3 = Isosorbide di decanoate, 4 = Sorbitan, 5 = Sorbitan mono decanoate, 6 = Sorbitan di
decanoate, 7 = Sorbitan tri decanoate, 8 = Sorbitan tetra decanoate, 9 = Sorbitol, 10 = Sorbitol mono decanoate, 11 = Sorbitol di decanoate,
12 = Sorbitol tri decanoate, 13 = Sorbitol tetra decanaote, 14 = Sorbitol penta decanoate, 15 = Sorbitol hexa decanoate
Isosorbide Decanoate
Sorbitan Decanoate
Sorbitol Decanoate
(1:1.5 w/w)
1
2 3
9
10 11
13 14
15
Sorbitol
Decanoate
(1:3 w/w)
10
11
12
13
14
15
4
5 6
7
8
1
9
2
Sorbitan
Decanoate
12
Time
(mins)
Time
(mins)
Time
(mins)
Time
(mins)
Res
ponse
(m
V)
Res
ponse
(m
V)
Res
ponse
(m
V)
Res
ponse
(m
V)
193
The chromatogram obtained for the sorbitan decanoate shows peaks due to free
isosorbide, sorbitan and sorbitol and their esters, from the polyol profile it was found
that isosorbide and sorbitol were present in the sorbitan decanoate sample, complete
dehydration of the sorbitol to sorbitan did not occur. From the chromatogram it can
be seen that the first eluting peaks are due to the unreacted polyols, these are followed
by the mono esters of each of the polyols with the sorbitan mono decanaote being in
the middle of the other two and considerably larger in height. The di and tri sorbitan
decanoate esters are the next large groups of peaks seen, the final small group of
peaks observed on the chromatogram are thought to be sorbitan tetra decanoate.
The two chromatograms obtained for the sorbitol decanoate show that all the possible
sorbitol decanoate ester species were eluted. The chromatogram obtained for the
sorbitol decanoate produced at 1:1.5 w/w stoichiometry shows unreacted sorbitol
followed by the two largest peaks present due to sorbitol mono and di decanoate, four
later eluting peaks are also noted and are all of a similar height and are thought to
correspond to the other four possible sorbitol esters (tri – hexa esters). The
chromatogram obtained for the sorbitol decanoate produced with 1:3 w/w sorbitol:
decanoyl chloride shows no unreacted sorbitol and only a very small peak
corresponding to sorbitol mono decanoate. Two large peaks are then observed due to
the di and tri esters followed by a reasonable sized peak due to the tetra ester, the two
later eluting components are thought to correspond to the penta and hexa esters. Due
to the larger ratio of acid chloride used it was expected that the most abundant peaks
would be larger esters compared to the previous chromatogram.

194
The study shows that all the possible polyol esters of decanoic acid were detected, as
with the polyol esters of caprylic acid.
7.2.4 Polyol Esters of Lauric Acid:
The chromatograms obtained for each of the polyol esters of lauric acid are shown in
figure 7.3.
The chromatogram obtained for isosorbide laurate shows three peaks corresponding to
free isosorbide, isosorbide mono laurate and isosorbide di laurate. The chromatogram
is similar to those obtained for isosorbide caprylate and decanoate, although the
retention times of the ester species are slightly longer for the laurate esters due to the
longer fatty acid used and the esters therefore being less volatile than the
corresponding esters of the other acids.
The chromatogram obtained for sorbitan laurate is also similar to those for the
sorbitan esters of the previous acids studied with four groups of peaks being observed
for the four possible sorbitan ester species. As with the previous samples unreacted
polyols are noted, however this chromatogram shows a larger peak due to the
isosorbide mono ester, than seen in the other samples and a reasonable sized peak
corresponding to the isosorbide di laurate is also seen.
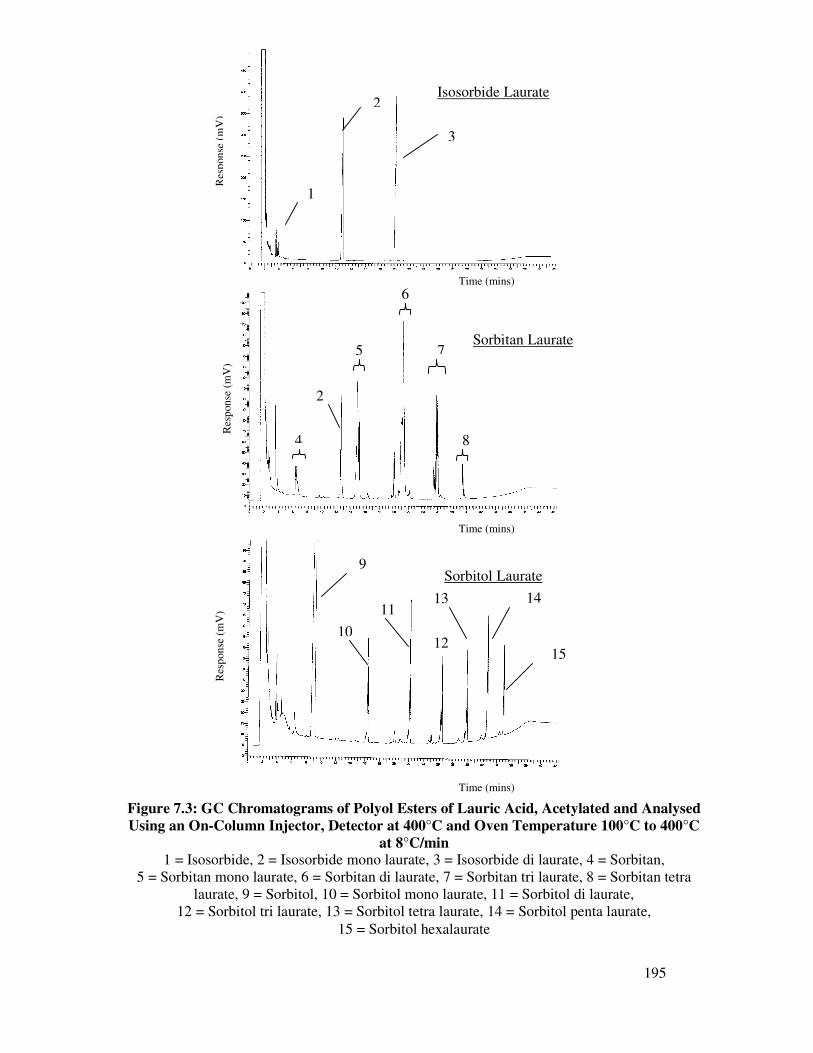
195
Figure 7.3: GC Chromatograms of Polyol Esters of Lauric Acid, Acetylated and Analysed
Using an On-Column Injector, Detector at 400°C and Oven Temperature 100°C to 400°C
at 8°C/min 1 = Isosorbide, 2 = Isosorbide mono laurate, 3 = Isosorbide di laurate, 4 = Sorbitan,
5 = Sorbitan mono laurate, 6 = Sorbitan di laurate, 7 = Sorbitan tri laurate, 8 = Sorbitan tetra
laurate, 9 = Sorbitol, 10 = Sorbitol mono laurate, 11 = Sorbitol di laurate,
12 = Sorbitol tri laurate, 13 = Sorbitol tetra laurate, 14 = Sorbitol penta laurate,
15 = Sorbitol hexalaurate
Isosorbide Laurate
Sorbitan Laurate
Sorbitol Laurate
1
2
3
4
2
5
6
7
8
9
10
11
12
13 14
15
Time (mins)
Res
ponse
(m
V)
Res
ponse
(m
V)
Time (mins)
Res
ponse
(m
V)
Time (mins)

196
The sorbitol laurate chromatogram shows a very large peak corresponding to
unreacted sorbitol, followed by six peaks of varying size that are thought to be due to
the six possible sorbitol esters of lauric acid.
Again this study shows that all the possible polyol esters under investigation eluted
from the column and were detected.
7.2.5 Polyol Esters of Myristic Acid:
The chromatograms obtained for the polyol esters of myristic acid are shown in figure
7.4. The isosorbide myristate chromatogram shows three peaks due to the unreacted
isosorbide and the mono and di ester species, as with the other isosorbide esters
investigated. The ester species are therefore sufficiently volatile to elute form the
column.
The sorbitan myristate chromatogram shows a small peak due to unreacted sorbitan
followed by an isosorbide mono myristate peak due to the sample containing
isosorbide and sorbitan, not just sorbitan, this was established from the polyol profile.
Four groups of peaks can then be seen due to sorbitan mono, di, tri and tetra myristate.
The tetra esters are a smaller group of peaks with a retention time of 32 to 33 minutes,
it is expected that there would be less tetra esters from the stochiometry of the starting
material, however the chromatogram indicates that sorbitan tetra esters were produced
and can be eluted.

Figure 7.4: GC Chromatograms of Polyol Esters of Myristic Acid, Acetylated and Analysed Using an On-Column Injector,
Detector at 400°C and Oven Temperature 100°C to 400°C at 8°C/min
1 = Isosorbide mono myristate, 2 = Isosorbide di myristate, 3 = Sorbitan mono myristate, 4 = Sorbitan di myristate,
5 = Sorbitan tri myristate, 6 = Sorbitan tetra myristate, 7 = Sorbitol mono myristate, 8 = Sorbitol di myristate,
9 = Sorbitol tri myristate, 10 = Sorbitol tetra myristate, 11 = Sorbitol penta myristate, 12 = Sorbitol hexa myristate
Sorbitol Myristate
(1:1.5 w/w)
Sorbitan
Myristate Sorbitol Myristate
(1:3 w/w)
Isosorbide Myristate
1
2
1
3
4
5
6
7
8 9
10
11
12
7
8
9 10
11
12
Time
(mins)
Res
ponse
(m
V)
Res
ponse
(m
V)
Time
(mins)
Time
(mins)
Res
ponse
(m
V)
Time
(mins)
Res
ponse
(m
V)
The chromatogram for the sorbitol myristate prepared at a 1:1.5 w/w ratio shows very
little residual sorbitol, a small peak due to sorbitol mono myristate is then seen
followed by larger peaks thought to be due to the di, tri and tetra esters, a smaller peak
follows these and is probably due to the penta ester species. A small peak at the end
of the chromatogram is thought to be due to the hexa esters, which again indicates that
all the possible ester species were produced and all eluted. The chromatogram
obtained for sorbitol myristate prepared with a stochiometry of 1:3 w/w shows small
peaks due to unreacted sorbitol and the mono ester. Peaks due to the di, tri, tetra and
penta esters of sorbitol are seen followed by a small peak at the end again thought to
be due to the hexa ester species. The largest peak is due to the tri ester, which at a
stochiometry of 1 sorbitol:3 acid chloride was expected.
7.2.6 Polyol Esters of Palmitic Acid:
The chromatograms for the polyol esters of palmitic acid are shown in figure 7.5.
The chromatogram obtained for isosorbide palmitate shows no residual isosorbide and
two major peaks due to isosorbide mono palmitate and isosorbide di palmitate.
Smaller peaks are evident to the right of the main peaks, these are probably isosorbide
mono and di esters of a larger fatty acid produced due to the palmitic acid feedstock
not being 100% pure.
The sorbitan palmitate chromatogram shows groups of peaks due to free sorbitan and
all four possible esters of sorbitan palmitate. Two smaller peaks are visible on either
side of the sorbitan mono palmitate and have retention times that correspond to
isosorbide and sorbitol mono esters of palmitic acid.

Figure 7.5: GC Chromatograms of Polyol Esters of Palmitic Acid, Acetylated and Analysed Using an On-Column Injector,
Detector at 400°C and Oven Temperature 100°C to 400°C at 8°C/min
1 = Isosorbide mono palmitate, 2 = Isosorbide di palmitate, 3 = Sorbitan, 4 = Sorbitan mono palmitate, 5 = Sorbitan di palmitate,
6 = Sorbitan tri palmitate, 7 = Sorbitan tetra palmitate, 8 = Sorbitol, 9 = Sorbitol mono palmitate, 10 = Sorbitol di palmitate,
11 = Sorbitol tri palmitate, 12 = Sorbitol tetra palmitate, 13 = Sorbitol penta palmitate
Isosorbide
Palmitate
Sorbitan
Palmitate Sorbitol Palmitate
(1:3)
1
2
3
4
5
6
7
Sorbitol
Palmitate
(1:1.5 w/w)
8
9
10 11 12
13
9
8
10 11
12
13 9
Sorbitol
Palmitate
(1:3 w/w)
Time
(mins)
Res
ponse
(m
V)
Res
ponse
(m
V)
Time
(mins)
Time
(mins) Time
(mins)
Res
ponse
(m
V)
Res
ponse
(m
V)

200
These would be produced as a consequence of the sorbitol used to produce the
material not converting to 100 % sorbitan, the polyol profile indicated that only 80 %
sorbitan was produced, with both isosorbide and sorbitol also being present and
therefore the possibility of the esters being produced.
The chromatogram for the sorbitol palmitate prepared at a 1:1.5 w/w shows some
residual sorbitol and peaks due to mono, di, tri, tetra and penta palmitate, with the
largest peak due to the di ester. The chromatogram obtained for sorbitol palmitate
prepared with a stochiometry of 1:3 w/w also shows peaks due to unreacted sorbitol
and the mono to penta ester. The largest sorbitol ester to elute from the column was
therefore the penta ester, the elution time is ~39 minutes and therefore is at the final
temperature of the GC programme and if the hexa ester was produced the temperature
would not be sufficient to volatilise it. This is the first of the polyol ester series were
all the esters did not elute from the column when using on-column injection.
7.2.7 Polyol Esters of Stearic Acid:
The chromatograms obtained for the polyol esters based on stearic acid are shown in
figure 7.6.
The chromatogram obtained for isosorbide stearate shows that both the possible ester
species are present and elute from the column, as seen with the isosorbide esters of
shorter fatty acid chain lengths.

Figure 7.6: GC Chromatograms of Polyol Esters of Stearic Acid, Acetylated and Analysed Using an On-Column Injector,
Detector at 400°C and Oven Temperature 100°C to 400°C at 8°C/min 1 = Isosorbide, 2 = Isosorbide mono stearate, 3 = Isosorbide di stearate, 4 = Sorbitan, 5 = Sorbitan mono stearate,
6 = Sorbitan di stearate, 7 = Sorbitan tri stearate, 8 = Sorbitan tetra stearate, 9 = Sorbitol, 10 = Sorbitol mono stearate,
11 = Sorbitol di stearate, 12 = Sorbitol tri stearate, 13 = Sorbitol tetra stearate
Isosorbide
Stearate
Sorbitan
Stearate
Sorbitol
Stearate
(1:1.5 w/w)
Sorbitol Stearate
(1:3 w/w)
1
2
3
4
5
6
7
8
9
10
11
12
13
9
10
11 12
13
Time
(mins)
Res
ponse
(m
V)
Res
ponse
(m
V)
Time
(mins)
Time
(mins)
Res
ponse
(m
V)
Res
ponse
(m
V)
Time
(mins)

202
The chromatogram of sorbitan stearate shows groups of peaks due to residual sorbitan
and the four possible esters. At either side of the sorbitan mono stearate peak are
smaller peaks, with retention times that indicate they are isosorbide mono stearate and
sorbitol mono steartate. The tetra esters elute at ~38 minutes which indicates they
elute close to the final oven temperature used, due to a 5 minute hold time at the end
of the run.
The chromatogram obtained for sorbitol stearate produced at 1:1.5 w/w stochiometry
shows residual sorbitol, followed by peaks due to the mono, di and tri esters of
sorbitol. A smaller peak is observed at the final oven temperature which is assumed
to be sorbitol tetra stearate, this is the largest ester to elute, higher esters of sorbitol
were detected for the shorter chain fatty acid, sorbitol esters indicating it is possible to
produce them, therefore the higher esters of stearic acid were probably produced but
not eluted. The chromatogram obtained for sorbitol stearate produced at a
stochiometry of 1:3 w/w also shows residual sorbitol and peaks due to sorbitol mono,
di, tri and tetra stearate. In contrast to the 1:1.5 w/w material the mono ester is very
small, however as with the 1:1.5 w/w material the tetra ester peak is small, this may
indicate that it is only partially volatile under the conditions used.
The study shows that a number of the polyol ester species based on stearic acid will
elute from the column, however the largest to elute are the tetra esters. Other lower
chain polyol esters resulted in all possible esters eluting and because the samples were
prepared in the same way it infers that the higher esters of stearic acid were produced
but the GC conditions were not adequate for them to elute from the column.
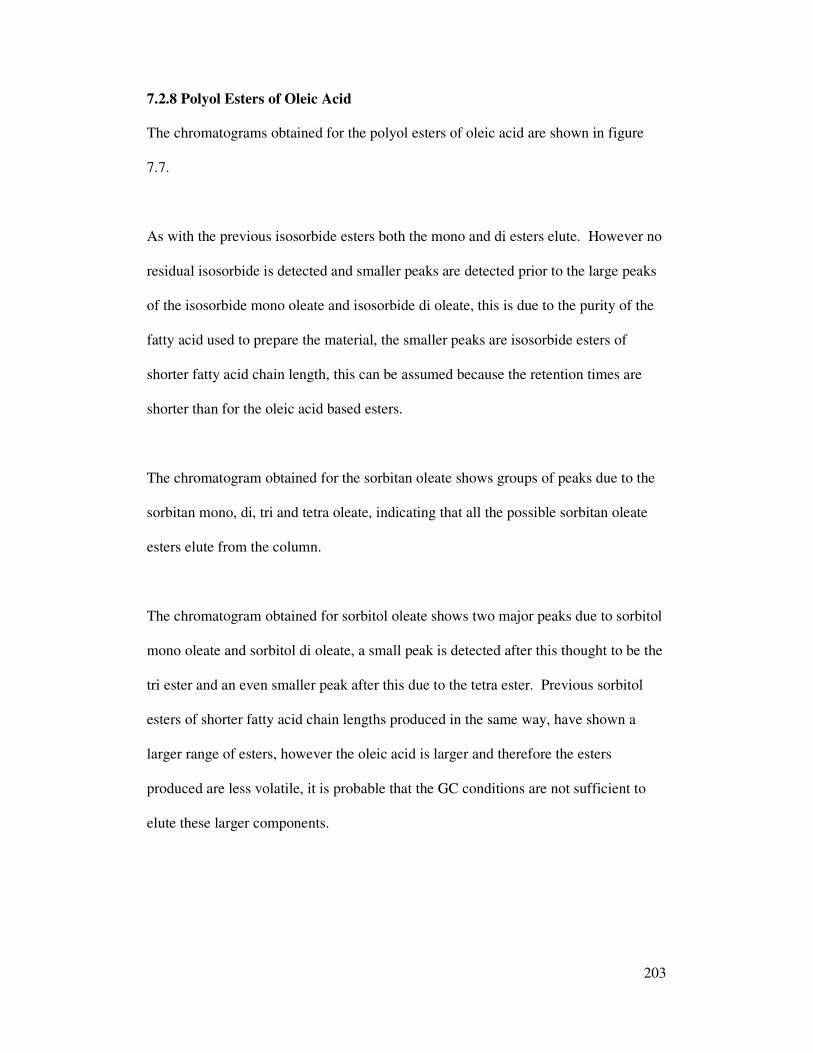
203
7.2.8 Polyol Esters of Oleic Acid
The chromatograms obtained for the polyol esters of oleic acid are shown in figure
7.7.
As with the previous isosorbide esters both the mono and di esters elute. However no
residual isosorbide is detected and smaller peaks are detected prior to the large peaks
of the isosorbide mono oleate and isosorbide di oleate, this is due to the purity of the
fatty acid used to prepare the material, the smaller peaks are isosorbide esters of
shorter fatty acid chain length, this can be assumed because the retention times are
shorter than for the oleic acid based esters.
The chromatogram obtained for the sorbitan oleate shows groups of peaks due to the
sorbitan mono, di, tri and tetra oleate, indicating that all the possible sorbitan oleate
esters elute from the column.
The chromatogram obtained for sorbitol oleate shows two major peaks due to sorbitol
mono oleate and sorbitol di oleate, a small peak is detected after this thought to be the
tri ester and an even smaller peak after this due to the tetra ester. Previous sorbitol
esters of shorter fatty acid chain lengths produced in the same way, have shown a
larger range of esters, however the oleic acid is larger and therefore the esters
produced are less volatile, it is probable that the GC conditions are not sufficient to
elute these larger components.
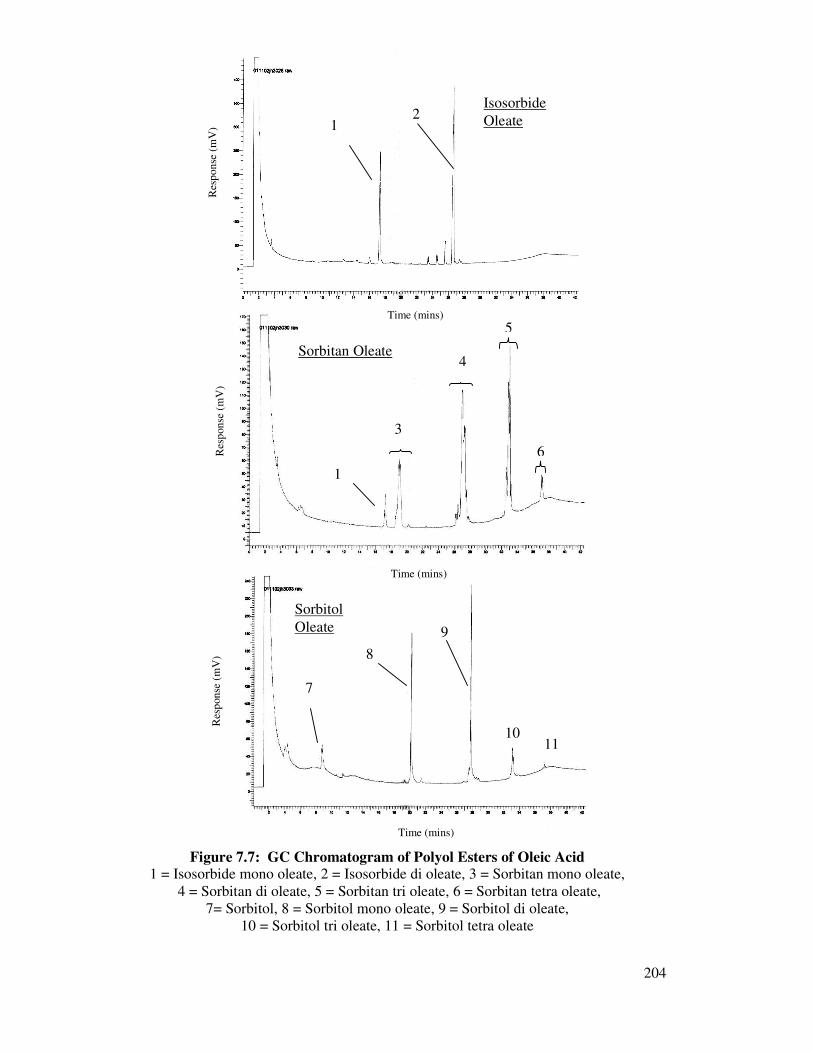
204
Isosorbide
Oleate 1 2
Sorbitan Oleate
1
3
4
5
6
7
8
9
10 11
Figure 7.7: GC Chromatogram of Polyol Esters of Oleic Acid 1 = Isosorbide mono oleate, 2 = Isosorbide di oleate, 3 = Sorbitan mono oleate,
4 = Sorbitan di oleate, 5 = Sorbitan tri oleate, 6 = Sorbitan tetra oleate,
7= Sorbitol, 8 = Sorbitol mono oleate, 9 = Sorbitol di oleate,
10 = Sorbitol tri oleate, 11 = Sorbitol tetra oleate
Sorbitol
Oleate
Time (mins)
Time (mins)
Res
ponse
(m
V)
Res
ponse
(m
V)
Time (mins)
Res
ponse
(m
V)

205
7.2.9 Capacity Factor:
The effect of varying the fatty acid chain length and the number of ester groups on
capacity factor was studied with the on-column injection, as with splitless injection in
chapter 6.
Effect of Chain Length
The capacity factor was determined for the isosorbide mono and sorbitol mono esters
with varying fatty acid chain lengths, as with the splitless injection analysis in chapter
6. The values obtained are shown in table 7.1 below.
Capacity Factor
Fatty Acid Chain Length Isosorbide Mono Ester Sorbitol Mono Ester
C8 4.2 6.7
C10 5.3 7.5
C12 6.3 8.2
C14 7.3 9.1
C16 8.1 9.9
C18 8.9 10.5
Table 7.1: Capacity Factor of Isosorbide and Sorbitol Mono Esters With
Varying Fatty Acid Chain Lengths Using On-column Injection
The plot of the data is shown in figure 7.8. As seen with the splitless injection and
Db1-ht column a linear relationship exists between capacity factor and fatty acid
chain length of the ester, with the R2 = 0.9958 for the isosorbide mono esters and
0.9978 for the sorbitol mono ester. Again the capacity factor for the sorbitan mono
esters was not determined due to the difficulty obtaining a precise retention time due
to the sorbitan mono esters appearing as group of peaks rather than a single peak.

206
Effect of Number of Ester Groups:
The capacity factors for each of the sorbitol ester species that eluted from the GC
column were determined and the values obtained are shown in table 7.2.
For a specific fatty acid, as the number of ester groups on the sorbitol increases, it is
expected that the volatility will decrease and therefore the retention on the column
will increase. This was confirmed by the fact that for each of the fatty acids studied,
as the number of ester groups on the sorbitol increased the capacity factor increased.
A plot of all the data is shown in figure 7.9 and as observed with the splitless
injection, for each sorbitol fatty acid ester studied the data is curved.
R2 = 0.9958
R2 = 0.9978
0
2
4
6
8
10
12
8 9 10 11 12 13 14 15 16 17 18
Fatty Acid Chain Length (C)
Cap
acit
y F
acto
r
Isosorbide Mono Esters
Sorbitol Mono Esters
Figure 7.8: Graph Showing Capacity Factor of Isosorbide
and Sorbitol Mono Esters With Varying Fatty Acid Chain
Lengths Analysed Using On-Column Injection

207
Capacity Factor
Ester Groups C8 C10 C12 C14 C16 C18
0 4.0 4.0 4.0 4.0 4.0 4.0
1 6.6 7.5 8.3 9.1 9.9 10.6
2 8.8 10.2 11.5 12.8 14.0 15.0
3 10.6 12.4 14.0 15.5 16.9 18.0
4 12.0 14.1 16.0 17.6 19.1 20.4
5 13.3 15.5 17.6 19.3 20.9 N/D
6 14.3 16.7 18.8 20.7 N/D N/D
N/D – Not detected
Table 7.2: Capacity Factor of Sorbitol Ester Species Analysed
Using On-Column Injection
Figure 7.9: Graph Showing Capacity Factor of Sorbitol Esters
Analysed Using On-Column Injection
0
5
10
15
20
25
0 1 2 3 4 5 6
Number of Ester Groups
Cap
acit
y F
acto
r C8
C10
C12
C14
C16
C18

208
7.2.10 Summary of the Use of On-Column Injection for Analysis of High Purity
Polyol Esters:
From the investigation it was found that:
- all the isosorbide ester chromatograms showed peaks corresponding to the mono and
di esters
- all the sorbitan ester chromatograms showed peaks for the mono, di, tri and tetra
esters
- all the possible sorbitol ester species eluted from the column for caprylic, decanoic,
lauric and myristic acid based esters. For palmitic esters five of the six possible esters
eluted, with only the hexa esters not detected. However for sorbitol esters based on
oleic and stearic acid the penta and hexa esters did not elute from the column.
The investigation has shown that the majority of ester species do elute from the
column when on-column injection is used. Table 7.3 shows the esters detected for
each polyol ester of each fatty acid studied.

209
C8 C10 C12 C14 C16 C18 C18:1
Isosorbide mono √ √ √ √ √ √ √
Isosorbide di √ √ √ √ √ √ √
Sorbitan mono √ √ √ √ √ √ √
Sorbitan di √ √ √ √ √ √ √
Sorbitan tri √ √ √ √ √ √ √
Sorbitan tetra √ √ √ √ √ √ √
Sorbitol mono √ √ √ √ √ √ √
Sorbitol di √ √ √ √ √ √ √
Sorbitol tri √ √ √ √ √ √ √
Sorbitol tetra √ √ √ √ √ √ *
Sorbitol penta √ √ √ √ √ X X
Sorbitol hexa √ √ √ √ X X X
Table 7.3 : Summary of Esters Detected Using On-column Injection For the
Various Fatty Acids Studied
√ Present X Absent * Trace
7.2.11 Comparison of Results using On-Column and Splitless Injection:
Chapter 5 and 6 detailed the GC analysis of the same high purity polyol esters detailed
in this chapter but using splitless injection rather than on-column injection. Table 6.8
shows the ester species which eluted from the column with splitless injection and
table 7.3 the ester species eluted with on-column injection. Comparison of table 6.8
and 7.3 shows that more ester species eluted from the GC column using on-column
injection than splitless injection.
It was found that:
- using splitless injection the technique is not capable of eluting all possible esters for
any of the fatty acid esters.

210
- using on-column injection all possible esters can be eluted for caprylic to myristic
acid.
- using on-column injection all isosorbide and sorbitan esters will elute for all fatty
acid esters under study.
- using splitless injection sorbitan tetra esters are a problem for all fatty acids esters
and for oleic and stearic acid only trace amounts of the tri esters were detected.
Although it was noted that when real samples were analysed with splitless injection
using another column sorbitan tri esters of stearic and oleic acid were detected, so the
column could have been partially responsible for the reduction in ester species
detected compared to on-column injection.

211
7.3 Optimising GC Conditions:
The work carried out in chapter 7.2 analysing the various polyol esters using on-
column injection showed that the majority of the polyol esters species would elute
from the GC column. Considerably more ester species eluted using on-column
injection than splitless injection. However again as the fatty acid chain length
increased the number of ester species that eluted decreased, with some of the higher
sorbitol ester species of palmitic, stearic and oleic acid not eluting. In an attempt to
elute all the esters it was felt that an investigation using a higher final oven
temperature should be tried, the higher temperature may be required to volatilise and
elute the higher sorbitol esters from the column.
7.3.1 Final Oven Temperature of 430 °C:
Increasing the final oven temperature to 430°C may be sufficient to volatilise some of
the sorbitol esters which did not volatilise at 400°C and therefore did not elute from
the column. The temperature selected was 430°C which is higher than the initial
upper temperature tried with the on-column injection but not the upper limit of the
column.
The following GC conditions were therefore used to analyse all of the high purity
polyol esters prepared:
Detector temperature: 430°C
Initial oven temperature: 100°C
Ramp rate: 8°C/min
Final oven temperature: 430°C, held for 5 minutes

212
The chromatograms obtained for each of the polyol esters were reviewed and the ester
species eluting noted, however it was found that the increased temperature had no
effect on the number of esters detected. The chromatograms obtained were
comparable to those in figures 7.1 – 7.6.
7.3.2: Final Oven Temperature of 450 °C
The use of a final oven temperature of 430°C had no significant effect on the esters
eluting from the column, therefore the use of an even higher final oven temperature
was studied. The temperature selected was 450°C which is the maximum operating
temperature for the column. The following GC conditions were used to analyse all
the high purity polyol esters:
Detector temperature: 450°C
Initial oven temperature: 100°C
Ramp rate: 8°C/min
Final oven temperature: 450°C, held for 5 minutes
Again the chromatograms obtained were studied and the ester species eluting for each
sample noted. All of the ester species for the polyol esters of caprylic and decanoic
acid eluted, for the polyol esters of lauric, myristic and palmitic acid all the isosorbide
and sorbitan ester species eluted and the mono to penta esters of sorbitol. The
chromatograms for the polyol esters of stearic acid showed that both the possible
isosorbide esters eluted from the column, however only the mono to tri esters of
sorbitan and sorbitol stearate eluted. The results were compared to the previous on-
column results obtained for polyol esters of stearic acid when a final oven temperature
of 400 and 430°C was used and it was found that with a final oven temperature of

213
450°C fewer ester species eluted. The various chromatograms obtained for the polyol
esters of stearic acid were also compared and it was found that at 450°C the peaks
were broader, this indicates that the column could be deteriorating, hence the reason
for fewer ester species eluting. Finally the polyol esters of oleic acid were analysed
with a final oven temperature of 450°C and again the ester species eluting were
established and compared to the previous on-column work for polyol esters of oleic
acid. It was found that with a final oven temperature of 450°C both isosorbide esters
eluted, the mono to tri sorbitan esters and the mono and di sorbitol esters of oleic acid.
The previous temperatures tried did not elute all of the possible esters of oleic acid but
more were eluted than this investigation showed and when reviewed the
chromatograms showed broad peaks. It was therefore concluded that the column had
deteriorated. The column was new at the start of the on-column work and therefore a
limited number of samples had been analysed, it is possible that although it is stated to
be suitable for use up to 450°C it can not withstand use at this temperature for any
length of time, as was found with the HT5 column used for the optimisation study
using splitless injection.
The optimisation of the GC conditions, in an attempt to elute all the possible ester
species from the GC column was a lengthy study, however it was found that the use of
a higher upper temperature had no effect on the number of ester species that can be
eluted from the column.

214
7.4 GC Analysis of Real Sorbitan Mono Ester Samples:
The work detailed in chapter 6 proved that GC is a useful analytical tool for the
analysis of real sorbitan mono ester samples. The results obtained in chapters 7.2 and
7.3 have shown that using GC with on-column rather than splitless injection a wider
range of esters can be eluted from the GC column, with only the largest sorbitol esters
not eluting. However these results were obtained with samples containing essentially
one polyol and prepared from high purity fatty acid feedstocks. Therefore real
sorbitan mono ester samples that have varying polyols and fatty acids were analysed
as in chapter 6.4.
7.4.1 Analysis of Manufactured Sorbitan Mono Ester Samples:
The following real sorbitan ester samples produced by Croda were therefore analysed
by GC using on-column injection:
Sorbitan mono palmitate
Sorbitan mono stearate
Sorbitan mono oleate – sample 1 and 2
These are part of the range of sorbitan mono esters produced by Croda and vary in
fatty acid feedstock used. The samples are the same as the real samples analysed in
chapter 6, however the analysis of real samples with splitless injection also included
sorbitan mono laurate, however this was found to have a large number of components
and be a very complex material therefore was eliminated from this study.
The samples were analysed by GC using the method detailed in chapter 7.1.3. The
single high purity polyol esters were also analysed to aid identification of the peaks in
the manufactured sorbitan mono ester samples.

215
Sorbitan mono palmitate:
The standard analysis (chapter 6.4.2.1) carried out showed that the manufactured
sorbitan mono palmitate sample under analysis contained only isosorbide and sorbitan
and that palmitic acid was the major fatty acid in the feedstock (94 %). The
chromatogram obtained for the manufactured sorbitan mono palmitate sample
analysed by GC using on-column injection is shown if figure 7.10. The
chromatogram shows that the sample contains both of the possible isosorbide esters of
palmitic acid. All of the possible sorbitan esters of palmitic acid were also found to
be present, the sorbitan tetra palmitate peaks were the last peaks observed on the
chromatogram and were small, however at the ratio of sorbitol to fatty acid used in the
production of sorbitan mono palmitate, the amount of tetra esters produced would be
limited and therefore the peaks were expected to be small. The polyol profile
indicated that sorbitol was not present, therefore the tetra esters would be the largest
esters expected.
The chromatogram obtained was compared to that obtained for the manufactured
sorbitan mono palmitate using splitless injection (figure 6.12) and were found to be
comparable for the mono, di and tri esters. However the on-column injection resulted
in peaks thought to be due to sorbitan tetra palmitate eluting which were not seen with
the splitless injection. In chapter 6 it was assumed that at the production ratios used
the tetra esters would not be produced. However the on-column analysis of sorbitan
mono palmitate indicates that the tetra esters were produced and do elute from the
column.

216
The GC analysis using splitless injection offered advantages over GPC analysis
because the mono esters were baseline resolved and the di and tri esters were well
separated by GC but not by GPC. On-column injection offers the same advantages as
GC with splitless injection has over GPC, however the tetra esters elute from the
column. Therefore the potential for more information on ester species is possible
using GC with on-column injection.
Sorbitan mono stearate:
It was established in chapter 6 that all three polyols are present in the manufactured
sorbitan mono stearate sample under analysis, although sorbitol is only present at a
low level. The fatty acid profile showed that the esters were prepared from a mixed
feedstock containing largely palmitic and stearic acid in almost equal quantities.
The GC chromatogram obtained for sorbitan mono stearate using on-column injection
is shown in figure 7.11, the mono ester region has doublets due to esters of the two
main acids. Two isosorbide mono ester peaks are identified and two sorbitan mono
ester groups of peaks are also seen. The palmitic acid esters will be more volatile and
therefore will elute prior to the corresponding stearic esters.
The di and tri ester regions show a range of peaks, however the di and tri esters are
well separated from each other. Due to the fatty acid feedstock, esters based on
palmitic and stearic acid could be produced as well as esters with mixed fatty acids.
The isosorbide di palmitate is the first peak of the di ester group to elute, this is
followed by a number of peaks which could consist of isosorbide di stearate and
sorbitan and sorbitol di esters of both acids and mixed acid esters.

1
2
3
4
5
6
Figure 7.10: GC Chromatogram of Manufactured Sorbitan Mono Palmitate Using On-Column Injection 1 = Isosorbide mono palmitate, 2 = Sorbitan mono palmitate, 3 = Isosorbide di palmitate,
4 = Sorbitan di palmitate, 5 = Sorbitan tri palmitate, 6 = Sorbitan tetra palmitate
Time (mins)
Res
ponse
(m
V)

218
The group of tri esters elute next and are thought to be due to sorbitan and sorbitol tri
esters. A small group of peaks elute after 34 minutes and are thought to be the tetra
esters, however no larger ester groups are detected, these would be due to sorbitol
penta and hexa esters however at the manufacturing ratio used and the polyol profile
only showing 4 % sorbitol to be present it is unlikely these esters would be produced.
The analysis using high purity esters also showed that only the sorbitol penta
palmitate could elute.
The chromatogram obtained was compared to that obtained for the sorbitan mono
stearate using splitless injection and as with the sorbitan mono palmitate were found
to be comparable for the mono, di and tri esters but using on-column injection the
tetra esters are also detected. Therefore GC analysis with on-column injection may
offer advantages over both GPC and GC with splitless injection, as was found with
sorbitan mono palmitate.
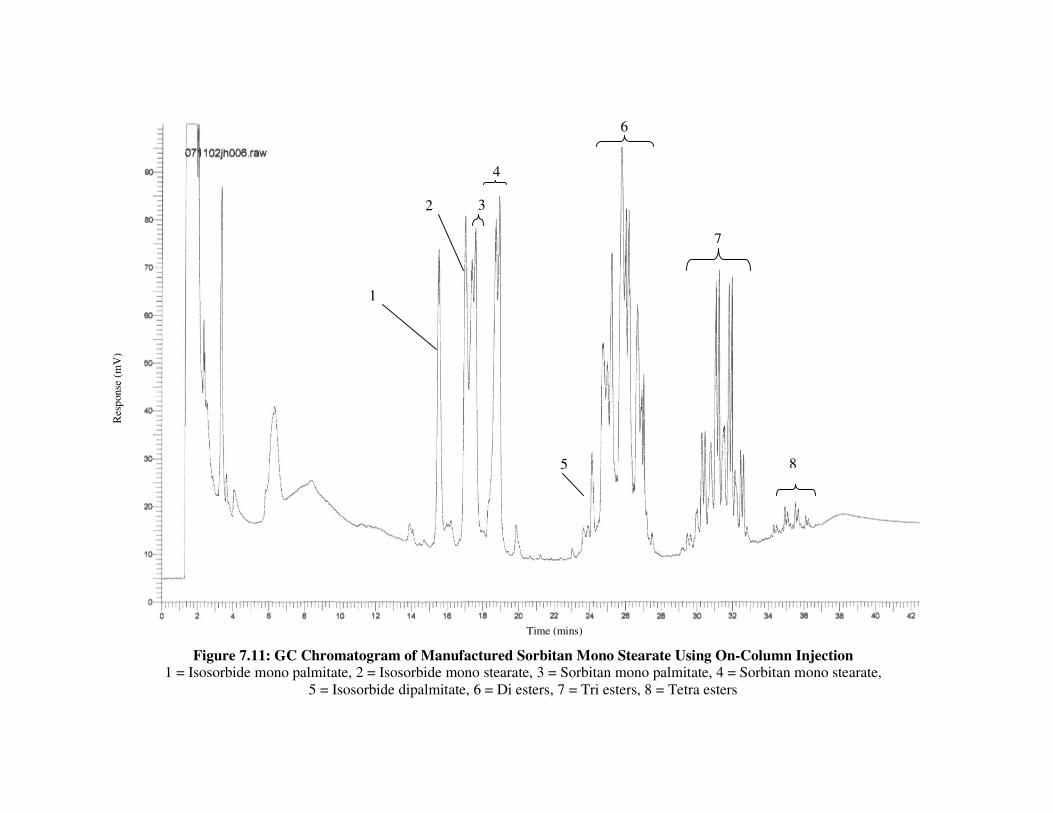
1
2 3
4
5
6
7
8
Figure 7.11: GC Chromatogram of Manufactured Sorbitan Mono Stearate Using On-Column Injection 1 = Isosorbide mono palmitate, 2 = Isosorbide mono stearate, 3 = Sorbitan mono palmitate, 4 = Sorbitan mono stearate,
5 = Isosorbide dipalmitate, 6 = Di esters, 7 = Tri esters, 8 = Tetra esters
Time (mins)
Res
ponse
(m
V)

220
Sorbitan Mono Oleate:
The GC chromatogram obtained for manufactured sorbitan mono oleate is shown in
figure 7.12. A single peak due to isosorbide mono oleate is evident followed by a
group of peaks thought to be sorbitan mono oleate. The di esters elute next with
isosorbide di oleate evident followed by sorbitan di oleate. A group of peaks are then
detected thought to be the sorbitan tri oleate esters, which is followed by a small
group of peaks which elute after 35 minutes and are thought to be sorbitan tetra esters.
The polyol profile indicated that no sorbitol was present, that it had been fully
dehydrated, therefore sorbitol esters were not expected and were not seen. The largest
esters possible would therefore be sorbitan tetra esters which were detected at the end
of the chromatogram, indicating that all possible esters of the sorbitan mono oleate
sample under analysis were detected.
As seen with sorbitan mono palmitate and stearate GC with on-column injection may
be a possible alternative to GPC analysis for determining ester distributions for
sorbitan mono oleate.

1 2
3
4
5
6
Figure 7.12: GC Chromatogram of Manufactured Sorbitan Mono Oleate Using On-Column Injection 1 = Isosorbide mono oleate, 2 = Sorbitan mono oleate, 3 = Isosorbide di oleate, 4 = Sorbitan di oleate,
5 = Sorbitan tri oleate, 6 = Sorbitan tetra oleate
222
Comparison of two manufactured sorbitan mono oleate samples:
The analysis of a real manufactured sorbitan mono oleate sample showed good
separation of a number of ester species in the sample. The intention of the analytical
method is to compare samples, therefore two manufactured sorbitan mono oleate
samples were selected and analysed by GC using on-column injection and the
chromatograms obtained compared to indicate if comparisons will be possible. The
two chromatograms obtained are shown in figure 7.13. Studying the chromatograms
obtained shows a number of differences, sample 2 has a distinct sorbitol mono-oleate
peak, however this peak is very small in sample 1. Also in sample 1 the peaks due to
the mono, di and tri esters are all similar sizes, but in sample 2 this is not found, with
the tri ester group of peaks in particular being considerably smaller. Also on close
inspection it can be seen that the profile of the groups of peaks for the two samples are
different. This initial work indicates that differences in sorbitan mono oleate samples
can be observed from a visual assessment, therefore with further work it may be
possible to use GC for comparison of sorbitan ester samples.
7.4.2 Summary:
The work carried out shows that GC analysis with an on-column injector has proved
to be of success in the analysis of manufactured sorbitan mono palmitate, stearate and
oleate samples. A large number of esters were found to elute with the highest esters
to elute being the tetra esters for the sorbitan mono palmitate and oleate, this was the
largest expected ester, it was possible that sorbitol penta and hexa ester could have
been produced, however it was felt unlikely, indicating that all expected esters eluted.
For each manufactured sorbitan mono ester sample the various mono

223
Figure 7.13: GC Chromatograms of Two Manufactured Sorbitan Mono Oleate Samples
SMO – sample 2
SMO – sample 1

224
ester species expected were well resolved and these were well separated from the di,
tri and tetra esters which were also well separated from each other.
The work has shown that GC with on-column injection could be used for the
comparison of ester species between samples. As detailed in chapter 6 currently the
best method available for comparison of differences in ester species in manufactured
sorbitan mono ester samples is GPC, GC with splitless injection appeared to offer
advantages over it due to better resolution of the various esters, however the use of
GC with on-column injection allows the tetra esters to be considered which did not
elute with splitless injection. However further work using on-column analysis is
required, including a repeatability study.

225
8. Conclusion and Further Work:
8.1 Conclusion
The objective of the work carried out was to develop a suitable method of analysis for
characterising sorbitan esters, which can then be used to monitor sorbitan esters
during manufacture, as well as to compare samples and establish structure activity
relationships.
Sorbitan esters have a range of components of varying size and polarity and therefore
volatility. HPLC was the first technique tried because it does not have the volatility
and thermal stability issues associated with GC. However despite the use of various
mobile and stationary phases for the analysis of a sample of sorbitan mono oleate,
HPLC was not found to be a suitable method of analysis. The best resolution was
obtained with a diol column and gradient elution with hexane and THF, a number of
partially resolved peaks were obtained indicating separation of some of the
components of the sample, however further work showed that the method was not
repeatable. This method would therefore be of little use in a QC department and
therefore was not felt to be worth pursuing further.
The next technique tried, GC with splitless injection, was found to be a suitable
method for the analysis of sorbitan mono esters. A DB1-ht column was required,
which is a high temperature column which operates at temperatures above normal
columns and allows elution of higher molecular weight, less volatile compounds.
Initial GC analysis confirmed that some sorbitan ester species would elute from a HT-
GC column. Components expected in Sorbitan Caprylate were prepared and analysed,
they have a shorter fatty acid chain length and therefore are more volatile and likely to
elute from the GC column than the large ester species in the sorbitan mono oleate
226
sample analysed by HPLC. Both isosorbide esters of caprylic acid, sorbitan mono to
tri caprylate and sorbitol mono to tetracaprylate eluted from the column. Analysis of a
manufactured sorbitan caprylate sample resulted in a chromatogram with different
ester species separated and identified, indicating that GC is a suitable method for
characterising it.
Elution from the HT-GC column of larger less volatile ester species present in
sorbitan esters with larger fatty acid chain lengths was investigated, by the preparation
of a series of polyol esters, of varying chain lengths, with the largest esters based on
oleic and stearic acid. GC analysis of the samples using an injector, detector and final
oven temperature of 380°C showed that both isosorbide esters, sorbitan mono, di and
tri esters and sorbitol mono and di esters for all the fatty acids investigated eluted.
Larger esters eluted from the column for esters with smaller fatty acid chain lengths
and for decanoic acid a small peak corresponding to sorbitol hexadecanoate was
observed, indicating all possible ester species of decanoic acid will elute from the
column. However the larger ester species for the longer chain fatty acids did not elute.
The use of a higher final oven temperature or alternative column did not increase the
number of ester species that could be eluted.
The work showed that HT-GC with splitless injection would be a suitable method of
analysis for the sorbitan mono ester range manufactured by Croda, which are
manufactured with a low fatty acid to sorbitol ratio and are expected to produce
largely mono and di esters, which can be detected by GC. In contrast the sorbitan tri
ester range, produced with a higher fatty acid to sorbitol ratio, to produce the higher

227
esters would not be suitable for analysis by GC because many of the higher esters
produced would not be detected.
GC analysis of samples of manufactured sorbitan mono palmitate, sorbitan mono
stearate and sorbitan mono oleate gave chromatograms that showed although not all
the ester species could be eluted, a large number could and that the various mono
esters are well resolved and are separated from the di and tri esters, which are also
well separated from each other. Validation of the method with sorbitan mono oleate
showed that it is specific and precise, demonstrating that the method is suitable for
characterising real sorbitan mono ester samples.
Analysis of a sample of manufactured sorbitan mono laurate resulted in a
chromatogram with a large number of peaks, indicating the complex nature of the
material, which is probably due to the mixed fatty acid starting material. Baseline
resolution was not obtained for the components and the large number of peaks means
identification of the peaks is not possible, however it may be possible to use the
chromatograms as ‘finger print’ type analysis for comparative purposes.
HT-GC with splitless injection offers advantages over the current GPC method used
for the analysis of sorbitan mono esters due to better resolution of the various ester
species.
The work showed that different columns from the same manufacturer, with the same
stationary phase gave different results, therefore it would be necessary to set up a

228
system suitability using a sample of known composition to verify that the resolution
of the chromatographic system is adequate prior to the analysis of samples.
Work carried out with HT-GC with on-column injection using a WCOT ultimetal
column with HT SIMDIST CB coating, showed it may also be a suitable method of
analysis for characterising the sorbitan mono ester range. Analysis of the range of
single high purity polyol esters by GC with on-column injection showed that more
ester species could be eluted for the larger fatty acid esters with on-column injection
than with splitless injection. This is probably due to the fact that all of the sample is
placed on the column, unlike splitless injection where the sample has to be transferred
from the injection port and complete transfer onto the column may not occur.
Analysis of real manufactured sorbitan mono ester samples using on-column injection
was also successful, with a number of well resolved, identified peaks observed from
mono to tetra esters. However validation of the method would be required to prove
that it is precise and acceptable for its intended purpose. Also the column used
became brittle when used at high temperatures for a length of time and this would
need to be considered if the method was to be used as a routine QC test.
The work carried out shows that HT-GC with splitless injection is a suitable
repeatable method of analysis for characterising a range of sorbitan mono esters. This
analysis could be used to allow a relationship between the composition of sorbitan
mono esters and their application to be established. This relationship could then be
used to design the next generation of emulsifiers. HT-GC with on-column injection
may also be a suitable method of analysis following further work.

229
8.2 Further Work:
GC with on-column injection showed potential for the analysis of sorbitan mono ester
samples. However validation of the method is required to indicate the repeatability of
the method and show that it is fit for purpose.
When the final analytical method has been determined, a range of sorbitan mono
esters could be produced using conditions that will result in varying polyol profiles
and therefore varying ester species. The samples could then be analysed using the
selected method to establish that differences in the composition of the sorbitan mono
esters can be determined using the analytical method developed.
The samples could then be used in one of the product application tests used within
Croda, to determine the effect sorbitan ester composition has on performance.
Sorbitan mono oleate is used as an emulsifier in emulsion explosives, a screening test
is used to establish a product's applicability as an emulsifier. The test involves
emulsifying ammonium nitrate, water, paraffin and an emulsifier using equipment
designed at Croda, the resulting emulsion stability is then evaluated. The samples of
varying composition could be used as the emulsifier and a study carried out to
establish if a relationship between the composition of sorbitan mono esters and the
application exists.

230
9. References:
1. Callum, D.C., Introduction to Surfactant Analysis, Blackie Academic and
Professional, London (1994).
2. Griffin, W.C., J. Soc. Cosmet. Chemists, 1:311 (1949).
3 Cross, J., Introduction to Non-ionic Surfactants in: Non-ionic Surfactants –
Chemical Analysis, p. 4, Marcel and Dekker, New York (1987).
4. Lewis, Polyol Ester Surfactants in: Non-ionic Surfactants – Organic Chemistry
p.219, Marcel and Dekker, New York (1998).
5. Garti, N., V.R Kaufman and A. Aserin, Analysis of Non-ionic surfactants by
HPLC in : Non-ionic Surfactants – Chemical Analysis, p. 231, Marcel and
Dekker, New York (1987).
6. Croda, Crill and Crillet data sheet.
7. Dubreucq, E., A. Ducret and R. Lortie, J. Surfact. Deterg., 3:327 (2000).
8. Dobson, B., ICI document, The Span Esterification Reaction.
9. Smirdrkal, J., R. Cervenkova and V. Filip, Eur. J. Lipid Sci. Technol., 106:851
(2004).
10. Fessenden R.J. and J.S. Fessenden, Organic Chemistry, 5th
edition, Wadsworth
Inc, Belmont, California, p.603 (1994).
11. Prichard, E. and B. Stuart, Practical Laboratory Skills Training Guide – Gas
Chromatography, LGC, Teddington (2003).
12. Uematsu, Y., K. Hirata, K. Suzuki, K. Iida, T. Kan and K. Saito, J. AOAC Intern.,
84:498 (2001).
13. Fregapane, G., D.B. Sarney, S.G. Greenberg, D.J. Knight and E.N. Vulfson,
Proceedings of Biocatalysis in Non-Conventional Media, Amsterdam, Elsevier,
563 (1992).

231
14. Perona, J.S, L.J.R Baron and V. Ruiz-Gutierrez, J. Chromatogr. B, 706:173
(1998).
15. Simoneau, C., P. Hannaert and E Anklam, Food Chemistry, 65:111 (1999).
16. Junior, J.L.R and N. Re-Poppi, Talanta, 72:1833 (2007).
17. Xue, J., L. Hao and F. Peng, Chemosphere, 71:1051 (2008).
18. Goni, F., R Lopez, A Etxeandia, E. Millan and P Amiano, , J. Chromatogr. B,
852:15 (2007).
19. Vukavic, T., M.V. Miloradov, A. Ristivojevic and J. Hlpka, Environmental
Toxicology and Pharmacology, 25:176 (2008).
20. Uygun, U., B. Senoz and H. Koksel, Food Chem., 109:355 (2008).
21. Rial-Otero, R., E.M. Gaspar, I. Moura and J.L. Capelo, Talanta, 71:503 (2007).
22. Chance, D., K.O. Gerhardt and T.P. Mawhinney, J. Chromatogr. A, 771:191
(1997).
23. Ventura, F., A. Figeras, J. Caixach, I. Espadaler, J. Romero, J. Guardiola and J.
Rivera, Wat. Res, 22:1211 (1988).
24. Kamm, W., F. Dionisi, L.B Fay, C. Hischenhuber, H.G. Schmarr and K.H Engel,
J. Chromatogr. A, 918:341 (2001).
25. Smith, M.D and E.M. Hill, Sci. Total Environ., 356:100 (2006).
26. Garti, N and A. Aserin, J Liq. Chromatogr., 4:1173 (1981).
27. Adlof, R and G. List, J. Chromatogr. A, 1046:109 (2004).
28. Garti, N., E. Wellner, A. Aserin and S. Sarig, JAOCS, 60:1151 (1983).
29. Wang, Z. and M. Fingas, J. High Resol. Chromatogr., 17:15 (1994).
30. Jandera, P., M. Holcapek and G. Theodoridis, J. Chromatogr. A, 813:299 (1998).
31. Bernabe-Zafon, V., E.F. Simo-Alfonso, G. Ramis-Ramos, J. Chromatogr. A,
1118:188 (2006).

232
32. Vanhoenacker, G. and P. Sandra, J. Chromatogr. A, 1082:193 (2005).
33. Takino, M., S. Daishima and K. Yamaguchi, J. Chromatogr. A, 904:65 (2000).
34. Sparreboom, A., M. Zhao, J.R. Brahmer, J. Verweij and S.D. Baker, J.
Chromatogr. B, 773:183 (2002).
35. Dang, H.V., A.I. Gray, D. Watson, C.D. Bates, P. Scholes and G.M. Eccleston, J.
Pharm and Biomed Anal., 40:1155 (2006).
36. Deng, G., D. Chow and G. Sanyal, Anal. BioChem, 289:124 (2001).
37. De Meulenaer, B., G. Van Royen, B. Vanhoutte and A. Huyghebaert, J.
Chromatogr. A, 896:239 (2000).
38. Holcapek, M., P. Jandera, P. Zderadicka and L. Hruba, J. Chromatogr. A,
1010:195 (2003).
39. Dugo, P, O. Favoino, P.Q. Tranchida, G. Dugo and L. Mondello, J. Chromatogr.
A, 1041:135 (2004).
40. Cvacka, J, O. Hovorka, P. Jiros, J. Kindl, K. Stransky and I. Valterova, J.
Chromatogr. A ,1101:226 (2006).
41. Levine L.H, J.L. Garland and J.V. Johnson, J. Chromatogr. A, 1062:217 (2005).
42. Im S.H., Y.H. Jeong, J.J Ryoo, Anal. Chim. Acta, 619:129 (2008).
43. Lemiere, F., Interfaces for LC-MS, LC-GC Guide to LC-MS, p.2 (2001).
44. Gee, M., J. Chromatogr., 9: 278 (1962).
45. Mima, H. and N. Kitamori, JAOCS, 41:198 (1964).
46. Weiss, T.J., M. Brown, H.J. Zeringue, J.R. and R.O. Feuge, JAOCS, 48:145
(1971).
47. Torres, M. C., M.A. Dean and F.W. Wagner, J. Chromatogr., 522:245 (1990).
48. Rios, J.J., M.C. Perez-Camino, G. Marquez-Ruiz and M.C. Dobarganes, JAOCS,
71:385 (1994).

233
49. Lawson, D.R. and D.A. Danehower, J. Chromatogr., 463:429 (1989).
50. Simonovska, B., M. Srbinoska and I. Vovk, J. Chromatogr. A, 1127:273 (2006).
51. Sahasrabudhe, M.R. and R.K. Chadha, JAOCS, 46:8 (1969).
52. G35300, Croda Test Method, Analysis of Glycerol and Polyol Esters by HPGPC
(2001).
53. Cooper, J.L., Croda Technical Report, GPC Analysis of a Range of Sorbitan
Esters, CIN10354 (2000).
54. Birch, C.G. and F.E. Crowe, JAOCS, 53:581 (1976).
55. Seino, H., T. Uchibori, T. Nishitani and S. Inamasu, JAOCS, 61:1761 (1984).
56. Marquez-Ruiz, G., M.C. Perez-Camino, J.J. Rios and M.C. Dobarganes, JAOCS,
71:1017 (1994).
57. Aitzetműller, K., J. Chromatogr. Sci., 13:454 (1975).
58. Kaufman, V.R. and N. Garti, J. Liq. Chromatogr., 4:1195 (1981).
59. Jaspers, M.E.A.P., F.F Van Leeuwen, H.J.W Nieuwenhuis and G.M. Vianen,
JAOCS, 64:1020 (1987).
60. Lin J.T., C.L. Woodruff and T.A. McKeon, J. Chromatogr. A, 782:41 (1997).
61.Fliszar, K.A., W.P. Wuelfing, Z. Li and R.A. Reed, J. Pharm and Biomed Anal.,
40, 896 (2006).
62. Dreux, M., M. Lafosse and L. Morin-Allory, The Evaporative Light Scattering
Detector – A Universal Instrument for Non-Volatile Solutes in LC and SFC, LC-
GC, 148 (1996).
63. Mancini, F., E. Miniati and L. Montanari, Ital. J. Food Sci., 9:323 (1997).
64. Charlesworth, J.M., Anal. Chem., 50:1414 (1978).
65. Mourey, T.H. and L.E. Oppenheimer, Anal. Chem., 56:2427 (1984).

234
66. Stolyhwo, A., H. Colin, M. Martin and G. Guiochon, J. Chromatogr., 288:253
(1984).
67. Robinson, J.L. and R. Macrae, J. Chromatogr., 303:386 (1984).
68. Liu, J., T. Lee, E. Bobik, M. Guzman-Harty and C. Hastilow, JAOCS, 70:343
(1993).
69. Stolyhwo, A., H. Colin and G. Guiochon, Anal. Chem., 57:1342 (1985).
70. Herslőf B. and G. Kindmark, Lipids, 20:783 (1985).
71. Palmer, A.J. and F.J. Palmer, J. Chromatogr., 465:369 (1989).
72. Letter, W.S., J. Liq. Chromatogr., 16:225 (1993).
73. Cassel, S., P. Chaimbault, C. Debaig, T. Benvegnu, S. Claude, D. Plusquellec, P.
Rollin, and M. Lafosse, J. Chromatogr. A, 919:95 (2001).
74. Moh, M.H., T.S. Tang and G.H. Tan, Food Chemistry, 69:105 (2000).
75. Hopia A.I and V.M. Ollilainen, J. Liq. Chromatogr., 16:2469 (1993).
76. Christie, W.W and M.L. Hunter, J. Chromatogr., 325:473 (1985).
77. Sugawara, T. and T. Miyazawa, Lipids, 34:1231 (1999).
78. Asmus, P.A and J.B. Landis, J Chromatogr., 316:461 (1984).
79. Bear, G.R. J. Chromatogr., 459:91 (1988).
80. Neff, W.E., G.R. List and W.C. Byrdwell, J. Liq. Chrom. & Rel. Technol.,
22:1649 (1999).
81. Février, P., A. Binet, L. Dufossé, R. Grée and F. Yvergnaux, J. Chromatogr. A,
923:53 (2001).
82. Wang, Z and M. Fingas, J. High Resol. Chromatogr., 17:85 (1994).
83. Hunt, T.P., C.J. Dowle and G Greenway, Analyst, 118:17 (1993).
84. Suffis, R., T.J. Sullivan and W.S. Henderson, J. Soc. Cosmetic Chemists, 16:783
(1965).

235
85. Tsuda, T and H. Nakanishi, J. Assoc. Off. Anal. Chem., 66:1050 (1983).
86. Giacometti, J, C. Milin and N. Wolf, J. Chromatogr. A., 704:535 (1995).
87. Blum, W and L. Damasceno, J. High Resolut. Chromatogr. & Chromatogr.
Commun., 10:472 (1987).
88. Termonia, M., F. Munari and P. Sandra, J. High Resolut. Chromatogr. &
Chromatogr. Commun., 10:263 (1987).
89. Hinshaw, J. V and L.S. Ettre, J. High Resolut. Chromatogr., 12:251 (1989).
90. Karrer, R and H. Herberg, J. High Resolut. Chromatogr., 15:585 (1992).
91. Aichholz. R., and E. Lorbeer, J. High Resolut. Chromatogr., 21:363 (1998).
92. Pereira, A.S. and F.R Aquino Neto, J. Chromatogr. Sci., 38:369 (2000).
93. Snyder, L.R., J.J. Kirkland and J.L. Glajch, Practical HPLC Method Development,
p. 276 - 282, John Wiley & Sons Inc, New York (1997).
94. Dolan, J.W and L.R. Snyder, Troubleshooting LC Systems, p. 85, Humana Press,
New Jersey (1989).
95. Skoog, D.A., F.J. Holler and T.A. Nieman, p. 680, Principles of Instrumental
Analysis, Harcourt Brace College Publishers, Florida (1998).
96. Shaddick R., The Preparation and Analysis of Isosorbide Esters, MSc Project,
Hull University (1999).