
Marlborough Sounds Recreational Fisher Characterisation
75
REPORT No. 1647 December 2009 Marlborough Sounds Recreational Fisher Characterisation
-
Upload
lincoln-nz -
Category
Documents
-
view
2 -
download
0
Transcript of Marlborough Sounds Recreational Fisher Characterisation

REPORT No. 1647 December 2009
Marlborough Sounds Recreational Fisher Characterisation

REPORT No. 1647 December 2009
Photo credit: Ross Wearing
Being outdoors, sharing the fun of catching fish and eating the catch with family and friends.
© Copyright: Apart from any fair dealing for the purpose of study, research, criticism, or review, as permitted under the Copyright Act, this publication must not be reproduced in whole or in part without the written permission of the Copyright Holder, who, unless other authorship is cited in the text or acknowledgements, is the commissioner of the report.
Marlborough Sounds Recreational Fisher Characterisation
Chris Batstone Eric Goodwin Weimin Jiang
Geoff Kerr Basil Sharp Jim Sinner
Prepared for
New Zealand Ministry of Fisheries
Cawthron Institute 98 Halifax Street East, Private Bag 2
Nelson, New Zealand Ph. +64 3 548 2319
Fax. + 64 3 546 9464 www.cawthron.org.nz
Reviewed by:
J A Sinner
Approved for release by:
J A Sinner
Recommended citation: Batstone C, Goodwin E, Jiang W, Sinner J, Kerr G, Sharp B 2009. Marlborough Sounds Recreational Fisher Characterisation. Prepared for New Zealand Ministry of Fisheries. Report No. 1647. 63p.


REPORT No. 1647 iii December 2009
EXECUTIVE SUMMARY
This document summarises the outcomes of an on-line characterisation survey of recreational fishers undertaken in the Marlborough Sounds over the summer of 2008 / 09. The study is part of a wider project commissioned by the New Zealand Ministry of Fisheries to develop a discrete choice model with a view to understanding the preferences of Marlborough Sounds recreational fishers. The characterisation survey had three broad aims. First, to provide fishery specific information about patterns of fishing and other context features. Second, to provide a sampling frame for further research in the design and estimation of a discrete choice model. Third, to establish a basis for segmentation of the sampling frame in order to take account of differing levels of skill, avidity, and the tastes and preferences that may exist in the fisher population. There are a number of features that distinguish this research from prior recreational fishery research in New Zealand. The principal innovations are the use of the recreation specialisation concept to stratify the fisher population, development of an estimate of the Marlborough Sounds fisher population, and a focus on fisher values and motivations. An estimate of the annual harvest is developed that is consistent with other estimates generated for stock assessment purposes. Research method developments include roving intercept patrols for data collection in the Marlborough Sounds, use of the internet for data collection, and evaluation of self selection bias in internet-based data collection. Seventy per cent of respondents agreed with the proposition that the salt water fishing opportunities in the Marlborough Sounds area generally make for a satisfying experience. Blue cod is slightly more popular than snapper as the most preferred target species. With the exception of more experienced fishers, current bag limits do not constrain average trip bags of these species. Clear patterns emerge as to the character of the Marlborough Sounds recreational fishery. Fishing is embedded in a lifestyle that has a strong emphasis on family and social values. The most important motivations amongst Marlborough Sounds recreational fishers are to be outdoors, to be close to nature, and to share the fun of fishing and the fish they catch with family and friends. In contrast, motivations associated with sports fisheries, such as the pursuit of trophy fish, technical aspects of fishing, and fishing skill development, are less important in the Marlborough Sounds. Only 25% of respondents agreed with the proposition that the more fish are caught, the better a fishing trip. Catch bags of a small number of large fish are preferred over larger bags of small fish. The most preferred time of the year to go fishing in the Marlborough Sounds is the peak holiday period of December to February. While Canterbury, Nelson / Tasman Bay and Wellington contribute significant fishing effort, the greater proportion of respondents’ usual residential location was the Marlborough region. Those who visited the Sounds to fish stayed predominantly in holiday homes, or on yachts and launches. Demographically, the fishery is largely made up of males 35 to 65 years of age who identify with a European / Pakeha ethnicity. Middle to high incomes are more common amongst survey respondents than low incomes. In the twelve months prior to completing the survey, most respondents fished less than fifteen days in either the Inner or Outer Sounds. However, more fishers fished a high number of days in the Inner

REPORT No. 1647 iv December 2009
Sounds than the Outer Sounds. The most preferred alternative fishing locations are Golden Bay, Tasman Bay and Kaikoura; the Banks Peninsula area was cited as another alternative fishing location. Fishing from private boats by line methods is the most preferred fishing mode, with dredging for scallops the second most preferred species / technique combination. Fishers most often fish in groups of three on a vessel, with family and friends most often forming fishing parties. Less than twenty per cent of respondents held an annual freshwater fishing license in the past five years, and less than ten per cent of fishers belong to saltwater fishing organisations. Survey respondents were segmented into four classes using recreation specialisation categories. While differences in avidity and fishing effectiveness are evident between the segments, motivations and values were consistent across the sample, centred on the outdoors and catching and sharing consumption of the catch with family and friends. Using avidity-corrected fisher intercept data, a mark-recapture process was employed to derive an estimate of the population of recreational fishers in the Marlborough Sounds. This estimate is 9,212 fishers, with a 95% confidence interval of 7,416 to 11,008 fishers. Combining segmentation, reported catch rates and trip frequencies with this estimate allows calculation of an estimate of the annual recreational harvest in the Marlborough Sounds. The point estimate is 138,870 fish, with a 95% confidence interval ranging from 111,907 to 165,962 fish. Using a weight at size estimate of 0.75 kg per fish at the minimum legal size allows comparison with a previously published estimate (Davey et al. 2008) of 149,067 fish. Two approaches were taken to recruit fishers for the survey. First, we used a random intercept process at sea and on launching ramps and marinas in the Marlborough Sounds; contact details were solicited and subsequent correspondence directed respondents to the Cawthron website. Second, we issued a wide call to the public to visit the website and to complete the questionnaire. In the course of the intercept process, target proportions of 70% trailer boats, 25% yachts and launches and 5% other modes were reached. Thirty-eight days were spent collecting intercept data between 6 December 2008 and 15 March 2009. At sea, intercepts were carried out by a Cawthron staff member accompanying Ministry of Fisheries compliance teams on their regular voyages. A total of 1207 fishers were intercepted in the field, and of these 470 completed the survey online or by post. In addition, a further 201 surveys were received in response to the public call, resulting in a total of 671 survey responses. A response rate of 41% was achieved from the intercept sample. With the exception of avidity, for which results were adjusted, no other self selection bias was detected amongst the response to the public call. Non-response bias is consistent with avidity bias and accounted for similarly. Key implications for policy lie in two areas: research methodology and substantive understandings of Marlborough Sounds recreational fishers. Innovative solutions to the “average angler”, avidity bias, and fisher population estimation issues have been used in the course of this project. A new approach to recreational harvest estimates – fisher population estimation coupled with population segmentation

REPORT No. 1647 v December 2009
has been trialled and shown to generate harvest estimates consistent with current employed fisheries science methods. Differences in survey responses between intercept and self selected response to public calls suggests current consultation processes encounter avid anglers with potentially different understandings and expectations than the greater part of the fisher population. In this fishery, we estimate 33% of fishers (the two most avid segments) contribute 56% of the effort in the fishery and account for 63% of the total catch. Their fishing effectiveness means they are sceptical of the existence of any localised depletion problem, and their catch expectations motivate against harvest restriction. There are implications in the design of policy responses to these facts. Differences in fisher effectiveness and expectations, and the iconic role that blue cod fishing plays in the lifestyles adopted by recreational fishers, underscores the need for community engagement processes in both policy formation and implementation. This is necessary to reach, involve and to stimulate co-operation and leadership from the most effective fishers, while embracing the diversity of value in the fishery.

REPORT No. 1647 vi December 2009
TABLE OF CONTENTS
EXECUTIVE SUMMARY.........................................................................................................III 1. INTRODUCTION.............................................................................................................1 1.1. Research context ...................................................................................................................................... 1 1.2. This research and previous studies........................................................................................................... 2 1.3. Methods .................................................................................................................................................... 3 1.4. Policy and macroeconomic contexts ......................................................................................................... 5 1.4.1. Macroeconomic context ............................................................................................................................ 5 1.4.2. Policy context ............................................................................................................................................ 5 1.5. Structure of the report ............................................................................................................................... 6 1.5.1. Between-sample differences ..................................................................................................................... 6 1.5.2. Non-response bias .................................................................................................................................... 7 1.5.3. Between-segment differences................................................................................................................... 7 1.5.4. Between-survey comparison ..................................................................................................................... 7 2. MARLBOROUGH SOUNDS RECREATIONAL FISHERS ..............................................7 2.1. Usual residential location .......................................................................................................................... 7 2.2. Residential location when fishing in the Marlborough Sounds .................................................................. 8 2.3. Age and gender distribution of Marlborough Sounds recreational fishers ............................................... 10 2.4. Fishing experience in the Marlborough Sounds ...................................................................................... 11 2.5. Income distribution of Marlborough Sounds recreational fishers............................................................. 12 2.6. Ethnicity characteristics of Marlborough Sounds recreational fishers...................................................... 13 2.7. Segmentation of Marlborough Sounds recreational fishers..................................................................... 14 2.7.1. Recreation specialisation ........................................................................................................................ 14 2.7.2. Recreation specialisation Index Development......................................................................................... 14 2.7.3. Marlborough Sounds Recreational Fishery Segmentation ...................................................................... 16 2.8. Indicative estimates of Marlborough Sounds recreational fisher population and annual blue cod harvest 17 2.8.1. Indicative fisher population estimate ....................................................................................................... 17 2.8.2. Indicative Marlborough Sounds annual recreational harvest of blue cod ................................................ 18 2.9. Motivations and values associated with Marlborough Sounds recreational fishery ................................. 20 2.9.1. Motivation: Why do you go fishing?......................................................................................................... 20 2.9.2. Values: what makes for a good fishing trip?............................................................................................ 22 2.10. Social participation aspects of the Marlborough Sounds recreational fishery.......................................... 24 2.10.1. Fishing companions............................................................................................................................ 24 2.10.2. Club membership ............................................................................................................................... 24 2.11. Communications: How do fishers obtain and share information about saltwater fishing? ....................... 25 2.11.1. Media used to obtain information about saltwater fishing ................................................................... 25 3. CHARACTERISTICS OF FISHING EFFORT................................................................26 3.1.1. Fishing Effort: Location............................................................................................................................ 26 3.1.2. Fishing Effort: Time of Year..................................................................................................................... 29 3.2. Target Species ........................................................................................................................................ 30 3.3. Catch rates of three key species ............................................................................................................. 32 3.4. Fishing Methods and experience ............................................................................................................ 33 3.4.1. Line Fishing Methods .............................................................................................................................. 33 3.4.2. Other fishing methods ............................................................................................................................. 34

REPORT No. 1647 vii December 2009
3.5. Reducing blue cod juvenile mortality ....................................................................................................... 35 4. COMPARISON BETWEEN SUB-SAMPLES.................................................................40 4.1. Comparison between intercept and public response subsamples........................................................... 40 4.2. Comparison between on water and on land intercepts............................................................................ 44 5. NON-RESPONSE BIAS ................................................................................................45 6. BETWEEN-SEGMENT COMPARISON ........................................................................46 7. BETWEEN-SURVEY COMPARISON ...........................................................................53 8. KEY POLICY AND RESEARCH RELEVANT OUTCOMES..........................................55 8.1. Research relevant outcomes................................................................................................................... 55 8.1.1. Sampling fishers for catch estimate purposes......................................................................................... 55 8.1.2. Discrete Choice Model research processes ............................................................................................ 55 8.1.3. The average fisher problem .................................................................................................................... 55 8.1.4. Internet uptake ........................................................................................................................................ 56 8.2. Policy relevant outcomes ........................................................................................................................ 56 8.2.1. Fisher population estimate ...................................................................................................................... 56 8.2.2. Recreation specialisation segmentation of the fisher population............................................................. 56 8.2.3. Key values in the Marlborough Sounds recreational fishery.................................................................... 57 8.2.4. Fisher heterogeneity................................................................................................................................ 57 8.2.5. Temporal pattern of fishing...................................................................................................................... 57 8.2.6. Communications media........................................................................................................................... 57 8.2.7. Potential fisher response to policy........................................................................................................... 57 8.2.8. Fisher safety............................................................................................................................................ 58 8.3. Sustainability measures and the fisher population .................................................................................. 58 9. ACKNOWLEDGEMENTS..............................................................................................62 10. REFERENCES..............................................................................................................62

REPORT No. 1647 viii December 2009
LIST OF FIGURES
Figure 1. Discrete Choice Model Design Project Information Flows.................................................. 1 Figure 2. Sample structure and process. ........................................................................................... 5 Figure 3. Fishers’ residential location, without and with correction for avidity bias............................ 8 Figure 4. Fishers’ fishing accommodation, without and with correction for avidity bias. ................... 9 Figure 5. Age and gender of fishers, without and with correction for avidity bias............................ 10 Figure 6. Fishers’ years of experience, without and with correction for avidity bias. ....................... 11 Figure 7. Fishers’ income, without and with correction for avidity bias............................................ 12 Figure 8. Fisher ethnicity, without and with correction for avidity bias............................................. 13 Figure 9. Fisher stratification by specialisation. S1 is least specialised, S4 most specialised,
without and with correction for avidity bias. ...................................................................... 16 Figure 10. Importance (see Table 6) of fishing motivation statements (see Table 7)........................ 21 Figure 11. Mean importance of fishing motivation statements, without and with correction for avidity
bias.................................................................................................................................... 21 Figure 12. Agreement with fishing values statements in Table 8. ..................................................... 23 Figure 13. Mean agreement with fishing values statements, without and with correction for avidity
bias.................................................................................................................................... 23 Figure 14. Communication media used by fishers, without and with correction for avidity bias........ 25 Figure 15. Number of days fished in Inner and Outer Sounds, without and with correction for avidity
bias.................................................................................................................................... 27 Figure 16. Number of days fished in other locations, without and with correction for avidity bias.... 28 Figure 17. When fishers fish, without and with correction for avidity bias. ........................................ 29 Figure 18. Proportion of fishers targeting a given species by line methods (see also Table 11),
without and with correction for avidity bias. Vertical bars are 95% confidence intervals around estimate of the population proportion. .................................................................. 30
Figure 19. Proportions of fishers using line fishing method / platform combinations, without and with correction for avidity bias. ................................................................................................. 33
Figure 20. Proportions of fishers using non-line methods / platforms combinations, without and with correction for avidity bias. ................................................................................................. 34
Figure 21. Respondents views on effectiveness of measures to reduce incidental mortality of juvenile blue cod. .............................................................................................................. 36
Figure 22 Mean perceived effectiveness of mortality reduction measures, without and with correction for avidity bias. ................................................................................................. 37
Figure 23. Ease of use of juvenile incidental mortality reduction measures. ..................................... 38 Figure 24. Mean perceived east of use of mortality reduction measures, without and with correction
for avidity bias. .................................................................................................................. 38 Figure 25. Frequency of use of juvenile incidental mortality reduction measures. ............................ 39 Figure 26. Mean frequency of use of mortality reduction measures, without and with correction for
avidity bias. ....................................................................................................................... 39
LIST OF TABLES
Table 1. Recreation specialisation segment definition.................................................................... 15 Table 2. Average number of trips and average catch rates, by specialisation segment. ............... 16 Table 3. Indicative estimate of the Marlborough Sounds recreational fisher population. ............... 18 Table 4. Indicative estimate of the annual Marlborough Sounds recreational Blue Cod harvest. . 18 Table 5. Distribution of harvest and effort in the Marlborough Sounds recreational fisher
population.......................................................................................................................... 19 Table 6. Shading scheme used in Figures 10 and 11. ................................................................... 20 Table 7. Fishing motivation statements. ......................................................................................... 20

REPORT No. 1647 ix December 2009
Table 8. Value statements and associated commentary on results. .............................................. 22 Table 9. Shading scheme for Figure 12.......................................................................................... 22 Table 10. Prevalence of club membership and freshwater license holding...................................... 24 Table 11. Species codes for line target species. .............................................................................. 30 Table 12. Target species codes for ‘Other methods’. ....................................................................... 31 Table 13. Method / platform code for Figure 20................................................................................ 34 Table 14. Method / platform code for Figure 21................................................................................ 35 Table 15. Perceptions of juvenile incidental mortality reduction measures. ..................................... 35 Table 16. Differences between intercept and public response samples. ......................................... 41 Table 17. Differences between respondent and non respondent intercepted fishers. ..................... 45 Table 18. Differences between specialisation segments.................................................................. 46 Table 19. Differences between results of our study and previous studies. ...................................... 53 Table 20. Differences between studies, in species targeted when line fishing................................. 54 Table 21. Differences between studies, in species targeted by non-line methods........................... 54 Table 22. Sustainability measures and the fisher population............................................................. 60


REPORT No. 1647 1 December 2009
1. INTRODUCTION
1.1. Research context
This document describes the outcomes of a characterisation study of recreational fishers undertaken in the Marlborough Sounds over summer of 2008 / 09. The study is part of a wider project commissioned by the New Zealand Ministry of Fisheries (MFish) to develop a discrete choice model (DCM), also referred to as a choice experiment. The purpose of such a model is to provide a representative and statistically valid means to accumulate, aggregate, and understand fisher preferences. Figure 1 shows the position of the characterisation survey in the wider project in terms of project information flows. The three research components all contribute to inform MFish policy and management frameworks for the Marlborough Sounds recreational fishery.
Note: Choice experiment refers to discrete choice model.
Figure 1. Discrete Choice Model Design Project Information Flows.
The purpose of the fisher characterisation survey is to:
• Provide fishery specific information about patterns of fishing and other context features for fishery managers and community groups,
• Provide a sampling frame for further research, including focus groups, in the design and estimation of a DCM, and
• Establish a basis for segmentation (stratification) of the sampling frame in order to take account of differing levels of skill, avidity, and the tastes and preferences that may exist in the fisher population.
CharacterisationSurvey
Focus Groups
Choice Experiment
Marlborough Sounds Blue Cod Recreational
Fishery Policy Framework Design

REPORT No. 1647 2 December 2009
1.2. This research and previous studies
This document summarises the findings of the current survey in characterising the fisher population, as well as presenting comparisons with the fishery characteristics described by previous studies, and within the population described in this study. Characteristics of the population, as found by this study, are compared with populations described by the two previous studies (Bell 1998 and Davey 2008). The differences noted have several likely causes including: changes in the composition of the fisher population in response to changes in the fishery, changes in habits of fishers between surveys, and statistically expected variation in taking multiple samples from a population. Using data collected for a limited set of attributes at the time of recruitment to the survey, we make comparisons between respondents and non-respondents and describe a non-response bias based on avidity. Our fisher population is composed of two sub-samples: those fishers whom we intercepted in the field, and those that answered a public call for survey respondents. We make comparisons and describe the differences between those two sub-samples within our study’s sample of the fisher population. Having pooled those sub-samples to create our study sample, we then segmented it, using the recreation specialisation framework (Bryan 1977; Scott and Shafer 2003; Oh and Ditton 2005). Recreation specialisation is based on the idea that fishers pass through a distinct set of phases in their progression in the sport and that progress can be thought of as a continuum along which fishers proceed over time. The segmentation methodology is modelled on that used by Salz et al. (2001) in their NOAA sponsored baseline characterisation of Massachusetts’ marine recreational fisheries. A specialisation index based a “social worlds” concept (Ditton 1992) is used to classify fishers into distinct clusters, creating four groups, each characterised by a common level of “specialisation”, or identity as a Marlborough Sounds Blue Cod fisher. This segmentation process has proven an effective approach to dealing with heterogeneity in fisher populations (Salz et al. 2001), where an “average” fisher is unlikely to exist. Fishers generally display wide variation in their experiences, avidity, expertise, commitment, economic expenditures, and social interactions related to fishing. This segmentation creates the opportunity for the third of our within-study comparisons. We describe the differences found between these groups of more or less committed fishers, as well as identifying the characteristics of those most likely to be affected by the various management options available.

REPORT No. 1647 3 December 2009
1.3. Methods
Two key issues have arisen internationally in recreational fisheries research. The first is to develop a sampling frame in the absence of a known population of fishers. The second is to stratify the sample of fishers to ensure it is representative of the range of tastes and preferences held by the fishing population as a whole. These aspects represent important motivations to undertake preliminary research prior to development and implementation of a DCM process. Two approaches were used to identify Marlborough Sounds recreational fishers who would participate in the survey, an intercept process and a public call process. The intercept process was designed to create a representative random sample of fishers, based on a quota sampling methodology. Contact information was collected to enable the follow up survey. Other information collected included each person’s role on the vessel and number of fishing trips in the past twelve months, as well as vessel name, length, and type. This information was collected to provide a means to assess any non-response bias that might emerge. The intercept process was carried out at launching ramps, marinas and at sea, to ensure coverage of the full extent of boat type and spatial distribution of fishers. Sea based intercepts were necessary to meet fishers in vessels that do not use launching ramps. A target of 70% trailer boats, 25% yachts and launches and 5% other vessels was reached. This quota for coverage by vessel type is based on fleet composition reported in Bell (1998), and Davey (2008). Thirty-eight days were spent collecting intercept data between 6 December 2008 and 15 March 2009. At sea, intercepts were carried out by a Cawthron staff member accompanying Ministry of Fisheries compliance teams on their regular voyages. Land based intercepts were conducted at launching ramps and marinas in Havelock and Picton. All fishers recorded during intercepts were invited to respond to the survey. The intent was for the at sea intercepts to be the primary source of recruitment to the survey. However MFish compliance sea patrols did not spend as much time at sea as initially planned, meaning a greater reliance was placed on land based intercepts. Respondents were offered the choice of completing the survey online or via a paper copy sent via the post; the latter responses were manually coded by Cawthron staff. Response data were converted to spreadsheet form and cleaned; duplicates (i.e. a person intercepted more than once, or who was intercepted and also responded to the public call) were removed prior to data analysis. The second approach was a wide call to the public inviting response to the survey online. The survey was publicised through internet, print, radio and television media as well as promotion through fishing clubs, tackle shops and fuel providers. Flyers were sent to residential addresses of box holders in the Marlborough Sounds. The public call process created a list that formed the basis for recruiting members of the focus groups, which were a key element in the choice experiment design process.

REPORT No. 1647 4 December 2009
A total of 1207 fishers were intercepted in the field, 1148 provided viable contact addresses with 470 completing the survey online and by post. All those who agreed to participate were sent follow up messages thanking them for their participation, and advising they would, at some point in the future, be requested to complete a survey. In addition, a further 201 surveys were received in response to the public call, resulting in a total of 671 survey responses. The response rate of 41% is lower than has been achieved in previous studies, possibly due to the delay between the in-field intercept and the delivery of the survey. To account for the potential for strategic behaviour amongst respondents confounding outcomes, surveys were accessed by participants in four controlled phases. In the first, a pilot of 48 randomly selected individuals – selected to be representative of sample strata – were sent requests to access the survey website and complete the survey. The response rate to this pilot was 77%, with a similar proportion of the responses agreeing to take part in further research. The majority of the intercept sample accessed the survey between 25 February and 4 March. In order to meet sample quota requirements, the data collection process was extended later into March. The remaining respondents were requested to complete the survey in two groups on 9 March and 16 March. The online survey closed on 12 April 2009 and completed mail surveys received after that date were not included in analyses. Data were corrected for avidity, i.e. the number of trips that fishers made. The correction process follows that reported by Thomson (1991). Avidity bias arises because more frequent fishers have a higher probability of encounter in the intercept process than less frequent fishers. Both uncorrected and corrected results are presented in this report. The segmentation of the population reported here follows the recreation specialisation scheme described by Bryan (1977), Ditton et al. (2005), and Scott and Schaffer (2001). Further description of the approach is contained at various locations in the text. Figure 2 describes the relationships between the sub-samples in the data collected. Responses between sub-samples were evaluated for consistency. The design phase of the DCM consists of a series of structured focus group meetings to evaluate design considerations. The final stage in the process is estimation of the resulting DCM from data collected from a further round of focus group meetings.

REPORT No. 1647 5 December 2009
Figure 2. Sample structure and process.
1.4. Policy and macroeconomic contexts
1.4.1. Macroeconomic context
In the course of the data collection process, MFish compliance personnel commented on the less intense fishing effort in the Marlborough Sounds over the peak holiday season. The macroeconomic conditions prevailing at the time of this fisher characterisation are likely to influence survey outcomes in terms of the representativeness of the sample derived in the survey process. In recessionary economic conditions, job layoffs and declining residential property values, groups such as the less wealthy, or more risk averse, for example, review their annual holiday plans. Other effects may include delays or cancellation of expenditure on the vehicles and vessels needed to undertake a season’s fishing. This effect is likely to compound the no take area closures discussed in the following section. From a sampling perspective, it is not possible to know which fishers stayed away, or for what reasons – i.e. we do not know what the non-response bias is.
1.4.2. Policy context
The policy context that forms the background for this research has influenced the data collection process. The Marlborough Sounds recreational fishery for blue cod is the subject of area closure regulations for the period 1 October 2008 to 30 September 2012. Surveys in the Marlborough Sounds in 1996, 2001 and 2004 have shown a continued decline in the catch rates of 30cm or greater blue cod. Measures introduced in 2003 reduced the recreational bag limit from 6 to 3 fish and increased the Minimum Legal Size (MLS) from 28cm to 30cm for the Marlborough Sounds, Tasman and Golden Bays. A consultation process initiated in November 2007, which received in excess of 1000 submissions, resulted in the Minister taking the decision in June 2008 to implement temporary (October 2008 to October 2012) ‘no-take’ blue cod areas to prevent further decline of blue cod and provide time for MFish and the
Wide Public Call
Angler InterceptSample
Web based DataCollection
InterceptMail Data Collection
Angler Intercept WebSubsample
Mail Subsample
Public ResponseSubsample
Intercept Web DataCollection
CharacterisationSampling Frame
CharacterisationData Collection
Mode
CharacterisationSample
Components
ChoiceExperiment
Sample Pool
Choice ExperimentSample
Strata andproportions
Focus groupparticipants

REPORT No. 1647 6 December 2009
community to work on a longer term solution. Regulatory changes also required recreational fishers to land blue cod in a whole or gutted state to improve compliance with minimum legal size. The closure has been contentious, with a number of public meetings held in which the science behind the closure was disputed, the nature and the extent of the consultation process challenged, and entry to at least one of the meetings challenged by interested parties not invited. Considerable comment was fielded by project staff in the course of data collection regarding the ill will evident in the community, which also was manifested in the qualitative comments solicited from survey respondents. This background of contention and dissent has strongly influenced the research process. The timing of the release of the survey to the sample generated from the intercept process was delayed to reduce the scope for potential for strategic behaviour by survey respondents. The comparatively low response rate to the web survey (41% versus 60 – 90% in other comparable studies) is attributable, at least in part, to this effect. The strength of the response bias on the part of more avid fishers to the public call is also likely to be due, least in part to this effect.
1.5. Structure of the report
The report is organised as follows. The outcomes of the survey are presented in Sections 2 and 3. Section 2 focuses on the fishers themselves in terms of residential and holiday accommodation, background demographic information, years fishing the Marlborough Sounds, their motivations and what they value, their years of fishery related experience, and the sample stratification that results from a recreation specialisation perspective (see Section 2.7). Indicative estimates of the 2008 / 09 Marlborough Sounds recreational fisher population and the recreational harvest of blue cod in that period are contained in section 2.8. Further socio-economic information such as media preference and club membership complete Section 2. Section 3 describes fishing locations, species targeted, the methods used, expected catch rates for three key species and fishers’ assessments of four approaches to the reduction of incidental mortality of juvenile blue cod.
1.5.1. Between-sample differences
The fisher sample for this survey was drawn from two distinct processes: field intercept (at boat ramps and on the water), and a public call for survey respondents. The subsamples returned by these two distinct processes have the potential to represent distinct populations, in which case it would not be appropriate to pool them. We assess this potential and report on the differences found in section 4.

REPORT No. 1647 7 December 2009
1.5.2. Non-response bias
Compliance in responding to the survey was voluntary: intercepted fishers were not obliged to take part in the study, and respondents to the public call were self-selected. If non-responding fishers would have answered differently to those that did respond, there is potential for a bias. The implications of this “non-response bias” are evaluated and discussed in section 5.
1.5.3. Between-segment differences
The pooled fisher sample was segmented according to recreation specialisation. We analysed differences between these segments, identifying which fishers would be more affected by the various management options that could be considered in reopening the fishery. These findings are reported in section 6.
1.5.4. Between-survey comparison
This survey generates a characterisation that can be compared with previous similar studies. However, it is important to acknowledge the differences between the context of this study and those of the previous research. Specifically, the previous studies (Bell 1998, Davey et al. 2008) comprised diary surveys, and spanned the course of 12 months when the fishery was open (subject only to bag limit and size restriction). The study presented here comprised a survey during three peak fishing months, but when the inner Marlborough Sounds Blue Cod fishery was closed. The implications of these differences are discussed in section 7. Finally, findings of the study that have relevance for future research and for recreational fisheries management are summarised in section 8 of the report.
2. MARLBOROUGH SOUNDS RECREATIONAL FISHERS
Avidity bias in fisher intercept data arises because more avid anglers make more fishing trips, and are more likely to be encountered in the intercept process, resulting in their being overrepresented in the intercept sample. The figures in this section give results both uncorrected (dark bars) and corrected (light bars) for avidity bias. Error bars represent the spread of 95% confidence around the (uncorrected or corrected) statistic. The uncorrected statistic represents the proportion or mean of the respondent fisher sample with no adjustment for the fact that avid fishers are likely to be over-represented, while the corrected statistic adjusts for this and is therefore the best estimate of the whole fisher population.
2.1. Usual residential location
The Marlborough Sounds draws fishers from both the adjacent region and from outside the Marlborough Sounds area. Figure 3 gives fishers’ usual residential location.

REPORT No. 1647 8 December 2009
Figure 3. Fishers’ residential location, without and with correction for avidity bias. 2.2. Residential location when fishing in the Marlborough Sounds
The Marlborough Sounds is a popular holiday destination for Marlborough residents but also for people who live outside the Marlborough Sounds area. Most respondents, when fishing, stayed at either their usual residence or in a holiday home. The most prevalent alternative accommodation modes are yachts and launches and staying with friends and relatives. Figure 4 summarises the accommodation used by fishers when fishing in the Marlborough Sounds.
A Christchurch/ Canterbury B Wellington region C Marlborough Sounds D Blenheim & other E Nelson/ Tasman Bay F Other New Zealand G International visitor

REPORT No. 1647 9 December 2009
Figure 4. Fishers’ fishing accommodation, without and with correction for avidity bias.
A Usual place of residence B Holiday home or “bach” C Camping ground or holiday park D Hotel or motel E Yacht or launch F Camping other than camping ground or holiday G A friend’s place H With relatives I Other accommodation not specified above

REPORT No. 1647 10 December 2009
2.3. Age and gender distribution of Marlborough Sounds recreational
fishers
The Marlborough Sounds recreational fisher population largely consists of males, with females featuring most prominently in the 35 - 65 age groups (Figure 5).
Figure 5. Age and gender of fishers, without and with correction for avidity bias.

REPORT No. 1647 11 December 2009
2.4. Fishing experience in the Marlborough Sounds
Most of Marlborough Sounds recreational fishers have between 10 and 40 years of experience fishing in the Marlborough Sounds, although a substantial portion (about one-quarter) have less than 10 year’s experience (Figure 6).
Figure 6. Fishers’ years of experience, without and with correction for avidity bias.

REPORT No. 1647 12 December 2009
2.5. Income distribution of Marlborough Sounds recreational fishers
Survey respondents were asked to indicate their personal pre-tax income. They did this by ticking boxes representing the following income classes:
A. Less than $20,000 B. $20,000 to $30,000 C. $30,000 to $50,000 D. $50,000 to $70,000 E. $70,000 to $100,000 F. More than $100,000
Most respondents reported annual income between $30,000 and $70,000, and fishers with higher incomes (more than $70,000 per year) were more common than those with low incomes (less than $30,000 per year) – see Figure 7.
Figure 7. Fishers’ income, without and with correction for avidity bias.

REPORT No. 1647 13 December 2009
2.6. Ethnicity characteristics of Marlborough Sounds recreational
fishers
The Marlborough Sounds recreational fisher population is composed mostly of people who identify with the Pakeha / European ethnicity, with very low participation rates from people who identify with other ethnicities (Figure 8).
Figure 8. Fisher ethnicity, without and with correction for avidity bias.
MAO Maori PI Pacific Islands SAM Samoa CIM Cook Islands TON Tonga CH Chinese KO Korean IND Indian PAK Pakeha

REPORT No. 1647 14 December 2009
2.7. Segmentation of Marlborough Sounds recreational fishers
2.7.1. Recreation specialisation
A prominent issue in research in recreational fisheries is generating a sample that is representative of the fisher population as a whole. Fishers differ in their avidity, preferences for methods, species, locations, and the motivations and values they attach to their fishing. Fishers show wide variation in their experiences, expertise, commitment, economic expenditures, and social interactions related to fishing. Underlying this variation are important sociological and psychological differences affecting motivations, expectations, desired outcomes, satisfaction levels, and social norms. These aspects are referred to as “social world characteristics”. A method developed and applied in the USA to understanding this diversity in fisher populations is the recreation specialization concept (Bryan 1977 and Scott and Shafer 2001). Specialisation in this context is defined as “a continuum of behaviour from the general to the particular reflected by equipment and skills used in the sport and activity setting preferences” (Bryan 1997). Bryan identified four types of fishers, each with a specific location on the continuum: occasional fishers, generalists, technique specialists and, at the most specialised end of the continuum, fishers with distinct preferences for particular techniques and types of locations. The typology of fisher is reflected in frequency of participation, setting preferences, technique preferences, choice of equipment, importance of catch, social setting of activity and preferences for resource management (Ditton et al. 1992).
2.7.2. Recreation specialisation Index Development
This study uses the specialisation index developed by Salz and Loomis (2001), which produces four segments based on four main social world characteristics: orientation, experiences, relationships, and commitment. Survey questions in Section Five of the survey, “How involved are you in saltwater fishing?” were designed to measure each of these characteristics. In that section, question response options, consisting of statements describing respondents’ connection to an activity relative to a particular social world characteristic, were ordered from least specialised (response = 1) to most specialised (response = 4). Segment One fishers are more likely to “[be] somewhat uncertain …. Unsure about what (they) can or cannot do, or how to do it.” Their relationships with other fishers are “Not established. [They] don’t really know any other Marlborough Sounds salt water fishers”, and when fishing in the Marlborough Sounds they feel “Unfamiliar with Marlborough Sounds and the fishing community.” Their commitment to the Marlborough Sounds fishing is “Almost non-existent. [They] basically don’t care whether or not [they] continue to go fishing in the Marlborough Sounds”. Segment Two fishers are more likely to “have some understanding of Marlborough Sounds salt water fishing, but still [be] in the process of learning. [They are] becoming more familiar and comfortable with salt water fishing.” Their relationships with other fishers are “Very limited.

REPORT No. 1647 15 December 2009
[They] know some other Marlborough Sounds salt water fishers by sight and sometimes talk with them, but … don’t know their names”. When fishing in the Marlborough Sounds they feel like they’re “An occasional fisher”, and their commitment to Marlborough Sounds fishing is “Moderate. [They] will continue to go fishing in the Marlborough Sounds as long as it is entertaining and provides the benefits [they] want.” Segment Three fishers are more likely to be “Comfortable with Marlborough Sounds fishing. [They] have regular, routine and predictable experiences. [They] have a good understanding of what to do and how to do it.” Their relationships with other Marlborough Sounds fishers are “… of familiarity. [They] know the names of other Marlborough Sounds salt water fishers and often speak with them.” When fishing in the Marlborough Sounds they feel like “A regular fisher”, and their commitment to Marlborough Sounds fishing is “Fairly strong. [They] have a sense of being a member of the fishing community, and it is likely [they] will continue to fish in the Marlborough Sounds for some time.” Segment Four fishers are more likely to be “A knowledgeable expert and / or someone who is comfortable teaching and helping others who are interested in Marlborough Sounds salt water fishing.” Their relationships with other fishers are “Close, [they] have personal and close friendships with other Marlborough Sounds saltwater fishers. These friendships are often centred on Marlborough Sounds salt water fishing.” When fishing in the Marlborough Sounds they feel like “An insider to the sport: Marlborough Sounds salt water fishing is an important part of who [they are]” and their commitment is “very strong. [They are] totally committed to fishing in the Marlborough Sounds. [They] encourage others to go fishing, and seek to ensure the activity continues into the future.” Table 1 describes how fishers were segmented into four groups (ranging from least to most specialized) based on total scores. The scales were developed by Salz et al. (2001) in the context of North American recreational fishers.
Table 1. Recreation specialisation segment definition.
Cumulative score Index level Segment description 4 – 6 Segment One (S1) Least experienced
7 – 10 Segment Two ( S2) Moderately experienced 11 – 13 Segment Three (S3) Very experienced 14 – 16 Segment Four (S4) Most experienced

REPORT No. 1647 16 December 2009
2.7.3. Marlborough Sounds Recreational Fishery Segmentation
Figure 9 describes the population proportions in the four recreation specialisation segments. Table 2 contrasts the average number of Marlborough Sounds fishing trips annually and average catch rates for blue cod and snapper, by segment.
Figure 9. Fisher stratification by specialisation. S1 is least specialised, S4 most specialised, without
and with correction for avidity bias. Table 2. Average number of trips and average catch rates, by specialisation segment.
Segment: S1 S2 S3 S4
Average trips per year 1.55 5.37 11.2 12.44
Average blue cod taken per trip 1.06 1.87 2.46 2.58
Average snapper taken per trip 1.02 1.81 1.40 1.26

REPORT No. 1647 17 December 2009
2.8. Indicative estimates of Marlborough Sounds recreational fisher
population and annual blue cod harvest
2.8.1. Indicative fisher population estimate
In the course of the fisher intercept process, following an initial period in December 2008, the interview team began to meet fishers they had previously interviewed. Cawthron used this “re-encounter” phenomenon to derive an indicative estimate of the population of Marlborough Sounds recreational fishers in 2008 / 09. The process is based on a form of the Peterson mark-recapture approach used by ecologists to estimate populations of animals in a defined area, where it is not possible or practical to undertake a census of the population (Ricker, 1975). A similar technique is used by social services providers to provide indicative estimates of the demand for social services where registration is impractical and the dimensions of the target population are undefined. The principal social sciences fields that contribute peer reviewed studies are epidemiology and community health dealing with subjects as diverse as research methods in medicine (Kastner et al. 2008), estimation of the size of a population at risk for sexually transmitted diseases (Rubin et al. 2006), the extent of alcohol abuse in communities (Bloor et al. 1998) and the incidence of myocardial infarctions (La Porte et al. 1992). We are not aware at this time of the prior application of the mark recapture process to the estimation of recreational fisher populations. Accordingly, this is a potentially important contribution to the development of recreational fisheries research and management in New Zealand. A number of sophistications over the approach presented here have been made by other researchers, to take account of effects such as fisher heterogeneity and the encounter process. Since our data does not support time series analysis we have used an estimation process consistent with the data available. The approach here is that described by Seber (1982), reported in an application by Matos-Caraballo et al. (2006). Applied to data from the fisher intercept process, the following formula derives an estimate of the 2008/09 Marlborough sounds recreational fisher population:
( ) ( )( )12
1211*+
++=
mnnN (1)
where N* = the population estimate, n1 = the total number of fishers encountered for the first time (the first sample), n2 = the number of fishers encountered on subsequent days’ interviewing (the second sample), and m2 = the number of fishers encountered for the second time on a subsequent day. An estimate of the variance of N may be obtained from the following expression (Seber 1982):
( )( )( )( )( ) ( )2212
2221)1211* 2 ++
−−++=
mmmnmnnnv (2)
An estimate of the 95% confidence for N* may be obtained as follows (Seber 1982):

REPORT No. 1647 18 December 2009
*96.1* vN ± (3)
Application of equations (1) to (3) yields an indicative estimate for the population of recreational fishers in the Marlborough Sounds in the summer of 2008 / 09 (Table 3).
Table 3. Indicative estimate of the Marlborough Sounds recreational fisher population.
Lower bound (5th percentile)
N* Upper bound (95th percentile)
7,416 9,212 11,008
2.8.2. Indicative Marlborough Sounds annual recreational harvest of blue cod
By using the fisher population estimate, population segmentation proportions, segment annual mean trip and mean per trip reported harvest rates described in sections 2.7 and 2.8, it is possible to derive an indicative estimate of the Marlborough Sounds annual recreational blue cod harvest. For the reported harvest rates, respondents were directed to respond based on practices prior to the closure of the Inner Sounds to blue cod fishing. Table 4 reports the outcomes of the calculation along with the most recent available (Davey et al. 2008) estimate for the annual Marlborough Sounds recreational harvest of blue cod. The conversion from tonnes reported in Davey et al. (2008) to numbers of fish uses a mean weight at minimum legal size (MLS) estimate provided by the Ministry of Fisheries of 1 fish at MLS = 0.75 kg.
Table 4. Indicative estimate of the annual Marlborough Sounds recreational Blue Cod harvest.
5th percentile estimate
(number of fish)
Annual Marlborough Sounds Recreational Blue
Cod Harvest Estimate (number of fish)
95th percentile (number of fish)
This study
111,807 138,869 165,962
Davey et al. (2008)
117,600 149,067 211,867
In making comparison between the Davey et al. (2008) estimate and this study, consideration should be given to the differences in the methods used to derive the estimates, and the fact that conversion from fish to weight at size is an estimate only. However the estimates are consistent in that the 95% confidence intervals overlap, and the data in this study was collected three years following Davey et al. (2008) in a fishery considered to be in decline locally over that period.

REPORT No. 1647 19 December 2009
It is important to note, however, the following disclaimer. The objective of the study was not to form these estimates. The intercept methodology was not designed with a mark-recapture task in mind, and the method used to calculate the estimate has been superseded by processes that use more advanced statistical methods. The significance of the “fisher re-encounter” phenomenon and the potential to test a basic form of the estimation process was noted by researchers. The estimates are provided here for three reasons. First, to provide a validation measure for the fisher population estimate, given there are no other studies available for comparison. Second, to draw attention to a potential method to resolve a long standing problem in recreational fisheries research, that of quantifying recreational fisher populations and deriving estimates of effort and annual harvests in the absence of registration or census processes. Third, for the potential of the approach to act as a validation / triangulation methodology to extend and validate existing catch estimate processes. Table 5 shows that fishers in segments Three and Four account for 24% and 9% of the fisher population respectively. In contrast, these two segments combined make 55% of the fishing trips, and through their greater expertise account for 63% of the total blue cod take. Fishers in these segments have reported similar effort and catch rates.
Table 5. Distribution of harvest and effort in the Marlborough Sounds recreational fisher population. Segment One Segment Two Segment Three Segment Four Segment proportion of the fisher population
13% 53% 24% 9%
Number of fishers 1239 4853 2232 829 Average number of trips per fisher
1.55 5.37 11.2 12.44
Total trips in segment
1920 26062 24996 10313
Segment trips as proportion of the total effort
3% 41% 39% 16%
Average number of blue cod taken per trip
1.06 1.87 2.46 2.58
Number of blue cod per segment
2,035 48,736 61,491 26,607
Segment blue cod take as proportion of the total blue cod take
1.5% 35.1% 44.3% 19.2%

REPORT No. 1647 20 December 2009
2.9. Motivations and values associated with Marlborough Sounds
recreational fishery
2.9.1. Motivation: Why do you go fishing?
Section Eight of the characterisation survey asked respondents to assign an importance ranking from 1 to 5 for 15 statements that describe their motivations for fishing in the Marlborough Sounds. Table 6 describes the shading scheme used in the figures below that report the results; Table 7 presents the motivation statements and the corresponding codes used in Figure 12, which portrays the pattern of responses in terms of proportions of the fisher population.
Table 6. Shading scheme used in Figures 10 and 11.
Shade Importance ranking Importance category
5 Extremely important
4 Very Important
3 Moderately important
2 Slightly important
1 Not all important
Table 7. Fishing motivation statements.
Code Motivation statement A To be outdoors B For family recreation C To experience new and different things D For relaxation E To be close to the water F To obtain fish for eating G To get away from the demands of other people H To experience the catch I To test my equipment J To share experiences with family, friends, and other
fishing partners K To catch a trophy fish L To develop my fishing skills M For the challenge or sport N For the fun of catching fish O To catch fish to share with other people
Figure 10 shows that the most important motivations amongst Marlborough Sounds recreational fishers are to be outdoors (A), for family recreation (B), for relaxation (D), to share experiences with family and friends (J) and for the fun of catching fish (N).
In contrast, motivations associated with sports fisheries are far less important: the pursuit of trophy fish (K), to test equupment (I), and fishing skill development (L).

REPORT No. 1647 21 December 2009
Figure 10. Importance (see Table 6) of fishing motivation statements (see Table 7).
Figure 11. Mean importance of fishing motivation statements, without and with
correction for avidity bias.

REPORT No. 1647 22 December 2009
2.9.2. Values: what makes for a good fishing trip?
Section Eight of the characterisation survey asked respondents to assign an agree / disagree ranking from 1 to 5 for ten statements that describe values associated with fishing in the Marlborough Sounds. Table 9 describes the shading scheme for the ranked values. Figure 12 portrays the pattern of responses in terms of proportions of the fisher population. Table 8 presents the value statements and the corresponding codes used in Figure 12, along with a brief commentary on the outcomes. Table 8. Value statements and associated commentary on results.
Code Value statement Results A The more fish I catch, the happier I
am Similar proportions for agreement and disagreement
B A fishing trip can be worthwhile even if no fish are caught
65% of respondent agreed
C I usually eat the fish I catch
90% of respondents agreed
D A worthwhile fishing trip is one in which many fish are caught
25% of respondents agreed, 40% disagreed
E I would rather catch one or two big fish than then ten small fish
65% of respondents agreed
F When I go fishing I’m just as happy if I don’t catch fish
Similar proportions for agreement and disagreement
G It doesn’t matter to me which species of fish I catch
Similar proportions for agreement and disagreement
H The bigger the fish, the better the fishing trip
Similar proportions for agreement and disagreement
I I’m just as happy if I don’t keep the fish I catch
Similar proportions for agreement and disagreement
J The salt water fishing opportunities in the Marlborough Sounds area generally make for a satisfying experience for me.
70% of respondents agreed 10% disagreed
Table 9. Shading scheme for Figure 12.
Shade Agreement rank Agreement category
1 Strongly disagree
2 Disagree
3 Neutral
4 Agree
5 Strongly agree

REPORT No. 1647 23 December 2009
Figure 12. Agreement with fishing values statements in Table 8.
Figure 13. Mean agreement with fishing values statements, without and with
correction for avidity bias.

REPORT No. 1647 24 December 2009
Seventy per cent of respondents agreed with the proposition that salt water fishing opportunities in the Marlborough Sounds area generally make for a satisfying experience for them. While the majority of respondents agreed with the proposition that a fishing trip to the Marlborough Sounds could be enjoyable even if fish weren’t caught, the majority of fishers value eating the fish they catch, and prefer catch bags to be made up of a small number of large fish over a large number of small fish. Similar proportions of the respondents agreed / disagreed (40% / 30%) with the remaining statements (A, F, G, H, I). Only 25% of respondents agreed with statement D, “A worthwhile fishing trip is one in which many fish are caught”.
2.10. Social participation aspects of the Marlborough Sounds recreational fishery
2.10.1. Fishing companions
Survey respondents were asked to indicate how many people they went fishing with on average in the Marlborough Sounds, and were asked to select from a number of alternatives as to their relationships with their fishing comparisons. The average number of fishing companions on a trip in the Marlborough Sounds was 3, with 75% of the responses less than 5, and 95% of the responses less than 8 people. This outcome is influenced by the sample proportions of vessels targeted in the intercept process design (Section 1.2).
Of Marlborough Sounds fishing trips, 60% were undertaken with family, 25% with friends, and less than 10% each with co-workers and with no-one. This highlights the social character and family related nature of the Marlborough Sounds recreational fishery.
2.10.2. Club membership
Survey respondents were asked to indicate whether they belonged to a saltwater fishing club, and whether they held an annual freshwater fishing license in the past five years. Table 10 describes the outcomes.
Table 10. Prevalence of club membership and freshwater license holding.
Indicator Proportion of positive responses Saltwater fishing club member 7%
Freshwater fishing annual license 16%

REPORT No. 1647 25 December 2009
2.11. Communications: How do fishers obtain and share information
about saltwater fishing?
2.11.1. Media used to obtain information about saltwater fishing
Communication with fishers is an important consideration for recreational fishery management. Respondents were asked to indicate which media they used to obtain information about saltwater fishing. Figure 14 describes the outcomes.
Figure 14. Communication media used by fishers, without and with correction for avidity bias. Marlborough Sounds fishers’ preferences for communications media are, in order,
1. Fishing magazines 2. Newspapers 3. Ministry of Fisheries internet 4. Television 5. Other internet sources 6. Other magazines 7. Radio.

REPORT No. 1647 26 December 2009
Note, however, that the difference between 2, 3, 4 and 5 are not statistically significant (as shown by overlapping confidence intervals in Figure 14). Eighty-two per cent of respondents indicated they had internet access at home. 3. CHARACTERISTICS OF FISHING EFFORT
Fishing effort distribution is described in terms of location and time of the year. Location and within year trip data was collected as days fished at location and month categories. Respondents also provided information on the location and seasonal preferences by ranking Marlborough Sounds recreational fishing locations and fishing months as first, second and third preferences.
3.1.1. Fishing Effort: Location
Data from this section of the survey is presented in two figures. Figure 15 shows the number of days fished in the previous 12 months in the Inner and Outer Sounds, corresponding to current closed and open areas. Figure 16 shows alternative locations fished.

REPORT No. 1647 27 December 2009
Figure 15. Number of days fished in Inner and Outer Sounds, without and with correction for avidity
bias.

REPORT No. 1647 28 December 2009
Figure 16. Number of days fished in other locations, without and with correction for avidity bias.

REPORT No. 1647 29 December 2009
3.1.2. Fishing Effort: Time of Year
Figure 17 describes the distribution of fishing effort within a year, clearly showing the peak summer season. The figure shows what percentage of fishers fish in any given month.
Figure 17. When fishers fish, without and with correction for avidity bias.

REPORT No. 1647 30 December 2009
3.2. Target Species
This section reports the preferences of Marlborough Sounds fishers for different target species. The data are grouped by method. Table 11 and Table 12 summarise the code used on the x-axis to represent the species in Figure 18 and Figure 19 respectively. The error bars represent 95% confidence intervals.
Figure 18. Proportion of fishers targeting a given species by line methods (see also Table 11), without
and with correction for avidity bias. Vertical bars are 95% confidence intervals around estimate of the population proportion.
Table 11. Species codes for line target species.
Code Target species BCO blue cod MOK moki FLA flounder GRO grouper KAH kahawai KIN kingfish SNA snapper TAR tarakihi OTH other species NON no target species

REPORT No. 1647 31 December 2009
Figure 18. Proportion of fishers targeting a given species using other methods (not line fishing) ,
without and with correction for avidity bias. Vertical lines indicate 95% confidence intervals.
Table 12. Target species codes for ‘Other methods’.
Code Species BUT butterfish CRA rock lobster FLA flounder KSP kina GSM greenshell mussel PAU paua SCA scallops OTH other species targeted NON no target species

REPORT No. 1647 32 December 2009
3.3. Catch rates of three key species
Bag limits constrain catches of blue cod, snapper, and mixed species. Figure 19 describes catch rates for three key line fishing species in the Marlborough Sounds. Average catches of blue cod are 2.5 fish per trip, whereas only 1 snapper is taken per trip.
Figure 19. Catch rates for key line fishing species, without and with correction for avidity bias. Vertical
lines indicate 95% confidence intervals around estimates of the population mean.

REPORT No. 1647 33 December 2009
3.4. Fishing Methods and experience
This section describes the Marlborough Sounds recreational fishery in terms of the fishing method and platform combinations used by fishers. Section 3.4.1 describes differing line methods and platforms, Section 3.4.2 other methods.
3.4.1. Line Fishing Methods
Figure 17 describes the distribution of line fishing method / platforms in terms of proportions of the population that use them. The error bars represent 95% confidence intervals. Table 13 describes the codes used to represent the method / platform combinations on the x-axis.
Figure 19. Proportions of fishers using line fishing method / platform combinations, without and with
correction for avidity bias.

REPORT No. 1647 34 December 2009
Table 13. Method / platform code for Figure 20.
Code Method/platform combination LPB Line fishing from private vessel LCH Line fishing from charter vessel LLPB Longline fishing from private vessel LSH Line fishing from the shore
LLSH Longline / kon-tiki from shore NL_MS I don’t line fish in the Marlborough Sounds
3.4.2. Other fishing methods
Figure 18 describes other fishing method / platforms in terms of proportions of the population that use them. The error bars represent 95% confidence intervals. Table 14 describes the codes used to represent the method / platform combinations on the x-axis.
Figure 20. Proportions of fishers using non-line methods / platforms combinations, without and with
correction for avidity bias.

REPORT No. 1647 35 December 2009
Table 14. Method / platform code for Figure 21.
Code Method / platform combination DPB Diving from private vessel DCH Diving from charter vessel DSH Diving from the shore
DRED Dredging SN Set netting DN Drag netting HG Hand gathering POT Potting OTH Other methods
NO_OTH None, I don’t use other methods 3.5. Reducing blue cod juvenile mortality
Incidental mortality to blue cod juveniles arises from catch and release of undersize fish, as required by minimum size regulation. In this section respondents’ assessment of four methods aimed at reducing this were evaluated. The four methods were: A. Use of circle hooks to ensure mouth / lip hooking B. Use of size 6/0 or hooks or larger to avoid catching juveniles and to avoid gut hooking C. Moving away from areas where large numbers of juvenile fish are caught, and, D. The use of “release tubes” to reduce predation by shags and gulls.
and they were evaluated in terms of their:
• effectiveness,
• ease of use, and
• frequency of use.
Respondents were asked to rate each of these aspects for each of four methods to reduce mortality, on a scale of 1 to 5, where 1 represented “not at all effective” and 5 “extremely effective”. Table 15 presents a brief summary of the outcomes. Percentages represent the proportions of the population returning a positive response (i.e. a 4 or 5). Respondents had a significantly less favourable view of release tubes compared to the other measures.
Table 15. Perceptions of juvenile incidental mortality reduction measures.
Effectiveness Ease of use Frequency of use
Use of circle hooks 50% 75% 68%
Use of size 6/0 or hooks or larger
55% 83% 75%
Moving away 50% 65% 70%
Release tubes 30% 30% 10%

REPORT No. 1647 36 December 2009
Figure 21 to Figure 26 present the outcomes in chart form.
Figure 21. Respondents views on effectiveness of measures to reduce incidental mortality of juvenile
blue cod.
Key
Extremely effective
Very effective
Moderately effective
Slightly effective
Not at all effective

REPORT No. 1647 37 December 2009
Figure 22 Mean perceived effectiveness of mortality reduction measures, without and with correction
for avidity bias.

REPORT No. 1647 38 December 2009
Figure 23. Ease of use of juvenile incidental mortality reduction measures.
Figure 24. Mean perceived east of use of mortality reduction measures, without and with correction for
avidity bias.
Key
Extremely easy
Very easy
Moderately easy
Slightly easy
Not at all easy

REPORT No. 1647 39 December 2009
Figure 25. Frequency of use of juvenile incidental mortality reduction measures.
Figure 26. Mean frequency of use of mortality reduction measures, without and with correction for
avidity bias.
Key
Always
Often
Occasionally
Rarely
Never

40 REPORT No. 1647 December 2009
4. COMPARISON BETWEEN SUB-SAMPLES
Two distinct strategies yielded the fisher sample surveyed for this study: intercept in the field, and public call for respondents. There is the potential for these two strategies to access different populations, which could be reflected in their responses to the survey instrument. The intercept sample yields fishers who actively fish, as they were encountered while taking part in the activity, while the public call sample may yield less avid fishers, with different views and motivations. Conversely, the public call also has the potential for over-representation of more avid fishers due to self-selection bias. Of the intercept sample, some were intercepted on the water, while others were intercepted on land – either with their boats at boat ramps, or on their boats berthed in marinas. This section presents comparison between the intercept and public response sub-samples, and between the on-the-water and on-land intercept subsamples.
4.1. Comparison between intercept and public response subsamples
Comparison of the public response and intercept samples’ responses suggested some differences, as detailed in Table 16. The intercepted fishers were likely to be less specialised (segments one and two) than the public respondents. The public call respondents report more days fished in the outer Marlborough Sounds, and were more avid in general. These fishers were more likely to feature in segments three and four, which reflect greater specialisation. These more avid, more committed fishers are reflected in some of the other differences that were observed between these samples. Intercepted fishers reported more gurnard caught than public respondents. The public call respondents appear to find it easier to catch a bag limit of blue cod, while the intercept sample finds it easier to catch a bag limit of snapper. The intercept fishers reported a greater preference for snapper than the public call sample. More of the intercept sample than of the public response call sample fish by line from a private boat, and more of the public call respondents prefer to fish from shore (this reflects the quota sampling approach adopted in the intercept process). More of the public call respondents fish on their own, and the average number of companions is lower amongst public call respondents than among the intercepted fishers. More of the intercepted fishers fish with their family. More of the public call respondents are members of a fishing club. While the motivations of the two samples were very similar, the public respondents were slightly more motivated by catching fish to eat, less so by further developing their skills, less by being outdoors, but more so to be away from the demands of others. They were more motivated by the challenge of the sport, and less by the possibility to catch a trophy fish. These and other differences are further detailed in Table 16.

REPORT No. 1647 41 December 2009
Table 16. Differences between intercept and public response samples.
Statistic Intercept sample
Public call sample
Statistical significance*
Specialisation and avidity
Respondents in segment 2 proportion 0.5 0.309 XXX
Respondents in segment 4 proportion 0.09 0.215 XXX Days fished in outer Marlborough Sounds mean 3.1 3.7
XX
Seasonal fishing pattern and preferences
Fishing in February proportion 0.558 0.411 XX
Fishing in March proportion 0.422 0.298 XX
Fishing in September proportion 0.311 0.23 X
Prefer month, Jan proportion 0.317 0.2 XXX
Prefer September proportion 0.008 0.033 XXX
Prefer November proportion 0.025 0.009 X
2nd preference February proportion 0.233 0.146 XX
2nd preference March proportion 0.159 0.054 XXX
3rd preference December proportion 0.123 0.054 XXX
3rd preference October proportion 0.023 0.049 XX Species fishing pattern and preferences (linefishing)
Fish for kahawai proportion 0.227 0.361 XXX
Fish for snapper proportion 0.568 0.453 XX
Fish for tarakihi proportion 0.243 0.364 XXX
Fish for other species proportion 0.072 0.026 XXX
Prefer tarakihi proportion 0.003 0.021 XXX
Prefer snapper proportion 0.275 0.18 X
2nd preference blue cod proportion 0.239 0.096 XXX
2nd preference blue moki proportion 0.002 0.093 XXX
2nd preference kahawai proportion 0.058 0.143 X
2nd preference tarakihi proportion 0.101 0.177 XX
2nd preference other species proportion 0.018 0.001 X
3rd preference other species proportion 0.022 0.045 X Species fishing pattern and preferences (non-linefishing)
Fish for butterfish proportion 0.113 0.265 XXX
Fish for mussels proportion 0.262 0.398 XX
Fish for scallops proportion 0.638 0.454 XXX
2nd favourite crayfish proportion 0.127 0.218 XX
2nd favourite flounder proportion 0.147 0.065 XX
2nd favourite mussels proportion 0.09 0.194 XXX
2nd favourite scallops proportion 0.206 0.128 XX
3rd favourite flounder proportion 0.06 0.148 XXX
3rd favourite mussels proportion 0.135 0.056 XX * XXX: significant at 0.05, XX: significant at 0.10, X: significant at 0.15

42 REPORT No. 1647 December 2009
Statistic Intercept sample
Public response sample
Statistical significance*
Catch rates
Catch rate of gurnard mean 0.9 0.58 XXX Disagree its easy to catch bag limit of blue cod proportion 0.272 0.059 XXX Strongly agree its easy to catch bag limit of blue cod proportion 0.207 0.377 XXX Strongly disagree its easy to catch bag limit of snapper proportion 0.261 0.368 X Neutral that its easy to catch bag limit of snapper proportion 0.193 0.119 X Strongly disagree its easy to catch bag limit of other species proportion 0.22 0.355 XXX Disagree its easy to catch bag limit of other species proportion 0.433 0.324 X Neutral that its easy to catch bag limit of other species proportion 0.218 0.123 XX Fishing methods used and preferred Fish by line from a private boat proportion 0.943 0.807 XXX Prefer line fishing from private boat proportion 0.904 0.675 XXX Prefer line fishing from shore proportion 0.005 0.101 XXX 3rd preferred method line fishing from charter boat proportion 0.027 0.003 XX 3rd preferred method long line from private boat proportion 0.008 0.026 XX 3rd preferred method line fishing from shore proportion 0.05 0.014 XX Dive from a charter boat proportion 0.003 0.023 XXX Dredge proportion 0.427 0.288 XX Use a method other than listed proportion 0.011 0.04 XX Prefer dredging proportion 0.244 0.143 XXX Prefer hand gathering proportion 0.048 0.101 XX Prefer potting proportion 0.003 0.021 XXX Prefer a method other than listed proportion 0.009 0.034 X Diving from private boat 2nd favourite proportion 0.033 0.069 XX Diving from shore 2nd favourite proportion 0.072 0.014 XX Method other than listed is second favourite proportion 0.001 0.013 XX Social aspects of fishing Fish with yourself proportion 0.032 0.109 XX Fish with family proportion 0.64 0.485 XXX Fish with co-worker proportion 0.014 <0.001 X Number of people fish with mean 3.257 2.761 X Belong to fishing club/organisation proportion 0.044 0.132 XXX
* XXX: significant at 0.05, XX: significant at 0.1, X: significant at 0.15

REPORT No. 1647 43 December 2009
Statistic Intercept sample
Public response sample
Statistical significance*
Use and preference of media for fishing information
Use the Mfish internet site proportion 0.313 0.517 XXX Mfish internet site is 2nd favourite proportion 0.038 0.083 XXX TV is 2nd favourite proportion 0.161 0.056 XXX Other magazines are 2nd favourite proportion 0.055 0.016 XX Mfish internet site is 3rd favourite proportion 0.038 0.086 XXX Fishing motivations Fish to be outdoors mean score 4.109 3.785 XXX Fish to experience new and different things mean score 3.442 2.935 XXX Fish to obtain fish for eating mean score 3.338 3.633 X Fish to develop my fishing skill mean score 2.563 2.483 XXX Fish mostly to be outdoors proportion 0.187 0.066 XXX Fish mostly for family recreation proportion 0.239 0.15 X Fish mostly to get away from the demands of other people proportion 0.009 0.043 XX Fish mostly to catch a trophy fish proportion 0.001 <0.001 X Fish mostly for the challenge or sport proportion 0.003 0.011 XXX Fish 3rd most importantly to be outdoors proportion 0.104 0.019 XXX Makings of a good fishing trip Good fishing means I usually eat the fish I catch mean score 4.299 4.491 XX It’s good fishing in the Marlborough Sounds mean score 3.771 4.093 XXX Demographics Usually live in Wellington region proportion 0.036 0.155 XXX Usually live in Blenheim/Marlborough region proportion 0.324 0.192 XXX Usually live in Nelson/Tasman Bay proportion 0.159 0.092 X Stay when fishing in the Sounds, at my usual place of residence proportion 0.292 0.185 XX Stay when fishing in the Sounds, with relatives proportion 0.127 0.009 XXX Born 1940s proportion 0.167 0.248 XX Born 1980s proportion 0.145 0.016 XX Male proportion 0.66 0.536 X Pakeha proportion 0.865 0.721 XXX
XXX: significant at 0.05, XX: significant at 0.10, X: significant at 0.15

44 REPORT No. 1647 December 2009
4.2. Comparison between on water and on land intercepts
On water On land Statistical significance*
Fisher characteristics Male proportion 0.607 0.688 - Age average
years 38.4 35.2 -
Residence Christchurch/Canterbury proportion 0.053 0.198 XXX Wellington proportion 0.031 0.044 - Marlborough Sounds proportion 0.057 0.151 - Blenheim/Marlborough proportion 0.382 0.364 - Nelson/Tasman Bay proportion 0.169 0.165 - Other New Zealand proportion 0.287 0.062 XXX Overseas proportion 0.022 0.015 - Accommodation Usual residence proportion 0.255 0.317 - Holiday home / bach proportion 0.212 0.299 - Camping ground / holiday park proportion 0.005 0.028 - Motel / hotel proportion 0.022 0.005 - Yacht or launch proportion 0.022 0.167 XXX Camping not at a park proportion 0.005 0.017 - Friend’s place proportion 0.067 0.058 - With relatives proportion 0.408 0.066 XXX None of the above proportion 0.005 0.044 - Role on vessel Skipper or equivalent proportion 0.058 0.487 XXX 1st mate or equivalent proportion 0.01 0.007 - Other – passenger, client etc proportion 0.932 0.506 XXX Vessel characteristics Launch proportion 0.376 0.139 XXX Trailer proportion 0.603 0.751 X Other proportion 0.021 0.11 XX Length metres 7.9 7.0 -
* XXX: significant at 0.05, XX: significant at 0.10, X: significant at 0.15, -: not significant

REPORT No. 1647 45 December 2009
5. NON-RESPONSE BIAS
Fishers were intercepted in the field, and some basic information was collected at that point. They were then sent a survey to complete later, either by post or online. Of 1207 fishers who were intercepted, 470 (40%) completed the survey, and it is their results, supplemented with those of the respondents to the public call, that are presented in this work as representative of the total fisher population. While we do not know how the non-respondents’ survey responses would have differed from those of the respondents, we have compared the information that was collected at the time of fisher intercept, to test for non response bias. Table 17 shows that more non-respondents were intercepted at the Havelock boat ramp than at other intercept locations, while fewer were met at Waikawa boat ramp. Respondents were more avid than non-respondents, reporting more annual trips. More of the respondents were owners of the vessel they were fishing from, and more of the non-respondents were fishing from a less common vessel (one other than a trailer boat, yacht or launch, and including catamaran, commercial fishing vessel, dinghy, fishing from rocks, kayak, no boat, and rubber dinghy). These differences suggest that the less specialised segments were less likely to respond, and may thus be underrepresented in this study.
Table 17. Differences between respondent and non respondent intercepted fishers. Statistic Respondents Non-respondents Statistical
significance Intercepted at Havelock ramp
Proportion 0.42 0.50 0.01
Intercepted at Waikawa ramp
Proportion 0.26 0.22 0.08
Number of trips
Mean 15.0 12.1 0.01
Vessel owner
Proportion 0.67 0.59 0.01
Vessel type other
Proportion 0.03 0.07 0.03
There is a clear signal in the data in Table 17 that a small non-response bias related to avidity exists between the response and non-response proportions of the fishers intercepted. Respondents undertook 24% more trips on average than non-respondents. The respondents on average were 13% more likely to be the skipper of the vessel. The proportion of non-respondents amongst fishers from the less common fishing platforms is twice that of respondents.

46 REPORT No. 1647 December 2009
6. BETWEEN-SEGMENT COMPARISON
Fishers were characterised by their response to questions in the survey designed to reflect a “station” on the recreation specialisation continuum from novice to expert as a Marlborough Sounds Blue Cod fisher. The population was segmented into one of four groups according to this level of “specialisation”, as described in section 1.3. We analysed the data to look for differences between specialisation segments, other than in those questions that were used for the segmentation. These differences are listed in Table 18. In this table each row compares the responses of two of the four segments. The response being compared is described in columns one and two (e.g. “Trips to the outer Sounds per year”). The segments being compared are detailed in the third and fourth columns (e.g. segment 3 compared to segment 2). The values for those segments are detailed in the fifth and sixth columns (e.g. 3.987 trips per year for segment 3, and 2.494 trips per year for segment 2), and the statistical significance of the difference observed is indicated in the seventh column (e.g. XXX means significant to 0.05, or 5% level). Differences that were not significant at the 20% level are not listed. For each value (e.g. number of trips to the outer sounds) there are four segments to compare, so six comparisons made, and thus six opportunities for difference. More specialised fishers make more trips to the outer Sounds, and more trips to the Inner Sounds. They make more trips to Golden Bay, but fewer to Kaikoura.
Table 18. Differences between specialisation segments.
Specialisation segments compared
(1 least specialised,
4 most specialised)
Values for segments compared
A B A B
Statistical significance of
difference* Trips to the outer Sounds per year 3 2 3.987 2.494 XXX Trips to the outer Sounds per year 4 2 4.526 2.494 XXX Trips to the inner Sounds per year 2 1 3.532 1.585 XX Trips to the inner Sounds per year 3 1 5.751 1.585 X Trips to the inner Sounds per year 4 1 6.44 1.585 XXX Trips to the inner Sounds per year 3 2 5.751 3.532 XXX Trips to the inner Sounds per year 4 2 6.44 3.532 XXX Trips to Golden Bay per year 4 3 3.29 1.836 XXX Trips to Kaikoura per year 3 2 1.915 2.79 X
* XXX: significant to 0.05, XX: significant to 0.1, X: significant to 0.15, x: significant to 0.2
The number of blue cod that fishers reported they expected to catch per trip was sometimes higher than the bag limit. This was interpreted as representing the catch of the whole fishing group. In these cases, the number reported was divided by the number of people in the fishing group. The repetition of the results below (number of blue cod expected) gives the uncorrected data first, followed by the corrected data. More specialised fishers have higher

REPORT No. 1647 47 December 2009
expected catch rates. The implication is that changes to policy instruments such as reduction in daily blue cod bag limits would differentially impact the four segments: the more highly “specialised” and avid fishers are likely to be constrained by the reduction.
Specialisation
segments compared
(1 least specialised,
4 most specialised)
Values for segments compared
A B A B
Statistical significance of
difference* Blue Cod expected (per group) per trip 2 1 2.573 1.007 XXX Blue Cod expected (per group) per trip 3 1 3.336 1.007 XXX Blue Cod expected (per group) per trip 4 1 3.534 1.007 XXX Blue Cod expected (per group) per trip 3 2 3.336 2.573 XXX Blue Cod expected (per group) per trip 4 2 3.534 2.573 XXX Blue Cod expected (per fisher) per trip 2 1 1.867 1.067 x Blue Cod expected (per fisher) per trip 3 1 2.467 1.067 XXX Blue Cod expected (per fisher) per trip 4 1 2.585 1.067 XXX Blue Cod expected (per fisher) per trip 3 2 2.467 1.867 XXX Blue Cod expected (per fisher) per trip 4 2 2.585 1.867 XXX
* XXX: significant to 0.05, XX: significant to 0.1, X: significant to 0.15, x: significant to 0.2
The more specialised the fisher, the more trips they make to the Marlborough Sounds area. Specialisation therefore appears to be correlated with avidity, despite not being based on it.
Trips in the Sounds per year 2 1 5.373 1.552 XX Trips in the Sounds per year 3 1 11.201 1.552 XX Trips in the Sounds per year 4 1 12.437 1.552 x Trips in the Sounds per year 3 2 11.201 5.373 XXX Trips in the Sounds per year 4 2 12.437 5.373 XXX
More specialised fishers find it easier to catch the bag limit of both snapper and blue cod.
Ease of catching the bag limit of snapper (1 hard, 5 easy) mean score 4 2 2.483 1.945 XXX Ease of catching the bag limit of blue cod (1 hard, 5 easy) mean score 3 1 3.681 2.329 XXX
Charter boats are more popular with the more specialised fishers for line fishing.
Prefer line fishing from a charter boat proportion 4 2 0.05 0.012 X Prefer line fishing from a private boat proportion 4 3 0.838 0.949 XX Prefer line fishing from a charter boat proportion 4 3 0.05 0.003 XXX
The more specialised fishers are more diverse in the techniques they employ. More of the more specialised fishers dive from a private boat, from charter boat and from shore. More of the more specialised fishers use set nets, use pots and other methods. More of the more specialised fishers dredge and use set nets.

48 REPORT No. 1647 December 2009
Specialisation segments compared
(1 least specialised,
4 most specialised)
Values for segments compared
Fishing methods A B A B
Statistical significance of
difference* Dive from a private boat proportion 4 2 0.483 0.226 XXX Dive from a private boat proportion 4 3 0.483 0.315 x Dive from shore proportion 3 2 0.146 0.085 x Use set nets proportion 3 2 0.263 0.117 XXX Use set nets proportion 4 2 0.326 0.117 XXX Use pots proportion 3 2 0.068 0.027 XX Use pots proportion 4 2 0.09 0.027 XXX Dive from a charter boat proportion 3 2 0.009 0.001 XXX Dive from a charter boat proportion 4 2 0.01 0.001 XXX Dive from a charter boat proportion 4 3 0.041 0.001 XX Use an other fishing method proportion 4 2 0.073 0.011 XXX
* XXX: significant to 0.05, XX: significant to 0.1, X: significant to 0.15, x: significant to 0.2
More specialised fishers are more likely than less specialised fishers to prefer dredging, set netting, diving from private boat, drag netting, and methods other than listed. The more specialised fishers would therefore be affected in different ways to by restrictions on line-fishing methods, as they have wider range of method / species combinations open to them to substitute to than less specialised fishers.
Prefer dredging proportion 2 1 0.266 0.013 X Prefer set netting proportion 3 2 0.104 0.026 XXX Prefer set netting proportion 4 2 0.138 0.026 XXX Prefer diving from private boat proportion 4 2 0.356 0.162 XXX Prefer drag netting proportion 4 2 0.005 0 XXX Prefer drag netting proportion 4 3 0.005 0 X Prefer an other method proportion 4 2 0.055 0.01 X
The more specialised fishers are more likely to fish with co-workers, to fish alone, or to fish with companions other than of the types listed. They fish with fewer companions, although the most significant difference is between the two most-specialised segments, with the most-specialised fishers preferring to fish with more companions than the second-most specialised. More specialised fishers are more likely to belong to a fishing club, and to hold a freshwater fishing license.
Social aspects of fishing Fish with other than listed proportion 3 2 0.003 0 XXX Fish with co-workers proportion 4 2 0.011 0.002 XX Fish with other than listed proportion 4 2 0.028 0 XXX Fish alone proportion 4 3 0.122 0.013 XX Number of fishing companions mean 3 1 3.366 4.035 x Number of fishing companions mean 4 2 4.01 3.454 XX Number of fishing companions mean 4 3 4.01 3.366 XXX

REPORT No. 1647 49 December 2009
Belong to a fishing club proportion 4 1 0.141 0 x Belong to a fishing club proportion 4 2 0.141 0.029 XXX Hold a freshwater fishing license proportion 4 2 0.304 0.146 XXX
The least and the most specialised fishers are more likely to use an internet site other than the Ministry of Fisheries for fishing information than are intermediate specialisation segments. The more specialised a fisher the more likely they are to use, and prefer, fishing magazines as a source of information.
Specialisation
segments compared
(1 least specialised,
4 most specialised)
Values for segments compared
Media use A B A B
Statistical significance of
difference* Use non-MFish internet site proportion 2 1 0.25 0.63 XXX Use non-Mfish internet site proportion 4 2 0.47 0.25 XXX Use fishing magazine proportion 2 1 0.60 0.08 XXX Use fishing magazine proportion 3 1 0.65 0.08 XXX Use fishing magazine proportion 4 1 0.62 0.08 XX Use other magazine proportion 4 3 0.20 0.12 x Use newspapers proportion 2 1 0.50 0.19 X Prefer fishing magazine proportion 2 1 0.33 0.02 XX Prefer fishing magazine proportion 3 1 0.34 0.02 X Prefer fishing magazine proportion 4 1 0.31 0.02 X Prefer non-Mfish internet site proportion 2 1 0.09 0.36 X Prefer non-Mfish internet site proportion 4 2 0.23 0.09 XX Prefer non-Mfish internet site proportion 4 3 0.23 0.06 XX
* XXX: significant to 0.05, XX: significant to 0.1, X: significant to 0.15, x: significant to 0.2
Fishing for family recreation is more important for more specialised fishers than for less specialised. The more specialised a fisher, the more motivated they are to be by being able to eat the fish they catch. More specialised fishers are more highly motivated by the experience of the catch, to test their equipment, to share experiences with family, to catch a trophy fish, for the challenge or sport, for the fun, to share fish and to develop skills.
Relative importance of motivations 1 not important, 5 important Fish for family recreation Importance 4 2 4.2 3.9 XX Fish for relaxation Importance 3 1 4.3 3.5 x Fish to obtain fish for eating Importance 2 1 3.5 2.0 XXX Fish to obtain fish for eating Importance 3 1 3.8 2.0 XXX Fish to obtain fish for eating Importance 4 1 3.6 2.0 XXX Fish to obtain fish for eating Importance 3 2 3.8 3.5 x Fish for the experience of the catch Importance 3 2 3.6 3.3 XX Fish for the experience of the catch Importance 4 2 3.8 3.3 XXX Fish to test my equipment Importance 3 1 1.9 1.2 X Fish to test my equipment Importance 4 1 2.1 1.2 X Fish to share experiences with family Importance 4 2 4.3 3.8 XXX Fish to catch a trophy fish Importance 3 1 1.8 1.1 x

50 REPORT No. 1647 December 2009
Fish to catch a trophy fish Importance 4 1 2.0 1.1 XX Fish to catch a trophy fish Importance 4 2 2.0 1.6 XX Fish for the challenge or sport Importance 4 2 2.9 2.4 XXX Fish for the fun of catching fish Importance 4 2 3.9 3.5 X Fish to catch fish to share Importance 3 2 3.5 3.1 X Fish to develop my fishing skill Importance 2 1 2.6 2.0 x Fish to develop my fishing skill Importance 4 1 2.8 2.0 X
The more specialised fishers are less likely to be primarily motivated by being outdoors. They are more likely to be primarily motivated by the challenge or sport of fishing, to obtain fish for eating, to catch a trophy fish, and to experience new things.
Specialisation
segments compared
(1 least specialised,
4 most specialised)
Values for segments compared
Most Important motivation A B A B
Statistical significance of
difference* Mostly fish to experience new things proportion 3 2 0.001 <0.001 XXX Mostly fish to catch a trophy fish proportion 3 2 0.003 <0.001 XXX Mostly fish to be outdoors proportion 4 2 0.06 0.202 XX Mostly fish to be outdoors proportion 4 3 0.06 0.197 x Mostly fish to obtain fish for eating proportion 4 2 0.27 0.134 X Mostly fish for the challenge or sport proportion 4 2 0.023 0.001 XXX
* XXX: significant to 0.05, XX: significant to 0.1, X: significant to 0.15, x: significant to 0.2
The least specialised fishers are more likely to be happier the more fish they catch than other fishers, but they do report (see above) expecting to catch fewer fish than the current (prior to the closure) bag limit. The more experienced fishers are less concerned about the species they catch, but they do want to keep their catch, and to eat their catch.
The makings of a good fishing trip 1 means disagree, 5 means agree The more I catch, the happier I am Agreement 3 1 2.70 3.37 X A fishing trip can be worthwhile even if no fish caught Agreement 2 1 3.68 4.34 x I usually eat the fish I catch Agreement 2 1 4.38 3.70 XXX I usually eat the fish I catch Agreement 3 1 4.49 3.70 XXX I usually eat the fish I catch Agreement 4 1 4.45 3.70 X It doesn't matter what species caught Agreement 3 2 2.74 3.18 XXX It doesn't matter what species caught Agreement 4 3 3.17 2.74 XXX I’m just as happy if I don't keep the fish I catch Agreement 3 2 2.66 3.11 XXX
The more specialised fishers consider it easier than less specialised fishers, to use specific hooks (circle hooks, and 6/0 hooks). The more specialised a fisher is, the more likely they are to use circle hooks, to use 6/0 hooks, or to move away from areas rich in juveniles. Specialised fishers’ response to modification to policy instruments with a focus on gear restrictions may be different to those of beginners to fishing. There appears to be no difference

REPORT No. 1647 51 December 2009
between the fisher segments’ attitudes to other blue cod juvenile mortality reduction techniques.
Specialisation segments compared
(1 least specialised,
4 most specialised)
Values for segments compared
Juvenile mortality reduction measures A B A B
Statistical significance
of difference* 1 is hard, 5 is easy
Easy to use circle hooks Mean ease 2 1 3.99 2.75 X Easy to use circle hooks Mean ease 3 1 3.94 2.75 X Easy to use circle hooks Mean ease 4 1 4.08 2.75 XX Easy to use 6/0 hooks Mean ease 2 1 4.06 2.87 XX Easy to use 6/0 hooks Mean ease 3 1 4.04 2.87 XX Easy to use 6/0 hooks Mean ease 4 1 4.00 2.87 XX
1 is never, 5 is always How often use circle hooks Mean often 2 1 3.90 2.08 XXX How often use circle hooks Mean often 3 1 3.68 2.08 XXX How often use circle hooks Mean often 4 1 3.99 2.08 XXX How often use 6/0 hooks Mean often 2 1 3.99 3.06 X How often use 6/0 hooks Mean often 3 1 4.06 3.06 X How often use 6/0 hooks Mean often 4 1 4.13 3.06 x How often move away Mean often 2 1 3.87 2.79 XXX How often move away Mean often 3 1 4.00 2.79 XXX How often move away Mean often 4 1 4.22 2.79 XX How often move away Mean often 4 2 4.22 3.87 XXX
* XXX: significant to 0.05, XX: significant to 0.1, X: significant to 0.15, x: significant to 0.2
The more specialised the fisher, the more years they are likely to have spent fishing.
How many years fishing How many years fishing mean 2 1 19.5 2.4 XXX How many years fishing mean 3 1 28.9 2.4 XXX How many years fishing mean 4 1 36.1 2.4 XXX How many years fishing mean 3 2 28.9 19.5 XXX How many years fishing mean 4 2 36.1 19.5 XXX How many years fishing mean 4 3 36.1 28.9 XXX
The more specialised a fisher, the more likely they are to stay at their own holiday place or bach, and the less likely they are to stay with relatives. These fishers are more likely than less specialised fishers to take and keep blue cod through the practice of cumulative bag limits. Similarly, fishers using overnight or better capable vessels would be expected to take and to keep blue cod under the auspices of cumulative bag limits.
Fishing accommodation Usually stay in my holiday place or bach proportion 2 1 0.286 0.017 X Usually stay in my holiday place or bach proportion 3 1 0.38 0.017 XXX Usually stay in my holiday place or bach proportion 4 1 0.436 0.017 XX

52 REPORT No. 1647 December 2009
Usually stay in my holiday place or bach proportion 4 2 0.436 0.286 x Usually stay with relatives proportion 2 1 0.083 0.411 X Usually stay with relatives proportion 3 1 0.03 0.411 X Usually stay with relatives proportion 4 1 0.029 0.411 X
More specialised fishers were more likely to be older than less specialised fishers. The more specialised fishers were more likely to agree to participate in further surveys. This aspect of more specialised fishers is consistent with non-response and between-sample differences for avid (experienced fishers) to take up opportunities to participate in fishery research and management (see Oh and Ditton (2005) and Scott and Shafer (2001)).
Specialisation
segments compared
(1 least specialised,
4 most specialised)
Values for segments compared
A B A B
Statistical significance
of difference* Born 1920s proportion 4 2 0.011 <0.001 XXX Born 1920s proportion 4 3 0.011 0 XX Born 1940s proportion 4 1 0.184 0 x Born 1950s proportion 4 1 0.248 0.039 x Born 1960s proportion 3 1 0.419 0.09 x Born 1960s proportion 3 2 0.419 0.274 X Born 1960s proportion 4 3 0.238 0.419 x Born 1980s proportion 2 1 0.122 0.449 XX Born 1980s proportion 3 1 0.04 0.449 XX Born 1980s proportion 4 1 0.032 0.449 X Cook Island Maori proportion 4 3 0.006 <0.001 X Agree to further survey proportion 3 1 0.88 0.538 x Agree to further survey proportion 3 2 0.88 0.724 XXX
* XXX: significant to 0.05, XX: significant to 0.1, X: significant to 0.15, x: significant to 0.2

REPORT No. 1647 53 December 2009
7. BETWEEN-SURVEY COMPARISON
The surveys by Bell (1998) and Davey (2008) were diary surveys conducted over the course of 12 months when the fishery was not the subject of no take area closures for blue cod fishing. By contrast the study presented here was conducted over three (peak fishing) months, by way of follow-up survey rather than diary, and significantly, while the inner Marlborough Sounds blue cod fishery was closed to all fishing. The closure of the fishery could have caused the substitution of some fishers’ effort away from the area. The public call for respondents may have captured some of those fishers no longer fishing in the Marlborough Sounds and therefore not present to be intercepted, but the closure remains a possible source of difference between this and previous studies. Other potential sources of difference are changes in the characteristics of the individual fishers, and a change in the individuals that make up the fisher population. We compared the results of our study with results from the previous studies, and found a number of apparent differences. Table 19 lists the differences observed. Two fishing habits with little change (proportion who fish with rod and line, and proportion that prefer February) are included for comparison with habits that did change. Two key changes in the fishery lie in the decline in blue cod abundance and the blue cod closure in the Inner Sounds.
Table 19. Differences between results of our study and previous studies.
Statistic Bell 1998
Davey 2008
Batstone 2009
Method – rod and line from private boat Proportion practising 0.912 0.98 0.901 Method – longline from private boat Proportion practising 0.04 0.18 0.062 Method - dredging Proportion practising 0.141 0.62 0.384 Month – January Proportion fishing 0.097 0.166 0.162 Month – February Proportion fishing 0.118 0.128 0.118 Month – March Proportion fishing 0.176 0.06 0.088 Month – December Proportion fishing 0.116 0.158 0.155
The questions regarding species targeted differed subtly from survey to survey. Bell (1998) and Davey (2008) asked fishers to indicate which species were being targeted on a per-trip basis. Our study asked fishers to indicate which species they target. Because fishers can target more than one species (both per trip and event), the total percentages (summing all species targeted) can add to more than 100%. Relative species popularity can be compared between studies after normalising the proportions by dividing each species proportion by the total summed proportion (>100%) for that study. These normalised results are presented in Table 20 and Table 21. Table 20 shows that over time, the preference to target blue cod continues to decline, with a greater decline seen between 2008 and 2009 than between 1998 and 2008, potentially due to the closure. The declines in fisher preference for snapper as a target species are similar in the two time periods. Where fishers do not indicate a preference for either of these species, there

54 REPORT No. 1647 December 2009
is some evidence that they are targeting gurnard, whose increase in popularity mirrors the decline in blue cod, kahawai, kingfish and tarakihi as preferred target species.
Table 20. Differences between studies, in species targeted when line fishing.
Statistic Bell
1998 Davey 2008
Batstone 2009
Target blue cod Proportion 0.46 0.42 0.25 Target blue moki Proportion 0.02 0.03 0.01 Target flounder Proportion 0.06 0.02 Target gurnard Proportion 0.01 0.02 0.10 Target hapuku/groper Proportion 0.08 0.06 0.07 Target kahawai Proportion 0.04 0.05 0.10 Target kingfish Proportion 0.02 0.02 0.04 Target snapper Proportion 0.32 0.28 0.21 Target tarakihi Proportion 0.06 0.04 0.11 Target other Proportion 0.03 0.02 No target Proportion 0.07
Table 21 shows an ongoing decline in the relative popularity of crayfish/rock lobster, balanced by an increase in the relative popularity of mussels. Acting as an internal consistency check, the pattern of change in scallop popularity matches the change observed in dredging popularity (Table 19).
Table 21. Differences between studies, in species targeted by non-line methods.
Statistic Bell
1998 Davey 2008
Batstone 2009
butterfish Proportion 0.05 0.09 0.08 crayfish/rock lobster Proportion 0.32 0.26 0.12 flounder Proportion 0.09 kina Proportion 0.02 mussels Proportion 0.03 0.04 0.15 paua Proportion 0.03 0.12 scallops Proportion 0.25 0.55 0.30 other Proportion 0.02 none Proportion 0.10
REPORT No. 1647 55 December 2009
8. KEY POLICY AND RESEARCH RELEVANT OUTCOMES
The following two sections present a synopsis of the key policy and research relevant findings of this fisher characterisation study. The relevant features of the research noted here are not intended as a comprehensive survey of the outcomes. It is anticipated that policy makers and researchers will find and derive value from the study as they deal with challenges in this and other recreational fisheries in New Zealand.
8.1. Research relevant outcomes
8.1.1. Sampling fishers for catch estimate purposes
The proportion of fishers that do not access fishing grounds via launching ramps and marinas is of the order of 40%. Those fishers are resident, temporarily or permanently in the Sounds, or they access fishing grounds in vessels capable of supporting longer duration voyages into the Sounds. Future studies to derive catch estimates for stock assessment processes could include roving data collection on the water to ensure coverage of these fishers. The limited extent of at-sea intercepts in this study precludes other than an indicative estimate of the proportion of fishers not likely to be encountered daily at launching ramps. This aspect would suggest that any bias in the fisher population and catch estimates derived in this study would understate rather than inflate the estimated quantities.
8.1.2. Discrete Choice Model research processes
Avidity bias in the non-respondents and in the public call sample means the less avid segments of the population should be afforded higher weights than the more avid segments in the derivation of a sampling frame for subsequent Discrete Choice Model research processes. The contentious nature of the research context suggests that future data collection methods such as web based surveys need to feature controls for avidity bias and strategic behaviour by respondents. The relatively high proportion of fishers normally resident outside of the Marlborough Sounds implies a need for data collection processes that take account of the diversity of residential location. There are statistical issues around spatial correlations (the residential location of one fisher, for example, is not independent of another) that potentially need to be dealt with in any multivariate analysis.
8.1.3. The average fisher problem
Kearney (2002) attributed the divergence of outcomes between New Zealand surveys of catch estimates at least in part to the omission of consideration of the heterogeneity of recreational fishers. This project adopted the recreation specialisation approach developed in the USA by Bryan (1977), Oh and Ditton (2005) and others, and employed in recreational fishing studies such as that of Salz et al. (2001) to stratify the fisher population according to their progress in their sport, and in turn developing expertise as fishers. The outcomes presented here

56 REPORT No. 1647 December 2009
demonstrate the effectiveness of this approach in discriminating between fisher strata in terms of avidity and effectiveness. This has relevance for scaling up of data collected in catch estimates to form fishery wide estimates. This is evident in the consistency of catch estimates derived in this work with those of Davey et al. (2008), and the statistical significance of differences in fishing effort and reported catch rates between segments. In this fishery we estimate 33% of fishers (the two most avid segments) contribute 56% of the effort in the fishery and account for 63% of the total catch. There are implications in the design of policy responses to these facts. Section 6 describes inter-segment differences that may have implications for policy.
8.1.4. Internet uptake
In excess of 80% of fishers encountered in the Marlborough Sounds in the course of data collection opted for participation by way of the internet. This contrasts favourably with a household internet access rate of 72% reported by the United Nations Development Program (UNDP, 2005). This outcome supports a strong role for the internet for research and communication purposes.
8.2. Policy relevant outcomes
8.2.1. Fisher population estimate
This study has produced an estimate of the Marlborough Sounds fisher population of the order of 10,000 fishers. To the best of our knowledge this is an innovation in recreational fisheries research in New Zealand and addresses a key issue, that of absence of license or registration regimes evident in other jurisdictions. Within the limits of the data collected, this estimate seems plausible. In combination with the fisher segmentation to take account of differing avidity and effectiveness in the fisher population, an estimate for recreational harvest in the Marlborough Sounds has been produced that is consistent with previous estimates (Davey et al. 2008). Understanding the scale of the fisher population may allow discrimination amongst potential policy instruments considered to alleviate local depletion issues.
8.2.2. Recreation specialisation segmentation of the fisher population
This study is the first in New Zealand marine recreational fisher research to attempt to stratify a fisher population. The practice is evident in recent research (Salz et al. 2001; Oh and Ditton 2005) undertaken in the USA. Segmentation allows analysts to consider the differential effects (and effectiveness) of policy instruments across varying sectors of the population. In the Marlborough Sounds context, it is possible that the more avid fishers do not experience depletion because they know where to find the remaining fish. The more avid 33% of fishers account for 63% of the catch and 56% of the fishing effort. These fishers share similar profiles in terms of avidity and effectiveness. In contrast the 67% of the fisher population who occur in the less specialised fisher segments are unlikely to be constrained by reduction in bag limits.

REPORT No. 1647 57 December 2009
8.2.3. Key values in the Marlborough Sounds recreational fishery
The values and motivations of recreational fishers in this fishery may be summarised as:
Sharing the fun of catching fish and eating the catch with family and friends. This value is evident across the fisher population segments, but intensifies in the more avid fishers. The key motivating factors are not those of a sports fishery with its emphasis on excitement, and technical and skill challenges. The social dimension is one of family and friends. The fishing is embedded in a lifestyle: Blue cod fishing is one attribute in the complex bundle of attributes that constitute the Marlborough Sounds lifestyle.
8.2.4. Fisher heterogeneity
The issue referred to in section 8.1.3, the “average fisher” problem, has relevance for policy formation. The average fisher is a statistical construct that, while useful in describing population level factors, may be misleading given the high level of heterogeneity evident in fisher populations world wide. The more specialised (and avid) fishers contribute more effort per person than less avid fishers, and are more effective, accounting for the greater share of the annual harvest. These fishers are less likely to experience any local depletion indicators, since they are more effective, and through their greater trip frequency are more likely to be familiar with changing spatial patterns of abundance. The degree to which their values represent the bulk of fishers remains open to discussion, although the experience of other segmentation studies (Oh and Ditton, 2005) is that these more avid fishers are more likely to become involved in advocacy in consultation processes.
8.2.5. Temporal pattern of fishing
Seasonal no take closures allow fishery managers to focus on periods of relatively higher fishing pressure. The summer holiday period is the key domestic tourism season. Figure 16, Section 3.2 describes the seasonal pattern of effort in the fishery. In the peak months the weather is less settled with high daily ranges for wind strength, making the Inner Sounds area attractive for shelter. In contrast, in the autumn and winter months the weather is more settled, making the proposition of fishing in Outer Sounds waters more attractive (comment from survey respondent).
8.2.6. Communications media
Two key factors with relevance for communication plans are: • High uptake of internet • Preference for fishing magazines over other print media
8.2.7. Potential fisher response to policy
Substitution of species and fishing locations are likely responses by fishers to policy initiatives. The capacity of fishers to make these changes is likely to be a function of fisher preferences, factors that constrain substitution choices, and the nature of the fishery. Blue cod

58 REPORT No. 1647 December 2009
fishing in the Marlborough Sounds is embedded in a lifestyle: blue cod fishing is one attribute in a bundle of attributes that constitutes the Marlborough Sounds experience. Fishers take up this lifestyle in varying intensities that range from summer vacation visits to full residence in remote parts of the Sounds. Two key factors constraining substitution decisions in response to changes in management parameters are likely to be ownership of residential or holiday property in the Sounds, and ownership of displacement launches and yachts with low transit speeds. The set of substitution possibilities available to these individuals is largely limited to species and technology substitution. This contrasts with fishers who fish from trailer vessels that make alternative fishing sites feasible, for example Blenheim / Marlborough residents shifting effort to Tasman Bay using access points at Okiwi Bay, the eastern coastline of the South Island from access points such as Port Underwood, or Kaikoura. The pattern of fisher substitution is a complex issue that has only been touched upon by this phase of the research project. Development of a DCM has the potential to further inform this aspect. This provides a structured and statistically robust avenue approach to consider fisher preferences. Recent advances posted in the marine resource economics literature (Lew and Larson 2009, for example) offer approaches to understanding the site substitution problem.
8.2.8. Fisher safety
An interesting thread emerged in the qualitative responses to the on-line survey concerning an externality potentially created by management decisions. Closure of sheltered Inner Sounds waters may motivate less experienced fishers to make fishing trip decisions that afford them less safety than is optimal due to the relatively more rigorous maritime conditions experienced in the Outer Sounds area. Seasonal considerations enter the picture. The weather is less favourable and tends to be more prone to rapid change in the peak summer season when holiday fishers move to the Sounds. In contrast, the weather is more settled, in the autumn and winter months. These aspects have relevance for consideration of area and seasonal closures in this fishery.
8.3. Sustainability measures and the fisher population
Two key innovations are located in this research. Each of these contributes policy relevant information. The first, the Marlborough Sounds recreational fisher population estimate of the order of 10,000 fishers, places the scale of the fishery in context of wider population demographics. The second is the segmentation of the fisher population. It allows policy makers to better understand the diversity of the fisher population in the context of management options for the fishery. Given the innovation, Table 22 provides examples of some ways in which understanding of the fishers in the context of avidity and experience can inform their position vis a vis potentially effective sustainability measures.

REPORT No. 1647 59 December 2009
A note of caution in interpreting these factors: differences between segments may be attributable to the nature of the sampling frame and the methodology used to identify population segments. A number of latent class multivariate modelling (LCM) approaches are available in which population segmentation emerges from the model estimation process in contrast to the a priori approach used in this study. The LCM formulation takes account of the presence of preference heterogeneity in the population by a process in which respondents are sorted into a small number of “classes,” each class with identical utility functions for all members. Information about class membership and class specific parameters is extracted from the data in the estimation process (Greene 2007). However it is dealt with, the fisher heterogeneity issue remains. Whichever approach is used to identify strata in fisher populations, this study has demonstrated the potential benefits for policy development that arise from understanding fisher heterogeneity.
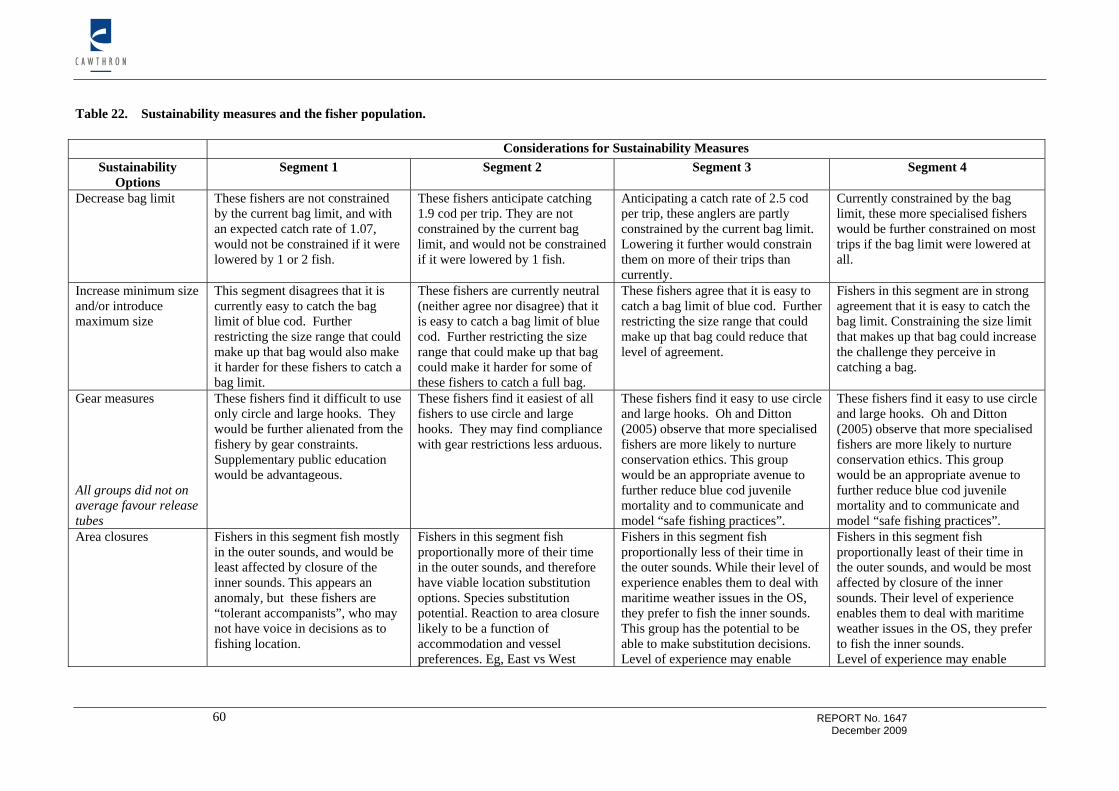
60 REPORT No. 1647
December 2009
Table 22. Sustainability measures and the fisher population.
Considerations for Sustainability Measures Sustainability
Options Segment 1 Segment 2 Segment 3 Segment 4
Decrease bag limit These fishers are not constrained by the current bag limit, and with an expected catch rate of 1.07, would not be constrained if it were lowered by 1 or 2 fish.
These fishers anticipate catching 1.9 cod per trip. They are not constrained by the current bag limit, and would not be constrained if it were lowered by 1 fish.
Anticipating a catch rate of 2.5 cod per trip, these anglers are partly constrained by the current bag limit. Lowering it further would constrain them on more of their trips than currently.
Currently constrained by the bag limit, these more specialised fishers would be further constrained on most trips if the bag limit were lowered at all.
Increase minimum size and/or introduce maximum size
This segment disagrees that it is currently easy to catch the bag limit of blue cod. Further restricting the size range that could make up that bag would also make it harder for these fishers to catch a bag limit.
These fishers are currently neutral (neither agree nor disagree) that it is easy to catch a bag limit of blue cod. Further restricting the size range that could make up that bag could make it harder for some of these fishers to catch a full bag.
These fishers agree that it is easy to catch a bag limit of blue cod. Further restricting the size range that could make up that bag could reduce that level of agreement.
Fishers in this segment are in strong agreement that it is easy to catch the bag limit. Constraining the size limit that makes up that bag could increase the challenge they perceive in catching a bag.
Gear measures All groups did not on average favour release tubes
These fishers find it difficult to use only circle and large hooks. They would be further alienated from the fishery by gear constraints. Supplementary public education would be advantageous.
These fishers find it easiest of all fishers to use circle and large hooks. They may find compliance with gear restrictions less arduous.
These fishers find it easy to use circle and large hooks. Oh and Ditton (2005) observe that more specialised fishers are more likely to nurture conservation ethics. This group would be an appropriate avenue to further reduce blue cod juvenile mortality and to communicate and model “safe fishing practices”.
These fishers find it easy to use circle and large hooks. Oh and Ditton (2005) observe that more specialised fishers are more likely to nurture conservation ethics. This group would be an appropriate avenue to further reduce blue cod juvenile mortality and to communicate and model “safe fishing practices”.
Area closures Fishers in this segment fish mostly in the outer sounds, and would be least affected by closure of the inner sounds. This appears an anomaly, but these fishers are “tolerant accompanists”, who may not have voice in decisions as to fishing location.
Fishers in this segment fish proportionally more of their time in the outer sounds, and therefore have viable location substitution options. Species substitution potential. Reaction to area closure likely to be a function of accommodation and vessel preferences. Eg, East vs West
Fishers in this segment fish proportionally less of their time in the outer sounds. While their level of experience enables them to deal with maritime weather issues in the OS, they prefer to fish the inner sounds. This group has the potential to be able to make substitution decisions. Level of experience may enable
Fishers in this segment fish proportionally least of their time in the outer sounds, and would be most affected by closure of the inner sounds. Their level of experience enables them to deal with maritime weather issues in the OS, they prefer to fish the inner sounds. Level of experience may enable
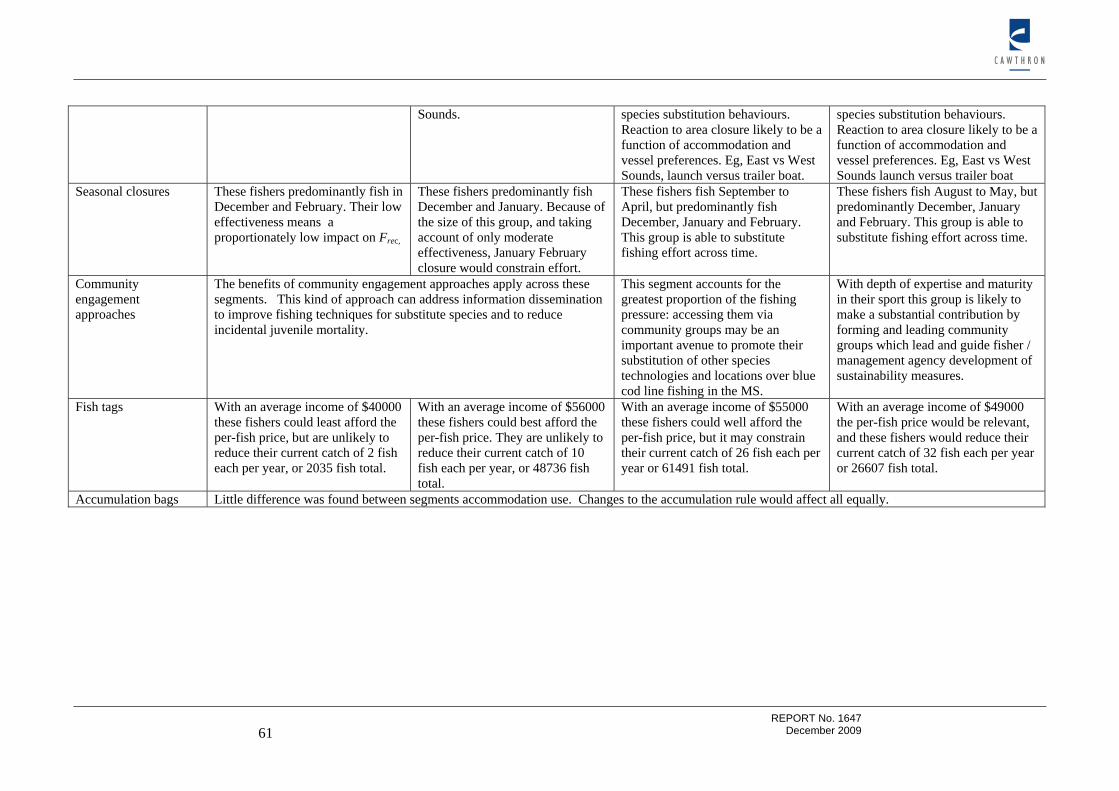
REPORT No. 1647 61 December 2009
Sounds. species substitution behaviours. Reaction to area closure likely to be a function of accommodation and vessel preferences. Eg, East vs West Sounds, launch versus trailer boat.
species substitution behaviours. Reaction to area closure likely to be a function of accommodation and vessel preferences. Eg, East vs West Sounds launch versus trailer boat
Seasonal closures These fishers predominantly fish in December and February. Their low effectiveness means a proportionately low impact on Frec,
These fishers predominantly fish December and January. Because of the size of this group, and taking account of only moderate effectiveness, January February closure would constrain effort.
These fishers fish September to April, but predominantly fish December, January and February. This group is able to substitute fishing effort across time.
These fishers fish August to May, but predominantly December, January and February. This group is able to substitute fishing effort across time.
Community engagement approaches
The benefits of community engagement approaches apply across these segments. This kind of approach can address information dissemination to improve fishing techniques for substitute species and to reduce incidental juvenile mortality.
This segment accounts for the greatest proportion of the fishing pressure: accessing them via community groups may be an important avenue to promote their substitution of other species technologies and locations over blue cod line fishing in the MS.
With depth of expertise and maturity in their sport this group is likely to make a substantial contribution by forming and leading community groups which lead and guide fisher / management agency development of sustainability measures.
Fish tags With an average income of $40000 these fishers could least afford the per-fish price, but are unlikely to reduce their current catch of 2 fish each per year, or 2035 fish total.
With an average income of $56000 these fishers could best afford the per-fish price. They are unlikely to reduce their current catch of 10 fish each per year, or 48736 fish total.
With an average income of $55000 these fishers could well afford the per-fish price, but it may constrain their current catch of 26 fish each per year or 61491 fish total.
With an average income of $49000 the per-fish price would be relevant, and these fishers would reduce their current catch of 32 fish each per year or 26607 fish total.
Accumulation bags Little difference was found between segments accommodation use. Changes to the accumulation rule would affect all equally.

62 REPORT No. 1647 December 2009
9. ACKNOWLEDGEMENTS
MFish Compliance Team, Nelson and Blenheim. MFish policy team. MFish socio-economic team Wellington. Recreational fishers who completed the survey, and gave their time at sea, and on ramps and marinas to discuss their perspectives on the Marlborough Sounds recreational fishery.
10. REFERENCES
Bell JD 2001. Results from the Marlborough Sounds recreational fishing survey 1998. Final Research Report for the Ministry of Fisheries Project REC9807. J.D. Bell & Associates, Dunedin. 73 p.
Bloor M, Keene J, Afzal S, Wood F, Whitbread C, Richard Self, 1998, Mark-Recapture Estimation of the Local Prevalence of Problem Drinking: An Account of the Results of a Feasibility Study, Addiction Research & Theory, 1476-7392, Volume 6, Issue 5, Pages 453 – 463
Bryan H 1977. Leisure Value Systems and Recreation Specialization, Journal of Leisure Research, 9:174-187.
Davey NK, Hartill B, Cairney DG, Cole RG 2008. Characterization of the Marlborough Sounds recreational fishery and associated blue cod and snapper harvest estimates, NZ Ministry of Fisheries.
Ditton R, Loomis DK, and S Choi 1992. Recreation Specialization: Re-Conceptualization From A Social Worlds Perspective, Journal of Leisure Research (24) 1, 33-51.
Ditton RB, Genther B, and R. Reichers 2005, A Stated Preference Choice Approach To Understanding Angler Preferences For Management Options, Human dimensions of wildlife, 10(3) 173-186
Greene WH 2007. NLogit 4.0, Econometric Software Inc.
Kastner M, Straus S, McKibbon K, and C Goldsmith 2008, The capture–mark–recapture technique can be used as a stopping rule when searching in systematic reviews, Journal of Clinical Epidemiology, 22 (4) pages 160-168 August 2008.
Kearney E 2002. Review Of Harvest Estimates From Recent New Zealand National Marine Recreational Fishing Surveys, Report to NZ Ministry of Fisheries.
LaPorte R E, Tull E S, McCarty D, 1992, Monitoring The Incidence Of Myocardial Infarctions: Applications Of Capture-Mark-Recapture Technology, International Journal Of Epidemiology 1992;21(2):258-62
Matos-Caraballo, D, Posada, JM and B Luckhurst,2006, Fishery-dependent evaluation of a spawning aggregation of tiger grouper (Mycteroperca tigris) at Vieques Island, Puerto Rico, Bulletin of Marine Science, Volume 79, Number 1, July 2006 , pp. 1-16(16)
Ricker WE 1975. Computation and interpretation of biological statistics of fish populations, Bulletin of the Fisheries Research Board of Canada, 191. cited in Smith 1994.

REPORT No. 1647 63 December 2009
Rubin G, Umbach D, Shyu S, Carlos Castillo-Chavez , 2006,Using mark-recapture methodology to estimate the size of a population at risk for sexually transmitted diseases, Statistics in Medicine, Volume 11 Issue 12, Pages 1533 - 1549
Salz RJ, Loomis DK 2000. Development and verification of a specialization index for angler segmentation. In: Kyle, G., comp., ed. Proceedings of the 1999 Northeastern Recreation Research Symposium; 1999 April 11-14; Bolton Landing, NY. U.S. For. Serv. Gen. Tech. Rep. NE-269. (cited in Salz et al. 2002).
Salz RL, Loomis DK, Ross MR and S R Steinback 2001. A Baseline Socio-economic Study of Massachusetts' Marine Recreational Fisheries, NOAA Technical Memorandum NMFS NE 165.
Seber GAF 1982. The Estimation of Animal Abundance and Related Parameters. The Blackburn Press, 654 pp.
Scott D, CS Shafer 2001. Recreation Specialization: A Critical Look At The Concept, Journal of Leisure Research, 33 (3) 319 – 343.
Thomson, CJ 1991. Effects of Avidity Bias on Survey Estimates of Fishing Effort and Economic Value, American Fisheries Society Symposium 12: 356-366
United Nations Development Program, 2005, ICT Profile - New Zealand, http://www.apdip.net/projects/dig-rev/info/nz/, downloaded 10.09.09