Manufacture and Characterisation of Short Fibre Biocomposites
Upload
khangminh22Category
view
1download
0
1
CATHODOLUMINESCENCE AND CHARACTERISATION OF
DEFECT STRUCTURES IN QUARTZ WITH APPLICATIONS
TO THE STUDY OF GRANITIC ROCKS
Dissertation
zur Erlangung des Doktorgrades
der Mathematisch-Naturwissenschaftlichen Fakultäten
der Georg-August-Universität zu Göttingen
vorgelegt von
Axel Müller
aus Dresden
Göttingen, Juni 2000

2
D7
Referent: Prof. Dr. H.-J. Behr
Korreferent: Prof. Dr. K. Weber
Tag der mündlichen Prüfung: 21.06.2000

3
Summary
The presented study contributes in solving the causes of cathodoluminescence (CL) of quartz.
For this purpose a variety of quartzes from different geological environments has been
systematically studied. The results have been applied to a number of granitic systems for the
understanding of the textural evolution, intrusion mechanism, and the phasing of magmatic
events of felsic igneous melts.
The spectral response of the CL of quartz in the range of visible light is characterised by
emission bands between 1.7 – 2.2 eV (red) and 2.4 – 3.1 eV (blue) resulting in blue, violet,
and red-brown colours. The emission bands with characteristic (relative) intensities, positions,
and half-widths have been mathematically captured. The intensity of CL normally changes
during electron radiation, whereby the blue emission decreases and the red emission
increases, indicating that the luminescence centres are unstable. The decay and generation of
luminescence centres during electron radiation have been quantified by recording time-
resolved spectra and by using the kinetic law. The concentration of unstable luminescence
centres is highest for quartz formed at low temperatures. In order to study the stability of
luminescence centres at different temperatures a number of heating experiments have been
carried out. Four emission bands (1.73, 1.85, 1.96, and 2.96 eV) are more intense after
heating, whereas a band at 2.48 eV disappears. Studies of samples with different polishing
qualities show that the CL intensity is reduced for rough surfaces, but the time-dependent
ratios of the emission bands remain unchanged. Besides radiation the CL intensity is
influenced by the temperature (quenching) during the measurement. Also this correlation has
been described here with the kinetic law.
A part of the study deals with the correlation between the CL properties and trace element
contents (mainly Al, Ti, Li). Analytical conditions for EPMA, LA ICP-MS, SIMS were
carefully chosen in order to achieve the highest possible sensitivity of these microanalytical
methods applied to quartz analysis. Trace element line profiles explained the growth and
alteration zones visible in CL. The average Fe concentration increases with the quartz
formation temperature. Therefore, the Fe content can be used to distinguish magmatic and
hydrothermal quartz. Substitutional incorporation of Fe3+ in the quartz lattice causes CL
emission at 1.73 eV. The increase of the 1.85 and 1.96 eV CL emissions during electron
radiation is explained by the abundance of hydroxyl defects in the quartz lattice. Upon

4
electron radiation H+ diffuses away and forms non-bridging oxygen hole centres, resulting in
higher CL intensity. This increase is steeper for hydrothermal and granitic (“wet”) quartzes
and is flatter for rhyolitic (“dry”) quartz. The 2.15 eV CL emission (yellow) is characteristic
for some granitic quartzes with high Mn (3 – 6 ppm). The 2.48 eV CL emission (turquoise) is
typical for hydrothermal quartz, which shows a high Li-associated 3474 cm-1 IR absorption
band. The 2.58 eV, 2.68 eV emissions occurring in spectra of all investigated quartzes may be
caused by intrinsic defects such as oxygen vacancies. Hydrothermal quartz may contain high
Al concentrations up to up to 5000 ppm; magmatic quartz shows Al concentrations up to 200
ppm. The hydrothermal quartz is characterised by a blue “flash” at initial electron radiation
caused by the 2.79 eV CL emission. It is assumed that this CL emission is related to the
positively charged interstitial cations H+, Na+, Li+ and K+ which compensate substitutional
Al3+. However, the concentrations of these trace elements do not simply correlate with the CL
intensity. Besides the unstable blue CL, we found also a more stable CL emission at a slightly
different wavelength (2.96 eV) in quartz phenocrysts in rhyolite and granite. This
luminescence could be related with Ti (up to 130 ppm) and is responsible for the contrasting
of growth zoning.
Based on the CL properties and trace elements, magmatic quartz has been subdivided into (1)
euhedral quartz phenocrysts showing stable, dominantly blue CL and growth zoning related to
Ti distribution and (2) anhedral matrix quartz with unstable red-brown CL and homogeneous
trace element distribution. The red-brown CL is related to the concentration of OH- and
molecular H2O in the crystal lattice. Rhyolitic and granitic quartz phenocrysts show similar
growth textures and trace element signatures indicating a similar low to mid-crustal
crystallisation environment. The phenocrysts are characterised by a fine-scale oscillatory
zoning (2 - 20 µm width), within super-ordinate stepped zoning (50 - 1000 µm width),
resorption surfaces, diffusion-induced wavy surfaces, and growth impediments. Except for the
oscillatory zoning, formed by self-organising growth, all growth textures formed by external
physico-chemical changes (temperature, pressure and magma composition) which result in
abrupt changes of the Ti concentration in the quartz crystals. The Ti content in the quartz
phenocrysts increases with increasing growth rate. Whereas the properties of the quartz
phenocryst point at low to mid-crustal origin, the matrix quartz must have been formed during
the conditions of magma emplacement.
Hydrothermal quartz shows similar growth patterns as magmatic quartz, but stepped zoning is
dominant here. This indicates quartz crystallisation in a disturbed (open) system. A

5
characteristic feature of hydrothermal quartz is the so-called sector zoning caused by different
impurity concentrations dependant of the growth direction. The zoning patterns in
hydrothermal quartz are explained by the distribution of Al-defects. The Al uptake is mainly
controlled by the pH of the aqueous solution; high pH (=5) results in high Al concentrations
in the quartz lattice. Additionally, the charge compensating ions H+, Li+, Na+, and K+
stimulates the Al3+ uptake.
Besides primary growth textures both magmatic and hydrothermal quartz mostly show a large
variety of secondary structures, which formed during retrograde processes. These processes
include (1) micro cataclasis, (2) healing, (3) diffusion, and (4) a-radiation. Based on the CL
measurements, we proposed a classification in (a) secondary structures with reduced defects
and (b) secondary structures with induced defects. Secondary structures with reduced defects
are basically the result of healing, dissolution-precipitation and diffusion, typically occur in
micro shear zones, along grain boundaries, and as halos around fluid inclusions.
Decrepitometry studies of fluid inclusions with halos of secondary non-luminescent quartz
showed they hold anomalous high fluid pressure on heating. The formation of secondary
quartz around fluid inclusions indicates the healing of defect structures and are possibly
initiated by the local increase of stress in part due to pressure gradients between fluid
inclusion and host quartz. Structures with higher defect concentrations are the result of natural
a–radiation and trace element diffusion and comprise bright CL halos around radioactive
mineral inclusions, diffusion rims along grain boundaries, and radiation-induced non-
luminescent spots. The radiation-induced spots are interpreted as aggregations of aqua
complexes with a gel-like structure, i.e. regions with a high local concentration of H2O and
substitutional Al compensated by hydroxyl groups. Non-luminescent spots and secondary
quartz around fluid inclusions are frequent in granitic matrix quartz and less common or
lacking in phenocrysts.
Cathodoluminescence has been applied to granitic systems from 2 magmatic provinces: the
Krušne Hory/Erzgebirge (Czech Republic/Germany) and the Eastern Lachlan Fold Belt
(Australia). In this way, the reconstruction of petrogenetic processes during granitic melt
generation, ascent and emplacement and related fractionation, could be achieved. The quartz
phenocrysts occurring in the F-Li-enriched granites of the Krušne Hory/Erzgebirge show
distinct contrasted growth zoning, being more common for phenocrysts in rhyolites.
Similarities in grain size, grain shape and growth texture found for phenocrysts in different

6
granite varieties of a intrusion complex proof a common history during the earliest stage of
crystallisation. The CL properties of different quartz generations in granite reflect the change
of the water content of the melt. During the early crystallisation stage the magma contained
<2.5wt% H2O and produced euhedral phenocrysts with stable CL and growth zoning. During
magma evolution the water content of the melt increases until about 5wt% H2O. At the latter
stage anhedral matrix quartz was formed. The quartz phenocrysts from different complexes of
F-Li-enriched granites may show different trace element contents (Ti/Al ratios). However, the
magmatic rock textures, quartz generations, growth patterns observed in CL are very similar
for all rocks. These similarities suggest that the magmatic quartz textures in the granite and
the phenocryst growth patterns found in Krušne Hory/Erzgebirge province are typical for F-
Li-enriched melts which are related to Sn-W-mineralisations.
Snowball-textured quartz phenoblasts occur common in highly evolved F-Li-enriched granites
and represent a late-magmatic solidification texture. Contrary to the rhyolitic quartz
phenocrysts these snowball quartzes show red CL. A trigonal habit of the zoning in the
phenoblasts indicates crystallisation temperatures <600°C (at <1 kbar). The irregular zoning is
explained due to periodic degassing during melt cooling in the granite roof. We found that
snowball quartz is a textural indicator for fluid-saturated, F-Li-enriched melts of alkali
feldspar granites with sub-volcanic (shallow) emplacement. Furthermore, it serves as an
indirect indicator for Sn-W-mineralisation.
The application of CL to greenschist facial deformed quartz of granites from the Eastern
Lachlan Fold Belt, Australia showed that magmatic undeformed and deformed quartz can be
easily distinguished based on CL properties. Deformed quartz exhibits structures of newly
formed (secondary) quartz with weak red-brown CL whereas undeformed quartz shows blue
to violet CL. The secondary quartz is depleted in trace elements. In deformed magmatic
quartz the unstable 1.85 and 1.96 eV CL emissions related to water-bearing defects remain
constant during electron radiation, indicating that the interstitial molecular water has been
removed from the quartz lattice during deformation and subsequently was incorporated into
muscovite micro flakes.

7
Acknowledgements
First of all I like to thank all my co-workers from the Earth Science Institutes in Göttingen for
their contribution to having a pleasant time throughout the last three years.
I would like to express my sincere thanks to Prof. Dr. H.-J. Behr and Dr. A.M. van den
Kerkhof for setting up the project, their continuous, motivating support, and the numerous
discussions we had during the course of study. They reviewed the whole manuscript critically
and improved the quality of the thesis significantly. I also like to thank Prof. Dr. Weber for
taking on the function of co-adviser.
I am extremely happy about the effective and smooth collaboration with Dr. R. Seltmann and
Dr. R. Trzebski. I appreciate many fruitful scientific discussions with them.
I greatly appreciate the help of Dr. A. Kronz, Dr. K. Simon, T. Scherer, and Dr. M.
Wiedenbeck with their tremendous technical knowledge they were instrumental for the
progress of the present work.
Special thanks go to Dr. J. Götze, Dr. N. Stenina, Dr. K. Breiter, Dr. U. Hein, Dr. M. René,
Dr. A. Vollbrecht, Dr. S. Siegesmund for invaluable advice, discussions which largely
contributed to the success of this study.
Dr. P. Lennox is thanked for his introduction to the Australian geology and for the
organisation of the field work in Australia.
For the correction of the English I wish to thank B. Peters-Kewitz, Dr. F. Wall, Dr. C.J.
Stanley, Dr. C.T. Williams, Dr. R. Armstrong, and C. Gross.
Funding for the project was provided by the Collaborative Research Centre SFB 468
“Wechselwirkungen an geologischen Grenzflächen”.
Above all, I thank my parents for their extraordinary support, both morally and financially.
During all my university education they have been a constant source of encouragement.

8
Contents
Summary .................................................................................................................. 3
Acknowledgement .................................................................................................... 7
Contents .................................................................................................................... 8
1 Introduction......................................................................................................... 11 1.1 The application of cathodoluminescence to the study of quartz.................. 11 1.2 Aims of the study......................................................................................... 15 Part I – CL properties and defect structures in quartz ............................... 15 Part II – CL applied to the study of granitic rocks ..................................... 17 1.3 Sample material........................................................................................... 20 Damara Orogen........................................................................................... 20 Krušne Hory/Erzgebirge.............................................................................. 21 Oberpfalz/NW Saxony/Harz/Odenwald ....................................................... 23 Eastern Lachlan Fold Belt........................................................................... 24
PART ICathodoluminescence properties and defect structures in quartz
2 Fundamentals of cathodoluminescence ............................................................ 27 2.1 Point defects in quartz................................................................................. 30 2.2 The state of water in quartz.......................................................................... 32
3 Cathodoluminescence equipment ...................................................................... 35 3.1 Sample preparation...................................................................................... 35 3.2 Optical CL................................................................................................... 36 Cathodoluminescence microscope HC3-LM ............................................... 36 The TRIAX 320 spectrograph ...................................................................... 36 3.3 Scanning electron microscope (SEM) CL................................................... 41 3.4 Mathematical treatment of CL spectra ........................................................ 43
4 Microanalysis of trace elements and defect centre characterisation in quartz............................................................................................................... 45 4.1 Electron probe microanalysis (EPMA)........................................................ 46 4.2 Laser ablation inductively coupled plasma mass spectrometry (LA- ICPMS)............................................................................................... 51 4.3 Secondary ion mass spectroscopy (SIMS) .................................................. 54 4.4 Fourier-transform infrared (FTIR) spectroscopy......................................... 57 4.5 Electron paramagnetic resonance (EPR) ..................................................... 58
5 Analytical results ................................................................................................ 59 5.1 Characterisation of the cathodoluminescence of quartz.............................. 59 5.2 Instability of luminescence centres during electron bombardment ............. 66 The effect of temperature............................................................................. 68 CL of thermally treated quartz.................................................................... 73 The effect of sample preparation on the CL of quartz................................. 73 Quantification of CL intensity change during electron radiation ............... 75

9
5.3 Comparison of CL spectral and trace element analysis ............................... 77 LA-ICPMS, EPMS, and SIMS analysis........................................................ 77 FT-IR spectroscopy...................................................................................... 78 Paramagnetic defect centres ....................................................................... 87 Overview of CL emission lines of quartz..................................................... 89
6 Genetic significance of CL structures and trace element distribution.......... 95 6.1 Impurity uptake during quartz crystallisation in silicate melts.................... 95 6.2 Impurity uptake during quartz crystallisation in aqueous solution.............. 102 6.3 Secondary CL structures and processes resulting in modification of defect centres........................................................................................... 107 Secondary CL structures with reduced defect centres ................................ 107 Secondary CL structures with induced defect centres................................. 112
PART IICathodoluminescence of quartz applied to the study of granitic rocks
7 Application of Cathodoluminescence to Magmatic Quartz in a Tin Granite – case study from the Schellerhau Granite Complex, Eastern Erzgebirge, Germany (co-authors: Seltmann R. and Behr H.-J.)............................................................ 114 7.1 Abstract........................................................................................................ 114 7.2 Introduction ................................................................................................. 114 7.3 Analytical methods ...................................................................................... 118 7.4 Geology and geochemistry of the SGC ...................................................... 119 Geological setting........................................................................................ 119 Phasing ........................................................................................................ 121 Geochemistry............................................................................................... 123 7.5 Textural studies............................................................................................ 125 The quartz texture of the SG1...................................................................... 125 The quartz texture of the SG2...................................................................... 129 The quartz texture of the SG3...................................................................... 129 7.6 CL-properties of the quartz in the SGC....................................................... 130 CL-colours ................................................................................................... 130 Primary growth textures.............................................................................. 131 Secondary CL structures ............................................................................. 137 7.7 Relationships between CL and trace element distribution in quartz of the SGC ................................................................................................... 138 7.8 A multistage quartz crystallisation model of the SGC ................................ 142 Early phenocryst crystallisation.................................................................. 142 Melt separation, intrusion, and main crystallisation of SG1, SG2 and SG3 ....................................................................................................... 145 7.9 Summary...................................................................................................... 147
8 The genetic significance of snowball quartz in highly fractionated tin granites of the Krušne Hory/Erzgebirge (co-author: and Seltmann R.)................................................................................ 149 8.1 Abstract........................................................................................................ 149 8.2 Introduction.................................................................................................. 149 8.3 Petrography and texture............................................................................... 151

10
8.4 CL and growth zoning ................................................................................. 151 8.5 Trace elements ............................................................................................. 153 8.6 Conclusions.................................................................................................. 153
9 Cathodoluminescence (CL) of magmatic quartz: applications to topaz granites from the Hub Stock (Slavkovský Les Mts., Czech Republic) (co-author: René M. and Behr H.-J.) .................................................................. 156 9.1 Abstract........................................................................................................ 156 9.2 Introduction.................................................................................................. 156 9.3 Geological setting ........................................................................................ 158 9.4 Petrography.................................................................................................. 160 9.5 Methodology................................................................................................ 160 9.6 Quartz CL colours and growth patterns ....................................................... 162 9.7 Quartz CL spectroscopy and trace element distribution.............................. 162 9.8 Discussion.................................................................................................... 167
10 Magma crystallisation, emplacement and deformation of S- and I-type granites in the Eastern Lachlan Fold Belt (SE Australia) indicated by quartz texture, cathodoluminescence, and Al-in-hornblende barometry (co-authors: Lennox P., and Trzebski R.)........................................................... 171 10.1 Summary.................................................................................................... 171 10.2 Introduction................................................................................................ 172 10.3 Geological Setting...................................................................................... 172 10.4 Methods ..................................................................................................... 174 10.5 Geochemistry............................................................................................. 176 10.6 Quartz texture and foliation development ................................................. 177 Carcoar Granodiorite................................................................................ 177 Barry Granodiorite.................................................................................... 179 Sunset Hills Granite.................................................................................... 179 10.7 Cathodoluminescence of quartz................................................................. 182 Primary magmatic CL textures .................................................................. 182 Secondary CL structures ............................................................................ 182 CL patterns and properties linked to trace elements in the quartz............ 183 10.8 Al-in-hornblende geobarometry on the Carcoar and Barry granodiorites. 188 10.9 Conclusions................................................................................................ 189 Quartz CL .................................................................................................. 189 Magmatic quartz textures.......................................................................... 190 Geochemistry and Al-in-hornblende geobarometry.................................. 191 Deformation fabrics................................................................................... 191 10.10 Geological implications ............................................................................. 192
References ................................................................................................................ 195
Appendix A............................................................................................................... 207Appendix B............................................................................................................... 214Appendix C............................................................................................................... 215Appendix D............................................................................................................... 222Appendix E............................................................................................................... 228
11
1 Introduction
1.1 The application of cathodoluminescence to the study of quartz
The electron-excited luminescence, or cathodoluminescence (CL), is an efficient technique
for the visualisation of intra-granular growth textures and alteration structures in quartz. A
distinction is made between growth textures such as zonation, resorption, incrustation,
cementation, etc., and secondary, late-formed structures such as alteration halos along grain
boundaries, healed microcracks formed by brittle deformation and healing structures around
fluid inclusions (Behr and Frentzel-Beyme, 1988; Behr, 1989). In the following the term
“primary CL textures” is used for intra-granular growth patterns developed during crystal
growth which is in agreement with the general application of the term “growth textures” for
crystal arrangements and zoning patterns in igneous rocks (e.g. Bard, 1986; Shore and Fowler,
1996; Watt et al., 1997). The term “secondary CL structures” is used for the wide variety of
structures formed during alteration, healing, and retrograde processes.
These structures which become visible using CL are principally based on the distribution of
trace elements and defects in the crystal lattice. The CL depends on the kind of chemical
bond, lattice defects (vacancies), and impurity elements which can act as activators,
sensitizers, and quenchers. Changes in the quantity and quality of defects in a mineral
revealed by CL and complementary microanalytical methods reflect physico-chemical
changes of melts and fluids (nature, concentration and oxidation state of trace elements,
temperature and pH of solutions etc.) during crystal growth, deformation or alteration, or
post-crystallisation dose rates of natural α- and γ-irradiation. However, the relationship
between the CL emission and the defect structures of quartz are complex, most still not
completely understood. Therefore, CL microscopy has been underused for the reconstruction
of geological processes so far. The presented study contributes in solving the causes of the CL
of quartz and uses CL for the interpretation of rock-forming processes.
The CL of minerals was studied more than a hundred years ago by Crookes (1879), who
observed that “substances known to be phosphorescent shine with great splendour when
subjected to the negative discharge in high vacuum”. The first report about
cathodoluminescence of quartz was given by Goldstein (1907). The possibilities afforded by
the microscopic examination of minerals under electron bombardment was not explored until
the 1960’s when the luminescence was studied since introduction of the electron microprobe.
12
Smith and Stenstrom (1965) and Long and Agrell (1965) independently made luminescence
microphotographs by illuminating the surface of thin sections with a electron beam (~1 mm
diameter). The results clearly showed the correlation between luminescence colour and
brightness and the concentration of trace elements in quartz and zoned calcite. Sippel (1965)
and Smith and Stenstrom (1965) used CL for the distinction of detrital quartz grains of
igneous or metamorphic origin and cement quartz. During the last 30 years, the application of
quartz CL in geosciences has grown in both extent and diversity. Major contributions pointing
out the use of CL as a petrologic tool have been published by Smith and Stenstrom (1965),
Remond (1977), Zinkernagel (1978), Hagni (1984, 1987), Walker (1985), Marshall (1988),
Remond et al. (1992), and Pagel et al. (2000).
Applications of CL in geosciences with special emphasis to quartz and quartz-bearing rocks
are summarised as follows:
1. CL facilitates the rapid characterisation of modal mineralogy and the identification of
economic or pathfinder minerals. It is possible to distinguish mineral constituents by
colour contrast, even in fine-grained rocks like sandstone or quartzite (e.g. Magnus and
Götze, 1998).
2. CL is well suitable to distinguish between different mineral generations of quartz and
carbonate. It enables the distinction of detrial quartz and cement quartz in siliciclastic rock
(e.g. Sippel, 1968) or of different quartz generations in igneous rocks (D’Lemos et al.,
1997; Müller et al., 2000). CL imaging clearly yields superior quantification of quartz
cement volumes in siliciclastic rocks (e.g. Evans et al., 1988). It has been suggested that
CL colours and structures visible in CL in detrial quartz grains may be used as provenance
indicators in study of siliciclastic rocks (Matter and Ramseyer, 1985; Owen, 1991;
Kennedy and Arikan, 1990; Milliken, 1994).
3. CL is a sensitive method for revealing growth zonation, twinning patterns, grain shapes
and secondary overgrowths which are not distinguishable in transmitted or polarised light
(e.g. D’Lemos et al., 1997; Watt et al., 1997). Zoning patterns result from the combination
of progressive growth, boundary layer effects and episodes of crystal-melt/fluid
disequilibria caused by fluctuations in temperature and melt/fluid composition during
crystallisation. The intragranular growth textures yield important information about the
nature and evolution of the crystal-forming melt/fluid.
4. The distribution of luminescence colours reveals alteration patterns in crystals, like grain
boundary alteration. The knowledge of the alteration pattern is important, for instance, for
the interpretation of oxygen isotope distribution in quartz crystals (Valley and Graham,

13
1996). In ore exploration CL studies of alteration structures facilitates the delineation of
the alteration zones affected by mineralising fluids and therewith of the size of ore bodies
(Hagni, 1984; 1987).
5. Alteration and deformation (secondary) structures like healed micro-fractures and
recrystallised phases can be easily detected in quartz by CL. This structures are indicators
for the paleopermeability and paleoporosity of crustal rocks, which are of particular
interest for oil exploration (e.g. Behr and Frentzel-Beyme, 1988; Laubach, 1997). Boiron
et al. (1992) and Winslow et al. (1994) demonstrated that CL can be used to distinguish
between different inclusion generations. Furthermore, CL investigations of secondary
structures contribute in solving the problem of fluid loss and re-equilibration of fluid
inclusions in quartz (e.g. Audétat and Günther, 1999).
6. CL spectroscopy provides information about the impurity and defect centre quality of a
crystal. For example, in carbonate REE can be measured by CL analysis of carbonate at
levels down to 0.1 ppm (Habermann et al., 2000). In some cases, CL spectrometry allows
the semi-quantitative analysis of trace elements (Townsend and Rowlands, 2000). Defect
identification of silicates by CL are also of interest for material sciences e.g., semi-
conductor industry, silicate technique, optical industry, and for the protection of historical
monuments i.e. the study of weathering of building materials like marble and limestone.
Despite considerable benefits of the phenomenological investigation of CL colours in quartz,
the causes of CL have not been resolved. This is partly due to the complex CL spectrum,
about 12 emission bands were detected in quartz (Kalceff and Phillips, 1995 and references
therein), and partly to the fact that the incorporation of trace elements and natural irradiation
causes a great number structural defects which strongly influence the quartz CL (e.g. Richter
and Zinkernagel, 1975; Zinkernagel, 1978; Sprunt, 1981; Ramseyer et al., 1988; Owen, 1988;
Ramseyer and Mullis, 1990; Perny et al., 1992; Kalceff and Phillips, 1995). The
determination of trace element distribution is impeded by the general low trace element
content of quartz which is in the range of the detection limits of micro analytical techniques.
Furthermore, the structure of the defects in the quartz lattice is partly unknown.
Trace elements in quartz which substitute for Si4+ are Al3+, Fe3+, Ti4+, Ge4+, P5+, 4H+ and Ga3+
ordered of average frequency (e.g. Bambauer, 1961; Lehmann, 1975; Lehmann and
Bambauer, 1973; Nuttall and Weil, 1980; Maschmeyer and Lehmann, 1983a and 1983b;
Weil, 1984). Cations such as H+, Li+, Na+, K+, Fe2+, Cu+, and Ag+ function as compensators of
the electric charge at interstitial positions. It has been striven to obtain quantitative analysis of

14
trace elements in quartz at the ppm level and with high spatial resolution. Variations in trace
element concentrations proved to be useful as petrogenetic indicators. Earlier studies showed
a large variation in the chemistry of quartz crystals from different environments (e.g. Suttner
and Leininger, 1972; Schrön et al., 1988; Blankenburg et al., 1994 and references therein,
Müller et al., 2000). Several authors have tried to relate specific trace elements and the related
defect structures in quartz to the formation environment and to a genetic interpretation.
Examples are given by Dennen et al. (1970), Siebers (1986), Ramseyer and Mullis (1990),
Gerler (1990), and Perny et al. (1992) for hydrothermal quartz, and Suttner and Leininger
(1972), Schrön et al. (1988), and Watt et al. (1997) for magmatic quartz. Dennen et al. (1970)
proposed a geothermometer based on the incorporation of Al in hydrothermal quartz as a
function of formation temperature. Using the electron paramagnetic resonance (EPR)
technique, Agel and Petrov (1990) confirmed that the concentration of [AlO 4]0 centres in
quartz increases with increasing crystallisation temperature. The concentration of
paramagnetic Ti and Al-related defect centres created by natural irradiation can be used for
rock dating (e.g Grün et al., 2000). Schrön et al. (1988) grouped pegmatitic, granitic, and
rhyolitic quartz according their Ge – Ti – Al contents.
A number of trace elements have been found to activate CL in quartz: Ti (Sprunt, 1981;
Kerkhof et al., 1996), Fe (Pott and McNicol, 1971; Sprunt, 1981; Gorobets et al., 1989), Al
(Grant and White, 1978; Perny et al., 1992), H and Li (Matter and Ramseyer, 1985; Perny et
al., 1992), Mn (Richter and Zinkernagel, 1975; Dudley, 1976), OH- and H2O (Behr, 1989;
Kalceff and Phillips, 1995), Ge (Luff and Townsend, 1990), and Ga (Dudley, 1976). There
are only a few studies about the CL of quartz in comparison with trace element studies which
have been done to visualise intra-granular growth patterns, to distinguish different quartz
generations and to explain crystallisation processes e.g. Sprunt (1981), Ramseyer and Mullis
(1990), Perny et al. (1992), Demars et al. (1996), Bruhn et al. (1996), and Watt et al. (1997).
The heterogeneous distribution of the trace elements (growth zoning) reflects the physico-
chemical variations of the fluid or the melt during crystal growth (e.g. Ramseyer and Mullis,
1990; Watt et al., 1997). Structural and/or chemical variations within crystals, which may
relate to crystal growth zones, can be identified by spatial variations in wavelength and
intensity of CL (e.g Waychunas, 1988; Marshall, 1988). CL-contrasted growth zoning are
observed e.g., by Ramseyer et al. (1988), Ramseyer and Mullis (1990) and Perny et al. (1992)
in hydrothermal quartz and e.g., by Schneider (1993) and Watt et al. (1997) in rhyolitic quartz
phenocrysts. Retrograde processes (alteration) may change CL properties resulting in the
creation of secondary CL structures may caused by the redistribution of defects. Most

15
secondary structures represent migration pathways of fluids which migrate along grain
boundaries, microcracks, or channelways by pore overpressure or tectonic strain (Behr and
Frentzel-Beyme, 1988; Behr, 1989). In spite of the fact that quartz is one of the common rock-
forming minerals, yet the relation between its CL properties, trace element distribution, and
petrogenesis is far from be solved.
1.2 Aims of the study
The aim of this study is to better explain the causes for the CL properties of quartz and to find
the petrological significance of structures visible in CL. The study is subdivided in 2 parts. In
the first part (chapters 2-6) defect structures of quartz are characterised and quantified by CL
microscopy, spectroscopy and complementary micro-analytical studies. In the second part
(chapters 7-10) CL-studies are applied of the results from the first part to mineralised granitic
systems on the hand of examples from the magmatic provinces Krušne Hory/Erzgebirge
(Czech Republic/Germany) and the Eastern Lachlan Fold Belt (Australia).
Part I - CL properties and defect structures in quartz
The first part of the study deals with the CL of quartz and its correlation with defect
structures. The defect structures in quartz are characterised and their formation during
crystallisation and re-distribution during retrograde processes are discussed. Quartz samples
from Upper Carboniferous granite intrusions in Germany and related rhyolitic dykes, flows
and domes of the Permian continental crust and hydrothermal quartzes of the Upper
Proterozoic Damara Orogen of Namibia were taken for the studies of the CL of quartz . The
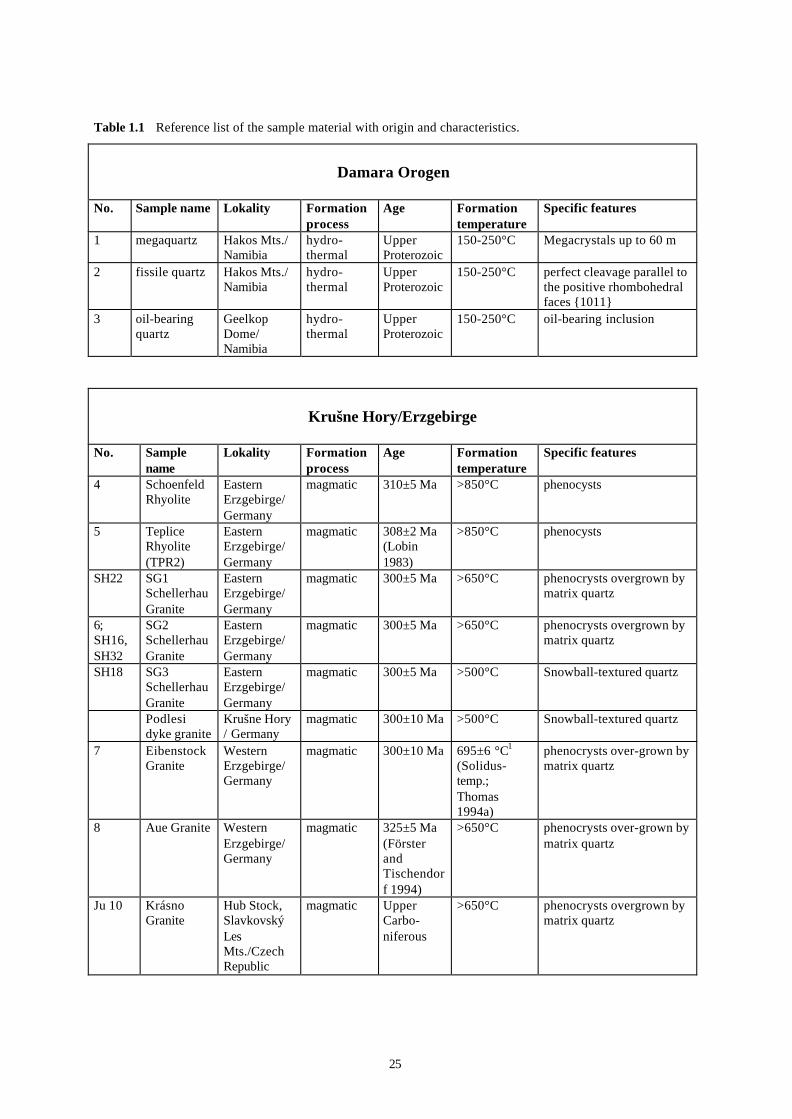
main characteristics of the samples are summarised in table 1.1.
Defect structures in quartz are unstable under electron radiation bombardment resulting in
changes of the CL. Looking at the problem of the mathematical capturing of CL parameters
like beam energy, radiation time, and sample temperature have been considered. Time-
resolved CL spectra with high resolution of the emitted wavelength were recorded to detect
the intensity, position and half-width of the emission bands and their changes during electron
radiation. In order to establish the parameters which may effect the CL of quartz the spectra
were recorded using different beam currents, sample surface roughness, and also by the study
of heat-treated samples. Temperature measurements were carried out to determine

16
temperature changes of the sample during electron radiation. For the quantification of the CL
emission spectra were resolved by best fitting with Gaussian curves.
A larger part of the study comprises the correlation between CL properties of quartz and trace
element distribution. Electron probe micro analysis (EPMA), laser ablation - inductively
coupled plasma mass spectrometry (LA ICP-MS), and secondary ion mass spectrometry
(SIMS) were used for the determination of trace elements. Since the determination of trace
elements in quartz is not a routine analysis, the sensitivities of the different microanalytical
methods were investigated. Furthermore, the defect centres were characterised by using
electron paramagnetic resonance spectroscopy (EPR). Fourier transform infra-red (FTIR)
spectroscopy facilitates the qualitative characterisation of crystallographic bound water.
Water occurs in quartz as different modifications: as hydroxyl groups related to different
defect structures (e.g. with Al), as molecular water in micropores and in fluid inclusions.
During electron radiation and heating crystallographic bound water may change to molecular
water which concentrates in micro pores. These processes are not completely understood and
a main topic of this study.
After studying CL properties CL structures and processes responsible for trace element
distribution and defect structure formation were discussed. At first quartz growth textures
were classified. The rhyolites as well as a number of the granites contain euhedral quartz
phenocrysts showing a CL-contrasted complex growth pattern. The euhedral phenocrysts in
granite are recognisable only by using CL because they are overgrown and embedded in
homogeneous anhedral quartz. The euhedral quartz phenocrysts in granite showing CL-
contrasted growth textures have been described in a few cases (Frentzel-Beyme, 1989;
Seltmann, 1994; D’Lemos et al., 1997; Müller and Behr, 1997). The questions arise if these
phenocrysts have the same origin and formed at similar conditions like phenocrysts in
rhyolite. This important for the understanding Upper Carboniferous magma formation during
the Variscan orogeny. The development of growth zoning during magmatic crystallisation is
explained by a number of models (e.g. Sibley et al., 1976; Anderson, 1984; Fowler, 1990) that
have been derived from the zoning pattern of plagioclase. We apply these models to the
crystallisation of magmatic quartz having a similar growth pattern as plagioclase. The
classification of growth zoning helps in distinguishing between zoning caused by self-
organised growth and zoning caused by physico-chemical changes of external factors such as
temperature, pressure and magma composition (Bottinga et al., 1966; Allègre et al., 1981;
Shore and Fowler, 1996). The zoning caused by external factors is of interest for the
reconstruction of the crystallisation history of felsic melts (magma storage, ascent, mixing,
17
emplacement, and cooling rate). In a further step the zoning of magmatic quartz was
compared with zoning observed in hydrothermal quartz. The differences between impurity
uptake in quartz crystals in a melt and in aqueous solutions were discussed.
In CL quartz shows secondary structures which formed during retrograde processes. Typical
secondary structures of quartz are healed veinlets and domains along micro shear zones, grain
and subgrain boundaries, diffusion rims at grain boundaries, patchy halos of secondary quartz
around fluid inclusions, radiation-induced non-luminescent spots, and halos around
radioactive inclusions. Mostly, secondary quartz shows a weak luminescence and is therefore
mostly easily distinguishable from the host crystal. The formation of secondary quartz may be
stimulated by fluid activity. The CL properties of the secondary quartz in comparison with the
host quartz indicate a redistribution of defect structures.
The study focuses on two types of secondary structures occurring in magmatic quartz: halos
of secondary quartz around fluid inclusions and non-luminescent spots with gel-like defect
structure. A wide variety of patchy halos around fluid inclusions have been observed by CL
since about one decade (Frentzel-Beyme, 1989; Behr, 1989; Kerkhof and Müller, 1999). The
CL-contrasted halos around fluid inclusions are assumed to be related to explosion and
implosion-decrepitation at changing PT conditions and to healing processes resulting in
volumetric and compositional changes of fluid inclusions. A better understanding of the
physical and chemical conditions leading to formation of halos of secondary quartz around
fluid inclusions is essential for a proper interpretation of fluid inclusion data. Non-
luminescent spots (1-5 µm) observed by SEM-CL become visible first in CL after a radiation
time of some minutes. The spots may be associated with larger defect clusters containing
structural water in the form of H+, OH-, and H2O.
Part II - CL applied to the study of granitic rocks
In the second part of the study (chapters 7-10) CL is applied to the study of quartz in granitic
rocks and comprises four papers. Two papers (chapter 7 and 8) have been published by
Müller, Seltmann, and Behr (2000) in “Mineralum Deposita” (vol. 35: pp. 169-189) and by
Müller and Seltmann (1999) in “Mineral Deposits: Processes to Processing” edited by Stanley
et al. (pp. 409-412). The other two papers (chapter 9 and 10) have been submitted by Müller,
René, and Behr to “Terra Nova” and by Müller, Trzebski, and Lennox to “Mineralogy and
Petrology”.
Samples were collected from two magmatic provinces, the Krušne Hory/Erzgebirge (Czech
Republic/Germany) and the Eastern Lachlan Fold Belt (Australia). The sample material used
18
for the studies is described in § 7.4, 8.3, 9.3, and 10.3. Principally, in the four papers the
results of quartz CL and trace element analysis are utilised to reconstruct interactions at the
crystal-melt interface during crystal growth and the state and changes in chemistry and
physics of the melt (mixing, differentiation, pulsation, degassing). Complimentary analysis of
the magmatic textures (grain size distribution, grain shape, grain relationship) with special
emphasis to fabrics influenced by late-magmatic volatiles will provide information about
cooling rate of the melt, emplacement conditions, role of volatile. The studies links CL studies
with micro-analytical studies and provide principally a new level in the knowledge about
petrogenetic and metallogenetic processes in magmatic systems.
On the basis of field work, geochemical and textural investigations, and CL a model of the
quartz crystallisation history of the Schellerhau granite melt is presented in chapter 7 (Müller
et al., 2000a). The late-Variscan Schellerhau granite complex (Eastern Erzgebirge, Germany)
is characterised by the intrusion sequence of porphyritic (SG1) to weakly porphyritic
monzogranites (SG2) and mostly seriate albite granite containing snowball-textured quartz
(SG3) (e.g. Seltmann, 1994; Schilka and Baumann, 1996). The intrusions are related to Sn-W-
mineralisations. The source of magma and its physico-chemical evolution during ascent and
fractionation is of particular interest for the formation of Sn-W-deposits. In the first step
different quartz generations were distinguished based on CL studies and the grain size
distribution. The SG1 and SG2 contain euhedral phenocrysts overgrown by an anhedral quartz
phase (matrix quartz). The phenocrysts show distinct contrasted growth zoning, being
normally more common for rhyolitic phenocrysts (Schneider, 1993). On the base of
microthermometric studies of silicate melt inclusions, Thomas (1992) calculated the
crystallisation depth of granitic quartz phenocrysts of the Erzgebirge granites (e.g. Eibenstock
and Schellerhau granites) of up to 21 km. Beside the Schellerhau granites a number of the
other investigated granites (samples 6, 7, 8) show such quartz phenocrysts which are
overgrown by a younger euhedral quartz generation (matrix quartz). The study of CL
properties, growth zoning, and trace element distribution of the different quartz generations in
Schellerhau granites answered the following questions: 1) Are granitic phenocrysts
comparable with phenocrysts occurring in rhyolites and which crystallisation environment
they represent? 2) Which crystallisation conditions cause the differences in CL and trace
element distribution of quartz phenocrysts and anhedral matrix quartz? 3) Do the quartz CL
and trace element distribution of different quartz generations reflect different crystallisation
environments? 4) How does the volatile content of the melt effect the quartz CL and defect

19
structure distribution? And 4) How can the analysis of growth zoning contribute to reconstruct
the melt crystallisation history?
The fluid saturation textures of the SG3 Schellerhau granite are discussed in chapter 8
(Müller and Seltmann, 1999). This chapter contributes to solving the problem of the formation
of snowball-textured alkali feldspar granites and their significance for genesis of Sn-W-
deposits. Snowball-textured quartz occurring in highly evolved alkali feldspar granites world-
wide are ellipsoidal phenoblasts up to 1 cm in size. They are characterised by zonal
arrangement of entrapped matrix minerals (albite, K-feldspar, mica) alternating with inclusion
free zones. Since long the origin and interpretation of snowball-texture are controversially
discussed and lacked application of CL based arguments. It is considered to be either
metasomatic (e.g. Beus et al., 1962; Sonyushkin et al., 1991), or magmatic origin (Kovlenko,
1977; Pollard, 1989; Yin et al., 1995; Renno, 1997; Poutiainen and Scherbakova, 1998).
Snowball-textured quartz occurs also in the roof of late Variscan tin-bearing alkali feldspar
granite stocks of the Krušne Hory/Erzgebirge. For textural, CL and trace element studies on
snowball quartz were chosen the third intrusion stage SG3 of the Schellerhau Granite
Complex (Eastern Erzgebirge/Germany) and the Podlesi dyke granite (Western Krušne
Hory/Czech Republic). The problem of magmatic or metasomatic origin is discussed on the
base of the analysis of the growth zoning visible by CL and the trace element distribution.
Chapter 9 discusses the significance of Ti distribution in quartz phenocrysts for the
interpretation of growth patterns on the example of the topaz-bearing granites of Hub Stock,
Slavkovsky Les Mountains, Czech Republic (Müller and René, 2000). The Hub Stock hosts
the Sn-W deposit Krásno on the SE margin of the Krušné Hory/Erzgebirge Batholith. The
trace element signature and growth patterns of quartz phenocryst of the different granite
intrusions are compared. The study is focused on high-resolution CL spectroscopy of the
quartz CL. Finally, similarities between quartz crystallisation history derivable from the
quartz CL and trace element distribution of the Schellerhau and Hub stock tin granites are
discussed.
In chapter 10 the significance of quartz CL for reconstruction of magma crystallisation,
emplacement and deformation of S- and I-type granites in the Eastern Lachlan Fold Belt is
discussed (Müller et al., 2000b). The samples were collected from Carcoar, Barry and Sunset
Hills granites. In contrary to the investigated granites of Krušné Hory/Erzgebirge the three
20
Australian granites are less fractionated and can be subdivided into the metaluminous I-type
Carcoar and Barry granodiorites and the peraluminous S-type Sunset Hills Granite. They were
intruded in the Late Ordivician-Early Silurian into Ordovician graywacke and volcaniclastic
rocks and were subsequently repeatedly deformed. In this paper quartz CL has been applied to
qualify and quantify the conditions of emplacement and deformation of the Carcoar and Barry
granodiorites and the Sunset Hills Granite with special emphasis on the macro- and
microtextures, trace element distribution of quartz, Al-in-hornblende barometry, and whole
rock geochemistry. Structural analysis of granites with a polyphase deformation history often
faces the difficulty in discriminating between generations of magmatic and deformation
fabrics. The application of quartz CL enables easily the distinction between magmatic and
deformation fabrics. Furthermore, the study demonstrates how the quartz CL properties and
quartz textures reflect the temperature and pressure conditions during magmatic
crystallisation and subsequent greenschist facial deformation. High-resolution spectroscopy is
used to show differences in CL of deformed and undeformed magmatic quartz. The causes of
this differences which may associated with crystallographic bound water in the quartz lattice
are discussed.
1.3 Sample material
As study objects we have chosen samples for which an extensive state of knowledge based on
mapping, chemical and petrographical data already exists but some petrogenetic questions are
unsolved. The quartz samples and quartz-bearing rocks were taken from 4 regions (table 2.1).
Damara Orogen
The first sample group is represented by hydrothermal quartzes from the southern margin of
the Upper Proterozoic Damara Orogen of Namibia. Previous fluid inclusion studies on this
quartzes were done by Behr and Horn (1982), Behr et al. (1983), Schmidt-Mumm et al.
(1986), and Behr and Schmidt-Mumm (1987) who contributed to the understanding of the
formation and activity of tectonic brines during the Proterozoic Damara Orogen (Namibia).
The name “megaquartz” (sample 1) came from mega quartz crystals, which are outstanding,
up to 60 m high monoliths in the Hakos Mountains. The quartz bodies are intergrown with
dolomite and are emplaced tectonically during an early deformation event of the Damara
Orogen. This event was characterised by thrusting of nappes over a fluvial-lacustrine and
21
evaporitic metaplaya sequence (Behr and Schmidt-Mumm, 1987). The fluids forming this
quartz-dolomite body are related to dehydration and leaching of evaporitic hydrate minerals
of the metaplaya sequence and had salinities of up to 69 wt% total salt content revealed from
fluid inclusion studies sequence (Behr and Schmidt-Mumm, 1987). The formation
temperature, as determined in fluid inclusion studies, ranged from 150 to 250°C. The clear
fissile quartz (sample 2) representing a special variety of the megaquartz shows perfect
cleavage parallel to the positive rhombohedral faces {1011}. The oil-bearing quartz (sample
3) is a pebble found in the gravel plain around the Geelkop Dome and contains fluid
inclusions of higher hydrocarbons.
Krušné Hory/Erzgebirge
The second group of samples were taken from the magmatic province Krušne
Hory/Erzgebirge (Czech Republic/Germany) forming. The study of the granitic rocks with
special emphasis on quartz CL and textural analyses contributed to IGCP-373 project
“Correlation, anatomy and magmatic-hydrothermal evolution of ore-bearing felsic igneous
systems in Eurasia” (Seltmann et al., 2000). The project covers all aspects of the formation of
silicic igneous systems (plutonic to volcanic) and their magmatic evolution. Our contribution
is important for the understanding of textural evolution, physico-chemical balancing and
intrusion mechanism, temporal scale and phasing of magmatic events of Li-F-enriched melts.
The samples 4, 5, 6 represent felsic volcanics and subvolcanics of the Altenberg-Teplice
caldera (ATC) of the Eastern Erzgebirge/Germany. Neoproterozoic gneisses of the
metamorphic basement and volcano-sedimentary rocks form the host rocks of the 500 km2
large ATC. Late-collisional extensional tectonics and collapse of the Variscan orogen
controlled during the Upper Carboniferous the block and graben tectonics in the area, caldera
formation with pre-dominantly ignimbritic rhyolites (Schönfeld and Teplice rhyolite) and
porphyritic microgranites (Altenberg microgranite), and finally the post-tectonic multiple
intrusion of tin granites of the Schellerhau Granite Complex (SGC) into a subvolcanic level.
The volcanogenic fill of the ATC is divided into four volcanic phases two of which have been
sampled: The Schönfeld Rhyolite (sample 4) as the oldest phase and the effusive-subvolcanic
Teplice Rhyolite (phase 2; TPR2), the youngest phase. The grey-greenish Schönfeld Rhyolite
contains only a few quartz phenocrysts (<3 vol.%) showing an amoebic and skeletal shape.
The Teplice Rhyolite (sample 5), volcanic fill of the ATC is the largest outcropping
Carboniferous volcanic suite of the Bohemian Massif (Hoth et al., 1995). TPR2 displays
hiatalporphyric texture with euhedral quartz (2-3 mm), anhedral alkalifeldspar and few biotite

22
phenocrysts, sometimes also plagioclas. The caldera collaps was later followed also by a
multiple intrusion of highly differentiated Schellerhau granites hosting Sn-W-mineralisations
(Breiter et al., 1991). The subvolcanic Schellerhau Granite Complex (SGC) belongs to the
highly evolved younger intrusion complex (YIC) of the Erzgebirge batholith (e.g. Tischendorf
and Förster, 1990). The SGC is characterised by the intrusion sequence of porphyritic (SG1)
to weakly porphyritic monzogranites (SG2) and mostly seriate albite granite (SG3). The SG1,
SG2 and SG3 chemically represent the suite of P-poor, Li-F-enriched A-type series
leucogranites. They are weakly peraluminous (A/CNK ≤ 1.2), enriched in HREE, Y, Th, Hf,
Zr, Sc, Nb, Ta, U and display from SG1 towards SG3 elevated abundances especially of Rb,
Li, F, and Sn. There is only a moderate chemical contrast between SG1 and SG2. The SG3 is
more highly evolved as to be seen also from fluid saturation textures. NW- and NE-striking
faults with vertical dislocations of several hundred metres form the SGC as horst and as a
result some deeper pluton parts are uncovered by erosion within the ATC. The granite variety
SG2 (sample 6) was selected for investigations in part I (see also § 7.4 and 7.5). The SG2
exhibits a weak hiatalporphyritic texture. Euhedral quartz phenocrysts with an average size of
2.6 mm are overgrown by an anhedral quartz phase with an average grain size of 0.7 mm.
The Eibenstock granites (sample 7) are related to the younger intrusive complex (YIC) of the
Krušné Hory/Erzgebirge Batholith in Western Erzgebirge (Lange et al., 1972; Fiala, 1968).
The batholith extends over an area of about 6000 km2, belongs to the largest Variscan granite
bodies of the Variscan Orogen. The sample 7 represents the first intrusion phase of the
Eibenstock granites and is characterised by a coarse grained, perthitic texture with porphyritic
kalifeldspars (3 cm). The porphyritic two mica Aue Granite (sample 8) which forms small
satellite intrusions located northwestern of the Eibenstock Granite Massif belongs to the older
intrusion complex (OIC) of the Krušné Hory/Erzgebirge Batholith.
In chapter 9 the study is focused on the topaz-bearing granites of the Hub Stock hosting the
Sn-W deposit Krásno, Slavkovský Les Mountains, Czech Republic (Jarchovský et al., 1994;
René, 1998). The Hub stock is situated at the SE margin of the Krušné Hory/Erzgebirge
Batholith. The porphyritic topaz-albite granite (sample Ju-10) comprises fine-grained
equigranular groundmass containing a phenocryst population dominated by quartz (2-5mm),
platy zinnwaldite, and sparse K-feldspar (0.5-2 cm). Topaz-albite microgranites (sample Ju-
20) found in the upper part of the Hub stock form the matrix to the intrusion breccias. The
hydrothermal vein quartz (sample 9) originates from a post-Variscan mylonite zone situated
in Hub stock granites.

23
Oberpfalz/NW Saxony/Harz/Odenwald
The third group is represented by Permo-Carboniferous granites and rhyolites from different
localities of the Variscan Orogen of Germany (Oberpfalz, NW Saxony, Harz, Odenwald).
This group includes rocks which were investigated with CL by Schneider (1993). In our study
the trace element analysis of these samples facilitates a better understanding of the
phenomena described by Schneider (1993). Furthermore, this samples were chosen to
compare the quartz properties of the magmatic rocks of the Krušné Hory/Erzgebirge with
other magmatic provinces of the Variscan Orogen.
The Wachtelberg Rhyolite (sample 10) intruded metamorphic units of the Variscan
Frankenberg – Hainichener Zwischengebirge at the Northern edge of the Erzgebirge. The
Frankenberg – Hainichener Zwischengebirge is part of the SW-NE striking Central Saxonian
Lineament. The intrusion marks the intersection of Central Saxonian Lineament with the
Flöha Lineament.
The Beucha Rhyolite (sample 11) belongs to youngest subvolcanics of the Permo-
Carboniferous Volcanic Complex of Northwest Saxony. The rhyolite is characterised by the
inhomogeneous occurrence of xenolithes and pyroxenes indicating assimilation of lower and
mid-crustal rocks. Mineral framework indicates a strong whole rock alteration: discordant
calcite veins, apatite in opaque biotites, sericitised and kaolinised orthoclas and plagioclas,
and pyroxenes dulled by iron oxides.
The medium-grained two-mica Flossenbürg Granite (sample 12) intruded Moldanubian
paragneisses of the Northern Oberpfalz/Germany. The anhedral quartz fills irregular cavities
between the subhedral to euhedral feldspar and mica. Sample 21 is a clear, pegmatoid quartz
lens (leucosome quartz) of migmatitic, Variscan HT-LP-paragneisses of the Northern
Oberpfalz. During the Variscan peak metamorphism the Proterozoic educts were overprint at
temperatures around 600°C and pressures between 2.5 and 4 kbar. The sample locality, the
quarry Böhmischbruck, is about 15 km southern of the Flossenbürg Granite.
The subvolcanic Ramberg Granite (sample 14) is beside the Brocken Granite the most
northern exposed Variscan granite in Germany situated in the Rhenoherzynian zone of the
Harz Mountains. The sample represents the medium-grained variety of the locality
Rosstrappe. The medium-grained variety occurs in the western and eastern part of the massif,
whereas a porphyritic type forms the central part of the pluton.
The Weinheim Rhyolite (sample 15) is situated in the Southern part of the Odenwald
Mountains/Germany, which forms part of the Mid-German Crystalline Rise (MGCR) within
the Saxothuringian zone of the Variscan Orogen. The magma formation of the near-surface

24
intruded rhyolite is explained by lower crustal anatexis and assimilation of upper crystal
rocks. Secondary processes lead to the pneumatolytic hydrothermal alteration of the rhyolite
(Flick, 1986; Arikas, 1964).
Eastern Lachlan Fold Belt
Granite samples collected from the Eastern Lachlan Fold Belt/Australia form the fourth
group. The study of these samples contributes to the DFG project “Morphogenesis and
tectonic setting of magma emplacement in the Eastern Lachlan Fold Belt, Australia” in co-
operation with the University of New South Wales, Sydney, Australia (Trzebski et al., 1999).
The northern part of the eastern Lachlan Fold Belt evolved in an island-arc setting during the
lower Palaeozoic (Powell, 1984; Coney, 1992; Collins and Vernon, 1992; Gray et al., 1997).
The Carcoar, Barry and Sunset Hills granites intruded the multiply deformed Ordovician
metasedimentary and volcaniclastic rocks during the Silurian.
The I-type Carcoar Granodiorite is a fine- to medium-grained, enclave-containing,
hornblende-biotite granodiorite to tonalite. The I-type Barry Granodiorite is a meridionally
elongated body (5 x 12 km), consisting mainly of hornblende and biotite granodiorite of
tonalitic composition with minor microtonalite enclaves (Lennox et al., 1998). The Sunset
Hills Granite shows an S-type aluminium saturation index (Wyborn and Henderson, 1996)
and contains 40-50% quartz, 30-40% plagioclase, 10-20% biotite and less than 10%
muscovite (Lennox et al., 1998). All three granites show a pervasive tectonic caused by the
multiple deformation during the Early Devonian Bowning, late Middle Devonian
Tabberabberan and Early Carboniferous Kanimblan events (Lennox et al., 1998; Trzebski et
al., 1999).
25
Table 1.1 Reference list of the sample material with origin and characteristics.
Damara Orogen
No. Sample name Lokality Formationprocess
Age Formationtemperature
Specific features
1 megaquartz Hakos Mts./Namibia
hydro-thermal
UpperProterozoic
150-250°C Megacrystals up to 60 m
2 fissile quartz Hakos Mts./Namibia
hydro-thermal
UpperProterozoic
150-250°C perfect cleavage parallel tothe positive rhombohedralfaces {1011}
3 oil-bearingquartz
GeelkopDome/Namibia
hydro-thermal
UpperProterozoic
150-250°C oil-bearing inclusion
Krušne Hory/Erzgebirge
No. Samplename
Lokality Formationprocess
Age Formationtemperature
Specific features
4 SchoenfeldRhyolite
EasternErzgebirge/Germany
magmatic 310±5 Ma >850°C phenocysts
5 TepliceRhyolite(TPR2)
EasternErzgebirge/Germany
magmatic 308±2 Ma(Lobin1983)
>850°C phenocysts
SH22 SG1SchellerhauGranite
EasternErzgebirge/Germany
magmatic 300±5 Ma >650°C phenocrysts overgrown bymatrix quartz
6;SH16,SH32
SG2SchellerhauGranite
EasternErzgebirge/Germany
magmatic 300±5 Ma >650°C phenocrysts overgrown bymatrix quartz
SH18 SG3SchellerhauGranite
EasternErzgebirge/Germany
magmatic 300±5 Ma >500°C Snowball-textured quartz
Podlesidyke granite
Krušne Hory/ Germany
magmatic 300±10 Ma >500°C Snowball-textured quartz
7 EibenstockGranite
WesternErzgebirge/Germany
magmatic 300±10 Ma 695±6 °C1
(Solidus-temp.;Thomas1994a)
phenocrysts over-grown bymatrix quartz
8 Aue Granite WesternErzgebirge/Germany
magmatic 325±5 Ma(FörsterandTischendorf 1994)
>650°C phenocrysts over-grown bymatrix quartz
Ju 10 KrásnoGranite
Hub Stock,SlavkovskýLesMts./CzechRepublic
magmatic UpperCarbo-niferous
>650°C phenocrysts overgrown bymatrix quartz

26
Krušne Hory/Erzgebirge
No. Samplename
Lokality Formationprocess
Age Formationtemperature
Specific features
Ju14 KrásnoMicro-granite
Hub Stock,SlavkovskýLesMts./CzechRepublic
magmatic UpperCarbo-niferous
>650°C phenocrysts overgrown bymatrix quartz
9 vein quartz Hub Stock,SlavkovskýLesMts./CzechRepublic
hydro-thermal
<300 Ma <500°C Berg crystals (3 mm)
Oberpfalz/NW Saxony/Harz/Odenwald
No. Sample name Lokality Formationprocess
Age Formationtemperature
Specific features
10 WachtelbergRhyolite
FrankenbergMts./Germany
magmatic Rotliegen-des
>850°C phenocrysts
11 BeuchaRhyolite
NW Saxonia/Germany
magmatic Rotliegen-des
>850°C phenocysts
12 FlossenbuergGranite
Oberpfalz/Germany
magmatic 312±3 Ma(Rb/Sr WR;Siebel et al.1997)
>650°C euhedral matrix quartz
13 leucosomequartz
Oberpfalz/Germany
pegmatitic ~320 Ma(Peak meta-morphose)
~600°C clear crystals
14 RambergGranite
Harz/Germany
magmatic 290 - 295Ma(Rb/Sr WR;Schust etal. 1991)
>650°C phenocrysts over-grown bymatrix quartz
15 WeinheimRhyolite
Odenwald/Germany
magmatic Rotliegen-des
>850°C phenocyst
Eastern Lachlan Fold Belt
No. Samplename
Lokality Formationprocess
Age Formationtemperature
Specific features
AU4-AU7
BarryGranodiorite
EasternLachlan FoldBelt/Australia
magmatic EarlySilurian
752±37°C phenocrysts overgrown bymatrix quartz
AU9-AU16
Sunset HillsGranite
EasternLachlan FoldBelt/Australia
magmatic EarlySilurian
>700°C phenocrysts overgrown bymatrix quartz
AU28-AU55
CarcoarGranodiorite
EasternLachlan FoldBelt/Australia
magmatic EarlySilurian
766±36°C euhedral matrix quartz

27
2 Fundamentals of cathodoluminescence
The term cathodoluminescence (CL) designates the luminescence induced by electron
bombardment. The interaction of the electron beam with the sample gives rise to a number of
effects: the emission of secondary electrons (SE), back-scattering of electrons (BSE), electron
absorption (“sample current”), characteristic X-ray, and CL emission (Fig. 2.1). Most energy
of the beam is converted into heat. The penetration depth of electrons and accordingly, the
excitation depth depends on the energy of the electrons (10-20 keV) and is in the range of 2-8
µm (e.g. Marshall, 1988).
Luminescence can be divided into two: intrinsic CL which is characteristic of the host lattice
and extrinsic CL which results from impurities. Larger defects such as dislocations and
clusters may also effect the CL.
Intrinsic luminescence is enhanced by non-stoichiometry (vacancies), structural imperfections
(poor ordering, radiation damage, shock damage), and impurities (non-activators), which
distort the crystal lattice. Some trace elements like Ti may provoke both intrinsic and extrinsic
CL. However, the role of Ti in enhancing intrinsic CL is a matter of discussion. Ti-rich
feldspar and quartz show blue CL, but the effective state of Ti charge and lattice position is
thin section
Augerelectrons
X-rays
cathodoluminescence
incident electron beam
heat
backscatteredelectrons
secondaryelectrons
samplecurrent
unscatteredelectrons
elasticallyscatteredelectrons
inelasticallyscatteredelectrons
Fig. 2.1 Schematic representation
of processes resulting from electron
bombardment (modified after Potts
et al., 1995). Note that the
emissions come from different
depths, e.g. CL and X-rays are
emitted from deeper section levels
than secondary electrons.
28
not answered (Marshall, 1988). Both the use of the term “activator” and the term “intrinsic”
have been used to characterise the CL of minerals containing Ti.
The impurities, responsible for the extrinsic luminescence, are called activators. Elements are
referred to as sensitizers when their presence is necessary to create a luminescence centre with
an activator. The latter is transferred into an excited state which results in a sensitized
luminescence (e.g. Waychunas, 1988; Remond et al., 1992). The luminescence properties are
mostly the result of luminescence-activating ions such as transition metals, rare-earth
elements or actinides. Changes of the crystal field properties i.e., field strength, site
symmetry, and coordination number, cause differences in the magnitude of the energy levels
of the activator elements and also the splitting of closely spaced levels. Therefore the CL
spectrum is not a characteristic property of the activator but a property of the mineral. The CL
intensity generally increases with the concentration of the activator to a maximum and then
decreases. This decrease is referred to as concentration quenching (self-quenching). It can be
explained by the transfer of a part of the excitation energy to other activator ions which is
more effective than luminescence emission. Some ions (quenchers) such as Fe3+, Fe2+, Co2+,
and Ni3+ show broad and intense charge transfer bands in the absorption spectrum and cause
quenching of the luminescence of activators with interfering emission bands. The quenching
by ions with intense charge transfer bands especially influences the visible and near UV
spectral ranges, whereas luminescence emissions in the IR are more or less unaffected.
Apparently, the quenchers cause new closely-spaced energy levels so that the electron can
easily return to the ground state with the emission of low-energy photons (IR) or by losing
heat energy (Marshall, 1988).
Quenching due to lattice defects may occur if the crystal structure is damaged by mechanical
processes, radiation, growth defects or impurities. These lattice defects create new energy
levels between the conduction and the valence bands resulting in absorption of the excitation
energy, non-luminescent energy transfer or low frequency emission.
Another process which may be responsible for lowering the luminescence intensity is thermal
quenching. Principally, heating of a sample results in the release of electrons and accordingly
in the excitation of thermoluminescence. During irradiation of a sample with high-energy
particles (e.g., electrons, ions) a part of the energy can be transformed into heat which
influences the energy transfer and non-luminescent transitions. As a consequence, the
luminescence intensity decreases during electron bombardment and then stabilises.

29
Cathodoluminescence is considered to form in 3 steps: (1) the absorption of excitation energy
and stimulation of the atoms into an excited state, (2) transformation and transfer of the
excitation energy, and (3) emission of light and relaxation to a non-excited state (Marfunin,
1995). The first two steps mainly depend on the mode of excitation, whereas the third step
depends on the character of specific luminescence centres.
In crystals, complex interaction between atoms leads to the broadening of the energy levels
into bands. In insulators like quartz, a broad gap, called the forbidden gap, exists between the
valence band and the conduction band. A precondition for cathodoluminescence is the
existence of activators (impurity ions, lattice defects), which cause and occupy discrete
energy levels in this forbidden zone. Luminescence centres can be differentiated by their
energy position within the forbidden gap and divided into into electron traps near the
conduction band (donor level) and recombination sites in the vicinity of the valence band
(acceptor level) (e.g. Marfunin, 1979).
Fig. 2.2 Processes of charge transfer and luminescence production in crystals after Krbetschek et al. (1997).
CL involves electron radiation induced excitation of an electron from the ground state to an
excited state. The following de-excitation leads to a state of lower energy within the forbidden
gap. Excitation results in the trapping of an electron or in the recombination with a
luminescent or a non-luminescent centre (Fig. 2.2a). In the case of a luminescent transition, a
photon is emitted. If the atom or ion is placed in a crystal lattice, non-luminescent transitions
are possible due to absorption or emission of lattice vibrations. A trapped electron can be
excited again, transits into the conduction band and may recombine with an activator element
level under emission of a photon (Fig. 2.2b). In the case of a small energy difference between
electron trap and activator level, a direct luminescent transition of the electron to the
conduction band
forbidden gap
valence band
luminescence luminescence luminescence
a b c d

30
recombination centre is possible (Fig. 2.2c). In figure 2.2d the excitation of several energy
levels and the subsequent relaxation and luminescence emission of a single activator is
shown.
2.1 Point defects in quartz
Quartz lattice defects can be grouped into three types according to their structure and size: 1)
point defects (most important for luminescence studies), 2) dislocations, 3) inclusions and
clusters of foreign minerals and volatiles. During crystallisation the impurity and lattice
defects are generally incorporated as charge compensated, diamagnetic defect centres. Natural
radioactivity as well as the electron radiation during experiments causes the transformation of
diamagnetic precursor centres into paramagnetic centres. The irradiation changes the defects
by trapping an electron or creating a hole at the site of a precursor defect. Additionally,
Fig. 2.3 Synopsis of the most common lattice defects in quartz modified after Götze (2000).
atomic displacements from the normal bonding (defect-free) sites may form by radiolysis
processes (Kalceff and Phillips, 1995).
EPR studies have identified about 20 different paramagnetic defect centres in quartz which
can be divided into 2 main types: 1) vacancy centres, which are subdivided into electron
O O
OOHOO
OOO
O
OO
OOOO
OO
O
OO O O
O
OO
O
O
O
O O
O
O
O
O OO
O
O
O
O
OO
Na+
Li+Li
+
Si
Si
Si Si
Si
Si
Si Ti
Si
Si Si Si
Si
Si
Si
Si
Si
(+)
(+)
(+)
(-)
(-)
(-)(0)
(0)
Si Fe
Al
Si
Si
SiSi
Si
Si
SiOOO
OHOHOOO
peroxy linkageperoxy
radical
oxygenvacancy
siliconvacancy
substitutionalisoelectroniccation
substitutionalheteroelectronicand interstitialcation
non-bridgingoxygen holecentre
non-bridgingoxygen
silanol groups
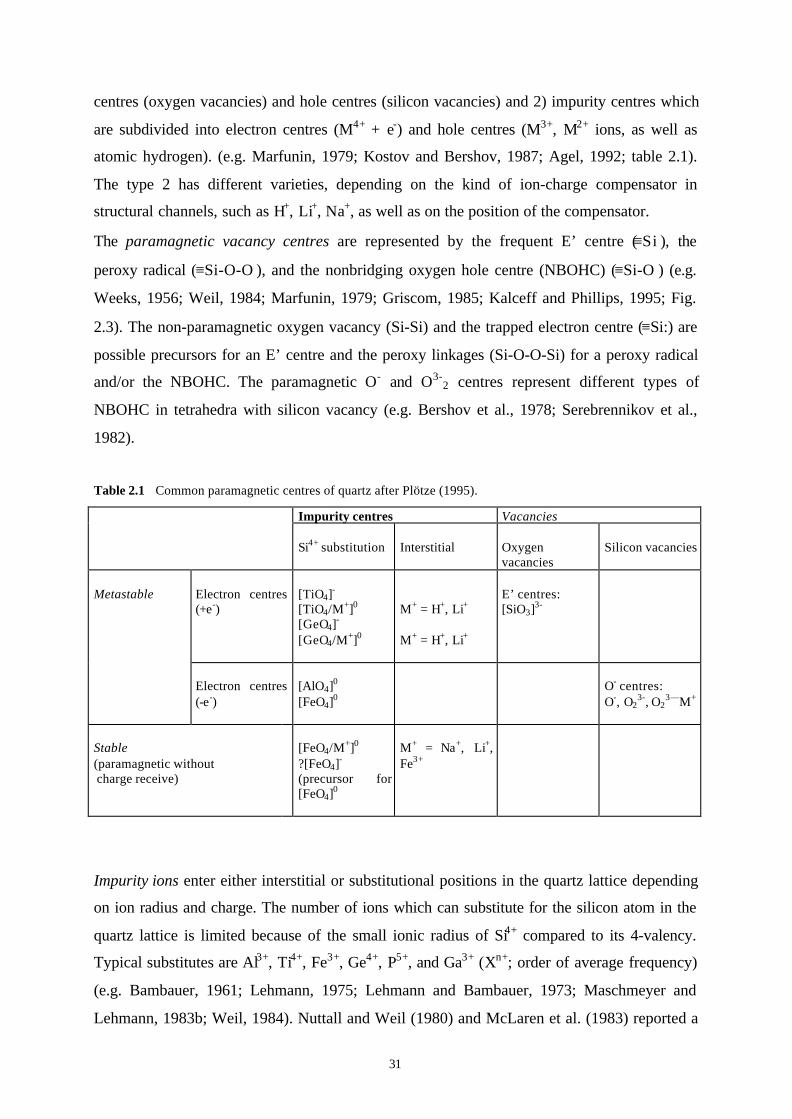
31
centres (oxygen vacancies) and hole centres (silicon vacancies) and 2) impurity centres which
are subdivided into electron centres (M4+ + e-) and hole centres (M3+, M2+ ions, as well as
atomic hydrogen). (e.g. Marfunin, 1979; Kostov and Bershov, 1987; Agel, 1992; table 2.1).
The type 2 has different varieties, depending on the kind of ion-charge compensator in
structural channels, such as H+, Li+, Na+, as well as on the position of the compensator.
The paramagnetic vacancy centres are represented by the frequent E’ centre (≡Si⋅), the
peroxy radical (≡Si-O-O⋅), and the nonbridging oxygen hole centre (NBOHC) (≡Si-O⋅) (e.g.
Weeks, 1956; Weil, 1984; Marfunin, 1979; Griscom, 1985; Kalceff and Phillips, 1995; Fig.
2.3). The non-paramagnetic oxygen vacancy (Si-Si) and the trapped electron centre (≡Si:) are
possible precursors for an E’ centre and the peroxy linkages (Si-O-O-Si) for a peroxy radical
and/or the NBOHC. The paramagnetic O- and O3-2 centres represent different types of
NBOHC in tetrahedra with silicon vacancy (e.g. Bershov et al., 1978; Serebrennikov et al.,
1982).
Table 2.1 Common paramagnetic centres of quartz after Plötze (1995).
Impurity centres Vacancies
Si4+ substitution Interstitial Oxygenvacancies
Silicon vacancies
Electron centres(+e-)
[TiO4]-
[TiO4/M+]0
[GeO4]-
[GeO4/M+]0
M+ = H+, Li+
M+ = H+, Li+
E’ centres:[SiO3]3-
Metastable
Electron centres(-e-)
[AlO4]0
[FeO4]0O- centres:O-, O2
3-, O23—M+
Stable(paramagnetic without charge receive)
[FeO4/M+]0
?[FeO4]-
(precursor for[FeO4]0
M+ = Na+, Li+,Fe3+
Impurity ions enter either interstitial or substitutional positions in the quartz lattice depending
on ion radius and charge. The number of ions which can substitute for the silicon atom in the
quartz lattice is limited because of the small ionic radius of Si4+ compared to its 4-valency.
Typical substitutes are Al3+, Ti4+, Fe3+, Ge4+, P5+, and Ga3+ (Xn+; order of average frequency)
(e.g. Bambauer, 1961; Lehmann, 1975; Lehmann and Bambauer, 1973; Maschmeyer and
Lehmann, 1983b; Weil, 1984). Nuttall and Weil (1980) and McLaren et al. (1983) reported a
32
hydrogenic trapped hole-center with four hydrogen atoms on a silicon position. Large open
channels (smallest O-O diameter 3.55 ? ) thread through the quartz structure parallel to the c-
axis and offer locations for interstitial cations such as H+, Na+, K+, Li+, Fe2+, Cu+, Co2+, Ag+
... (Mn+; order of average frequency). They act as charge compensators for the substitutional
X3+ and X5+ ions. The possible incorporation of other cations in interstitial position (e.g. Ni2+,
Al3+, Fe3+, Co3+, Cr3+, Ti4+) is a matter of discussion (Lehmann and Bambauer, 1973a, b;
Weil, 1984).
The paramagnetic impurity centres which are built by tetravalent ions (mostly Ti4+ and Ge4+)
cause the formation of the diamagnetic [XO4]0 centres. These centres act as a precursor for the
paramagnetic [XO4]-, which develops during ionisation irradiation (table 2.1). At room
temperature these centres bind diffusing M+ cations such as H+, Li+, Na+ forming a
paramagnetic [XO4/M+]0 centre (Wright et al., 1963; Rinneberg and Weil, 1972; Mackey,
1963; Rakov et al., 1985; Agel, 1992; Weil, 1993). The trivalent ions build up diamagnetic
[YO4/M+]0 centres associated with an adjacent charge compensating cation M+ (H+, Li+, Na+).
The paramagnetic defects are metastable and decay depending on the temperature. The
closure temperature varies e.g. 55-82°C for the [TiO 4/M+]0 centre and 49-64°C for the [AlO 4]0
centre (Grün et al., 2000).
2.2 The state of water in quartz
Apart from Al, bonded water in the quartz lattice in the form of H+, OH- and H2O is the most
important impurity. Brunner et al. (1961) proposed that water can be incorporated into the
quartz lattice according to the reaction: -Si-O-Si- + H2O = -Si-OH + HO-Si-. This is a
preferred stress-induced mechanism and referred to as “hydrolytic weakening” (e.g. Griggs
and Blacic, 1965; Griggs, 1967; Fig. 2.4a). Calculations of total energy indicate that this
reaction which uses an energy of ~0.1 eV is spontaneous for a Si-O bond stretched beyond
4% of its normal bond length (Heggie, 1992). Another possible configuration is described by
Nuttall and Weil (1980) and McLaren et al. (1983), who assumed that hydrogen is

33
Fig. 2.4 Models of the structural state of water in the quartz lattice. a – hydrolytic weakening according to
Griggs (1967); b - (4H)Si defects according to McLaren et al. (1983) where 4H+ substitutes for Si4+; c- model of
aqua complexes after Stenina et al. (1988). The incorporated water molecule forms weak donor-acceptor and
hydrogen bonds with the surrounding matrix. This bonds break during electron radiation.
O O O
Si H Me
O O O Me O O
Si H Me
O O O
n+
m+
m+
-
-
+
+
O O O
Si e Me
O O Me O O
Si e H O Me
O O O
n+
m+
m+2
electron
radiation
Si
O HSi O H H O Si H O
Si
Si Si Si
H O O H O H O H H O H Si O
Si Si
Si Si
O O H HSi O H H O H H O Si H H O O
Si Si
hydrolyticweakening(Griggs, 1967)
(4H) - defects (McLaren et al., 1983)
2SiO -H O-Me 2Me O aqua complexes(Stenina et al., 1988)
Si
bondstretching
a
b
c 3 2n+ m+
4

34
incorporated in the quartz structure by means of (4H)Si defects where 4H+ substitutes for Si4+
(Fig. 2.4b). The infrared absorption spectra of natural quartz crystals typically exhibit sharp
absorption peaks between 3000 and 3700cm-1 which are associated with hydrogen and
hydroxyl acting as a charge compensator of Al3+/Mn+ (e.g. Brunner et al., 1961; Kats, 1962;
Bambauer et al., 1963). Kronenberg et al. (1986) showed that the solubility of water in the
quartz lattice depends on the Al content. Maschmeyer and Lehmann (1983a) proposed a
model where two OH goups are neighbouring substitutional X3+ and interstitial Mn+. Based on
transmission electron microscopy (TEM), X-ray microanalysis and EPR Stenina et al. (1988,
1995) showed that the trace substitutional X3+ and related compensating Mn+ create parts of
aqua complexes and clusters in the form of 2SiO 3-H2O-Mn+2Xm+O4, where Xm+ is mostly Al3+
and Fe3+ and Mn+ mostly Li+ and Na+ (Fig. 2.4c). The tetrahedrally charged water molecule is
built between two defective positively charged SiO 3+ tetrahedra and the two defective
negatively charged [Xm+O4] tetrahedra. Mn+ cations enter interstitial position as charged
compensators. This scheme of heteroisomorphic substitution Mn+Xm+ for Si4+ is typical for
quartz. The incorporated water molecule forms weak donor-acceptor and hydrogen bonds
with the surrounding matrix. This tetrahedrally-charged water can be revealed in the IR-
spectrum as molecular water and hydroxyl. Under electron beam irradiation the aqua
complexes become visible by TEM in form of several microns small, non-crystalline (gel
like) micro-areas with diffuse boundaries.

35
3 Cathodoluminescence equipment
3.1 Sample preparation
In this CL study thin sections with a thickness of 250 µm were used so as to provide
demountable thin sections on which to carry out LA-ICPMS, FTIR spectroscopy, EPMA, and
CL on the same area of the quartz samples. The laser of the ICPMS ablated craters 100 – 150
µm in depth and for the FTIR spectroscopy demounted thin sections polished on both sides
are necessary.
The first stage of sample preparation consists of cutting the section, which was mounted on a
glass slide with epoxy resin. Subsequent polishing was carried out with progressively finer
grades of abrasive (carborundum). The final stage involves polishing with diamond paste with
a grade of 0.3 µm. The samples were thoroughly cleaned. The polished surface was mounted
on a standard glass slide (48x24x2.8 mm) with Akemi Mamorkitt 1000. The other glass slide
was removed and the procedure of polishing was repeated until a section thickness of 250 µm
was reached. For sample temperature measurements during CL and FTIR spectroscopy the
section was removed from the glass slide with Xylol. In addition, a number of thin sections
were chemically polished with a OP-S suspension of different granularities (1 µm and 3 µm)
in order to test the effect of the surface quality on the CL properties.
Quartz being a non-conductor, requires a conductive coating to prevent charging under
electron bombardment. The preferred coating for CL studies is carbon. It is also the best
choice for X-ray analysis, because has a minimal effect on the X-ray spectrum. However, it is
not ideal for SEM imaging, owning to its low secondary electron field. The coating was done
at standard conditions to a thickness of about 15nm to avoid variations in CL-intensity.

36
3.2 Optical CL
Cathodoluminescence microscope HC3-LM
The commercially produced hot-cathodoluminescence microscope (HC1-LM) after Neuser et
al. (1995) is provided with a high-vacuum chamber (<10-5 mbar) and uses an acceleration
voltage of 14keV (Fig. 3.1). The HC1-LM is a development of the prototype constructed at
the IGDL Göttingen 1987 (Neuser, 1988) according to the model of Zinkernagel (1978). The
electron gun operates as a “hot cathode”, i.e. the electrons are emitted from a heated filament.
In a “cold cathode” CL microscope the electron beam is generated during discharge between
the cathode and anode in an ionised gas. The hot-cathode technique provides a considerably
greater beam stability and CL intensity than the cold cathode instruments and thus is suitable
for investigation of the weakly luminescent quartz. The electron gun directs a focused beam
upwards onto an inverted thin section; the CL is viewed through the sample from above. The
electron beam with a diameter of ca. 4.8 mm irradiates the thin section surface with a current
density of ca. 10 mA/mm2. The basis of the HC3-LM is a polarisation microscope model
OLYMPUS BX30M with some modifications, for instance, the vacuum sample chamber is
mounted in place of the sample stand. The polarisation objectives have a
magnification/numerical aperture of 5x/0.15, 10x/0.30, 20x/0.40. The high vacuum of the
sample chamber is attained by a Diffstak oil diffusion pump combined with an Edwards
rotary vane pump.
The TRIAX 320 Spectrograph
CL spectra were recorded with a triple-grating spectrograph TRIAX 320 provided with a
liquid N2-cooled Charge Coupled Device (CCD) camera (Fig. 3.2). The system is well suited
to applications with very low signals such as the CL of quartz. The spectrograph is attached to
the CL microscope ocular with a quartz fibre guide of 1.5 m length (transmission range 200-
900 nm). The quartz fibre guide is coupled via a fibre optic interface to the entrance slit of the
TRIAX 320. The system is controlled by an external PC using the software programs
HWINIT for hardware initialisation and SpectraMax for Windows for data processing.
The triple-grating spectrograph is equipped with one ruled grating (100 lines/mm) and two
blazed holographic gratings (1200 and 1800 lines/mm) which are mounted on a rotating triple
grating turret. The higher spectral resolution obtained with the 1200 and 1800 lines/mm
gratings results in small ranges of the recorded spectra, namely 70 nm and 40 nm, respectively
(Table 3.1).

37
PO
WE
R
TR
IAX
320
32
0
NIK
ON
NIK
ON
253
quar
tz
glas
s fib
re
guid
e
com
pute
r to
wer
com
pute
r sc
reen
with
S
pect
roM
ax fo
r W
indo
ws
LN c
oole
d C
CD
ca
mer
a
2
CC
D
dete
ctor
co
ntro
ller
TR
IAX
320
im
agin
g sp
ectr
omet
er
Diff
stak
oil
diffu
sion
pum
p
Edw
ards
rot
ary
vane
pum
p
NIK
ON
M
icro
flex
cont
rol b
ox
phot
ogra
phic
at
tach
men
t N
IKO
N
Mic
rofle
x 12
Pow
er s
uppl
yH
C3-
LM C
L m
icro
scop
e
Ele
ctro
n gu
n
Fig.
3.1
C
atho
dolu
min
esce
nce
equi
pmen
t HC
3-LM
with
TR
IAX
32
0 sp
ectro
grap
h an
d ph
otog
raph
ic M
ilcro
flex
atta
chm
ent a
t the
C
ente
r of E
arth
Sci
ence
s G
öttin
gen.
(1) -
con
figur
atio
n fo
r spe
ctra
l an
alys
is; (
2) -
conf
igur
atio
n fo
r pho
togr
aphi
c do
cum
enta
tion.

38
Table 3.1 Specification of the used optical gratings.
Grating 100 lines/mm 1200 lines/mm 1800 lines/mmWorking range 250 – 900 nm 190 – 1200 nm 250 – 900 nmScanning range per recording 1000 nm 70 nm 40 nmSpectral resolution 0.5 nm 0.06 nm 0.02 nmWavelength position accuracy 1 nm 0.3 nm 0.1 nm
The back-illuminated CCD camera with UV-AR-coating has a spectral response between 200
and 1050 nm (Fig. 3.3). The CCD detector array is built up of an area of silicon photodiodes
divided into a 2-dimensional matrix of pixels. Each pixel integrates a charge arising from the
photoelectric effect caused by the incident light. The charges of adjacent pixels are kept
separated by a grid of electrodes that confine the changes by electrostatic force. The pixel
charge is controlled and read out by the detector interface unit (DIU). The signal from the
CCD is processed, amplified and converted to digital datapoints by electronics in the DIU and
transferred to the host PC.
1800
100
triple-grating turret
LN cooled CCD camera
2 focus mirror
torroidal collimating mirror
quartz glass guide
fiber optic interface
stepper motor
The CCD array head is cooled by liquid nitrogen which works with a temperature below –
140°C. The cooling is necessary to lowering the dark current and to obtain a better
signal/noise ratio at low photon emission rates.
Fig. 3.2 Top view of theSpectrum One TRIAX320 spectro-graph.

39
A mercury lamp was attached to the entrance slit of the spectrometer in order to calibrate the
wavelength. A difference between the position of the measured peak and the known mercury
peak at 546.1 nm was corrected by setting the wavelength difference into the lines
“MultiAUtoCaloffset 0 =” (1200 lines/mm grating), “MultiAUtoCaloffset 1 =” (1800
lines/mm grating), and “MultiAUtoCaloffset 2 =” (100 lines/mm grating) of the file
MONO1.ini.
The CL spectra were recorded for the same instrumental setting: a filament current of 0.18 nA
using the objective 20x/0.40. The analysed area was 800 µm in diameter. The 100 lines/mm
grating was used to fully detect the emitted spectra of visible light between 400 and 900 nm
(3.1 - 1.4 eV). The 1200 lines/mm grating provided high-resolution spectra of 70 nm width
sectors. The high wavelength resolution obtained by using the 1800 lines/mm grating was not
suitable as the half-width of the quartz CL bands varies between 20 and 100 nm.
The time-resolved spectra were recorded within 40 s (100 lines/mm grating) and of 60 s (1200
lines/mm grating) using the maximum entrance slit width of 2 mm and an acquisition time of
20 and 30 s, respectively. The system needed twice the acquisition time to accumulate the low
emission intensity and to measure the background. The intensities are integrated over the
duration of exposure. The first spectrum was recorded immediately after the initialisation of
the electron bombardment because of drastic CL change of quartz during the first seconds of
radiation (Fig. 3.4). Subsequent spectra were recorded in steps of one minute or several
minutes.
The change of the CL intensity of the 1.96 and 2.79 eV emissions during electron radiation
was measured with the f/3.4 Grating Monochromator at a speed of 10 mm/min using the CL
Fig. 3.3 Spectralsensitivity of the TRIAX320 CCD-camera

40
microscope after Zinkernagel (1978) at the University Göttingen (10 keV, 0.2 nA). In
contrary to the TRIAX 320 the monochromator allows the record of the CL intensity change
from time zero of electron radiation. The CL intensity drastically changes during the first
seconds of electron radiation and its recording is of interest for solving the causes of CL.
The photographic documentation was carried out by a NIKON Microflex UFX-II system
equipped with a NIKON FX-35A reflex camera (Fig. 3.1). Colour slides of the luminescent
images were taken with high-sensitive films KODAK Ektachrome 400 HC (400 ASA) and
KODAK Ektachrome 1600 (1600 ASA). High-sensitive films were chosen because of the low
CL intensities. The exposure times were of 100 – 250 s for the 400 HC and of 10 – 30 s for
the 1600 using the 10x/0.30 objective.
Fig. 3.4 Used timesteps for time-resolvedspectrum recording withthe 100 lines/mm (a) and1200 lines/mm grating(b). The grey squaresrepresent the durationwhich is necessary forspectrum acquisition.

41
3.3 The scanning electron microscope (SEM) CL
The scanning electron microscope (SEM) is along with the light microscope the most
important imaging instrument. The scanning electron microprobe utilises a scanned electron
beam with a small spot size normally around 2 µm in diameter. By scanning the electron
beam, synchronized with the X, Y deflection of a display oscilloscope, and modulating the
display oscilloscope intensity with the photomultiplier output, a magnified map of the CL of
the specimen is obtained. Total photomultiplier output intensities were used for the intensity
function.
The SEM-CL offers advantages over the conventional (optical) CL microscopy for CL studies
(Grant, 1978; Tovey and Krinsley, 1980). The main advantage is the larger spatial resolution
of ≤1µm2. Other advantages are the higher magnification, the capability of combining CL and
SEM investigations like back scattered electron (BSE) imaging and microanalytical analysis
on the same area. The possibility of increasing the power density over small sample areas is
useful for samples with low CL intensity like quartz. A disadvantage is the monochromatic
(grey scale) image.
Two scanning electron microscopes equipped with different CL detectors, the Cambridge
Instruments 250-MK3 with a S20-Extended photomultiplier and the JEOL JXA 8900 with a
CLD40 R712 photomultiplier, were used for the study of internal growth patterns and
secondary CL structures within individual quartz crystals. The voltage and sample current for
both SEM was 15 keV and 5-15 nA. A quartz glass lens in front of the S20-Extended detector
collects the emitted light of the sample; the photomultiplier of the JEOL system works
without additional lenses and mirrors. Images were collected from the JEOL system using
slow beam scan rates of 20 s at processing resolution of 1024x860 pixels and 256 grey levels.
The documentation of the CL images at the 250-MK3 were carried out with a photocamera
with Agfapan APX 25 films and by using slow beam scan rates of 250 sec.
The detectable wavelength for both photomultipliers ranges from 380 to 850 nm. The lower
limit of detection is 380 nm, which is determined by the absorption of the lead glass plate in
front of the photomultipliers. The maximum wavelength responses are at 600 nm for the
CLD40 R712 and at 420 nm for the S20-Extended photomultiplier. The spectral sensitivity of
both photomultipliers are shown in the figure 3.5.
Remarkable differences between the images produced by the photomultipliers have been
found (Fig. 3.6). The S20 Extended photomultiplier is more sensitive for blue emissions and
was therefore used for imaging of samples with dominant blue luminescence, whereas the

42
CLD40 R712 photomultiplier was preferred to contrast reddish luminescent secondary
textures. Dark contrasted areas of quartz SEM-CL images always correspond to red to reddish
brown CL-colours and bright areas correspond to blue to violet colours. The luminescence
colours were checked by optical CL prior to or after SEM-CL investigations.
0
10
20
30
40
50
60
70
200 300 400 500 600 700 800 900
wavelength (nm)
S20 Extended
CLD40 R712
Fig. 3.5 The spectral
sensitivity characteristics of the
Cambridge Instruments S20
Extended and the JEOL CLD40
R712 photomultipliers.
Fig. 3.6 Unprocessed SEM-CLimages of a vein quartz (sample 9)using different photomultipliers. a -Cambridge Instruments S20Extended photomultiplier; b -JEOL CLD40 R712photomutliplier.

43
Image processing was carried out using the software Optimas 6.0 for Windows. Starting with
an unprocessed CL image a typical sequence of processing steps was: (1) producing a grey
level histogram (2) selection of the grey level range responsible for contrasting of structures
within the quartz crystal (3) extension of the chosen grey level range to 256 grey levels (4)
treatment of the image with several filters for sharpening and smoothing (5) determination of
grey-scale profiles e.g. along trace element traverses of zoned quartz crystals, as shown in
figure.
3.4 Mathematical treatment of CL-spectra
Spectral data acquisition was carried out by using the software SpectraMax for Windows. The
emitted light was recorded in nanometer (nm). The emission bands are not immediately
obvious from visual inspection of the experimental data due to the close proximity of broad
emission bands which results in complex peak overlapping. The asymmetry of the broad
peaks and the shift in the different quartz samples suggests the presence of several bands. The
processing steps for spectra analysis were the following:
1) For processing of the spectra the data were exported as ASCII data into the EXCEL
program.
2) The spectra were corrected for the sensitivity of the spectrometer (Fig. 3.3). For that the
measured intensities were multiplied by the factor of efficiency.
3) Spectral emission bands normally have a Gaussian shape if plotted in energy space
(Kalceff and Phillips, 1995). Therefore, the data in nanometer (nm) were converted into
electron volts (eV) according: E = 1239.8/?, where E is the energy (eV), and ? the
wavelength (nm).
The shape of the intensity distribution of an emission band plotted versus the light energy
is described by the Gaussian function. The emission intensity I(E) at the energy E (eV) of
an emission band centred at a is described by the following equation:

44
1 - (E – a)2/2 s 2
I(E) = If ———— e (3.3) s v 2p
where If = intensity factor; E = energy (eV); a = position of the maximum of the
Gaussian curveand centre of symmetry; s = distance from a to the turning point of
the Gaussian curve (Fig. 3.7).
0
0.2
0.4
0.6
0.8
1
-3 -2 -1 0 1 2 3= aE
I(E)
σ = 1
σ = 0.5
σ = 0.2
The position (a), width (s), and size (If) of the Gaussian curves were calculated and
adjusted in such a way that the sum of the individual components equals the recorded
spectrum. The band positions (a) were determined by manual setting of the peak
configurations using the high-resolution spectra recorded with the 1200 lines/mm grating.
The intensity factor If corresponds to the area under the Gaussian curve (the integral of
Gaussian distribution from - 8 to + 8 is 1). If was used to determine ratio and percentage
of the individual emission bands of the total spectra between 1.4 and 3.1 eV recorded with
the 100 lines/mm grating.
Fig. 3.7 Gaussian curves for a =
0, If = const., and different s (0.2,
0.5, and 1).

45
4 Microanalysis of trace elements and defect centre
characterisation in quartz
Amongst the suite of microanalytical techniques commonly used for trace element
determination, secondary ion mass spectrometry (SIMS), electron probe micro analysis
(EPMA), and laser ablation inductively coupled plasma mass spectrometer (LA ICP-MS) can
provide element analysis data with a high sensitivity and a high spatial resolution, which
allows the determination of element zoning of crystals. Therefore, the three methods were
chosen for the determination of the trace element distribution in quartz. The electron
paramagnetic resonance (EPR) and the Fourier-transform infrared (FTIR) spectroscopy are
powerful techniques available for the characterisation of defects centres in quartz. Clearly, no
single instrument gives a complete characterisation of a mineral, but if the five techniques are
employed in a complementary fashion, the chances for success are better.
The LA ICP-MS has the potential to determine most elements of the periodic system at the
part-per-million level in solids with a spatial resolution down to 20 µm. The instrument
allows fast and accurate analysis of most important trace elements in quartz (Li, Al, Ti, Cr,
Mn, Fe, and Ge). A laser beam with larger diameter and higher energy ablates more material
and results in lower detection limits. On the other hand the trace element distribution of zoned
quartz crystals requires highest spatial resolution. Therefore a compromise between detection
limit and spatial resolution has to be found. For a mean ablation crater size of about 20 µm the
detection limit for LA ICP-MS are comparable with those of EPMA.
The EPMA is based on X-ray emission of a solid bombarded with a focused electron beam.
Characteristic X-rays are analysed according to their wavelength, the peak intensity counted
relative to a standard. The main advantages of the EPMA are the high spatial resolution of ~4
µm and the capability of combining microanalytical analysis with CL and BSE imaging.
Trace and ultra-light elements (e.g. Li) which can not be measured by EPMA can measured
by the ion microprobe. The SIMS instrument uses a focused primary ion beam to perform in
situ microanalysis of minerals in samples prepared as gold coated polished thin sections. A
very small percentage of the sample material sputtered from the polished surface of the
sample is ionised, and these ions are accelerated into a mass spectrometer where they are
separated according to their mass. Nearly all elements from H to U can be detected and many
can be analysed quantitatively down to part-per-million levels, or lower. 16O- beam currents

46
are required for trace element analysis and beam diameters of 30 µm allow the determination
of the chemical zoning of minerals.
The EPR is a powerful spectroscopic technique available for the detection and identification
of paramagnetic defects. Paramagnetic defects arising from impurities (Al, Ti, Fe, Ge, H, P,
Cu, Ag) and oxygen and silicon vacancies are induced by natural or artificial irradiation of the
quartz lattice. EPR describes the interaction between an electronic spin submitted to the
influence of crystal field and an external magnetic field. The technique based upon the
resonance absorption of induced magnetic microwaves caused by the magnetic moment of
unpaired electrons resulting from paramagnetic defects. The determination of centres were
made using powders.
The FTIR spectroscopy of quartz allows the qualification of structural bounded water in form
of H2O molecules, hydroxyl, hydrogen-compensated aluminium and lithium defects. Records
of spectra of single points and along profiles through quartz crystals were used to determine
variations of kind and quantity of water associated defects.
4.1 Electron probe microanalysis (EPMA)
Trace elements in quartz were determined by wavelength-dispersive Electron Probe Micro
Analysis (EPMA) on the JEOL JXA 8900 operating at an accelerating potential of 15 keV, at
a beam current of 120 nA on the Faraday cup, and with a beam diameter of 7 µm. Analyses
were performed for Al, Ti, K, and Fe. Raw intensities converted into concentrations, making
appropriate matrix corrections after the phi-rho-z method by Armstrong (1991).
Measurements were carried out as single point analysis, or as line scans, yielding distribution
profiles. CL imaging was performed prior and after EPMA analysis. In this way the
measurement points in relation to the CL textures can be exactly located.
Quartz contains trace elements of at such low concentrations that a quantification by EPMA
poses a major difficulty. Therefore, particular attention had to be paid to a number of
parameters: 1) long counting time, 2) high beam current, 3) precise background measurement,
4) high polishing quality of the sample surface, and 4) carbon coating with constant thickness.
The most decisive and often underestimated is the effect of the sample surface quality on the
sensitivity of the measurement (Fig. 4.1). The increase of the Al background between
measurement 39 and 48 during sample change is caused by sample surface contamination,

47
Fig. 4.1 Variation of brutto intensities of the Al and Ti background measurements (upper minus lower
background) of three trace element profiles.
whereas the Ti background remains constant. This effect results in a decrease of the detection
limit for Al from 27 ppm to 50 ppm. Finally, for high precision and sensitivity, the high beam
current of 120 nA, the beam diameter of 7 µm, and the counting rate of 10 min per shot means
180 s per element were chosen.
The determination of element concentrations in analytical chemistry is based on repetitive
measurements and on the application of statistical methods (e.g. Miller and Miller, 1988;
Miller, 1991). In EPMA, concentrations are calculated from the difference between the
accumulated peak counts and the background (BG) at the position of the X-ray line
maximum. For extremely low concentrations only qualitative analysis is possible. The
concentration at the detection limit, CDL, as the lowest concentration of an analysed element
that can be distinguished with reasonable confidence from zero concentration of the analysed
element in a sample (blank). Ziebold (1967) suggested different definitions of the CDL, and
also Miller (1991) emphasises that a single, “correct”, definition of the limit of detection,
cannot be given and should be specified.
We used two definitions of the detection limit. The intensity (in counts) of the detection limit
(I1DL) is given in equation (4.1) (e.g. Merlet and Bodinier, 1990):
150
170
190
210
230
250
270
290
310
330
0 10 20 30 40 50
number of measurements
Sample surface contamination
0
20
40
60
80
100
120
140
0 10 20 30 40 50
number of measurements

48
I1DL = 3 σBG (4.1)
where σBG = standard deviation of the background.
To reach a probability of 95% that a peak is present, the peak counts must exceed three times
the standard deviation of the background, whereby the number of background measurements
n must be =5. I1DL was calculated for each trace element profile on the base of 12 background
measurements.
A second method for determining of the intensity of the detection limit (I2DL) is based on the
level of significance applied to Student’s t-distribution and the standard deviation obtained
from background measurements (Plesch, 1982):
I2DL = tz (P;f) s BG (4.2)
where sBG = standard deviation of the mean of the background; tz (P;f) = level of
significance of the Student’s t-distribution for binomial limitation determined by the
confidence level P and the degrees of freedom f = number of background measurements
n – 2.
For each trace element profile both I1DL and I2DL were determined. For the latter a confidence
level of 95% and 12 background measurements were used which result in the binomial level
of significance tz (P;f) of 2.228 (Table 4.1). The application of the equation (4.2) in this case
results in a lowering of IDL.
For the determination of the detection limit CDL the determination of the regression
coefficients a and b are necessary, which represent the gradients of the regression line
intensity vs. concentration of an element:
CDL = a + b IDL (4.3)
where a and b = the regression coefficients of the regression line intensity vs.
concentration.

49
The regression coefficients a and b were determined by equation (4.4) and (4.5):
? C ? I 2 - ? C I ? Ia = ————————— (4.4)
n ? I2 – (? I )2
n ? C I - ? I ? Cb = ———————— (4.5)
n ? I2 – (? I )2
where I = intensity; C = concentration of measurements; n = number of measurements.
The regression lines of intensity vs. concentration for the elements Al, Ti, K, and Fe are
illustrated in figure 4.2. The regression coefficients a and b were calculated from 273
measurements for each element. The coefficient a represents the concentration for zero counts
and should be theoretically zero. But small systematic errors of the equipment result in a shift
of the regression line (a ? 0) for Al at about 19 ppm. Consequently, the Al content calculated
by the EPMA software is generally 19 ppm to high. For the other elements a is about zero.
The concentrations of the detection limit for Al, Ti, K and Fe calculated after the equations
(4.2) and (4.3) are shown in figure 4.3 and listed in table 4.2.
Table 4.1 Level of significance of the Student’s t-
distribution for binomial limitation (Plesch, 1982).
f tz (P;f)
P = 95% P = 99%
1 12.710 63.6602 4.303 9.9253 3.182 5.8414 2.776 4.6045 2.571 4.0326 2.447 3.7077 2.365 3.4998 2.306 3.3559 2.262 3.25010 2.228 3.16912 2.179 3.05515 2.131 2.94720 2.086 2.84530 2.042 2.75050 2.009 2.6788 1.960 2.576

50
Fig. 4.2 Calculated regression coefficients a and b of regression lines of netto counts vs. element concentration.
Under ideal conditions a should be zero, but systematic errors of the equipment cause a shifting of the regression
line for Al at about 19 ppm.
56Fe48
Ti39
K27
Al
1
10
100
25 30 35 40 45 50 55 60
mass
C1DLC2DL
Fig. 4.3 Detection limits of trace
elements in quartz for EPMA. The
detection limit C1DL bases on the
calculated intensity I1DL after equation
(4.1) and C2DL on the intensity I2DL
after equation (4.2). In the case of the
EPMA the C2DL is ca. 25% lower than
C1DL caused by the level of significance
which is lower than three standard
deviations.
y = 0.3707x + 18.766(n = 273)
0
500
1000
1500
2000
2500
3000
3500
0 2000 4000 6000 8000 10000
Al (netto cts)
y = 0.6461x - 0.0283(n = 273)
0
20
40
60
80
100
120
140
0 50 100 150 200 250
Ti (netto cts)
y = 0.6924x + 0.2612(n = 273)
0
100
200
300
400
500
600
0 200 400 600 800
K (netto cts)
y = 0.6983x - 0.2349n = 273
0
100
200
300
400
500
600
700
800
0 200 400 600 800 1000 1200
Fe (netto cts)

51
Table 4.2 Detection limits CDL (ppm) of EPMA calculated after the equations
(4.2) and (4.3) with a confidence level of 95%.
Profile number
n f Al Ti K Fe
1 12 10 41.8 10.9 9.1 9.12 12 10 27.9 11.2 5.5 11.23 12 10 51.3 7.3 13.0 14.54 12 10 66.4 13.0 5.7 7.45 12 10 32.2 6.8 5.6 8.06 12 10 32.1 12.1 5.7 12.77 12 10 28.6 9.5 5.4 7.78 12 10 27.2 6.5 6.4 6.49 12 10 26.0 5.9 5.8 8.610 12 10 23.6 6.2 6.7 8.111 12 10 50.2 9.7 3.6 6.612 12 10 25.2 6.7 8.3 9.1
4.2 Laser ablation - inductively coupled plasma mass spectrometry (LA ICP-MS)
The trace element composition of quartz grains has been determined using a Laser Ablation
microsampler coupled to an Inductively Coupled Plasma Mass Spectrometer (LA ICP-MS)
model FISONS PQ2+ with “S-option”. A Nd:YAG UV-laser (266 nm) model FISONS UV
Microprobe with a laser pulse repetition rate of 5 Hz was focused onto the surface of a
polished sample. Using a laser beam energy of 2.25 mJ, the middle aperture, and an
acquisition time of 40 s, the laser ablated craters 30 to 50 µm in diameter and between 100 to
150 µm deep. The ablated sample volume per shot amounted up to 300 000 µm3 of which
approximately 80% reached the mass spectrometer and was analysed. The determination of
the optimal laser configurations was carried out by several test measurements and varying
counting rates, to reach very low detection limits, to avoid sample outbreak during ablation,
and to get craters as small as possible for better spatial resolution of the trace element
distribution (Fig. 4.4). A laser beam with larger diameter and higher energy ablates more
material and results in lower detection limits which are inversely proportional to 3rd root of
the ablation volume (Potts et al., 1995). Nevertheless, the risk that micro-inclusions within
this volume were also analysed cannot be avoided.
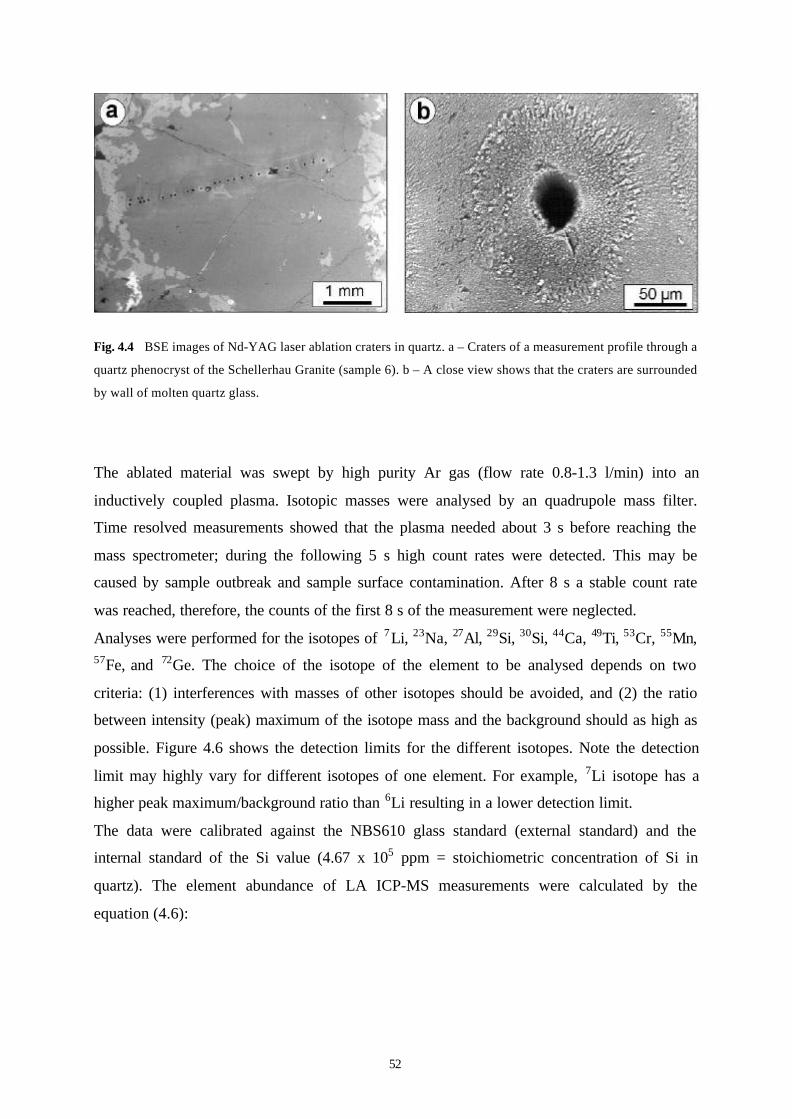
52
Fig. 4.4 BSE images of Nd-YAG laser ablation craters in quartz. a – Craters of a measurement profile through a
quartz phenocryst of the Schellerhau Granite (sample 6). b – A close view shows that the craters are surrounded
by wall of molten quartz glass.
The ablated material was swept by high purity Ar gas (flow rate 0.8-1.3 l/min) into an
inductively coupled plasma. Isotopic masses were analysed by an quadrupole mass filter.
Time resolved measurements showed that the plasma needed about 3 s before reaching the
mass spectrometer; during the following 5 s high count rates were detected. This may be
caused by sample outbreak and sample surface contamination. After 8 s a stable count rate
was reached, therefore, the counts of the first 8 s of the measurement were neglected.
Analyses were performed for the isotopes of 7Li, 23Na, 27Al, 29Si, 30Si, 44Ca, 49Ti, 53Cr, 55Mn,57Fe, and 72Ge. The choice of the isotope of the element to be analysed depends on two
criteria: (1) interferences with masses of other isotopes should be avoided, and (2) the ratio
between intensity (peak) maximum of the isotope mass and the background should as high as
possible. Figure 4.6 shows the detection limits for the different isotopes. Note the detection
limit may highly vary for different isotopes of one element. For example, 7Li isotope has a
higher peak maximum/background ratio than 6Li resulting in a lower detection limit.
The data were calibrated against the NBS610 glass standard (external standard) and the
internal standard of the Si value (4.67 x 10⁵ ppm = stoichiometric concentration of Si in
quartz). The element abundance of LA ICP-MS measurements were calculated by the
equation (4.6):

53
cpselemsample ∗ cSi29
sample ∗ cpsSi29NSB
celemsample = ∗ celem
NSB (4.6)cpsSi29
sample ∗ cSi29NSB ∗ cpselem
NSB
where celemsample = the concentration of the element of interest in the sample; cpselem
sample = count rate of
mass of element of interest in the sample; cSi29sample = assumed concentration of the 29Si isotope in the
sample (21980 ppm); cpsSi29NSB = count rate of mass of the 29Si isotope in the standard; cpsSi29
sample =
count rate of the 29Si isotope in the sample; cSi29NSB = concentration of the 29Si isotope in the standard
(15305 ppm); cpselemNSB = count rate of mass of element of interest in the standard; celem
NSB =
concentration of the element of interest in the standard.
The detection limit is influenced by the acquisition time, the volume of ablated sample
material, the flow rate of the Ar gas, and the isotope of the element. Furthermore, the
sensitivity of the ICP-MS may change during the course of one measurement day. This drift
found by standard and background measurements in regular time intervals was not a linear
function of time (Fig. 4.5). Therefore, the measurements were done in the sequence: five
background measurements – one standard measurements – ten sample analysis measurements.
Fig. 4.5 Fluctuation of standard (a) and background (b) count rates of LA ICP-MS measurements during one
measure day.
The mean and the standard deviation (σBG) were calculated for each sequence of background
measurements. These values were then used to calculated the intensity of the detection limits
(IDL) in accordance with the equations (4.1) and (4.2). The regression coefficient b was
determined from a single point calibration, assuming a linear calibration line which passes
through the origin of the intensity vs. concentration plot (Table 4.3). It follows from equation
(4.7):
1.E+02
1.E+03
1.E+04
1.E+05
1.E+06
1.E+07
1.E+08
1 3 5 7 9 11 13 15
number of measurements
7Li 23Na 27Al 29Si 44Ca
49Ti 53Cr 55Mn 57Fe 72Ge
a
1.E+02
1.E+03
1.E+04
1.E+05
1 11 21 31 41 51 61 71
number of measurements
7Li
27Al
29Si
b

54
CDL = CSTD IDL/ISTD (4.7)
where ISTD = intensity of the standard measurement; CSTD = given concentration of the element in the
standard.
The high sensitivity of the ICP-MS for most trace elements in quartz leads to very low
detection limits shown in figure 4.6 and listed in table 4.3. Ca and Na cannot be measured
because the high detection limit. For Na it is mainly caused by molecular interferences with12C32O2 which is present in small amounts in the sample chamber. The determination of Na is
general problem of micro beam analysis because its high volatility and frequency leads to a
omnipresent Na contamination.
4.3 Secondary ion mass spectrometry (SIMS)
The SIMS analyses were performed on a Cameca IMS-6f magnetic sector ion microprobe at
the GeoForschungsZentrum Potsdam by M. Wiedenbeck. The mass filtered beam had a
impact energy of 12.5 keV, a 40 nA primary current and was focused to a spot size of 25 µm.
The gold-coated polished samples were embedded in rings of one inch in diameter with a
vacuum compatible medium. During analysis, the material was gradually removed from the
sample surface by the incident primary 16O- beam in a process termed “sputtering”. After
selecting a position to analyse, a 50x50 µm area was pre-sputtered with the rastered primary
beam for 240 s to remove the gold coating and any surface contamination. Within any one set
Fig. 4.6 Detection limits of trace
elements in quartz for LA ICP-MS.
The detection limit C1DL bases on the
calculated intensity I1DL after equation
(4.1) and C2DL on the intensity I2DL
after equation (4.2). In the case of the
EPMA the C2DL is ca. 25% lower
than C1DL caused by the level of
significance which is lower than three
standard deviations.
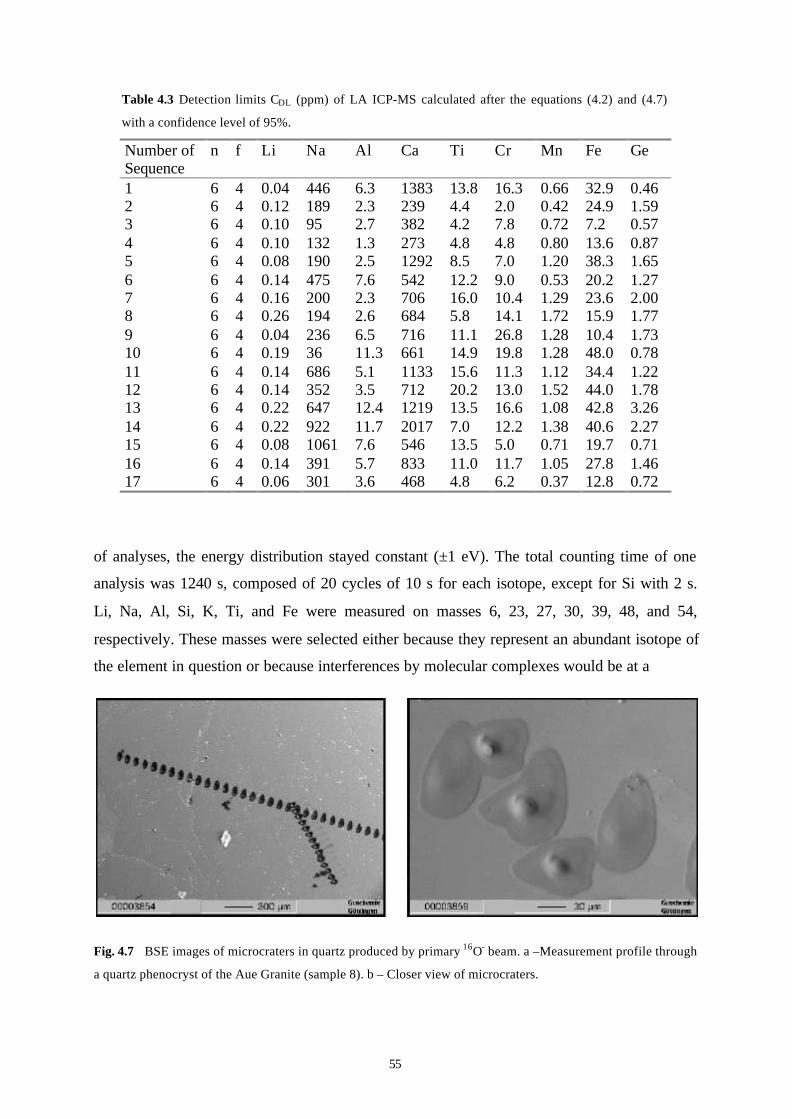
55
Table 4.3 Detection limits CDL (ppm) of LA ICP-MS calculated after the equations (4.2) and (4.7)
with a confidence level of 95%.
Number ofSequence
n f Li Na Al Ca Ti Cr Mn Fe Ge
1 6 4 0.04 446 6.3 1383 13.8 16.3 0.66 32.9 0.462 6 4 0.12 189 2.3 239 4.4 2.0 0.42 24.9 1.593 6 4 0.10 95 2.7 382 4.2 7.8 0.72 7.2 0.574 6 4 0.10 132 1.3 273 4.8 4.8 0.80 13.6 0.875 6 4 0.08 190 2.5 1292 8.5 7.0 1.20 38.3 1.656 6 4 0.14 475 7.6 542 12.2 9.0 0.53 20.2 1.277 6 4 0.16 200 2.3 706 16.0 10.4 1.29 23.6 2.008 6 4 0.26 194 2.6 684 5.8 14.1 1.72 15.9 1.779 6 4 0.04 236 6.5 716 11.1 26.8 1.28 10.4 1.7310 6 4 0.19 36 11.3 661 14.9 19.8 1.28 48.0 0.7811 6 4 0.14 686 5.1 1133 15.6 11.3 1.12 34.4 1.2212 6 4 0.14 352 3.5 712 20.2 13.0 1.52 44.0 1.7813 6 4 0.22 647 12.4 1219 13.5 16.6 1.08 42.8 3.2614 6 4 0.22 922 11.7 2017 7.0 12.2 1.38 40.6 2.2715 6 4 0.08 1061 7.6 546 13.5 5.0 0.71 19.7 0.7116 6 4 0.14 391 5.7 833 11.0 11.7 1.05 27.8 1.4617 6 4 0.06 301 3.6 468 4.8 6.2 0.37 12.8 0.72
of analyses, the energy distribution stayed constant (±1 eV). The total counting time of one
analysis was 1240 s, composed of 20 cycles of 10 s for each isotope, except for Si with 2 s.
Li, Na, Al, Si, K, Ti, and Fe were measured on masses 6, 23, 27, 30, 39, 48, and 54,
respectively. These masses were selected either because they represent an abundant isotope of
the element in question or because interferences by molecular complexes would be at a
Fig. 4.7 BSE images of microcraters in quartz produced by primary 16O- beam. a –Measurement profile through
a quartz phenocryst of the Aue Granite (sample 8). b – Closer view of microcraters.
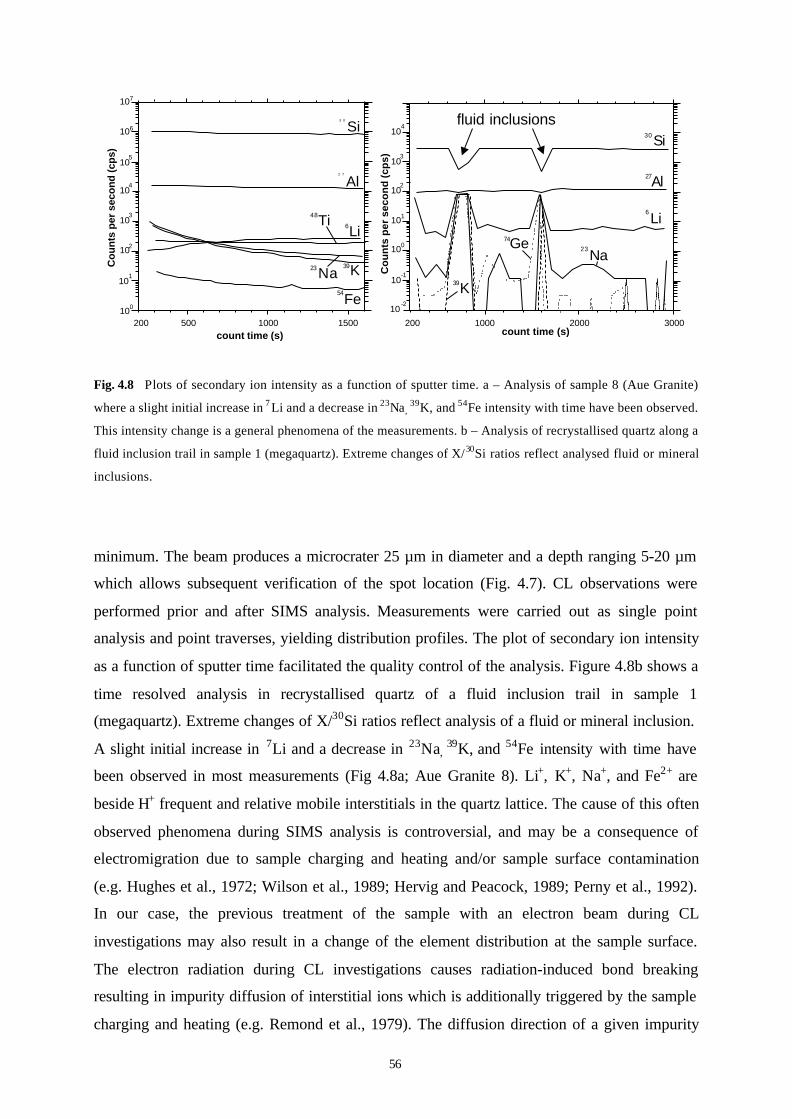
56
Fig. 4.8 Plots of secondary ion intensity as a function of sputter time. a – Analysis of sample 8 (Aue Granite)
where a slight initial increase in 7 Li and a decrease in 23Na, 39K, and 54Fe intensity with time have been observed.
This intensity change is a general phenomena of the measurements. b – Analysis of recrystallised quartz along a
fluid inclusion trail in sample 1 (megaquartz). Extreme changes of X/30Si ratios reflect analysed fluid or mineral
inclusions.
minimum. The beam produces a microcrater 25 µm in diameter and a depth ranging 5-20 µm
which allows subsequent verification of the spot location (Fig. 4.7). CL observations were
performed prior and after SIMS analysis. Measurements were carried out as single point
analysis and point traverses, yielding distribution profiles. The plot of secondary ion intensity
as a function of sputter time facilitated the quality control of the analysis. Figure 4.8b shows a
time resolved analysis in recrystallised quartz of a fluid inclusion trail in sample 1
(megaquartz). Extreme changes of X/30Si ratios reflect analysis of a fluid or mineral inclusion.
A slight initial increase in 7Li and a decrease in 23Na, 39K, and 54Fe intensity with time have
been observed in most measurements (Fig 4.8a; Aue Granite 8). Li+, K+, Na+, and Fe2+ are
beside H+ frequent and relative mobile interstitials in the quartz lattice. The cause of this often
observed phenomena during SIMS analysis is controversial, and may be a consequence of
electromigration due to sample charging and heating and/or sample surface contamination
(e.g. Hughes et al., 1972; Wilson et al., 1989; Hervig and Peacock, 1989; Perny et al., 1992).
In our case, the previous treatment of the sample with an electron beam during CL
investigations may also result in a change of the element distribution at the sample surface.
The electron radiation during CL investigations causes radiation-induced bond breaking
resulting in impurity diffusion of interstitial ions which is additionally triggered by the sample
charging and heating (e.g. Remond et al., 1979). The diffusion direction of a given impurity
200 1000 2000 3000200 500 1000 1500
10
10 104
3
2
1
0
39
39
74
23
6
30
27
54
6
48
23
0
1
2
3
4
5
6
7
-1
-2
10 10
10 10
10 10
10 10
10
10
10
10
count time (s) count time (s)
Co
un
ts p
er s
eco
nd
(cp
s)
Co
un
ts p
er s
eco
nd
(cp
s)
3 0
SiSi
LiLi
KK
Ti
NaNa
Ge
Fe
2 7
Al Al
fluid inclusions

57
from the bulk to the surface or vice versa is controlled by the surface potential distribution.
Nevertheless, the observed change in the line intensity with exposure time of alkalis and Li is
an often observed phenomena during SIMS measurements (e.g. Shimizu et al., 1978). The
electromigration near the surface will give low results for the Na, K, and Fe and high results
for Li. After ca. 500 s the count rates are nearly stabilised. Therefore, counts from the first 8
analytical cycles (496 s) were neglected. Because no standard was available the relative
intensities were given in X/30Si ratios.
4.4 Fourier-transform infrared (FTIR) spectroscopy
Transmission FTIR spectra of quartz were obtained using the Perkin Elmer 1760-X FTIR
spectrometer by S. Vaupel at the University Göttingen. The spectrometer can operate with an
internal ray path and a triglycine-sulphate-detector or an external microscope with a separate
mercury-cadmium-telluride-detector. The change between the two configurations is effected
by a swivelling mirror. The external microscope is supplemented with a vacuum sample
chamber (Dewar K-770-T) which is required for liquid N2-cooling of the sample and ray path
(–190 - –194°C) to avoid interference with atmospheric H2O and CO2. The cooling resulted in
a maximal signal/noise ratio of the detected spectra.
FTIR spectroscopy is the only method for the determination of the distribution and
specification of structural water in quartz crystals. The quartz wafer is penetrated by an
electromagnetic UV beam (wavelength = 2-25 µm). The radiation excites the vibration of the
atoms which lead to the absorption of distinct wavelengths depending on the kind of atoms
and their bonds.
The analysis were carried out on doubly polished wafers 250 µm in thickness. Prior to the
measurement the wafers were cleaned with acetone and dried for 10 h at 110°C. The spectra
were acquired in a range of wave numbers between 5000 to 2000 cm-1 with 200 scans in the
transmission modus. The resolution of the measurements was 4 cm-1. The spot size of the
beam on the sample was 40 µm in diameter which allows the recording of several spectra
along a traverse within one grain. Background were taken after each spectra. The spectrum
processing was carried out on a PC for baseline correction, sample thickness correction and
converting of the transmission spectrum to the absorption spectrum.

58
4.5 Electron paramagnetic resonance (EPR)
The paramagnetic defect centres of the quartz samples were investigated by EPR at
frequencies of the X-band (9.5 GHz) at 20, 70, and 295 K using a Varian E-line spectrometer
at the Department of Mineralogy, University of Marburg. The measurements were carried out
by T. Scherer. The influence of technical parameters such as modulation amplitude,
microwave power, temperature, scan time, etc. on the spectra were checked for the optimal
settings for recording the spectra. These settings (modulation field HM = 1 G, temperature T =
295 K, microwave power p = 0.2 mW for E’ and HM = 1 G, p = 7 mW, T = 70 K for [AlO 4]0
centres) were kept constant throughout all the measurements to allow correct comparison
between the signal intensities of the different spectra.
The samples were crushed and quartz crystals were separated from the parent rock material by
hand-picking under binocular microscope. Isolated quartz was sieved to obtain the 63-125 µm
fraction, followed by a HF acid treatment at room temperature to remove feldspar (not
necessary for the hydrothermal quartz). Finally the fraction was treated with distilled water
and then air dried.
The specific peak positions of the paramagnetic centres were drawn from simulated spectra
and from literature data. The centres were calculated in relative intensities. For the calculation
of the relative intensity of the paramagnetic defect centres the following equation was used:
Is ∗ 10000
Irel = —————— 4.8
Gs ∗ ms
where Is = measured intensity of the EPR signal, Gs = intensification factor used during
spectrum recording, and ms = mass of the sample.

59
5 Analytical results
5.1 Characterisation of the cathodoluminescence of quartz
The quartz CL spectra in the range of 1.4 to 3.1 eV generally consist of two broad emission
peaks at 1.7 – 2.2 eV (red emission) and 2.4 – 3.1 eV (blue emission; Fig. 5.1). The CL
colour, mostly shades of blue, violet, and red-brown is dependent on the ratio of the two main
emission peaks (Table 5.1). The peak ratio changes with the exposure time of electron
radiation, whereby the blue emission generally decreases and the red emission increases (Fig.
5.2). The maximum of the two peaks shifts for different quartz types indicating that the peaks
are built up of different emission bands of different stability. Nine emission bands have been
detected in all the spectra by fitting the spectra with Gaussian curves. Three emission bands
can be distinguished in the red emission range (1.73, 1.84, and 1.96 eV) and five bands in the
blue emission range (2.47, 2.58, 2.68, 2.79, and 2.96 eV) (Fig. 5.3). Additionally, a broad
band has been observed in the yellow range of the spectrum at 2.15 eV. Depending on the
quartz sample the emission bands show different intensities, half-width, and different stability
during irradiation. The parameters of CL emission bands obtained from best-fit listed in
Appendix A. Most CL band positions are consistent with the values reported in the literature
(e.g. Remond et al., 1992; Gorton et al., 1996; Kalceff et al., 2000 and references therein;
Table 5.2). Characteristics of the spectra can be summarised as follows (Fig. 5.1, 5.2, 5.3):
1. Nine emission bands are developed in the CL spectra of all samples.
2. The intensity of the blue emissions decreases whereas the intensity of red emission
generally increases during electron radiation. A frequently observed bright blue “flash” at
initial electron radiation is caused by the unstable blue emission at ~2.79 eV.
3. Dominant emission bands of rhyolitic quartz (samples 4, 10, 11, 15) are the 1.96, 2.58,
2.68, 2.79, and 2.96 eV band. The spectra are very similar although they originate from
different volcanic provinces. An exception is the quartz of the Teplice Rhyolite showing a
dominant 1.73 eV emission. The blue and red luminescent growth zones in quartz
phenocrysts are caused by the variation of the blue CL emission whereas the red CL
remains essentially constant (sample 10, 11, 15).
4. The 1.73 and 2.15 eV bands are characteristic for the granitic quartz and some rhyolites
(sample 5). The 2.15 eV emission is dominant in the quartz of the Aue and Eibenstock
granites form the Western Erzgebirge.

60
5. Hydrothermal quartz (sample 1, and 3) exhibit a distinctive 2.47 eV band and sample 9 a
dominant 2.79 eV band. The bands are characterised by a fast intensity decrease during
electron exposure. The 2.47 eV emission causes a turquoise CL at initial electron radiation
(sample 1 and 3).
6. The 2.68 and 2.58 eV emission bands are developed with about constant peak area ratios
in all samples: 1 : 0.34±0.08. Similar observations were made for the 1.96 and 1.84 eV red
emission bands which show ratios of 1 : 0.51±0.17. The 2.58 eV and 2.68 eV emission are
not immediately obvious from visual inspection of the other 100 mm-grating spectra due
to the close proximity of more intense emissions, but the bands are detectable in spectra
recorded with the 1200 line/mm grating (Fig. 5.3).
Table 5.1 CL colours and structures revealed by CL.
No. Sample name Initial CLcolour
Duration ofinitialcolour (s)
Final CL colour Primary CL structures Secondary CLstructures*
1 megaquartz intense turquoise 60 orange-brown - 3, 52 fissile quartz bright blue 30 red-brown - -3 oil-bearing quartz intense turquoise 60 red-brown - -4 Schoenfeld Rhyolite bright blue 120 blue-violet zoned phenocrysts 3, 45 Teplice Rhyolite (TPR2) bright blue1)
weak blue2)301)
102)violet-blue1)
dark red1)zoned phenocrysts 2, 3, 4, 5
6 Schellerhau Granite bright blue1)
weak blue2)
bright blue3)
301)
52)
203)
violet-blue1)
red-brown2)
red-brown3)
zoned phenocrysts 1, 2, 3, 5
7 Eibenstock Granite bright blue1)
bright blue3)
301)
203)
violet-red-brown1)
red-brown3)zoned phenocrysts 1, 2, 3, 5
8 Aue Granite bright blue 20 orange-brown zoned phenocrysts 1, 2, 3, 59 vein quartz intense blue 300 dark blue - -10 Wachtelberg Rhyolite bright blue1)
weak blue2)301)
102)violet 1)
red-brown2)zoned phenocrysts 3, 4
11 Beucha Rhyolite bright blue1)
bright blue2)1201)
102)blue-violet 1)
red-brown2)zoned phenocrysts 2, 3, 4, 5
12 Flossenbuerg Granite bright blue 60 red-brown - 1, 2, 3, 513 leucosome quartz bright blue 20 red-brown - -14 Ramberg Granite bright blue 30 red-brown zoned phenocrysts 1, 2, 3, 515 Weinheim Rhyolite bright blue1)
bright blue2)1201)
102)violet-blue1)
red-brown2)zoned phenocrysts 3, 4
* Secondary CL textures (see chapter 7.3): 1 – micropores; 2 – patchy halos of secondary quartz around fluidinclusions; 3 – veinlets of recrystallised quartz; 4 – diffusion rims along grain boundaries; 5 – bright haloscaused by radioactive inclusions and fluids;
1) Blue luminescent growth zones in magmatic phenocryst2) Red luminescent growth zones in magmatic phenocryst3) Magmatic matrix quartz

61
Table 5.2 Comparison of frequently reported CL emissions of SiO2 and proposed associations andidentification (a-SiO2 = amorphous SiO2).
Wave-length(nm)
Energy(eV)
Peakposition(eV)
Specimen Association/identification
References
775763751740
1.601.6251.651.675
1.65 – 1.8 Opal α-SiO2,sandstone
Associated with Fe3 +
impurityPott and McNicol (1971), Sprunt (1981),Kalceff et al. (1997), Bruhn et al. (1996)
729719708698689
1.701.7251.751.7751.800
~1.9 a- and α-SiO2 NBOHC (Si-Oprecursor)
Oxygen vacancy
Remond et al. (1992), Kalceff and Phillips(1995), Zinkernagel (1978), Friebele et al.(1985)
Luff and Townsend (1990)679670661653
1.8251.8501.8751.900
1.93 SiO2 Na impurity Remond et al. (1992); Khanlary et al.(1993); Yang et al. (1994)
644636628
1.9251.9501.975
1.95 Hydrated a andα-SiO2
NBOHC (-OHprecursor)
Kalceff and Phillips (1995), Koyama(1980), Nishikawa et al. (1992)
620612605
2.0002.0252.050
2.1-2.4 a-SiO2,irradiated α-SiO2
STE Kalceff et al. (1995), Itoh et al. (1990)
598590584
2.0752.1002.125
2.17 Ge doped α-SiO2 STE associated withGe
Luff and Townsend (1990)
577570564
2.1502.1752.200
2.25-2.8 Natural α-SiO2 Associated withinterstitial cations
Ramseyer and Mullis (1990)
557551545
2.2252.2502.275
2.4 Syntheticamethyst
Fe impurity Ruppert (1987)
539533528
2.3002.3252.350
2.5 α-SiO2 Impurity Itoh et al. (1988), Kalceff and Phillips(1995)
522517
2.3752.400
2.55 Smoky α-SiO2 (Al 3+)0 hole center Nassau and Prescott (1975)
511506501496491485481
2.4252.4502.4752.5002.5252.5502.575
2.6-2.8 α-SiO2, Opal,rose quartz
STE
Ti, Ti3+ , interstitialTi3+ , TiO2 microinclusions
Remond et al. (1992), Kalceff and Phillips(1995)
Sprunt (1981), Luff and Townsend (1990),Kerkhof et al. (1996)
477472468
2.6002.6252.650
2.74 a-SiO2 Oxygen deficientcentre
Griscom (1991), Kalceff et al. (1997)
464459455
2.6752.7002.725
2.75 O implanted a-SiO2
Oxygen related centre Hagni (1987)
451447443
2.7502.7752.800
~2.9 Natural α-SiO2 Substitutional Al andcation
Ramseyer and Mullis (1990)
439435431
2.8252.8502.875
~2.95 α-SiO2 Intrinsic defect Alonso et al. (1983), Kalceff and Phillips(1995), Gorton et al. (1996)
428424420
2.9002.9252.950
2.99 C implanted a-SiO2
C impurity Koyama (1980)
417413410
2.9753.0003.025
3.0 a-SiO2 STE’s associatedwith Ge, Al, H
Khanlary et al. (1993), Yang et al. (1994)
407403400397393390387384
3.0503.0753.1003.1253.1503.1753.2003.225
3.1-3.3 a and α-SiO2,sandstone, opal
Al3 +-M+ (where M+ =H+, Li+, Na+, or K+)
Impurityincorporation duringgrowth
Ramseyer and Mullis (1990), Remond et al.(1992), Khanlary et al. (1993), Kalceff andPhillips (1995), Gorton et al. (1996)
Skuja and Trukhin (1989), Luff andTownsend (1990)
381379376
3.2503.2753.300
~3.7 α-SiO2 insandstone
Associated with Aland Li impurities
Demars et al. (1996)
373370
3.3253.350
4.3 α-SiO2 Na impurity Sprunt (1981)
Infra-red
Red
Ora
nge
Yel
low
Gre
enB
lue
Vio
let
Ult
ra v
iole
t

62

63
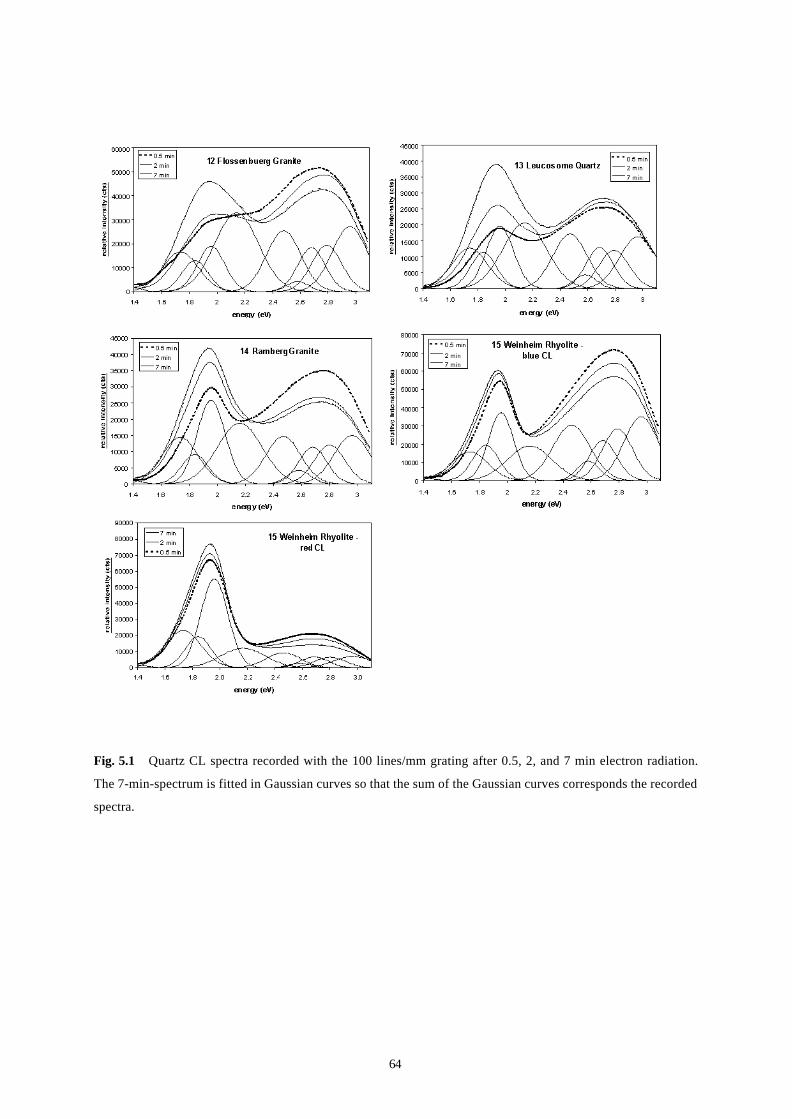
64
Fig. 5.1 Quartz CL spectra recorded with the 100 lines/mm grating after 0.5, 2, and 7 min electron radiation.
The 7-min-spectrum is fitted in Gaussian curves so that the sum of the Gaussian curves corresponds the recorded
spectra.

65
Fig. 5.2 CL intensity change during 10 min electron radiation of the samples 1, 4, and 8. Note the high
instability of the blue emission of sample 1 and the dominance of the relative constant intensity of the yellow
2.15 eV band of sample 8.
2468
0
5000
10000
15000
20000
25000
30000
35000
40000
450004 Schoenfeld Rhyolite
3579
0
10000
20000
30000
40000
50000
600008 Aue Granite
1.526678078
1.6687754061.840039181
2.050442405
2.315219421
2.65851828
3.1213494460.5
0
10000
20000
30000
40000
50000
600001 Megaquartz
1.4
1.4
1.4
2.4
2.4
2.4
2.6
2.6
2.6
2.8
2.8
2.8
3.09
9
9
1
1
1
3
3
3
5
5
5
7
7
73.0
3.0
2.2
2.2
2.2
1.6
1.6
1.6
1.8
1.8
1.8
2.0
2.0
2.0
energy (eV)
radiation time (min)
radiation time (min)
radiation time (min)
rela
tive
inte
nsi
ty (c
ts)
rela
tive
inte
nsi
ty (c
ts)
rela
tive
inte
nsi
ty (c
ts)
energy (eV)
energy (eV)

66
5.2 Instability of CL during electron bombardment
The blue emission (2.6 – 3.1 eV) is characterised by high intensity at initial electron
bombardment visible as a blue “flash”. The initial intensity of this blue emission, mostly
centred at ~2.8 eV may drop by 1/2 to 1/3 after a few seconds. The intensity is stabilised after
30 to 100 s of electron bombardment (Fig. 5.4). The steady state of CL-changes during
electron radiation points at a saturation effect. The saturation status is reached faster with
higher electron radiation dose. Figure 5.5 shows CL spectra of sample 12 after 2 minutes
electron beam exposure using different beam currents. Note that the intensity of blue emission
remains constant after 2-minutes spectra at beam currents =0.18 mA indicating a saturation
status. In the case of the megaquartz (sample 1) and oil-bearing quartz (sample 3) the initial
blue emission is centred at ~2.5 eV which causes turquoise CL at initial electron radiation.
In contrast to the blue emission, the red emission (1.75 – 2.2 eV) generally shows an intensity
minimum at initial electron bombardment followed by a steep parabolic increase during first
minute of electron radiation followed by a slight increase until saturation is reached. The
intensity increase of red CL together with the decrease of the blue CL causes a change from
initial blue/violet to red/red-brown CL. However, the decrease of blue and the increase of red
emission behave independently: in the case of the deformed magmatic quartz form the Eastern
Lachlan Fold Belt (see § 10.7) the red emission remains constant whereas the blue one
decreases.
0
500
1000
1500
2000
2500
3000
3500
4000
4500
2.5 2.6 2.7 2.8 2.9 3 3.1
energy (eV)
3 Oil-bearing Quartz
1 Megaquartz
12 Flossenbuerg Granite
10 Wachtelberg Rhyolite
Fig. 5.3 Blue CL emission rangeof several quartzes recorded 1200lines/mm grating after 7 minelectron radiation. The spectrumof the sample 12 is fitted inGaussian curves.

67
Fig. 5.4 Intensity change of the 1.96 and 2.79 eV emission of some characteristic samples during the radiation
time of 10 min recorded with the f/3.4 Grating Monochromator using the CL microscope after Zinkernagel
(1978) at the University Göttingen (10 keV, 0.25 mA). The experimental curves are grey and the fitted curves
are black lines.

68
The effect of temperature
Most of the energy of the electron beam is converted into heat in the sample near the surface
(e.g. Remond et al., 1992). After Reimer (1985) the portion of the converted beam energy into
heat amounts between ƒ = 40-80% (ƒ = degree of effectiveness); Castaing (1951) assumed an
average portion of ƒ = 70% which transforms into heat. The energy Q = ƒ ∗ U ∗ I ∗ t which
effects the samples measured here reaches Q = 2.016 J using a beam voltage U = 1.4 104 V,
current I = 1.8 10-4 A and ƒ = 0.8.
The heat production at the irradiated spot was calculated by several authors and several types
of equipment (Castaing, 1951; Friskney and Haworth, 1967; Dudek, 1970; Reimer, 1985).
These calculations, which give an idea about the maximum temperature of the sample,
assume, that firstly, the electron beam radius rb corresponds to the interaction depth of the
electron beam re in the sample. Secondly, the radius of the sample rs should be so large that
the external surface of the sample remains at ambient temperature (∆T = 0) meaning that rs >>
rb. Both conditions are not fulfilled for the used CL microscope: the electron beam radius rb
(2.4 mm) is ca. 500 times larger than the penetration depth of the electrons (re ~ 5 µm) and the
beam radius is so large that the temperature at the external sample surfaces rises considerably.
As a consequence the thin section turns hot after same minutes of electron radiation.
The heat developed in a cylindrical interaction volume is controlled by the thermal
conductivity of the sample (e.g. λquartz = 1.38 W m-1 K-1 or λgranite/rhyolite = 2.1 – 2.9 W m-1 K-1),
of the carbon coating (λgraphite = 169 W m-1 K-1), of the glass slide of the thin section (λwindow
glass = 0.7 W m-1 K-1), and of the sample holder (λbrass = 111 W m-1 K-1). The heat flow
problem is very complex due to the different thermal conductivities and thermal transition
coefficients, and the heterogeneous heat transmission. Therefore, temperature measurements
Fig. 5.5 CL spectra of sample
12 after 2 min electron beam
exposure using different beam
currents.

69
were carried out to know the thermal changes of the sample during electron radiation. The
temperatures were measured with a sensor on the reverse of demounted thin sections about
250 µm away from the incident beam and by using different beam currents (Fig. 5.6a, b, c).
The measurements were corrected by the maximal temperature difference ∆T between the
target of the incident electron beam and the sensor:
∆T = ƒ ∗ U ∗ I ∗ l / λsample π rb2 5.1
where l = distance between temperature measure point and incident beam on the thin
section surface, λsample = thermal conductivity of the sample, and π r2 = area of the
incident beam.
The temperature difference ∆T amounts 19.7 K by taking the electron beam voltage is U = 1.4
104 V, the current I = 1.8 10-4 A, ƒ = 0.8, the distance 2.44 104 m, the beam radius rb = 2.4 103
m, and λquartz = 1.38 W m-1 K-1.
Figures 5.6a, f, and k show the temperature increase in the target of the electron beam for the
samples 1, 4 and 8 during 600 seconds. The temperature increase is an exponential function of
the radiation time and shows a linear correlation with the beam current (Fig. 5.7). The plots
5.6b, g, and l show the CL intensity change of the single emission bands during the first
electron exposure and the plots 5.6d, i, and n during the second electron exposure of the same
sample area after 24 h. The emission band areas and their change were determined from time-
resolved spectra recorded with the 100 lines/mm grating of the TRIAX 320. Note, that the
spectrum recording with the TRIAX 320 does not allow the determination of the fast intensity
change during the first 30 s of electron beam exposure. The intensity change during the
second electron exposure is much lower than the change during the first electron exposure
indicating that 1) the CL is mainly caused by the electron radiation, 2) the temperature has a
low influence of the CL, 3) the electron exposure causes a permanent modification of
luminescence centres, and 4) the creation and destruction of luminescence centres take place
mainly during the first three minutes of electron radiation. In the plots showing CL intensity
change versus temperature (5.6c, e, h, j, m, and o) a clear mathematical correlation does not
exist demonstrating a low dependence of CL on the temperature.
However, thermoluminescence bands may have identical positions as the CL bands.
Characteristic thermoluminescence bands are the 2.95-2.85 eV, 2.21-2.14 eV and 2.00-1.98
eV bands (e.g. Jani et al., 1983; Yang et al., 1994; Zhang et al., 1994; Rink et al., 1993).

70
Especially the latter is a frequent and intensive thermoluminescence band of natural quartz
(e.g. Rink et al., 1993). The intensity maximum of the 2.21-2.14 eV and 2.00-1.98 eV bands is
in the temperature range of the CL measurements. Therefore, the temperature should have a
secondary influence on the CL intensity and its change.
Fig. 5.6a-e Plots of radiation time versus sample temperature and CL intensity change of the sample 8. a -
Change of the sample temperature in the target of the electron beam using different beam currents; b – Change of
CL band intensities given in percentage emission band area during the first electron exposure of 10 min using the
beam current of 0.18 mA; c – Plot of emission band area change versus sample temperature rise; d - Change of
CL band intensities given in percentage emission band area during the second electron exposure after 24 h using
the beam current of 0.18 mA; e – Plot of emission band area change versus sample temperature rise.

71
Fig. 5.6f-j Plots of radiation time versus sample temperature and CL intensity change of the sample 1. f -
Change of the sample temperature in the target of the electron beam using different beam currents; g – Change of
CL band intensities given in percentage emission band area during the first electron exposure of 10 min using the
beam current of 0.18 mA; h – Plot of emission band area change versus sample temperature rise; i - Change of
CL band intensities given in percentage emission band area during the second electron exposure after 24 h using
the beam current of 0.18 mA; j – Plot of emission band area change versus sample temperature rise.

72
Fig. 5.6k-o Plots of radiation time versus sample temperature and CL intensity change of the sample 4. k -
Change of the sample temperature in the target of the electron beam using different beam currents; l – Change of
CL band intensities given in percentage emission band area during the first electron exposure of 10 min using the
beam current of 0.18 mA; m – Plot of emission band area change versus sample temperature rise; n - Change of
CL band intensities given in percentage emission band area during the second electron exposure after 24 h using
the beam current of 0.18 mA; o – Plot of emission band area change versus sample temperature rise.

73
CL of thermally treated quartz
The samples 1, 14, and 15 were thermally treated at 300°C and at 600°C for 24 hours. The
spectra of the thermally treated quartzes show the following changes in the emission
properties (Fig. 5.8, 5.9):
1) The treatment generally results in a significant increase of the 1.73 eV band after
300°C heating from room temperature and a sligth increase of both the 1.85 and 1.96
eV bands.
2) The initial peak observed at 2.48 eV is destroyed at > 600°C.
3) All three samples show a more or less intensive shift of the blue peak to higher energy
after 600°C heat-treatment, caused by the intensification of the 2.96 eV (sample 1, 14,
15) and of the 2.79 eV bands (sample 14).
The intensification of the 2.96 eV band in all three samples may indicate that this peak is
characteristic for quartz formed at high temperature, whereas the 2.48 eV band is typical for
hydrothermal quartz.
The effect of sample preparation on the CL of quartz
The method of specimen preparation (polishing) may affect the concentration of defects
participating in radiative and non-radiative processes in the surface regions (Ruppert, 1987).
The influence of specimen preparation and surface roughness on the CL signal of SiO 2 has
been mentioned in Sprunt (1981) and Ruppert (1987). In order to study the effect of sample
preparation spectra were recorded for (a) unpolished thin sections using different granularities
of carborundum (1 µm and 3 µm) and (b) thin sections polished chemically (OP-S
suspension) and compared with (c) the normally used polishing with diamond paste (0.3 µm).
As a result we found systematic lower CL intensities for rougher surfaces. However, the peak
area ratios of the emission bands and the stability of the CL-activator centres remained
unchanged.
40
50
60
70
80
90
100
110
120
130
140
0.1 0.12 0.14 0.16 0.18 0.2
beam current (mA)
1 Megaquartz8 Aue Granite4 Schoenfeld Rhyolite
Fig. 5.7 Linear correlation of
sample temperature increase in the
target of the electron beam versus
electron beam current.

74
Fig. 5.8 Initial CL spectra (after 30 s electron radiation) of unheated, and at 300 and 600°C for 24 h treated
quartzes.
1 Megaquartz
0
10000
20000
30000
40000
50000
60000
70000
1.4 1.6 1.8 2 2.2 2.4 2.6 2.8 3
energy (eV)
unheatedheated 300°C for 24 h
heated 600°C for 24 h
14 Ramberg Granite0
5000
10000
15000
20000
25000
30000
35000
40000
45000
50000
1.4 1.6 1.8 2 2.2 2.4 2.6 2.8 3
energy (eV)
unheatedheated 300°C for 24 h
heated 600°C for 24 h
15 Weinheim Rhyolite0
10000
20000
30000
40000
50000
60000
70000
80000
1.4 1.6 1.8 2 2.2 2.4 2.6 2.8 3
energy (eV)
unheated
heated 300°C for 24 hheated 600°C for 24 h

75
Quantification of CL intensity change during electron radiation
The kinetic of physicochemical reactions in natural systems can be generally described by the
kinetic law c = c0 exp(-kt), where c = concentration of the component at time t, c0 =
concentration of the component at time t = 0, and k = velocity (equilibrium) constant. The
equation is the base for the determination of velocity constants (e.g. diffusion coefficients,
thermal conductivity). The equation was applied to quantify the decay of the blue intensity
and the simultaneously increase of the red emission intensity during electron radiation. The
latter may be described by the reverse equation of the kinetic law. Application of the equation
resulted in an approximate quantification of the intensity change as a function of time. A
complicating factor is the composite character of the blue emission intensities, which
subdivides into a fast decaying component and a slowly decaying component. Picouet (1999)
suggested an equation being the sum of two kinetic law equations:
Ib = Ibs + Ib1 ∗ exp(-t/kb1) + Ib2 ∗ exp(-t/kb2) 5.2
where Ib = intensity of blue CL at the radiation time t; Ibs = intensity of stable blue CL;
Ib1 = intensity of the slow decreasing CL component at t = 0; kb1 = velocity constant of
the slow decreasing CL component; Ib2 = intensity of the fast decreasing CL component
at t = 0; kb2 = velocity constant of the fast decreasing CL component; t = radiation time.
1 Megaquartz
0
1000
2000
3000
4000
5000
6000
7000
8000
2.5 2.6 2.7 2.8 2.9 3 3.1
energy (eV)
heated 600°C for 24 h
unheated Fig. 5.9 CL spectra of the blue
emission range of unheated and
heated quartz of the megaquartz.
The spectrum of the heated quartz
were fitted with Gaussian curves.

76
This equation fits very well with the measured time-dependent intensity change (Fig. 5.4).
The increase of red emission between 1.75 to 2.2 eV may be described by the following
equation which is the reverse function of equation 5.2:
Ir = Irs - Ir1 ∗ exp(-t/kr1) - Ir2 ∗ exp(-t/kr2) 5.3
where Ir = intensity of red CL at the radiation time t; Irs = intensity of red CL for t ? 8 ;
Ir1 = intensity of the slow increasing CL component for t ? 8 ; kr1 = velocity constant of
the slow increasing CL component; Ir2 = intensity of the fast increasing CL component
for t ? 8; kr2 = velocity constant of the fast increasing CL component; t = radiation
time.
The red CL emission is composed of a fast increasing component during the first minute of
electron radiation and a slowly increasing component. Figure 5.4 shows the intensity change
of the 1.96 and 2.79 eV emissions during 10 min electron beam exposure. The curves were
fitted using the equations 5.3 and 5.2, respectively. The samples 9 and 13 show a reverse time
–dependent behaviour of the CL signal.
The fitted parameters of the radiation-time-dependent intensities at 1.96 and 2.79 eV are given
in Appendix B. The velocity constants kr1, kr2, kb1, and kb2 are similar for all samples: namely
502±16, 24±11, 252±9, and 14±5, respectively. The lower the velocity constant the faster the
decay and formation of CL activator centres. That implies that the decay of the centres
causing blue CL is about 2 times faster than the formation of the activator centres causing red
CL.
The emission intensities I represent the concentration of luminescence centres in the
interaction volume of the electron beam. The parameters Irs, Ir1, Ir2, Ibs, Ib1, and Ib2 are intensity
portions of the respective emission, whereby Ir1, Ir2, Ib1, and Ib2 are intensity portions which
compose the changeable CL. These parameters are proportional to the concentration of
luminescence centres. The rhyolitic quartz has a low Ir2 and Ib2 indicating a more stable CL
(Fig. 5.10). The granitic and hydrothermal quartz exhibit a wide scattering of intensity
parameters which corresponds to unstable and highly variable CL. Particularly the high Ir1 and
Ir2 of granitic quartz demonstrates the high instability of the red CL. Generally, we conclude
that the higher the quartz formation temperature and pressure the lower is the concentration of
unstable luminescence centres.

77
Fig. 5.10 Plots of fitted parameters Irs, Ir1, Ir2, Ibs, Ib1, and Ib2 of the equation 5.2 describing the decrease of 2.79
eV (blue) CL emission and of the equation 5.3 describing the increase of 1.96 eV (red) CL emission during
electron exposure. a – Plot of the stable blue CL intensity Ibs versus the intensity of red CL Irs for radiation time t
? 8 showing that samples with high intensity of blue CL exhibit also a high intensity of red CL; b – Plot of the
fast increasing red CL component Ir2 versus the slow increasing red CL component Ir1. There is no correlation
between the two components; c – Plot of the slow changing CL components of the blue CL Ib1and red CL Ir1; d –
Plot of the fast changing CL components of the blue CL Ib2 and red CL Ir2. Note, that rhyolitic quartz has a low
no fast changing CL.
5.3 Comparison of CL spectral and trace element analysis
EPMA, LA-ICPMS, and SIMS analysis
In order to measure trace element distributions complementary to the CL colours and spectra,
quartz has been analysed by LA-ICPMS and EPMA. SIMS analysis were carried out on a
selection of samples (megaquartz; Aue Granite; and Weinheim Rhyolite). The analysis were
performed by EPMA for Al, Ti, Fe, Mn, by LA-ICPMS for Al, Ti, Li, Ge, Fe, and by SIMS
for Li, Na, K, Al, Ti, and Fe. Trace element profiles traversing different growth and alteration
zones were measured (Fig. 5.11a, b, c; see also chapter 7, 8, 9, 10).
Quartz formed at high temperatures (=600°C) such as rhyolitic quartz shows an average high
Ti concentration up to 130 ppm (Fig. 5.11, 5.12a, 5.13). The growth zones are mainly
characterised by variations in Ti. The Ti concentration correlates exponentially with the

78
intensity of the 2.96 eV emission (Fig. 5.14). The content of Ti in hydrothermal quartz is
always below 40 ppm. Magmatic quartzes show a maximal Al content of 200 ppm, whereas
hydrothermal quartz may contain much more Al e.g. up to 5000 ppm in vein quartz. The vein
quartz shows unstable CL at 2.79 eV of very high intensity, suggesting that this luminescence
is associated with Al defect structures. Large variations in Al between adjacent growth zones
of hydrothermal quartz have been found. Furthermore, Al concentration differs for the
rhombohedral faces z to r of the zoned hydrothermal α-quartz (Fig. 5.11b). The sum of Li,
Na, K, and Fe shows a good correlation with Al (Fig. 5.13). This confirms the general
assumption that Li, Na, K, and Fe act as interstitial charge compensators for substitutional Al
(e.g., Dennen, 1965; Smith and Steele, 1984).
Hydrothermal quartz exhibits elevated Ge concentrations, between 3-16 ppm (Fig. 5.12.). The
LA-ICPMS analysis shows a strong enrichment in Mn, Fe, Ge, and Cr. The enrichment of all
these element may caused by micro inclusions situated in the measured sample volume.
The quartz of the Erzgebirge Batholite (Eibenstock and Aue Granite) exhibits high Fe and
Mn. The CL spectra of these samples show a characteristic stable 2.15 eV band which is
possibly associated with Mn.
The average Fe concentration increases with the quartz formation temperature. Therefore, the
Fe content of quartz is a good criteria to distinguish quartz of different genesis. Pott and
McNicol (1971) and Kempe et al. (1999) found that high Fe3+ causes the 1.73 eV CL
emission. However, in our samples we found no correlation between the Fe concentration and
the 1.73 eV band intensity. The lack of correlation may be explained by the fact that Fe occurs
as divalent and trivalent ions. It was frequently observed that Fe increases towards the grain
boundary indicating a high diffusion rate of Fe in the quartz lattice (Fig. 5.11a, see also §
10.7). The preferred diffusing ion is likely to be the Fe2+ due to its smaller ion radius. Weak or
non-luminescent secondary quartz in healed microcracks, or formed around fluid inclusions is
typically depleted in all trace elements (Fig. 5.11c).
FT-IR spectroscopy
Spectra of quartz containing structural water in the form of H+, OH-, and H2O show
characteristic absorption bands between 3000-3700 cm-1. The absorption bands are caused by
stretching vibrations of H-related chemical bonds excited by electromagnetic UV radiation.
Generally two classes of absorption occur in the IR spectra: sharp absorption bands (low half
width) at 3305, 3365, 3425, and 3470 cm-1 and broad absorption bands (high half-width) at
3440 cm-1, 3220 cm-1 and 3110 cm-1 (Brunner, 1961; Kats, 1962; Aines and Rossman, 1984).

79
Fig. 5.11a Trace element profile of a quartz phenocryst of the Wachtelberg Rhyolite (sample 12) determined by
EPMA and compared with relative CL intensity (grey shade).
0 100 200 300 400 500
200
distance (µm)
elem
ent c
ont
ent (
ppm
)
200
120
160
80
grey
sha
de
160
120
80
40
0
Al Fe
Ti K
200 µm
A
B
A B
blue CL violet CL red CL
microcrack
diffusionenrichment

80
Fig. 5.11b Trace element profile of a Berg crystal (vein quartz; sample 9) determined by EPMA compared with
relative CL intensity (grey shade).
0 100 200 300 400
60
40
20
0
5000
4000
3000
2000
distance (µm)
elem
ent
cont
ent (
ppm
)
100
60
80
40grey
sh
ade
Al Fe
Ti K
200 µm
A
B
A B
brightblue CLblue CL blue CL
red-
brow
n C
L
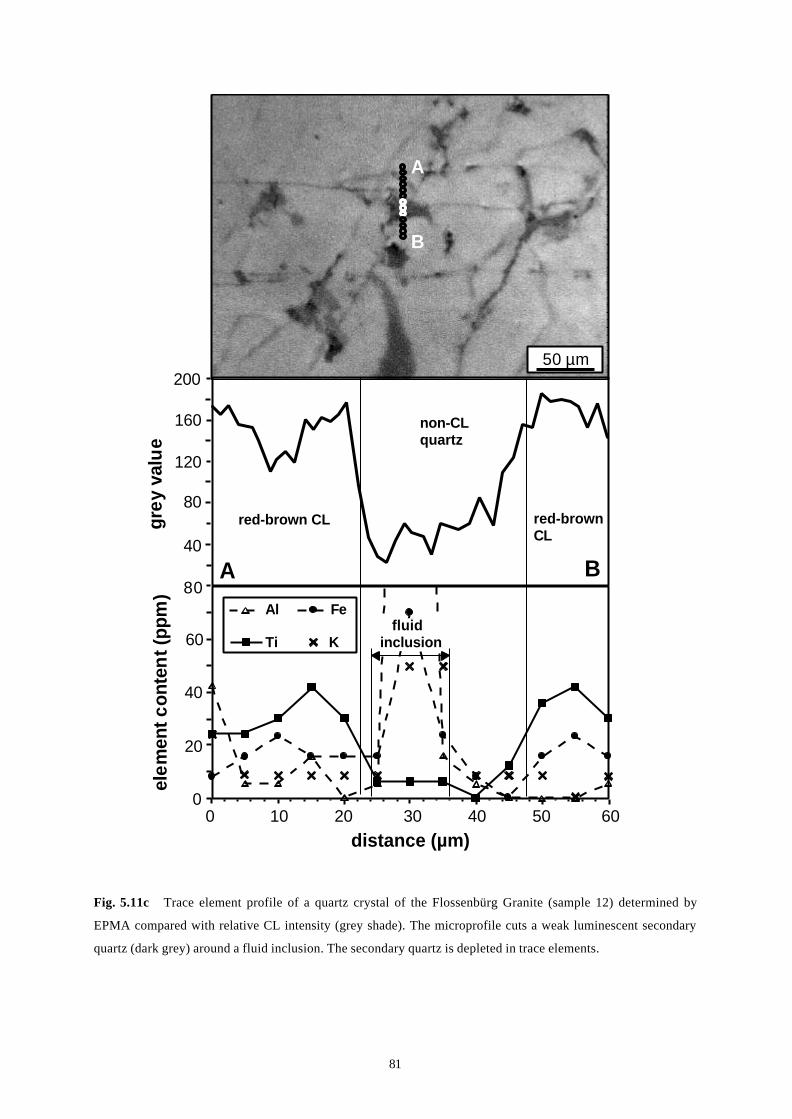
81
Fig. 5.11c Trace element profile of a quartz crystal of the Flossenbürg Granite (sample 12) determined by
EPMA compared with relative CL intensity (grey shade). The microprofile cuts a weak luminescent secondary
quartz (dark grey) around a fluid inclusion. The secondary quartz is depleted in trace elements.
A
B
50 µm
distance (µm)
elem
ent c
onte
nt (
ppm
)gr
ey v
alu
e
Al Fe
Ti K
A B
200
120
160
80
40
non-CLquartz
red-brown CL
80
60
40
20
00 10 20 30 40 50 60
red-brownCL
fluidinclusion

82
Fig. 5.12a, b Plots of trace element concentration of quartz. a – Al vs Ti determined by EPMA. b – Li vs. Ge
determined by LA-ICPMS.
0
20
40
60
80
100
120
140
1 10 100 1000 10000
Al (ppm)
15 Weinheim Rhyolite
10 Wachtelberg Rhyolite
11 Beucha Rhyolite
12 Flossenbuerg Granite
14 Ramberg Granite
8 Aue Granite
1 Megaquartz
2 Fissile Quartz
3 Oil-bearing Quartz
13 Leucosome Quartz
9 Vein Quartz
detection limit
a
0
2
4
6
8
10
12
14
16
0 20 40 60 80 100 120 140
Li (ppm)
2 Fissile Quartz
3 Oil-bearing Quartz
1 Megaquartz
10 Wachtelberg Rhyolite
7 Eibenstock Granite
11 Beucha Rhyolite
12 Flossenbuerg Granite
8 Aue Granite
14 Ramberg Granite
5 Teplice Rhyolite
15 Weinheim Rhyolite
13 Leucosome Quartzdetection limit
b
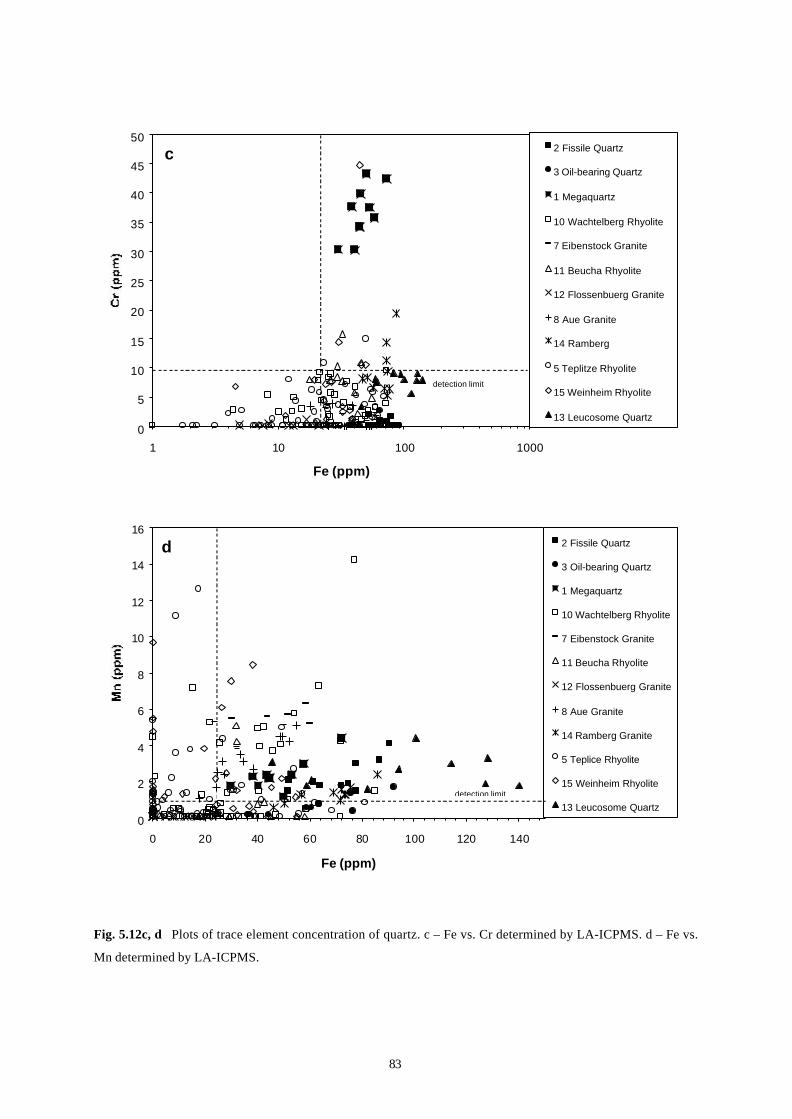
83
Fig. 5.12c, d Plots of trace element concentration of quartz. c – Fe vs. Cr determined by LA-ICPMS. d – Fe vs.
Mn determined by LA-ICPMS.
0
5
10
15
20
25
30
35
40
45
50
1 10 100 1000
Fe (ppm)
2 Fissile Quartz
3 Oil-bearing Quartz
1 Megaquartz
10 Wachtelberg Rhyolite
7 Eibenstock Granite
11 Beucha Rhyolite
12 Flossenbuerg Granite
8 Aue Granite
14 Ramberg
5 Teplitze Rhyolite
15 Weinheim Rhyolite
13 Leucosome Quartz
detection limit
c
0
2
4
6
8
10
12
14
16
0 20 40 60 80 100 120 140
Fe (ppm)
2 Fissile Quartz
3 Oil-bearing Quartz
1 Megaquartz
10 Wachtelberg Rhyolite
7 Eibenstock Granite
11 Beucha Rhyolite
12 Flossenbuerg Granite
8 Aue Granite
14 Ramberg Granite
5 Teplice Rhyolite
15 Weinheim Rhyolite
13 Leucosome Quartzdetection limit
d

84
Fig. 5.13 Variation diagrams of relative concentrations (X/30Si, where X = 6 Li, 23Na, 27Al, 39K, 54Fe, 48Ti) of
trace elements determined by SIMS.

85
Fig. 5.14 Correlation of average Ti concentration with the peak area of the 2.96 eV emission.
A band with low half-width indicates a well definite bond, which is not effected by other bond
vibrations. Sharp bands are developed if H-related bonds are isolated and have a sufficient
large distance to similar bonds. The sharp peaks at 3365 and 3305 cm-1, attributed to proton-
compensated aluminium defects, are the most significant peaks in the hydroxyl band. The Al-
H-defects ([AlO 4/H+]0 centres) are very stable up to temperatures of 1000°C (Kats, 1962;
Schneider, 1993). The peak at 3474 cm-1 was assigned by Kats (1962) to proton-compensated
aluminium defect perturbed by Li+ (marked as “Li-H” in Fig. 5.15). This absorption band was
absent after >450°C quartz heating (Schneider, 1993).
Molecular water exists in the quartz lattice as micropores and fluid inclusions as well as
structural bound water. The vibrations of the water molecules affect one another which results
in broader absorbed wavelength ranges. At room temperature the broad absorption bands at
3440 cm-1 are caused by the asymmetrical stretching vibrations and the 3220 cm-1 and 3110
cm-1 bands by the symmetrical stretching vibrations of molecular water (Aines and Rossman,
1984). To distinguish fluid water from crystallographic bounded water, spectra are obtained at
cryogenic temperatures between -190 and -194°C. The change of the state from the water to
ice during sample cooling results in the quenching of the asymmetrical vibrations (3440 cm-1)
in the crystal lattice and the rise of the symmetric vibrations (3220 cm-1 and 3110 cm-1).
1
10
100
0 0.5 1 1.5 2 2.5
2.96eV/2.68eV-peak area ratio after 7min electron radiation
8 Aue Granite
11 Beucha Rhyolite - blue CL
11Beucha Rhyolite - red CL
13 Leucosome Quartz
12 Flossenbuerg Granite
1 Megaquartz
3 Oil-bearing Quartz
14 Ramberg Granite
6 Schellerhau Granite - blue CL
6 Schellerhau Granite - red CL
4 Fissile Quartz
10 Wachtelberg Rhyolite
15 Weinheim Rhyolite - blue CL
15 Weinheim Rhyolite - red CL
9 Vein Quartz

86
Structural bounded OH-groups can not change into solid H2O (ice). The change into the solid
state of water presupposed, that the water molecules are able to built hydrogen bonds which
can be problematic if the number of water molecules is small (Aines and Rossman, 1984).
Fig. 5.15 Representative IR-absorption spectra of different quartz types measured at ~190°C.
The IR absorption spectra of one sample recorded along profiles are very homogeneous.
There is no variation of Al-H- and Li-H-defect concentrations found in different growth zones
of the rhyolitic phenocrysts (sample 11). The lack of correlation between spectroscopic data
and growth zoning in the quartz phenocrysts shows that neither proton-compensated Al nor
Li-defect concentrations control the luminescence contrast of this growth zones. Similar
observations were made by Liebetrau (1991) and Schneider (1993) in rhyolitic quartz
phenocrysts.
The associated 3365 and 3305 cm-1 absorption bands are found in all spectra and are
indicative for proton-compensated Al defects (Fig. 5.15). The bands are most intense in
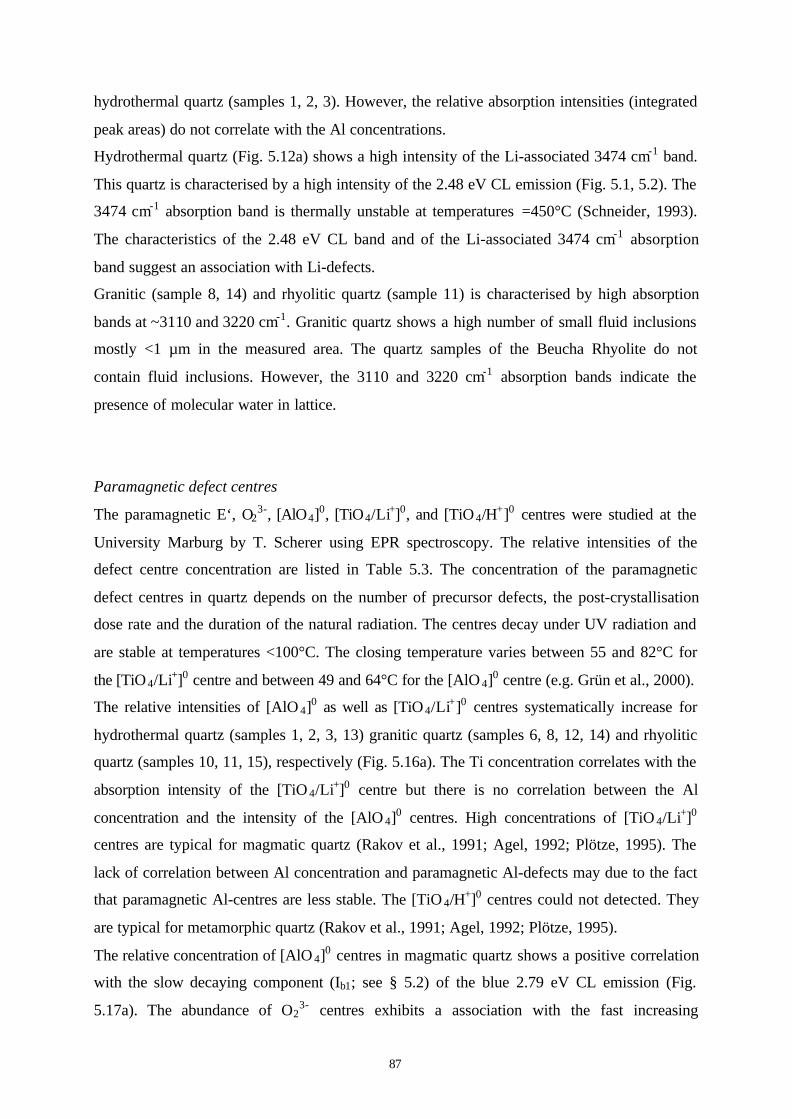
87
hydrothermal quartz (samples 1, 2, 3). However, the relative absorption intensities (integrated
peak areas) do not correlate with the Al concentrations.
Hydrothermal quartz (Fig. 5.12a) shows a high intensity of the Li-associated 3474 cm-1 band.
This quartz is characterised by a high intensity of the 2.48 eV CL emission (Fig. 5.1, 5.2). The
3474 cm-1 absorption band is thermally unstable at temperatures =450°C (Schneider, 1993).
The characteristics of the 2.48 eV CL band and of the Li-associated 3474 cm-1 absorption
band suggest an association with Li-defects.
Granitic (sample 8, 14) and rhyolitic quartz (sample 11) is characterised by high absorption
bands at ~3110 and 3220 cm-1. Granitic quartz shows a high number of small fluid inclusions
mostly <1 µm in the measured area. The quartz samples of the Beucha Rhyolite do not
contain fluid inclusions. However, the 3110 and 3220 cm-1 absorption bands indicate the
presence of molecular water in lattice.
Paramagnetic defect centres
The paramagnetic E‘, O23-, [AlO4]0, [TiO4/Li+]0, and [TiO 4/H+]0 centres were studied at the
University Marburg by T. Scherer using EPR spectroscopy. The relative intensities of the
defect centre concentration are listed in Table 5.3. The concentration of the paramagnetic
defect centres in quartz depends on the number of precursor defects, the post-crystallisation
dose rate and the duration of the natural radiation. The centres decay under UV radiation and
are stable at temperatures <100°C. The closing temperature varies between 55 and 82°C for
the [TiO4/Li+]0 centre and between 49 and 64°C for the [AlO 4]0 centre (e.g. Grün et al., 2000).
The relative intensities of [AlO 4]0 as well as [TiO4/Li+]0 centres systematically increase for
hydrothermal quartz (samples 1, 2, 3, 13) granitic quartz (samples 6, 8, 12, 14) and rhyolitic
quartz (samples 10, 11, 15), respectively (Fig. 5.16a). The Ti concentration correlates with the
absorption intensity of the [TiO 4/Li+]0 centre but there is no correlation between the Al
concentration and the intensity of the [AlO 4]0 centres. High concentrations of [TiO 4/Li+]0
centres are typical for magmatic quartz (Rakov et al., 1991; Agel, 1992; Plötze, 1995). The
lack of correlation between Al concentration and paramagnetic Al-defects may due to the fact
that paramagnetic Al-centres are less stable. The [TiO 4/H+]0 centres could not detected. They
are typical for metamorphic quartz (Rakov et al., 1991; Agel, 1992; Plötze, 1995).
The relative concentration of [AlO 4]0 centres in magmatic quartz shows a positive correlation
with the slow decaying component (Ib1; see § 5.2) of the blue 2.79 eV CL emission (Fig.
5.17a). The abundance of O23- centres exhibits a association with the fast increasing

88
component (Ir2; see § 5.2) of the red 1.96 eV CL emission (Fig. 5.17b). This corresponds with
the general observation, that the 1.96 eV emission is associated with non-bridging oxygen
hole centres (NBOHC) with OH-precursor (e.g. Kalceff and Phillips, 1995). The
paramagnetic O23- centre is a kind of NBOHC (see chapter 2). Silanol groups (=Si-O-H) are
favourable precursors O23- centres in quartz. Upon irradiation H+ diffuses away and NBOHC
are formed (e.g. O-, O23-) resulting in an increase of the 1.96 eV CL emission.
Table 5.3 List of relative intensity of paramagnetic defect centres determined by EPR spectroscopy.
No.
Sample name Quartz type ESR intensity of paramagnetic defect centres (a.u.)
[AlO4]0 [TiO4/Li+]0 O23- E’-centre
1 megaquartz hydrothermal 0.38 0 0.422 0.0682 fissile quartz hydrothermal 0 0 0 03 oil-bearing quartz hydrothermal 0.691 0 0.68 0.684 Schoenfeld Rhyolite rhyolitic n.d.* n.d.* n.d.* n.d.*
5 Teplice Rhyolite (TPR2) rhyolitic 12.77 0.221 1.128 0.7196 Schellerhau Granite granitic 11.689 0.948 0.906 0.3297 Eibenstock Granite granitic 3.124 0.516 1.57 0.2878 Aue Granite granitic 5.003 0.95 1.177 0.1719 vein quartz hydrothermal n.d.* n.d.* n.d.* n.d.*
10 Wachtelberg Rhyolite rhyolitic 27.94 1.27 0.749 0.43911 Beucha Rhyolite rhyolitic 14.03 1.499 0.302 0.80112 Flossenbuerg Granite granitic 8.933 0.414 0.604/ 0.682 0.14113 leucosome quartz pegmatoid 0.244 0.159 0 014 Ramberg Granite granitic 5.195 0.445 1.365 0.05815 Weinheim Rhyolite rhyolitic 11.87 1.505 0.435 0.111n.d.* - not determined
Fig. 5.16 Results of EPR spectroscopy. a - EPR intensity of the [AlO4]0 vs the [TiO4/Li+]0 centre of different
quartz types. High temperature formed quartzes exhibit the highest concentrations. b – Ti concentration vs EPR
intensity of the [TiO4/Li+]0 centre. Quartzes with high Ti content show a high the [TiO4/Li+]0 defect
concentration.
0
0.2
0.4
0.6
0.8
1
1.2
1.4
1.6
1.8
2
0 5 10 15 20 25 30
EPR intensity of [AlO4]0 (a.u.)
8 Aue Granite
11 Beucha Rhyolite
13 Leucosome Quartz
12 Flossenbuerg Granite
1 Megaquartz
3 Oil-bearing Quartz
14 Ramberg Granite
6 Schellerhau Granite
4 Fissile Quartz
10 Wachtelberg Rhyolite
15 Weinheim Rhyolite
a
0
0.2
0.4
0.6
0.8
1
1.2
1.4
1.6
0 20 40 60 80 100 120
Ti (ppm)
8 Aue Granite
11 Beucha Rhyolite
13 Leucosome Quartz
12 Flossenbuerg Granite
1 Megaquartz
3 Oil-bearing Quartz
14 Ramberg Granite
6 Schellerhau Granite
2 Fissile Quartz
10 Wachtelberg Rhyolite
15 Weinheim Rhyolite
b
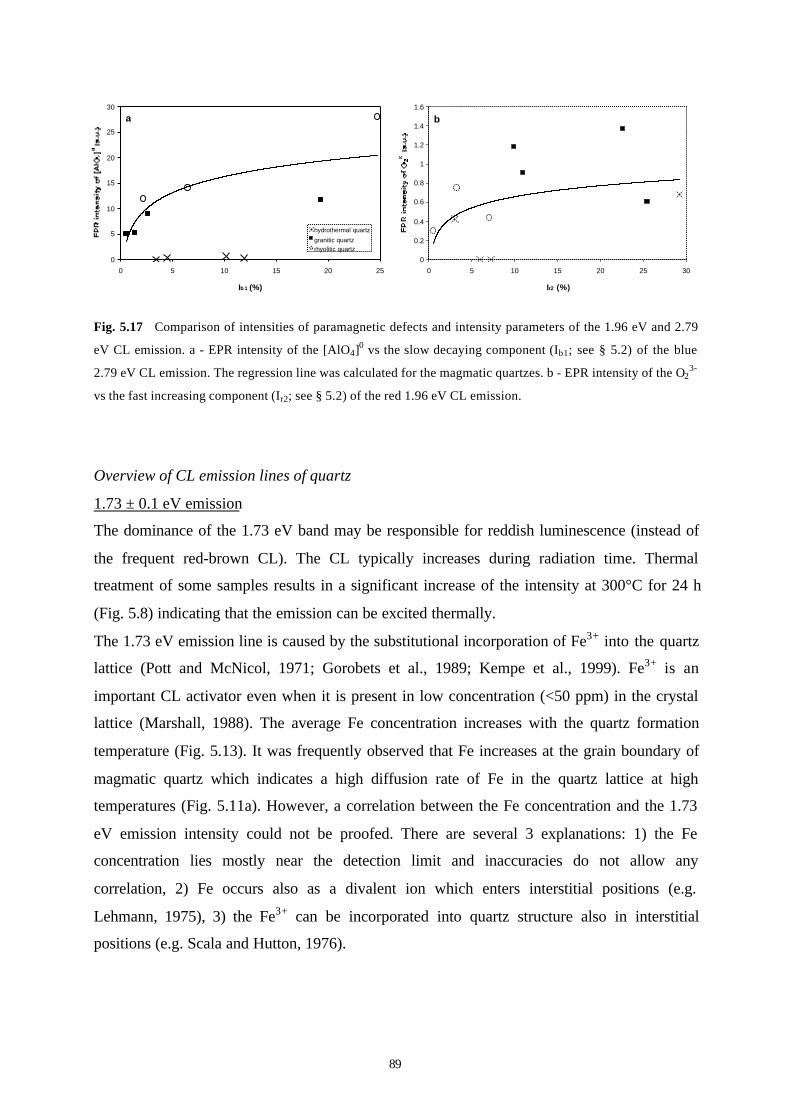
89
Fig. 5.17 Comparison of intensities of paramagnetic defects and intensity parameters of the 1.96 eV and 2.79
eV CL emission. a - EPR intensity of the [AlO4]0 vs the slow decaying component (Ib1; see § 5.2) of the blue
2.79 eV CL emission. The regression line was calculated for the magmatic quartzes. b - EPR intensity of the O23-
vs the fast increasing component (Ir2; see § 5.2) of the red 1.96 eV CL emission.
Overview of CL emission lines of quartz
1.73 ± 0.1 eV emission
The dominance of the 1.73 eV band may be responsible for reddish luminescence (instead of
the frequent red-brown CL). The CL typically increases during radiation time. Thermal
treatment of some samples results in a significant increase of the intensity at 300°C for 24 h
(Fig. 5.8) indicating that the emission can be excited thermally.
The 1.73 eV emission line is caused by the substitutional incorporation of Fe3+ into the quartz
lattice (Pott and McNicol, 1971; Gorobets et al., 1989; Kempe et al., 1999). Fe3+ is an
important CL activator even when it is present in low concentration (<50 ppm) in the crystal
lattice (Marshall, 1988). The average Fe concentration increases with the quartz formation
temperature (Fig. 5.13). It was frequently observed that Fe increases at the grain boundary of
magmatic quartz which indicates a high diffusion rate of Fe in the quartz lattice at high
temperatures (Fig. 5.11a). However, a correlation between the Fe concentration and the 1.73
eV emission intensity could not be proofed. There are several 3 explanations: 1) the Fe
concentration lies mostly near the detection limit and inaccuracies do not allow any
correlation, 2) Fe occurs also as a divalent ion which enters interstitial positions (e.g.
Lehmann, 1975), 3) the Fe3+ can be incorporated into quartz structure also in interstitial
positions (e.g. Scala and Hutton, 1976).
0
5
10
15
20
25
30
0 5 10 15 20 25
Ib 1 (%)
hydrothermal quartz
granitic quartzrhyolitic quartz
a
0
0.2
0.4
0.6
0.8
1
1.2
1.4
1.6
0 5 10 15 20 25 30
Ir2 (%)
b

90
1.85 ± 0.1 and 1.96 ± 0.2 eV emission
The dominant peak of the red emission range of most quartzes is given by the 1.96 eV band.
The weak 1.85 eV emission is associated with the 1.96 eV band as both emissions show a
constant peak area ratio (1.96 : 1.84 eV = 1 : 0.51±0.17). The emissions are characterised by
an parabolic increase during electron radiation. The only exception is the vein quartz (sample
9), for which no red CL emission was observed. The intensity increase is generally steeper in
quartz formed at low temperature and flatter in quartzes in rhyolite, where these lines show
already a high initial intensity. The 1.96 and 1.85 eV bands of the rhyolitic quartzes are often
very distinct as the neighbouring 1.73 and 2.15 eV emissions normally have low intensities.
The emission is slightly influenced by the sample warming during electron radiation (Fig.
5.6). Furthermore the heating at 300°C for 24 h results in an intensity increase of both 1.85
and 1.96 eV bands (Fig. 5.8). This is in agreement with Rink et al. (1993) who observed that
radiated rhyolitic quartz phenocrysts show an intense red thermoluminescence band centred at
1.96-2.0.
The concentration of O23- centres shows a weak association with the unstable component of
the 1.96 eV emission (Fig. 5.17b). This corresponds with the general observation, that the 1.96
eV emission is associated with non-bridging oxygen hole centres (NBOHC) like O23- and O-
centres (e.g. Siegel and Marrone, 1981; Kalceff and Phillips, 1995). OH-precursors are the
proposed cause for the creation of this NBOHC (e.g. Griscom, 1985; Friebele et al., 1985;
Kalceff and Phillips, 1995). Upon irradiation H+ diffuses away and NBOHC are formed
resulting in an increase of the 1.96 eV CL emission. According to Griscom (1985) the
paramagnetic E’centre (≡Si·) and/or the diamagnetic trapped-electron center (≡Si:) are
important causes for the emission at 1.96 eV besides the NBOHC. Defects related to
structural water have been assumed as possible precursor centres. Koyama (1980) assumed
that this emission may originate from hydrogen in the form of OH or adsorbed H2O in the
quartz lattice. The 1.85 eV band is similarly associated with NBOHC (Griscom, 1985; Kalceff
and Phillips, 1995). Possible precursors of the NBOHC are peroxy linkages, “strained”
silicon-oxygen bonds, and/or hydroxyl groups.
Greenschist facial deformed granitic quartz from the Lachlan Fold Belt (see § 10.7) show a
constant or decreasing 1.96 eV and 1.85 eV emissions during electron bombardment. This
quartz contains finely dispersed muscovite flakes of up to 0.5 µm in diameter, which are
arranged on micro-sliding planes. The flakes are interpreted as products of deformation. They
incorporated the stress-induced mobilised structural water of the quartz lattice. Therefore,

91
nearly no interstitial bonded water occurs in the quartz lattice, which would have caused the
rise of red intensity during electron radiation due to the radiolysis of hydroxyl bonds.
Both 1.96 and 1.85 eV emissions do not generally correlate with the Al distribution. High Al
concentrations (>1000 ppm) are associated with the 2.79 eV emission (see below) and the
3.26 eV emission (Alonso et al., 1983; Luff and Townsend, 1990; Perny et al., 1992; Gorton
et al., 1996). This lack of correlation may explained as follows: 1) the substitutional position
compensated by hydroxyl defects may be occupied also by other ions like Fe3+, 2) Al may
occur also in interstitial sites (Cohen, 1960), and 3) Al is in part present in the form of micro-
inclusions (Blankenburg et al., 1994; Götze et al., 1999).
2.15 ± 0.2 eV emission
The 2.15 eV emission band (yellow) is dominant for granitic quartz (samples 7, 8, 12). It is
the only emission band whose intensity remains relatively constant during electron radiation
implying a stable luminescence centre. The quartz of the Eibenstock and Aue Granite
showing high-intensity 2.15 eV emission exhibit high Mn suggesting that the emission may
caused by Mn.
According to Lysakov (1978) Mn in quartz has characteristic CL at 1.92, 2.23, and 2,6 eV in
quartz. The latter peak is caused by the trivalent ion and the other two by the bivalent ion. The
2.15 eV band was observed by Itoh et al. (1990), Remond et al. (1992), Fuchs and Götze
(1996) and Götze et al. (1999). Rink et al. (1993) described a thermoluminecence peak
centred between 2.14 eV – 2.21 eV in natural quartz of hydrothermal origin. Itoh et al. (1990)
proposed that electron radiation of α-quartz generates pairs of E’ centres (≡Si⋅) and peroxy
radicals (≡Si-O-O⋅) showing luminescence at 2.1 eV as well as self trapped excitons (STE)
showing luminescence at 2.8 eV. However, an association of the the 2.15 eV and 2.79 eV
emission could not be detected. According to Fuchs and Götze (1996) and Götze et al. (1999)
the predominance of the 2.15 eV emission of some agates and of hydrothermal quartz is
associated with the high concentration of E’ centres. In this study a correlation between EPR
intensity of the E’ centre and the peak area of the 2.15 eV band has not been found.
2.48 ± 0.2 eV emission
Hydrothermal quartz (megaquartz and oil-bearing quartz) exhibit a significant 2.48 eV peak at
initial electron bombardment causing a turquoise CL at initial radiation. This emission rapidly
decays during the first minute of electron bombardment. The emission is thermally stable up
to 300°C, however it is destroyed after heating at 600°C for 24 h. The samples of
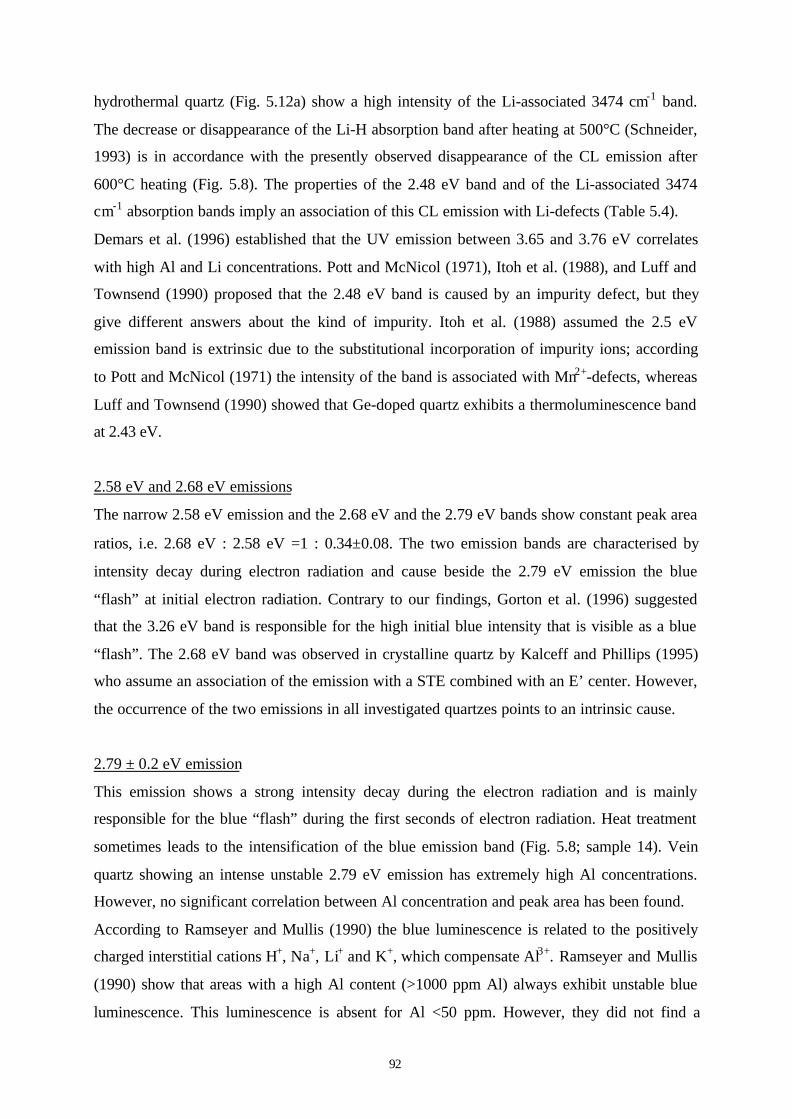
92
hydrothermal quartz (Fig. 5.12a) show a high intensity of the Li-associated 3474 cm-1 band.
The decrease or disappearance of the Li-H absorption band after heating at 500°C (Schneider,
1993) is in accordance with the presently observed disappearance of the CL emission after
600°C heating (Fig. 5.8). The properties of the 2.48 eV band and of the Li-associated 3474
cm-1 absorption bands imply an association of this CL emission with Li-defects (Table 5.4).
Demars et al. (1996) established that the UV emission between 3.65 and 3.76 eV correlates
with high Al and Li concentrations. Pott and McNicol (1971), Itoh et al. (1988), and Luff and
Townsend (1990) proposed that the 2.48 eV band is caused by an impurity defect, but they
give different answers about the kind of impurity. Itoh et al. (1988) assumed the 2.5 eV
emission band is extrinsic due to the substitutional incorporation of impurity ions; according
to Pott and McNicol (1971) the intensity of the band is associated with Mn2+-defects, whereas
Luff and Townsend (1990) showed that Ge-doped quartz exhibits a thermoluminescence band
at 2.43 eV.
2.58 eV and 2.68 eV emissions
The narrow 2.58 eV emission and the 2.68 eV and the 2.79 eV bands show constant peak area
ratios, i.e. 2.68 eV : 2.58 eV =1 : 0.34±0.08. The two emission bands are characterised by
intensity decay during electron radiation and cause beside the 2.79 eV emission the blue
“flash” at initial electron radiation. Contrary to our findings, Gorton et al. (1996) suggested
that the 3.26 eV band is responsible for the high initial blue intensity that is visible as a blue
“flash”. The 2.68 eV band was observed in crystalline quartz by Kalceff and Phillips (1995)
who assume an association of the emission with a STE combined with an E’ center. However,
the occurrence of the two emissions in all investigated quartzes points to an intrinsic cause.
2.79 ± 0.2 eV emission
This emission shows a strong intensity decay during the electron radiation and is mainly
responsible for the blue “flash” during the first seconds of electron radiation. Heat treatment
sometimes leads to the intensification of the blue emission band (Fig. 5.8; sample 14). Vein
quartz showing an intense unstable 2.79 eV emission has extremely high Al concentrations.
However, no significant correlation between Al concentration and peak area has been found.
According to Ramseyer and Mullis (1990) the blue luminescence is related to the positively
charged interstitial cations H+, Na+, Li+ and K+, which compensate Al3+. Ramseyer and Mullis
(1990) show that areas with a high Al content (>1000 ppm Al) always exhibit unstable blue
luminescence. This luminescence is absent for Al <50 ppm. However, they did not find a
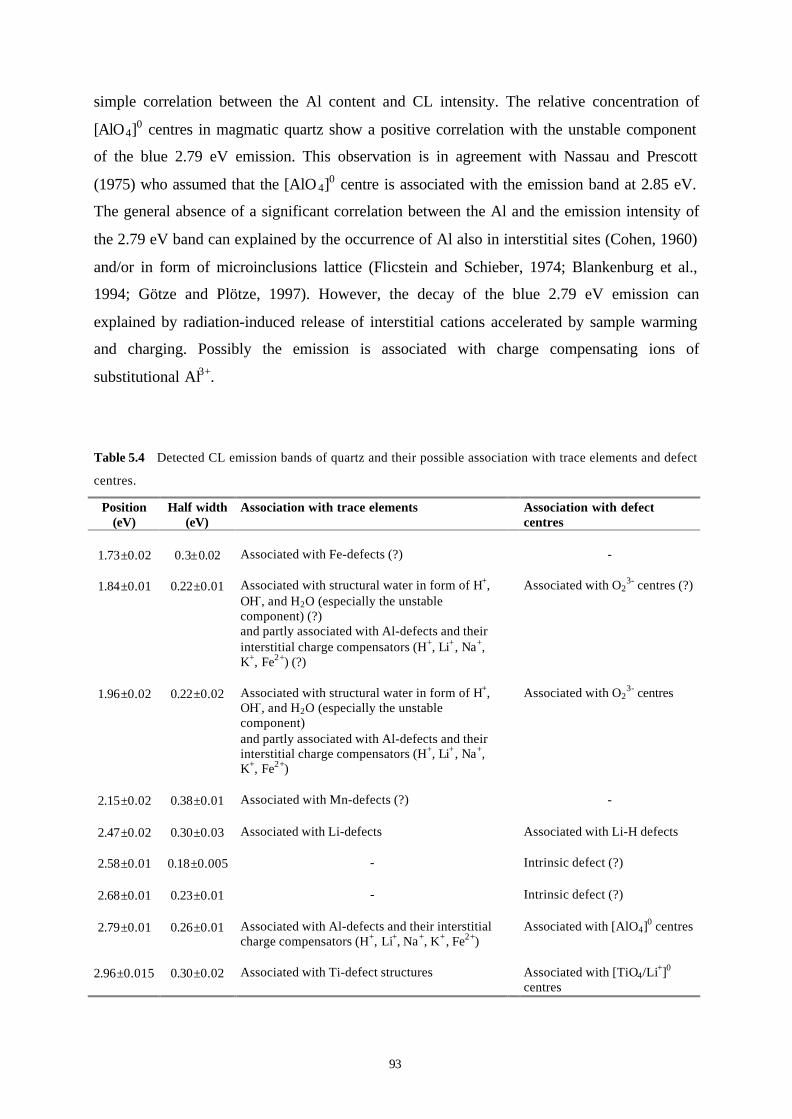
93
simple correlation between the Al content and CL intensity. The relative concentration of
[AlO4]0 centres in magmatic quartz show a positive correlation with the unstable component
of the blue 2.79 eV emission. This observation is in agreement with Nassau and Prescott
(1975) who assumed that the [AlO 4]0 centre is associated with the emission band at 2.85 eV.
The general absence of a significant correlation between the Al and the emission intensity of
the 2.79 eV band can explained by the occurrence of Al also in interstitial sites (Cohen, 1960)
and/or in form of microinclusions lattice (Flicstein and Schieber, 1974; Blankenburg et al.,
1994; Götze and Plötze, 1997). However, the decay of the blue 2.79 eV emission can
explained by radiation-induced release of interstitial cations accelerated by sample warming
and charging. Possibly the emission is associated with charge compensating ions of
substitutional Al3+.
Table 5.4 Detected CL emission bands of quartz and their possible association with trace elements and defect
centres.
Position(eV)
Half width(eV)
Association with trace elements Association with defectcentres
1.73±0.02 0.3±0.02 Associated with Fe-defects (?) -
1.84±0.01 0.22±0.01 Associated with structural water in form of H+,OH-, and H2O (especially the unstablecomponent) (?)and partly associated with Al-defects and theirinterstitial charge compensators (H+, Li+, Na+,K+, Fe2+) (?)
Associated with O23- centres (?)
1.96±0.02 0.22±0.02 Associated with structural water in form of H+,OH-, and H2O (especially the unstablecomponent)and partly associated with Al-defects and theirinterstitial charge compensators (H+, Li+, Na+,K+, Fe2+)
Associated with O23- centres
2.15±0.02 0.38±0.01 Associated with Mn-defects (?) -
2.47±0.02 0.30±0.03 Associated with Li-defects Associated with Li-H defects
2.58±0.01 0.18±0.005 - Intrinsic defect (?)
2.68±0.01 0.23±0.01 - Intrinsic defect (?)
2.79±0.01 0.26±0.01 Associated with Al-defects and their interstitialcharge compensators (H+, Li+, Na+, K+, Fe2+)
Associated with [AlO4]0 centres
2.96±0.015 0.30±0.02 Associated with Ti-defect structures Associated with [TiO4/Li+]0
centres

94
2.96 ± 0.2 eV emission
This band represents the more stable part of the blue CL emission and is characteristic for
rhyolitic quartz (sample 5, 15) as well as for granitic quartz (sample 7, 12, 14; Fig. 5.1, 5.3).
A good correlation between the emission intensity and Ti distribution was found (Fig. 5.14).
Heating at 600°C for 24 h results in the intensification (sample 15) as well as the creation
(sample 1) of the 2.96 eV band after (Fig. 5.8, 5.9).
Rink et al. (1993) observed thermoluminescence emission at 2.85-2.95 eV for magmatic
quartz. Kalceff and Phillips (1995) assumed that the origin of the 2.95 eV emission is possibly
related to irradiation producing intrinsic defects. Koyama (1980) observed blue CL in carbon-
implanted SiO 2. Like Ti4+ carbon enter the substitutional position in the SiO 4 tetrahedra.
Although the Ti content closely correlates with the 2.96 eV emission, it is not clear whether
Ti is a CL activator or sensitizer (Table 5.4).

95
6 Genetic significance of CL structures and
trace element distribution
6.1 Impurity uptake during quartz crystallisation in silicate melts
The rhyolites (samples 4, 5, 10, 11, 15) as well as a number of the sampled granites (samples
6, 7, 8, 14) contain euhedral quartz phenocrysts showing a CL-contrasted complex growth
pattern (Fig. 5.11, 6.1, 6.2a-f, 7.6; Plate 1). The euhedral phenocrysts of granites are
recognisable only by using CL because they are overgrown and embedded in a homogeneous
anhedral quartz phase. The existence of euhedral quartz phenocrysts in granites showing CL-
contrasted growth textures is currently not known to be common and was described in only a
few cases (Frentzel-Beyme, 1989; Seltmann, 1994; D’Lemos et al., 1997; Müller and Behr,
1997). The questions arises if this granitic phenocrysts are comparable phenocrysts occurring
in rhyolites and if they represent a similar crystallisation environment.
A main result of the trace element analysis is that the stable blue CL of the phenocrysts
correlates with high Ti concentrations and that the variation of Ti is mainly responsible for the
contrasting of the magmatic zoning of the quartz phenocrysts (see chapter 7 and 9). Caused by
its high field strength (F = 1.04) Ti4+ can substitute Si only at high temperatures. High Ti
concentrations in macroscopically rutile-free quartz generally indicate formation temperatures
=500°C (Blankenburg et al., 1994). High Ti concentrations are also typical for quartz in
granulites (Kerkhof and Müller, 1999). To understand the variation of the Ti concentration in
quartz phenocrysts the growth textures were classified according their structure. The
classification of growth zoning is necessary to distinguish between zoning caused by self-
organised growth and zoning caused by physico-chemical changes of external factors such as
temperature, pressure and magma composition (e.g. Bottinga et al., 1966; Allègre et al., 1981;
Shore and Fowler, 1996). The zoning caused by external factors is of great interest for the
reconstruction of the crystallisation history of felsic melts (magma storage, ascent, mixing,
emplacement, and cooling rate) which will applied in the in the chapters 7-10.

96

97
Plate 1 CL images of magmatic quartz. a – Quartz of the Flossenbuerg Granite (sample 12) showing a weak
red-brown CL and a dense network of healed cracks. b – Edge of a zoned quartz phenocryst with blue CL
overgrown by red-brown luminescent matrix quartz (Schellerhau Granite, sample 6). c – Quartz phenocryst of
the Schellerhau Granite with complex growth pattern overgrown by red-brown luminescent anhedral matrix
quartz. d - Zoned quartz phenocryst of the Teplice Rhyolite (sample 5). Resorption of the phenocryst surface
causes the truncation of pre-existing growth zones. Note the small quartz fragments around the phenocryst which
indicate a mechanical abrasion during transport in the melt. e - Zoned quartz phenocryst of the Teplice Rhyolite.
f – Zoned quartz phenocryst of the Teplice Rhyolite with red-brown luminescent core. g – Edge of a zoned
quartz phenocryst of the Weinheim Rhyolite (sample 15) with a melt inclusion. The zoning fits the shape of the
melt inclusion (black with red rim). h - Zoned quartz phenocryst twin of the Weinheim Rhyolite which exhibits
resorpted red-brown luminescent cores, melt inclusions (black), and healed cracks (pink lines).
Fig. 6.1 CL images of rhyolitic quartz phenocrysts recorded with a JEOL CLD40 R712 detector. a – Phenocryst
from the Weinheim Rhyolite (sample 15). b – Phenocryst from the Beucha Rhyolite (sample 11). Note the
anhedral, unzoned, bright quartz phase which overgrows the resorpted core with complex zoning pattern.
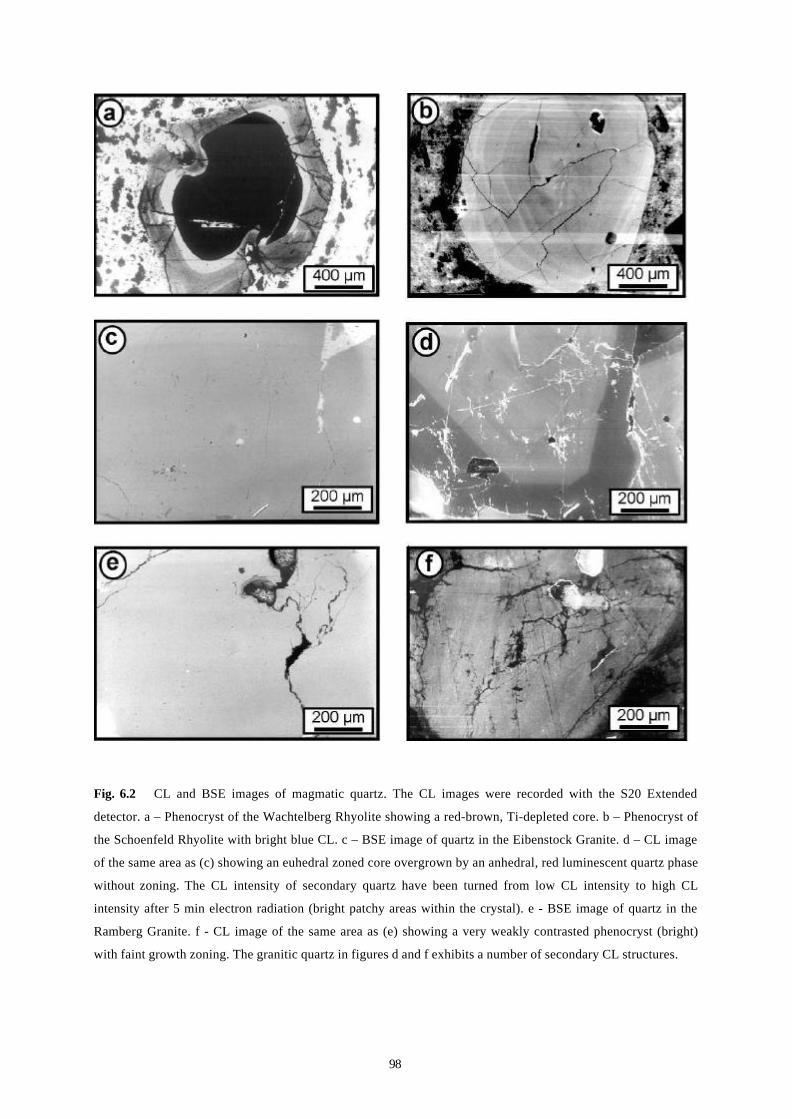
98
Fig. 6.2 CL and BSE images of magmatic quartz. The CL images were recorded with the S20 Extended
detector. a – Phenocryst of the Wachtelberg Rhyolite showing a red-brown, Ti-depleted core. b – Phenocryst of
the Schoenfeld Rhyolite with bright blue CL. c – BSE image of quartz in the Eibenstock Granite. d – CL image
of the same area as (c) showing an euhedral zoned core overgrown by an anhedral, red luminescent quartz phase
without zoning. The CL intensity of secondary quartz have been turned from low CL intensity to high CL
intensity after 5 min electron radiation (bright patchy areas within the crystal). e - BSE image of quartz in the
Ramberg Granite. f - CL image of the same area as (e) showing a very weakly contrasted phenocryst (bright)
with faint growth zoning. The granitic quartz in figures d and f exhibits a number of secondary CL structures.

99
The development of growth zoning during magmatic crystallisation is described by a number
of models (e.g. Sibley et al., 1976; Anderson, 1984; Fowler, 1990) that have been derived
from the growth zoning of plagioclase. We apply these models to the crystallisation of
magmatic quartz having a very similar growth zoning as plagioclase. Below an interpretation
of growth textures in quartz phenocrysts is given, based on our observations and the present
level of knowledge, to explain the variations of impurity uptake in magmatic quartz. The
compilation of growth textures is illustrated in Fig. 7.1 (chapter 7).
During crystallisation of a mineral four processes are competing and the overall growth rate-
controlling process is the slowest one: 1) the reactions occurring at the crystal-melt interface,
2) the bulk diffusion of components in the melt close to the interface, 3) the production and
dissipation of the latent crystallisation heat at the interface, and 4) the relative flow of the melt
with respect to the interface. The latter two are not critical since heat diffusivities are one to
several orders of magnitude higher than mass diffusivities (Dowty, 1980) and the crystal
settling effects in a magma chamber are small for viscous silicate melts. Therefore, processes
1) and 2) control are the main parameters controlling the crystal growth rate. A crystal can
grow only if the thermodynamic variables for the formation of that phase exceed the
equilibrium conditions. This overstepping (undercooling, overheating, supersaturation)
provides energy by which nuclei are formed and crystal growth is sustained. The nuclei
provide sinks to which the crystallising components diffuse. The distance over which
elements are transported by diffusion depends on the diffusion rate and time.
The microscopic topography of individual growth zones is a relic crystal-melt interface and is
indicative for disturbances of growth and diffusion rates during crystallisation. These
parameters depend on the melt composition, crystal transport in the melt (e.g., convection),
the ascent velocity of the melt, and pressure- and temperature variations. These criteria
regulate the type and quantity of trace elements, few of which are CL-activators. Thickness
and frequency of the zones are directly related to the physical and chemical melt properties.
The diffusion rate in the melt controls the compositional variation and width of the zoning.
The higher the diffusion rates, the less are the compositional differences in trace element
content in the quartz. Concentration gradients develop in the melt when the growth rate
exceeds the diffusion rate, and in the solid when the reaction rate of crystals with the liquid is
lower than the growth rate (Sibley et al., 1976). The development of growth zoning during
magmatic crystallisation was described by a number of models (e.g. Sibley et al., 1976;
Anderson, 1984) that have been derived from the zonal structure of plagioclase. We apply

100
these models to the crystallisation of magmatic quartz, which shows very similar zonal
growth as plagioclase.
Major discontinuities in the zoning (50 - 1000 µm width) being non-periodic and showing a
significant change of the luminescence colours result in physico-chemical changes of external
factors (“extrinsic” according to Shore and Fowler, 1996) such as temperature, pressure and
magma composition (Bottinga et al., 1966; Allègre et al., 1981). Bottinga et al. (1966) defined
the non-periodic zones as compositional zoning, and Allègre et al. (1981) called them stepped
zoning. Depending on the type of the physico-chemical change (degassing, magma mixing or
ascent) the trace element concentrations, mostly represented by variations of Ti and
sometimes of Al, show an abrupt change (see chapter 7).
The fine oscillatory zoning (2 - 20 µm width) within the step zones can be explained by a self-
organised (“intrinsic” according to Shore and Fowler, 1996) diffusion-controlled mechanism
on the crystal-melt boundary layer and plays a role exists in a number of models proposed by
several authors (Sibley et al., 1976; Haase et al., 1980; Allègre et al., 1981; Loomis, 1982;
Simakin, 1984; Pearce, 1993). Oscillatory growth zones form very slowly, at low degrees of
undercooling and oversaturation under near-equilibrium conditions. This is possible only
when the crystallising system on the solid-liquid interface is not disturbed, i.e. thus the melt
should not convect (Allègre et al., 1981). The self-organisation in the crystal-melt reaction
zone and boundary layer can be explained by the following model (e.g. Allègre et al., 1981;
Fig. 6.3): Saturation of silica in the reaction zone increases the quartz growth rate. The
increasing growth rate results in the decrease of silica concentration if the growth rate exceeds
the diffusion rate of silica. Simultaneously, quartz-foreign elements are accumulated in the
reaction zone and boundary layer. The high growth rate favours the incorporation of
impurities due to the change of planar to the cellular interfaces with rather high specific free
Fig. 6.3 Model system showing
schematic concentrations of
relevant species versus distance
from the surface of quartz crystal
in melt. The very low Na+ and K+
gradient is due to its high
diffusion coefficient (after Hess
1989).H , Ti , LiNa , K
Si 4+
4+
3+
+
+ +
+
crystal reactionzone
conc
entra
tion
of c
ompo
nent
boundarylayer
melt
Al
0 x

101
energy. The growth rate will slow down when quartz growth is so fast that silica becomes
depleted in the reaction zone and boundary layer. Consequently, the diffusion rate becomes
the dominant crystal growth controlling process. The growth rate starts to rise again as soon
as the silica in the reaction zone has been recovered. Investigations on natural plagioclase by
Greenwood and McTaggart (1957) and Wiebe (1968) confirm that oscillation zones of
crystals grown from the same melt and formed by self-organising character of processes
cannot be correlated. Physical or chemical changes in the bulk magma are not required to
develop oscillation zones. The self-organised growth causes only slight variations of Ti
upatke.
Wavy surfaces are sometimes observed between the straight-bordered growth zones. They are
characterised by convex inlets which are opposed to the growth direction. In contrast to
resorption surfaces which are resulted in sharp truncation of the regular zoning and rounded
crystal corners (e.g. Shore and Fowler, 1996) the inlets of the wavy surface are much smaller
and extend maximal 20 µm in the growth zones and do not cut older zones or round-off
corners. The subsequent growth zones are rectilinear bordered again and parallel to the
euhedral crystal habit. This feature is in contrast to the wavy zoning which is described for
plagioclase by Pearce and Kolisnik (1990), where the subsequent growth zones keep the wavy
structure. The wavy zones of quartz are interpreted as a small scale diffusion front caused by
rapid variation of the melt temperature and/or composition leading to changes of CL
properties developed during crystal growth.
Discussions about the distinction of resorption surfaces and growth impediments in quartz
phenocrysts have been controversial (Kozlowski, 1981; Harris and Anderson, 1984).
Laemmlein (1930) first recognised and described lobate depressions at the quartz crystal
surface as growth impediments. This result is in accordance with our CL observations which
show clearly that the zoning around lobate depressions, mineral-, and melt inclusions adapts
to the shape of the impediments. In contrast, resorption surfaces cut pre-existing growth
zones. Growth impediments are caused by immiscible liquids, vapor bubbles, molten sulfide
or fluid-rich melt droplets which stick on the crystal surface, hinder the crystal growth and
result in lobate depressions and entrapments (Kozlowski, 1981; Donaldson and Henderson,
1988; Lowenstern, 1995). The resorption (melting) of quartz surfaces is due to SiO 2-
undersaturation of the melt that may be caused by increase in temperature, isothermal
depressurisation or magma mixing. Crystals may undergo rounding due to chemical
interaction (melting) and mechanical abrasion during transport in the melt. The occurrence of
resorption which results in strong rounding of the quartz crystals is in accordance with the

102
rapid ascent of granitic melts by dyke formation as found by Holtz and Johannes (1994) and
Johannes and Holtz (1996).
The presence of skeletal (dendritic) growth indicates supercooling and the consequent
decrease of the diffusion/growth rate. Here, the compositional gradient on the crystal-melt
interface develops, but the planar crystal-melt interface becomes unstable and changes to
cellular and dendritic growth. This type of crystal growth results in skeletal (dendritic) crystal
morphologies (Kirkpatrick, 1981; Fowler, 1990).
The growth pattern in rhyolitic and granitic quartz phenocrysts are similar indicating a similar
crystallisation environment. Flick (1984; 1987) describes rhombohedral a-quartz phenocrysts
from the Weinheim Rhyolite (sample 15). Assuming a typical solidus of a rhyolitic melt of
900-950°C, a crystallisation pressure of at least 13 kbar is necessary for a-quartz
crystallisation (Flick 1987). This pressure corresponds with a formation depth of phenocrysts
in this rhyolite of about 40 km assuming a geothermal gradient of 20/25°C/km. Thomas
(1992) calculated the depth of quartz phenocryst crystallisation of granites of the Erzgebirge
(e.g. Eibenstock Granite) of up to 21 km provided by microthermometric studies of silicate
melts. Our observations and the two calculations of the crystallisation depth show that
euhedral quartz phenocrysts in rhyolites as well as granites exhibiting blue CL-contrasted
growth zoning represent a low to mid-crustal crystallisation environment.
Like shown above except for the oscillatory zoning all growth textures are caused by physico-
chemical changes of external factors such as temperature, pressure and magma composition
which result in the abruptly change of Ti concentration. In § 9.8 is shown that the Ti content
in quartz phenocrysts increases with increasing growth rate. Quartz phenocrysts frequently
show a Ti depletion in the red/red-brown luminescent crystal core (sample 5, 6, 10, 15)
indicating a slow growth rate during the early crystallisation stage (Fig. 6.2a).
6.2 Impurity uptake during quartz crystallisation in aqueous solution
Hydrothermal quartz shows similar growth patterns as magmatic quartz but the compositional
zoning is more dominant than the self-organised oscillatory zoning. This indicates
crystallisation in a more frequently disturbed (open) system. Resorption (solution) surfaces
observed in magmatic quartz and cutting pre-existing growth zones do not occur in
hydrothermal quartz. This observation can be explained by the low solubility of Si2O in water
which results only in weakly resorbed (solved) crystal surfaces that can not be distinguished

103
from unsolved surfaces. A matter of discussion is, if a crystal surface represents generally a
solution surface. A characteristic feature of hydrothermal quartz is the so-called sector zoning
(e.g., Siebers, 1986) which has been not observed in magmatic quartz.
As shown in chapter 6 the contrasted zoning of hydrothermal quartz was explained by the
distribution of Al-defects. Therefore, the present discussion focuses on the incorporation and
distribution of Al3+ (and to lesser extend also Fe3+) and their charge compensating ions Li+,
H+, Na+, Fe2+, K+. Ti, which may cause CL zoning of magmatic quartz phenocrysts is nearly
absent in hydrothermal quartz. This can be explained by the following considerations: 1) The
high field strength of Ti4+ allows the to substitution of Si4+ only at temperatures >500°C
(Blankenburg et al., 1994), 2) the supply of Ti is very low in natural hydrothermal solutions,
and 3) the uptake of Ti of >50 ppm is limited by the stability PT-field of the a-quartz.
Generally, the incorporation of trace elements in hydrothermal quartz depends on the growth
direction, growth velocity, the solution chemistry, and the crystallisation pressure and
temperature (Brown and Thomas, 1960; Cohen, 1960; Bambauer, 1961; Poty, 1969; Siebers
et al., 1984; Siebers and Klapper, 1984; Siebers, 1986; Pankrath 1988). The quartz growth
kinetic in an aqueous solution is similar to the processes in silicate melt and can be divided
into 5 stages:
1) Solution of silica in the form of complexes
2) Transport of the complexes into the crystal boundary layer and reaction zone of the
growing crystal by diffusion and convection
3) Dissociation of the complexes, and adsorption of the complex components on the
crystal surface; desorption and removal of water and quartz-foreign elements from the
reaction zone
4) Surface diffusion of the components to energetically favourable places
5) Incorporation (reaction) into the crystal and diffusion of the reaction heat.
In order to understand the processes in the crystal-fluid reaction zone and boundary layer in
aqueous solutions Siebers (1986) proposed the following model: At the crystal surface a
equilibrium develops between diffusion and boundary layer processes (Fig. 6.4). The
thickness of the boundary layer depends on the diffusion coefficient of the reaction partners at
the crystal surface. The thermal diffusion coefficient of the heat which is produced in the
reaction zone is much higher than the diffusion coefficients of the substances. Therefore, the
reaction heat does not effect reaction and growth processes. The oversaturation of the reaction
partners increases with the distance from the reaction zone. The concentration gradient in the
boundary layer is the driving force of the reaction and growth rate. Therefore, the height of

104
growth mounds at the basis c (0001) corresponds to the thickness of the boundary layer which
can reach several millimetres (Jackson, 1979). In comparison to the crystal-melt interface the
crystal-liquid interface is generally more sensitive for concentration variations than
temperature variations (Siebers, 1986).
Precondition for impurity incorporation in quartz is that the impurity element is dissolved in
the aqueous solution as a complex which can be transported. The dissolution rate and the
ability of forming complexes depend on the element concentration of the solution, the
pressure, temperature, redox potential, and pH (e.g. Siebers, 1986). Al can be fixated on the
quartz surface if it is represent as aqueous tetrahedrally coordinated species [Al(OH)4]-
(Merino et al., 1989). This species occurs in aqueous solutions with pH >5 (for =100°C).
According to Merino et al. (1989) and Pankrath (1988) high amounts of Al (>2000 ppm), Li,
Na and low H concentrations in hydrothermal quartz may result from crystallisation in a high-
pH aqueous solution. These authors assumed that the pH of the solution is beside the crystal
growth rate the main controlling factor in the uptake of Al and responsible for the large
variation of Al in hydrothermal quartz.
Fig. 6.4 Model system (modified after Siebers 1986) showing schematic concentrations c of relevant
components versus distance from the surface of quartz crystal in solution during diffusion-controlled growth.
The relative thickness of the boundary layer d of component is controlled by its diffusion coefficient D. The
development of growth mounds favours the impurity segregation. The sketch in the cycle show the idealised
crystal-fluid reaction zone in pure water.
C ( )C (x)
C ( )
d < d , because D << D
d ~ dd
dC (0)
C (x)
SiO SiOtemp
imp
impimp
impimp
temp
SiO
SiO
SiO SiO
SiO
x
C (0)
0
T(x)
T(0)
crystal
boundary layer
reaction zone
con
cen
trat
ion
of
com
po
nen
t
aqueous solution
impurities
growthmounds
T( )
O
OO
O
O
O
O
OO
O
H
H
H
HH
H
H
HH
H
H
HH
HO
O
O
O
H O
O H
H
H
H
H
H
H
H
2
2 2
2
2
2 2

105
The Al concentration of the hydrothermal quartz (sample 9) differs between the rhombohedral
faces z (~4500 ppm) and r (~3300 ppm). The different Al concentrations of different growth
directions cause the sector zoning observed by CL (Fig. 6.11c). The probability of Al3+ uptake
is controlled by different crystal structural and crystal chemical properties of the surfaces of
the growing crystal. For these different surfaces, the probability of Al uptake is higher for z
(0111) faces and lower in r (1011) faces. According to the Periodic-Bond-Chain (PBC) theory
after Hartmann (1978) the crystal faces of quartz can be distinguished into K-(kinked) and F-
(flat) faces. Atomic flat F-faces are the m (1010), r (1011), and z (0111) faces. The basis c
(0001) is an atomic rough K-face. The PBC theory can not differentiate between the surfaces
of r (1011) and z (0111). The K-face is more reactive because of the high number of free
bonds. At this face foreign ions are preferably adsorbed. The F-faces remains flat during
higher growth rate whereas the roughness of the K-face c (0001) increases. An increasing
growth rate results in a drastic increase of the impurity uptake at the rough K-face c (0001)
(e.g., Martin and Armington, 1983). The increase of Al uptake on the F-face z (0111) with
increasing growth rate occurs at temperatures above 400°C. Below 400°C the relationship
between Al uptake and growth rate becomes inverted (Tsinober and Kamentsev, 1964;
Rumyantsev and Novozhilov, 1980). Siebers (1986) proofed that the impurity concentration
decreases from c (0001), m (1010), r (1011), to z (0111). The PBC theory cannot explain the
different distribution coefficients of foreign ions at m (1010), r (1011), and z (0111). The
distribution coefficient of foreign ions on the different faces depends also on the growth rate,
temperature, degree of saturation, and growth mechanism (Siebers, 1986). The compositional
differences between F and K-faces disappear at higher temperatures near the solidus. During
high temperature crystallisation the crystal-fluid interface undergoes a drastic increase of
roughness. Close to the melting temperatures all faces becomes rough and take up foreign
ions in similar portions. That explains why sector zoning is not observed in magmatic quartz.
The extremely high Al in hydrothermal quartz up to 5000 ppm (sample 9) gives reason to
assume that Al is not only structurally incorporated, but also as impurity clusters or inclusions
(Flicstein and Schieber, 1974; Blankenburg et al., 1994). Götze et al. (1999) showed that the
content of bulk trace Al is higher than the structurally incorporated Al calculated from
saturated paramagnetic Al centres. Mullis and Ramseyer (1999) determined up to 12000 ppm
Al in fissure quartz form the Alps. Caused by the larger ion radius of Al3+ in comparison to
Si4+ such high amounts of structurally incorporated Al3+ should cause an extreme deformation
and weakening of the quartz lattice. Pfenninger (1961) described impurity entrapment in the
form of micro-inclusions and gave the following explanation: The oversaturation of silica

106
results in diffusion-controlled crystal growth and higher growth rates. At these rates the
surface diffusion is too low to organise a planar face growth and cellular growth becomes
dominant. Cellular growth results in the development of defect channels which may be filled
with foreign elements. These defect channels, 20 - 50 nm in diameter, are parallel to the c-axis
and surrounded by disordered SiO 2 boundary layers (Fig. 6.5). They start to grow at the
structural channels due to the stepwise bond lacking between the tetrahedra. The competition
between impurity segregation and lateral diffusion results in a broadening of the defect
channels which finally may result in dendritic growth.
The dynamics of processes at the atomic boundary layer (4-6) are not fully explained, because
the structure of the quartz surface is unknown. It has been assumped that free bonds of the
surface oxygen are compensated by H+ (e.g., Anderson and Wickersheim 1964, Gallei and
Parks 1972, Kuznetsov and Lobachev 1973). H2O is removed during the uptake of dissolved
SiO2 complexes. The Si-OH bond layer is followed by polymolecular adsorbed H2O
molecules (Fig. 6.4). This “quasi-crystalline” layer interacts with the dissolved complexes.
The criteria which control the uptake of Al3+ and Fe3+ and its charge compensating ions Li+,
H+, Na+, Fe2+, K+ into the lattice of hydrothermal quartz can be summarised as follows:
1) Impurity concentration differs systematically between growth directions and decreases
from c (0001), m (1010), r (1011), to z (0111).
2) The increase of the growth rate stimulates the impurity uptake at the K-face c (0001). This
is valid only at temperatures >400°C for the F-face z (0111). Below 400°C the impurity
concentration decreases with increasing growth rate.
3) Impurity uptake is controlled by the pH of the aqueous solution. High pH (=5) of an
aqueous solution results in high Al concentrations in quartz.
4) The presence of the charge compensating ions H+, Li+, Na+, and K+ stimulates the Al3+
and Fe3+ uptake.
Fig. 6.5 Idealised model of hollow defect
channels K and the disordered boundary layer
G according to Pfenninger (1961). Section
vertical to c-axis.
KG
GK

107
Dennen et al. (1970) proposed a geothermometer based on the incorporation of Al in
hydrothermal quartz as a function of the formation temperature. However, the multiple
criteria which control the Al uptake show that the Al concentration cannot be directly used as
a geothermometer.
6.3 Secondary CL structures and processes resulting in modification of defect centres
Quartz may show a number of secondary structures made visible in CL which formed after
growth of the host crystal by retrograde processes. The secondary CL structures are
principally formed by a number of processes: 1) micro-cataclasis followed by healing
(dissolution-precipitation), 2) diffusion, and 3) a-radiation. These processes result in the
modification of defect centres in the quartz lattice or in the formation of new quartz. The
secondary structures may show reduced or lower defect centre contents or reversely defect
centres are induced. The secondary CL structures have been grouped according their defect
centre content.
Secondary CL structures with reduced defect centres
Secondary structures with reduced defect centre content are healed veinlets, healed irregular
domains, and patchy halos of secondary quartz around fluid inclusions. They are
distinguished by weak red-brown or no CL. This weak CL is indicative of lower contents of
activator elements and/or intrinsic defects.
Trans-granular veinlets and irregular domains of up to several hundreds micrometres wide
have been observed. The veinlets are completely healed, or they contain fluid inclusions.
Some samples (Megaquartz, Schellerhau Granite) show different veinlet generations of (Fig.
6.6e, f). Thin concentric and radial, healed micro-cracks are typical for rhyolitic quartz
phenocrysts (Fig. 6.2a, b). In this case the cracks are interpreted as thermally induced
contraction cracks formed due to rapid cooling during effusion. Dissolution-precipitation
(healing) results in veinlets and domains of secondary quartz along micro shear zones, grain
edges, grain and subgrain boundaries (§ 10.7).

108
Fig. 6.6 SEM-CL images of secondary CL structures in quartz. a – Non-luminescent spots (easily visible in the
cycle) in quartz of the Flossenbuerg Granite. b – Patchy halos of secondary quartz around fluid inclusions
connected by sub-parallel healed micro cracks (Flossenbuerg Granite). c - Combination of SEM-CL and BSE
images showing the residual porosity of the former fluid inclusions (black “holes”; Flossenbuerg Granite). d –
Healed veinlet in the quartz of the Sunset Hills Granite/Lachlan Fold Belt (see chapter 10). The wider veinlet is
not completely healed. e – The hydrothermal megaquartz shows a dense network of healed cracks and domains
of different ages. Three populations can be distinguished: 1) healed domains with weak CL following fluid
inclusion trails. 2) Bright luminescent, linear trails some of which overprint the population (1). 3) Linear, thin
cracks healed with weak luminescent quartz. f – Light circular halo around a zircon. The radius of halo is ~40
µm. The halo is subdivided into a brighter inner zone (~25 µm) and a outer zone (~15 µm) (Schellerhau
Granite).

109
Particularly in quartz formed at high temperatures patchy halos of secondary quartz around
fluid inclusions were observed. These and similar structures have been observed since about
one decade (Frentzel-Beyme, 1989; Behr, 1989; Kerkhof and Müller, 1999). In the following
part the characteristics and formation mechanics of the halos are discussed in more detail. The
understanding of the formation of this structures is important for the interpretation of fluid
inclusion data. Magmatic quartz crystals typically contain red to red-brown luminescent,
patchy halos of secondary quartz around fluid inclusions, connected by healed sub-parallel
trans-granular micro-cracks of <5 µm wide (Fig. 6.6c). This structures are frequent in granitic
quartz and less common in rhyolitic phenocrysts. The secondary quartz has the same
crystallographic orientation as the host quartz indicating. The CL intensity of the secondary
quartz increases during 2-10 min electron radiation using high beam power densities >10+4
W/cm2 (Fig. 6.2d). The halos of secondary quartz are depleted in trace elements (Li, Al, K,
and Ti) compared to the host quartz (see § 10.7). Sometimes, the host crystal around the
secondary quartz is enriched particularly in Fe and Ti (Fig. 5.11c). These elements are
probably released from the secondary quartz.
Decrepitation experiments of fluid inclusions with halos of secondary quartz showed that they
hold anomalously high fluid pressures on heating (Müller, 1995). Bodnar et al. (1989) showed
that the internal pressure required to initiate decrepitation of fluid inclusions in quartz is
inversely related to inclusion size according to the equation: internal pressure (kbar) = 4.26 •
D-0.423, where D is the inclusion diameter in microns. Figure 6.7 shows this relationship
between decrepitation pressure and fluid inclusion diameter (line) within a range (hatched
area) after Bodnar et al. (1989). The data measured for the pegmatite quartz of Pleystein and
Kreuzstein and Pfahl quartz (Oberpfalz, Germany) plot in the hatched area. On the other hand
the data of the Rozvadov Granite (Oberpfalz, Germany) show extremely high decrepitation
pressures. The fluid inclusions of this rock exhibit halos of secondary quartz, whereas the
pegmatites and Pfahl quartz do not.
The specific features of secondary quartz around fluid inclusions allow us to establish a model
for the mechanism of fluid inclusion decrepitation and modification, whereby three stages can
be distinguished (Fig. 6.8).

110
Fig. 6.7 Relationship between decrepitation pressure and inclusion diameter after Bodnar et al. (1989).
According to Bodnar et al. (1989) data should plot in the hatched area like the fluid inclusions of the pegmatites
and the Pfahl quartz form the Oberpfalz/Germany. The fluid inclusions in the quartz of the Rozvadov Granite
showing halos of secondary quartz around fluid inclusions hold anomalously high fluid pressures on heating
(Müller, 1995).
In the first stage mass decrepitation of fluid inclusions (micro-crack formation) may occur.
Simultaneous decrepitation of fluid inclusions is assumed, because in the present samples the
halos are connected with one generation of healed micro-cracks. Mass decrepitation may be
induced by differences between fluid pressure and lithostatic pressure e.g. during uplift
(isothermal decompression). The α/β-transition causes an anisotropic contraction of 0.86
vol.% vertical to the c-axis and 1.3 vol.% parallel to the c-axis and induces stress within
individual grains (e.g. Blankenburg et al. 1994) and subsequently may also trigger mass
decrepitation. Dissolution-precipitation initiated by shearing leads to the healing of the micro
cracks.
In the second stage the defect-poor quartz grows at the cost of the host quartz and releases or
replaces defect centres. The formation of defect-poor quartz at the cost of the defect-rich host
quartz is explained by the displacing of atoms along the phase boundary of the quartz with
higher defect density so that the atoms fit to the lattice of the quartz with low defect density
(e.g. Passchier and Trouw, 1998; Stünitz, 1998). This results in local displacement of the
phase boundary (between the new quartz and the host quartz) and the growth of the more pure
crystal at the cost of more disordered neighbour. The process reduces the internal free energy
of the crystals involved and causes the release and replacement of defect centres, which are
enriched in the grow front.
3 5 10 20 30 50
5
4
3
2
1
0
decr
epita
tio
n p
ress
ure
(kba
r)
inclusion diameter (µm)
quartz Rozvadovgranite/Oberpf.
Pfahl quartz
pegmatite quartzPleystein/Oberpf.
pegmatite quartzKreuzstein granite

111
In conclusion, the formation of secondary quartz around fluid inclusions is explained by a
reconstituting process of the host crystal and represents a structural transformation, whereby
the crystallographic orientation is preserved.
Fig. 6.8 Model of formation of halos of secondary quartz around fluid inclusions. a – first stage: mass
decrepitation of fluid inclusions (micro-crack formation). b – second stage: defect-poor quartz grows at the cost
of the host quartz and releases or replaces defect centres.
Secondary CL structures with induced defect centres
Secondary CL structures with induced defect centres are halos around radioactive inclusions,
diffusion rims along grain boundaries and micro-cracks, and non-luminescent spots in granitic
quartz. Natural a–radiation and trace element diffusion cause the modification and formation
of defect centres in quartz.
Some samples show round halos around radioactive inclusions with pinkish/yellowish white
CL (Fig. 6.6b). Natural a-radiation of radioactive micro-inclusions (zircon, monazite) results
in damage of the crystal structure (metamictisation). The radius of halos is typically ~40 µm.
Each halo is subdivided into a brighter inner zone (~25 µm) and an outer zone (~15 µm). The
radius of ~40 µm corresponds to the interaction radius of the a-particles in quartz (Owen,
1988). Similar bright CL was also observed in hydrothermal quartz (sample 1) along opeb
cracks, indicating that quartz lattice damage was produced by a-radiation from radioactive
components of the migrating fluid.
In magmatic quartz diffusion rims at grain boundaries (grain boundary alteration) frequently
occur at the grain contacts between quartz and plagioclase or biotite (see § 10.7). The
diffusion rims show the enrichment of Fe, Al, and K. Fe may diffuse up to 400 µm into the
defect centres
a b

112
quartz. The Fe enrichment at the grain boundaries not always results in the change of the CL
colour (Fig. 5.11c). This observation may be explained by the fact that Fe occurs as divalent
and trivalent ions. The diffusion rims in magmatic quartz are explained by solid state
diffusion of trace elements at high (sub-solidus) temperatures.
Particularly in granitic quartz radiation-induced non-luminescent spots were observed. Weak
luminescent spots up to 5 µm in size developed during electron radiation in granitic quartz
(sample 7, 8, 12, and 14; Fig. 6.6a). The radiation-induced spots are interpreted as
aggregations of aqua complexes with a gel-like disordered structure, i.e. regions with a high
local concentration of H2O and substitutional Al with one or more OH groups attached in a
locally disordered network. Stenina et al. (1984) described similar spots developed during
electron radiation and identified these structures as amorphous (non-crystalline) micro-areas
using TEM imaging. The electron radiation results in the release of molecular water from the
aqua complexes (see § 2.2). H+ ions migrate along weak donor-acceptor and hydrogen bonds
of the aqua complex defects. As a consequence oxygen may migrate due to the radiation-
triggered redistribution of Si-O and Mm+-O bonds (Stenina et al., 1984; Gritsenko and
Lisitsyn, 1985). At the defective places the following reaction occurs: O2- + 2H+ ? H2O.
Here water bubbles may develop. Heggie (1992) showed that microcracks by producing
radicals facilitate the migration of water. In this case “water” moves through SiO 2 matrix in
the dissociated form. Heat-treatment experiments (500°C for several hours) showed that the
aqua complexes homogenised into the lattice and structural water converts to non-bound form
and creates micro bubbles (e.g. Griggs, 1967; Brunner et al., 1961; Bambauer et al., 1969;
McLaren et al., 1983; Stenina et al., 1984). These bubbles of heat-treated quartz arise as a
result of the thermal-induced break down of 2[SiO 3]---O-H-H bonds and the following H+
migration along the weak bonds of the lattice. The gel like defect structures were incorporated
during crystallisation. The frequent occurrence of these spots in anhedral granitic quartz
(matrix quartz) reflects “wet” conditions during crystallisation whereas rhyolitic and granitic
quartz phenocrysts does not show spots indicating “dry” crystallisation conditions.
In summary, trace elements in quartz are largely redistributed during retrograde processes.
Non-luminescent spots and secondary quartz around fluid inclusions are frequently in granitic
matrix quartz and less common or lacking in rhyolitic phenocrysts. The frequent occurrence
of spots caused by gel-like defect structures in anhedral granitic matrix quartz reflects “wet”
conditions during crystallisation, whereas rhyolitic and granitic quartz phenocrysts does not
show spots indicating “dry” crystallisation conditions. Rhyolitic phenocrysts are mostly fluid

113
inclusion free, whereas granitic phenocrysts frequently show halos of secondary quartz
around fluid inclusions as a result of a overprinting by late-magmatic voliatiles.

114
7 Application of Cathodoluminescence to Magmatic Quartz in a
Tin Granite – Case Study from the Schellerhau Granite Complex,
Eastern Erzgebirge, Germany
(this chapter has been published in Mineralium Deposita, vol. 35, pp. 169-189,
2000, co-authors: R. Seltmann and H.-J. Behr)
7.1 Abstract
A model of the cooling history of tin-bearing granitic magma forming the Schellerhau
granites (Eastern Erzgebirge, Germany) is shown on the basis of quartz textures. Similar grain
size, similar grain habit and correlatable growth textures of phenocrysts in different granite
varieties give proof of a common crystallisation history before the melts of the Schellerhau
granite varieties were intruded. Four nucleation events occurred during crystallisation in
different crustal levels between about 20 and 1 km depth. The parental melt of the Schellerhau
granites is interpreted to have contained <2.5 wt.% H2O originally. The water content of the
melt during the subvolcanic intrusion stage amounted to more than 5 wt.% and characterises
highly evolved residual melts that enable the formation of tin deposits. This paper contributes
to a better understanding of the development and behaviour of fractionated tin-bearing
granitic melts, and links quartz cathodoluminescence (CL) with microanalytical studies.
7.2 Introduction
MacLellan and Trembath (1991) developed a quantitative model for evaluating the cooling
history of a granitic magma on the basis of quartz textures. The relative chemical and
structural stability of quartz is responsible for the conservation of quartz generations of
different size, habit and structural state in granites and rhyolites. In contrast the chemical
composition of feldspar changes during cooling because it is in equilibrium with melt.
Therefore quartz morphology provides reliable information about the cooling history of
granitic melts.
In this paper we report about the application of cathodoluminescence (CL) microscopy to
distinguish different quartz generations in the Schellerhau tin granites. CL is used to illustrate

115
the growth textures of quartz. However, it is not the aim of this paper to provide a detailed
explanation of the complex causes of luminescence in quartz. The CL of quartz results from
substitutional and interstitial incorporation of trace elements and from different types of
intrinsic and extrinsic defect centres in the quartz lattice (e.g. Ramseyer et al., 1988).
Consequently, the luminescence behaviour is a complex function of the concentration of trace
elements which may act as CL activators, like Al, Fe and Ti, or as quenchers. The CL is
related to the conditions of mineral crystallisation, and alteration and of natural γ- and α-
radiation. The analysis of the luminescence spectra makes it possible to quantify the emission
properties of single grains. The scanning electron microscope cathodoluminescence (SEM-
CL) facilitates high resolution of intragranular growth textures of magmatic quartz. Zoning
within quartz is normally invisible by conventional optical microscopy and rarely documented
by quantitative analysis. We also determined trace element concentrations in quartz using the
electron microprobe. In addition, the detailed analysis of quartz texture and size distribution
was carried out. The intragranular growth textures, the quartz framework and the grain size
distribution yield important information on the nature and evolution of the melt from which
the crystal grew. Plots of maxima of grain size distributions for a single mineral indicate
bursts of nucleation which are caused by a high degree of melt undercooling (Dowty, 1989).
In the following is given a short introduction in the general interpretation of growth textures,
based on the present level of knowledge. A general compilation of observable growth and
resorption textures is illustrated in Fig. 7.1.
The different primary growth textures represent disturbances of growth and diffusion rates
during crystallisation. Growth and diffusion rates depend on melt composition, crystal
transport in the melt (e.g., convection) and ascent velocity of the melt and related pressure and
temperature changes. These criteria regulate type and quantity of defects, few of which are
luminescent active and incorporated into the quartz lattice. Wavelength and amplitudes of
individual zones are directly related to the physical and chemical melt properties. The

116
Fig. 7.1 Synoptical scheme of primary growth textures in magmatic quartz phenocrysts with a diameter of 1 to
5 mm contrasted by SEM-CL. 1 - Nucleation of hexagonal β-quartz or rhombohedral α-quartz; 2 - Resorped
surface; 3 - Skeletal growth; 4 - Step zoning (50 - 1000 µm); 5 - Oscillation zoning (2 - 20 µm); 6 - Growth
impediment; 7 - Inclusion (entrapment) of melt or a bubble; 8 - Growth impediment caused by adjacent
phenocrysts; 9 - Rim of anhedral quartz of the final magmatic crystallisation.
diffusion rate in the melt controls the compositional variation and width of the zoning. The
higher the diffusion rates, the less compositional differences occur in the quartz.
Concentration gradients develop in the melt when the growth rate exceeds the diffusion rate,
and in the solid when the reaction rate of crystals with the liquid is lower than the growth rate
(Sibley et al., 1976).
The development of growth zoning during magmatic crystallisation is described by a number
of models (e.g. Sibley et al., 1976; Anderson, 1984) that have been derived from the zonal
structure of plagioclase. We apply these models to the crystallisation of magmatic quartz
having a very similar zonal growth as plagioclase.
Major discontinuities in the zoning (50 - 1000 µm width) being non-periodic and showing a
significant change of the luminescence colours result in physicochemical changes of external
factors (“extrinsic” acc. to Shore and Fowler, 1996) such as temperature, pressure and magma
4
57
9
6
21
8
3

117
composition (Bottinga et al., 1966; Allègre et al., 1981). Bottinga et al. (1966) defined those
zones as compositional zoning, and Allègre et al. (1981) called them stepped zoning.
The fine oscillatory zoning (2 - 20 µm width) within the step zones is explained by a self-
organised (“intrinsic” acc. to Shore and Fowler, 1996) diffusion controlled mechanism on the
crystal-melt boundary layer and exists in a number of recent models (Sibley et al., 1976;
Haase et al., 1980; Allègre et al., 1981; Loomis, 1982; Simakin, 1984; Pearce, 1993).
Oscillatory growth happens very slowly at low degrees of undercooling and oversaturation. It
may only take place when the crystallising system is not disturbed on the solid-liquid
interface, thus the melt should not convect (Allègre et al., 1981). Investigations on natural
plagioclases by Greenwood and McTaggart (1957) and Wiebe (1968) confirm that oscillation
zones of crystals grown from the same melt cannot be correlated due to the self-organising
character of the process. To develop oscillation zones physical or chemical changes in the
bulk magma are not required.
Discussions about the distinction of resorption structures and growth impediments in quartz
phenocrysts have been controversial (Kozlowski, 1981; Harris and Anderson, 1984).
Laemmlein (1930) first recognised and described lobate depressions at the crystal surface as
growth embayments. The fact that these are growth impediments may be recognised because
the zonation adapts to the shape of the embayments. In contrast, resorption surfaces cut pre-
existing zones. Growth impediments are caused by immiscible liquids, vapor bubbles, molten
sulfide or fluid-rich melt droplets which stick on the crystal surface, hinder the crystal growth
and result in lobate depressions and entrapments (Kozlowski, 1981; Donaldson and
Henderson, 1988; Lowenstern, 1995). The resorption (melting) of quartz surfaces is due to
SiO2-undersaturation of the melt which may be caused by increase in temperature, isothermal
depressurisation or magma mixing. Crystals may undergo a rounding due to thermal
weakening, chemical interaction and mechanical abrasion even during transport in the melt.
The occurrence of resorption which results in strong rounding of the quartz crystals is in
accordance with the rapid ascent of granitic melts by dyke formation as found by Holtz and
Johannes (1994) and Johannes and Holtz (1996).
The presence of skeletal growth indicates supercooling and a related decrease of the ratio of
diffusion rate/growth rate. In such cases compositional gradients on the crystal-melt interface
develop, planar crystal/melt interfaces become unstable and the growth results in skeletal
morphology (Kirkpatrick, 1981; Fowler, 1990).

118
As object of studies we have chosen the Schellerhau Granite Complex (SGC) in the Eastern
Erzgebirge/Germany. It has been studied by Pälchen and Ossenkopf (1967), Helbig and Beyer
(1970), Seim et al. (1982), Just et al. (1987), and Schilka and Baumann (1996) so that an
extensive state of knowledge based on mapping, availability of drill cores and resulting
chemical and petrographical data exists. The pluton was studied by the authors across a
vertical sampling profile of about 1000 m using the relief differences of up to 300 m caused
by erosion and dislocations, and available drill cores of depths of up to 1000 m (drilling
Niederpöbel 1/58, Helbig and Beyer, 1970). On the basis of the collected data, we present a
model of the quartz crystallisation history of the Schellerhau granite magma.
7.3 Analytical methods
Cathodoluminescence (CL) microscopy has been used to visualise growths and alteration
structures in quartz. Two instruments for CL studies of polished thin sections were used. The
analyses of the luminescence colours (optical CL) were carried out on a hot-cathode-
luminescence-microscope (Neuser et al., 1995) at the University of Göttingen. Thin sections
were coated with a carbon layer and were bombarded with electrons with an energy of 14 keV
and a filament current of 0.17 mA. The electron beam (4 mm cross section) and the sample
were maintained in vacuum conditions of 10-5 mbar. The spectral response of the
luminescence was recorded by a TRIAX 320 spectrometer with a 100 lines/mm grating for
the emission spectra from 1.3 to 3.1 eV. The single emission bands 2.79 eV and 1.96 eV were
measured with the Monochromator at a speed of 10 mm/min using the CL-microscope after
Zinkernagel (1978) (10 keV, 0.25 mA). The scanning electron microscope model Geoscan
250-MK3 with a CL detector (SEM-CL) was used for black-and-white images of the internal
growth and secondary structures of the quartz grains. The voltage was 15 keV and the current
5 to 15 nA. Dark contrasted areas in quartz produced by SEM-CL correspond to red to reddish
brown CL-colours of the optical CL. Light areas correspond to blue to violet colours.
The trace element concentrations in quartz were determined by wavelength-dispersion
analysis on the JEOL JXA 8900 electron microprobe operating at 15 kV and 70 nA with a
beam diameter of 5 µm. Analyses were performed for Al, Ti, Mn and Fe. The calculated
detection limits ranged from <25 ppm for Al, <17 ppm for Ti, <26 ppm for Mn to <23 ppm
for Fe with a confidence level of 95%.

119
The application of the lacquer peel method (Behr, 1966) enables detailed analyses of the
quartz framework (Müller and Behr, 1997). This technique, usually applied to carbonates, is
used here to visualise the quartz textures. The peels are produced by treating the surfaces of
polished samples with a 40% HF solution. The corroded surface is covered with several
lacquer layers. After drying, the lacquer film is pulled off and used as a negative for black-
and-white photos. Quartz appears black and feldspar and mica white or grey on the photos.
Grain size analyses were carried out in thin sections and in hand specimen. The length and
width of quartz grains (≤ 1 mm) in the thin sections was measured using a defined raster,
determined through the grain size. The distance between the points of the raster corresponds
to the average grain diameter. Quartz grains larger than 1 mm were measured by micrometer
on polished hand specimens (15 x 15 cm). The grain size was calculated from the average of
its length and width.
7.4 Geology and geochemistry of the SGC
Geological setting
The SGC belongs to the highly evolved younger granite group of the Erzgebirge batholith
(Tischendorf and Förster, 1990; Stemprok, 1993; Förster and Tischendorf, 1994; Seltmann,
1994). Neoproterozoic gneisses of the metamorphic basement and volcano-sedimentary rocks
of the Altenberg-Teplice caldera form the host rocks (Fig. 7.2).
Late-collisional extensional tectonics and collapse of the Variscan orogen controlled during
the Upper Carboniferous the block and graben tectonics in the area, caldera formation with
pre-dominantly ignimbritic rhyolites and porphyritic microgranites, and finally the post-
tectonic multiple intrusion of tin granites of the SGC into a subvolcanic level. Uplift, faulting,
block tilting and erosion took place mostly in Permo-Silesian and Cenozoic times and formed
the recent morphology. NW- and NE-striking faults with vertical dislocations of several
hundred metres form the SGC as horst and as a result some deeper pluton parts are uncovered
by erosion. The SGC crops out at about 13 km2 as a NW-SE elongated body roughly bounded
in the north-eastern part by the Weisseritztal fault and in the south-western part by the

120
Fig. 7.2 Geological sketch map of the Schellerhau granite massif and its geological setting in the Altenberg-
Teplice caldera, Eastern Erzgebirge (without Cenozoic).

121
Pöbelbach fault (Schilka and Baumann, 1996). These marginal fault zones indicate within the
structural pattern of the Altenberg-Teplice caldera a NW-striking sinistral strike-slip
movement and north-east directed extension controlling in the post-caldera stage the post-
tectonic SGC intrusion. Faults intersecting the SGC are either post-intrusively reactivated or
newly formed as indicated by their hydrothermal mineralisation of diffent ages ranging from
Upper Carboniferous to Cenozoic.
According to gravimetry data and geochemical studies of drill cores, granites of the SGC type
form the mostly hidden Eastern Erzgebirge partial pluton (Tischendorf, 1964). This NNW-
striking hidden granite ridge reaches from Dippoldiswalde in the north to Zinnwald in the
south with ca. 10 km east-west extension. To the south, in the Czech part of the Erzgebirge,
the chemically and texturally similar Preisselberg-Cinovec granite (Stemprok et al., 1994)
forms the continuation of this granite ridge.
Phasing
The SGC is characterised by the intrusion sequence of porphyritic (SG1) to weakly-
porphyritic (SG2) biotite syeno- to monzogranites, and mostly seriate albite granites (SG3).
The SG1, SG2 and SG3 rocks of the SGC represent individual stages (phases) of a multiple
granite intrusion as indicated by field evidence.
The SG1 forms the central and upper part of the SGC and occupies about 2/3 of the SGC at
the recent surface. Locally, the SG1 exhibits a marginal facies characterised by the most
primitive composition within the SGC that is due to porphyritic texture and muscovite-
bearing similar to the “intermediate granites” (IG, “Zwischengranite” type Walfischkopf,
Lange et al., 1972; Stemprok, 1986) of the Western Erzgebirge. Pendants of that SG1 variety
of the SGC also occur in the multiple intrusions of tin granites at Sadisdorf and Sachsenhöhe.
The textural variability of the marginal facies of the SGC also includes so-called two-phase
textures (Cobbing et al., 1992; Seltmann and Stemprok, 1994) where crystals/crystal mush of
an earlier SGC intrusion and cooling stage either underwent fluidisation at intrusive contacts
or were infiltrated along grain margins but not resorbed by low-viscosity melt batches of a
subsequent intrusion stage. The older phenocrysts exhibit sharp contacts to the surrounding
groundmass of that second stage.
The SG2 intruded the SG1 along its margins probably due to cauldron subsidence effects in
the post-caldera stage of the Altenberg-Teplice crustal unit. The SG2 occupies about 1/3 of
the SGC surface. There is field evidence that SG1 enclaves occur in SG2 (locality Paradies-
Fundgrube), SG2 dykes cross-cut SG1, and there are sharp intrusive contacts with

122
stockscheiders and chilled margins of the younger phase against the earlier phase (northern
SGC flank at Kipsdorf SG2/SG1, southern SGC flank at Kahleberg SG2/SG1, drill cores
SG3/SG1 and SG3/SG2).
The albite granites (SG3) occur as fine- to medium-grained porphyritic and seriate varieties.
They were found in most of the drillings as flat igneous layers of up to several ten metres
thickness intercalated with SG1 and SG2 units characterising the SGC as sheeted laccolite
body. Small SG3 dykes cross-cutting the earlier granite phases SG1 and SG2 provide
evidence for magmatic origin of SG3 and against its interpretation as metasomatic zones.
Exploratory excavations near the former New Galgenteich quarry exposed a small SG3 dyke
with sharp igneous contacts to the SG2 (F. Schiemenz, pers. comm.). The occurrence of fluid
saturation textures (miarolitic cavities, micrographic quartz/K-feldspar intergrowth) reflects
the high fractionation degree of the SG3 melt.
The genetical position of alkali feldspars, especially the occurrence of sugar-grained albites,
remains unsolved and is controversially discussed for similar rocks (Beus et al., 1962;
Schwartz, 1992; Stemprok, 1993). Regardless of many subsolidus features caused by deuteric
alteration and post-magmatic fluid-rock reactions, we classify the SG3 rocks as to be of
predominantly magmatic origin (Just et al., 1987; Seltmann et al., 1992) as they are
characterised by snowball quartz that is bearing melt inclusions (R. Thomas, pers. comm.).
These melt inclusions show features of trapped silicate melt similar to those studied in topaz-
bearing granites from Karelia (Poutiainen and Scherbakova, 1998) and do not link to the
interpretation of crystallised silica colloid trapped as a hydro gel during greisenisation as
described from a Cornish topaz granite (Williamson et al., 1997). The snowball quartz
contains also inclusions of late-magmatic matrix albite. Many SGC samples underwent
supplementary metasomatic albitisation (Haapala, 1997) and therefore only relics of the
primary texture and structural relationships allow to identify the original granite type.
Within the Eastern Erzgebirge, marginally to the SGC, a series of stock-like granites
(Altenberg, Sadisdorf, Sachsenhöhe, Zinnwald, Preisselberg), each with 1-5 km2 outcrop size
at the recent surface, form as multiple intrusions cupola-shaped elevations of the hidden
pluton. These stocks we interprete as channelised products of evolved melt batches and the
accompanying ore-forming greisen fluids as originated from deeper parental magmas. They
are, similar to the SG1 to SG3 sequence, composed of rock types with fine-grained
porphyritic via medium-grained equigranular syeno- to monzogranites to seriate albite
granites. The granite elevations represent the country rocks for endocontact tin mineralization
of the greisen type. Numerous drillings made in the area between Cinovec (Zinnwald) and
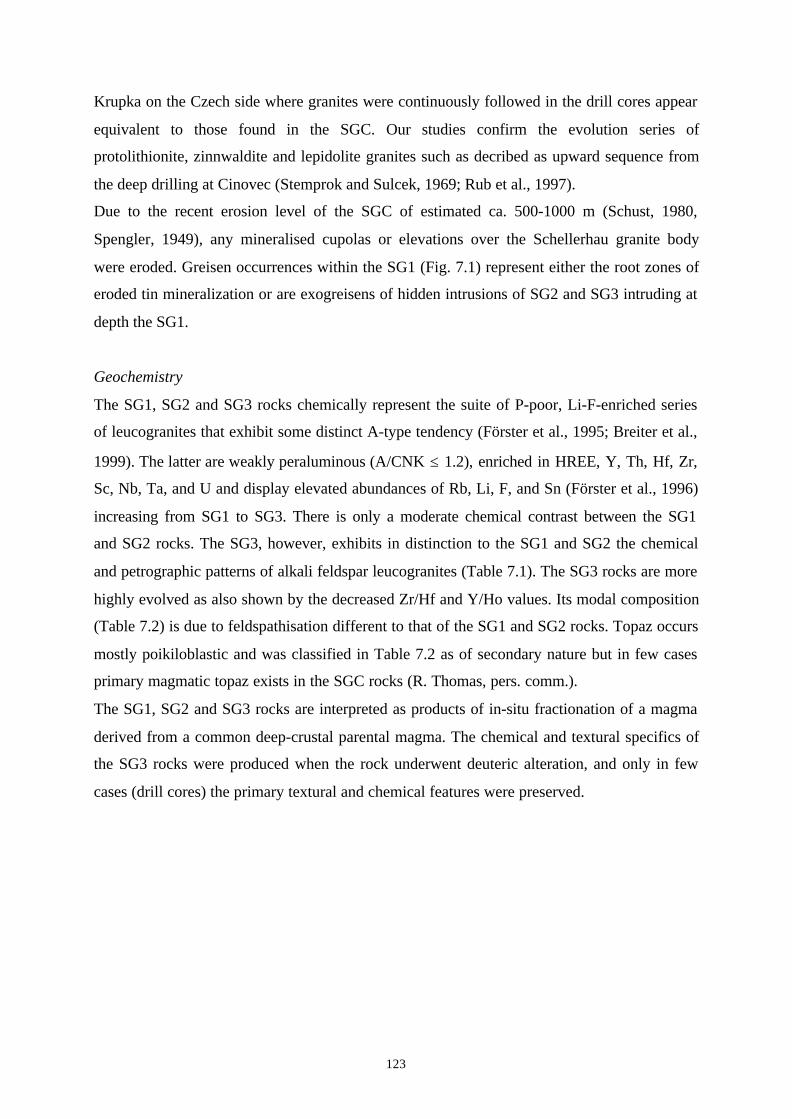
123
Krupka on the Czech side where granites were continuously followed in the drill cores appear
equivalent to those found in the SGC. Our studies confirm the evolution series of
protolithionite, zinnwaldite and lepidolite granites such as decribed as upward sequence from
the deep drilling at Cinovec (Stemprok and Sulcek, 1969; Rub et al., 1997).
Due to the recent erosion level of the SGC of estimated ca. 500-1000 m (Schust, 1980,
Spengler, 1949), any mineralised cupolas or elevations over the Schellerhau granite body
were eroded. Greisen occurrences within the SG1 (Fig. 7.1) represent either the root zones of
eroded tin mineralization or are exogreisens of hidden intrusions of SG2 and SG3 intruding at
depth the SG1.
Geochemistry
The SG1, SG2 and SG3 rocks chemically represent the suite of P-poor, Li-F-enriched series
of leucogranites that exhibit some distinct A-type tendency (Förster et al., 1995; Breiter et al.,
1999). The latter are weakly peraluminous (A/CNK ≤ 1.2), enriched in HREE, Y, Th, Hf, Zr,
Sc, Nb, Ta, and U and display elevated abundances of Rb, Li, F, and Sn (Förster et al., 1996)
increasing from SG1 to SG3. There is only a moderate chemical contrast between the SG1
and SG2 rocks. The SG3, however, exhibits in distinction to the SG1 and SG2 the chemical
and petrographic patterns of alkali feldspar leucogranites (Table 7.1). The SG3 rocks are more
highly evolved as also shown by the decreased Zr/Hf and Y/Ho values. Its modal composition
(Table 7.2) is due to feldspathisation different to that of the SG1 and SG2 rocks. Topaz occurs
mostly poikiloblastic and was classified in Table 7.2 as of secondary nature but in few cases
primary magmatic topaz exists in the SGC rocks (R. Thomas, pers. comm.).
The SG1, SG2 and SG3 rocks are interpreted as products of in-situ fractionation of a magma
derived from a common deep-crustal parental magma. The chemical and textural specifics of
the SG3 rocks were produced when the rock underwent deuteric alteration, and only in few
cases (drill cores) the primary textural and chemical features were preserved.

124
Table 7.1 Chemical analyses of major and trace elements from representative SGC samples.
Number,Granite
Sh-22 (SG1) # 16 (SG2) Sh-32 (SG2) Sh-18 (SG3)
Locality Abandonedmine Paradies-
Fdgr.
Abandoned mineParadies-Fdgr.
From drill core nearKipsdorf
295m depth, drillcore at Kipsdorf
Texture Very fine-grained, weakly
porphyritic,phenocryst-poor
Medium-grained(altered), seriate,
weaklyporphyritic,
Medium-grainedequigranular
(slightly altered)
Fine- to medium-grained seriate,
albitized
SiO2, wt.% 75.13 72.93 71.91 69.29TiO2 0.057 0.094 0.068 0.022Al2O3 12.60 13.84 14.64 16.97Fe2O3 0.89 1.69 1.25 0.74MnO 0.02 0.05 0.033 0.09MgO 0.06 0.17 0.07 0.02CaO 0.50 0.71 0.92 0.11Na2O 3.31 3.47 3.91 6.96K2O 5.33 5.09 4.64 4.09P2O5 0.02 0.04 0.036 0.03H2O+ 0.86 0.72 0.98 0.87CO2 0.05 0.10 0.12 0.15Li2O 0.037 0.075 0.164 0.016F 0.51 0.82 1.41 0.12-O=F -0.21 -0.34 -0.59 -0.05Total 99.16 99.45 99.56 99.43Sn, ppm 18 402 164 42Nb 51 40 75 72Rb 782 929 1297 1115Sr 8.53 34.0 32.1 19.2Ba 86.9 798 105 83.8Cs 29.7 40.2 62.4 16.7Zr 140 121 84.2 40.1Hf 8.11 7.53 6.71 8.28Pb 39 413 18 6.9Th 58.1 39.5 24.9 9.29U 15.0 17.6 20.8 3.33Y 103 89.6 44.5 1.55La 15.8 35.5 26.1 1.14Ce 32.4 85.3 69.0 2.44Pr 5.22 11.2 8.55 0.26Nd 19.0 37.4 25.3 0.70Sm 6.11 10.3 6.85 0.24Eu 0.063 0.195 0.12 <0.02Gd 8.47 10.7 6.01 0.24Tb 1.94 2.27 1.36 0.06Dy 14.3 15.4 9.54 0.38Ho 3.24 3.25 1.99 0.08Er 10.6 10.5 6.95 0.30Tm 1.73 1.89 1.42 0.08Yb 12.0 12.8 11.4 0.93Lu 1.80 1.97 1.71 0.15Y/Ho 31.7 27.5 22.4 20.7Zr/Hf 17.2 16 12.5 4.8
Notes on analyticalmethods: Oxides, Nb, Snby XRF, Li by ICP-AES, F by ISE, othertrace elements by ICP-MS. Details onanalytical conditions andaccuracy are availableon request from RS.H2O- not determined.Sample #16 bears littlegalena.

125
Table 7.2 Modal mineral composition of representative samples of the SGC.
Samples Sh-22 (SG1) # 16 (SG2) Sh-32 (SG2) Sh-18 (SG3)Characteristics Very fine-grained, weakly
porphyritic,phenocryst-poor
Fine-to medium-grained(altered), seriate, weakly
porphyritic
Medium-grained,equigranular
(slightly altered)
Fine- to medium-grainedseriate,
albitizedPRIMARY MINERALS: PHENOCRYSTS and GROUNDMASS, vol.%
Quartz 31.7 30.7 23.6 19.7
K-feldspar 35.8 32.2 30.3 15.3
Albite (An<5 vol.%)(Afs), estim. portions
Albite-Oligoclase(Plagiocl. An>5 vol.%)
6.3
14.2
5.0
15.0
13.0
13.9
14.9
-Li-mica (Protolithioniteto Zinnwaldite)
3.4 3.0 9.0 4.9
Accessories (Titanite,Rutile, Monazite, Zircon,Thorite, Apatite, ...)
0.1 0.8 0.1 0.1
Opaque (Ore) Minerals:Ilmenite, Sulphides
0.1 0.1 0.1 0.1
SECONDARY MINERALS, vol.%
Albite(Afs, An <5 vol.%)
3.3 6.3 3.0 38.1
Mica from veinlets - 0.6 - -
Sericite(+ Hydrosericite)
4.4 3.6 2.5 6.3
Muscovite 0.1 0.5 - -
Kaolinite 0.1 1.6 1.5 -
Fluorite 0.3 0.7 0.8 0.6
Topaz 0.2 0.2 2.1 -
Carbonate - 0.4 - -
SUM, vol.% 100.0 100.1 99.9 100.0
7.5 Textural studies
The quartz texture of the SG1
The grain size maxima of quartz in the phases and varieties of the Schellerhau granite massif
(Figs. 7.3 and 7.4) help to reconstruct the multiphase intrusion and crystallisation history of
the pluton. We focussed in our study on SG1 and SG2 phases of the SGC since these are the
only ones well exposed at the surface, whereas the afs-rich SG3 varieties are predominantly
represented by a few drill cores and are mainly characterised by secondary (recrystallisation)
structures which overprint and remove the primary ones.

126
Fig. 7.3 The phenocryst portion of textural varieties of the SG1 and SG2, illustrated by black-and-white prints
of lacquer peels. Quartz appears black and feldspars grey or white. The phenocryst portion varies between 5 to
40%; the portion of 15% is most frequent and common.

127
Fig. 7.4 Grain size maxima, shapes and distributions of quartz crystals in the SG1 and SG2. A maximum in the
grain size distribution in a magmatic rock indicates a burst of nucleation caused by a high degree of melt
undercooling. The texture is contrasted by black-and-white prints of laquer peels. The quartz appears black and
the feldspar grey or white. 1 - quartz phenocrysts (1st generation); 2 - quartz microphenocrysts (2nd generation);
3a - granophyric quartz in miaroles; 3b - microgranophyric quartz (3rd generation); 3c - isometric aplitic quartz
(3rd generation); 3d - anhedral quartz (3rd generation).
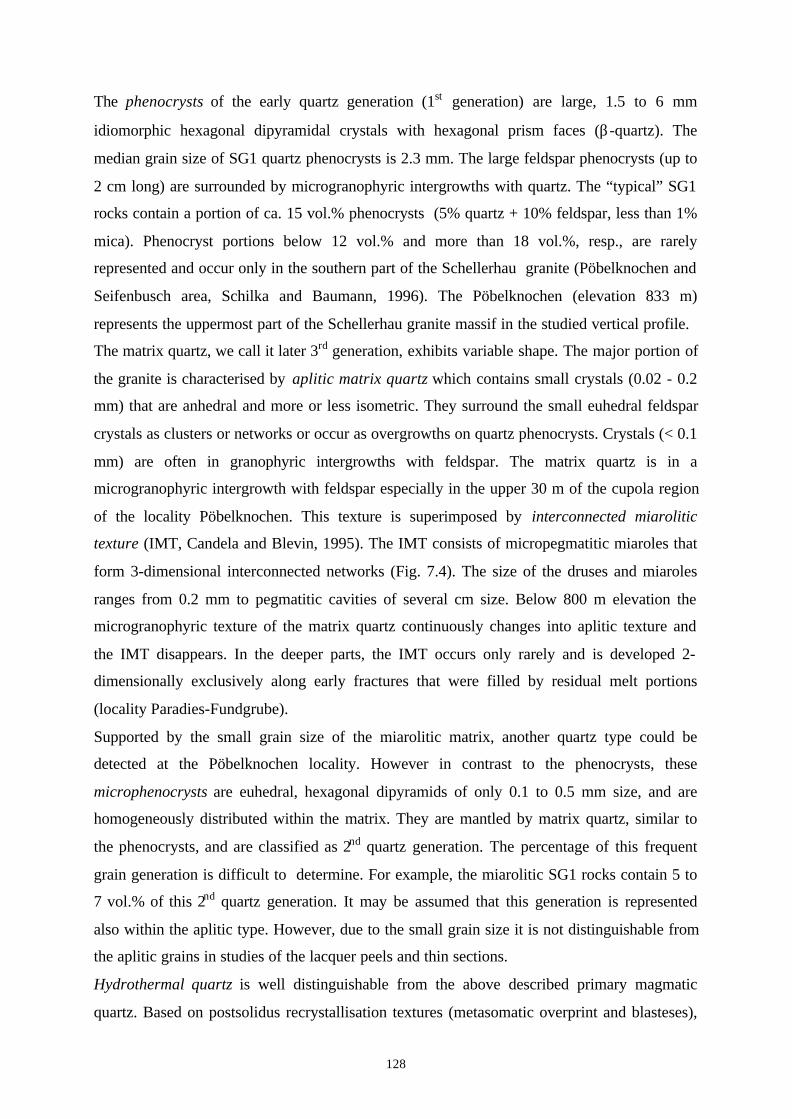
128
The phenocrysts of the early quartz generation (1st generation) are large, 1.5 to 6 mm
idiomorphic hexagonal dipyramidal crystals with hexagonal prism faces (β-quartz). The
median grain size of SG1 quartz phenocrysts is 2.3 mm. The large feldspar phenocrysts (up to
2 cm long) are surrounded by microgranophyric intergrowths with quartz. The “typical” SG1
rocks contain a portion of ca. 15 vol.% phenocrysts (5% quartz + 10% feldspar, less than 1%
mica). Phenocryst portions below 12 vol.% and more than 18 vol.%, resp., are rarely
represented and occur only in the southern part of the Schellerhau granite (Pöbelknochen and
Seifenbusch area, Schilka and Baumann, 1996). The Pöbelknochen (elevation 833 m)
represents the uppermost part of the Schellerhau granite massif in the studied vertical profile.
The matrix quartz, we call it later 3rd generation, exhibits variable shape. The major portion of
the granite is characterised by aplitic matrix quartz which contains small crystals (0.02 - 0.2
mm) that are anhedral and more or less isometric. They surround the small euhedral feldspar
crystals as clusters or networks or occur as overgrowths on quartz phenocrysts. Crystals (< 0.1
mm) are often in granophyric intergrowths with feldspar. The matrix quartz is in a
microgranophyric intergrowth with feldspar especially in the upper 30 m of the cupola region
of the locality Pöbelknochen. This texture is superimposed by interconnected miarolitic
texture (IMT, Candela and Blevin, 1995). The IMT consists of micropegmatitic miaroles that
form 3-dimensional interconnected networks (Fig. 7.4). The size of the druses and miaroles
ranges from 0.2 mm to pegmatitic cavities of several cm size. Below 800 m elevation the
microgranophyric texture of the matrix quartz continuously changes into aplitic texture and
the IMT disappears. In the deeper parts, the IMT occurs only rarely and is developed 2-
dimensionally exclusively along early fractures that were filled by residual melt portions
(locality Paradies-Fundgrube).
Supported by the small grain size of the miarolitic matrix, another quartz type could be
detected at the Pöbelknochen locality. However in contrast to the phenocrysts, these
microphenocrysts are euhedral, hexagonal dipyramids of only 0.1 to 0.5 mm size, and are
homogeneously distributed within the matrix. They are mantled by matrix quartz, similar to
the phenocrysts, and are classified as 2nd quartz generation. The percentage of this frequent
grain generation is difficult to determine. For example, the miarolitic SG1 rocks contain 5 to
7 vol.% of this 2nd quartz generation. It may be assumed that this generation is represented
also within the aplitic type. However, due to the small grain size it is not distinguishable from
the aplitic grains in studies of the lacquer peels and thin sections.
Hydrothermal quartz is well distinguishable from the above described primary magmatic
quartz. Based on postsolidus recrystallisation textures (metasomatic overprint and blasteses),

129
visible CL zonation, and dark red-brown luminescence, those metasomatic quartz textures
formed by hydrothermal processes could be excluded from this study.
The quartz texture of the SG2
The SG2 exhibits a weak hiatalporphyritic texture (Figs. 7.3 and 7.4) that was described in the
past as homophan (Pälchen, 1968) or equigranular (Schilka and Baumann, 1996). However,
the grain size distribution shows a significant hiatus between the both maxima at 0.7 mm and
3 mm. The median grain size of the SG2 quartz phenocrysts (1st generation) is 2.6 mm (the
corresponding value in the SG1 for the 1st quartz generation is 2.3 mm). The most frequent
phenocryst portion amounts to 15 vol.% as in SG1 (5 % quartz + 10% feldspar). Variations in
comparison to the “normal” type are situated only in the southern part of the granite massif
near the locality of Seifenbusch. The mine dumps of the abandoned “Paradies-Fundgrube”
contain SG2 varieties with up to 35 vol.% phenocryst portions (quartz + feldspar), and others
with less than 10 vol.%. The role of the 2nd quartz generation may be similar to that in the
SG1. The anhedral matrix quartz (3rd generation) of the SG2 was feeding the irregular cavities
between the subhedral to euhedral feldspar crystals and envelopes the quartz phenocrysts.
The quartz texture of the SG3
The textures of the granite phases succeeding SG1 and SG2, in the following summarized as
SG3, are heterogeneous, aberant and show no or only few similarities to the previously
described textural types (Fig. 7.5). Numerous leucocratic SG3 phases and varieties,
hiatalporphyritic, seriate, equigranular and aplitic ones, are, in general, characterised by an
alkali feldspar-rich matrix. Within the matrix composed of euhedral, microcrystalline albite
plates (20 - 600 µm) occur micropoikilitic, amoebic and snowball-like quartz phenoblasts of
different size (0.3 - 5 mm). These belong to magmatic-hydrothermal transition processes and
form a 4th quartz generation that is grown in a highly viscous crystal mush with a low portion
of residual melt in coexistence with fluids exsolved from the melt. Albite has been clearly
determined as the liquidus mineral as it forms inclusions in all the other rock-forming
minerals. Small isolated K-feldspar phenocrysts have irregular grain boundaries. The quartz
crystals contain numerous euhedral albite crystals that also typically occur in the matrix. The
irregular grain boundaries of the quartz, surrounding the albite crystals of the matrix, support
the idioblastic growth. Partially, the quartz grains show euhedral shape due to occurrence of
idioblastic growth creating textures characteristic of highly fractionated Sn-bearing granites
(Cobbing et al., 1992; Müller and Behr, 1997; Beskin et al., 1994).
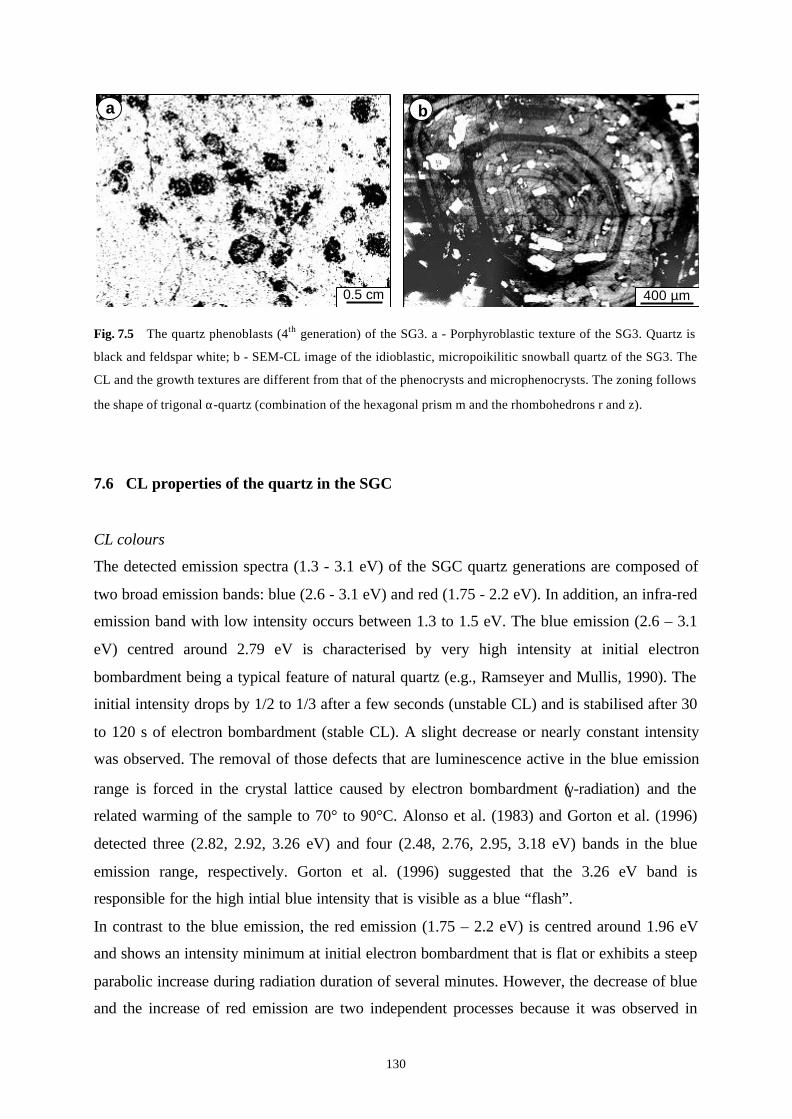
130
Fig. 7.5 The quartz phenoblasts (4th generation) of the SG3. a - Porphyroblastic texture of the SG3. Quartz is
black and feldspar white; b - SEM-CL image of the idioblastic, micropoikilitic snowball quartz of the SG3. The
CL and the growth textures are different from that of the phenocrysts and microphenocrysts. The zoning follows
the shape of trigonal α-quartz (combination of the hexagonal prism m and the rhombohedrons r and z).
7.6 CL properties of the quartz in the SGC
CL colours
The detected emission spectra (1.3 - 3.1 eV) of the SGC quartz generations are composed of
two broad emission bands: blue (2.6 - 3.1 eV) and red (1.75 - 2.2 eV). In addition, an infra-red
emission band with low intensity occurs between 1.3 to 1.5 eV. The blue emission (2.6 – 3.1
eV) centred around 2.79 eV is characterised by very high intensity at initial electron
bombardment being a typical feature of natural quartz (e.g., Ramseyer and Mullis, 1990). The
initial intensity drops by 1/2 to 1/3 after a few seconds (unstable CL) and is stabilised after 30
to 120 s of electron bombardment (stable CL). A slight decrease or nearly constant intensity
was observed. The removal of those defects that are luminescence active in the blue emission
range is forced in the crystal lattice caused by electron bombardment (γ-radiation) and the
related warming of the sample to 70° to 90°C. Alonso et al. (1983) and Gorton et al. (1996)
detected three (2.82, 2.92, 3.26 eV) and four (2.48, 2.76, 2.95, 3.18 eV) bands in the blue
emission range, respectively. Gorton et al. (1996) suggested that the 3.26 eV band is
responsible for the high intial blue intensity that is visible as a blue “flash”.
In contrast to the blue emission, the red emission (1.75 – 2.2 eV) is centred around 1.96 eV
and shows an intensity minimum at initial electron bombardment that is flat or exhibits a steep
parabolic increase during radiation duration of several minutes. However, the decrease of blue
and the increase of red emission are two independent processes because it was observed in
ba
400 µm0.5 cm

131
deformed quartz that the red emission remained constant whereas the blue one decreased
(authors’ unpubl. data).
After subsidence of the initial blue emission, the morphologically-distinct quartz generations
of the SGC show different luminescence colours from bright blue to violet to dark red-brown.
There are three different luminescence types of quartz in SG1 and SG2 rocks. Nearly all
phenocrysts in the SG1 and SG2 sections, exhibit a weak luminescent, dark red-brown
phenocryst core. This is surrounded by 100-1000 µm broad, in shades of a blue and violet
luminescent phenocryst ongrowth zone. The phenocrysts show an outermost ongrowth zone
formed by homogeneous matrix quartz with unstable red-brown luminescence. The spectral
analysis of the red-brown luminescent phenoblasts of the SG3 was not feasible due to the high
density of feldspar inclusions.
The luminescence spectra at 1.3 to 3.1 eV of these three types show different ratios of red
versus blue emission peak areas. The ratio in the phenocryst core is 3.5, in the blue zone 1.4,
and in the matrix quartz 2.8. The red-brown luminescent phenocryst core is characterized by a
minor concentration of stable blue luminescent defect structures and accompanied by a low
red emission intensity, that only slightly increases during continued radiation. In contrast, the
blue luminescent quartz exhibits a much higher stable blue luminescence and also a low and
slightly increased red emission. The intensity of the blue luminescence of the matrix quartz
lies near those of the red core, but the high red intensity is characterised by a steep rise.
Consequently, the CL of the two phenocryst luminescence types is more stable during
electron radiation than the CL of the matrix quartz.
The infra-red emission between 1.3 to 1.5 eV behaves similar to the red emission, the
intensity increases with treatment (electron bombardment) time. The intensity of this emission
peak is lower than the blue and red emissions, and it varies strongly within quartz grains that
are visible as homogeneous.
Primary growth textures
The phenocrysts and microphenocrysts of the SG1 and SG2 show distinctive growth
zonations (Figs. 7.6, .7.7 and 7.8), as is normally more common for rhyolitic phenocrysts (e.g.
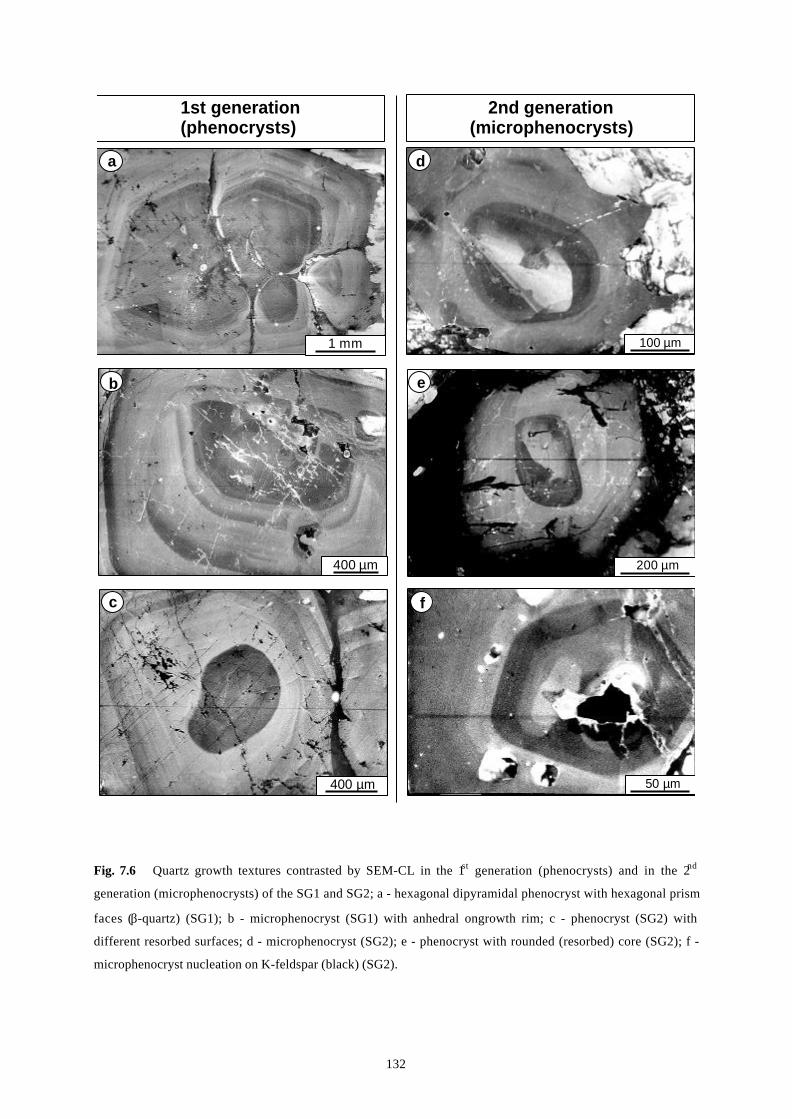
132
Fig. 7.6 Quartz growth textures contrasted by SEM-CL in the 1st generation (phenocrysts) and in the 2nd
generation (microphenocrysts) of the SG1 and SG2; a - hexagonal dipyramidal phenocryst with hexagonal prism
faces (β-quartz) (SG1); b - microphenocryst (SG1) with anhedral ongrowth rim; c - phenocryst (SG2) with
different resorbed surfaces; d - microphenocryst (SG2); e - phenocryst with rounded (resorbed) core (SG2); f -
microphenocryst nucleation on K-feldspar (black) (SG2).
1 mm
400 µm
400 µm
200 µm
100 µm
50 µm
1st generation(phenocrysts)
2nd generation(microphenocrysts)
a d
e
fc
b

133
Laemmlein, 1930; Schneider, 1993; Watt et al., 1997). The existence of euhedral quartz
phenocrysts in granites showing CL-contrasted growth textures is currently not known to be
common and was described in only a few cases (Frentzel-Beyme, 1989; Seltmann, 1994;
D’Lemos et al., 1997; Müller and Behr, 1997). The detailed analysis and comparison of
growth textures of ca. 40 phenocrysts and 50 microphenocrysts in SG1 and SG2 allow the
correlation of significant growth textures indicating a common crystallisation history.
All phenocrysts of the SG1 and SG2 exhibit a dark red-brown luminescent rounded or
globular core (zone 1). Internally, the dark core zone does not show contrasted growth
textures. Weakly contrasted growth zones occur exclusively in the marginal zone (zone 1a).
The crystals used tiny mica, albite or orthoclase crystals as nuclei. Large crystal nuclei (e.g.,
mica and K-feldspar) often serve as growth centers for two to five quartz crystals
simultaneously, and growth impediments are typical (Fig. 7.6a). Such grain clusters may
break up during magma flow, leading to single grains, showing different growth rates in the
various growth directions. In the case of small nuclei, isolated crystals develop.
Fig. 7.7 Schematic representation of quartz growth textures contrasted by SEM-CL and their correlation with
the 1st generation (phenocrysts) of the SG1 and SG2. Two different euhedral quartz generations continue to grow
simultaneously with the beginning of microphenocryst growth in the step zone 2b. The subordinate zones 2a, b
and c are characterised by a gradual change from bright blue to violet luminescence. Both the phenocrysts and
microphenocrysts are hexagonal dipyramidal β-quartz crystals with hexagonal prism faces.
Zone 3Zone 2cZone 2b
Zone 2a
Zone 1bZone 1a
Zone 3Zone 2cZone 2b
1st generation of the SG1
Common growth history ofthe SG1 and SG2 phenocrysts
1st generation(phenocrysts)
2nd generation(microphenocrysts)
SG1SG2
1 mm
1st generation of the SG2

134
Fig. 7.8 Schematic representation of quartz growth textures contrasted by SEM-CL and their correlation with
the 2nd generation (microphenocrysts) of the SG1 and SG2. The frequent impediments of the zone 2c were
caused by vapour bubbles that stuck to the crystal surface and hindered the growth.
The stage of red-brown growth ends with resorption (rounding) (Figs. 7.6b, c). The evidence
of resorption is the cutting of zonations of zone 1a. The degree of resorption differs strongly
in the individual crystals, and most of the euhedral crystals develop a globular shape. This is
succeeded by a blue to violet growth zone (zone 2) that may be subdivided into three sub-
zones (2a, b and c). Internally, these sub-zones show a gradual transition from bright blue to
violet. Within the sub-zones are oscillatory zonations of 2 to 20 µm thickness. Zone 2 may
have up to three subordinated resorption phases, where the resorption is only slightly
developed and is not detectable in each crystal. The oscillatory zonation of zone 2 in the SG1
phenocrysts disappears in the direction of the red-brown luminescent rim (3rd generation, zone
Zone 3
Zone 2c
Zone 2b2nd generation of the SG1
Common growthhistory of the SG1 andSG2 microphenocrysts
2nd generation(microphenocrysts)
2nd generation of the SG2
0.1 mm

135
3). In contrast, zone 2 in the SG2 phenocrysts is disturbed by resorption. This is followed by a
homogeneous red-brown anhedral growth rim.
In addition to the 1st generation of quartz phenocrysts, the 2nd generation of euhedral quartz
(microphenocrysts) occurring in the miarolitic SG1 (Figs. 7.4 and 7.8) exhibits clearly-
contrasted growth textures with oscillatory zones of ≥ 2 µm. The growth textures belonging to
different crystals may be correlated as genetically-linked generations. The nucleation of the
second generation can be reconstructed in detail (Fig. 7.6d-f). Exclusively, tiny K-feldspar
crystals serve as crystallisation centre for quartz that started growing simultaneously at many
places on the feldspar surfaces. With increasing size the growing crystals touch and unify to a
single crystal. It is significant that these crystals of the 2nd generation do not show the growth
impediments that usually develop during growth of neighbouring crystals (such as
phenocrysts of 1st generation). The crystals of the 2nd generation could grow in the melt
unimpeded and have only few small lobate impediments. Consequently, the crystals
accumulated in a later crystallisation stage to intergranular clusters that are situated among the
feldspars and form net-like envelopes around the feldspar crystals as visible by CL (Fig. 7.9).
The crystal growth begins with bright blue luminescent quartz which merges into violet
during further growth. This growth stage is accompanied by an early simultaneous resorption
and by a subsequent distinct resorption stage (Fig. 7.6d-f). The overgrowth zone changes from
bright blue to violet again. Within this zone lobate impediments often occur. Such structures
could not be observed in large phenocrysts of the 1st generation. Marginally, the SG1
microphenocrysts lose their zonal structure and merge into homogeneous, dark red
luminescent, anhedral growth rims. In contrast, the marginal zone of the SG2 quartz
concludes with resorption, similarly to the SG2 phenocrysts. Finally, the SG2
microphenocrysts show ongrowth of a homogeneous, red-brown luminescent anhedral
generation (3rd generation, zone 3).
The average grain size of the microphenocrysts (0.07 - 0.6 mm, Fig. 7.4) is lower in the SG1
than in the SG2 (0.3 - 0.9 mm). The comparison of grain size maxima of the miarolitic SG1
(0.15 mm) with the aplitic SG1 (0.3 mm) shows that the grain size of this generation increases
in the aplitic SG1. The CL observations allow the conclusion that this increase of grain size is
caused by a broader anhedral growth rim in the aplitic facies. In contrast, the grains of the
miarolitic variety exhibit either no or very thin growth rims. Thus, the measured average grain
size of the miarolitic variety represents the “true” size of the SG1 microphenocrysts.

136
Although the euhedral 1st and 2nd generations show different grain size range, it is justified to
correlate their growth textures. The microphenocrysts have initial growth during the growth of
zone 2b of the phenocrysts. Both exhibit the same resorption events, but the resorption is
more strongly developed in the microphenocrysts. In exceptional cases, individual crystals
form sub-generations between 1st and 2nd generations. These are phenocryst fragments that
formed by brittle failure during magma flow and that later continued to grow separately (Fig.
7.6a). According to habits, internal zonation and luminescence behaviour, the 1st and 2nd
generations of quartz phenocrysts are similar or identical to those in rhyolites (Schneider,
1993). This observation characterises the original SGC melt as dry felsic (rhyolitic) magma.
The growth zoning of phenoblasts of the SG3 (4th generation, Fig. 7.5) shows no similarities
to the zoning in the phenocrysts and microphenocrysts of the SG1 and SG2 and develops
obviously under magma-hydrothermal transitional conditions when the melt is degassing. It is
clearly distinguishable from the postsolidus rearrangements by hydrothermal fluids as
outlined above. The phenoblasts consist of sharp-bordered, homogeneous, bright grey and
1 mm
1 mm
a
b
Fig. 7.9 Distribution of the
1st (large grey grains), 2nd
(small grey grains) and 3rd
generation (black) in the
quartz framework a) of the
SG1 and b) of the SG2 in thin
section images.

137
dark grey contrasted zones (2 µm to 200 µm). Resorption surfaces which resulted in rounding
of the crystals cannot be detected. The zoning follows the shape of trigonal α-quartz
(combination of the hexagonal prism m and the rhombohedrons r and z). Growth impediments
occur around the feldspar inclusions, but the impediments do not form large lobate textures
like those in the microphenocrysts.
Secondary CL structures
Primary growth textures and secondary CL structures are distinguished by characteristic
features because primary textures were developed during crystallisation and secondary
strucutres formed after growth. Secondary structures overprint and delete primary ones.
Cataclasis of crystals (cracks, decrepitated inclusions) cause recrystallisation of quartz that
shows different CL characteristics due to formation under different conditions.
Almost all quartz crystals contain dark red-brown luminescent, star-like structures along thin
microcracks (< 3 µm). These strucutres are healed decrepitation traces of micro-inclusions.
The ruptures that connect the decrepitation halos can be explained by cooling-induced thermal
stresses at grain scales, especially during incoherent β-/α-transition and isothermal uplift
(Sprunt, 1979; Behr, 1989). In the case of dense networks of microcracks a fracture pattern of
dark contrasted polygons develops (Figs. 7.6e and 7.10).
White to light gray contrasted structures veining the grains in high intensity are conspicious in
these samples (Fig. 7.6b). Their distribution is inhomogeneous; some single grains are
extremely veined and others not. These structures are stable at extended electron
bombardment and are rooted in inclusions and neighboured crystals of K-feldspar. The quartz
develops white rims at its grain boundaries with K- feldspar. The veins use the decrepitation
structures and partially overprint them. All quartz types show light halos around radioactive
inclusions.
In addition to thin CL contrasted microcracks (< 3 µm) that connect the decrepitation traces,
larger transgranular microshear zones (to 100 µm) showing distinct brecciation of the host
quartz occur (Fig. 7.6c). The healed cracks, that are only visible by CL are related to heat
generated by friction of crystals in the melt and to post-magmatic deformation.

138
Fig. 7.10 Synoptical scheme of secondary structures contrasted by SEM-CL. 1 - star-like decrepitation traces
around fluid inclusions connected with microcracks; 2- pattern of polygons associated with a dense network of
microcracks; 3 - light grey contrasted structures rooted in inclusions and neighboured crystals of K-feldspar; 4 -
microshear zones; 5 - round halos around radioactive inclusions.
7.7 Relationships between CL and trace element distribution in quartz of the SGC
Different trace element contents in the quartz generations and the heterogeneous incorporation
of trace elements in zoned crystals reflect changes of growth conditions like temperature,
pressure and composition of the melt. One aim of this work was to determine the trace-
element contents of the different quartz generations and their distribution in the zoned
phenocrysts, to search for correlations between the CL behaviours and Al, Ti, Fe and Mn.
High Al concentrations occur in the red brown luminescent matrix quartz as a short-lived,
intensive initial blue (Figs. 7.11a, c and 7.12). In contrast, the quartz phenocrysts and the
quartz of the healed microcracks with blue CL and relative stable red-brown, respectively,
contain low Al concentrations. Alonso et al. (1983), Perny et al. (1992), Kalceff and Phillips
(1995) and Gorton et al. (1996) suggested that the 3.1 – 3.25 eV emission band correlates with
Al of the compensated centres and causes the unstable portion of the blue CL. However, the
2
3
4
4
5
kfs
kfs
mica
1

139
investigated quartz shows a decrease of the entire measured blue emission range (2.6 – 3.1
eV) with maximum at 2.79 eV.
Numerous studies of natural and synthetic quartz by electron paramagnetic resonance (EPR)
and optical absorption showed that Al3+ (M3+) as the most characteristic impurity element of
quartz substitutes Si4+ in the silicon-oxygen tetrahedra of the regular lattice and Li+, Na+, K+,
Fe2+ and H+ (Mn+) as ion-compensators enter interstitial positions. The infrared absorption
spectra of natural quartz crystals often exhibit sharp, dichroic absorption peaks between 3000
and 3740 cm-1 which are associated with hydrogen and hydroxyl acting as a charge
compensator of Al3+ and of Mn+ (e.g. Brunner et al., 1961; Kats, 1962; Bambauer et al., 1963).
Maschmeyer and Lehmann (1983) gave a first model for the association of Al and hydroxyl in
quartz where two OH groups are neighbouring the substitional M3+ (Al3+, Fe3+...) and
interstitial Mn+. Stenina et al. (1988) showed on the basis of transmission electron
microscopy, X-ray microanalysis and EPR that the trace M3+ cations replacing Si4+ in oxygen
tetrahedra are related to compensating Mn+ ions and form parts of aqua complexes and
clusters as follows:

140
Scheme 1
The greater part of the structural water, Al-, Li- and Na-ions of hydrothermal and magmatic
quartz are incorporated in such aqua complexes. These defect structures are primary and are
built into the lattice during crystallisation. Consequently the uptake of M3+ and Mn+ in
magmatic quartz is controlled by the presence of water in the melt. The structural water
bounded as Si---O-H-H traps scattered electrons during radiation and the bounds are ruptured
(McLaren and Phakey, 1966; Maschmeyer and Lehmann, 1983; Stenina et al., 1984). The
radiation-induced reaction results in the development of paramagnetic E’ centres (≡Si·) and/or
diamagnetic trapped electron centres (≡Si:) which are beside the non-bridging oxygen hole
centres (Si-O·) the cause for the emission at 1.96 eV (Griscom, 1985). This process is visible
by CL where the formation of point defects of red-brown CL (<1µm) takes place in water-rich
pegmatitic and granitic quartz during electron bombardment (e.g. Behr, 1989; Schneider,
1993). Nevertheless, the mechanism of transformation is not clearly yet. The higher the
content of interstitial molecular water and of associated Men+ and M3+ ions in the magmatic
quartz the steeper is the intensity increase of red CL during the electron bombardment.
Furthermore, the different quartz luminescence types of the SGC reflect the water content of
the melt: dry (“rhyolitic”) conditions during the nucleation and growth of the red-brown
phenocryst core, more wet conditions during the blue phenocryst growth and, finally, wet
(“granitic”) conditions during the granite emplacement and crystallisation of the 3rd
generation. The low Al concentration in the phenocrysts is presumedly caused by the limited
water supply in the melt. This conclusion confirms Thomas (1994) who determined water
contents of melt inclusions of Erzgebirge granites in the range of 2.9 to 8.0 eq. wt. %. These
melt inclusions represent the early and late stages of quartz crystallisation, respectively.
O O O
Si H Me
O O O Me O O
Si H Me
O O O
n+
m+
m+
-
-
+
+

141
Fig. 7.12 SEM-CL profile across a zoned quartz phenocryst showing the Al and Ti concentration and the ratio
of the red and blue emission peak areas.
elem
ent c
onte
nt (
ppm
) p
eak
area
of r
ed (
1.96
eV
)/p
eak
area
of b
lue
(2.7
9 eV
) CL
qua
rtz
SE
M-C
L
quartz grain profile (µm)0 500 1000 1500 2000 2500
3.5
3.0
2.5
2.0
1.5
1.0
300 µm
Al Ti
bluephenocryst quartz
red-brownphenocryst quartz
rel. stable CLrel. stable CL
rel.
unst
able
CL
red-brown quartzof healed microcracks
red-
bro
wn
mat
rix
quar
tz
250
200
150
100
50
0

142
In contrast to the M3+ and Mn+ the substitional M4+ ions (mostly Ti4+) create relatively stable
defect centres without interstitial charge compensators. The blue luminescent quartz of the
phenocrysts and microphenocryst shows a strong enrichment of Ti. In contrast the stable red-
brown CL of the phenocryst and crackling structures and the unstable red-brown CL of matrix
quartz exhibit low Ti concentrations. The high intensity of the stable blue luminescence
correlates with Ti-related defect centres (Figs. 7.11a, b and 7.12). These observations are also
supported by Kerkhof et al. (1996) and Bruhn et al. (1996). It remains unsolved if the Ti
functioned as CL activator or sensitizer (J. Götze, pers. comm.). The dark red-brown
luminescent quartz of the healed microcracks and of the decrepitation halos is depleted in Al
and Ti (Figs. 7.11a-c and 7.12).
Iron and manganese concentrations of all CL types are below the detection limit of 23 and 26
ppm, respectively.
7.8 A multistage quartz crystallisation model of the SGC
Early phenocryst crystallisation
Initially, nuclei developed in the melt during growth as hexagonal dipyramids (β-quartz).
Such crystals are formed at low values of undercooling ∆Ti (Kirkpatrick, 1975; Allègre et al.,
1981; Swanson and Fenn, 1986; MacLellan and Trembath, 1991). The value of ∆Ti is the
difference between the liquidus temperature and crystallisation temperature. At such
conditions, the nucleation rate is low (Swanson, 1977), and only a limited number of nuclei
may be formed in the melt.
The nucleation of quartz crystals of the 1st generation, and 2nd generation, as well took place
in few cases on growth centres that are formed by tiny K-feldspar, albite and mica crystals.
Their joint occurrence allows to interpret them as microenclaves that are in disequilibrium
with the melt. Especially the alkali feldspar residues are often corroded until nearly complete
resorption.
The euhedral habit of the phenocrysts seems to indicate unimpeded crystallisation in the melt,
maybe due to high charge potential. The hexagonal habit of the zoning (β-quartz) indicates
that the phenocrysts crystallised at about 750 °C (7 kbar; Yoder, 1950) and that the melt
shows a H2O-content of <2.5 wt% (Johannes and Holtz, 1996). Evidence for possible
maximum depths of first nucleation for crystallisation of Erzgebirge tin granites is provided
by microthermometric studies of silicate melt inclusions in quartz phenocrysts (Thomas,

143
1992), which indicate the depth of magma formation of up to 21 km (Fig. 7.13). The results of
melt inclusion studies (Thomas, 1994) on granitic quartz form a p-T-t path that tracks the
entrapment of melt during quartz growth in different stages of magma uprise at various crust
levels. This synoptical information based on a few hundreds of inclusion data reflects the
stages of melt evolution. To reconstruct in detail from which defined growth zone of a single
quartz phenocryst an individual melt inclusion was measured requires application of more
sophisticated methods (oriented sections, CL, SIMS).
Fig. 7.13 The quartz crystallisation model of the Schellerhau granites. Scheme shows nucleation, growth and
resorption of four different quartz generations at its formation depths and resulting growth patterns. The
evolution scheme of the SGC considers melt generation from the lower crust under decompressional, late
collisional tectonics of the Variscan orogen in the Upper Carboniferous. Extensional tectonics control the
segregation of melt batches and multiphase intrusion of SG1, SG2 and SG3 into a subvolcanic level.
+
+
0
10 km
20 km
nucleation and ongrowth ofanhedral matrix qtz (3rd gen.)on 1st and 2nd qtz generationin SG1 and SG2.Nucleation and idioblasticgrowth of snowball qtz(4th gen.) in SG3
heterogeneous growth of1st and 2nd qtz generation
nucleation of euhedral 2ndqtz generation
resorption of 1stqtz generation
nucleation and growth ofeuhedral 1st qtz generation
1st, 2nd, 3rdqtz generationin SG1 and SG2
IMT - Interconnected Miarolitic Texture
32 km
40 km
MOHOafter extension
MOHOUpper Carboniferous
brittle-ductiletransition zone
SE
GR
EG
ATI
ON
OF
ME
LT
BA
TC
HE
SW
ITH
EX
TE
NS
ION
AL
TE
CT
ON
ICS
ME
LT
DR
AIN
ING
WIT
HLA
TE C
OLL
ISIO
NA
LTE
CTO
NIC
S
present erosion level
water-rich melt(>5 wt% H O)
water-poor melt(<2.5 wt% H O)
SG1 SG2 SG3
IMT4th qtz gene-ration in SG3
DIF
FER
EN
TIA
TIO
N,
CO
OLI
NG
, UP
LIFT
2
2
1st 2nd
3rd4th

144
Weakly CL contrasted growth zones developed only during the final stage of initial growth
(red-brown luminescent core zone 1, Fig. 7.7). These may be either self-organised
(oscillative) growth zones or zones disturbed by disequilibrium with the melt. The growth of
zone 1 ended abruptly by strong resorption of the initial crystallisation stage. Rapid,
isothermal ascent of the magma into higher crust levels explains the resorption that produced
rounded crystals (Holtz and Johannes, 1994). There is no evidence for magma mixing, neither
from the chemical evolution of the intrusion sequence nor from the element profiles in the
feldspars (authors’ unpubl. data).
The growth of the blue luminescent zone begins (zone 2) in a higher crust level, at weakly-
undercooled melt conditions (Fig. 7.13). The euhedral unimpeded growth continues, with the
distinction, that periodic, fine laminae, 5 - 20 µm broad oscillatory zones form in the 300 to
1000 µm broad zone 2.
Cyclic, self-organising oscillation growth is only possible when the melt cannot convect and
the chemical bulk composition remains constant. Despite the obvious homogeneity of the blue
growth zone a number of events are documented that possibly reflect changes of the melt
conditions (Figs. 7.9 and 7.13):
1. Within zone 2 occurs three times the gradual change from bright blue to violet. These sub-
zones (2a, b and c) stop abruptly and the next zone starts growing with bright blue CL.
2. A second nucleation stage, that begins with the growth of zone 2b in the phenocrysts
occurs. Crystallisation of the 2nd euhedral quartz generation (microphenocrysts) starts (Fig.
7.7, 7.13). The second nucleation stage requires a change in temperature/pressure
conditions (Sibley et al., 1976).
3. Furthermore, up to three subordinated resorption stages develop. Only one of them
coincides with the abrupt change of violet to blue luminescence (border of zone 2b to 2c).
The other two resorptions are situated within the zones 2a and 2b, respectively. The latter
resorption stages are more clearly developed in the microphenocrysts than in the
phenocrysts.
4. Also obvious are frequent lobate impediments occurring in the zone 2c, especially of the
microphenocrysts (Fig. 7.8). The impediments may be caused by vapour bubbles which
stuck to the crystal surface and hindered growth. The bubble formation may be explained
by depressurisation (degassing) and related foaming (1st boiling of melt) prior to the main
intrusion.

145
The equilibrium of the bulk melt in the reservoirs, that is responsible for the blue luminescent
zones, occurred for a long time, and was only slightly disturbed. Stepwise ascent along short
distances or convection may be the cause of weak undercooling in the melt. The initiation of
growth of the microphenocrysts of zone 2b caused two different euhedral quartz generations
that continue to grow simultaneously. The nuclei of the microphenocrysts surrounding one
and the same crystallisation centre unify themselves during continued growth to one single
crystal which contrasts with the nucleation behaviour of the 1st quartz generation. This may be
due to lower charge potential of the 2nd quartz generation.
Melt separation, intrusion, and main crystallisation of SG1, SG2 and SG3
Generally, the 1st and 2nd quartz generations of the SG1 and SG2 have a common
crystallisation history as outlined above. Only during the growth of zone 2b, the SG1 melt
separated from deeper located melt reservoir and intruded at a subvolcanic level. The
microgranophyric and aplitic matrix quartz, both of which crystallised in the intrusion level,
represent as 3rd generation (zone 3) the final crystallisation. The textures indicate extreme
nucleation, low growth rates and that the melt was strongly undercooled (Swanson and Fenn,
1986). MacLellan and Trembath (1991) show, that porphyritic textures in which quartz occurs
as unit of phenocrysts and aplitic matrix grains (Kirkham and Sinclair, 1988) are textures of
rapid cooling. Granophyric intergrowths in the groundmass and matrix quartz overgrowing
the phenocrysts are common. Consequently, the quartz phenocrysts were already present,
when the matrix and granophyric quartz crystallised. In addition to the textures, the
geomorphological and stratigraphic considerations of Spengler (1949) and Schust (1980), who
concluded a ca. 1,000 m thick cover at the time of intrusion, support the subvolcanic nature.
Geothermobarometric data give a paleo-intrusion level of the various tin granites of the
Erzgebirge between 200 and 3,000 m (Seltmann et al., 1992).
The locality Pöbelknochen (833 m) represents the roof of the Schellerhau massif. There are
diffuse contacts between “normal” SG1 rocks (with 15% phenocrysts) and local zones of
SG1 variations with extremely variable phenocryst content. We interpret the latter rocks as
result of highly dynamic magma near the intrusion centre. Possible interpretations include
mixing of forerunner marginal and main phase magma in the immediate roof parts of the
intrusion, or magma schlieres with variable phenocryst content, or melt batches intruding
subsequently to the normal SG1 emplacement. Except for the marginal intrusive
endocontacts, only at Pöbelknochen few xenoliths of the metamorphic cover are incorporated
in the granite body. The interconnected miarolitic texture (IMT) found at Pöbelknochen
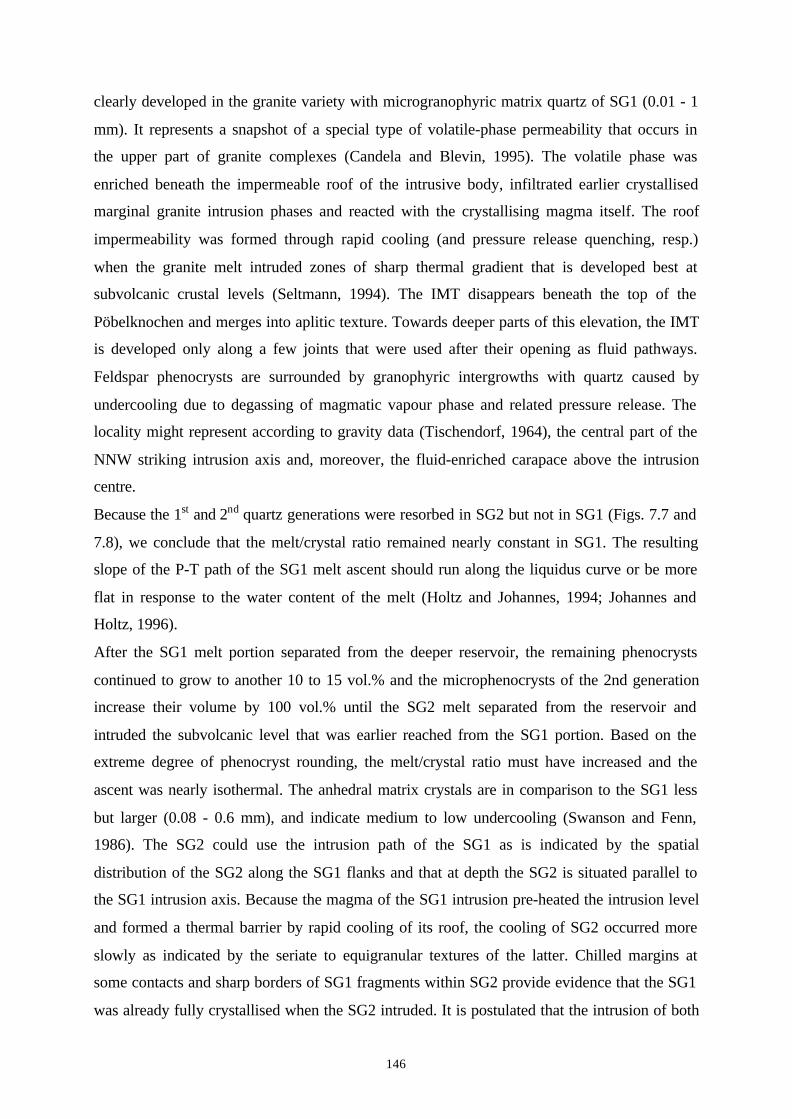
146
clearly developed in the granite variety with microgranophyric matrix quartz of SG1 (0.01 - 1
mm). It represents a snapshot of a special type of volatile-phase permeability that occurs in
the upper part of granite complexes (Candela and Blevin, 1995). The volatile phase was
enriched beneath the impermeable roof of the intrusive body, infiltrated earlier crystallised
marginal granite intrusion phases and reacted with the crystallising magma itself. The roof
impermeability was formed through rapid cooling (and pressure release quenching, resp.)
when the granite melt intruded zones of sharp thermal gradient that is developed best at
subvolcanic crustal levels (Seltmann, 1994). The IMT disappears beneath the top of the
Pöbelknochen and merges into aplitic texture. Towards deeper parts of this elevation, the IMT
is developed only along a few joints that were used after their opening as fluid pathways.
Feldspar phenocrysts are surrounded by granophyric intergrowths with quartz caused by
undercooling due to degassing of magmatic vapour phase and related pressure release. The
locality might represent according to gravity data (Tischendorf, 1964), the central part of the
NNW striking intrusion axis and, moreover, the fluid-enriched carapace above the intrusion
centre.
Because the 1st and 2nd quartz generations were resorbed in SG2 but not in SG1 (Figs. 7.7 and
7.8), we conclude that the melt/crystal ratio remained nearly constant in SG1. The resulting
slope of the P-T path of the SG1 melt ascent should run along the liquidus curve or be more
flat in response to the water content of the melt (Holtz and Johannes, 1994; Johannes and
Holtz, 1996).
After the SG1 melt portion separated from the deeper reservoir, the remaining phenocrysts
continued to grow to another 10 to 15 vol.% and the microphenocrysts of the 2nd generation
increase their volume by 100 vol.% until the SG2 melt separated from the reservoir and
intruded the subvolcanic level that was earlier reached from the SG1 portion. Based on the
extreme degree of phenocryst rounding, the melt/crystal ratio must have increased and the
ascent was nearly isothermal. The anhedral matrix crystals are in comparison to the SG1 less
but larger (0.08 - 0.6 mm), and indicate medium to low undercooling (Swanson and Fenn,
1986). The SG2 could use the intrusion path of the SG1 as is indicated by the spatial
distribution of the SG2 along the SG1 flanks and that at depth the SG2 is situated parallel to
the SG1 intrusion axis. Because the magma of the SG1 intrusion pre-heated the intrusion level
and formed a thermal barrier by rapid cooling of its roof, the cooling of SG2 occurred more
slowly as indicated by the seriate to equigranular textures of the latter. Chilled margins at
some contacts and sharp borders of SG1 fragments within SG2 provide evidence that the SG1
was already fully crystallised when the SG2 intruded. It is postulated that the intrusion of both

147
granites occurred in the period of crustal uplift and rapid erosion so that the crystallisation
process happened within changing p-T gradients.
The SG3 represents the end member of the geochemical differentiation of the Schellerhau
granite massif. Despite its geochemical and genetical relations with SG1 and SG2, the SG3
does not show textural similarities. Geochemical evidence (REE patterns, Zr/Hf) indicates
that the melt originated from the same reservoir. But, texturally, the phenocrysts of the 1st and
2nd generations are missing as expected. The sealed amoebic grain boundaries of snowball
quartz (4th generation) show replacement and idioblastic growth with entrapment of
numerous matrix crystals. The crystallisation of this phenoblastic quartz type occured in the
last stage of crystallisation representing the fluid-saturated, highly-evolved alkali feldspar-rich
residual melt. Oscillations of rapidly increased velocity of quartz growth enabled zonal
entrapment of albite. At slow growth velocity quartz “snowplowed” the albite tablets in the
melt and albite-free zones of quartz were developed. This crystallisation stage is representing
the magma-hydrothermal transition when the melt is becoming highly viscous after releasing
its magmatic vapour phase (magma degassing due to hydraulic fracturing).
The trigonal habit of the zoning (α-quartz) indicates that the phenoblasts crystallised at
<600°C (<1kbar). The phenoblasts which crystallised in the subvolcanic level indicate a late-
stage H2O-content of >5 wt% in the melt (Yoder, 1950; Thomas, 1994; Johannes and Holtz,
1996).
The quartz phenoblasts and hydrothermal greisen quartz cannibalised more or less the older
quartz generations, thus reflecting the intense late- to post-magmatic fluid-rock reactions that
are closely related to tin mineralisation and deuteric alteration.
7.9 Summary
The application of cathodoluminescence combined with grain texture and grain size analysis
facilitates the identification of four quartz generations in the SG1, SG2 and SG3: � large
(∅=2.3 mm) euhedral hexagonal dipyramidal zoned phenocrysts (1st generation); �
hexagonal dipyramidal zoned microphenocrysts (2nd generation) (∅ = 0.2 mm); � matrix
quartz (3rd generation) developed aplitic and miarolitic (∅=0.1 mm) in the SG1 and anhedral
(∅=0.3 mm) in the SG2; and � zoned, micropoikilitic, amoebic and snowball-like quartz
phenoblasts (0.3 - 5 mm) (4th generation) in the SG3. One maximum of a grain size
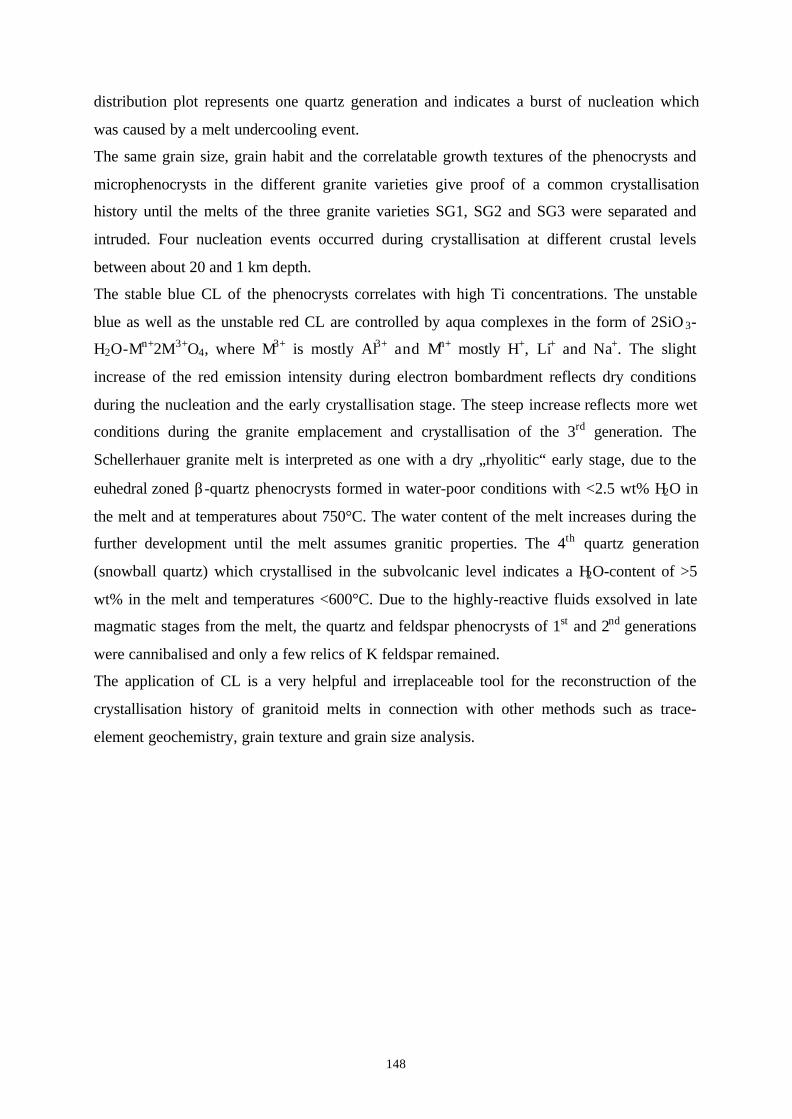
148
distribution plot represents one quartz generation and indicates a burst of nucleation which
was caused by a melt undercooling event.
The same grain size, grain habit and the correlatable growth textures of the phenocrysts and
microphenocrysts in the different granite varieties give proof of a common crystallisation
history until the melts of the three granite varieties SG1, SG2 and SG3 were separated and
intruded. Four nucleation events occurred during crystallisation at different crustal levels
between about 20 and 1 km depth.
The stable blue CL of the phenocrysts correlates with high Ti concentrations. The unstable
blue as well as the unstable red CL are controlled by aqua complexes in the form of 2SiO 3-
H2O-Mn+2M3+O4, where M3+ is mostly Al3+ and Mn+ mostly H+, Li+ and Na+. The slight
increase of the red emission intensity during electron bombardment reflects dry conditions
during the nucleation and the early crystallisation stage. The steep increase reflects more wet
conditions during the granite emplacement and crystallisation of the 3rd generation. The
Schellerhauer granite melt is interpreted as one with a dry „rhyolitic“ early stage, due to the
euhedral zoned β-quartz phenocrysts formed in water-poor conditions with <2.5 wt% H2O in
the melt and at temperatures about 750°C. The water content of the melt increases during the
further development until the melt assumes granitic properties. The 4th quartz generation
(snowball quartz) which crystallised in the subvolcanic level indicates a H2O-content of >5
wt% in the melt and temperatures <600°C. Due to the highly-reactive fluids exsolved in late
magmatic stages from the melt, the quartz and feldspar phenocrysts of 1st and 2nd generations
were cannibalised and only a few relics of K feldspar remained.
The application of CL is a very helpful and irreplaceable tool for the reconstruction of the
crystallisation history of granitoid melts in connection with other methods such as trace-
element geochemistry, grain texture and grain size analysis.

149
8 The genetic significance of snowball quartz in highly
fractionated tin granites of the Krušne Hory/Erzgebirge
(this chapter has been published in “Mineral Deposits: Processes to Processing”
edited by Stanley et al., Balkema, pp. 409-412, 1999, co-author: R. Seltmann)
8.1 Abstract
Snowball-textured quartz phenoblasts are magmatic-hydrothermal fluid saturation textures
and occur widespread in highly evolved alkali feldspar and topaz-bearing granites. They are
characterised by zonal arrangement of entrapped matrix minerals (albite, K-feldspar, mica)
alternating with inclusion-free zones. Case studies from the Schellerhau and Podlesi granites
(Erzgebirge/Krušne Hory) showed a crystallisation sequence albite – K-feldspar – Li-mica –
snowball quartz. If the growth velocity increased rapidly, beside silicate melt drops also
predating and simultaneously formed matrix minerals were overgrown and trapped in the
quartz. CL and growth zoning studies indicate a kinetically caused increase of the growth
velocity with crystal size in a nearly non-convecting crystal mush. Wavy zones of snowball
quartz are interpreted as products of small scale diffusion fronts which lead to the change of
CL properties developed during the crystal growth and caused by rapid variation of the melt
conditions.
8.2 Introduction
Snowball-textured quartzes in granitic rocks are ellipsoidal phenoblasts up to 1cm in size.
They are characterised by zonal arrangement of entrapped matrix minerals (albite, K-feldspar,
mica) alternating with inclusion-free zones (Figs. 8.1 – 8.2a).

150
Fig. 8.1 Synoptical scheme of CL-contrasted growth textures in snowball quartz as observed in the Schellerhau
SG3 granite and in the Podlesi dyke granite. Quartz crystal size is usually 1 mm up to 1 cm.
Regardless the genetically totally different formation mechanism, these late-magmatic
textures have some phenomenological similarities to metamorphic blastesis products also
called snowball texture for which the term was first used when crystals grow under shear
stress and other minerals were entrapped during rotational deformation.
The snowball texture is typical for highly evolved alkali feldspar and topaz-bearing granites
world-wide and its origin is controversially discussed. It is considered to be either
metasomatic (e.g. Beus et al., 1962; Sonyushkin et al., 1991), or magmatic in origin
(Kovalenko, 1977; Renno, 1997; Poutiainen and Scherbakova, 1998).
Snowball-textured quartz occurs also in the roof of late Variscan tin-bearing alkali feldspar
granite stocks of the Krušne Hory/Erzgebirge. For textural, cathodoluminescence (CL) and
trace element studies on snowball quartz were chosen the third intrusion stage SG3 of the
Schellerhau granite complex (Eastern Erzgebirge/Germany; Müller et al., 1999) and the
Podlesí dyke granite (Western Krušne Hory/Czech Republic; Breiter et al., 1997). These

151
highly evolved, Li-F-enriched alkali feldspar leucogranites belong to the younger granite
group and are connected with the Sn-W mineralization of the Krušne Hory/Erzgebirge
(Seltmann, 1994). The rocks are emplaced as small stocks, sills and dykes at shallow crustal
levels (formation pressure <1kbar).
8.3 Petrography and texture
The texture of the alkali feldspar granites is characterized by porphyritic snowball quartz and
K-feldspar, and fine-grained euhedral albite tablets which form the main portion of the matrix.
The quartz are between 2 - 5 mm and 0.2 – 1.5 mm in diameter in the Schellerhau SG3 granite
and Podlesi dyke granite, respectively. In the Podlesi dyke granite, where snowball quartz and
K-feldspar have nearly the same size as the matrix albite, the porphyritic texture shifts into a
fine-grained one. The snowball quartz shows continuous growth into the matrix quartz,
recognizable by the ramified, amoeboic grain boundaries, and penetrates the matrix. Up to 90
vol.% of the modal quartz is accumulated in the snowballs. The crystals contain zonally
enriched inclusions of the matrix minerals, such as corroded K-feldspar, mica, metamictic
zircon, apatite and above all albite. Furthermore, in many cases fluid and melt inclusions
occur. The entrapped albite tablets are often arranged with their long axis parallel to the
zoning. Large number of albite tablets envelope the phenoblast edge indicating that the quartz
put off the albite tablets during the growth. If the growth velocity increased rapidly the albite
and other matrix minerals were overgrown and trapped in the quartz. The general
crystallisation sequence is: albite – K-feldspar – mica – snowball quartz.
8.4 CL and growth zoning
The investigated snowball quartz have a red-brown luminescence with weak intensity. The
CL spectra show a dominance of the red emission centred at 1.96 eV and low intensity of the
blue emission centred at 2.79 eV. During the electron radiation the red emission increases
whereas the blue emission decreases visible by the blue “flash” at the first seconds of
radiation.
The phenoblasts contain CL-contrasted growth zoning which is visible by using the SEM-CL
with 15 kV and a current of 15 mA (Figs. 8.1-8.2). The first growth zones show spherical

152
shape which changes during the subsequent growth into rectilinear bordered zones with α-
quartz habit. The zones have variable width from 2 to 200 µm. Growth impediments around
albite inclusions are recognizable as the zoning fits the shape of the obstruction (Fig. 8.2b).
Fig. 8.2 SEM-CL images of snowball quartz of the Schellerhau SG3 granite. a) Snowball quartz with a large
number of albite inclusions (white); b) Detail of a snowball quartz showing growth impediments around albite
(Ab) inclusions (1), wavy zoning (2), and stress-induced recrystallised quartz (black) around mineral inclusions
(3).
a
400 µm
b
100 µm
AbAb
AbAb
1
3
2

153
These impediments are well developed in the crystal core and are smaller and indistinct in the
direction to the crystal edge. This indicates a general increase of the growth velocity with
growing crystal size. Between the straight bordered growth zones wavy surfaces occur. They
are characterized by convex inlets which are opposed to the growth direction. In contrast to
resorption surfaces which are resulted in sharp truncation of the regular zoning and rounded
crystal corners (e.g. Shore and Fowler, 1996) the inlets of the wavy surface are much smaller
and extend maximal 20 µm in the growth zones and do not cut older zones or round-off
corners. The subsequent growth zones are rectilinear bordered again and parallel to the
euhedral crystal habit. This feature is in contrast to the wavy zoning which is described in
plagioclase by Pearce and Kolisnik (1990) were the subsequent growth keeps the wavy
texture. The wavy zones of snowball quartz are interpreted as a small scale diffusion front
which lead to the change of CL properties developed during the crystal growth and caused by
rapid variation of the melt conditions. The zoning continues into the amoebic crystal margin
and into the matrix quartz without changes of the CL properties. Consequently, at least the
rims of snowball quartz and the matrix quartz represent one and the same quartz generation.
The zoning pattern indicates that the snowball quartz crystallised in-situ without significant
magma movement. The tension anisotropy of quartz caused the stress-induced
recrystallisation of non-luminescent secondary quartz around albite inclusions (Fig. 8.2b).
8.5 Trace elements
The CL of quartz results from substitutional and interstitial incorporation of trace elements
like Al, Fe and Ti and from different types of intrinsic and extrinsic defect centres in the
quartz lattice. K and Na were measured to distinguish the Al originated from mineral
inclusions from that of the host quartz.
Both, the Schellerhau and the Podlesi snowball quartz, are characterised by in average low Ti
concentration of 20 ppm (Figs. 8.3a - 3b). In contrast, the quartz has a variable and mostly
high Al content. Near the contact to albite the Al, Fe and Ti content increases caused by
diffusion (Fig. 8.3b).
The measured trace elements show no correlation with CL zoning. This is in contrast to
rhyolitic phenocrysts where Ti is mainly responsible for the contrasting of the magmatic
zoning (Müller et al., 1999). The dominance of red luminescence centered at 1.96 eV

154
associated with a steep increase during electron radiation indicates high content of Si-OH
bonds and molecular water in the quartz lattice (Kalceff and Phillips, 1995).
Fig. 8.3 Trace element profiles of snowball quartz of the Schellerhau SG3 granite (a) and the Podlesi dyke
granite (b) using electron microprobe.
Schellerhau G3 granite
10
100
1000
10000
0 200 400 600 800 1000
distance (µm)
AlTiKFe
Na
core rim
a
Podlesi Dyke granite
10
100
1000
10000
0 100 200 300 400 500
distance (µm)
b
core rim
ab incl. kfs incl.
kfs incl.
contact to albite

155
8.6 Conclusions
The habit and zoning pattern, the arrangement of the enclosed and neighbouring albites and
the occurrence of melt inclusions indicate a growth of the snowball quartz in a nearly non-
convecting crystal mush. On the other hand, the trigonal habit of the zoning indicates
crystallisation temperature of <600°C (at <1kbar). The zoning and CL properties of the
snowball quartz show magmatic as well as hydrothermal features.
According to Holten et al. (1997) the observed zoning texture of the snowball quartz mostly
reflects an external fluctuation in open systems and is not a product of self-organising growth.
The irregular zoning is explained due to periodic degassing during melt cooling in the granite
roof (Plimer, 1987).
Due to the highly reactive fluids exsolved in late magmatic stages from the melt, obviously
the quartz and feldspar phenocrysts of the early crystallisation stages were cannibalised and
mainly resolved.
Consequently, snowball quartz is a textural indicator for fluid-saturated, F-Li-enriched melts
of alkali feldspar granites with subvolcanic (shallow) emplacement (Pitfield et al., 1990).
Furthermore, it serves as indirect indicator for tin-tungsten mineralisation related to such
melts.

156
9 Cathodoluminescence (CL) of magmatic quartz:
Applications to topaz granites from the Hub Stock
(Slavkovský Les Mts., Czech Republic)
(this chapter has been submitted to Terra Nova, co-author: M. René and H.-J.
Behr)
9.1 Abstract
Topaz-bearing granites from the Hub Stock, hosting the Sn-W deposit Krásno (Slavkovský
Les Mountains, Czech Republic), form a stock structure in the SW part of the Krušné
Hory/Erzgebirge Batholith. CL facilitates the discrimination of three magmatic quartz
generations within these granites, which has given new insights into the textural evolution of
felsic igneous rocks. Two phenocryst generations exhibit complex growth zoning with
dominant blue CL, similar to those generally found in phenocrysts from rhyolites. They
represent a water-poor (<2.5wt% H2O) “rhyolitic” crystallisation environment in the lower
and middle crust. Variation of Ti is mainly responsible for the contrasting magmatic zoning
pattern in quartz phenocrysts. Furthermore, the Al/Ti ratio measured by EPMA can be used to
distinguish quartz phenocrysts from different magma sources. Unzoned matrix quartz
crystallised during and after subvolcanic melt emplacement and overgrew the older
phenocryst generations. From the high Al content and the dominance of the unstable red 1.96
eV CL emission, which is associated with hydroxyl defects and adsorbed H2O in the lattice, it
is suggested that the matrix quartz grew in a residual “granitic” melt with higher water
content.
9.2 Introduction
Electron-excited luminescence, or cathodoluminescence (CL), is a sensitive method for
revealing growth zoning, alteration patterns, grain shapes and different generations of quartz,
which are not distinguishable in transmitted or polarised light (e.g. D’Lemos et al., 1997;
Watt et al., 1997; Müller et al., 2000). CL colour and intensity in quartz are generally

157
controlled by activator and sensitise elements (extrinsic lattice defects) like Al, Ti, Fe, Mn,
Ge, Li, Na, and H and intrinsic defects (e.g. oxygen and silicon vacancies) (e.g. Sprunt, 1981;
Waychunas, 1988; Perny et al., 1992; D’Lemos et al., 1997; Pagel et al., 2000). Al3+, Ti4+,
Fe3+, and Ge4+ substitute for Si4+ and the cations H+, Li+, Na+, Fe2+, and Mn2+ function as
compensators of the electric charge at interstitial positions (e.g. Bambauer, 1961; Lehmann,
1975; Lehmann and Bambauer, 1973; Maschmeyer and Lehmann, 1983; Weil, 1984). Earlier
studies showed a large variation in the trace element content within quartz crystals as well as
of quartz crystals from different environments (e.g. Stuttner and Leininger, 1972; Schrön et
al., 1988; Blankenburg et al., 1994; Müller, 2000). Spatial variations of CL properties reflect
structural and chemical variations within crystals, which are related to crystal growth zones.
These variations are caused by fluctuations in growth and diffusion rates in the melt through
the crystal-melt boundary layer. Growth and diffusion rate are controlled either by self-
organising intrinsic mechanism or an extrinsic mechanism involving physical or chemical
changes within the bulk system, such as crystal settling, large-scale convection, magma
mixing, ascent velocity and related temperature and pressure changes (e.g. Sibley et al., 1976;
Shore and Fowler, 1996), but the problem is to relate the different patterns of zoning to
specific genetic processes.
Despite considerable benefits of the phenomenological investigation of the CL of quartz, the
relationship between CL properties, trace elements, and petrogenesis is far from being solved.
This study is focused on magmatic quartz from the topaz-bearing granites of the Hub Stock
hosting the Krásno Sn-W deposit (Slavkovský Les Mountains, Czech Republic). The aim of
this study is to explain the causes of the CL of magmatic quartz and to determine the
petrological significance of trace element distribution, quartz CL, and of textures visible in
CL. Combination and comparison of the CL studies with micro-analytical results (EPMA) has
been given new insights into the origin, emplacement, crystallisation, and textural evolution
of fractionated Li-F-enriched melts and provide an information link between simplified
systems of theory and experiment, and the complexities of natural processes.

158
9.3 Geological setting
The Krušné Hory/Erzgebirge batholith that extends over an area of about 6000 km2, belongs
to the largest Variscan granite bodies in the Bohemian Massif (Fig. 9.1). Topaz-albite granites
that usually form granite stocks are traditionally related to the younger intrusive complex
(YIC) of the Krušné Hory/Erzgebirge batholith (Lange et al., 1972; Fiala 1968). However, the
topaz-albite granites of the Hub Stock form part of a complicated stock structure of topaz-
albite granites, which are associated with the upper part of the Krásno Sn-W ore deposit
(Jarchovský et al., 1994; René, 1998). Topaz-albite granites in this part of the Slavkovský les
Mts. are part of the Krudum massif that forms a relatively independent magmatic body on the
SW margin of the Karlovy Vary pluton. The emplacement of the granite stock was associated
with intensive tectonic deformation of slightly migmatized biotite paragneisses in the
overlying pre-Variscan basement. Intrusion breccias described in detail by Jarchovský and
Pavlu (1991) and Seltmann et al. (1992) occur in the upper part of the Hub stock and are
cemented by topaz-albite microgranites.
Topaz-albite granites of the Hub stock are mostly medium-grained varieties locally
accompanied by fine-grained porphyritic topaz-albite granites with characteristic quartz and
K-feldspar phenocrysts. The temporal relationship between the medium-grained and fine-
grained porphyritic granites cannot be interpreted unambiguously. The contact of both
varieties has a tectonic character in some cases and an intrusive character in the other, either
gradually passing from one variety to another or linked with the origin of a small coarse-
grained zone on the contact of both varieties. The two textural varieties may represent
different granitic facies of approximately the same age, the origin of which was controlled by
local pressure conditions during emplacement and crystallization (René, 1998)

159
Fig. 9.1 Geological setting of the Hub stock. (a), (b) Geological map of the Krušné Hory/Erzgebirge with the
distribution of granite types and the position the Hub stock. (c) Simplified cross-section through the Hub stock
according to Jarchovský (1998).

160
9.4 Petrography
The porphyritic topaz-albite granitic rocks (sample Ju-10) have a fine-grained equigranular
groundmass (50 - 100 µm) of anhedral quartz, albite (An03-05), K-feldspar, Li-mica, topaz,
muscovite, and accessory minerals (fluorite, cassiterite, apatite, zircon, hematite, sulphides).
The megacryst population is dominated by bipyramidal quartz (1.5 - 3 mm), platy Li-mica,
and sparse K-feldspar up to two centimetres in size.
Topaz-albite microgranites (sample Ju-20) found in the upper part of the Hub stock, that form
the matrix of the intrusion breccias, are aplitic (grain size: 200-500 µm) and rarely
porphyritic. The microgranitic rocks include K-feldspars several millimetres in size as well as
bipyramidal quartz (1.5 - 3 mm). The groundmass of the microgranitic rocks is composed of
anhedral quartz, albite, Li-mica, K-feldspar, and primary topaz.
The application of CL facilitates the identification of a third magmatic quartz population
beside the large phenocrysts (qz1) and the matrix quartz (qz3) in both granite varieties (Fig.
9.2a, b). Like the large phenocrysts, this population is 300 – 700 µm in size and exhibits a
dipyramidal ß-quartz habit and growth zoning. Each phenocryst population forms a maximum
in the grain size distribution plot: qz1 at 2 mm and qz2 at 0.4 mm. In the following we call
this population microphenocryst (qz2). Both the phenocrysts and microphenocrysts are
overgrown by younger matrix quartz.
9.5 Methodology
CL investigations were carried out using a hot-cathodoluminescence-microscope (Neuser et
al., 1995) with 14keV energy and filament current of 0.18 µA. CL spectra were recorded with
a triple-grating (100, 1200, and 1800 lines/mm) spectrograph TRIAX 320 provided with a
liquid N2-cooled Charge Coupled Device (CCD) camera. The system is well suited to
applications with very low signals such as the CL of quartz. The 100-lines/mm grating was
used to detect the emitted spectra between 400 and 950 nm (3.1 and 1.4 eV), whereas the
1200 lines/mm grating provided high-resolution spectra of 70 nm width sectors. The latter
allowed the determination of the exact position of the single CL emission bands. For the
quantification of the CL spectra were resolved by best fitting with Gaussian curves.
The application of a microprobe (EPMA) equipped with a CL detector (SEM-CL) facilitates
the analysis of trace element distribution in relation to the CL textures. Trace element
abundances of Al, Ti, K and Fe in quartz were determined using a JEOL JXA 8900 electron

161
microprobe fitted with a wavelength dispersive detector and with a CL detector (CLD40
R712). Raw analysis were converted into concentrations, after making appropriate matrix
corrections using the phi-rho-z method of Armstrong (1991). The main advantages of the
EPMA are the high spatial resolution of ~5 µm and the capability of combining
microanalytical analysis with CL and BSE imaging on the same area. The CL detector
provided monochromatic (grey scale) images of the growth zones and alteration patterns
within individual quartz crystals. Trace element measurements were carried out as line scans
yielding distribution profiles. CL imaging was performed prior to and after EPMA analysis. In
this way the measurement points in relation to the CL textures can be exactly located. The
grey scale profiles along measured trace element profiles within quartz crystals are processed
from the SEM-CL images using the software Optimas 6.0. Dark contrasted areas of quartz
SEM-CL images correspond to red to reddish brown CL-colours and bright areas correspond
to blue to violet colours. Quartz contains trace elements of very low concentrations so that
quantification by EPMA poses a major difficulty. For high precision and sensitivity, a high
beam current of 120 nA, beam diameter of 7 µm, and a counting rate of 10 min per analysis
(i.e. 180 s per element) were chosen. Detection limits were calculated for each trace element
profile with a confidence level of 95% on the basis of the standard deviation obtained from 12
background measurements (Plesch, 1982). Detection limits are 56 ppm for Al, 9-16 ppm for
Ti, 8 ppm for K, and 11-18 ppm for Fe.
There are several reasons why the concentrations of Al, Ti, K and Fe were determined. Al3+
and Ti4+ are the most frequent trace elements in quartz, which substitute for Si4+ (e.g.
Bambauer, 1961; Dennen, 1965; Weil, 1984; Blankenburg et al., 1994) and may have a strong
influence of the CL of quartz (e.g. Ramseyer and Mullis, 1990; Perny et al., 1992; Müller et
al., 2000). K+ was chosen as representative of the interstitial ions, because the detection limit
of Na (~80 ppm) was higher than the concentration and the ultra-light element Li cannot be
measured by EPMA. Fe and Mn are important CL activators and quenchers in silicates and
enter interstitial (Fe2+ and Mn2+) and substitutional (Fe3+ and Mn3+) positions (Marshall,
1988). However, the concentration of Mn was far below the detection limit (~ 12 pm).

162
9.6 Quartz CL colours and growth patterns
The application of CL facilitates the identification of three magmatic quartz generations in the
two granite varieties: euhedral zoned phenocrysts (qz1), euhedral zoned microphenocrysts
(qz2), and anhedral unzoned matrix quartz (Fig. 9.2a and b). The growth zoning in the
phenocrysts (qz1 and qz2) is contrasted by different shades of blue, violet, and red-brown CL
and include stepped (compositional) and oscillatory zoning with ß-quartz habit, resorption
surfaces, and growth impediments (Kozlowski, 1981; Schneider, 1993; Müller et al., 2000;
Fig. 9.2c, d and e). Characteristic is the presence of fine-scale oscillatory zoning (2 - 20 µm
width) within super-ordinate stepped zoning (50 - 1000 µm width). The analysis of the growth
zoning shows, that the nucleation and growth of the microphenocrysts (qz2) begins with the
growth of the outer step zone of qz1 (Fig. 9.2a, b).
The existence of euhedral quartz phenocrysts in granites showing CL-contrasted growth
zoning is currently not known to be common and was described in only a few cases
(Seltmann, 1994; D’Lemos et al., 1997; Müller et al., 2000). Furthermore, the growth zoning
of these granitic phenocrysts is similar to growth zoning of phenocrysts observed in Permian-
Carboniferous rhyolites of the Erzgebirge (Fig. 9.2f). In contrast the matrix quartz (qz3)
overgrowing qz1 and qz2 is free of growth zoning and exhibits a red-brown CL.
Quartz formed during post-magmatic or late-magmatic alteration is easily distinguishable
from the above-described magmatic quartz. Based on postsolidus recrystallisation textures
(fluid saturation textures, grain blasteses, cannibalising; e.g. Müller and Seltmann, 1999), and
dark red-brown luminescence, those metasomatic quartz textures formed by hydrothermal
processes could be excluded from this study.
9.7 Quartz CL spectroscopy and trace element distribution
The spectral response of the CL of quartz in the range of visible light is characterised by 9
emission bands between 1.7 – 2.2 eV (red) and 2.4 – 3.1 eV (blue) (Fig. 9.3, Table 9.1). The
intensity of the emission bands changes with the exposure time of electron radiation, whereby
the blue emission decreases and the red emission increases, indicating the decay and creation
of luminescence centres,

163
Fig. 9.2 SEM-CL images of quartz phenocrysts from the Hub stock topaz-bearing granites (Slavkovský Les
Mts.). (a) Zoned quartz phenocryst (qz1, Ju-20). The line A-B shows the position of the trace element profile in
figure 9.4a, c, and e. (b) Scheme of the three quartz generations, which are distinguishable in the SEM-CL image
(a): zoned phenocryst (qz1), zoned microphenocrysts (qz2), and the matrix quartz (qz3) developed as ongrowths
on qz1 and qz2. The nucleation and growth of qz2 begins with the growth of the outer step zone of qz1. (c)
Zoned quartz phenocryst (qz1, Ju-20). The stepped zones (1) are truncated by resorption surfaces (arrowed) and
overlain by the sub-ordinate oscillatory zoning. Three large scale resorption events are recorded in the zoning
pattern. (d) Grey scale profile through the quartz phenocryst in figure 3c. High grey scale corresponds to blue CL
and low grey scale to red-brown CL. Within a stepped zone the grey scale (blue CL) tendentiously decreases in
the growth direction. The grey scale correlates with the Ti distribution (see Fig. 9.5a). (e) Quartz phenocryst
showing growth impediments. The zoning fits the shape of the impediment caused by immiscible melt, vapour
phases or minerals which stick onto the crystal surface during growth. During further growth the impediment
becomes enclosed. (f) Zoned quartz phenocryst from the Wachtelberg Rhyolite (Eastern Erzgebirge). The zoning
pattern of rhyolitic phenocrysts is similar to the zoning occurring in the phenocrysts of the Hub stock granites.

164
Fig. 9.3 CL spectra of (a) violet luminescent phenocryst quartz of sample Ju-10, (b) violet luminescent
phenocryst quartz of sample Ju-20, and (c) red-brown luminescent matrix quartz (Ju 10). The spectra were
recorded after 30 s, 2 min, and 7 min electron radiation. The 7-min-spectra are fitted with Gaussian curves. Each
Gaussian curve represents a single emission band.

165
Table 9.1 CL emission bands between 1.4 and 3.1 eV observed in the magmatic quartz of the topaz-bearing
granites from the Hub stock and their identification (NBOHC - non-bridging oxygen hole centre; STE - self-
trapped exciton)
CL band
position
(eV)
Half width
(eV)
Identification Reference
1.73±0.02 0.3±0.02 substitutional Fe3+ Pott and McNicol (1971)
1.84±0.01 0.22±0.01 Associated with NBOHC with Si--O and
peroxy linkage precursor or ≡Si: centre
Stevens Kalceff and Phillips (1995)
1.96±0.02 0.22±0.02 Associated NBOHC with −OH precursor Stevens Kalceff and Phillips (1995)
2.15±0.02 0.38±0.01 STE associated with Ge Luff and Townsend (1990)
2.47±0.02 0.3±0.03 Impurity Itoh et al. (1988)
2.58±0.01 0.18±0.005 Associated with Al3+-defect structures
STE
Nassau and Prescott (1975)
Remond et al. (1992)
2.68±0.01 0.23±0.01 STE
Associated with Ti-defect structures
Stevens Kalceff and Phillips (1995)
Marfunin (1979)
2.79±0.01 0.26±0.01 Oxygen related centre Hagni (1987)
2.96±0.02 0.3±0.02 Associated with Ti-defect structures This study
respectively. The CL colours are more unstable in the matrix quartz than in the phenocrysts.
The CL signal obtained from phenocrysts within both granitic varieties is similar, whereas the
CL spectra of the matrix quartz show a dominance of the red emission (Fig. 9.3).
The comparison of CL emission band and trace elements revealed the following:
• Growth zones with blue CL show high Ti concentrations up to 70 ppm (Fig. 9.4a and b).
We found that the blue CL emission at 2.96 eV is associated with Ti (Fig. 9.5a). From this
observation we conclude, that variations in Ti are mainly responsible for the magmatic
zoning pattern within these quartz phenocrysts. The 2.96 eV band is beside the 2.47, 2.58,
2.68, and 2.79 eV one of five bands of the blue emission range. Generally, crystallisation

166
temperatures >500°C are necessary for the substitution of Si4+ through Ti4+ caused by the
high field strength of Ti4+ (F = 1.04; Blankenburg et al., 1994). However, it is generally
not clear whether Ti is a CL activator or sensitizer (Marshall 1988, Götze 2000).
• Phenocryst quartz (qz1 and 2) shows an Al content between 170 and 270 ppm, whereas
matrix quartz (qz3) has higher concentrations between 250 and 370 ppm (Fig. 9.4c and d).
Al concentrations >400 ppm correlate with K concentrations >30 ppm indicating the
contamination of the analysis by feldspar microinclusions. Al generally behaves in an
opposite way to Ti with abundances being low in the blue and higher in the red-brown
luminescent quartz especially in the matrix quartz (qz3; Fig. 9.5b). In contrast Ramseyer
and Mullis (1990) and Perny et al. (1992) assume that the high Al and Li concentrations
are the cause of the blue CL of hydrothermal quartz. According to Siegel and Marrone
(1981), Griscom (1985), and Stevens Kalceff and Phillips (1995) the red CL emission
around 1.96 eV is related to OH- and/or adsorbed H2O. The increase of the emission
during electron radiation is explained by radiolysis of hydroxyl groups and/or adsorbed
H2O of the quartz lattice, which leads to the formation of non-bridging oxygen hole
centres (NBOHC). Hydroxyl groups and adsorbed H2O acting as charge compensator of
Al3+ forming [2SiO 3-H2O-M+2AlO4] defects, where M+ is a combination of Li, K, and Na
ions (Bambauer et al., 1963; Maschmeyer and Lehmann, 1983; Kronenberg et al., 1986;
Stenina, 1995). This association of Al and hydroxyl groups and/or adsorbed H2O may
explain the weak correlation of Al with the red emission.
• The Fe content varies predominantly between 10 and 30 ppm (Fig. 9.4e and f). It was
observed that Fe increases towards the grain boundary up to 260 ppm indicating a high
diffusion rate of Fe in the quartz lattice. This grain rim shows no change in CL properties.
Pott and McNicol (1971) and Kempe et al. (1999) found that high Fe3+ causes the 1.73 eV
CL emission. However, in our samples we found no correlation between the Fe
concentration and the 1.73 eV band intensity. The lack of correlation may be explained by
the fact that Fe occurs as divalent and trivalent ions.
• Weak to non-luminescent, post-magmatic (secondary) quartz is depleted in Ti, Al, Fe and
K (Fig. 9.5a and b).

167
Fig. 9.4 Trace element profiles of quartz of the topaz granites from the Hub stock. Lower Ti and higher Al are
characteristic for the matrix quartz. High Al (>400 ppm) correlates with K indicating analysed micro-inclusions
of feldspar. The steep increase of Fe near the grain boundary to plagioclase demonstrates the high diffusion rate
of Fe in the quartz lattice. Secondary (post-magmatic) quartz between 100 and 130 µm in (b), (d), and (f) is
depleted in Ti, Al, Fe and K. The arrows at the axis of ordinates mark the detection limits (dl).
9.8 Discussion
Topaz-bearing granites of the Hub stock hosting the Krásno Sn-W ore deposit contain three
generations of magmatic quartz represented by phenocrysts (qz1), microphenocrysts (qz2),
and matrix quartz (qz3) indicating multiple crystallisation and contrasting crystallisation
environments.

168
Fig. 9.5 (a) Correlation of Ti and CL signal plotted as grey scale within a zoned quartz phenocryst (qu1, Ju-10).
The grey scale reflects the intensity ratio of red (1.7 – 2.2 eV) versus blue emission (2.4 – 3.1 eV). The higher
the blue emission intensity the greater the amount of the grey scale. Quartz with high Ti shows violet to blue CL.
(b) Al concentration of phenocryst quartz (1), matrix quartz (2), and secondary (post-magmatic) quartz (3). The
matrix quartz (2) has high Al in contrast to the secondary quartz (3). (c) Comparison of the Ti-Al ratio of quartz
phenocrysts from the Hub stock topaz-bearing granites and of Schellerhau tin granites (Eastern Erzgebirge). The
phenocrysts of the different topaz-bearing granite varieties of the Hub stock show a similar trace element
signature indicating a common magma source, whereas the phenocryst quartz of the Schellerhau tin granites has
a lower Al concentration.

169
To understand the Ti variation of growth zones in the phenocrysts (qz1 and qz2) it is
necessary to distinguish between zoning caused by self-organised growth and zoning caused
by physico-chemical changes of external factors such as temperature, pressure and magma
composition (e.g. Allegre et al., 1981; Anderson, 1984; Fowler, 1990; Shore and Fowler,
1996). The fine-scale oscillatory zoning observed arises from self-organised growth without
the intervention of externally imposed periodicities in the state (pressure, temperature, or
composition) of the melt from which the crystal grew (e.g. Sibley et al., 1976; Allegre et al.,
1981; Ortoleva, 1990; Shore and Fowler, 1996). Self-organisation of the growth is controlled
by cyclic competition of the crystal growth rate and the diffusion rate of silica and elements
such as Ti within the crystal-melt reaction zone and boundary layer. In contrast, stepped
zoning and resorption surfaces are zoning patterns typically caused by external factors (e.g.
Allegre et al., 1981; Müller et al., 2000). The stepped zones are often truncated by resorption
surfaces, which results in rounding of the crystals (Fig. 9.2c). Resorption (melting) of crystal
surfaces indicates local SiO 2-undersaturation of the melt, which may be caused by an increase
in temperature, isothermal decompression, or magma mixing. The continuous fractionation
trend of the granite varieties of the Hub Stock and Krásno area (e.g. Jarchovský and Pavlu,
1991) gives no indications for magma mixing which may cause the multiple resorption
events. Furthermore, the crystal settling effects in a magma chamber are small for viscous
silicate melts (e.g. Dowty, 1989) and do not result in large-scale resorption of crystals.
Therefore, we favour isothermal decompression during adiabatic melt ascent as the cause of
large-scale resorption. Adiabatic conditions are only possible by rapid magma ascent in
dykes. Resorption drastically lowers the amount of suspended solids in the melt. The flow rate
is elevated by reduction of the effective viscosity. This process may be initiated by brittle
deformation during extension or shear in the upper crust. The occurrence of resorption
surfaces is in accordance with the rapid ascent of granitic melts by dyke formation as found
by Clemens and Mawer (1992), Petford et al. (1993), Petford (1996) and Johannes and Holtz
(1996). After a resorption event (melt ascent), the subsequent growth of a new stepped zone
begins with high Ti (blue CL) indicating a change of the crystallisation conditions. The Ti
content decreases tendentiously across the stepped zones during further growth and is overlain
by a sub-ordinate oscillatory Ti variation. If the oscillatory Ti variation is controlled by the
rate of Ti diffusion in the melt (self-organised growth), then the tendentious decrease in Ti
within the stepped zone should have other causes. After a resorption event, here explained by
adiabatic melt ascent, Ti incorporation is likely to be high as a result of rapid growth rates
since the melt moved into cooler surroundings. We draw this conclusion from textural

170
observations. There may be some additional effects such as pressure and melt composition,
which favour incorporation of Ti into the quartz lattice.
The growth zoning and CL properties of the phenocrysts of the granites (qz1 and qz2) are
similar to those observed in phenocrysts of Permian-Carboniferous rhyolites of the German
Variscides (Schneider, 1993; Müller, 2000) and may indicate similar crystallisation
conditions. Thomas (1992) calculated the depth of quartz phenocryst crystallisation of tin
granites of the Krušné Hory/Erzgebirge of up to 21 km provided by microthermometric
studies of silicate melt inclusions. This is in accordance with the crystallisation depth of
quartz phenocrysts of the Permian-Carboniferous rhyolites of the Erzgebirge, which was
estimated at about 25 km (Thomas, 1992). Our observations and the calculations of the
crystallisation depth by Thomas (1992) show that zoned quartz phenocrysts in granites with
dominant blue CL represent a water-poor (<2.5wt% H2O) “rhyolitic” crystallisation
environment in the lower and middle crust. Such phenocrysts contained in granites exhibit
early stages of magma evolution and show features similar to rhyolite magmas, thus may
represent the capability of erupting magmas. The matrix quartz (qz3) is interpreted as the
product of the last magmatic crystallisation stage during and after the subvolcanic melt
emplacement taking place at ca. 1.5 km (Thomas, 1994). Derivable from the high Al
incorporated in [2SiO 3H2OM+2AlO4] defects (M+ = Li+, Na+, K+) and from the dominance of
the unstable red 1.96 eV CL emission, which is associated with hydroxyl defects and
adsorbed H2O in the lattice the matrix quartz grew in a residual “granitic” melt with higher
water content.
Quartz phenocrysts in both topaz-bearing granites of the Hub stock exhibit a similar Al/Ti
ratio (Fig. 9.5c). However, this differs from quartz phenocrysts of other topaz-bearing granites
of the Krušné Hory/Erzgebirge like the Schellerhau granite (Müller et al., 2000). Similar
observations have been made by Stuttner and Leininger (1972) who showed that Ti content is
different for quartz derived from different batholiths. Thus, quartz phenocrysts formed from
different magma sources have various Al/Ti ratios. We conclude that the two quartz
phenocryst generations of the topaz-bearing granite varieties of the Hub stock represent the
same crystallisation history and are derived from one-magma chamber. However, the rock
textures, quartz generations, and growth patterns observed in CL are very similar for a
number of topaz-bearing granites of the Krušné Hory/Erzgebirge (Müller et al., 2000; Müller,
2000). These similarities suggest that the quartz textures in the granite and the phenocryst
growth patterns found in the Krušne Hory/Erzgebirge province are typical for Li-F-enriched
melts, which are related to Sn-W-mineralizations.

171
10 Crystallisation, emplacement and deformation of S- and I-type granites in the Eastern Lachlan Fold Belt (SE Australia)indicated by quartz texture, cathodoluminescence, and Al-in-
hornblende barometry
(this chapter has been submitted to Mineralogy and Petrology, co-authors: P.Lennox and R. Trzebski)
10.1 Abstract
The I-type Carcoar and Barry Granodiorites and the S-type Sunset Hills Granite were intruded
in the Late Ordovician-Early Silurian into Early Ordovician greywacke and volcaniclastic pile
at different levels and subsequently repeatedly deformed in the Lachlan Fold Belt, SE
Australia. Whereas the Carcoar Granodiorite has one generation of anhedral quartz, the Barry
Granodiorite consists of unzoned subhedral quartz phenocrysts and anhedral matrix quartz,
which crystallised at or near the emplacement level. Both granodiorites are considered to have
been derived from the same magma source and have experienced a continuous and rapid
ascent to depths of 4 to 6 km as determined by Al-in-hornblende barometry. The Sunset Hills
Granite has three generations of quartz, and is geochemically related and spatially linked to
the adjacent Wyangala Batholith. It was intruded at depths of 10-12 km. The magma of the
Sunset Hills Granite ascended in a stepwise fashion, causing multiple quartz nucleation,
episodes of slow crystal growth, and resorption events. The Carcoar and Barry granodiorites
both show syn- and post-magmatic foliations, whereas the Sunset Hills Granite only has a
post-magmatic foliation. The post-magmatic, solid-state foliations were produced during
regional transpression and transtension during two subsequent deformation events. The earlier
deformation is related to the Early Devonian Bowning event which caused east-west
compression accompanied by regional transpression and transtension and vertical uplift and
contraction in the Eastern Lachlan Fold Belt. During the Bowning event, the granodiorites
were deformed under brittle conditions at temperatures of 250 to 400°C; whereas the Sunset
Hills Granite experienced ductile deformation at temperatures of around 550°C. The second
deformation recorded in the quartz is the late Middle Devonian Tabberabberan event, which is
not apparent in the granodiorites, whereas the Sunset Hills Granite was further deformed,
uplifted and experienced transpression during this event. The multiple deformation of quartz

172
result in redistribution of Ti, Al and structurally bound water in the quartz lattice and the
formation of muscovite (<0.5 µm) along slip planes in quartz.
10.2 Introduction
Structural analysis of granites with a polyphase deformation history often faces the difficulty
of discriminating between generations of magmatic and deformation fabrics. In this paper, we
present an method that combines microstructural, petrological and geochemical data to
reconstruct the conditions of magma crystallisation, emplacement and deformation.
In recent years, cathodoluminescence (CL) of quartz has been increasingly applied to describe
the processes of magma genesis, transport and deformation (Behr, 1989; Watt et al., 1997;
Müller et al., 2000). In this study, CL was applied to characterise the conditions of magma
crystallisation, emplacement and deformation of the Carcoar and Barry granodiorites and the
Sunset Hills Granite in the Eastern Lachlan Fold Belt (SE Australia). Special emphasis was
placed on the macro- and microtexture, trace element distribution in quartz, Al-in-hornblende
barometry, and whole-rock geochemistry. We show how the CL behaviour of quartz and its
textures at the microscale reflect the conditions and sequences of magma crystallisation and
deformation. This is a complimentary study to previous structural and gravity modelling,
which revealed the pluton shape at depth and the tectonic setting during emplacement of these
granites (Trzebski et al., 1999).
10.3 Geological Setting
The northern part of the eastern Lachlan Fold Belt evolved in an island-arc setting during the
lower Palaeozoic (Powell, 1984; Coney, 1992; Collins and Vernon, 1992; Gray et al., 1997).
The Molong-Wyangala-Jerangle-Kuark Zone (abbreviated as Molong-Wyangala Zone) within
the northern Lachlan Fold Belt may represent a fragment of a former Ordovician island arc
and lies adjacent to the Hill End-Barradine Zone (abbreviated as Hill End Zone) a Mid-
Silurian turbidite-filled trough (Glen et al., 1998; Scheibner, 1998).
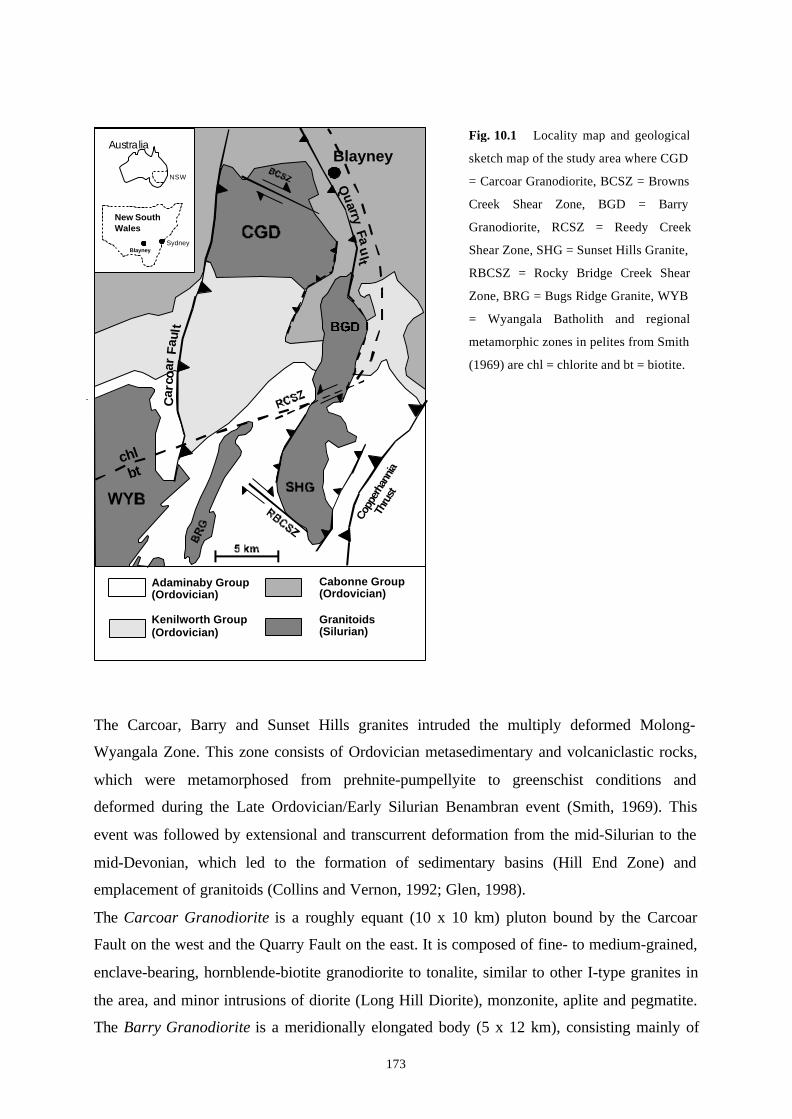
173
The Carcoar, Barry and Sunset Hills granites intruded the multiply deformed Molong-
Wyangala Zone. This zone consists of Ordovician metasedimentary and volcaniclastic rocks,
which were metamorphosed from prehnite-pumpellyite to greenschist conditions and
deformed during the Late Ordovician/Early Silurian Benambran event (Smith, 1969). This
event was followed by extensional and transcurrent deformation from the mid-Silurian to the
mid-Devonian, which led to the formation of sedimentary basins (Hill End Zone) and
emplacement of granitoids (Collins and Vernon, 1992; Glen, 1998).
The Carcoar Granodiorite is a roughly equant (10 x 10 km) pluton bound by the Carcoar
Fault on the west and the Quarry Fault on the east. It is composed of fine- to medium-grained,
enclave-bearing, hornblende-biotite granodiorite to tonalite, similar to other I-type granites in
the area, and minor intrusions of diorite (Long Hill Diorite), monzonite, aplite and pegmatite.
The Barry Granodiorite is a meridionally elongated body (5 x 12 km), consisting mainly of
Fig. 10.1 Locality map and geological
sketch map of the study area where CGD
= Carcoar Granodiorite, BCSZ = Browns
Creek Shear Zone, BGD = Barry
Granodiorite, RCSZ = Reedy Creek
Shear Zone, SHG = Sunset Hills Granite,
RBCSZ = Rocky Bridge Creek Shear
Zone, BRG = Bugs Ridge Granite, WYB
= Wyangala Batholith and regional
metamorphic zones in pelites from Smith
(1969) are chl = chlorite and bt = biotite.
btchl
Qu
a rry Fau
lt
NSW
New SouthWales
BlayneySydney
Adaminaby Group(Ordovician)
Kenilworth Group(Ordovician)
Cabonne Group(Ordovician)
Granitoids(Silurian)
Copp
erha
nnia
T
hrus
t
BlayneyC
a rco
ar F
a ul t
Australia

174
hornblende and biotite granodiorite of tonalitic composition with minor microtonalite
enclaves (Lennox et al., 1998). The Sunset Hills Granite crops out as a north-south elongated
body (6 x 13 km) bound in part by a possible extension of the Quarry Fault in the west and the
Copperhannia Thrust in the east (Fig. 10.1). It is mainly composed of a biotite granite
intruded in places by aplite and muscovite-leucogranite dykes. Metasedimentary xenoliths of
up to 5 m in length and 0.3-0.5 m in width represent stoped blocks of the host rocks
(Adaminaby Group) and show a foliation oblique to the foliation in the granite, indicating
deformation prior to granite emplacement (Lennox et al., 1998).
All three granites show poorly developed magmatic flow fabrics, and a poor to moderately
pervasive tectonic fabric. The main solid-state fabric (Sg) in all granites consists of aligned
biotite books, opaque grains, fractured feldspars, rarely aligned hornblende crystals and
elongated muscovite aggregates. Cross-cutting mylonite zones, S-C microstructures and shear
zones are better developed south of and adjacent to the Sunset Hills Granite. New zircon
SHRIMP and published Ar-Ar, Rb-Sr and K-Ar dating studies (Lennox et al., 1998) indicate
that the granites intruded about the same time, during the Early Silurian following the
Benambran event. All three granites were multiply deformed during the Early Devonian
Bowning, late Middle Devonian Tabberabberan and Early Carboniferous Kanimblan events
(Lennox et al., 1998; Trzebski et al., 1999).
10.4 Methods
The CL emission of quartz was analysed using a hot-cathodoluminescence-microscope
(Neuser et al., 1995) at an energy of 14 keV and a filament current of 0.18 mA. CL is
generated by the emission of photons of ultra violet (UV) to infrared (IR) wavelength from
activated electrons of the sample during electron bombardment. The spectral response of the
CL was recorded with the grating (100 lines/mm and 1200 lines/mm) spectrograph TRIAX
320 and a LN2-cooled CCD-detector, and corrected for the total instrument response. The
high-resolution spectrograph was used to determine the energy of individual emission bands,
which usually have a Gaussian shape if plotted in energy space. The position, width, and
height of the Gaussian curves were calculated and adjusted in such a way that the sum of the
individual components corresponds to the recorded CL spectra. The areas of the Gaussian
curves were used to determine the percentage of the individual emission bands of the total

175
spectra between 1.4 and 3.1 eV. The peak area portions were correlated with the recorded
trace elements.
The scanning electron microscope cathodoluminescence (SEM-CL) generates a high degree
of spatial resolution of CL textures, and enables visualisation of magmatic growth zoning and
deformation fabrics in quartz. A Geoscan 250-MK3, with a CL detector operating at an
energy of 15 keV and a filament current of 8-12 nA was used for black-and-white images of
the primary (growth) CL textures and secondary (post-magmatic) CL structures in quartz.
Typical primary CL textures in magmatic quartz, as revealed by variations in CL, include (1)
stepped zoning (50-1000 µm width) with subordinate oscillatory zoning (2-20 µm width), (2)
resorption surfaces, (3) growth impediments, and (4) skeletal growth (Müller et al., 2000).
Secondary CL structures, such as healed microcracks and recrystallised domains are also
clearly detectable with CL (Behr, 1989).
Additional information about the nature and evolution of the magma can be obtained by
analysing the grain size distribution of quartz and its framework. The application of the
lacquer peel method (Behr 1966; see Fig. 10.3) enables detailed analyses of the quartz
framework. Grain size analysis were carried out in thin sections and hand specimens. The
length and width of quartz grains (=1 mm) in thin sections. Quartz grains >1mm were
measured by micrometer on polished hand specimen (15 x 15 cm). The grain size of each
grain was calculated from the average of its length and width.
The high-resolution spectral analysis of CL was combined with Electron Probe Micro
Analysis (EPMA) to establish a correlation between the CL emission bands and Al, Ti, K, and
Fe, which may act as CL activators in quartz. The element concentrations in quartz and of Na,
Si, Ti, Ca, Fe, Mg, Al, Cr, K, and Mn in hornblende were determined using the JEOL JXA
8900 electron probe micro analyser (EPMA) operating at 15 kV. To minimize the excitation
volume during the measurements of the hornblende crystals the beam was set to 40 nA and to
a diameter of 5 µm. For high precision and sensitivity of the trace element determination in
quartz, the a beam current of 120 nA, a beam diameter of 7 µm, and a counting rate of 10 min
per shot means 180 s per element were chosen. Detection limits were calculated for each trace
element profile with a confidence level of 95% on the base of the standard deviation obtained
from 12 background measurements (Plesch, 1982). Detection limits are 32 ppm for Al, 20
ppm for Ti, 13 ppm for K, and 15 ppm for Fe.

176
10.5 Geochemistry
The three granites show similarities in their geochemical composition and can be subdivided
into two groups: the metaluminous I-type Carcoar and Barry granodiorites, with SiO 2 contents
of 63-67wt.%, and the meta- to peraluminous Sunset Hills Granite and Wyangala Batholith
with S-type affinity and with a SiO 2 content of 69-74wt.% (Fig. 10.2).
Fig. 10.2 Representative variation diagrams of whole rock samples of the Carcoar Granodiorite, Barry
Granodiorite, Sunset Hills Granite and Wyangala Batholith. a - The Carcoar and Barry granodiorites are
metaluminous I-type granites and the Sunset Hills Granite and Wyangala Batholith are meta- to peraluminous S-
type granites. b - The decrease of MgO, FeOT and CaO in the Barry Granodiorite with increasing SiO2 indicates
that melt differentiation occurred by fractionation (gravity settling) of hornblende. The Carcoar Granodiorite
represents a primitive melt. c - The differentiation trend by decreasing TiO2 is characterised by a gap which
clearly separates the two granite groups. d - The variation of Sr indicates fractionation of plagioclase in the Barry
Granodiorite, whereas the decrease of Ba concomitant with Sr shows that both K-feldspar and plagioclase were
removed during differentiation of the Sunset Hills Granite.

177
The TiO2, Al2O3, K2O and Na2O contents of the Barry Granodiorite are constant, whereas the
MgO, FeOT and CaO contents decrease with increasing SiO 2. The distribution of the major
elements, the constant Sr content and the minor variation of the Ba content indicate that
differentiation occurred by fractionation (gravity settling) of hornblende. The Barry
Granodiorite shows a progressive differentiation of major and trace elements from north to
south, which is shown by the decrease of hornblende and the increase of quartz to the south.
The geochemistry of the Carcoar Granodiorite shows similarities with the Barry Granodiorite,
except that the Barry Granodiorite shows a higher degree of fractionation, as indicated by the
depletion of hornblende.
In the Sunset Hills Granite, the MgO, FeOT , TiO2, Al2O3, and CaO contents decrease with
increasing SiO 2. The Na2O and K2O contents vary between 2.4-4.2wt.% and 0.6-4.7 wt.%,
respectively. The decrease of Ba concomitant with Sr shows that both K-feldspar and
plagioclase were removed during differentiation. In contrast to the Barry Granodiorite, the
distribution of the major and trace elements shows an east-west trend in the Sunset Hills
Granite. The highest fractionation was recorded at the western margin of the pluton.
10.6 Quartz texture and foliation development
Carcoar Granodiorite
The magmatic quartz of the Carcoar Granodiorite is represented by one anhedral generation,
which forms irregular grain aggregates between the subhedral to euhedral feldspar and the
hornblende grains (Fig. 10.3a). The grain size distribution of the weakly deformed samples
shows one main peak around 650 µm, which indicates one nucleation event during magmatic
crystallisation (Dowty, 1989) (Fig 10.4a).
The weak, post-magmatic deformation of the Carcoar Granodiorite is reflected in thin section
by undulatory extinction of quartz, and by new grains at grain boundaries as a result of
rotation recrystallisation (Fig. 10.3b). The degree of deformation in quartz generally increases
with the proximity to shear zones. Measurements of the orientation of the subgrain boundaries
of deformed quartz showed that the dominant feature are prismatic subgrain boundaries
parallel to the c-axis. During the dynamic recrystallisation, bulges at grain boundaries formed
where some new grains (~12 µm diameter) developed due to progressive rotation of subgrains
(Fig. 10.3b, 10.4a). Biotite formed ‘fish’ and hornblende crystals were rigidly rotated into a
post-magmatic foliation. Simple, open kink-bands associated with slip on the basal plane were

178
Fig. 10.3 The quartz framework of the Carcoar Granodiorite, Barry Granodiorite, and the Sunset Hills Granite.
a - The anhedral quartz of the fine-grained Carcoar Granodiorite filled the irregular cavities between the
subhedral to euhedral feldspar (white), biotite and hornblende crystals (grey) (contrasted lacquer peel). b -
Deformed quartz of the Carcoar Granodiorite contains elongated subgrains and small recrystallized grains at the
edges. c - The Barry Granodiorite contains subeuhedral quartz phenocrysts (arrows) overgrown by anhedral to
aplitic matrix quartz. d - Elongated phenocryst of the Barry Granodiorite with subparallel contrasted subgrains
cross-cut by trails of recrystallized quartz. e - The fine- to medium-grained, porphyritic magmatic texture of the
Sunset Hills Granite with two euhedral zoned phenocryst generations (first and second) which are embedded in
anhedral matrix quartz. f - Deformed phenocryst (first generation) of the Sunset Hills Granite entirely converted
to new grains with high-angle boundary during recovery of subgrains.
a
2 mm
2 mm
2 mm
250 µm
250 µm
250 µm
b
c d
e f
1
2

179
developed in biotite, whereas hornblende reacted by intragranular, brittle displacement along
the cleavage planes. The foliation within the shear zones is not parallel with the magmatic
foliation marked by aligned hornblende and biotite. Muscovite occurs as fringes within strain
shadows of feldspar.
Barry Granodiorite
The grain size distribution of quartz in the equigranular to weakly porphyritic Barry
Granodiorite shows two maxima (Fig. 10.4). It contains sub-euhedral quartz phenocrysts with
diameters between 800 and 900 µm (Fig. 10.3c, d), which are embedded in the anhedral
matrix quartz with an average diameter of ~300 µm (Fig. 10.4b). In the southern part of the
Barry Granodiorite, the isometric matrix quartz has an average diameter of about 100 µm,
whereas the size of the phenocrysts remains constant at 800 to 900 µm.
The deformed quartz of the Barry Granodiorite shows elongate subgrains marked by ribbons
and rims of polygonal, recrystallised quartz with high-angle grain boundaries formed by
rotation recrystallisation (Fig. 10.3d). Prismatic subgrain boundaries parallel to the C-axis are
dominant. The non-elongated recrystallised grains with an average grain size of 40 µm show
straight boundaries and 120° triple junctions (Fig. 10.4b). The recrystallised quartz ribbons
are similar to the Type 2 polycrystalline quartz ribbons after Boullier and Bouchez (1978).
The feldspars within the post-magmatic shear zones are often entirely sericitised. Plagioclase
is weakly recrystallised along microcracks. Likewise in the Carcoar Granodiorite, the
magmatic foliation is marked by aligned hornblende and biotite. The post-magmatic
deformation of biotite and hornblende caused slip along the cleavage planes, rigid body
rotation, boudinage, and recrystallisation at the crystal edges.
Sunset Hills Granite
The porphyritic Sunset Hills Granite contains two generations of euhedral quartz phenocrysts
embedded in anhedral matrix quartz (third generation) as shown in Fig. 10.4c. The quartz
phenocrysts and aggregates were almost entirely converted to new grains with high-angle
boundaries, due to rotation recrystallisation. The new grains with an average diameter of 100
µm are either microscopically strain-free or internally deformed (Fig. 10.4c). In deformed
quartz, basal subgrain boundaries normal to the c-axis occur in addition to the prismatic
subgrain boundaries, forming typically rectangular (“chessboard”) patterns. A number of the
larger grains of the quartz aggregates shows strongly curved, sutured grain boundaries formed
due to grain boundary migration recrystallisation. Recrystallised, polycrystalline quartz

180
Fig. 10.4 Grain size distribution of quartz. a – of the Carcoar Granodiorite, b – of the Barry Granodiorite, c – ofthe Sunset Hills Granite. The original grain size maximum of 3.5 mm (reconstructed) of the large, firstgeneration phenocrysts is reduced by deformation. This diagram shows that the maximum frequency of thematrix quartz is overlapped by the maximum frequency of grains modified by the post-magmatic rotationrecrystallisation.

181
Fig. 10.5 SEM-CL images of quartz. a – Quartz grain of the Carcoar Granodiorite with a bright core and darkgrey diffusion rim (dr) depleted in Ti and enriched in Fe. The high Fe concentration of the diffusion rim isderived from the neighbouring biotite (bt) (dashed line = position of the electron microprobe profile in Fig.10.8a). b - Zoned quartz phenocryst (pqz) of the Sunset Hills Granite with magmatic growth zoning which isweakened and partly destroyed during deformation. It is overgrown by dark contrasted, unzoned matrix quartz(mqz). The brighter the CL of the zone the higher is the Ti concentration (dashed line = position of the electronmicroprobe profile in Fig. 10.8c). c - Euhedral quartz phenocryst of the Barry Granodiorite (pqz) overgrown bydark red-brown luminescent, anhedral matrix quartz (mqz). The arrows mark the border between the twogenerations. d - The subgrains in the deformed quartz of the Barry Granodiorite are bordered by darkrecrystallized quartz depleted in trace elements. The development of stress-induced Si-OH bonds alongmicrosliding planes leads to this lamellate textures. Along the thin healed cracks at right angles to c are smallstar-like halos. e - Rotation recrystallization in the quartz of the Carcoar Granodiorite results in first stage star-like textures at the grain edges, as shown by the arrows. f - Advanced rotation crystallization in the quartz of theSunset Hills Granite. The volume of newly crystallized (secondary), non-luminescent quartz (black) grows withthe increase in the intensity of deformation.

182
ribbons (Type 2 and Type 4 ribbons after Boullier and Bouchez, 1978) cross-cut quartz
aggregates and cataclastic feldspar. Biotite is entirely recrystallised with its (001) planes
subparallel to the S-C fabrics. Feldspar is entirely sericitised in some samples and shows
pressure-solution phenomena, particularly at contacts with muscovite layers or where cross-
cut by muscovite layers. Indications of pre-existing magmatic foliation were not found.
10.7 Cathodoluminescence of quartz
Primary magmatic CL textures
Quartz phenocrysts of the Sunset Hills Granite (first and second generation) show weakly
contrasted, relict growth zones typical of rhyolitic phenocrysts (Laemmlein 1930; Schneider
1993; Watt et al. 1997). Growth pattern, formed by oscillatory zoning (2-20 µm width),
superordinate stepped zoning (50-1000 µm width) and resorption surfaces, is preserved in less
deformed phenocrysts. However, these growth zones were largely erased due to high-
temperature, post-magmatic deformation (Fig. 10.5b). On the other hand, experiments with
zoned, rhyolitic quartz phenocrysts also show that the contrast of the CL growth zones
weakens after several hours of heating at temperatures over 500°C. In contrast, the subhedral,
quartz phenocrysts of the Barry Granodiorite are non-rhyolitic, do not show growth zoning.
The red-brown luminescent quartz phenocrysts are overgrown in optical continuity by dark
red-brown luminescent, anhedral matrix quartz (Fig. 10.5c). In all three granites, the anhedral
matrix quartz shows no zoning.
Secondary CL structures
In all three granites, quartz shows fine, transgranular ruptures, which are healed by dark red-
brown, nearly non-luminescent quartz. Star-like halos around fluid inclusions are arranged
along these ruptures (Fig. 10.5d).
The deformed quartz of the Carcoar and Barry granodiorites exhibits lamellae, which are not
detectable using polarisation microscopy (Fig. 10.5d, e). In contrast, quartz of the Sunset Hills
Granite is free of lamellae as such lamellae (Fig. 10.5f). The subgrain boundaries are coated
by dark red-brown luminescent, newly crystallised quartz (Fig. 10.5d). Rotation
recrystallisation mainly produced star-like structures at grain edges (Fig. 10.5e). With
progressive rotation recrystallisation, the new rotated grains become more rounded, and the
volume of the newly crystallised quartz (secondary quartz; Fig. 10.5f) increases in the Barry

183
Granodiorite and Sunset Hills Granite. Transgranular, up to 200 µm wide diffusion rims along
thin, open micro-cracks indicate circulation of fluids along these cracks. These structures are
abundant in the Sunset Hills Granite and relatively rare in the Barry Granodiorite.
CL patterns and properties linked to trace elements in the quartz
The quartz of the Carcoar Granodiorite and Sunset Hills Granite luminescences blue to
violet/red-brown; whereas the quartz of the Barry Granodiorite luminescences red-brown to
dark red-brown. The emission spectra of quartz between 1.4 and 3.1 eV are composed of two
broad emission ranges; blue (2.6-3.1 eV) and red (1.75-2.1 eV) resulting in blue, violet, and
red-brown CL colours (Fig. 10.6). The blue range consists of five emission bands at 2.47,
2.58, 2.68, 2.79, 2.96 eV (Fig. 10.7), and the red range consists of four bands at 1.73, 1.84,
1.96, and 2.15 eV. The blue emission range is generally characterised by a decrease of the
intensity during electron radiation, and is caused by the destruction of luminescent defects
through electron radiation and partly through sample warming (Ramseyer et al. 1988;
Ramseyer and Mullis 1990). Cathodoluminescence resulting from defect centres is partly due
to the effect of interstitially or substitutionally incorporated trace elements. Electron
microprobe profiling of quartz grains was used to determine the relationship between the CL
properties and the distribution of trace elements. The profiles and the Ti, Al, K and Fe
concentrations are shown in Fig. 10.8.
The Ti concentration of quartz correlates with the intensity of the blue 2.97 eV emission band.
The quartz of the Carcoar Granodiorite with the highest average Ti content (~85 ppm) shows
the highest intensity of the 2.96 eV emission. The intensity of this band and the Ti content
decrease from the Sunset Hills Granite (~75 ppm), to the Barry Granodiorite (~45 ppm) to the
new crystallised quartz (~15 ppm). Furthermore, the intensity of the 2.96 eV emission and the
Ti vary within the zoned phenocrysts of the Sunset Hills Granite; blue luminescent zones
show a higher intensity and Ti content than the violet and red zones. Similar observations
have been made by Kerkhof et al. (1996) and Müller et al. (2000), who showed that blue to
violet luminescent growth zones in high-temperature quartz have high Ti concentrations. With
increasing degrees of deformation the primary magmatic Ti distribution is more and more
overprinted, resulting in weakening of the growth zoning. The dark red-brown to non-
luminescent, secondary CL patterns, such as star-like halos around fluid inclusions, diffusion
rims along open micro-cracks, lamellae and domains of newly crystallised (secondary) quartz
along healed micro-cracks (e.g. black areas of the quartz in Fig. 10.5d, e, f), are depleted in Ti
(Fig. 10.9). Depletion of Ti occurs near grain boundary in all three granitoids.

184
Fig. 10.6 CL spectra of quartz (1.4 - 3.1 eV) recorded with the 100 lines/mm grating after 30 s, 2 min, and 7
min of electron bombardment. The 7-min-spectra are fitted with Gaussian curves. Each Gaussian curve
represents a single emission band. a - Carcoar Granodiorite (CGD). b - Barry Granodiorite (BGD). c - Sunset
Hills Granite (SHG).

185
The Al distribution in all three granites is heterogeneous and the Al content is mostly below
32 ppm. At Al contents above the detection limit of 32 ppm, Al correlates with K (Fig. 10.10).
The regression line corresponds to the Al/K weight ratio of an average muscovite
composition. The muscovite flakes of up to 0.5 µm in diameter are finely dispersed in the
quartz of all three granites, probably on slide planes and we assume they are the products of
deformation.
The average Fe content of the three granites amounts approximately to the detection limit of
15 ppm. Despite the low Fe concentration, the spectra show the 1.73 eV emission band caused
by Fe3+ defect structures (Pott and McNicol, 1971). The Fe content in quartz increases at the
grain contacts with plagioclase, and particularly with biotite (Fig. 10.8), which indicates a
high diffusion mobility of Fe in the quartz lattice.
Fig. 10.7 Quartz CL spectra sections of the blue spectrum range (2.5 - 3.1 eV) recorded with the 1200 lines/mm
grating after 7 min of electron bombardment where CGD = Carcoar Granodiorite, BGD = Barry Granodiorite
and SHG = Sunset Hills Granite. The spectrum of BGD – new crystallised quartz is fitted with Gaussian curves.
The intensity of the 1.96 eV emission is constant during electron radiation in the quartz of the
Carcoar Granodiorite, and decreases in the quartz of the Barry Granodiorite and Sunset Hills
Granite. According to Siegel and Marrone (1981), Griscom (1985), and Stevens Kalceff and
Phillips (1995), the red CL emission around 1.96 eV is related to OH- and/or adsorbed H2O.
In undeformed quartz the 1.96 eV emission increases during electron radiation. This increase
is explained by radiolysis of hydroxyl groups and/or adsorbed H2O of quartz lattice, which

186
Fig. 10.8 Trace element profiles of quartz. a, b Carcoar Granodiorite. The position of the profile is shown in
Figure 7a. c, d Barry Granodiorite. e, f Sunset Hills Granite. The position of the profile in the Sunset Hills
Granite is shown in Figure 7b.
leads to the formation of non-bridging oxygen hole centres (NBOHC; Kalceff and Phillips,
1995). Hydroxyl groups and adsorbed H2O act as charge compensators for [2AlO 4/M+]-
defects, where M+ is a combination of Li, K, and Na ions (Bambauer et al., 1963;
Maschmeyer and Lehmann, 1983; Kronenberg et al., 1986; Stenina 1995). As discussed
above, the Al of the deformed quartz of the granites is removed from the quartz lattice and
may be incorporated into the muscovite flakes. A similar process is assumed for the hydroxyl
groups and adsorbed H2O of the quartz lattice. Both bound water types may also be removed
during deformation. This process explains the constant or slightly decreasing 1.96 eV
emission, because no NBOHC is created during electron radiation, due to the absence of
hydroxyl groups and adsorbed H2O in the quartz lattice.
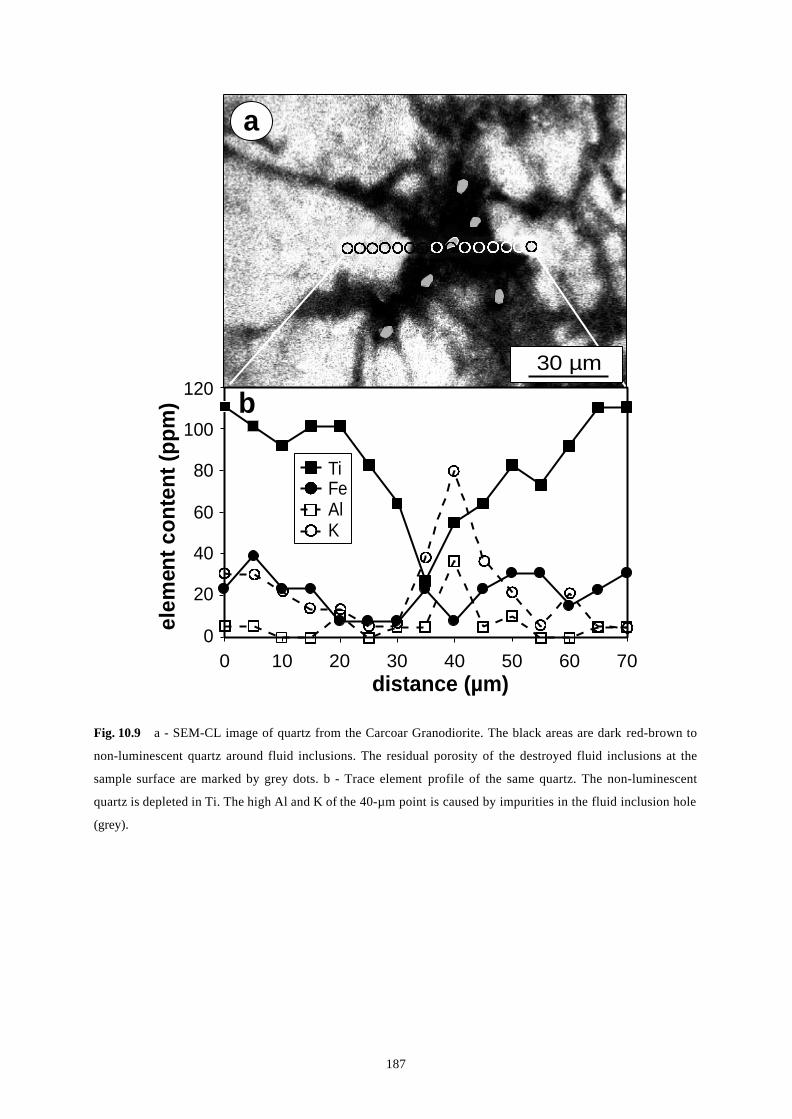
187
Fig. 10.9 a - SEM-CL image of quartz from the Carcoar Granodiorite. The black areas are dark red-brown to
non-luminescent quartz around fluid inclusions. The residual porosity of the destroyed fluid inclusions at the
sample surface are marked by grey dots. b - Trace element profile of the same quartz. The non-luminescent
quartz is depleted in Ti. The high Al and K of the 40-µm point is caused by impurities in the fluid inclusion hole
(grey).
0 10 20 30 40 50 60 70
120
100
80
60
40
20
0
elem
ent c
onte
nt (p
pm)
distance (µm)
TiFeAlK
30 µm
a
b

188
Fig. 10.10 Al versus K concentrations of the investigated quartz of the three granites. The regression line of the
data above 50 ppm corresponds with the Al/K ratio of the average muscovite composition (dashed line). The
deformation of magmatic quartz caused the development of submicroscopic muscovite flakes (<0.5 µm) along
slip planes.
10.8 Al-in-hornblende geobarometery on the Carcoar and Barry granodiorites
The Al-in-hornblende barometer helps to estimate the crystallisation pressure of granites. The
empirical correlation between the pressure of emplacement of calcalkaline granites, and the
total Al content of hornblende equilibrated with quartz was proposed by Hammarstrom and
Zen (1986) and Hollister et al. (1987). Experimental calibrations of the barometer were
carried out by numerous workers (Johnson and Rutherford, 1989; Thomas and Ernst, 1990;
Schmidt, 1992; Anderson and Smith, 1995). The barometer applies if the magmatic rocks (1)
have the assemblage pl + ksp + qtz + hb + bt + tnt + Fe - Ti; and (2) plagioclase has a constant
rim composition in the range of An25 and An35; (3) the analysis is limited only to the rim
composition of hornblende; (4) the hornblende FeT/(FeT + Mg) ratios are in the range of 0.40-
0.65, to exclude low ƒO2, and (5) the pressure of crystallisation is above 1 kbar
(Hammarstrom and Zen, 1986; Hollister et al., 1987; Anderson and Smith, 1995).
The Carcoar and Barry granodiorites have the appropriate mineral assemblage, with a
plagioclase composition between An29 and An34, and hornblende with FeT/(FeT + Mg) ratios
0
50
100
150
200
250
300
0 100 200 300 400 500
Al (ppm)
Carcoar Granodiorite
Barry Granodiorite
Sunset Hills Granite
Al/K mass ratio in muscovite
189
in the range of 0.42-0.53. The pressures during mineral growth were calculated using the
calibration of Anderson and Smith (1995), including the effect of temperature, as the
barometer is sensitive to variations in temperature. The temperatures were determined using
the amphibole-plagioclase geothermometer after Blundy and Holland (1990) with the
modified pressure term after Schmidt (1992).
Al-in-hornblende barometry on the Carcoar Granodiorite yields pressures of 1.7 ± 0.7 kbar
(30 analyses) at 756 ± 12 C. Amphiboles of the Barry Granodiorite yield pressures of 1.8 ±
0.8 kbar (37 analyses) at 753 ± 22 C. No differences in the AlT-content were detected between
the core and the rim of hornblende in the Carcoar and Barry granodiorites. Consequently, the
crystallisation depth of the hornblende of the Carcoar and Barry granodiorites is 6.0 ± 2.6 km.
These results are consistent with the estimated intrusion depths of 4-6 km for the Carcoar and
Barry granodiorites based on the extent and nature of the contact aureole as calculated by
Lennox and Fowler (pers. comm.)
10.9 Discussion and conclusions
Quartz cathodoluminescence
Three main conclusions can be made from CL analysis:
(1) Magmatic quartz with high Ti content shows blue to violet CL, and with low Ti content
red to red-brown CL. The variation of Ti in the quartz lattice relates with contrasts in the
growth zoning of quartz phenocrysts referred to as the primary magmatic CL textures.
With increasing deformation the homogeneity of Ti distribution decreases.
(2) Dark red-brown to non-luminescent, secondary CL textures show low Al, Fe and Ti
concentrations. The low trace element concentration of the star-like halos and the lamellae
are due to systematic recovery of the defect centres of trace element, which was initiated
by local stress around fluid inclusions and along slip planes (Kerkhof and Müller, 1999).
The annealing of intragranular micro-shear zones led to formation of secondary quartz,
depleted in trace elements.
(3) In contrast to undeformed, natural quartz, interstitial water is absent from deformed
quartz. We suggest that a large portion of the interstitial water, which was originally
incorporated in the quartz lattice during magmatic crystallisation, was absorbed in the
submicroscopical muscovite flakes during the post-magmatic deformation. The residual
interstitial water reacted with silica due to pressure solution during deformation, and

190
formed Si-OH bonds along intragranular cracks caused by sliding (e.g. Michalske and
Freiman, 1982).
Magmatic quartz textures
The analysis of the magmatic quartz texture, grain size distribution, and CL contrasted growth
zoning of the phenocrysts leads to the following four conclusions:-
(1) The Carcoar Granodiorite has one generation of anhedral quartz, which crystallised in
cavities between feldspar and mafic minerals during and after emplacement.
(2) The Barry Granodiorite formed one generation of unzoned, subeuhedral quartz
phenocrysts overgrown by a second generation of anhedral matrix quartz. The
homogeneous distribution of AlT in hornblende indicates one main crystallisation stage.
Therefore, both quartz generations must have crystallised at or near the emplacement
level. First, quartz grew in a crystal mush, which facilitated a relatively unhindered
growth and formation of planar crystal faces. Their growth may have been interrupted by
magma degassing or magma pulsing. As a result, quartz with contrasting CL properties
crystallised filling the residual space between the crystals. The grain size of the matrix
quartz of the Barry Granodiorite is smaller in comparison to the Carcoar Granodiorite. In
the south, the Barry Granodiorite shows aplitic textures and the grain size of the matrix
quartz decreases to ~100 µm indicating faster cooling rates of the melt. Both features
indicate that a higher level of the Barry pluton is exposed in the south.
(3) In contrast to the Carcoar and Barry granodiorites, the Sunset Hills Granite has three
generations of quartz. The first two generations are phenocrysts of variable size, showing
oscillatory and superordinate stepped zoning, and resorption surfaces. The stepped zoning
and the resorption surfaces both indicate a change in melt composition, pressure and
temperature during the early stage of magma ascent. The properties of these phenocrysts
show similarities with rhyolitic phenocrysts. The third magmatic generation is represented
by the homogeneous matrix quartz, which crystallised at the intrusion level, overgrowing
the phenocrysts.
(4) The melt of both granodiorites underwent a relatively continuous and rapid ascent;
whereas the melt of the Sunset Hills Granite experienced a stepwise ascent that caused
multiphase nucleation, episodes of slow crystal growth, and resorption events.

191
Geochemistry and Al-in-hornblende geobarometry
The similarities in chemical composition of the Carcoar and Barry granodiorites indicate
derivation from one magma source. The geochemical difference between both granodiorites is
documented by fractionation of hornblende within the Barry Granodiorite. The most
fractionated, uppermost part of the Barry Granodiorite is exposed at the contact with the
Sunset Hills Granite in the south. The intrusion depth is in the lower error range of the
hornblende crystallisation depth between 3 and 6 km. This depth is consistent with
estimations of 4-6 km for the emplacement depth of the Barry Granodiorite by Lennox and
Fowler (pers. comm.), which are based on the extent and nature of the contact aureole. The
intrusion depth of the Carcoar Granodiorite is in the upper error range of the hornblende
crystallisation depth between 6 and 9 km, as also inferred by lower cooling rates and a wider
contact aureole. Consequently, the northern part of the Carcoar Granodiorite represents a
deeper part of the pluton compared with the southern part of the Barry Granodiorite, which is
consistent with 3D gravity modelling of the pluton (Trzebski et al., 1999).
In contrast to the I-type Carcoar and Barry granodiorites, the Sunset Hills Granite shows S-
type affinity. The magma of the Sunset Hills Granite we interprete as fractionation product
derived from the magma of the Wyangala Batholith. Besides the compositional similarities of
both granites, the Sunset Hills Granite occurs at the northeastern extremity of the negative
gravity anomaly due to the Wyangala Batholith (Trzebski et al., 1999). Three-dimensional
gravity modelling and re-interpretation of aeromagnetics suggest a subsurface connection and
therefore a possible genetic link in magma genesis between both granites.
Deformation fabrics
The Carcoar and Barry granodiorites both show magmatic and post-magmatic foliation,
whereas in the Sunset Hill Granite an intense post-magmatic foliation was developed, which
may have possibly overprinted a pre-existing magmatic foliation. The magmatic foliation of
the Carcoar and Barry granodiorites are marked by aligned biotite and hornblende and are
cross-cut by the post-magmatic, solid-state foliation. This later foliation in all granitoids is
post-magmatic, because it is (1) marked by secondary minerals, such as muscovite and
chlorite, (2) is locally at high angles to pluton-host rock contacts, (3) is continuous with the
regionally developed cleavage, and (4) cross-cuts aligned igneous minerals. In addition, the
contact aureole of these granitoids overprints the earlier metamorphic fabrics (Lennox et al.,
1991; Lennox and Fowler, 1994; McKinlay, 1993; Lennox et al., 1998). The post-magmatic
deformation fabrics are probably related to regional shear zones.

192
The dominance of prismatic subgrain boundaries of quartz in the Carcoar and Barry
granodiorites indicates slip along the basal plane, which is limited to the stability field of low-
quartz (Blumenfeld et al., 1986; Kruhl, 1996). The beginning of quartz recrystallisation in the
Carcoar Granodiorite indicates deformation temperatures of =290°C (Voll 1976, 1980). The
increase in size of the dynamically recrystallised quartz grains in the Barry Granodiorite, in
comparison with that of the quartz in the Carcoar Granodiorite, is due to both increasing
temperature and differential stress. Secondly, the new crystallised quartz grains with high-
angle boundaries developed during the recovery of subgrains at moderate to high
temperatures in the Barry Granodiorite (Hull and Bacon, 1984; Hirth and Tullis, 1992). The
Barry Granodiorite was deformed at higher temperature than the Carcoar Granodiorite. The
abscence of widespread boundary migration recrystallisation indicates a maximum
deformation temperature of 400°C (Guillopé and Poirier, 1979; Urai and Humphreys, 1981;
Urai, 1983; Paschier and Trouw, 1998). Using the closure temperature of the Ar-Ar system in
biotite, the likely temperatures during the post-magmatic Bowning deformation (405-410 Ma)
are estimated to ~350°C for the Carcoar Granodiorite and to 350-400°C for the Barry
Granodiorite.
The boundary migration recrystallisation during dynamic recrystallisation in the quartz of the
Sunset Hills Granite is a typical process at high temperatures of 400-700°C (Guillopé and
Poirier, 1979; Urai and Humphreys, 1981; Urai, 1983; Paschier and Trouw, 1998). The
development of basal and prismatic subgrain boundaries in deformed quartz indicates prism
slip of quartz, which is restricted to the stability field of high-quartz at temperatures around
550 C (Blacic and Christie, 1984; Blumenfeld et al., 1986; Kruhl, 1996). The increase of
dynamically recrystallised grain size from the Barry Granodiorite to the Sunset Hills Granite
is interpreted to be a result of the dominance of annealing recrystallisation over dynamic
recrystallisation at temperatures around 550 C. This is consistent with the estimated
deformation temperatures of 550°C for the adjacent Wyangala Batholith (Morand, unpubl.
data in Paterson et al., 1990).
10.10 Geological implications
This study has quantified the conditions of magma crystallisation, emplacement and
deformation of the Carcoar, Barry and Sunset Hills granites. Our previous work revealed the
structural framework of these granites and their host rocks, the three-dimensional shape of the
193
plutons, their spatial relationship with faults and their distribution at depth (Lennox et al.,
1998; Trzebski et al., 1999). New and published radiometric dating differentiated three events
that indicate the timing of emplacement of the granites and their subsequent deformation
(Lennox et al., 1998). These events are coeval with regional orogenic events in the Lachlan
Fold Belt (e.g., Gray and Forster, 1997). The first event (Benambran), dated at approximately
430 Ma (Lower Silurian) by the zircon SHRIMP U-Pb method and by U-Pb dating of zircon
fractions, indicates the emplacement time of all three granites (Lennox, unpublished data).
Both subsequent events, dated to ~410 Ma (Bowning) and ~375 Ma (Tabberabberan) using
the Rb-Sr-, Ar-Ar- and K-Ar-methods on biotite and hornblende, document two deformation
stages following granite emplacement (Lennox et al., 1998; Glen et al., in press).
All three granites intruded synchronously, but at different crustal levels. The Carcoar and
Barry granodiorites were emplaced at a depth of 6±2.6 km under brittle to locally weakly
ductile conditions. The elongate shape of the Barry Granodiorite is subparallel to the regional
structural strain. In contrast, the almost square geometry of the Carcoar Granodiorite suggests
emplacement in a brittle fashion which was structurally controlled by extensional faults and
fractures at shallow crustal depths. Although the intrusion depth of the Sunset Hills Granite
could not be determined, we assume that the magma accumulated at deeper levels on the basis
of the upper greenshist facies and the ductile structures of the surrounding host rocks (Lennox
and Fowler, 1994). The grain boundary migration recrystallisation and larger average size of
recrystallised quartz grains (~100 µm) with high-angle boundaries further indicate that the
Sunset Hills Granite remained in a hotter environment over a considerably longer period of
time after emplacement. The concordance in structural development between the Sunset Hills
Granite and the host-rocks, the geometry of foliation trends around the pluton and its
elongated shape additionally indicate emplacement into host rocks at greater depth under
ductile conditions. This is also supported by the fact that during the first post-magmatic
Bowning event the Sunset Hills Granite was deformed at temperatures of ~550o C and at
depths of 10-12 km when applying a likely geothermal gradient of 45-55°C/km (Packham,
1999). Similar intrusion depths were obtained by pressure data of 3-4 kbar for the adjacent
and genetically related Wyangala Batholith (Morand quoted in Paterson et al., 1990). In
contrast, during the same event both I-type granodiorites were deformed at temperatures of
350-400°C due to their higher emplacement level in the crust. The east-west contraction
during the Upper Silurian/Lower Devonian causes uplift of both granodiorites and cooled
through the closure temperature of biotite (~ 350o C) at around 412 Ma; whereas the deeper
seated Sunset Hills Granite was synchronously cooled through the closure temperature of

194
hornblende (~550o C). The second post-magmatic deformation (Tabberabberan event), caused
by regional east-west contraction, only weakly deformed the near-surface located more
resistant granodiorites in a brittle fashion because the granodiorites were at upper crustal
levels (Vernon and Flood, 1988). The Sunset Hills Granite experienced further vertical uplift
due to east-vergent thrusting and cooling through the closure temperature of biotite (~350o C)
at around 380 Ma (Paterson et al., 1990; Glen and Watkins, 1999). The youngest event around
340 Ma, which correlates with the Early Carboniferous Kanimblan deformation (Gray and
Forster, 1997), was associated with north-south contraction and resulted in mega-kinking at a
regional scale (Powell et al., 1985). North-south oriented thrusting may have further exposed
all three granites along north-vergent ramps. This is supported by the fact that both
granodiorites show deeper exposure levels in the north of the plutons.

195
References
Agel A. (1992): Paramagnetische Defektzentren in polykristallinem Quarz granitischer und metamorpherHerkunft. Thesis, Univ. Marburg, 109 p.
Agel A. and Petrov I. (1990): Im Quarzgitter substituiertes Aluminium als Indikator für dessenBildungstemperatur. Ber. Dtsch. Min. Ges., Beih. Eur. J. Mineral., 2/1: 144.
Allègre C.J., Provost A., Jaupart C. (1981): Oscillatory zoning: A pathological case of crystal growth. Nature,294: 223-228.
Aines R.D. and Rossman G.R. (1984): Water in minerals? A peak in the infrared. J. Geophys. Res., 89/B6: 4059-4071.
Alonso P.J., Halliburton L.E., Kohnke E.E. and Bossoli R.B. (1983): X-ray-induced luminescence in crystallineSiO2. J.Appl.Phys., 54/9: 5369-5375.
Anderson A.T. (1984): Probable relations between plagioclase zoning and magma dynamics, Fuego Volcano,Guatemala. Amer. Mineral., 69: 660-676.
Anderson J.H. and Wickersheim K.A. (1964): Near infrared characterisation of water and hydroxyl groups onsilica surfaces. Surf. Sci., 2: 252-260.
Anderson J.L. and Smith D.R. (1995): The effects of temperature and ƒO2 on the Al-in-hornblende barometer.American Mineralogist, 80: 549-559.
Arikas K. (1964): Geochemie und Petrologie der permischen Rhyolite in SW-Deutschland. Fortschritte d.Mineral., Bh. 1, 64: 9-10.
Armstrong J.T. (1991): Quantitative elemental analysis of individual microparticles with electron beaminstruments. In: Heinrich K.F.J. and Newbury D.E. (eds.): Electron probe quantification. Plenum Press, NewYork, London, 261-315.
Audétat A. and Günther D. (1999): Mobility and H2O loss from fluid inclusions in natural quartz crystals.Contrib. Mineral. Petrol., 137: 1-14.
Baker B.G. and Sexton B.A. (1975): Electron beam effects in Auger analysis of physisorbed xenon. Surf. Sc., 52:353-364.
Bambauer H.U. (1961): Spurenelementgehalt und –Farbzentren in Quarzen aus Zerrklüften der SchweizerAlpen. Schweiz. Mineral. Petrogr. Mitt., 41: 335-369.
Bambauer H.U., Brunner G.O., Laves F. (1963): Merkmale des OH-Spektrums alpiner Quarze (3µ-Gebiet).Schweiz. Mineral. Petrogr. Mitt., 43: 259-268.
Bard J.P. (1986): Microtextures of igneous and metamorphic rocks. - D. Reidel Publishing Company Dordrecht,Boston, Lancaster, 264 pp.
Behr H.J. (1966): Die Verwendung von Lackfilmen (Ätzbildern) zur Strukturuntersuchung von metamorphenund magmatischen Gesteinen. Monatsber. Dt. Akad. Wiss., 8/12: 897-904.
Behr H.J. (1989): Die geologische Aktivität von Krustenfluiden. In: Gesteinsfluide - Ihre Herkunft undBedeutung für geologische Prozesse. Nds. Akad. Geowiss. Veröfftl. 1, Hannover, pp. 7-42.
Behr H.-J. and Frentzel-Beyme K. (1989): Permeability and paleoporosity in crystalline bedrocks of the CentralEuropean basement-studies of cathodoluminescence. In: Boden A. and Eriksson K.G. (eds.): Exploration ofthe deep continental crust. Deep drilling in crystalline bedrock, volume 2. Springer, pp. 477-497.
Behr H.-J. and Horn E.E. (1982): Fluid inclusion systems in metaplaya deposits and their relationship tomineralization and tectonics. Chem. Geol., 37: 173-189.
Behr H.-J., Horn E.E., Porada H. (1983): Fluid inclusions and genetic aspects of the Damara Orogen. In: MartinH. and Eder F.W.: Intracontinental Fold Belts. Springer, pp. 611-654.
Behr H.-J. and Schmidt-Mumm A. (1987): The role of sedimentary and tectonic brines in the Damara Orogen,Namibia. Appl. Geochemistry, 2: 535-542.
Bershov L.V., Krylova M.D. and Speranskij A.V. (1978): The electron holes centres O—Al and Ti3+ asindicator for temperature conditions during regional metamorphosis (in Russ.). Izv. Akad. Nauk SSSR, Ser.geol., 113-117.
Beskin S.M., Larin V.N., Marin Yu.B. (1994): Physiographic types of granitic rocks of Kazakhstan and theirmetallogenic significance. In: Shatov V., Seltmann R., Kremenetsky A., Lehmann B., Popov V., Ermolov P.(eds.): Granite-related ore deposits of Central Kazakhstan and adjacent areas. Glagol St. Petersburg 1996,pp 259-268.
Beus A.A., Severov E.A., Sitnin A.A., Subbotin K.D. (1962): Albitized and greisenized granites (apogranites).Izdat. Akad. Nauk SSSR, Moscow, 196 p. (in Russian).
Blacic J.D. and Christie J.M. (1984): Plasticity and hydrolytic weakening of quartz single crystals. J. Geophys.Res., 89: 4223-4239.
196
Blankenburg H.-J., Götze J. and Schulz J. (1994): Quarzrohstoffe . Deutscher Verlag für Grundstoffindustrie,Leipzig-Stuttgart, 296 pp.
Blumenfeld P., Mainprice D. and Bouchez J.L. (1986): C-slip in quartz from subsolidus deformed granite.Tectonophysics, 127: 97-115.
Blundy J.D. and Holland J.B. (1990): Calcic amphibole equilibria and a new amphibole-plagioclasegeothermometer. Contrib. Mineral. Petrol., 104: 208-24.
Blundy J.D. and Holland J.B. (1994): Non-ideal interactions in calcic amphiboles and their bearing onamphibole-plagioclase thermometry. Contrib. Mineral. Petrol., 116: 433-47.
Boiron M.C., Essarraj S., Sellier E., Cathelineau M., Lespinasse M. and Poty B (1992): Identification of fluidinclusions in relation to their host microstructural domains in quartz by cathodoluminsecence. Geochim.Cosmochim. Acta, 56: 175-185.
Bottinga Y., Kudo A., Weill D. (1966): Some observations on oszillatory zoning and crystallisation of magmaticplagioclase. Amer. Mineral., 51: 792-806.
Boullier A.M. and Bouchez J.L. (1978): Le quartz en rubans dans les mylonites. Bull. Soc. geol. France, 7/3:253-262.
Breiter K., Sokolova M., Sokol A. (1991): Geochemical specialisation of the tin bearing granitoid massif of NWBohemia. Mineral. Deposita 26: 298-306.
Breiter K., Förster H.J., Seltmann R. (1999): Variscan silicic magmatism and related tin-tungsten mineralizationin the Erzgebirge-Slavkovsky les metallogenic province. Mineralium Deposita, 34: 505-521.
Breiter K., Fryda J., Seltmann R., Thomas R. (1997): Mineralogical evidence for two magmatic stages in theevolution of an extremely fractionated P-rich rare-metal granite: the Podlesi stock, Krušné Hory, CzechRepublic. J. Petrol., 38/12: 1723-1739.
Brown C. and Thomas L. (1960): The effect of impurities on the growth of synthetic quartz. J. Phys. Chem.Solids, 13: 337.
Bruckschen P., Neuser R.D., Richter D.K. (1992): Cement stratigraphy in Triassic and Jurassic limestones of theWeserbergland (northwest Germany). Sedimentary Geology, 81: 195-214.
Bruhn F., Bruckschen P., Meijer J., Stephan A., Richter D.K., Veizer J. (1996): Cathodoluminescenceinvestigations and trace-element analysis of quartz by micro-PIXE: implications for diagenetic andprovenance studies in sandstone. Canadian Mineralogist 34: 1223-1232
Brunner G.O., Wondratschek H. and Laves F. (1961): Ultrarotuntersuchung über den Einbau von H innatürlichen Quarz. Z. Elektrochem. 56: 735-750.
Candela P.A., Blevin P.L. (1995): Do some miarolitic granites preserve evidence of magmatic volatile phasepermeability? Economic Geology, 90: 2310-2316.
Castaing R. (1951): Application des sondes électroniques à une méthode d’analyse ponctuelle chimique etcristallographique. (Electron beam based techniques for spatially resolved chemical and crystallographicalanalyses.) – Thèse, Université de Paris, France.
Cobbing E.J., Pitfield P.E.J., Darbyshire D.P.F., Mallick D.I.J. (1992): The granites of the South-East Asian tinbelt. British Geological Survey Overseas Memoir 10, London, 369 p.
Cohen A.J. (1960): Substitutional and interstitial aluminium impurity in quartz, structure, and color centreinterrelationships. J. Phys. Chem. Solids, 13: 321-325.
Collins P.J. and Vernon R.H. (1992): Paleazoic arc growth, deformation and migration across the Lachlan FoldBelt, southeastern Australia. Tectonophysics, 214: 381-400.
Coney P.J. (1992): The Lachlan Fold Belt of eastern Australia and Circum Pacific tectonic evolution.Tectonophysics, 214: 381-400.
Crookes W. (1879): Contributions to molecular physics in high vacuo. Phil. Trans., 170: 641-662.Demars C., Pagel M., Deloule E., Blanc P. (1996): Cathodoluminescence of quartz from sandstones:
Interpretation of the UV range by determination of trace element distributions and fluid-inclusion P-T-Xproperties in authigenic quartz. Amer. Mineral., 81: 891-901.
Dennen W.H. (1965): Stoichiometric substitution in natural quartz. Geochimica et Cosmochimica Acta, 30:1235-1241.
Dennen W.H., Blackburn W.H., Quesada A. (1970): Aluminium in quartz as a geothermometer. Contr. Mineral.and Petrol., 27: 332-342.
D’Lemos R.S., Kearsley A.T., Pembroke J.W., Watt G.R., Wright P. (1997): Complex quartz growth histories ingranite revealed by scanning cathodoluminescence techniques. Geol. Mag., 134/4: 549-552.
Donaldson C.H., Henderson C.M.B. (1988): A new interpretation of round embayments in quartz crystals.Mineral. Mag., 52: 27-33.
Dowty E. (1989): Crystal growth and nucleation theory and the numerical simulation of igneous crystallization.In: Hargraves R.B. (ed.): Physics of magmatic processes. New Jersey, pp 419-485.
Dudek H.J. (1970): Zeitlicher und räumlicher Temperaturverlauf im Material bei fokussierterElektronenbestrahlung. Optik 30/5: 453-460.
Dudley R.J. (1976): The use of cathodoluminscence in the identification of soil materials. J. Soil Sci., 27: 487-491.

197
Evans J., Hogg A.J., Hopkins M.S., Howarth R.J. (1994): Quantification of quartz cements using combined SEMCL and image analysis . J. Sed. Res., 64A: 334-338.
Fiala F. (1968): Granitoids of the Slavkovský (Císaøský) Les Mountains. Sbor. geol. Vìd, G, 14: 93-160.Flick H. (1984): Kristallisation des Quarzes in kieselsäurereichen Schmelzen – Möglichkeiten seiner
Verwendung als geologisches Thermometer und Barometer. Habilitation, University Heidelberg, 133 pp.Flick H. (1987): Geotektonische Verknüpfung von Plutonismus und Vulkanismus im südwestdeutschen
Variscicum. Geol. Rdsch. 76/3: 699-707.Flicstein J. and Schieber M. (1974): Microsegregation of impurities in hydrothermally-grown quartz crystals. J.
Cryst. Growth 24/25: 603-609.Förster H.J., Tischendorf G. (1994): The western Erzgebirge-Vogtland granites: Implications to the Hercynian
magmatism in the Erzgebirge-Fichtelgebirge anticlinorium. In: Seltmann R., Möller P., Kämpf H. (eds.):Metallogeny of Collisional Orogens. Czech Geological Survey Prague, pp 35-48.
Förster H.J., Seltmann R., Tischendorf G. (1995): High-fluorine, low phosphorus A-type (post-collision) silicicmagmatism in the Erzgebirge. In: 2nd Symp. Permocarboniferous Igneous Rocks. Terra Nostra, 7: pp 32-35.
Förster H.J., Seltmann R., Tischendorf G. (1996): Post-collisional A-type silicic magmatism in the VariscanErzgebirge. Journ. Confer. Abstracts, 1: p. 174.
Fowler A.D. (1990): Self-organized mineral textures of igneous rocks: the fractal approach. Earth-ScienceReviews 29: 47-55
Frentzel-Beyme K. (1989): REM-Kathodolumineszenz-Strukturen im Quarzteilgefüge von Metamorphiten:Bestandsaufnahme und geologische Interpretation . Dissertation University Göttingen, Photodruck Göttingen,78 p.
Friebele E.J., Griscom D.L. and Marrone M.J. (1985): The optical absorption and luminescence bands near 2 eVin irradiated and drawn synthetic silica. J. Non-Cryst. Solids, 71: 133-144.
Friskney C.A. and Haworth C.W. (1967): Heat-flow problems in electron-probe microanalysis. J. Appl. Phys.38: 3796-3798.
Fuchs, H. and Götze, J. (1996): Origin of volcanic agate – evidence from cathodoluminescence, EPR andgeochemical studies. Intern. Conf. CL Rel. Techn. Geosci. Geomat., Nancy, Abstracts, pp. 49-50.
Gallei E. and Parks G.A. (1972): Evidence for surface hydroxyl groups in attenuated total reflectance spectra ofcrystalline quartz. J. Colloid Interface Sci., 38: 650-651.
Gerler J. (1990): Geochemische Untersuchungen an hydrothermalen, metamorphen, granitischen undpegmatitischen Quarzen und deren Flüssigkeitseinschlüssen. Thesis, Georg-August-Universität Göttingen,Germany, 169 pp.
Glen R.A. (1998): The Eastern Belt of the Lachlan Orogen. In: Finlayson, D.M. and Jones, L.E.A. (eds.):Mineral Systems and the crust-upper mantle of southeast Australia . Australian Geological SurveyOrganisation Record, 2: 80-82.
Glen R.A., Walshe J.L., Barron L.M., Watkins J.J. (1998): Ordovician convergent-margin volcanism andtectonism in the Lachlan sector of east Gondwana. Geology, 26: 751-754.
Glen, R.A. and Walshe J.L. (1999): Cross-structures in the Lachlan Orogen: the Lachlan Transverse Zoneexample. Australian Journal of Earth Science, 46: 641-658.
Glen, R.A., Lennox, P.G. and Forster, D.A. (in press): 40Ar-39Ar dating of deformation west of the Hill EndThrough, Lachlan Orogen, New South Wales. Quarterly Note, Geological Survey of New South Wales.
Goldstein E. (1907): Über das Auftreten roten Phosphoreszenzlichtes an Geissler’schen Röhren: Bericht derDeutschen Physikalischen Gesellschaft , 598-605.
Gorobets B.S., Graft M.L., Podolskiy A.M. (1989): Luminescence of minerals and ores. Ministry of GeologyUSSR, Moscow, 53 pp., (in Russian).
Gorton N.T., Walker G., Burley, S.D. (1996): Experimental analysis of the composite blue CL emission inquartz - is this related to aluminium content? In: Abstracts SLMS International Conference onCathodoluminescence, Nancy, Sept 1996, p 59.
Gottstein G. and Mecking H. (1985): Recrystallization. In: Wenk H.R. (ed.): Preferred orientation in deformedmetals and rocks - an introduction to modern texture analysis. Academic Press, New York, pp. 183-218.
Götze J. (2000): Cathodoluminescence microscopy and spectroscopy in applied mineralogy. Habilitation, TUBergakademie Freiberg, 128pp.
Götze J. and Plötze M. (1997): Investigation of trace element distribution in detrital quartz by electronparamagnetic resonance (EPR). Eur. J. Mineral. 9: 529-537.
Götze J., Plötze M., Fuchs H. and Habermann D. (1999): Defect structure and luminescence behaviour of agate –results of electron paramagnetic resonance (EPR) and cathodoluminescence (CL) studies. Min. Mag. 63/2:149-163.
Grant P. (1978): The role of scanning electron microscope in cathodoluminescence petrology. In: Whalley B.(ed): Scanning Electron Microscopy in the Study of Sediments. Geo Abstracts, pp. 1-11.
Grant P.R. and White S.H. (1978): Cathodoluminscence and microstructure of quartz overgrowths on quartz.Scan. Electr. Micr., 1978/I: 789-794.

198
Gray D.R., Forster D.A., Bucher M. (1997): Recognition and definition of orogenic events in the Lachlan FoldBelt. Australian Journal of Earth Sciences, 44: 489-501.
Gray D.R. and Forster D.M. (1997): Orogenic concepts – applications and definition: Lachlan fold belt, easternAustralia. American Journal of Science, 297: 859-891.
Greenwood H.J., McTaggart K.C. (1957): Correlation of zones in plagioclase. Amer J Sci 255: 656-666.Griggs D.T. (1967): Hydrolytic weakening of quartz and other silicates. Geophys. J. R. Astron. Soc. 14: 19-32.Griggs D.T. and Blacic J.D. (1965): Quartz: Anomalous weakness of synthetic crystals. Science, 147: 292-295.Griscom D.L. (1985): Defect structure of glass. - J. Non-Cryst. Solids 73, 51-77.Griscom D.L. (1991): Optical properties and structure of defects in silica glass. J. Cer. Soc. Japan, 99: 923.Gritsenko B.P. and Lisitsyn V.M. (1985): Intrinsic short-lived defects in quartz. Sov. Phys. Solid State, 27/7:
1330-1331.Grün R., Tani A., Gurbanov A., Koshchug D., Williams I., Braun J. (2000): A new method for the estimation of
cooling and denudation rates using paramagnetic centres in quartz: A case study on the EldzhurtinskyGranite, Caucasus. J. Geophys. Research (in review).
Guillopè M. and Poirier J.P. (1979): Dynamic recrystallization during creep of single crystalline halite: anexperimental study. J. Geophys. Res., 4: 5557-5567.
Guzzi M., Martini M., Mattaini M., Pio F., Spenolo G. (1987): Luminescence of fused silica: observation of theO2
- emission band. Phys. Rev. B, 35: 9407-9409.Haapala I. (1997): Magmatic and postmagmatic processes in tin-mineralized granites: Topaz-bearing
leucogranite in the Eurajoki Rapakivi granite stock, Finland. J. Petrol., 38/12: 1645-1659.Haase C.S., Chandam J., Feinn D., Ortoleva P. (1980): Oscillatory zoning in plagioclase feldspar. Science, 209:
272-274.Habermann D., Neuser R.D., Richter D.K. (2000): Quantitative high-resolution spectral analysis of Mn2+
activated CL in sedimentary calcite. In: Pagel M., Barbin V., Blanc P., Ohnenstetter D. (eds.):Cathodoluminescence in Geosciences. Springer, Berlin Heidelberg New York, pp. 331-358.
Hagni R.D. (1984): Cathodoluminescence microscopy applied to mineral exploration and benefication. In: ParkW.C., Hausen D.M., Hagni R.D. (eds.): Applied mineralogy. Proceedings of the Second InternationalCongress on Applied Mineralogy, AIME, New York, p. 41-66.
Hagni R.D. (1987): Industrial applications of cathodoluminescence microscopy. In: Hagni R.D. (ed.): ProcessMineralogy IV: Applications to precious metal deposits, industrial minerals, coal, liberation, mineralprocessing, agglomeration, metallurgical products, and refractories, with special emphasis oncathodoluminescence microscopy. TMS, Warrendale, Pennsylvania, p. 37-52.
Hammarstrom J.M. and Zen E-An (1986): Aluminium in hornblende: An empirical igneous geobarometer. Am.Mineral., 71: 1297-1313.
Hanusiak W.M. (1975): Low temperature cathodoluminescence of crystalline silica for use in thecharacterisation of respirable dusts. MSc Thesis, State College, Penn State University.
Hanusiak W.M. and White E.M. (1975): SEM cathodoluminescence for characterisation of damaged andundamaged alpha-quartz in respirable dusts. In: Johari O., Corvin I. (eds.): Proceedings of the 8th annualScanning Electron Microscope Symposium, pp. 125-132.
Harris D.W., Anderson A.T. (1984): Volatiles H2O, CO2 and Cl in a subduction related basalt. Contrib. Mineral.Petrol., 87: 120-128.
Hartmann P. (1978): Sur la morphologie des cristaux. Bull. Mineral., 101: 195.Hashimoto T., Sakaue S., Aoki H., Ichino M. (1994): Dependence of TL-property changes of natural quartzes on
aluminium contents accombined by thermal annealing treatment. Radiat. Meas., 23: 293-299.Hay R.S. and Evans B. (1987a): Chemically induced grain boundary migration in calcite: temperature
dependence, phenomenology, and possible applications to geologic systems. Contrib. Mineral. Petrol., 97:127-141.
Hay R.S. and Evans B. (1987b): Chemically induced grain boundary migration in low and high angle calcitegrain boundaries. Acta Metal., 135: 2049-2062.
Hayes W., Kane M.J., Salminen O., Wood R.L. and Doherty S.P. (1984): ODMR of recombination centers incrystalline quartz. J. Phys. C, 17: 2943-2951.
Heggie M.I. (1992): A molecular water pump in quartz dislocations. Nature, 355/23: 337-339.Helbig C., Beyer F. (1970): Zur relativen Alterstellung und petrotektonischen Analyse des Schellerhauer Granits.
Jb. Geol., 3/1967, Berlin, pp. 217-242.Hess P.C. (1989): Origin of igneous rocks. Harvard University Press, 336 pp.Hirth G. and Tullis J. (1992): Dislocation creep regimes in quartz aggregates. J. Struct. Geol., 14: 145-160.Hollister L.S., Grissom G.C., Peters E.K., Stowell H.H., and Sisson V.B. (1987): Confirmation of the empirical
correlation of Al in hornblende with pressure of solidification of calc-alkaline plutons. Am. Mineral., 72:231-239.
Holt D.B. (1992): New directions in scanning electron microscopy cathodoluminecence microcharacterisation.Scanning Microscopy, 6: 1-21.

199
Holt D.B. and Saba F.M. (1985): The cathodoluminescence mode of the scanning electron microscope: apowerful microcharacterisation technique. Scanning Electron Microscopy, 1985/III: 1023-1045.
Holten T., Jamtveit B., Meakin P., Cortini M., Blundy J., Austrheim H. (1997): Statistical characteristics andorigin of oscillatory zoning in crystals. Amer. Min., 82: 596-606.
Holtz F., Johannes W. (1994): Maximum and minimum water contents of granitic melts: implications forchemical and physical properties of ascending magmas. Lithos, 32: 149-159.
Hull D. and Bacon D.S. (1984): Introduction to dislocation. Pergamon Press, New York, 251p.Isoya J., Bowman M.K., Norris J.R., Weil J.A. (1983): An electron spin echo envelope modulation study of
lithium hyperfine and quadropole coupling in the Al (Ti-Li) center of a–quartz. J.Chem.Phys., 78: 1735-1746.
Itoh C., Suzuki T., Itoh N. (1990): Luminescence and defect formation in undensified and densified amorphousSiO2. Phys. Rev. B, 41/6: 3794-3799.
Jackson K. (1979): Theory of crystal growth. Treatise on solid Chemistry Vol. 5, Hannay N. (ed.), Plenum Press,New York.
Jani M., Halliburton L.E., Kohnke E.E. (1983): Point defects in crystalline SiO2: thermally stimulatedluminescence above room temperature. J. Appl. Phys., 54: 6321.
Jarchovský T. and Pavlù D. (1991): Albite-topaz microgranite from Horní Slavkov (Slavkovský Les Mts.) NorthBohemia. Vìst. Ústø. úst. geol., 66: 13-22.
Jarchovský T., Pavlù D., Morysek J., Najman K., Kozubek P. (1994): Li-F granite cupolas and Sn-Wmineralization in the Slavkovský les Mts., Czech Republic. Monograph Series on Mineral Deposits, 31: 131-148.
Johannes W., Holtz F. (1996): Petrogenesis and experimental petrology of granitic rocks. Springer, BerlinHeidelberg New York, 335 p.
Johnson, M.C. and Rutherford, M.J. (1989): Experimental calibration of the aluminium-in-hornblendegeobarometer with application to Long valley caldera (California) volcanic rocks. Geology, 17: 837-841.
Jones C.E. and Embree D. (1976): Correlations of the 4.77-4.28-eV luminescence band in silicon dioxide withthe oxygen vacancy. J. Appl. Phys., 47/12: 5365-5371.
Just G., Schilka W., Seltmann R. (1987): INAA investigations in tin-bearing granites of the Altenberg andSadisdorf ore deposits. In: Proc. 4 th Meeting on Nuclear Analytical Methods, Vol. 1, pp. 242-251.
Kalceff S.M.A. and Phillips M.R. (1995): Cathodoluminescence microcharacterization of the defect structure ofquartz. Phys. Review B, 52/5: 3122-3134.
Kalceff S.M.A., Phillips M.R., Moon A.R. (1997): Cathodoluminescence microcharacterisation of the irradiationsensitive defect structure of amorphous silicon dioxide. Microscopy and Microanalysis, 3: 751.
Kalceff S.M.A., Phillips M.R., Moon A.R., Kalceff W. (2000): Cathodoluminescence microcharacterisation ofsilicon dioxide polymorphs. In: Pagel M., Barbin V., Blanc P., Ohnenstetter D.: Cathodoluminescence inGeosciences. Springer, Berlin Heidelberg New York, pp. 193-224.
Kats A. (1962): Hydrogen in alpha-quartz. Philips Res. Repts, 17: 133-279.Kempe U., Götze J., Dandar, S., Habermann, D. (1999): Magmatic and metasomatic processes during formation
of the Nb-Zr-REE deposits from Khaldzan Buregte (Mongolian Altai): Indications from a combined CL-SEM study. Miner. Mag., 63: 165-177.
Kennedy S.K. and Arikan F. (1990): Spalled quartz overgrowths as a potential source of silt. J. Sed. Petrol., 60:438-444.
Kerkhof A.M. van den, Scherer T., Riganti A. (1996): Cathodoluminescence and EPR analysis of Archeanquarzites from the Nondweni Greenstone Belt, South Africa. In: Abstracts SLMS International Conferenceon Cathodoluminescence , Nancy, Sept 1996, p. 75.
Kerkhof A.M. van den, Behr H.-J., and Müller A. (1999): Charakterisierung von Defektstrukturen in Quarz mitKathodolumineszenz. SFB 468 Wechselwirkungen an geologischen Grenzflächen, Arbeits- undErgebnisbericht, Universität Göttingen.
Kerkhof A.M. van den and Müller A. (1999): Fluid inclusion re-equilibration and trace element redistribution inquartz: observations by cathodoluminescence microscopy. ECROFI XV 1999 Abstracts and Program,Potsdam, Terra Nostra , 99/6: 161-162.
Khanlary M.R., Townsend P.D., Townsend J.E. (1993): Luminescence spectra of germanosilicate optical fibres.1: radioluminescence and cathodoluminescence. J. Phys. D, 26: 371.
Kirkham R.V., Sinclair W.D. (1988): Comb quartz layers in felsic intrusions and their relationship to porphyrydeposits. In: Taylor R.P., Strong D.F. (eds.): Canadian Institute of Mining and Metallurgy. Special Volume39: pp 50-71.
Kirkpatrick R.J. (1975): Crystal growth from the melt: A review. Amer. Mineral., 60: 798-814.Kirkpatrick R.J. (1981): Kinetics of crystallization of igneous rocks. Mineral. Soc. Amer., Rev. Mineral., 8: 321-
398.Kostov R.I. and Bershov L.V. (1987): Systematics of paramagnetic electron-hole centres in natural quartz (in
Russian). Izvest. AN SSSR, ser. geol., 7: 80-87.

200
Kovalenko V.I. (1977): Petrology and geochemistry of rare-metal granitoids. Novosibirsk: Nauka, 225 p. (inRussian).
Kozlowski A. (1981): Melt inclusions in pyroclastic quartz from the Carboniferous deposits of the Holy CrossMts, and the problem of magmatic corrosion. Acta Geologica Polonica, 31/3-4: 273-283.
Koyama H. (1980): Cathodoluminescence study of SiO2. J. Appl. Phys., 51: 2228-2235.Krbetschek M.R., Götze J., Dietrich A., Trautmann T. (1997): Spectral information from minerals relevant for
luminescence dating. Radiat. Meas. 27/5,6: 695-748.Kronenberg A.K., Kirby S.H., Aines R.D., Rossmann G.R. (1986): Solubility and diffusional uptake of hydrogen
in quartz at high water pressures: implications for hydrolytic weakening in the laboratory and within theearth. Tectonophysics 172: 255-271.
Kruhl J.H. (1996): Prism- and basal-plane parallel subgrain boundaries in quartz: a microstructuralgeothermobarometer. J. metam. Geol., 14: 581-589.
Kuznetov V. and Lobachev A. (1973): Hydrothermal method for the growth of crystals. Sov. Phys.Crystallography , 17: 775.
Laemmlein G. (1930): Korrosion und Regeneration der Porphyr-Quarze. Z Kristallogr. 75: 109-127.Lange H., Tischendorf G., Pälchen W., Klemm I., Ossenkopf W. (1972): Fortschritte der Metallogenie im
Erzgebirge. B. Zur Petrographie und Geochemie der Granite des Erzgebirges . Geologie, 21/4-5: 457-493.Laubach S.E. (1997): Method to detect natural fracture strike in sandstones. AAPG Bulletin, 81/4: 640-623.Lehmann G. and Bambauer H.V. (1973): Quarzkristalle und ihre Farben. Angew. Chem. 7: 281-289.Lehmann G. (1975): On the colour centres of iron in amethyst and synthetic quartz: a discussion. Amer. Mineral.
60: 335-337.Lennox P.G., Hawley S., Fowler T.J. (1991): Intraorogenic Barry Granite – two granites in one! Lachlan Fold
Belt Conference, Abstracts, 29: 17.Lennox P.G. and Fowler T.J. (1994): Tectonism, deformation gradients and intrusion styles. 7th Specialist Group
in Tectonics and Structural Geology, Field Conference, Jindabyne. Geological Society of Australia,Abstracts, 36: 93-94.
Lennox P.G., Fowler T. and Foster D. (1998): Barry Granodiorite and Sunset Hill Granite: Wyangala-styleintrusion at the margin of a regional ductile shear zone, northern Lachlan Fold Belt, New South Wales.Australian Journal of Earth Sciences, 45: 849-863.
Lennox P.G., Trzebski R.C., Siebel W., Armstrong R. (in prep.) : Crustal architecture in the eastern Lachlan FoldBelt, Australia.
Lobin M. (1983): Pflanzenfunde aus den Tuffiten des Teplicer Quarzporphyrs. Exk. Führ. U. Kurzref. “Fortschr.Paläont. Stratigr. Rotl.”, Ges. Geol. Wiss. DDR, Berlin, p. 31.
Long J.V.P. and Agrell S.O. (1965): The cathodoluminescence of minerals in thin section. Miner. Mag., 34: 318-326.
Loomis T.P. (1982): Numerical simulations of crystallization processes of plagioclase in complex melts: theorigin of major and oszillatory zoning of plagioclase. Contr. Miner. Petr. , 81: 219-229.
Lowenstern J.B. (1995): Applications of silicate-melt inclusions to the of magmatic volatiles. In: ThompsonJ.F.H. (ed.): Magmas, fluids and ore deposits. Mineralogical Association of Canada Short Course, 23: 71-99.
Luff B.J. and Townsend P.D. (1990): Cathodoluminescence of synthetic quartz. J. Phys. Condens. Matter, 2:8089-8097.
Lysakov V.S. (1978): Luminescence of quartz activated with manganese ions. Sov. Phys. J., 21: 946-947.MacLellan H.E., Trembath T.T. (1991): The role of quartz crystallization in the development and preservation of
igneous texture in granitic rocks: Experimental evidence at 1 kbar. Amer. Mineral., 76: 1291-1305.Magnus M. and Götze (1998): Mineral composition of Lower Turonian sandstones of the Elbe Zone (Germany):
evidence from combined CL and image analysis. Zbl. Geol. Paläont. Teil 1, 11/12: 1255-1262.Marfunin A.S. (1979a): Physics of Minerals and Inorganic materials. Springer, Berlin.Marfunin A.S. (1979b): Spectroscopy, luminescence and radiation centres in minerals. Translated from Russian
by V.V. Schiffer, Springer, Berlin, 352 pp.Marfunin A.S. (1995): Advanced Mineralogy. Vol.2 – Methods and instrumentations: Results and recent
developments. Springer, Berlin Heidelberg New York.Martin J. and Armington A. (1983): Effect of growth rate on quartz defects. J. Cryst. Growth, 62: 203.Maschmeyer D. and Lehmann G. (1983a): New hole centres in natural quartz. Phys. Chem. Minerals, 10: 84-88.Maschmeyer D. and Lehmann G. (1983b): A trapped-hole centre causing rose coloration of natural quartz. Z.
Kristallogr. 163: 181-196.Marshall D.J. (1988): Cathodoluminescence of geological materials. Allen & Unwin Inc., Winchester/Mass.,
146 pp.Matter A. and Ramseyer K. (1985): Cathodoluminescence microscopy as a tool for provenance studies of
sandstones. In: Zuffa G.G. (ed.): Provenance of arenites. Dordrecht Reidel, pp. 191-212.McKinlay S. (1993): Geology of the Carcoar Granite, Blayney. BSc(Hons) thesis, The University of New South
Wales, Sydney (unpubl.).

201
McLaren A.C., Phakey P.P. (1966): Transmission electron microscope study of bubbles and dislocations inamethyst and citrine quartz. Aust. J. Phys., 19: 19-24.
McLaren A.C., Cook R.F., Hyde S.T., Tobin R.C. (1983): The mechanisms of the formation and growth of waterbubbles and associated dislocation loops in synthetic quartz. Phys. Chem. Minerals, 9: 79-94.
Medlin W.L. (1964): Trapping centers in thermoluminescent calcite. Phys. Rev. 135: 1770-1779.Merino E., Harvey C., and Murray H.H. (1989): Aqueous-chemical control of the tetrahedral-Aluminium content
of quartz, halloysite, and other low-temperature silicates. Clays and Clay Minerals 37/2: 135-142.Merlet C. and Bodinier J.-L. (1990): Electron microprobe determination of minor and trace transition elements in
silicate minerals: A method and its application to mineral zoning in the peridotite nodule PHN 1611.Chemical Geol. 83: 55-69.
Michalske A. and Freiman W. (1982): A molecular interpretation of stress corrosion in silica. Nature 295: 511-512.
Miller J.C. and Miller J.N. (1988): Basic statistical methods for analytical chemistry: Part I: Statistics of repeatedmeasurements. A review. Analyst, 113: 1351-1356.
Miller J.N. (1991): Basic statistical methods for analytical chemistry: Part 2: Calibration and regression methods.Analyst, 116: 3-14.
Milliken K.L. (1994): Cathodoluminescent textures and the origin of quartz silt in Oligocene mudrocks SouthTexas . J. Sed. Res., 64A: 567-571.
Müller A. (1995): Untersuchung magmatischer, metamorpher und hydrothermaler Quarze aus der Oberpfalz mitthermischer Schallemissionsanalyse. Diploma , Universität Göttingen, 61 pp.
Müller A. and Behr H.J. (1997): The lacquer peels method and cathodoluminescence applied to quartz ingranites and rhyolites. IAVCEI Abstracts, Puerto Vallarta, Mexico, p 101.
Müller A. and Seltmann R. (1999): The genetic significance of snowball quartz in high fractionated tin granitesof the Krušne Hory/Erzgebirge. In: Stanley et al.: Mineral deposits: processes to processing . Volume 1,Balkema, Rotterdam, pp. 409-412.
Müller A., Seltmann R. and Behr H.-J. (2000a): Application of cathodoluminescence to magmatic quartz in a tingranite – case study from the Schellerhau Granite Complex, Eastern Erzgebirge, Germany. MineraliumDeposita, 35/2-3: 169-189.
Müller A., Trzebski, R. and Lennox P. (2000b): Magma crystallisation, emplacement and deformation of S- andI-type granitoids in the Eastern Lachlan Fold (SE Australia) as constrained by quartz cathodoluminescenceand Al-in-hornblende barometry. (in prep.).
Müller A. and René M. (2000): Cathodoluminescence microcharaterization of magmatic quartz of the topaz-bearing granites from the tin ore deposit Krásno (Slavkovský Les Mts., Czech Republic). Terra Nova (inreview).
Nassau K. and Prescott B.E. (1975): A reinterpretation of smoky quartz. Phys. Stat. Sol. (A) 29: 659-663.Neuser R. D. (1988): Zementstratigraphie und Kathodolumineszenz des Korallenoolith (Malm)
imSüdniedersächsischen Bergland. Bochumer geol. u. geotechn. Arb . 32: 172.Neuser R. D., Bruhn F., Götze J., Habermann D. and Richter D. K. (1995): Kathodolumineszenz: Methodik und
Anwendung. Zbl. Geol. Paläont. Teil 1 , 1/2: 287-306.Neuser R.D., Richter D.K., Vollbrecht A. (1988): Natural quartz with brown/violet cathodoluminescence -
Genetic aspects evident from spectral analysis. Zbl. Geol. Paläont. Teil 1 , 7/8: 919-930.Nicolas A. and Poirier J.P. (1976): Crystalline plasticity and solid state flow in metamorphic rocks. Wiley
London, 444 pp.Nishikawa H., Shiroyama Y., Nakamura R., Ohki Y., Nagasawa K., Hama Y. (1992): Photoluminescence from
defect centers in high-purity silica glasses oberserved under 7.9-eV excitation. Phys. Rev. B 45/2: 586-591.Nuttall R.H.D. and Weil J.A. (1980): Two hydrogenic trapped-hole species in α-quartz. Solid State Commun. 33:
99-102.Nuttall R.H.D., Weil J.A. (1981): The magnetic properties of the oxygen-hole aluminium centers in crystalline
SiO2. I. [Al4O]0. Canad. J. Phys. 59: 1696-1708.O’Keeffe M. and Hyde B.G. (1978): On Si-O-Si configurations in silicates. Acta Crystallogr. B34: 27-32.O’Reilly E.P. and Robertson J. (1983): Theory of defects in vitreous silicon dioxide. Phys. Rev. B 27: 3780-
3795.Owen M.R. (1984): Southern source of the Jackford sandstone determined by petrography, cathodoluminescence
of quartz, and hafnium content of zircons. Abstracts with Programs 16, Boulder, Co: Geol. Soc. Amer., p.616.
Owen M.R. (1988): Radiation-damage halos in quartz. Geology, 16: 529-532.Owen M.R. (1991): Application of cathodoluminescence to sandstone provenance. In: Barker E., Kopp O.C.
(eds.): Luminescence microscopy and spectroscopy. Quantitative and qualitative applications. Soc. Sed.Geol., Tulska Oklahoma, p. 67-75.
Packham G.H. (1999): Radiometric evidence for Middle Devonian inversion of the Hill End Trough, northeastLachlan Fold Belt. Australian Journal of Earth Sciences, 46: 23-33.
202
Pagel M., Barbin V., Blanc P., Ohnenstetter D. (2000): Cathodoluminescence in Geosciences. Springer, BerlinHeidelberg New York, 514 pp.
Pälchen W. (1968): Zur Geochemie und Petrologie der postorogenen variszischen Magmatite des sächsischenOsterzgebirges . Thesis, TU Bergakademie Freiberg, 142 pp.
Pälchen W., Ossenkopf P. (1967): Über das relative Alter des Schellerhauer Granitmassivs und seinerVarietäten. Ber deutsch Ges geol Wiss B, Miner. Lagerstättenf., 12/4: 359-371.
Pankrath R. (1988): Spurenelementeinbau in Tief-Quarz als Funktion der Wachstumsbedingungen undUmprägungen unter trockenen und hydrothermalen Bedingungen. Thesis, Ruhr-Universität Bochum,Germany.
Parks G.A. (1984): Surface and interfacial free energies of quartz. J. Geophys. Res., 89/B6: 3997-4008.Passchier C.W. and Trouw R.A.J. (1998): Microtectonics. Springer Verlag, Berlin Heidelberg New York.Paterson S.R., Tobisch O.T., Morand V.J. (1990): The influence of large ductile shear zones on the emplacement
and deformation of the Wyangala Batholith, SE Australia . J. Struct. Geol., 12: 639-650.Paterson S.R., Vernon R.H., Tobisch O.T. (1989): A review of criteria for determining magmatic and solid-state
foliations in granitoids. J. Struct. Geol., 11: 349-363.Pearce T.H. (1993): A simple deterministic model of oscillatory zoning in magmatic plagioclase. Geol. Assoc.
Can. – Mineral. Assoc. Can., Program Abstr. 18, p. A-81.Pearce T.H. and Kolisnik A.M. (1990): Observations of plagioclase zoning using interference imaging. Earth-
Science Reviews, 29: 9-26.Perny B., Eberhardt P., Ramseyer K., Mullis J., Pankrath R. (1992): Microdistribution of aluminium, lithium and
sodium in a quartz: possible causes and correlation with shored lived cathodoluminescence. Amer. Mineral.,77: 534-544.
Pfenninger H. (1961): Diffusion von Kationen und Abscheidung von Metallen in Quarz unter elektrischerFeldeinwirkung. Thesis, Universität Zürich, Switzerland.
Picouet P.A. (1999): Cathodoluminecence spectroscopy and the orientation of a hydrothermal quartz crystal.Schweiz. Mineral. Petrol. Mitt., 79: 455-460.
Pitfield P.E.J., Teoh L.H., Cobbing E.J. (1990): Textural variation and tin mineralization in granites from theMain Range Province of the Southeastern Asian Tin Belt. Geol. J., 25: 419-429.
Plesch R. (1982): Auswerten und Prüfen in der Röntgenspektrometrie. G-I-T Verlag Ernst Giebeler, Darmstadt,147 pp.
Plimer I.R. (1987): Fundamental parameters for the formation of granite-related tin deposits . Geol. Rundschau,76/1: 23-40.
Plötze M. (1995): Investigation of quartz, scheelite and fluorite from hydrothermal rare-metal deposits by EPR(in German). Thesis, TU Bergakademie Freiberg, 141 pp.
Poirier J.P. and Guillope M. (1979): Deformation-induced recrystallisation of minerals. Bull. Mineral., 102: 67-74.
Pott G.T. and McNicol B.D. (1971): Spectroscopy study of the coordination and valence of Fe and Mn ions inand on the surface of aluminas and silicas. Disc. Faraday Soc. 52: 121-131.
Potts P.J., Bowles J.F.W., Reed S.J.B., and Cave M.R. (1995): Microprobe techniques in the earth sciences. TheMineralogy Society Series, vol. 6, Chapman and Hall, London, 419 pp.
Poty B. (1969): La croissance des cristaux de quartz dans les filons sur l’exemble du filon de la Gardette (Bourgd’Oisans) et des filons du massif du Mont-Blanc. Thesis, University of Nancy, France, 162 pp.
Poutiainen M., Scherbakova T.F. (1998): Fluid and melt inclusion evidence for the origin of idiomorphic quartzcrystals in topaz-bearing granite from the Salmi batholith, Karelia, Russia. Lithos, 44: 141-151.
Powell C.McA. (1984): Ordovician to earliest Silurian: marginal sea and island arc. In: Veevers J.J. (ed.):Phanerozoic Earth History of Australia. Oxford University Press, Oxford, 29-309.
Powell C.McA., Cole J.P., Cudahy T.J. (1985): Megakinking in the Lachlan Fold Belt, Australia. In: HancockP.L. and Powell C.McA. (eds.): Multiple Deformation in Ductile and Brittle Rocks. J. Struct. Geology, 7:281-300.
Rakov L.T., Kuvshinova K.A., Moiseev B.M., Pleskova M.A., Kandinov M.N. (1991): Typomorphic propertiesof Ti centres in quartz (in Russian). Dokl. Akad. Nauk SSSR, 317: 181-185.
Ramseyer K., Baumann J., Matter A., and Mullis J. (1988): Cathodoluminescence colours of a-quartz. Miner.Magazine, 52: 669-677.
Ramseyer K. and Mullis J. (1990): Factors influencing short-lived blue cathodoluminescence of a-quartz. Amer.Miner., 75: 791-800.
Reed S.J.B. (1996): Electron microprobe analysis and scanning electron microscopy in geology. CambridgeUniversity Press, Cambridge, 201 pp.
Reimer L. (1985): “SEM” – Physics of image formation of microanalysis. Springer Verlag, Berlin-Heidelberg-New York-Tokyo.
Remond G. (1977): Applications of cathodoluminscence in mineralogy. J. Luminescence, 15/2: 121-155.

203
Remond G., Le Gressus C., Okuzumi H. (1979): Electron beam effects observed in cathodoluminescence andAuger electron spectroscopy in natural minerals: Evidence for ionic diffusion. Scanning Electron Microsc.,1: 237-244.
Remond G., Cesbron F., Chapoulie R., Ohnenstetter D., Rouques-Carmes C. and Schvoerer M. (1992):Cathodoluminescence applied to the microcharacterization of mineral materials: a present status inexperimentation and interpretation. Scanning Microsc., 6/1: 23-69.
René M. (1998): Development of topaz-bearing granites of the Krudum massif (Karlovy Vary pluton). ActaUniv. Carolinae, Geol., 42/1: 103-109.
Renno A. (1997): Zur Petrogenese der Albitgranite von Abu Dabbab und Nuweibi . Thesis. Berlin: Techn. Univ.,Logos-Verl. D 83.
Richter D.K. and Zinkernagel U. (1975): Petrographie des „Permoskyth“ der Jaggl-Plawen-Einheit (Südtirol)und Diskussion der Detritusherkunft mit Hilfe von Kathoden-Lumineszenz-Untersuchungen. Geol. Rdsch.,64: 783-807.
Rink W.J., Rendell H., Marseglia E.A., Luff B.J., and Townsend P.D. (1993): Thermoluminescence Spectra ofigneous quartz and hydrothermal quartz. Phys. Chem. Minerals, 20: 353-361.
Rinneberg H., Weil J.A. (1972): EPR studies of Ti3+-H+ centers in X-irradiated –quartz. J. Chem. Phys., 56:2019-2028.
Rovetta M.R., Blacic J.D., Hervig R.L. and Holloway J.R. (1989): An experimental study of hydroxyl in quartzusing infrared spectroscopy and ion microprobe techniques. J. Geophys. Res., 94: 5840-5850.
Rub M.G., Stemprok M., Rub M.G. (1997): On the tantalum mineralization in the rare metal granites of theCinovec massif (Czechia). Dokl. Akad. Nauk ., 352: 795-798 (in Russian).
Rumyantsev V. and Novozhilov A. (1980): Dependence on concentration of aluminium centres and anomalouspleochroism on certain crystallisation parameters in synthetic quartz. Sov. Phys. Crystallography, 25: 75.
Ruppert L.F. (1987): Applications of cathodoluminescence of quartz and feldspar to sedimentary petrology.Scanning Microscopy, 1: 63.
Scala C.M. and Hutton D.R. (1976): Site assignment of Fe3+ in α-quartz. Physica Status Solidi, B73: K115-K117.
Scheibner E. (1998): In: Basden H. (ed.): Geology of New South Wales – Synthesis. Volume 2. - GeologicalSurvey of New South Wales, Memoirs in Geology 13.
Schilka W., Baumann L. (1996): Metasomatische Prozesse im Schellerhauer Granitmassiv (Osterzgebirge).Freib. Forsch.-H., C467: 151-175.
Schmidt W. (1992): Amphibole composition in tonalite as a function of pressure: an experimental calibration ofthe Al-in-hornblende barometer. Contrib. Mineral. Petrol., 110: 304-310.
Schmidt-Mumm A. (1991): Low frequency acoustic emission from quartz upon heating from 90-610°C. Phys.Chem. Minerals, 17: 545-553.
Schmidt-Mumm A. and Behr H.-J. (1987): Fluid systems in metaplaya sequences in the Damara Orogen(Namibia): Evidence for sulphur-rich brines – general evolution and first results . Chem. Geol., 61: 135-145.
Schneider N. (1993): Das lumineszenzaktive Strukturinventar von Quarzphänokristen in Rhyolithen. GöttingerArb. Geol. Paläont., 60: 81 pp.
Schrön W., Schmädicke E., Thomas R., Schmidt W. (1988): Geochemische Untersuchungen anPegmatitquarzen. Z. geol. Wiss., 16: 229-244.
Schust F. (1980): Zum Zusammenhang zwischen der paläogeographischen Entwicklung und der Intrusionstiefeder Granite im Osterzgebirge. Z. angew. Geol. 26/8: 405-411.
Schust F., Thomas U., Schwandke E. (1991): Erkenntnisfortschritte zur Geologie des Harzes. Z. geol. Wiss.19/6: 625-635.
Schwartz M.O. (1992): Geochemical criteria for distinguishing magmatic and metasomatic albite-enrichment ingranitoids – examples from the Ta-Li granite Yichun (China) and the Sn-W deposit Tikus (Indonesia).Mineralium Deposita, 27: 101-108.
Seim R., Eidam J., Korich D. (1982): Zur Elementverteilung in einem Zinngranit (SchellerhauerMassiv/Osterzgebirge). Chem Erde, 41: 219-235.
Seltmann R. (1994): Sub-volcanic minor intrusions in the Altenberg caldera and their metallogeny. In: SeltmannR., Möller P., Kämpf H. (eds.): Metallogeny of Collisional Orogens. Czech Geological Survey Prague, pp198-206.
Seltmann R., Bankwitz P., Frischbutter A., Thomas R. (1992): Metallogenic position of breccia-related granitebodies and tin ore deposits at the north-western border of the Bohemian Massif (Krusne Hory - Krasny Lesarea). In: Kukal Z. (ed.): Proceed 1st Internat Conf Bohemian Massif in Prague 1988. Czech Geol SurveyPrague: pp 257-268.
Seltmann R., Stemprok M. (1994): Textural evidence for the existence of two-phase granites in the youngerintrusive complex granites of the Krusne Hory/Erzgebirge Province. J. of the Czech Geol. Soc., 39/1: 103-104.
Seltmann R., Stemprok M., Müller A. (2000): Textures of rare-metal granites as exploration tool. ExtendedAbstract. Proceed. 31st IGC, Rio de Janeiro (in print).

204
Serebrennikov A.I., Valter A.A., Mashkovtsev R.I., Shscherbakova M.Ya. (1982): The investigation of defectsin shock-metamorphosed quartz. Phys. Chem. Minerals, 8: 153-157.
Shore M., Fowler A.D. (1996): Oscillatory zoning in minerals: a common phenomenon. Canadian Mineral. 34:1111-1126.
Sibley D.F., Vogel T.A., Walker B.M., Byerly G. (1976): The origin of oszillatory zoning in plagioclase: Adiffusion and growth controlled model. Amer. J. Sci. 276: 275-284.
Siebel W., Trzebski R., Stettner G., Hecht L., Casten U., Höhndorf A., Müller P. (1997): Granitoid magmatismof the NW Bohemian massif relealed: gravity data, composition, age relations and phase concept. Geol.Rdsch., Suppl., 86:45-63.
Siebers F.B., Giese U., Flörke O.W. (1984): Growth of doped quartz and the anisotropy of impurity distribution.Zeitschrift für Kristallographie, 167: 189-190.
Siebers F.B. and Klapper H. (1984): Zelluläres Wachstum und Verunreinigungsverteilung im Zuchtquarz,aufgezeigt mit Röntgentopographie. Zeitschrift für Kristallographie, 167: 177-178.
Siebers F.B. (1986): Inhomogene Verteilung von Verunreinigungen in gezüchteten und natürlichen Quarzen alsFunktion der Wachstumsbedingungen und ihr Einfluß auf kristallphysikalische Eigenschaften. Thesis, Ruhr-Universität Bochum, Germany, 133 pp.
Siegel G.H. and Marrone M.J. (1981): Photoluminescence in as-drawn and irradiated silica optical fibers: Anassessment of the role of nonbridging oxygen defect centres. J. Non-Cryst. Solids 45: 235-247.
Simakin A.G. (1984): A simple quantitive model of rhythmic zoning in crystals. Geochem. Int., 21: 13-26.Simpson C. (1985): Deformation of granitic rocks across the brittle-ductile transition. J. Struct. Geol., 7: 503-
511.Singer B.S., Dunger M.A., Layne G.D. (1995): Textures and Sr, Ba, Mg, Fe, K, and Ti compositional profiles in
volcanic plagioclase: Clues to the dynamics of calc-alkaline magma chambers. American Mineralogist, 80:776-798.
Sippel R.F. (1965): Simple device for luminescence petrography. Rev. Sci. Instrum., 36: 1556-1558.Sippel R.F. (1968): Sandstone petrology. Evidence from luminescence petrography. J. Sed. Petrol., 38: 530-554.Skuja L. and Trukhin A. (1989): Comment on the “Luminescence of fused silica: Observation of the O2-
emission band”. Phys. Rev. B, 39: 3909.Smith J.V. and Stenstrom R.C. (1965): Electron-excited luminescence as a petrologic tool. J. Geol., 73: 627-635.Smith R.E. (1969): Zones of progressive regional burial metamorphism in part of the Tasman Geosyncline,
Eastern Australia. J. Petrol., 10: 144-163.Sonyushkin V.E., Sukhorukov Y.T., Scherbakova T.F. (1991): P-T enviroment of crystallization of quartz in
granites of the Salmi batholith, Russian Karelia. In: Haapala I. and Rämö O.T. (eds.): Symposium onRapakivi Granites and Related Rocks, p. 47. Geol. Surv. Finland Guide, vol. 34.
Spengler E. (1949): Über die Abtragung des variszischen Gebirges in Sachsen. Abh. Geol. Landesanst., Berlin,212 p.
Sprunt E. (1979): Microcracking and healing in granites: New evidence from cathodoluminescence. Science,205: 495-497.
Sprunt E. (1981): Causes of quartz cathodoluminescence colors. Scan. Electron Micr., 1981: 525-535.Spry A. (1969): Metamorphic textures. Pergamon Press, Oxford, 352 pp.Stemprok M. (1986): Petrology and geochemistry of the Czechoslovak part of the Krusne hory Mts. granite
pluton. Sbor. geol. ved. L GM , 27: 111-156.Stemprok M. (1993): Magmatic evolution of the Krusne Hory–Erzgebirge batholith. Z. geol. Wiss., 21/1-2: 237-
245.Stemprok M., Novak J.K., David J. (1994): The association between granites and tin-tungsten mineralization in
the eastern Krusne hory (Erzgebirge), Czech Republic. In: von Gehlen K., Klemm D.D. (eds.): MonographSeries on Mineral Deposits 31. Gebr. Boerntraeger, Berlin Stuttgart, pp. 97-129.
Stemprok M., Sulcek Z. (1969): Geochemical profile through an ore-bearing lithium granite. Econ. Geol., 64:392-404.
Stenina N.G., Bazarov L.S., Shcherbakova M.Y., Mashkovtsev R.I. (1984): Structural state and diffusion ofimpurities in natural quartz of different genesis . Phys. Chem. Minerals, 10: 180-186.
Stenina N.G., Sotnikov V.I., Korolyuk V.N., Kovaleva L.T. (1988): Microstructural features of hydrothermalvein quartz as an indicator of mineralization. Geokhimiya, 5: 641-653, (English translation).
Stenina N.G. (1995): Energy aspect in the formation of granitic magma and ore deposits. In: Pašava J., Kribek B.and Zák K. (eds): Mineral deposits: from their origin to their environmental impacts. Balkema, Rotterdam,pp. 539-542.
Sterner S.M. and Bodnar R.J. (1989): Synthetic fluid inclusions – VII. Re-equilibration of fluid inclusions inquartz during laboratory-simulated metamorphic burial and uplift. J. Metamorphic Geol., 7: 243-260.
Stoecklein W. and Gobel R. (1992): Application of cathodoluminescence in paint analysis. ScanningMicroscopy, 6: 669-678.
Stünitz H. (1998): Syndeformational recrystallisation – dynamic or compositionally induced? Contrib. Mineral.Petrol., 131: 219-236.

205
Suttner L.J. and Leininger R.K. (1972): Comparison of the trace element content of plutonic, volcanic, andmetamorphic quartz from southwestern Montana. Geol. Soc. Am. Bull., 83: 1855-1862.
Swanson S.E. (1977): Relation of nucleation and crystal-growth rate to the development of granitic textures.Amer. Mineral., 62: 966-978.
Swanson S.E. and Fenn P.M. (1986): Quartz crystallization in igneous rocks. Amer. Mineral., 71: 331-342.Thomas R. (1992): Results of investigations on melt inclusions in various magmatic rocks from the northern
border of the Bohemian Massif. In: Kukal Z. (ed.) Proceed 1st Internat Conf Bohemian Massif in Prague1988, Czech Geol Surv Prague, pp 298-306.
Thomas R. (1994a): Fluid evolution to the emplacement of the Variscan granites in the Erzgebirge region: areview of the melt and fluid inclusion evidence. In: Seltmann R, Möller P, Kämpf H (eds.): Metallogeny ofCollisional Orogens. Czech Geological Survey Prague, pp 70-82.
Thomas R (1994b) Estimation of water content of granitic melts from inclusion data. In: Seltmann R, Möller P,Kämpf H (eds.): Metallogeny of Collisional Orogens. Czech Geological Survey Prague, pp 224-229.
Thomas W.M. and Ernst W.G. (1990): The aluminium content of hornblende in calc-alkaline granitic rocks: Amineralogic barometer calibrated experimentally to 12 kbars. - In: Spencer R.J. and I-Ming Chou (eds.):Fluid-mineral interactions: A tribute to H.P. Eugster. The Geochemical Society, Special Publication 2, 59-63.
Tischendorf G (1964) Stand der Kenntnisse bei der Suche nach Zinnlagerstätten im Osterzgebirge. Zeitschrift fürAngewandte Geologie 10/5: 225-238
Tischendorf G., Förster H.J. (1990): Acid magmatism and related metallogenesis in the Erzgebirge. Geol. J., 25:443-454.
Tobisch O.T. and Paterson S.R. (1990): The Yarra granite: An intradeformational pluton associated with ductilethrusting, Lachlan Fold Belt, southeastern Australia. Geol. Soc. Am. Bull., 102: 693-703.
Toramaru A. (1991): Model of nucleation and growth of crystla in cooling magmas. Contrib. Mineral. Petrol.,108: 106-117.
Tovey N.K. and Krinsley D.H. (1980): A cathodoluminescent study of quartz sand grains. J. Microscopy, 120:279-289.
Townsend P.D. and Rowlands A.P. (2000): Information encoded in cathodoluminescence emission spectra. In:Pagel M., Barbin V., Blanc P., Ohnenstetter D. (eds.): Cathodoluminescence in Geosciences. Springer, BerlinHeidelberg New York, pp. 41-57.
Trukhin A.N. and Plaudis A.E. (1979): Investigation of intrinsic luminescence of SiO2. Sov. Phys. Solid State,21/4: 644-646.
Trzebski R., Lennox P., Palmer D. (1999): Contrasts in morphogenesis and tectonic setting duringcontemporaneous emplacement of S- and I-type granitoids in the Eastern Lachlan Fold Belt, southeasternAustralia. In: Castro A., Fernandez C., Vigneresse J.L. (eds.): Understanding Granites: Integrating New andClassical Techniques. Geol. Soc., London, Sp. Publ., 158: 123-140.
Tsinober L. and Kamentsev I. (1964): Effect of growth rate on the concentration of centers of smoky color andon the unit cell parameters of synthetic quartz crystals. Sov. Phys. Crystallography, 9: 374.
Urai J.L. (1983): Water assisted dynamic recrystallization and weakening in polycrystalline bischofite.Tectonophysics, 96: 125-127.
Urai J.L. and Humphreys F.J. (1981): The development of shear zones in polycrystalline camphor.Tectonophysics, 78: 677-685.
Valley J.W. and Graham C.M. (1996): Ion microprobe analysis of oxygen isotope ratios in quartz from Skyegranite: healed micro-cracks, fluid flow, and hydrothermal exchange. Contrib. Mineral. Petrol., 124: 225-234.
Vernon R.H. and Flood R.H. (1988): Contrasting deformation of S- and I-type granitoids in the Lachlan FoldBelt, eastern Australia. Tectonophysics, 147: 127-144.
Voll G. (1976): Recrystallization of quartz, biotite and feldspars from Erstfeld to the Leventina Nappe, SwissAlps, and ist geological significance. Schweiz. mineral. Petrogr. Mitt., 56: 641-47.
Voll G. (1980): Ein Querprofil durch die Schweizer Alpen vom Vierwaldstätter See zur Wurzelzone –Strukturen und ihre Entwicklung durch Deformationsmechanismen wichtiger Minerale. N. Jb. Geol. Pal.Abh., 160: 321-335.
Walker G. (1985): Mineralogical applications of luminescence technique. In: Berry F.J., Vaughan D.J. (eds.):Chemical bonding and spectroscopy in mineral chemistry. Chapman and Hall, London, 103-140.
Watt G.R., Wright P., Galloway S., McLean C. (1997): Cathodoluminescence and trace element zoning in quartzphenocrysts and xenocrysts. Geochim Cosmochim Acta, 61: 4337-4348.
Waychunas G.A. (1988): Luminescence, X-ray emission and new spectroscopies. In: Hawthorne F.C. (ed.)Spectroscopic methods in mineralogy and geology. Rev. Miner. 18: 639-698.
Weeks R.A: (1994): The many varieties of E‘ centres: a review. J. Non-Cryst. Solids, 179: 1-9.Weil J.A: (1984): A review of electron spin spectroscopy and its application to the study of paramagnetic defects
in crystalline quartz. Phys. Chem. Minerals, 10: 149-165.
206
Wiebe R.A. (1968): Plagioclase stratigraphy: A record of magmatic conditions and events in a granite stock. Am.J. Sci., 266: 690-703.
Wilkins C. and Smart G. (1997): Browns Creek gold-copper deposit. In: Berkmann D.A. and Mackenzie D.H.(eds.): Geology of Australian and Papua New Guinean Mineral Deposits. The Australian Institute of Miningand Metallurgy, Melbourne, 575-580.
Williamson B.J., Stanley C.J., Wilkinson J.J. (1997): Implications from inclusions in topaz for greisenisation andmineralisation in the Hensbarrow topaz granite, Cornwall, England. Contrib. Mineral. Petrol., 127: 119-128.
Winslow D.M., Bodnar R.J., and Tracy R.J. (1994): Fluid inclusion evidence for an anticlockwise metamorphicP-T path in central Massachusetts. J. Metamorphic Geology, 12: 361-371.
Wyborn D. and Henderson G.A.M. (1996): Notes to accompany geological map Blayney 1 : 100000 sheet area.Australian Geol. Surv. Organisation Report, 56.
Yang X.H. and McKeever S.W.S. (1990): The pre-dose effect in crystalline quartz. J. Phys. D: Appl. Physics,23: 237-244.
Yang X.H., Townsend P.D., Holgate S.A. (1994): Cathodoluminescence and depth profiles of tin in float glass.J. Phys. D, 27: 1757.
Yin L., Pollard P.J., Hu Shouxi, Taylor R.G. (1995): Geologic and geochemical characteristics of the Yichun Ta-Nb-Li deposit, Jiangxi Province, South China. Economic Geology, 90/3: 577-585.
Yoder H.S. (1950): High-low quartz inversion up to 10,000 bars. Transactions Amer Geophys Union, 31: 827.Ziebold T.O. (1967): Precision and sensitivity in electron microprobe analysis. Anal. Chem., 39: 858-861.Zinkernagel U. (1978): Cathodoluminescence of quartz and its application to sandstone petrology. Contrib.
Sedimentology, 8: 1-69.

207
Appendix A
List of CL emission band parameters of quartz
Sample 1.73 eV - Band 1.84 eV - BandPosition Sigma Half-width If If (%) Position Sigma Half-width If If (%)
(eV) (eV) (eV) (eV) (eV) (eV)1 Megaquartz 1.74 0.13 0.3 5000 4.3 1.84 0.095 0.22 3500 3.0
1.74 0.13 0.3 8600 13.0 1.84 0.095 0.22 5000 7.61.73 0.13 0.3 10500 17.5 1.84 0.095 0.22 8000 13.4
2 Fissile Quartz 1.74 0.14 0.32 5500 9.0 1.84 0.095 0.22 3000 4.91.74 0.14 0.32 7700 12.3 1.84 0.095 0.22 3700 5.91.74 0.13 0.3 11500 16.5 1.84 0.095 0.22 5000 7.2
3 Oil-bearing 1.735 0.13 0.31 6500 7.5 1.84 0.095 0.22 3500 4.1 Quartz 1.735 0.13 0.31 13000 15.7 1.84 0.095 0.22 6000 7.3
1.735 0.13 0.31 17000 22.7 1.84 0.095 0.22 8000 10.7
4 Schoenfeld 1.73 0.13 0.3 5000 4.6 1.845 0.095 0.23 8000 7.3Rhyolite 1.73 0.13 0.3 7500 7.4 1.845 0.095 0.23 9000 8.8
1.73 0.13 0.3 11000 10.8 1.845 0.095 0.23 9600 9.5
5 Teplice Rhyolite 1.73 0.13 0.3 3714 7.2 1.84 0.095 0.22 1864 3.6blue CL/ 1.73 0.13 0.3 5200 10.6 1.84 0.095 0.22 2200 4.5phenocryst 1.73 0.13 0.3 7000 13.5 1.84 0.095 0.22 3000 5.8
5 Teplice Rhyolite 1.73 0.125 0.3 39600 36.1 1.835 0.095 0.23 8500 7.7red CL/ 1.735 0.125 0.29 38000 34.9 1.835 0.095 0.23 9600 8.8phenocryst 1.73 0.13 0.3 36000 31.1 1.835 0.095 0.23 14000 12.1
6 Schellerhau Granite 1.735 0.125 0.29 9000 7.0 1.837 0.095 0.23 5000 3.9blue CL/ 1.735 0.125 0.29 12000 10.1 1.837 0.095 0.23 6000 5.0phenocryst 1.735 0.13 0.31 15500 14.3 1.84 0.095 0.22 7700 7.1
6 Schellerhau Granite 1.734 0.125 0.28 12000 14.3 1.84 0.095 0.22 5300 6.3red CL/ 1.734 0.125 0.28 17000 19.1 1.84 0.095 0.22 7000 7.9phenocryst 1.735 0.13 0.31 20000 22.2 1.84 0.095 0.22 8800 9.8
6 Schellerhau Granite 1.735 0.13 0.31 5500 7.9 1.836 0.095 0.23 6400 9.2red CL/ 1.735 0.13 0.31 10300 13.4 1.836 0.095 0.23 7500 9.7matrix quartz 1.735 0.13 0.31 13500 17.2 1.84 0.095 0.22 8000 10.2
7 Eibenstock Granite 1.725 0.135 0.31 4500 17.2 1.85 0.095 0.22 1350 5.21.73 0.14 0.32 6000 21.0 1.835 0.09 0.21 1600 5.61.725 0.135 0.31 7000 22.8 1.85 0.095 0.22 2500 8.1
8 Aue Granite 1.73 0.12 0.28 8620 5.9 1.85 0.095 0.22 3080 2.11.73 0.12 0.28 12500 9.1 1.85 0.095 0.22 4000 2.91.73 0.13 0.31 13000 10.9 1.85 0.095 0.22 5000 4.2
9 Vein Quartz 1.7 0.15 0.36 2200 2.8 1.84 0.095 0.22 1 0.01.71 0.15 0.36 2400 5.8 1.84 0.095 0.22 1 0.01.7 0.15 0.36 2420 13.9 1.84 0.095 0.22 1 0.0
10 Wachtelberg 1.73 0.13 0.3 4190 6.1 1.84 0.095 0.22 4325 6.3Rhyolite 1.73 0.13 0.3 4630 7.4 1.84 0.095 0.22 4780 7.7blue CL 1.73 0.13 0.3 4960 8.3 1.84 0.095 0.22 5120 8.5
10 Wachtelberg 1.723 0.125 0.29 5000 9.4 1.84 0.095 0.22 5500 10.3Rhyolite 1.723 0.125 0.29 6000 12.0 1.84 0.095 0.22 5500 11.0red CL 1.73 0.13 0.3 6200 12.7 1.84 0.095 0.22 6400 13.1
11 Beucha Rhyolite 1.73 0.13 0.3 6384 7.6 1.85 0.095 0.22 4910 5.8blue CL 1.73 0.13 0.3 8300 10.8 1.85 0.095 0.22 5400 7.0
1.73 0.13 0.3 10000 13.2 1.85 0.095 0.22 5300 7.0
11 Beucha Rhyolite 1.73 0.13 0.3 6375 10.6 1.84 0.095 0.22 3312 5.5red CL 1.73 0.13 0.3 8287 13.9 1.84 0.095 0.22 3810 6.4
1.73 0.13 0.3 10200 15.9 1.84 0.095 0.22 5300 8.3

208
List of CL emission band parameters of quartz (continued)
Sample 1.73 eV - Band 1.84 eV - BandPosition Sigma Half-width If If (%) Position Sigma Half-width If If (%)
(eV) (eV) (eV) (eV) (eV) (eV)
12 Flossenbuerg 1.73 0.135 0.31 12000 8.0 1.84 0.095 0.22 3500 2.3Granite 1.73 0.135 0.31 8500 6.1 1.832 0.095 0.22 7000 5.0
1.735 0.13 0.3 15000 10.4 1.84 0.095 0.22 10000 7.0
13 Leucosome 1.74 0.13 0.3 5000 6.7 1.84 0.095 0.22 4000 5.4Quartz 1.74 0.13 0.3 7000 8.3 1.84 0.095 0.22 5700 6.8
1.74 0.13 0.3 11500 11.4 1.84 0.095 0.22 8800 8.7
14 Ramberg Granite 1.735 0.13 0.31 7000 6.6 1.84 0.09 0.22 5500 5.21.735 0.13 0.31 11000 11.3 1.84 0.09 0.22 7500 7.71.735 0.13 0.31 15000 10.4 1.84 0.095 0.22 10000 7.0
15 Weinheim 1.735 0.125 0.29 9800 5.1 1.845 0.095 0.22 13000 6.8Rhyolite 1.735 0.125 0.29 12000 6.6 1.845 0.095 0.22 15000 8.3blue CL 1.73 0.13 0.31 14300 8.5 1.845 0.095 0.22 15000 8.9
15 Weinheim 1.73 0.13 0.31 12575 14.9 1.84 0.095 0.22 9494 11.3 Rhyolite 1.73 0.13 0.31 19400 18.4 1.84 0.095 0.22 14160 13.4red CL 1.73 0.13 0.31 21000 20.1 1.84 0.095 0.22 15000 14.4
Sample 1.96 eV - Band 2.15 eV - BandPosition Sigma Half-width If If (%) Position Sigma Half-width If If (%)
(eV) (eV) (eV) (eV) (eV) (eV)
1 Megaquartz 1.96 0.1 0.24 4100 3.5 2.16 0.16 0.38 30000 25.61.96 0.1 0.24 9000 13.6 2.16 0.16 0.38 19500 29.51.96 0.1 0.24 9800 16.4 2.15 0.16 0.38 20300 33.9
2 Fissile Quartz 1.955 0.1 0.23 5000 8.2 2.155 0.16 0.37 12600 20.61.955 0.1 0.23 7000 11.1 2.15 0.16 0.38 14000 22.31.955 0.1 0.23 11000 15.8 2.145 0.16 0.37 16000 22.9
3 Oil-bearing 1.96 0.1 0.24 5300 6.1 2.155 0.175 0.41 22000 25.5 Quartz 1.956 0.1 0.24 12400 15.0 2.15 0.155 0.36 21000 25.4
1.96 0.1 0.24 14500 19.4 2.14 0.16 0.38 20300 27.1
4 Schoenfeld 1.972 0.087 0.2 13700 12.5 2.15 0.16 0.38 17000 15.5Rhyolite 1.972 0.095 0.22 16000 15.7 2.15 0.16 0.38 17000 16.7
1.967 0.1 0.24 19000 18.7 2.15 0.16 0.38 19000 18.7
5 Teplice Rhyolite 1.956 0.09 0.22 3076 5.9 2.15 0.16 0.38 6863 13.2blue CL/ 1.956 0.09 0.22 4000 8.2 2.15 0.16 0.38 7000 14.3phenocryst 1.956 0.1 0.24 7000 13.5 2.16 0.16 0.38 8300 16.0
5 Teplice Rhyolite 1.976 0.085 0.21 18000 16.4 2.14 0.16 0.38 20000 18.2red CL/ 1.97 0.085 0.2 20800 19.1 2.14 0.16 0.38 19800 18.2phenocryst 1.972 0.1 0.24 25500 22.0 2.13 0.16 0.38 25000 21.6
6 Schellerhau Granite 1.957 0.093 0.22 8500 6.6 2.155 0.16 0.37 21000 16.3blue CL/ 1.957 0.1 0.24 13000 10.9 2.15 0.16 0.38 22000 18.5phenocryst 1.957 0.105 0.26 17300 16.0 2.15 0.16 0.38 23300 21.5
6 Schellerhau Granite 1.955 0.095 0.23 9400 11.2 2.15 0.16 0.38 19500 23.3red CL/ 1.954 0.105 0.24 17500 19.7 2.145 0.155 0.37 22000 24.7phenocryst 1.957 0.11 0.26 20500 22.7 2.14 0.16 0.38 23800 26.4
6 Schellerhau Granite 1.968 0.095 0.22 8500 12.2 2.143 0.16 0.37 13800 19.8red CL/ 1.96 0.105 0.24 15300 19.9 2.143 0.16 0.37 17400 22.6matrix quartz 1.962 0.11 0.26 18300 23.3 2.14 0.16 0.38 19000 24.2
7 Eibenstock Granite 1.942 0.09 0.2 1500 5.7 2.136 0.17 0.4 8200 31.41.942 0.09 0.2 2400 8.4 2.136 0.17 0.4 9300 32.61.942 0.09 0.2 2700 8.8 2.122 0.17 0.4 10500 34.1
8 Aue Granite 1.935 0.09 0.21 5140 3.5 2.19 0.152 0.36 53000 36.21.935 0.09 0.21 7200 5.2 2.19 0.152 0.36 48000 35.01.935 0.09 0.21 7700 6.4 2.185 0.155 0.36 46500 38.8

209
List of CL emission band parameters of quartz (continued)
Sample 1.96 eV - Band 2.15 eV - BandPosition Sigma Half-width If If (%) Position Sigma Half-width If If (%)
(eV) (eV) (eV) (eV) (eV) (eV)
9 Vein Quartz 1.95 0.11 0.26 600 0.8 2.17 0.175 0.44 7000 9.01.95 0.11 0.26 600 1.4 2.17 0.175 0.44 5000 12.11.95 0.11 0.26 600 3.4 2.167 0.18 0.41 3150 18.1
10 Wachtelberg 1.962 0.095 0.22 9200 13.4 2.173 0.16 0.38 10500 15.3Rhyolite 1.962 0.095 0.22 10800 17.4 2.173 0.16 0.38 9500 15.3blue CL 1.962 0.1 0.24 12144 20.2 2.17 0.16 0.38 9000 15.0
10 Wachtelberg 1.967 0.089 0.22 13200 24.7 2.163 0.16 0.37 6350 11.9Rhyolite 1.963 0.089 0.22 14200 28.5 2.163 0.155 0.36 5900 11.8red CL 1.962 0.1 0.23 15180 31.1 2.16 0.16 0.38 5700 11.7
11 Beucha Rhyolite 1.95 0.1 0.24 10760 12.8 2.165 0.16 0.38 14020 16.7blue CL 1.95 0.1 0.24 11300 14.7 2.165 0.16 0.38 13600 17.7
1.95 0.1 0.24 14100 18.6 2.16 0.16 0.38 14000 18.5
11 Beucha Rhyolite 1.956 0.1 0.24 8542 14.2 2.16 0.16 0.38 7777 12.9red CL 1.956 0.1 0.24 10250 17.2 2.16 0.16 0.38 8555 14.3
1.956 0.1 0.24 14950 23.4 2.16 0.16 0.38 10500 16.4
12 Flossenbuerg 1.95 0.09 0.22 8000 5.3 2.155 0.16 0.37 29700 19.8Granite 1.95 0.09 0.22 9000 6.5 2.145 0.16 0.37 28700 20.7
1.956 0.1 0.24 15000 10.4 2.14 0.16 0.38 33000 23.0
13 Leucosome 1.96 0.1 0.24 7000 9.4 2.155 0.16 0.37 13200 17.8Quartz 1.96 0.1 0.24 10700 12.7 2.155 0.16 0.37 15300 18.1
1.96 0.1 0.24 15500 15.3 2.14 0.16 0.38 20600 20.4
14 Ramberg Granite 1.958 0.085 0.2 12600 12.0 2.16 0.16 0.38 17400 16.51.962 0.09 0.22 16000 16.4 2.15 0.16 0.38 18500 18.91.956 0.1 0.24 15000 10.4 2.14 0.16 0.38 33000 23.0
15 Weinheim 1.96 0.085 0.2 25500 13.3 2.16 0.16 0.38 19000 9.9Rhyolite 1.96 0.085 0.2 27000 14.9 2.16 0.16 0.38 19000 10.5blue CL 1.955 0.09 0.22 28000 16.6 2.16 0.16 0.38 19000 11.2
15 Weinheim 1.958 0.1 0.24 24333 28.8 2.165 0.16 0.38 9383 11.1 Rhyolite 1.958 0.1 0.24 40200 38.2 2.165 0.16 0.38 12000 11.4red CL 1.958 0.1 0.24 43800 42.0 2.165 0.16 0.38 12200 11.7
Sample 2.47 eV - Band 2.58 eV BandPosition Sigma Half-width If If (%) Position Sigma Half-width If If (%)
(eV) (eV) (eV) (eV) (eV) (eV)
1 Megaquartz 2.44 0.15 0.36 48300 41.2 2.58 0.08 0.18 3400 2.92.445 0.14 0.32 16400 24.8 2.58 0.08 0.18 2300 3.52.465 0.125 0.29 11000 18.4 2.58 0.08 0.18 750 1.3
2 Fissile Quartz 2.46 0.137 0.32 14600 23.9 2.58 0.08 0.18 2500 4.12.46 0.13 0.3 12300 19.6 2.58 0.08 0.18 2500 4.02.465 0.125 0.29 11000 15.8 2.58 0.08 0.18 2100 3.0
3 Oil-bearing 2.455 0.15 0.35 25000 29.0 2.58 0.08 0.18 2900 3.4 Quartz 2.455 0.13 0.31 15100 18.3 2.58 0.08 0.18 2400 2.9
2.465 0.125 0.29 9400 12.6 2.58 0.08 0.18 1200 1.6
4 Schoenfeld 2.46 0.122 0.28 18800 17.1 2.58 0.08 0.18 5000 4.6Rhyolite 2.46 0.122 0.28 15000 14.7 2.58 0.08 0.18 4700 4.6
2.47 0.12 0.28 13800 13.6 2.58 0.08 0.18 3100 3.1
5 Teplice Rhyolite 2.465 0.13 0.31 10715 20.6 2.58 0.08 0.18 1790 3.4blue CL/ 2.465 0.13 0.31 9000 18.4 2.58 0.08 0.18 1700 3.5phenocryst 2.47 0.125 0.3 7900 15.2 2.58 0.08 0.18 1500 2.9
5 Teplice Rhyolite 2.465 0.125 0.29 11000 10.0 2.58 0.08 0.18 1900 1.7red CL/ 2.465 0.125 0.29 10000 9.2 2.58 0.08 0.18 1900 1.7phenocryst 2.47 0.125 0.3 9500 8.2 2.58 0.08 0.18 1600 1.4

210
List of CL emission band parameters of quartz (continued)
Sample 2.47 eV - Band 2.58 eV BandPosition Sigma Half-width If If (%) Position Sigma Half-width If If (%)
(eV) (eV) (eV) (eV) (eV) (eV)
6 Schellerhau Granite 2.463 0.135 0.32 25000 19.4 2.58 0.08 0.18 4500 3.5blue CL/ 2.463 0.135 0.32 20000 16.8 2.58 0.08 0.18 3800 3.2phenocryst 2.47 0.125 0.3 14000 12.9 2.58 0.08 0.18 3000 2.8
6 Schellerhau Granite 2.462 0.13 0.3 14300 17.1 2.58 0.08 0.18 2500 3.0red CL/ 2.462 0.13 0.3 11000 12.4 2.58 0.08 0.18 2200 2.5phenocryst 2.47 0.125 0.3 8700 9.6 2.58 0.08 0.18 1500 1.7
6 Schellerhau Granite 2.465 0.13 0.31 11300 16.2 2.58 0.08 0.18 2700 3.9red CL/ 2.465 0.13 0.31 9300 12.1 2.58 0.08 0.18 2050 2.7matrix quartz 2.47 0.125 0.3 7700 9.8 2.58 0.08 0.18 1500 1.9
7 Eibenstock Granite 2.48 0.11 0.26 2700 10.3 2.58 0.08 0.18 850 3.32.48 0.11 0.26 2400 8.4 2.58 0.08 0.18 820 2.92.48 0.11 0.26 2600 8.5 2.58 0.08 0.18 600 2.0
8 Aue Granite 2.48 0.11 0.26 18000 12.3 2.58 0.08 0.18 6525 4.52.48 0.11 0.26 15300 11.2 2.58 0.08 0.18 6200 4.52.48 0.11 0.26 10500 8.8 2.58 0.08 0.18 5500 4.6
9 Vein Quartz 2.47 0.145 0.34 17000 21.9 2.58 0.08 0.18 4000 5.12.47 0.145 0.34 8500 20.5 2.58 0.08 0.18 2000 4.82.47 0.125 0.3 2700 15.5 2.58 0.08 0.18 700 4.0
10 Wachtelberg 2.465 0.13 0.31 11770 17.1 2.58 0.08 0.18 2500 3.6Rhyolite 2.465 0.13 0.31 9800 15.8 2.58 0.08 0.18 1900 3.1blue CL 2.465 0.13 0.31 9000 15.0 2.58 0.08 0.18 1580 2.6
10 Wachtelberg 2.457 0.137 0.33 7900 14.8 2.58 0.08 0.18 1750 3.3Rhyolite 2.457 0.137 0.33 6500 13.0 2.58 0.08 0.18 1500 3.0red CL 2.465 0.125 0.28 5800 11.9 2.58 0.08 0.18 1000 2.1
11 Beucha Rhyolite 2.485 0.12 0.29 11585 13.8 2.58 0.08 0.18 3043 3.6blue CL 2.485 0.12 0.29 9500 12.3 2.58 0.08 0.18 2800 3.6
2.48 0.12 0.28 9500 12.5 2.58 0.08 0.18 1800 2.4
11 Beucha Rhyolite 2.48 0.125 0.3 10416 17.3 2.58 0.08 0.18 1733 2.9red CL 2.48 0.125 0.3 9166 15.4 2.58 0.08 0.18 1698 2.8
2.48 0.125 0.3 7500 11.7 2.58 0.08 0.18 1300 2.0
12 Flossenbuerg 2.47 0.13 0.3 29700 19.8 2.58 0.08 0.18 5000 3.3Granite 2.47 0.13 0.3 25000 18.0 2.58 0.08 0.18 5000 3.6
2.48 0.125 0.3 22500 15.7 2.58 0.08 0.18 3000 2.1
13 Leucosome 2.47 0.127 0.29 14600 19.7 2.58 0.08 0.18 2500 3.4Quartz 2.47 0.13 0.3 14600 17.3 2.58 0.08 0.18 2700 3.2
2.47 0.125 0.28 15200 15.0 2.58 0.08 0.18 3100 3.1
14 Ramberg Granite 2.465 0.13 0.31 19000 18.0 2.58 0.08 0.18 4000 3.82.465 0.125 0.28 14700 15.0 2.58 0.08 0.18 3200 3.32.48 0.125 0.3 22500 15.7 2.58 0.08 0.18 3000 2.1
15 Weinheim 2.45 0.138 0.32 36000 18.8 2.571 0.08 0.18 10800
5.6
Rhyolite 2.45 0.138 0.32 31400 17.4 2.571 0.08 0.18 10400
5.8
blue CL 2.46 0.135 0.32 28000 16.6 2.58 0.08 0.18 7600 4.5
15 Weinheim 2.46 0.125 0.3 11875 14.1 2.58 0.08 0.18 2717 3.2 Rhyolite 2.46 0.125 0.3 10000 9.5 2.58 0.08 0.18 2420 2.3
red CL 2.46 0.125 0.3 8200 7.9 2.58 0.08 0.18 1900 1.8

211
List of CL emission band parameters of quartz (continued)
Sample 2.68 eV - Band 2.79 eV - BandPosition Sigma Half-width If If (%) Position Sigma Half-width If If (%)
(eV) (eV) (eV) (eV) (eV) (eV)
1 Megaquartz 2.685 0.1 0.23 11000 9.4 2.79 0.11 0.26 10200 8.72.685 0.1 0.23 4000 6.1 2.79 0.11 0.26 4100 6.22.685 0.1 0.23 3500 5.8 2.79 0.11 0.26 2500 4.2
2 Fissile Quartz 2.685 0.1 0.23 6700 10.9 2.792 0.11 0.26 7300 11.92.685 0.1 0.23 6500 10.4 2.792 0.11 0.26 6800 10.82.685 0.1 0.23 6150 8.8 2.795 0.11 0.26 6200 8.9
3 Oil-bearing 2.685 0.1 0.23 7200 8.3 2.79 0.11 0.26 8700 10.1 Quartz 2.685 0.1 0.23 6000 7.3 2.79 0.11 0.26 6000 7.3
2.685 0.1 0.23 4500 6.0 2.79 0.11 0.26 3500 4.7
4 Schoenfeld 2.685 0.1 0.23 13100 11.9 2.79 0.11 0.26 15200 13.8Rhyolite 2.685 0.1 0.23 11200 11.0 2.79 0.11 0.26 12700 12.5
2.685 0.1 0.23 9800 9.7 2.79 0.11 0.26 10800 10.6
5 Teplice Rhyolite 2.68 0.1 0.24 7060 13.6 2.8 0.11 0.26 8700 16.8blue CL/ 2.68 0.1 0.24 6000 12.2 2.8 0.11 0.26 7100 14.5phenocryst 2.68 0.1 0.24 5700 11.0 2.8 0.11 0.26 6300 12.1
5 Teplice Rhyolite 2.685 0.1 0.23 6000 5.5 2.8 0.11 0.26 5800 5.3red CL/ 2.685 0.1 0.23 6000 5.5 2.8 0.11 0.26 5000 4.6phenocryst 2.685 0.1 0.23 5300 4.6 2.8 0.11 0.26 5500 4.8
6 Schellerhau Granite 2.68 0.1 0.24 15000 11.6 2.8 0.11 0.26 18500 14.3blue CL/ 2.68 0.1 0.24 12100 10.2 2.8 0.11 0.26 14200 11.9phenocryst 2.68 0.1 0.24 9000 8.3 2.8 0.11 0.26 10800 10.0
6 Schellerhau Granite 2.68 0.1 0.24 8000 9.6 2.8 0.11 0.26 8000 9.6red CL/ 2.68 0.1 0.24 5500 6.2 2.8 0.11 0.26 6300 7.1phenocryst 2.68 0.1 0.24 5000 5.5 2.8 0.11 0.26 5000 5.5
6 Schellerhau Granite 2.68 0.1 0.24 6700 9.6 2.8 0.11 0.26 8600 12.4red CL/ 2.68 0.1 0.24 6000 7.8 2.8 0.11 0.26 6700 8.7matrix quartz 2.68 0.1 0.24 4900 6.2 2.8 0.11 0.26 5600 7.1
7 Eibenstock Granite 2.685 0.1 0.23 2200 8.4 2.79 0.105 0.24 2300 8.82.685 0.1 0.23 1980 6.9 2.79 0.105 0.24 2050 7.22.685 0.1 0.23 2000 6.5 2.79 0.105 0.24 1850 6.0
8 Aue Granite 2.685 0.1 0.23 15568 10.6 2.785 0.105 0.24 16436 11.22.685 0.1 0.23 13700 10.0 2.785 0.105 0.24 14300 10.42.685 0.1 0.23 9650 8.1 2.785 0.105 0.24 11200 9.4
9 Vein Quartz 2.685 0.1 0.23 10500 13.5 2.8 0.11 0.26 18000 23.12.685 0.1 0.23 5500 13.3 2.8 0.11 0.26 8500 20.52.685 0.1 0.23 2250 12.9 2.8 0.11 0.26 2600 14.9
10 Wachtelberg 2.685 0.1 0.23 8100 11.8 2.8 0.11 0.26 8100 11.8Rhyolite 2.685 0.1 0.23 6735 10.8 2.8 0.11 0.26 6745 10.9blue CL 2.685 0.1 0.23 6150 10.3 2.8 0.11 0.26 6160 10.3
10 Wachtelberg 2.685 0.1 0.23 4700 8.8 2.8 0.11 0.26 5400 10.1Rhyolite 2.685 0.1 0.23 3800 7.6 2.8 0.11 0.26 4400 8.8red CL 2.685 0.1 0.23 4000 8.2 2.8 0.11 0.26 3900 8.0
11 Beucha Rhyolite 2.685 0.1 0.23 9195 10.9 2.79 0.11 0.26 11850 14.1blue CL 2.685 0.1 0.23 8000 10.4 2.79 0.11 0.26 9000 11.7
2.685 0.1 0.23 6500 8.6 2.79 0.11 0.26 7600 10.0
11 Beucha Rhyolite 2.685 0.1 0.23 6050 10.1 2.79 0.11 0.26 7073 11.8red CL 2.685 0.1 0.23 5444 9.1 2.79 0.11 0.26 6295 10.5
2.685 0.1 0.23 4900 7.7 2.79 0.11 0.26 5600 8.8
12 Flossenbuerg 2.68 0.1 0.24 17000 11.4 2.79 0.11 0.26 19300 12.9Granite 2.68 0.1 0.24 15900 11.4 2.795 0.11 0.26 18800 13.5
2.68 0.1 0.24 14500 10.1 2.79 0.11 0.26 16100 11.2
13 Leucosome 2.685 0.1 0.23 9000 12.1 2.79 0.11 0.26 9000 12.1Quartz 2.685 0.1 0.23 9800 11.6 2.79 0.11 0.26 9200 10.9
2.685 0.1 0.23 10200 10.1 2.79 0.11 0.26 10000 9.9

212
List of CL emission band parameters of quartz (continued)
Sample 2.68 eV - Band 2.79 eV - BandPosition Sigma Half-width If If (%) Position Sigma Half-width If If (%)
(eV) (eV) (eV) (eV) (eV) (eV)
14 Ramberg Granite 2.68 0.1 0.24 11800 11.2 2.8 0.11 0.26 13500 12.82.68 0.1 0.24 9300 9.5 2.8 0.11 0.26 10500 10.72.68 0.1 0.24 14500 10.1 2.79 0.11 0.26 16100 11.2
15 Weinheim 2.685 0.095 0.22 22300 11.6 2.79 0.11 0.26 26500 13.8Rhyolite 2.685 0.095 0.22 19000 10.5 2.79 0.11 0.26 25000 13.8blue CL 2.685 0.1 0.23 17400 10.3 2.79 0.11 0.26 23600 14.0
15 Weinheim 2.685 0.1 0.23 6704 7.9 2.8 0.11 0.26 7800 9.2 Rhyolite 2.685 0.1 0.23 6750 6.4 2.8 0.11 0.26 7000 6.6red CL 2.685 0.1 0.23 5300 5.1 2.8 0.11 0.26 5500 5.3
Sample 2.96 eV - BandPosition Sigma Half-width If If (%)
(eV) (eV) (eV)
1 Megaquartz 2.955 0.125 0.28 5200 4.42.96 0.125 0.3 2200 3.32.96 0.125 0.3 1500 2.5
2 Fissile Quartz 2.96 0.12 0.28 7000 11.42.96 0.12 0.28 6000 9.62.96 0.12 0.28 5800 8.3
3 Oil-bearing 2.96 0.127 0.3 8700 10.1 Quartz 2.965 0.125 0.29 6700 8.1
2.96 0.125 0.3 4500 6.0
4 Schoenfeld 2.96 0.13 0.3 22000 20.0Rhyolite 2.96 0.13 0.3 17800 17.5
2.96 0.13 0.3 15000 14.8
5 Teplice Rhyolite 2.96 0.128 0.3 10000 19.3blue CL/ 2.96 0.128 0.3 9000 18.4phenocryst 2.96 0.128 0.3 8200 15.8
5 Teplice Rhyolite 2.97 0.13 0.3 7500 6.8red CL/ 2.97 0.13 0.3 7500 6.9phenocryst 2.97 0.13 0.3 7300 6.3
6 Schellerhau Granite 2.965 0.135 0.31 27500 21.3blue CL/ 2.965 0.135 0.31 22000 18.5phenocryst 2.965 0.135 0.31 15500 14.3
6 Schellerhau Granite 2.965 0.135 0.31 10000 11.9red CL/ 2.965 0.135 0.31 7500 8.4phenocryst 2.965 0.135 0.31 5700 6.3
6 Schellerhau Granite 2.97 0.135 0.32 12500 18.0red CL/ 2.97 0.135 0.32 10000 13.0matrix quartz 2.97 0.135 0.32 8000 10.2
7 Eibenstock Granite 2.965 0.13 0.31 3900 14.92.965 0.13 0.31 3600 12.62.96 0.13 0.3 3500 11.4
8 Aue Granite 2.96 0.125 0.3 23000 15.72.96 0.125 0.3 20000 14.62.96 0.125 0.3 15700 13.1
9 Vein Quartz 2.96 0.125 0.3 18500 23.82.96 0.125 0.3 8900 21.52.96 0.125 0.3 3000 17.2
10 Wachtelberg 2.965 0.135 0.31 14470 21.0Rhyolite 2.965 0.135 0.31 12045 19.4blue CL 2.965 0.135 0.31 11000 18.3

213
List of CL emission band parameters of quartz (continued)
Sample 2.96 eV - BandPosition Sigma Half-width If If (%)
(eV) (eV) (eV)
10 Wachtelberg 2.965 0.135 0.31 9100 17.0Rhyolite 2.965 0.135 0.31 7600 15.2red CL 2.965 0.135 0.31 7000 14.4
11 Beucha Rhyolite 2.962 0.135 0.32 17300 20.6blue CL 2.962 0.135 0.32 14500 18.8
2.962 0.135 0.32 12300 16.2
11 Beucha Rhyolite 2.965 0.135 0.31 12100 20.1red CL 2.965 0.135 0.31 10000 16.8
2.965 0.135 0.31 9000 14.1
12 Flossenbuerg 2.957 0.13 0.3 29000 19.4Granite 2.957 0.13 0.3 28000 20.2
2.957 0.13 0.3 24500 17.1
13 Leucosome 2.965 0.135 0.31 14000 18.8Quartz 2.96 0.135 0.31 15000 17.8
2.965 0.135 0.31 15000 14.8
14 Ramberg Granite 2.965 0.135 0.31 20000 19.02.965 0.135 0.31 14500 14.82.957 0.13 0.3 24500 17.1
15 Weinheim 2.955 0.135 0.31 42000 21.9Rhyolite 2.955 0.135 0.31 37000 20.5blue CL 2.96 0.125 0.3 31000 18.4
15 Weinheim 2.96 0.125 0.3 9000 10.7 Rhyolite 2.96 0.125 0.3 7600 7.2red CL 2.96 0.125 0.3 6500 6.2

214
Appendix B
List of kinetic law parameters of CL intensity change for the 1.96 and 2.79 eV emission
Function of the 1.96 eV emission increase (and b): Ir = Irs - Ir1 ∗ exp(-t/kr1) - Ir2 ∗ exp(-t/kr2) where Ir = intensity ofred CL at the radiation time t; Irs = intensity of red CL for t ? 8 ; Ir1 = intensity of the slow increasing CLcomponent for t ? 8; kr1 = velocity constant of the slow increasing CL component; Ir2 = intensity of the fastincreasing CL component for t ? 8 ; kr2 = velocity constant of the fast increasing CL component; t = radiationtime.Function of the 2.79 eV emission decay (and a): Ib = Ibs + Ib1 ∗ exp(-t/kb1) + Ib2 ∗ exp(-t/kb2) where Ib = intensityof blue CL at the radiation time t; Ibs = intensity of stable blue CL; Ib1 = intensity of the slow decreasing CLcomponent at t = 0; kb1 = velocity constant of the slow decreasing CL component; Ib2 = intensity of the fastdecreasing CL component at t = 0; kb2 = velocity constant of the fast decreasing CL component; t = radiationtime. Intensities are normalised for the highest measured intensity (Irs of sample 15). The reproducibility of theparameters lies in the error range of 10 – 20 %.
No. Sample name 1.96 eV emission 2.79 eV emission
Irs (%) Ir1 (%) kr1 Ir2 (%) kr2 Ibs (%) Ib1 (%) kb1 Ib2 (%) kb2
1 Megaquartz 46.2 16.1 512 3.0 7 4.5 4.5 254 72.2 14
2 Fissile Quartz 49.8 30.2 498 7.2 10 12.1 3.5 234 25.7 7
3 Oil quartz 55.0 15.6 470 29.2 36 6.9 10.2 248 37.8 10
4 Schoenfeld Rhyolite 61.6 18.1 502 4.4 36 23.0 9.9 259 17.9 16
5 Teplice rhyolite – blueCL
23.1 6.6 513 4.9 18 13.0 4.5 250 16.8 8
5 Teplice Rhyolite- red CL 95.6 37.2 522 3.8 11 12.0 0.9 245 4.7 86 Schellerhau Granite –
blue CL/phenocryst64.2 26.0 489 11.0 42 21.0 19.3 261 33.0 15
6 Schellerhau Granite –red CL/Phenocryst
72.7 26.9 495 23.8 45 9.3 6.4 256 9.8 22
6 Schellerhau Granite –red CL/matrix quartz
59.2 17.2 504 36.9 33 11.2 6.8 252 14.7 15
7 Eibenstock Granite 21.1 9.3 521 5.6 23 4.8 6.8 243 6.2 10
8 Aue Granite 47.0 8.1 506 9.9 16 22.0 0.6 245 22.5 10
9 Vein Quartz 30.1a 3.5a 244a 1.3a 8a 2.2 22.8 257 74.6 16
10 Wachtelberg Rhyolite –blue CL
31.8 5.6 491 3.2 26 15.1 24.7 271 11.3 20
10 Wachtelberg Rhyolite –red CL
35.8 3.3 509 2.4 26 9.4 3.7 240 11.4 20
11 Beucha Rhyolite– blueCL
44.2 13.6 531 0.5 18 16.7 6.6 255 11.4 20
11 Beucha Rhyolite – redCL
40.1 6.2 485 2.7 24 12.7 8.2 247 9.0 20
12 Flossenbuerg Granite 80.1 47.3 492 25.4 12 35.2 2.7 254 51.1 8
13 Leucosome Quartz 68.4 44.6 479 6.0 27 24.4b 11.9b 495b 3.9b 24b
14 Ramberg Granite 60.4 16.0 488 22.6 24 21.6 1.4 263 45.3 17
15 Weinheim Rhyolite –blue CL
78.0 8.0 504 7.1 20 47.5 2.3 254 23.5 10
15 Weinheim Rhyolite – redCL
100.0 15.6 521 6.8 26 10.4 16.5 247 11.1 8

215
Appendix C
List of trace element analysis of quartz (LA ICP-MS)
1 Megaquartz
Sample Li Na Al Ca Ti Cr Mn Fe Gehakos01 1 36.5 108.8 229.5 1506.6 14.3 39.8 2.2 44.9 15.7hakos02 1 29.5 348.1 168.8 1286.5 16.2 42.4 4.4 72.1 11.7hakos03 1 33.4 378.9 238 1787.9 14.8 35.7 3.0 57.7 12.8hakos04 1 27.2 225.3 156.4 991 20 30.3 1.8 29.8 14.4hakos05 1 38.7 309.5 204.8 1371.7 22.2 37.6 2.3 38.3 20.2hakos06 1 45.8 357.4 217.6 1273.3 12.1 34.2 2.4 43.6 12.4hakos07 1 34.8 246.2 237.1 893.4 14.2 43.2 1.2 50.0 11.2hakos08 1 25.8 217.6 178.7 1391.2 18.1 34.2 2.2 44.4 9.8hakos09 1 36.9 253.9 216.1 1123.1 14.2 37.5 2.4 53.2 12.2hakos10 1 29.7 264.3 181.1 1023.3 15.3 30.2 1.8 40.3 13.8
2 Fissile quartz
Sample Li Na Al Ca Ti Cr Mn Fe Gespalt01 1 2.8 241.4 125.6 464.5 14.4 0.1 4.1 90.3 2.6spalt02 1 2.7 250.3 144.4 378.2 26.3 2.0 2.1 51.9 0.1spalt03 1 2.5 241.7 168.3 280.4 20.0 0.9 1.8 63.9 1.1spalt04 1 2.1 251.4 170.4 7.1 12.2 0.1 1.9 74.7 0.4spalt05 1 2.2 154.7 103.3 0.1 9.4 0.1 1.5 77.5 0.9spalt06 1 2.7 247.5 157.9 345.3 11.1 0.8 1.8 72.0 1.2spalt07 1 2.4 249.2 162.4 0.1 13.6 0.1 1.5 51.6 0.4spalt08 1 2.3 258.3 167.0 293.2 9.0 0.1 2.0 61.3 1.2spalt09 1 2.2 138.2 126.8 397.4 12.9 1.7 3.0 77.6 2.1spalt10 1 2.7 263.9 149.2 0.1 11.2 0.1 3.2 86.5 0.1
3 Oil-bearing quartz
Sample Li Na Al Ca Ti Cr Mn Fe Geoel01 1 134.3 1788.2 410.4 200.8 16.8 0.1 0.4 76.4 7.2oel02 1 118.8 2416.2 472.4 256.5 14.9 0.1 0.2 36.7 6.7oel03 1 131.2 3458.0 630.3 215.4 15.0 0.1 0.6 60.5 5.5oel04 1 118.6 3375.5 487.7 125.7 14.6 2.7 0.8 63.6 2.9oel05 1 119.1 1288.4 597.9 152.1 9.3 0.1 1.7 92.0 7.0oel06 1 112.8 3921.5 493.7 234.8 10.1 0.1 0.2 44.1 5.4oel07 1 123.8 3545.2 417.1 176.4 8.2 0.1 0.6 58.6 6.3oel08 1 109.6 3455.0 518.2 349.2 12.5 0.1 0.8 63.3 3.2oel09 1 116.3 2392.2 483.7 281.8 13.2 0.1 0.2 36.3 7.3oel010 1 121.0 1823.3 417.1 175.8 14.5 0.1 1.4 75.5 2.9
5 Teplice Rhyolite
Sample Li Na Al Ca Ti Cr Mn Fe Gelug102 1 32.4 89.9 157.4 452.9 99.2 1.8 0.8 61.9 2.2lug103 1 29.5 79.6 152.7 0.1 124.1 0.1 0.9 81.0 1.3lug104 1 34.8 75.4 149.3 116.1 167.4 0.1 1.3 57.1 1.9lug105 1 34.0 0.1 157.6 154.0 93.1 0.1 0.5 0.1 0.4lug106 1 28.0 0.1 159.2 0.1 107.8 0.1 0.1 0.1 1.5lug107 1 28.6 6.4 149.9 149.0 124.3 0.1 0.9 0.1 2.4lug108 1 27.1 88.3 140.6 761.0 85.1 0.1 0.1 8.4 1.6lug109 1 25.7 424.1 171.2 0.1 60.1 0.1 12.6 17.4 1.2lug110 1 18.3 393.1 175.1 141.3 35.3 0.1 5.4 0.1 1.3lug111 1 17.5 70.7 170.4 0.1 50.7 0.1 2.0 0.1 1.4lug113 1 29.3 0.1 160.2 0.1 54.2 0.1 1.2 0.1 1.0

216
List of trace element analysis of quartz (LA ICP-MS) (continued)
5 Teplice Rhyolite
Sample Li Na Al Ca Ti Cr Mn Fe Gelug114 1 29.5 0.1 155.1 0.1 74.5 0.1 0.3 0.1 1.2lug115 1 23.5 26.5 178.1 0.1 69.2 0.1 0.2 6.5 1.3lug116 1 32.4 0.1 170.0 2180.3 136.2 0.1 0.5 0.1 0.9lug119 1 27.0 121.6 161.6 133.5 98.6 1.3 3.6 9.0 0.8lug120 1 30.1 113.8 163.2 363.7 89.1 0.1 1.0 21.8 0.5lug201 1 31.9 354.8 123.2 453.1 149.4 0.9 3.8 14.4 2.5lug202 1 34.2 0.1 134.4 260.3 124.9 0.1 0.6 2.2 2.8lug203 1 35.9 0.1 159.6 0.1 176.6 0.1 1.4 13.1 1.2lug204 1 37.8 144.9 134.9 0.1 80.6 0.1 11.1 8.8 0.8lug205 1 26.8 104.1 129.0 0.1 60.7 2.7 16.0 5.1 0.7lug206 1 33.6 194.4 122.1 491.2 70.1 2.2 1.0 4.0 0.4lug207 1 33.4 0.1 129.0 0.1 55.0 0.1 0.2 2.1 1.8lug208 1 31.1 0.1 125.1 70.7 60.4 0.1 0.9 1.7 3.2lug209 1 39.9 0.1 177.4 0.1 107.9 0.1 2.2 7.3 0.8lug210 1 30.8 0.1 161.1 290.2 144.3 0.1 1.4 6.3 1.6lug211 1 34.1 0.1 147.1 0.1 165.1 0.1 0.4 10.8 1.5lug212 1 38.2 0.1 142.6 0.1 169.9 0.1 0.4 7.0 0.2lug213 1 28.9 0.1 155.6 0.1 199.8 4.5 0.1 22.9 0.1lug301 1 30.4 0.1 133.9 0.1 87.0 0.1 1.5 31.0 0.1lug302 1 32.6 0.1 144.2 179.7 86.2 0.1 4.3 26.9 0.1lug304 1 35.7 94.9 144.3 475.8 103.2 3.6 1.5 29.8 1.4lug305 1 33.0 0.1 140.5 162.4 120.2 0.1 0.1 25.1 1.1lug306 1 30.1 0.1 146.5 240.8 146.7 2.5 0.3 19.3 1.4lug307 1 32.7 0.1 144.4 0.1 102.5 0.1 0.5 10.8 0.8lug308 1 26.9 0.1 134.5 0.1 51.6 0.1 0.2 17.1 1.1lug309 1 22.6 0.1 117.8 224.4 63.0 0.8 0.1 20.1 1.0lug310 1 24.9 0.1 115.4 105.0 57.3 0.1 0.1 16.6 0.1lug311 1 22.8 0.1 119.0 185.5 47.2 0.1 0.1 5.0 0.4lug312 1 25.2 0.1 112.5 196.9 58.3 0.1 0.1 3.1 0.1lug501 1 26.3 1368.4 183.6 45.6 58.4 14.9 5.0 49.2 1.0lug502 1 20.1 1110.3 174.5 0.1 64.1 5.3 1.0 41.4 0.2lug503 1 20.8 1128.7 170.2 0.1 57.3 6.3 2.7 53.8 1.7lug504 1 22.8 899.5 163.0 135.5 51.4 5.1 0.4 68.5 2.4lug505 1 20.9 903.4 145.8 0.1 41.7 1.1 0.1 38.8 1.5lug506 1 19.8 911.1 151.8 224.9 26.6 3.3 0.5 58.7 1.1lug507 1 20.9 795.1 155.8 29.3 15.4 3.0 0.2 24.8 1.5lug508 1 20.7 835.5 149.3 26.3 36.2 5.8 0.1 21.1 2.1lug509 1 19.2 918.8 141.2 41.4 44.6 3.4 0.2 24.2 2.4lug510 1 16.8 1059.0 141.4 0.1 42.4 7.1 1.8 34.0 0.7lug511 1 18.7 999.0 150.1 0.1 59.2 4.3 0.1 13.7 1.5lug512 1 17.3 878.0 151.7 0.1 40.3 6.2 0.1 18.4 2.0lug513 1 17.8 1034.4 160.2 0.1 20.3 8.0 0.1 12.1 0.9lug514 1 16.0 1031.9 157.1 0.1 46.8 10.8 0.1 22.9 1.9lug515 1 14.7 1223.0 158.8 271.4 39.6 5.8 0.2 55.8 1.5lug516 1 16.4 1202.4 156.4 0.1 46.7 3.8 0.1 48.5 2.1
6 Schellerhau Granite
Sample Li Na Al Ca Ti Cr Mn Fe Gesh69101 29.2 136.3 300.7 3156.9 26.1 17.5 23.0 5.8sh69102 27.3 19.0 119.0 3043.8 100.7 9.8 7.1 0.1sh69103 24.5 32.2 87.0 3434.3 83.1 1.7 2.3 7.5sh69105 20.2 13.3 114.6 2823.5 24.9 5.7 0.1 2.1sh69106 30.6 282.0 124.2 3345.0 25.6 11.3 0.1 4.1sh69107 20.4 64.9 96.4 2864.5 10.5 21.9 0.1 1.2sh69108 29.0 71.9 140.5 2709.6 86.9 13.3 2.2 0.1sh69109 27.0 1.6 88.5 2706.3 102.0 4.9 0.1 7.8sh69110 44.8 44.1 444.0 2157.2 123.7 0.1 12.5 0.1sh69111 43.6 110.0 454.1 2174.7 100.1 4.7 0.1 0.7sh69112 38.7 14.9 124.5 3641.5 76.0 0.1 0.1 0.1sh69113 15.2 55.8 183.0 3353.2 30.8 11.9 16.0 0.6

217
List of trace element analysis of quartz (LA ICP-MS) (continued)
6 Schellerhau Granite
Sample Li Na Al Ca Ti Cr Mn Fe Gesh69201 35.1 1.8 108.8 3047.9 73.0 0.1 8.8 1.5sh69202 33.2 2.3 116.8 2786.4 83.6 0.1 63.1 0.1sh69204 27.7 0.1 138.5 2940.4 57.8 0.8 0.1 2.9sh69205 35.3 0.1 110.7 3273.3 73.8 0.1 0.1 8.6sh69206 40.8 0.1 99.4 3757.0 150.3 0.1 32.2 3.3sh69207 24.5 0.1 108.4 3706.7 9.9 0.1 0.1 0.1sh69209 37.6 98.7 117.7 3254.6 22.5 0.1 26.4 1.2sh69210 27.1 0.1 101.4 3442.2 45.2 0.3 0.1 0.1sh69211 21.9 110.6 124.9 2523.5 62.9 0.1 0.1 0.1sh69212 20.2 0.1 175.3 2696.9 34.3 0.1 68.3 0.1sh69401 25.0 423.7 0.1 20.9 24.7 130.9 0.9sh69402 25.3 216.2 1958.7 15.4 12.9 110.6 2.4sh69403 26.5 92.2 0.1 13.8 14.3 136.2 0.1sh69404 29.9 104.8 0.1 21.1 11.9 20.5 0.1sh69405 33.6 149.4 0.1 20.1 14.3 11.1 0.1sh69406 34.5 124.0 0.1 20.9 15.4 34.4 28.3sh69407 24.6 106.1 2230.8 16.1 16.3 73.8 1.4sh69408 32.2 85.2 1550.0 18.1 10.8 188.7 7.7sh69409 17.5 106.2 455.6 16.7 19.0 130.9 0.1sh69410 23.0 79.0 415.1 20.3 14.6 130.5 0.1sh69411 26.0 263.7 6309.7 18.2 15.5 104.8 0.1sh70101 21.6 261.3 0.1 16.6 15.8 81.7 51.7sh70102 31.1 257.0 494.1 16.3 12.8 19.9 28.3sh70103 40.2 258.8 1761.7 15.9 13.7 0.1 15.3sh70104 35.7 269.4 2293.9 17.1 15.0 18.9 0.1sh70105 36.3 283.9 0.1 18.0 13.4 12.9 9.3sh70106 32.5 229.0 1094.8 15.6 16.5 19.4 19.4sh70107 27.8 271.5 0.1 18.1 14.4 15.9 0.1sh70108 39.3 262.5 0.1 18.9 14.2 55.4 0.1sh70109 23.2 248.0 0.1 12.9 11.8 83.8 0.8sh70110 22.0 166.1 698.1 23.1 14.2 60.7 20.6sh70201 32.0 116.1 1418.6 18.7 11.3 102.0 22.6sh70202 30.2 94.6 0.1 15.0 11.8 99.6 37.5sh70203 26.5 111.0 1205.4 13.1 16.4 139.8 6.0sh70204 23.7 104.3 516.9 17.4 17.8 151.6 30.6sh70205 16.1 96.4 0.1 14.2 14.0 208.4 2.8sh70206 19.3 126.6 1450.1 19.4 17.8 86.0 0.1sh70207 29.2 135.6 526.8 12.4 14.3 138.1 49.0sh70209 29.3 162.6 1005.9 22.3 15.2 56.3 29.5sh70210 33.7 138.3 293.0 21.8 14.7 30.4 0.1sh70211 22.8 122.3 541.2 19.3 18.8 4.5 48.5sh70212 19.8 113.7 1589.9 14.3 11.9 218.2 28.5sh70213 17.5 91.9 647.8 13.9 13.5 294.0 0.1sh70214 13.8 110.7 468.4 18.4 18.2 113.0 18.6sh70215 18.1 108.5 167.3 19.1 12.6 225.6 28.1sh70303 27.6 261.5 0.1 11.9 13.8 266.7 0.1sh70304 38.8 189.4 1795.5 12.4 10.5 11.1 0.1sh70305 39.3 242.9 510.5 21.7 17.9 26.1 0.1sh70306 28.2 176.6 737.0 18.1 12.8 58.0 48.7sh70307 33.2 206.3 732.8 16.9 12.1 36.9 0.1sh70308 28.8 267.7 1266.7 14.4 16.9 41.1 7.3sh70309 27.7 298.9 0.1 14.7 15.2 42.3 31.2sh70310 24.9 158.8 456.5 14.6 13.1 31.2 0.1sh70311 33.8 114.3 2930.2 19.9 18.3 33.8 0.1sh70312 11.9 125.1 0.1 17.2 16.1 185.7 0.1sh70313 21.6 235.8 527.7 21.0 15.7 68.8 10.7sh70314 25.3 192.4 675.2 12.9 19.7 203.8 49.0sh70315 28.0 176.4 1028.7 19.2 14.4 67.3 0.1sh70316 22.3 239.6 33.0 13.6 13.4 75.1 17.8sh72101 23.7 119.6 0.1 13.7 15.6 40.6 0.1sh72102 20.3 108.0 43.8 13.5 10.0 323.0 0.1sh72103 25.8 118.4 0.1 15.0 13.9 112.5 0.1
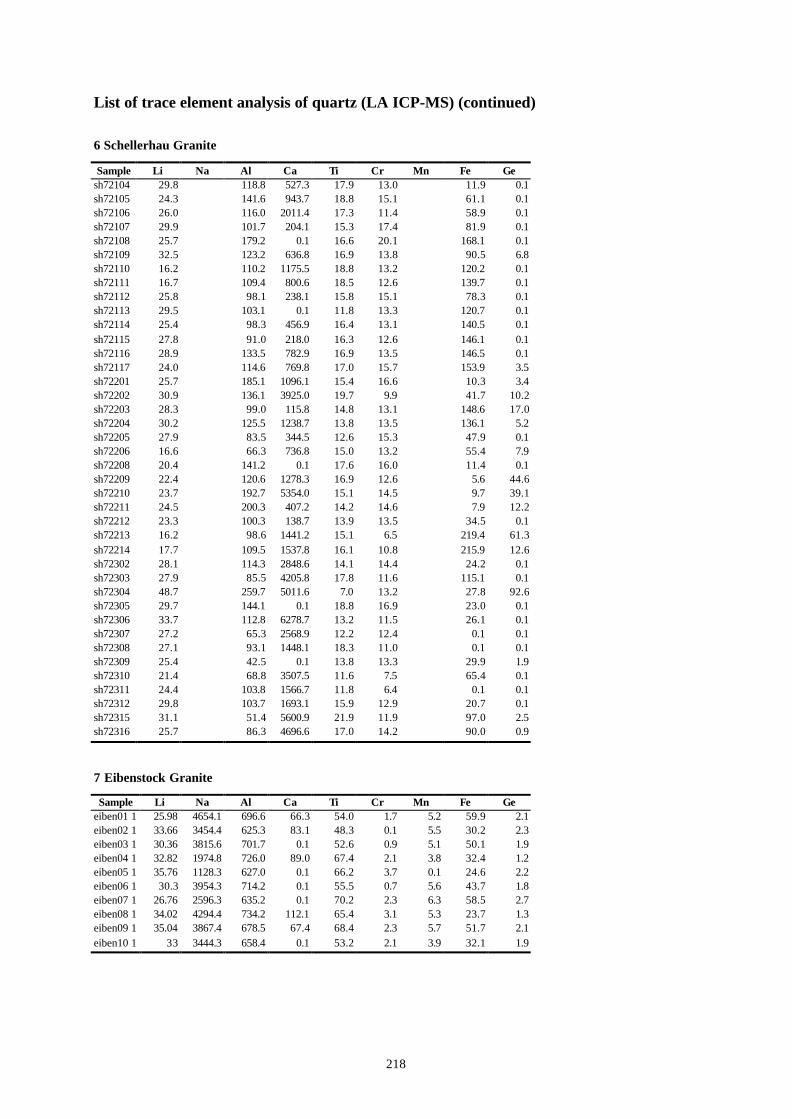
218
List of trace element analysis of quartz (LA ICP-MS) (continued)
6 Schellerhau Granite
Sample Li Na Al Ca Ti Cr Mn Fe Gesh72104 29.8 118.8 527.3 17.9 13.0 11.9 0.1sh72105 24.3 141.6 943.7 18.8 15.1 61.1 0.1sh72106 26.0 116.0 2011.4 17.3 11.4 58.9 0.1sh72107 29.9 101.7 204.1 15.3 17.4 81.9 0.1sh72108 25.7 179.2 0.1 16.6 20.1 168.1 0.1sh72109 32.5 123.2 636.8 16.9 13.8 90.5 6.8sh72110 16.2 110.2 1175.5 18.8 13.2 120.2 0.1sh72111 16.7 109.4 800.6 18.5 12.6 139.7 0.1sh72112 25.8 98.1 238.1 15.8 15.1 78.3 0.1sh72113 29.5 103.1 0.1 11.8 13.3 120.7 0.1sh72114 25.4 98.3 456.9 16.4 13.1 140.5 0.1sh72115 27.8 91.0 218.0 16.3 12.6 146.1 0.1sh72116 28.9 133.5 782.9 16.9 13.5 146.5 0.1sh72117 24.0 114.6 769.8 17.0 15.7 153.9 3.5sh72201 25.7 185.1 1096.1 15.4 16.6 10.3 3.4sh72202 30.9 136.1 3925.0 19.7 9.9 41.7 10.2sh72203 28.3 99.0 115.8 14.8 13.1 148.6 17.0sh72204 30.2 125.5 1238.7 13.8 13.5 136.1 5.2sh72205 27.9 83.5 344.5 12.6 15.3 47.9 0.1sh72206 16.6 66.3 736.8 15.0 13.2 55.4 7.9sh72208 20.4 141.2 0.1 17.6 16.0 11.4 0.1sh72209 22.4 120.6 1278.3 16.9 12.6 5.6 44.6sh72210 23.7 192.7 5354.0 15.1 14.5 9.7 39.1sh72211 24.5 200.3 407.2 14.2 14.6 7.9 12.2sh72212 23.3 100.3 138.7 13.9 13.5 34.5 0.1sh72213 16.2 98.6 1441.2 15.1 6.5 219.4 61.3sh72214 17.7 109.5 1537.8 16.1 10.8 215.9 12.6sh72302 28.1 114.3 2848.6 14.1 14.4 24.2 0.1sh72303 27.9 85.5 4205.8 17.8 11.6 115.1 0.1sh72304 48.7 259.7 5011.6 7.0 13.2 27.8 92.6sh72305 29.7 144.1 0.1 18.8 16.9 23.0 0.1sh72306 33.7 112.8 6278.7 13.2 11.5 26.1 0.1sh72307 27.2 65.3 2568.9 12.2 12.4 0.1 0.1sh72308 27.1 93.1 1448.1 18.3 11.0 0.1 0.1sh72309 25.4 42.5 0.1 13.8 13.3 29.9 1.9sh72310 21.4 68.8 3507.5 11.6 7.5 65.4 0.1sh72311 24.4 103.8 1566.7 11.8 6.4 0.1 0.1sh72312 29.8 103.7 1693.1 15.9 12.9 20.7 0.1sh72315 31.1 51.4 5600.9 21.9 11.9 97.0 2.5sh72316 25.7 86.3 4696.6 17.0 14.2 90.0 0.9
7 Eibenstock Granite
Sample Li Na Al Ca Ti Cr Mn Fe Geeiben01 1 25.98 4654.1 696.6 66.3 54.0 1.7 5.2 59.9 2.1eiben02 1 33.66 3454.4 625.3 83.1 48.3 0.1 5.5 30.2 2.3eiben03 1 30.36 3815.6 701.7 0.1 52.6 0.9 5.1 50.1 1.9eiben04 1 32.82 1974.8 726.0 89.0 67.4 2.1 3.8 32.4 1.2eiben05 1 35.76 1128.3 627.0 0.1 66.2 3.7 0.1 24.6 2.2eiben06 1 30.3 3954.3 714.2 0.1 55.5 0.7 5.6 43.7 1.8eiben07 1 26.76 2596.3 635.2 0.1 70.2 2.3 6.3 58.5 2.7eiben08 1 34.02 4294.4 734.2 112.1 65.4 3.1 5.3 23.7 1.3eiben09 1 35.04 3867.4 678.5 67.4 68.4 2.3 5.7 51.7 2.1eiben10 1 33 3444.3 658.4 0.1 53.2 2.1 3.9 32.1 1.9

219
List of trace element analysis of quartz (LA ICP-MS) (continued)
8 Aue Granite
Sample Li Na Al Ca Ti Cr Mn Fe Geauer101 1 49.2 491.4 231.0 0.0 46.9 0.0 3.5 33.5 0.0auer102 1 48.8 403.4 222.7 0.0 75.1 0.5 1.7 24.2 0.1auer103 1 33.4 386.4 281.4 0.0 62.2 0.0 4.2 52.2 0.1auer104 1 31.6 578.9 152.4 0.0 71.6 0.0 4.5 49.3 2.0auer105 1 28.7 427.1 207.4 0.0 80.2 0.4 2.4 27.3 0.4auer106 1 40.8 552.6 247.7 0.0 53.0 0.0 5.1 54.8 1.4auer107 1 50.2 545.5 276.5 0.0 78.1 3.5 2.7 38.4 0.6auer108 1 38.4 511.8 180.8 0.0 59.7 0.0 2.5 24.9 1.4auer109 1 27.2 308.9 153.9 0.0 44.7 3.5 1.1 17.8 1.1auer110 1 33.1 643.9 162.8 0.0 67.6 3.8 3.1 26.5 0.5auer111 1 43.2 466.8 169.8 0.0 80.2 0.0 3.1 34.6 0.2auer112 1 52.0 379.3 211.8 0.0 63.2 2.4 4.5 48.5 0.7
10 Wachtelberg Rhyolite
Sample Li Na Al Ca Ti Cr Mn Fe Gewacht101 1 25.9 922.8 164.6 0.1 90.7 0.1 4.9 40.2 0.2wacht102 1 25.0 520.6 177.5 0.1 69.4 0.1 0.1 21.8 1.4wacht103 1 20.4 387.6 154.5 0.1 50.1 0.1 0.1 23.1 0.5wacht104 1 21.2 622.5 150.4 89.9 55.2 0.1 5.0 42.4 1.8wacht105 1 21.3 458.8 157.0 161.2 41.1 0.1 1.4 28.5 0.1wacht108 1 22.6 607.5 158.8 31.3 38.2 0.1 0.5 23.2 0.3wacht109 1 21.0 796.1 152.2 6.4 28.4 3.2 0.1 37.6 1.5wacht110 1 20.5 373.3 163.2 53.9 72.0 1.2 3.7 45.8 1.5wacht111 1 20.9 374.3 175.8 27.9 58.6 0.1 0.1 71.5 1.4wacht112 1 19.6 293.1 160.1 0.1 74.5 0.1 0.1 39.2 1.7wacht402 1 24.5 75.1 147.9 41.3 40.8 0.1 0.4 23.3 1.5wacht403 1 24.4 78.6 127.6 332.9 24.1 5.3 0.1 28.1 1.4wacht404 1 25.9 111.6 132.6 159.3 12.7 9.2 0.5 21.3 1.5wacht405 1 29.3 28.3 148.1 173.6 9.1 1.1 0.1 11.6 0.7wacht406 1 24.7 162.0 135.9 545.8 5.9 4.9 0.1 13.2 1.3wacht407 1 22.1 10.2 134.4 107.4 11.4 1.9 0.1 24.9 0.8wacht408 1 21.2 305.8 133.2 0.1 25.5 3.0 7.2 15.3 1.2wacht409 1 22.5 114.6 134.3 0.1 40.7 0.1 1.3 18.8 2.5wacht410 1 24.8 163.9 140.3 0.1 98.4 0.1 0.1 21.0 1.6wacht411 1 22.0 117.3 144.7 0.1 98.4 8.4 0.1 25.1 0.7wacht501 1 26.4 231.0 186.1 38.0 90.7 0.1 7.3 63.4 2.3wacht502 1 28.6 526.8 141.7 210.4 108.0 3.2 0.5 58.5 0.7wacht503 1 22.7 554.3 119.9 271.5 14.2 8.9 0.8 26.0 0.1wacht504 1 22.2 464.3 124.0 0.1 23.5 0.1 0.1 22.8 2.3wacht505 1 21.6 290.6 119.2 116.8 22.3 5.7 0.3 26.1 0.8wacht506 1 22.1 397.7 129.8 0.1 25.2 0.1 0.2 46.9 2.7wacht507 1 21.5 418.8 141.6 0.1 9.2 7.6 0.1 34.9 0.8wacht508 1 22.4 365.4 140.1 0.1 80.4 3.9 0.1 32.9 1.3wacht201 1 23.4 658.5 145.4 0.1 99.0 9.5 4.2 71.8 0.5wacht202 1 32.0 82.8 149.7 427.3 132.1 1.8 4.0 49.0 0.9wacht203 1 27.4 0.1 137.8 0.1 108.0 6.7 1.5 40.6 1.9wacht204 1 23.8 0.1 116.4 0.1 58.0 7.8 0.3 20.7 1.3wacht205 1 26.0 0.1 114.8 90.1 16.6 3.2 0.3 0.1 0.1wacht206 1 23.0 0.1 109.5 0.1 30.7 2.8 0.2 4.4 2.9wacht207 1 27.8 0.1 123.2 0.1 83.5 5.3 0.5 8.2 0.1wacht208 1 24.6 0.1 118.0 0.1 32.3 0.1 0.1 16.8 1.9wacht209 1 27.5 0.1 114.5 0.1 21.9 4.4 5.3 21.8 1.6wacht211 1 22.3 121.3 109.2 0.1 20.2 0.1 2.3 1.0 0.6wacht212 1 37.1 388.8 112.8 0.1 32.1 0.1 4.5 0.1 0.8wacht213 1 22.6 328.2 120.6 891.5 23.1 1.6 4.1 25.6 2.0wacht214 1 36.0 219.4 135.1 0.1 108.4 0.7 3.9 40.9 1.1wacht215 1 46.8 235.4 153.8 0.1 93.9 0.1 1.5 84.8 0.1wacht302 1 27.3 0.1 141.3 0.1 113.5 0.1 17.0 68.5 2.0wacht303 1 26.7 116.9 155.1 0.1 78.0 0.1 14.2 76.9 1.1

220
List of trace element analysis of quartz (LA ICP-MS) (continued)
10 Wachtelberg Rhyolite
Sample Li Na Al Ca Ti Cr Mn Fe Gewacht304 1 22.2 197.2 161.5 582.7 57.9 3.9 28.0 71.1 0.7wacht305 1 22.5 0.1 123.2 0.1 39.4 0.1 5.8 54.1 0.8wacht306 1 28.4 0.1 146.5 591.5 110.7 2.6 1.0 51.6 1.4wacht307 1 24.5 0.1 126.4 416.9 78.1 2.5 0.1 12.8 1.0wacht308 1 27.3 0.1 131.8 0.1 93.4 2.4 0.5 10.1 0.2wacht309 1 23.8 30.7 172.2 0.1 73.1 0.1 0.1 13.0 2.9wacht310 1 23.8 29.7 154.5 0.1 27.2 0.1 0.1 15.1 0.7wacht311 1 24.0 0.1 121.6 0.1 44.8 0.1 0.6 21.8 0.4wacht312 1 29.3 0.1 137.9 0.1 122.3 0.1 0.1 30.1 0.8
11 Beucha Rhyolite
Sample Li Na Al Ca Ti Cr Mn Fe Gebeuch101 21.78 1486.3 197.5 0.1 79.0 15.7 4.2 32.1 1.5beuch102 18.54 1178.9 195.0 258.4 71.1 10.9 0.1 45.1 2.0beuch103 18.18 759.2 190.0 63.2 77.4 7.7 5.1 31.8 2.0beuch104 18.66 1017.8 186.2 0.1 73.2 10.3 0.1 29.2 1.3beuch105 19.08 1081.5 211.8 0.1 112.5 4.8 0.1 54.8 1.2beuch201 22.38 948.9 186.2 164.1 95.7 5.8 0.8 39.9 2.2beuch202 16.44 958.5 179.7 121.0 80.2 2.2 0.9 42.5 1.9beuch203 19.74 800.1 178.1 260.8 85.6 7.9 0.3 25.6 0.5beuch204 18.84 803.9 182.7 151.1 82.0 8.0 0.1 17.6 1.3beuch205 19.2 971.4 178.0 0.1 83.4 8.4 0.1 29.1 1.5beuch206 19.44 727.3 188.4 0.1 91.4 1.7 0.1 58.0 1.0
12 Flossenbürg Granite
Sample Li Na Al Ca Ti Cr Mn Fe Gefloss01 1 11.3 833.3 49.4 0.1 13.5 0.1 0.1 13.1 1.9floss02 1 12.5 279.7 71.3 147.2 36.4 0.2 0.1 4.9 2.6floss03 1 12.7 357.1 84.1 257.2 34.8 0.1 0.1 7.5 2.2floss04 1 23.1 512.9 145.9 0.1 37.5 0.4 0.1 0.1 0.3floss05 1 16.9 498.5 116.9 110.4 33.1 0.1 0.1 20.9 1.9floss06 1 17.9 372.2 138.1 211.2 37.0 0.1 0.1 0.1 2.0floss07 1 12.0 467.2 68.1 16.6 28.5 1.1 0.1 16.7 1.5floss08 1 12.3 456.3 85.3 201.4 34.2 0.5 0.1 8.3 1.9floss09 1 16.4 546.4 72.1 0.1 32.1 0.1 0.1 0.1 2.2floss10 1 12.5 438.4 110.2 174.2 35.4 0.1 0.1 12.1 1.9
13 Leucosome quartz
Sample Li Na Al Ca Ti Cr Mn Fe Geexsud01 1 9.3 273.2 229.6 234.9 27.3 7.9 1.8 140.1 1.1exsud02 1 12.0 409.5 210.8 306.1 15.4 9.1 1.6 82.0 1.0exsud03 1 8.5 359.3 234.6 287.6 22.3 7.8 1.9 127.2 1.2exsud04 1 6.2 346.1 246.5 264.8 23.3 8.0 4.4 100.7 1.6exsud05 1 5.7 276.0 232.2 192.1 21.8 3.4 3.1 45.5 2.1exsud06 1 10.3 439.2 243.8 304.7 18.8 7.6 2.1 60.5 1.2exsud07 1 9.4 297.3 227.5 293.5 25.3 8.1 1.8 58.7 2.1exsud08 1 6.4 321.2 212.0 253.9 22.6 5.6 3.0 114.2 1.3exsud09 1 9.2 482.1 250.6 304.5 21.3 9.0 3.3 128.2 3.5exsud10 2 8.3 403.2 237.9 295.4 22.6 8.9 2.7 94.0 2.0

221
List of trace element analysis of quartz (LA ICP-MS) (continued)
14 Ramberg Granite
Sample Li Na Al Ca Ti Cr Mn Fe Geram01 1 13.7 650.5 389.4 880.8 42.8 19.4 2.4 85.6 3.0ram02 1 13.8 494.0 421.9 483.8 28.3 6.6 1.3 56.6 2.0ram03 1 19.5 505.4 428.9 282.5 23.1 8.1 0.6 46.2 1.2ram04 1 14.2 870.5 378.9 1056.0 36.5 5.3 1.3 73.1 2.3ram05 1 14.7 764.4 471.9 545.3 35.7 14.3 1.0 71.5 2.1ram06 1 15.6 647.5 479.7 657.4 34.4 6.5 1.4 68.9 2.1ram07 1 18.5 530.3 398.7 943.2 25.2 8.3 0.8 50.3 3.2ram08 1 15.3 732.2 456.9 456.3 35.9 11.2 1.6 71.9 2.4ram09 1 16.5 842.5 498.0 645.3 36.8 9.4 1.3 73.6 2.0ram10 1 14.3 653.9 423.8 899.7 37.8 6.4 1.7 75.5 1.9
15 Weinheim Rhyolite
Sample Li Na Al Ca Ti Cr Mn Fe Gewein101 1 29.2 746.2 185.7 0.1 24.9 1.0 1.7 0.1 1.6wein102 1 46.5 55.5 179.8 0.1 44.1 0.1 1.3 0.1 2.5wein103 1 56.2 123.7 171.0 331.4 75.4 6.8 1.2 4.6 5.6wein104 1 43.7 0.1 169.1 0.1 99.5 6.4 0.4 0.1 3.7wein105 1 34.8 0.1 169.2 0.1 98.0 0.1 0.3 0.1 1.6wein106 1 25.9 309.6 170.6 97.2 79.0 0.1 0.4 0.1 1.0wein107 1 30.8 5474.6 170.3 0.1 87.6 5.8 5.5 0.1 1.3wein108 1 33.0 1307.6 172.7 0.1 51.7 0.1 9.7 0.1 0.8wein109 1 24.8 445.5 184.9 268.6 44.3 0.5 1.3 0.1 0.9wein110 1 22.6 350.8 173.9 283.8 33.7 0.1 0.1 0.1 2.0wein201 1 31.1 449.4 155.3 547.6 62.3 0.1 0.5 30.7 2.3wein202 1 37.1 0.1 184.0 247.6 60.1 1.8 1.3 11.3 0.9wein203 1 34.7 6474.0 214.7 208.3 178.8 10.4 1.7 45.2 3.3wein204 1 31.0 563.6 192.6 0.1 84.3 0.4 1.5 0.1 2.0wein206 1 39.4 245.1 196.3 249.2 162.6 10.5 2.2 49.2 0.7wein207 1 39.7 181.3 189.3 40.5 123.8 0.1 1.4 0.1 1.8wein208 1 37.9 211.1 170.5 270.9 52.7 0.1 1.2 54.6 1.3wein209 1 24.8 80.9 162.2 239.4 40.5 4.3 0.1 22.9 2.0wein301 1 35.9 540.4 152.6 307.9 35.7 1.7 4.8 0.1 1.2wein302 1 42.8 0.1 154.3 454.1 13.7 0.1 0.5 0.1 0.1wein303 1 50.6 0.1 162.5 637.3 58.7 0.1 1.5 0.1 3.2wein304 1 44.8 0.1 165.3 326.3 105.3 2.7 0.7 36.8 2.8wein305 1 34.7 0.1 172.4 0.1 132.9 0.1 0.7 24.5 0.8wein308 1 32.1 3122.5 170.2 787.0 186.6 0.1 2.5 28.2 7.6wein309 1 33.3 1289.3 174.7 0.1 122.0 7.6 6.1 26.4 1.6wein310 1 32.5 502.6 165.5 344.7 165.6 1.0 8.5 38.2 0.8wein401 1 28.3 185.2 171.2 246.5 38.5 0.1 0.5 0.1 0.6wein402 1 27.3 191.7 194.4 77.0 45.5 0.4 0.4 0.1 1.5wein403 1 31.4 152.8 195.7 281.6 75.8 1.7 0.1 0.1 2.2wein404 1 34.0 241.9 202.6 314.0 69.4 0.1 0.5 0.1 0.5wein405 1 32.6 109.1 199.2 4.0 71.1 1.1 0.1 0.1 0.7wein406 1 27.4 145.4 189.9 239.6 62.8 0.1 0.5 0.1 1.3wein407 1 26.3 1104.7 189.2 364.0 36.1 0.1 0.8 0.1 1.0wein408 1 28.1 1611.2 176.9 402.9 26.0 5.2 1.4 0.1 1.5wein501 1 28.5 544.5 173.7 0.1 66.0 0.6 3.8 19.6 2.5wein502 1 41.6 556.1 179.2 0.1 113.9 2.5 0.2 32.2 0.1wein503 1 46.3 776.2 195.7 0.1 241.7 14.4 7.6 30.0 2.1wein504 1 54.1 899.0 196.2 0.1 305.7 1.5 0.1 55.1 2.5wein505 1 48.1 1065.4 204.8 0.1 267.0 44.7 0.1 44.0 2.8wein506 1 42.7 1026.0 223.0 0.1 221.8 1.3 2.2 24.0 0.7wein507 1 46.7 1289.3 225.7 0.1 259.9 1.3 0.4 38.4 1.7wein508 1 51.4 909.6 215.5 0.1 203.6 7.2 0.4 23.7 2.2wein509 1 35.4 944.0 167.8 0.1 50.7 7.9 0.1 19.2 2.8

222
Appendix D
List of trace element analysis of quartz (EPMA)
1 Megaquartz 6 Schellerhau GraniteSample Al Ti K Fe Sample Al Ti K Fe
Megaquartz 158.8 0.0 33.2 15.5 Schell red CL 108.9 16.0 0.0Megaquartz 142.9 0.0 24.9 7.8 Schell red CL 103.6 18.0 0.0Megaquartz 153.5 0.0 8.3 15.5 Schell red CL 114.2 18.0 23.3Megaquartz 127.1 12.0 16.6 15.5 Schell red CL 93.0 18.0 31.1Megaquartz 5.3 6.0 8.3 7.8 Schell red CL 124.8 18.0 15.5Megaquartz 5.3 12.0 16.6 15.5 Schell red CL 135.4 16.0 0.0Megaquartz 5.3 6.0 16.6 0.0 Schell red CL 135.4 18.0 7.8Megaquartz 5.3 0.0 0.0 0.0 Schell red CL 188.4 29.0 0.0Megaquartz 5.3 0.0 24.9 0.0 Schell red CL 119.5 24.0 7.8Megaquartz 5.3 0.0 24.9 7.8 Schell red CL 130.1 21.0 0.0
Schell red CL 93.0 24.0 0.0
2 Fissile quartz Schell red CL 93.0 25.0 0.0
Sample Al Ti K Fe Schell red CL 114.2 24.0 15.5Fissile 21.2 18.0 33.2 7.8 Schell red CL 103.6 26.0 23.3Fissile 15.9 0.0 58.1 23.3 Schell red CL 108.9 27.0 0.0Fissile 21.2 18.0 41.5 0.0 Schell red CL 82.4 31.0 23.3Fissile 15.9 0.0 49.8 7.8 Schell red CL 119.5 29.0 15.5Fissile 21.2 6.0 66.4 15.5 Schell red CL 98.3 33.0 0.0Fissile 26.5 18.0 99.6 15.5 Schell red CL 103.6 35.0 7.8Fissile 10.6 12.0 66.4 7.8 Schell red CL 135.4 32.0 0.0Fissile 21.2 6.0 49.8 7.8 Schell red CL 114.2 28.0 0.0Fissile 21.2 0.0 83.0 0.0 Schell red CL 103.6 30.0 15.5Fissile 21.2 30.0 58.1 0.0 Schell red CL 93.0 36.0 23.3
Schell red CL 98.3 36.0 15.5
3 Oil-bearing quartz Schell red CL 130.1 36.0 15.5
Sample Al Ti K Fe Schell red CL 103.6 38.0 15.5Oil 455.3 0.0 41.5 0.0 Schell red CL 87.7 48.0 7.8Oil 465.9 0.0 33.2 7.8 Schell blue CL 87.7 36.0 7.8Oil 460.6 0.0 33.2 31.1 Schell blue CL 124.8 42.0 7.8Oil 471.2 18.0 24.9 0.0 Schell blue CL 108.9 42.0 7.8Oil 434.1 18.0 41.5 15.5 Schell blue CL 93.0 42.0 0.0Oil 434.1 18.0 49.8 0.0 Schell blue CL 93.0 42.0 15.5Oil 476.5 0.0 58.1 0.0 Schell blue CL 93.0 48.0 7.8Oil 476.5 6.0 41.5 15.5 Schell blue CL 93.0 50.0 0.0
Schell blue CL 77.1 46.0 0.0
6 Schellerhau Granite Schell blue CL 124.8 51.0 0.0
Sample Al Ti K Fe Schell blue CL 103.6 54.0 15.5Schel matrix 199.0 0.0 7.8 Schell blue CL 82.4 54.0 7.8Schel matrix 273.2 0.0 15.5 Schell blue CL 98.3 55.0 7.8Schel matrix 214.9 21.0 15.5 Schell blue CL 87.7 57.0 15.5Schel matrix 199.0 17.0 0.0 Schell blue CL 98.3 58.0 15.5Schel matrix 214.9 19.0 0.0 Schell blue CL 98.3 62.0 0.0
Schel matrix 199.0 25.0 15.5Schel matrix 225.5 24.0 15.5 8 Aue GraniteSchel matrix 183.1 27.0 15.5 Sample Al Ti K FeSchel matrix 156.6 30.0 23.3 aue 58.2 60.0 41.5 23.3Schel matrix 209.6 30.0 15.5 aue 42.4 60.0 49.8 31.1Schel matrix 193.7 30.0 15.5 aue 63.5 60.0 41.5 15.5Schel matrix 206.2 36.0 23.3 aue 68.8 65.9 49.8 38.9Schell red CL 98.3 11.0 0.0 aue 79.4 65.9 33.2 23.3Schell red CL 124.8 12.0 23.3 aue 58.2 65.9 33.2 7.8Schell red CL 98.3 14.0 0.0 aue 74.1 71.9 83.0 23.3
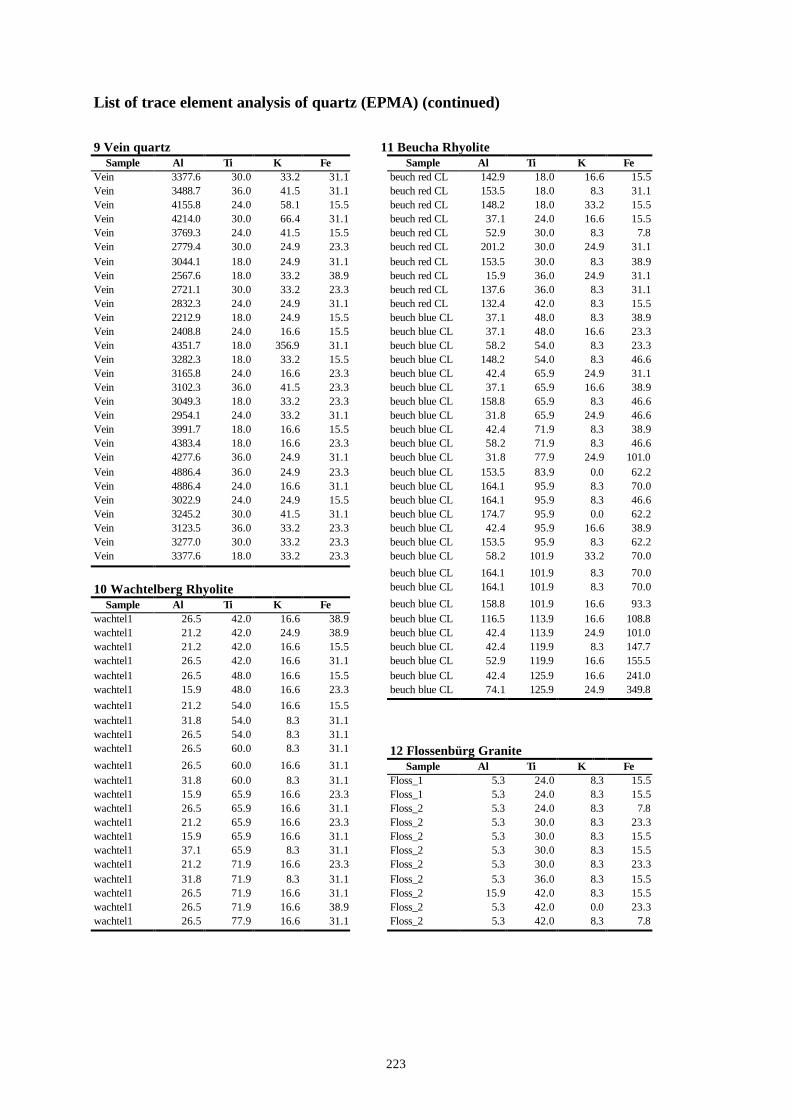
223
List of trace element analysis of quartz (EPMA) (continued)
9 Vein quartz 11 Beucha RhyoliteSample Al Ti K Fe Sample Al Ti K Fe
Vein 3377.6 30.0 33.2 31.1 beuch red CL 142.9 18.0 16.6 15.5Vein 3488.7 36.0 41.5 31.1 beuch red CL 153.5 18.0 8.3 31.1Vein 4155.8 24.0 58.1 15.5 beuch red CL 148.2 18.0 33.2 15.5Vein 4214.0 30.0 66.4 31.1 beuch red CL 37.1 24.0 16.6 15.5Vein 3769.3 24.0 41.5 15.5 beuch red CL 52.9 30.0 8.3 7.8Vein 2779.4 30.0 24.9 23.3 beuch red CL 201.2 30.0 24.9 31.1Vein 3044.1 18.0 24.9 31.1 beuch red CL 153.5 30.0 8.3 38.9Vein 2567.6 18.0 33.2 38.9 beuch red CL 15.9 36.0 24.9 31.1Vein 2721.1 30.0 33.2 23.3 beuch red CL 137.6 36.0 8.3 31.1Vein 2832.3 24.0 24.9 31.1 beuch red CL 132.4 42.0 8.3 15.5Vein 2212.9 18.0 24.9 15.5 beuch blue CL 37.1 48.0 8.3 38.9Vein 2408.8 24.0 16.6 15.5 beuch blue CL 37.1 48.0 16.6 23.3Vein 4351.7 18.0 356.9 31.1 beuch blue CL 58.2 54.0 8.3 23.3Vein 3282.3 18.0 33.2 15.5 beuch blue CL 148.2 54.0 8.3 46.6Vein 3165.8 24.0 16.6 23.3 beuch blue CL 42.4 65.9 24.9 31.1Vein 3102.3 36.0 41.5 23.3 beuch blue CL 37.1 65.9 16.6 38.9Vein 3049.3 18.0 33.2 23.3 beuch blue CL 158.8 65.9 8.3 46.6Vein 2954.1 24.0 33.2 31.1 beuch blue CL 31.8 65.9 24.9 46.6Vein 3991.7 18.0 16.6 15.5 beuch blue CL 42.4 71.9 8.3 38.9Vein 4383.4 18.0 16.6 23.3 beuch blue CL 58.2 71.9 8.3 46.6Vein 4277.6 36.0 24.9 31.1 beuch blue CL 31.8 77.9 24.9 101.0Vein 4886.4 36.0 24.9 23.3 beuch blue CL 153.5 83.9 0.0 62.2Vein 4886.4 24.0 16.6 31.1 beuch blue CL 164.1 95.9 8.3 70.0Vein 3022.9 24.0 24.9 15.5 beuch blue CL 164.1 95.9 8.3 46.6Vein 3245.2 30.0 41.5 31.1 beuch blue CL 174.7 95.9 0.0 62.2Vein 3123.5 36.0 33.2 23.3 beuch blue CL 42.4 95.9 16.6 38.9Vein 3277.0 30.0 33.2 23.3 beuch blue CL 153.5 95.9 8.3 62.2Vein 3377.6 18.0 33.2 23.3 beuch blue CL 58.2 101.9 33.2 70.0
beuch blue CL 164.1 101.9 8.3 70.0
10 Wachtelberg Rhyolite beuch blue CL 164.1 101.9 8.3 70.0
Sample Al Ti K Fe beuch blue CL 158.8 101.9 16.6 93.3wachtel1 26.5 42.0 16.6 38.9 beuch blue CL 116.5 113.9 16.6 108.8wachtel1 21.2 42.0 24.9 38.9 beuch blue CL 42.4 113.9 24.9 101.0wachtel1 21.2 42.0 16.6 15.5 beuch blue CL 42.4 119.9 8.3 147.7wachtel1 26.5 42.0 16.6 31.1 beuch blue CL 52.9 119.9 16.6 155.5wachtel1 26.5 48.0 16.6 15.5 beuch blue CL 42.4 125.9 16.6 241.0wachtel1 15.9 48.0 16.6 23.3 beuch blue CL 74.1 125.9 24.9 349.8wachtel1 21.2 54.0 16.6 15.5wachtel1 31.8 54.0 8.3 31.1wachtel1 26.5 54.0 8.3 31.1wachtel1 26.5 60.0 8.3 31.1 12 Flossenbürg Granitewachtel1 26.5 60.0 16.6 31.1 Sample Al Ti K Fewachtel1 31.8 60.0 8.3 31.1 Floss_1 5.3 24.0 8.3 15.5wachtel1 15.9 65.9 16.6 23.3 Floss_1 5.3 24.0 8.3 15.5wachtel1 26.5 65.9 16.6 31.1 Floss_2 5.3 24.0 8.3 7.8wachtel1 21.2 65.9 16.6 23.3 Floss_2 5.3 30.0 8.3 23.3wachtel1 15.9 65.9 16.6 31.1 Floss_2 5.3 30.0 8.3 15.5wachtel1 37.1 65.9 8.3 31.1 Floss_2 5.3 30.0 8.3 15.5wachtel1 21.2 71.9 16.6 23.3 Floss_2 5.3 30.0 8.3 23.3wachtel1 31.8 71.9 8.3 31.1 Floss_2 5.3 36.0 8.3 15.5wachtel1 26.5 71.9 16.6 31.1 Floss_2 15.9 42.0 8.3 15.5wachtel1 26.5 71.9 16.6 38.9 Floss_2 5.3 42.0 0.0 23.3wachtel1 26.5 77.9 16.6 31.1 Floss_2 5.3 42.0 8.3 7.8

224
List of trace element analysis of quartz (EPMA) (continued)
13 Leucosome quartz 15 Weinheim RhyoliteSample Al Ti K Fe Sample Al Ti K Fe
Leucosome 84.7 24.0 49.8 7.8 wein blue CL 169.4 71.9 16.6 15.5Leucosome 100.6 30.0 83.0 15.5 wein blue CL 52.9 71.9 24.9 31.1Leucosome 84.7 30.0 74.7 7.8 wein blue CL 58.2 89.9 24.9 23.3Leucosome 95.3 18.0 107.9 7.8 wein red CL 158.8 18.0 8.3 15.5Leucosome 95.3 0.0 74.7 0.0 wein red CL 127.1 18.0 16.6 15.5Leucosome 100.6 12.0 132.8 0.0 wein red CL 142.9 18.0 8.3 31.1Leucosome 90.0 18.0 74.7 0.0 wein red CL 132.4 18.0 16.6 46.6Leucosome 116.5 12.0 33.2 23.3 wein red CL 142.9 18.0 58.1 70.0Leucosome 84.7 12.0 33.2 7.8Leucosome 84.7 24.0 24.9 15.5
Carcoar Granodiorite14 Ramberg Granite Sample Al Ti K Fe
Sample Al Ti K Fe carcor 350 110 200 30ramb 5.3 36.0 16.6 15.5 carcor 0 100 30 0ramb 5.3 42.0 33.2 23.3 carcor 0 80 0 30ramb 47.6 42.0 16.6 15.5 carcor 0 50 20 20ramb 127.1 48.0 33.2 23.3 carcor 0 50 30 20ramb 111.2 60.0 16.6 38.9 carcor 0 40 20 0ramb 47.6 60.0 24.9 31.1 carcor 180 70 130 20ramb 95.3 60.0 8.3 7.8 carcor 0 100 0 20ramb 153.5 77.9 49.8 23.3 carcor 0 90 20 20ramb 5.3 42.0 8.3 15.5 carcor 240 100 130 30
carcor 250 100 160 30
15 Weinheim Rhyolite carcor 0 80 20 30
Sample Al Ti K Fe carcor 0 70 0 30wein red CL 180.0 24.0 8.3 23.3 carcor 0 80 0 40wein red CL 169.4 24.0 24.9 31.1 carcor 0 90 0 40wein red CL 142.9 24.0 16.6 23.3 carcor 0 90 20 50wein red CL 142.9 24.0 16.6 31.1 carcor 90 90 80 60wein red CL 142.9 36.0 8.3 15.5 carcor 0 50 40 70wein red CL 142.9 36.0 16.6 23.3 carcor 0 50 20 90wein red CL 148.2 42.0 8.3 15.5 carcor 0 40 0 120wein red CL 180.0 42.0 8.3 7.8 carcor 0 40 20 170wein red CL 180.0 42.0 8.3 7.8 carcor 0 40 20 250wein red CL 180.0 42.0 8.3 15.5 carcor 0 30 40 460wein red CL 158.8 42.0 8.3 23.3 carcor 0 20 30 470wein blue CL 185.3 42.0 8.3 7.8 carcor 0 130 20 30wein blue CL 52.9 42.0 16.6 23.3 carcor 0 120 20 20wein blue CL 68.8 42.0 33.2 46.6 carcor 0 100 0 40wein blue CL 153.5 48.0 16.6 15.5 carcor 0 30 20 20wein blue CL 185.3 48.0 16.6 7.8 carcor 0 100 0 40wein blue CL 148.2 48.0 16.6 15.5 carcor 0 100 0 30wein blue CL 169.4 48.0 16.6 23.3 carcor 0 120 20 20wein blue CL 158.8 54.0 16.6 7.8 carcor 0 140 20 30wein blue CL 158.8 54.0 8.3 15.5 carcor 0 110 20 20wein blue CL 74.1 54.0 16.6 31.1 carcor 0 100 0 30wein blue CL 153.5 54.0 16.6 7.8 carcor 0 100 20 20wein blue CL 148.2 54.0 8.3 15.5 carcor 0 80 0 20wein blue CL 169.4 54.0 8.3 15.5 carcor 0 90 20 0wein blue CL 158.8 54.0 8.3 7.8 carcor 0 90 0 20wein blue CL 164.1 60.0 16.6 7.8 carcor 0 120 20 20wein blue CL 169.4 60.0 8.3 31.1 carcor 0 110 20 0wein blue CL 68.8 60.0 16.6 31.1 carcor 0 110 0 0wein blue CL 164.1 60.0 24.9 23.3 carcor 0 110 0 0wein blue CL 137.6 65.9 16.6 7.8 carcor 0 100 20 0wein blue CL 158.8 65.9 16.6 23.3 carcor 0 110 0 20wein blue CL 153.5 65.9 16.6 15.5 carcor 0 120 0 30wein blue CL 185.3 65.9 16.6 7.8 carcor 0 100 30 0wein blue CL 169.4 65.9 16.6 7.8 carcor 0 120 20 0

225
List of trace element analysis of quartz (EPMA) (continued)
Barry Granodiorite Sunset Hills GraniteSample Al Ti K Fe Sample Al Ti K Fe
bary 100 60 50 0 sunset 0 60 40 30bary 230 60 110 0 sunset 0 40 20 20bary 140 60 60 0 sunset 0 30 0 0bary 220 50 110 30 sunset 0 40 0 40bary 0 60 0 0 sunset 470 30 230 40bary 260 40 0 40 sunset 0 50 0 0bary 90 90 90 20 sunset 0 90 0 0bary 0 0 20 12 sunset 150 100 90 20bary 0 0 0 50 sunset 12 90 20 20bary 0 0 30 0 sunset 12 90 20 0bary 0 0 0 0 sunset 380 80 160 0bary 110 0 60 20 sunset 12 60 20 30bary 12 20 30 0 sunset 12 160 0 30bary 12 12 12 0 sunset 90 140 50 40bary 12 70 30 0 sunset 0 100 0 40bary 160 60 80 20 sunset 0 20 0 20bary 0 60 0 0 sunset 0 50 0 0bary 0 50 0 0 sunset 510 120 20 30bary 400 60 170 20 sunset 0 120 20 20bary 0 50 0 20 sunset 0 60 20 20bary 380 60 170 20 sunset 0 50 0 0bary 160 40 70 0 sunset 0 30 20 0bary 150 50 70 0 sunset 0 0 0 20bary 150 50 60 0 sunset 0 40 0 30bary 0 20 30 20 sunset 0 0 0 20bary 180 40 80 0 sunset 0 0 0 20bary 0 40 0 0bary 0 70 20 0 Porphyritic topaz-albite granite (Ju 10)bary 360 50 170 0 Sample Al Ti K Febary 280 60 130 0 Ju_10_1 222.3 60.0 8.3 31.1bary 0 70 20 20 Ju_10_1 232.9 48.0 24.9 38.9bary 0 30 0 20 Ju_10_1 185.3 48.0 16.6 23.3bary 390 50 240 30 Ju_10_1 238.2 60.0 16.6 31.1bary 90 30 20 20 Ju_10_1 84.7 24.0 16.6 23.3bary 170 40 60 30 Ju_10_1 238.2 42.0 16.6 31.1bary 0 20 40 40 Ju_10_1 232.9 42.0 8.3 38.9bary 0 0 30 60 Ju_10_1 232.9 30.0 16.6 38.9
Ju_10_1 217.1 42.0 8.3 38.9
Sunset Hills Granite Ju_10_1 227.6 36.0 16.6 15.5
Sample Al Ti K Fe Ju_10_1 248.8 30.0 8.3 31.1sunset 0 90 0 0 Ju_10_1 254.1 42.0 24.9 31.1sunset 0 70 20 20 Ju_10_1 254.1 54.0 24.9 38.9sunset 90 80 30 0 Ju_10_1 259.4 48.0 16.6 15.5sunset 90 90 40 20 Ju_10_1 264.7 48.0 8.3 15.5sunset 0 70 0 0 Ju_10_1 259.4 54.0 16.6 23.3sunset 410 80 200 0 Ju_10_1 248.8 36.0 24.9 23.3sunset 0 60 0 0 Ju_10_1 259.4 48.0 16.6 38.9sunset 0 60 0 0 Ju_10_1 254.1 54.0 24.9 31.1sunset 310 70 180 30 Ju_10_1 264.7 54.0 16.6 54.4sunset 0 60 30 0 Ju_10_1 248.8 48.0 24.9 15.5sunset 0 100 0 0 Ju_10_1 222.3 42.0 16.6 38.9sunset 0 90 0 20 Ju_10_1 190.6 42.0 24.9 38.9sunset 130 120 70 0 Ju_10_1 232.9 48.0 16.6 23.3sunset 0 120 0 30 Ju_10_1 222.3 54.0 16.6 15.5sunset 280 0 130 20 Ju_10_1 201.2 54.0 16.6 23.3sunset 0 140 0 20 Ju_10_1 190.6 60.0 16.6 31.1sunset 450 50 250 200 Ju_10_1 174.7 54.0 24.9 31.1sunset 200 70 120 20 Ju_10_1 206.5 48.0 24.9 23.3sunset 240 30 110 0 Ju_10_1 248.8 65.9 33.2 15.5sunset 140 60 70 0 Ju_10_1 211.8 54.0 16.6 23.3sunset 170 70 70 0 Ju_10_1 217.1 48.0 16.6 15.5
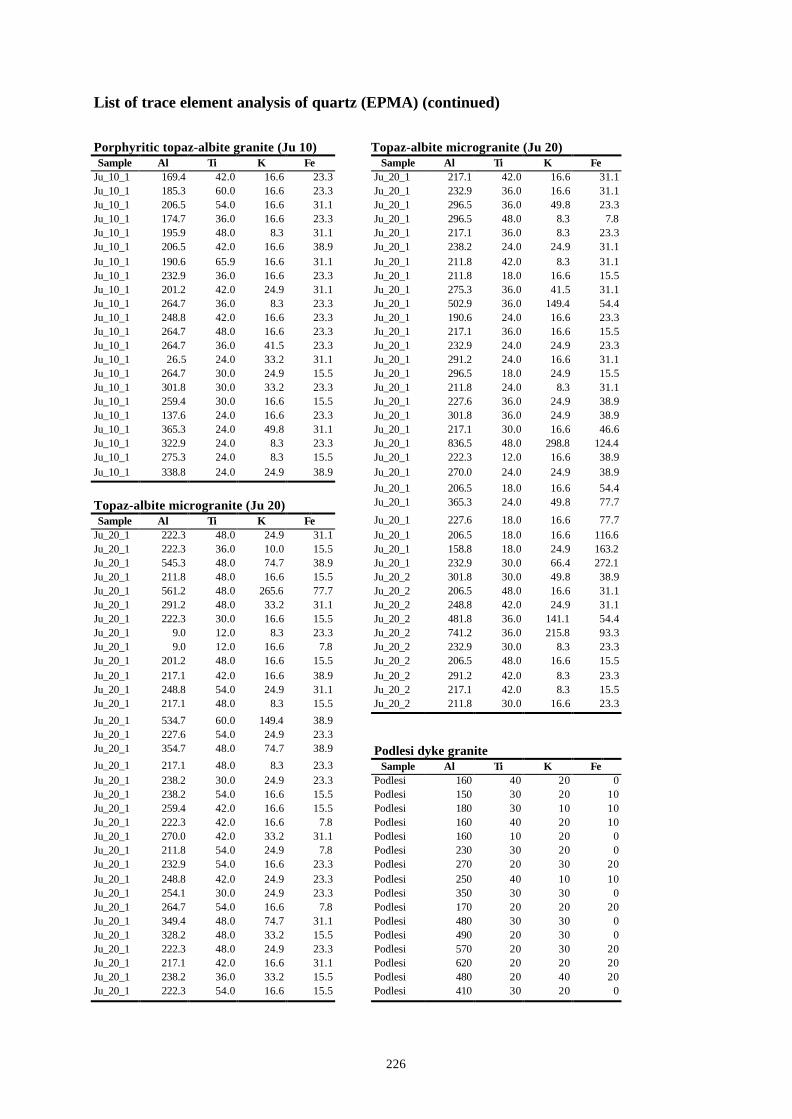
226
List of trace element analysis of quartz (EPMA) (continued)
Porphyritic topaz-albite granite (Ju 10) Topaz-albite microgranite (Ju 20)Sample Al Ti K Fe Sample Al Ti K Fe
Ju_10_1 169.4 42.0 16.6 23.3 Ju_20_1 217.1 42.0 16.6 31.1Ju_10_1 185.3 60.0 16.6 23.3 Ju_20_1 232.9 36.0 16.6 31.1Ju_10_1 206.5 54.0 16.6 31.1 Ju_20_1 296.5 36.0 49.8 23.3Ju_10_1 174.7 36.0 16.6 23.3 Ju_20_1 296.5 48.0 8.3 7.8Ju_10_1 195.9 48.0 8.3 31.1 Ju_20_1 217.1 36.0 8.3 23.3Ju_10_1 206.5 42.0 16.6 38.9 Ju_20_1 238.2 24.0 24.9 31.1Ju_10_1 190.6 65.9 16.6 31.1 Ju_20_1 211.8 42.0 8.3 31.1Ju_10_1 232.9 36.0 16.6 23.3 Ju_20_1 211.8 18.0 16.6 15.5Ju_10_1 201.2 42.0 24.9 31.1 Ju_20_1 275.3 36.0 41.5 31.1Ju_10_1 264.7 36.0 8.3 23.3 Ju_20_1 502.9 36.0 149.4 54.4Ju_10_1 248.8 42.0 16.6 23.3 Ju_20_1 190.6 24.0 16.6 23.3Ju_10_1 264.7 48.0 16.6 23.3 Ju_20_1 217.1 36.0 16.6 15.5Ju_10_1 264.7 36.0 41.5 23.3 Ju_20_1 232.9 24.0 24.9 23.3Ju_10_1 26.5 24.0 33.2 31.1 Ju_20_1 291.2 24.0 16.6 31.1Ju_10_1 264.7 30.0 24.9 15.5 Ju_20_1 296.5 18.0 24.9 15.5Ju_10_1 301.8 30.0 33.2 23.3 Ju_20_1 211.8 24.0 8.3 31.1Ju_10_1 259.4 30.0 16.6 15.5 Ju_20_1 227.6 36.0 24.9 38.9Ju_10_1 137.6 24.0 16.6 23.3 Ju_20_1 301.8 36.0 24.9 38.9Ju_10_1 365.3 24.0 49.8 31.1 Ju_20_1 217.1 30.0 16.6 46.6Ju_10_1 322.9 24.0 8.3 23.3 Ju_20_1 836.5 48.0 298.8 124.4Ju_10_1 275.3 24.0 8.3 15.5 Ju_20_1 222.3 12.0 16.6 38.9Ju_10_1 338.8 24.0 24.9 38.9 Ju_20_1 270.0 24.0 24.9 38.9
Ju_20_1 206.5 18.0 16.6 54.4
Topaz-albite microgranite (Ju 20) Ju_20_1 365.3 24.0 49.8 77.7
Sample Al Ti K Fe Ju_20_1 227.6 18.0 16.6 77.7Ju_20_1 222.3 48.0 24.9 31.1 Ju_20_1 206.5 18.0 16.6 116.6Ju_20_1 222.3 36.0 10.0 15.5 Ju_20_1 158.8 18.0 24.9 163.2Ju_20_1 545.3 48.0 74.7 38.9 Ju_20_1 232.9 30.0 66.4 272.1Ju_20_1 211.8 48.0 16.6 15.5 Ju_20_2 301.8 30.0 49.8 38.9Ju_20_1 561.2 48.0 265.6 77.7 Ju_20_2 206.5 48.0 16.6 31.1Ju_20_1 291.2 48.0 33.2 31.1 Ju_20_2 248.8 42.0 24.9 31.1Ju_20_1 222.3 30.0 16.6 15.5 Ju_20_2 481.8 36.0 141.1 54.4Ju_20_1 9.0 12.0 8.3 23.3 Ju_20_2 741.2 36.0 215.8 93.3Ju_20_1 9.0 12.0 16.6 7.8 Ju_20_2 232.9 30.0 8.3 23.3Ju_20_1 201.2 48.0 16.6 15.5 Ju_20_2 206.5 48.0 16.6 15.5Ju_20_1 217.1 42.0 16.6 38.9 Ju_20_2 291.2 42.0 8.3 23.3Ju_20_1 248.8 54.0 24.9 31.1 Ju_20_2 217.1 42.0 8.3 15.5Ju_20_1 217.1 48.0 8.3 15.5 Ju_20_2 211.8 30.0 16.6 23.3
Ju_20_1 534.7 60.0 149.4 38.9Ju_20_1 227.6 54.0 24.9 23.3Ju_20_1 354.7 48.0 74.7 38.9 Podlesi dyke graniteJu_20_1 217.1 48.0 8.3 23.3 Sample Al Ti K FeJu_20_1 238.2 30.0 24.9 23.3 Podlesi 160 40 20 0Ju_20_1 238.2 54.0 16.6 15.5 Podlesi 150 30 20 10Ju_20_1 259.4 42.0 16.6 15.5 Podlesi 180 30 10 10Ju_20_1 222.3 42.0 16.6 7.8 Podlesi 160 40 20 10Ju_20_1 270.0 42.0 33.2 31.1 Podlesi 160 10 20 0Ju_20_1 211.8 54.0 24.9 7.8 Podlesi 230 30 20 0Ju_20_1 232.9 54.0 16.6 23.3 Podlesi 270 20 30 20Ju_20_1 248.8 42.0 24.9 23.3 Podlesi 250 40 10 10Ju_20_1 254.1 30.0 24.9 23.3 Podlesi 350 30 30 0Ju_20_1 264.7 54.0 16.6 7.8 Podlesi 170 20 20 20Ju_20_1 349.4 48.0 74.7 31.1 Podlesi 480 30 30 0Ju_20_1 328.2 48.0 33.2 15.5 Podlesi 490 20 30 0Ju_20_1 222.3 48.0 24.9 23.3 Podlesi 570 20 30 20Ju_20_1 217.1 42.0 16.6 31.1 Podlesi 620 20 20 20Ju_20_1 238.2 36.0 33.2 15.5 Podlesi 480 20 40 20Ju_20_1 222.3 54.0 16.6 15.5 Podlesi 410 30 20 0

227
List of trace element analysis of quartz (EPMA) (continued)
Podlesi dyke granite Schellerhau SG3Sample Al Ti K Fe Sample Al Ti K Fe
Podlesi 410 20 0 0 Schell G27 330 20 0 10Podlesi 570 20 30 10 Schell G28 10 20 20 0Podlesi 400 10 20 10 Schell G29 370 20 0 10Podlesi 2000 20 30 10 Schell G30 270 40 10 10Podlesi 280 40 20 10 Schell G31 100 30 10 0Podlesi 390 20 20 10 Schell G32 10 0 10 0Podlesi 2000 30 1140 90 Schell G33 80 20 20 10Podlesi 130 20 20 20 Schell G34 70 30 10 0Podlesi 220 20 10 10 Schell G35 130 40 0 10Podlesi 120 10 20 20 Schell G36 520 30 20 10Podlesi 160 20 60 0 Schell G37 130 40 10 0Podlesi 490 30 170 0 Schell G38 130 30 10 20Podlesi 570 30 150 0 Schell G39 0 40 10 10Podlesi 120 10 30 10 Schell G40 160 30 20 0Podlesi 130 10 10 20 Schell G41 230 20 20 0Podlesi 2000 50 20 90 Schell G42 130 20 10 0Podlesi 880 30 30 40 Schell G43 230 10 0 10Podlesi 260 20 20 40 Schell G44 100 20 0 0Podlesi 280 20 10 50 Schell G45 70 20 10 0Podlesi 180 10 20 60 Schell G46 30 0 10 0Podlesi 280 20 40 90 Schell G47 30 10 0 0Podlesi 510 30 80 110 Schell G48 40 10 10 10
Schell G49 0 30 10 20Schell G50 30 10 0 10
Schellerhau SG3 Schell G51 80 10 50 10
Sample Al Ti K Fe Schell G52 40 20 10 10Schell G3 720 60 10 20 Schell G53 30 0 0 0Schell G4 120 50 10 10 Schell G54 20 30 0 0Schell G5 50 20 0 10 Schell G55 10 10 10 0Schell G6 490 20 10 0 Schell G56 30 20 10 0Schell G7 10 10 10 0 Schell G57 30 20 0 0Schell G8 30 30 10 0 Schell G58 10 20 0 10Schell G9 30 30 10 20 Schell G59 0 20 0 0Schell G10 280 10 20 10 Schell G60 0 10 0 0Schell G11 370 30 10 10 Schell G61 0 10 10 10Schell G12 280 50 10 10 Schell G62 0 0 0 0Schell G13 280 40 10 0 Schell G63 0 20 20 10Schell G14 270 40 10 10 Schell G64 0 20 10 0Schell G15 1810 30 0 10 Schell G65 0 10 10 10Schell G16 410 40 20 20 Schell G66 0 10 0 10Schell G17 580 20 10 0 Schell G67 0 20 10 10Schell G18 240 60 20 30 Schell G68 0 0 10 0Schell G19 690 20 20 10 Schell G69 0 0 0 10Schell G20 500 20 0 0 Schell G70 0 10 0 0Schell G21 1150 40 0 0 Schell G71 0 0 10 10Schell G22 1740 40 50 10 Schell G72 0 20 0 10Schell G23 260 30 20 10 Schell G73 0 30 20 0Schell G24 380 20 20 0 Schell G74 0 20 10 0Schell G25 350 10 10 0 Schell G75 0 30 20 10Schell G26 30 20 20 0 Schell G76 0 10 0 0

228
Appendix E
List of trace element analysis of quartz (SIMS) given in relative concentrations (X/30Si)
1 MegaquartzSample 6Li/30Si 23Na/30Si 27Al/30Si 39K/30Si 48Ti/30Si 54Fe/30Si
Hak01 2.16E-04 3.78E-05 1.54E-02 2.12E-05 2.52E-06 2.88E-06Hak02 1.06E-05 1.51E-05 3.10E-03 1.72E-05 1.14E-06 2.67E-07Hak03 2.84E-04 2.39E-05 1.50E-02 9.12E-06 2.07E-06 2.75E-06Hak04 2.21E-04 1.69E-05 1.03E-02 5.36E-06 1.82E-06 2.15E-06Hak05 3.02E-04 1.92E-05 1.53E-02 6.55E-06 1.66E-06 3.48E-06Hak06 7.17E-06 1.93E-05 7.87E-04 1.09E-05 8.76E-12 1.47E-07
8 Aue GraniteSample 6Li/30Si 23Na/30Si 27Al/30Si 39K/30Si 48Ti/30Si 54Fe/30Si
AUE01 5.20E-04 3.86E-04 2.80E-02 6.64E-04 1.82E-04 1.40E-05AUE02 5.25E-04 1.43E-04 2.56E-02 1.27E-04 1.77E-04 1.13E-05AUE03 4.90E-04 1.79E-04 2.53E-02 1.30E-04 1.90E-04 1.28E-05AUE04 3.90E-04 1.70E-04 2.10E-02 1.23E-04 2.04E-04 1.20E-05AUE05 4.16E-04 1.06E-04 2.05E-02 6.77E-05 1.92E-04 9.15E-06AUE06 3.04E-04 1.06E-04 1.56E-02 7.66E-05 2.22E-04 7.41E-06AUE07 2.89E-04 1.51E-04 1.60E-02 9.13E-05 2.24E-04 8.69E-06AUE08 1.29E-04 1.92E-04 1.16E-02 1.49E-04 2.70E-05 6.15E-06AUE10 3.25E-04 2.81E-04 2.14E-02 2.36E-04 2.02E-04 1.26E-05AUE11 1.23E-04 9.85E-04 1.47E-02 4.32E-04 1.33E-04 9.44E-06AUE12 1.79E-04 4.69E-04 1.77E-02 1.97E-04 2.07E-04 1.08E-05AUE14 1.87E-04 3.08E-04 1.53E-02 1.54E-04 2.10E-04 9.91E-06AUE15 1.89E-04 3.70E-04 1.62E-02 1.96E-04 2.06E-04 1.15E-05AUE17 1.73E-04 2.24E-04 1.50E-02 1.46E-04 1.89E-04 1.10E-05AUE18 2.23E-04 1.80E-04 1.60E-02 1.28E-04 1.92E-04 1.07E-05AUE19 2.33E-04 1.77E-04 1.67E-02 1.29E-04 2.01E-04 1.11E-05AUE20 3.23E-04 1.87E-04 2.31E-02 1.47E-04 2.31E-04 1.83E-05AUE21 3.26E-04 1.48E-04 1.67E-02 9.06E-05 2.26E-04 8.31E-06AUE24 2.26E-04 1.49E-04 1.67E-02 1.10E-04 2.23E-04 1.60E-05AUE25 2.79E-04 2.32E-04 2.14E-02 1.49E-04 1.39E-04 2.94E-05AUE27 1.17E-04 3.38E-04 1.38E-02 1.85E-04 8.42E-06 5.52E-05AUE28 1.90E-04 1.44E-03 2.93E-02 3.74E-04 1.28E-04 3.01E-05AUE29 1.89E-04 6.53E-04 1.98E-02 4.89E-04 0.000129 2.78E-05AUE30 2.26E-04 2.94E-04 2.08E-02 2.15E-04 1.27E-04 2.23E-05AUE31 2.89E-04 3.28E-04 2.37E-02 2.71E-04 1.27E-04 2.35E-05AUE32 2.46E-04 5.01E-04 2.21E-02 3.28E-04 1.37E-04 2.02E-05AUE33 2.22E-04 4.98E-04 2.15E-02 3.52E-04 1.59E-04 2.20E-05AUE35 1.49E-04 4.71E-04 1.74E-02 3.85E-04 2.06E-04 1.82E-05AUE36 1.63E-04 3.99E-04 1.78E-02 2.12E-04 2.03E-04 1.61E-05AUE38 2.90E-04 4.33E-04 2.78E-02 3.14E-04 9.90E-05 2.98E-05AUE39 1.31E-04 8.14E-04 1.64E-02 5.72E-04 1.64E-04 1.85E-05AUE40 2.54E-04 2.80E-04 1.87E-02 2.00E-04 2.00E-04 1.91E-05
15 Weinheim RhyoliteSample 6Li/30Si 23Na/30Si 27Al/30Si 39K/30Si 48Ti/30Si 54Fe/30Si
Rhy01 2.32E-04 2.05E-04 1.83E-02 1.87E-04 1.76E-04 2.26E-05Rhy02 2.18E-04 2.16E-04 1.61E-02 1.94E-04 2.26E-04 1.90E-05Rhy04 9.44E-05 2.43E-04 1.66E-02 2.11E-04 2.44E-04 1.91E-05Rhy05 1.10E-04 2.39E-04 1.63E-02 2.15E-04 2.37E-04 2.02E-05Rhy06 9.01E-05 2.19E-04 1.61E-02 1.98E-04 2.38E-04 1.89E-05Rhy07 9.22E-05 2.52E-04 1.53E-02 2.18E-04 2.28E-04 1.87E-05Rhy08 1.34E-04 2.66E-04 1.75E-02 2.53E-04 1.86E-04 2.09E-05Rhy09 2.46E-04 1.35E-03 3.20E-02 3.04E-03 2.97E-04 4.04E-05Rhy10 2.91E-04 2.60E-03 3.38E-02 3.34E-03 3.07E-04 4.31E-05Rhy11 3.66E-04 6.38E-04 2.29E-02 7.56E-04 2.41E-04 3.06E-05Rhy13 2.79E-04 2.70E-04 1.64E-02 2.31E-04 7.65E-05 1.93E-05Rhy14 2.18E-04 2.47E-04 1.40E-02 1.98E-04 4.64E-05 1.80E-05Rhy15 1.55E-04 1.53E-03 1.94E-02 1.03E-03 1.29E-04 5.97E-05

229
Curriculum vitae
Date & place of birth: 2 June 1970, Dresden, Germany
Education: 1977-1983 Polytechnische Oberschule, Dresden
1983-1987 Polytechnische Oberschule, Leipzig
1987-1989 Abitur, Halle
1989-1990 Civil Service
1990-1993; Mining Academy Freiberg
1993-1996; University Göttingen
Diploma in Geology/Paleontology
Advisor: H.-J. Behr
Co-advisor: D. Helmcke
Thesis: Part I - Investigation of magmatic, metamorphic
and hydrothermal quartz from the Oberpfalz/Germany
with thermal acoustic emission analysis [in German];
Part II – Geological mapping SE of the Flossenbürg
Granite Massif, Oberpfalz, Germany [in German]
1996-1997; University Göttingen
Work on DEKORP-Project: Development and
application of gravimetric methods for the evidence of
steep dipping structures in seismic profiles
1997-2000; University Göttingen
Ph.D. Studies in Earth Sciences
Advisor: H.-J. Behr
Co-advisor: K. Weber
Thesis: Cathodoluminescence and characterisation of
defect structures in quartz with applications to the study
of granitic rocks
Copyright © 2022 FDOKUMEN