the preparation, characterisation and - CiteSeerX
317
OCTOBER 1987 THE PREPARATION, CHARACTERISATION AND CATALYTIC ACTIVITY OF TUNGSTEN BRONZES THESIS SUBMITTED FOR THE DEGREE OF DOCTOR OF PHILOSOPHY BY SHEENA STEVENSON Department of Chemistry, Brunel University, Uxbridge, Middlesex.
-
Upload
khangminh22 -
Category
Documents
-
view
0 -
download
0
Transcript of the preparation, characterisation and - CiteSeerX

OCTOBER 1987
THE PREPARATION, CHARACTERISATION AND
CATALYTIC ACTIVITY OF TUNGSTEN BRONZES
THESIS SUBMITTED FOR THE DEGREE OF
DOCTOR OF PHILOSOPHY
BY
SHEENA STEVENSON
Department of Chemistry, Brunel University, Uxbridge, Middlesex.

- i -
A C K NOW LED GEM E N T S
I would like to thank my supervisor, Dr. P.A. Sermon for his
constant encouragement and advice throughout the work described
in this thesis.
I would also like to thank my colleagues in the Chemistry
Department for their friendship and support.
I wish to thank the technical staff of the Chemistry Department
for their invaluable assistance.
I would also like to thank Mrs. Speed for typing this thesis.
-----000-----

- ii -
A B S T RAe T
The structure and catalytic aspects of tungsten bronzes have
been considered. A series of potassium tungsten bronzes, KxW0 3,
0.05 ~ x ~ 0.8, and the corresponding series of sodium tungsten
bronzes, Na xW03, 0.05 ~ x ~ 0.8 were prepared by a thermal method.
The thermal stability of the prepared samples was studied in the
presence of both an oxidising and a reducing gas. The number and
strength of acid sites present on the bronzes was studied by
temperature-programmed desorption of ammonia. Xps, xrd and elect
rical resistivity measurements gave information about the bulk and
surface properties of the bronzes. The activity of the tungsten
bronzes for isopropanol decomposition and propene metathesis was
investigated. In addition, a silica-supported tungsten bronze and
a copper-potassium tungsten bronze, CUyKxW03, were prepared. Their
structures and catalytic values were considered.

TO MY FAMILY
j
j
j
j
j
j
j
j
j
j
j
j
j
j
j
j
j
j
j
j
j
j
j
j
j
j
j

ACKNOWLEDGEMENTS
ABSTRACT
CHAPTER 1
INTRODUCTION
1.1 Oxide Bronzes
- iii -
CON TEN T S
1.2 Structures of Oxide Bronzes
1.3 Properties of Oxide Bronzes
1.3.1 Electronic Properties
1.3.2 Magnetic Properties
1.3.3 Optical Properties
1.3.4 Chemical Properties
1.4 Preparation of Oxide Bronzes
1.5 Catalysis - general theo~ies
1.6 Catalysis and Solid State Chemistry
1.6.1 Oxide Bronzes as Catalysts
1.6.2 Alcohol Decomposition
1.6.3 Alkene Metathesis
1.6.4 Ammonia Synthesis on Supported Potassium
Tungsten Bronzes
1.6.5 Methanol Synthesis and the Water-Gas-Shift
Reaction on Copper Based Catalysts.
1.7 Present Study
REFERENCES
CHAPTER 2
PREPARATION OF POTASSIUM AND SODIUM TUNGSTEN BRONZES
2. 1 Introduction
Page No.
i
i i
1
11
11
15
16
16
17
18
19
19
20
20
22
24
25
27
31

Page No.
2.2 Synthesis of Tungsten Bronzes 31
2.3 Present Methods of Preparation
2.3.1 Potassium and Sodium Bronzes 33
2.3.2 Supported Potassium Bronze 34
2.3.3 CUyKxW03 34
REFERENCES 37
CHAPTER 3
PHYSICAL CHARACTERISATION AND SURFACE MORPHOLOGY
3. 1 Introduction 39
3.2 The BET Method of Surface Area Determination 40
3.3 Surface Acidity
3.3. 1 Nature of Surface Acidity 42
3.3.2 Measurement of Surface Acidity 45
3.3.2.1 Non-aqueous Titrations 45
3.3.2.2 Aqueous Titrations 46
3.3.2.3 Infra-red Spectroscopy 46
3.3.2.4 Tpd of Chemisorbed Bases 46
3.4 Transmission Electron Microscopy 47
3.5 Experimental Procedures
3.5.1 Krypton Adsorption Measurement 48
3.5.2 Tpd of Ammonia 50
3.5.3 Transmission Electron Microscopy 52
3.6 Results
3.6.1 BET Surface Area 53
3.6.2 Tpd of Amnonia 54
3.6.3 Transmission Electron Microscopy 58
REFERENCES 63

CHAPTER 4
THERMAL ANALYSIS
4.1 Introduction
4.1.2 Thermal Methods of Analysis
4.2 Experimental Thermal Analysis
4.2.1 Tga and Ota Techniques
4.2.2 Tpr Technique
4.2.3 Tpo Technique
4.3 Results
4.3.1 Tga and Ota Results
4.3.1.1 Reduction of W0 3 and the Potassium Tungsten
Bronzes
4.3.1.2 Reduction of the Sodium Tungsten Bronzes
4.3.2 Tpr Results
4.3.2.1 Reduction of W03 4.3.2.2 Reduction of Potassium Tungsten Bronzes
4.3.2.3 Reduction of Sodium Tungsten Bronzes
4.3.3. Tpo Results
4.3.3.1 Oxidation of W Powder and Potassium Tungsten
Bronzes
4.3.3.2 Oxidation of Sodium Tungsten Bronzes
4.4 Conclusions
REFERENCES
CHAPTER 5
X-RAY DIFFRACTION STUDIES
5.1 Introduction
5.2 Theory
5.3 Crystal Planes and Lattice Spacing
Page No.
64
65
65
66
67
67
68
70
71
71
72
73
75
76
78
79
81
83
5.4 Apparatus and Procedure
5.5 Results
5.5.1 X-ray Diffractometer Studies
5.5.2 . W Powder, W03, K2W04 and Na 2W04 5.5.3 Potassium Tungsten Bronzes
5.5.4 Sodium Tungsten Bronzes
REFERENCES
CHAPTER 6
X-RAY PHOTOELECTRON SPECTROSCOPY
6.1 Introduction
·6.2 Experimental Procedure
6.3 Results
6.3.1 Calculation of Oxidation States
6.3.2 Experimental Results
6.3.3 W, W03, K2W04 and Na2W04 6.3.4 Potassium and Sodium Tungsten Bronzes
6.4 Conclusions
REFERENCES
CHAPTER 7
ELECTRICAL RESISTIVITY
7.1 Introduction
7.2 Experimental Procedure
7.3 Electrical Resistivity Results
7.4 Conclusions
REFERENCES
CHAPTER 8
CATALYTIC ACTIVITY FOR ISOPROPANOL DECOMPOSITION
8.1 Introduction
Page No.
85
85
86
86
94
99
100
103
103
104
104
105
106
108
109
113
114
116
120
121

8.2 Experimental Procedure
8.3 Results
8.4 Conclusions
REFERENCES
CHAPTER 9
CATALYTIC ACTIVITY FOR PROPENE METATHESIS
9. , Introduction
9.2 Experimental Procedure
9.3 Results
9.4 Conclusions
REFERENCES
CHAPTER 10
A SILICA-SUPPORTED BRONZE AND A COPPER BRONZE
10. 1 Introduction
10.1.1 Supported Catalysts
10.1.2 Copper Catalysts
10.1.3 Cata1ysed Reactions
(i ) The Water-Gas-Shift Reaction
(i i ) Methanol Synthesis
(i i i ) Ammonia Synthesis
(i v) N20 Decomposition
10.2 Experimental Procedures
Page No.
124
127
130
137
138
141
144
148
151
152
153
154
155
155
157
158
160
10.2.1 Physical Characterisation of the Silica-Supported 161
Bronze and CUyKxW03 10.2.2 The Water-Gas-Shift Reaction 161
10.2.3 Methanol Synthesis 162
10.2.4 Ammonia Synthesis 163
10.2.5 N20 Decompostion 164

Page No.
10.3 Results
10.3.1 The Silica-Supported Bronze 164
10.3.1.1 Tpr 164
1 O. 3. 1. 2 X rd 1 65
10.3.1.3 Xps 166
10.3.1.4 Activity of the Supported Bronze for 167
Ammonia Synthesis
10.3.2 CUyKxW03 10.3.2.1 Tpr 168
REFERENCES
CHAPTER 11
CONCLUSIONS
REFERENCES
APPENDIX
10.3.2.2 Xrd 169
10.3.2.3 Xps 169
10.3.2.4 N20 Decomposition 172
1Q.3.2.5 Methanol Synthesis and The Water-Gas- 173
Shift Reaction
176
179
189

- 1 -
CHAPTER 1
INTRODUCTION
1.1 Oxide Bronzes
The term 'oxide bronze ' is commonly used to describe ~ class
of ternary oxide phases AxMOn' formally derived by insertion of an
electropositive element, A, into an oxide matrix MOn of a transition
metal M. Typical parent oxides MOn include those of W, Mo, V and Ti,
where Mis in its hi ghest oxi dati on state. The structures ad"opted
bv the MOn matrices in these compounds are closely related to (but
not identical with) those of the normal oxides and involve open co
valent frameworks of linked metal-oxygen polyhedra enclosing sites
available for occupation by the A species. The electropositive
element A, for example an alkali metal, enters the matrix as a cation
and the average oxidation state of M is lowered accordingly.
As early as 1823, Wohler(l) prepared sodium tungsten bronzes
and somewhat later Laurent(2), von Knorre(3), and Schafer(4) reported
the same type of compounds with potassium, lithium and rubidium
respectively. These compounds were believed to be stoichiometric
until 1935 when Hagg(5) in an x-ray diffraction study found that
sodium tungsten bronzes of cubic symmetry belonged to a continuous
series of solid solutions.
1.2 Structures of Oxide Bronzes
In AxMOn, the transition metal, M is usually in a high oxidation
state and has a small crystal radius relative to 02-. It exerts
strong directional bonding effects on its neare~t neighbours in the

- 2 -
crystal. Accordingly tunnel and layer structures occur, consisting
of linked polyhedra. Such structural types can accommodate a large
variation in A content, either in the interstices or between the
layers.
The common structural unit of the transition metal oxides that
form oxide bronzes is the MOG octahedron. The octahedra may be
essentially regular, as found in W, Ti and Nb oxides, or severely
deformed, as observed in the vanadium oxides where the coordination
is closer to that of a trigonal bipyramid. The mode of linking the
octahedra (i.e. vertex, edge or face sharing), also differs sign
ificantly among these transition metals. The possibilities are
restricted by the stoichiometry of the framework, a small ratio of
oxygen to metal atoms precluding extensive vertex sharing, but even
when the stoichiometry is the same the transition metals exhibit
individual behaviour. For example, W03 consists entirely of vertex
shared octahedra whereas Mo03 is a layer structure of edge-shared
octahedra.
The differences in the coordination of the transition metals in
their oxides also persist in the bronzes which often possess structures
closely related to the parent oxide.. Thus, observed are the tunnel
structures of the tungsten bronzes, the layer structures of the
molybdenum bronzes and the complex vanadium bronzes containing irreg
ular coordination. The geometry of the structure depends on the
number of A ions to be inserted, their size, and their coordination
requirements. The extent to which these requirements are met is
determined by the flexibility of the host framework. This varies
widely among the transition metals that form bronzes and is
responsible for the very different types of structure observed.

- 3 -
Despite the complexity and variety of bronze structures, it is
possible to describe their structures in terms of surprisingly few
simple groups of octahedra. This is an approach that has been
emphasised by Wadsley in transition metal oxide chemistry(6} and
implies an extended covalent bonded system beyond the immediate environ
ment of the metal atom. Attention here will be focused on the simple
tunnel structures of W, which consist of three-dimensional frameworks
constructed from infinite chains of octahedra, the octahedral clusters
of the molybdenum bronzes and the vanadium bronzes which contain
common ri bbons and sheets of octahedr'a.
Tungsten Bronzes
All the known tungsten bronze structures contain a three
dimensional tunnel framework of the host lattice of stoichiometry W03,
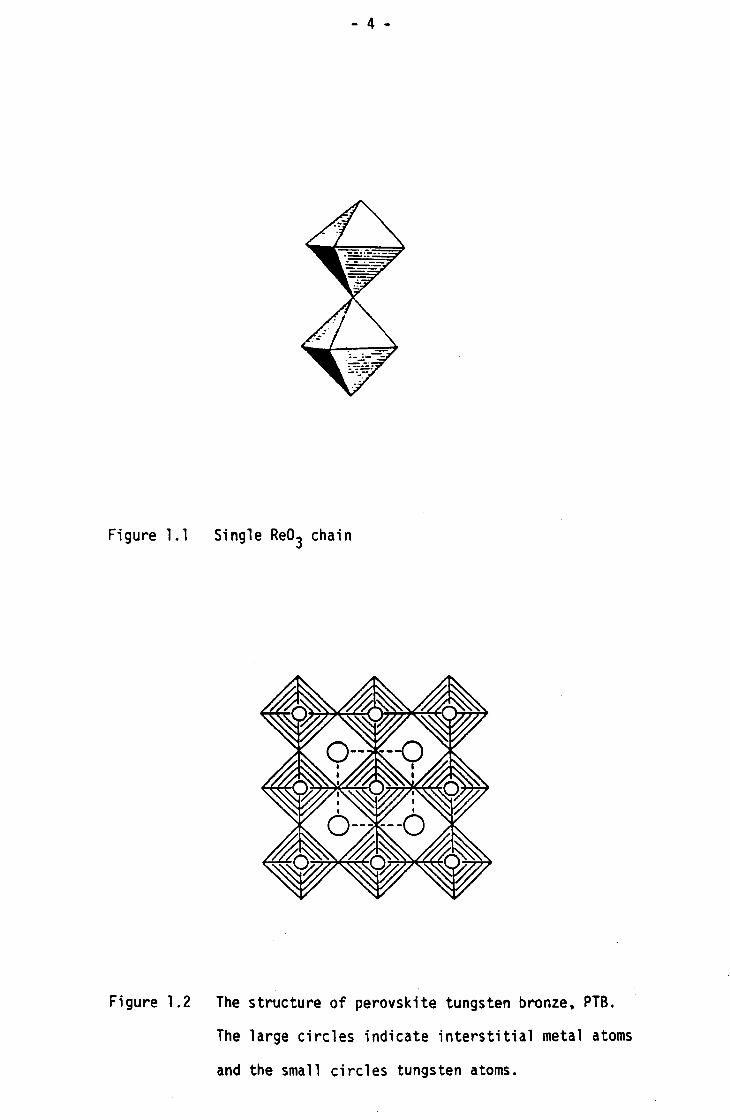
consisting of single Re03 chains (Figure l.l) which share all
equatorial vertices with four other chains.
Alkali metal tungsten bronzes adopt four different types of
structures. These are (i) perovskite tungsten bronzes, PTB, (ii)
tetragonal tungsten bronzes, TTB, (iii) hexagonal tungsten bronzes,
HTB and (iv) intergrowth tungsten bronzes.
Perovskite tungsten bronzes are formed only by lithium and
sodium at atmospheric pressure. The perovskite type structure
exhibits the highest symmetry among the bronze structures. It is
analogous to that of perovskite, AB03 but with the A positions only
partially occupied. It can also be regarded as consisting of four
membered rings of W06 octahedra forming tunnels of square cross
section running along the cube axes as shown in Figure 1.2. The
- 4 -
Figure 1.1 Single Re03 chain
Figure 1.2 The structure of perovskite tungsten bronze. PTB.
The large circles indicate interstitial metal atoms
and the small circles tungsten atoms.

- 5 -
maximum radius of the sphere that can be accommodated in the 12 co
ordinated sites (square tunnels) formed by the regular W06 octahedra
is 0.13nm (assuming r02- = 0.14nm and a = 0.38nm). This permits only
light alkali atoms (lithium and sodium) to occupy these sites.
Potassium, rubidium and cesium have effective ionic radii greater than
0.13nm and do not form PTB phases at atmospheric pressure. Magneli(7)
determined the structure of a sodium bronze of composition, Na O. 10W03.
This phase is very closely related to that of a perovskite bronze.
The tungsten atoms in this phase are displaced in alternating directions
along the c-axis forming puckered layers. Due to this puckering the
unit cell becomes tetragonal rather than cubic and the cell volume is
doubled. This phase also forms with lithium.
Among the alkali metals only sodium and potassium form tetragonal
tungsten bronzes. The structure can be regarded as built up of three -
four - and five-membered rings of W06 octahedra as shown in Figure 1.3.
The interstitial holes thus formed are of three types: trigonal,
tetragonal and pentagonal. The tungsten atoms in potassium TTB lie
in the same plane and are thus not puckered. However, in the corres
ponding sodium TTB phase, the tungsten atoms form puckered layers when
x is 0.33 while they lie in the same plane when x is 0.48. The
alkali metal atoms are located in the tetragonal and pentagonal
tunnels. If all these available sites are completely filled x becomes
0.66.
The hexagonal tungsten bronzes are formed by a considerable
number of elements. Like TTB it is built up of W06 octahedra sharing
corners and arranged in layers normal to the hexagonal axis stacked
on top of each other and connected by common corners perpendicular
to this axis as shown in Figure 1.4. The W06 octahedra form a network

- 6 -
Figure 1.3 The crystal structure of tetragonal tungsten bronze,
TTB, projected onto the xy plane. The W06 octahedra
are shown shaded. The 1 arge open and fill ed ci rc 1 es
indicate the alkali metal atoms, located in tetra-
gonal and pentagonal tunnels respectively.
of three and six membered rings. The unit cell of the hexagonal phase
contains two W06 layers along the hexagonal axis, which differ only
by a small displacement of the atoms in opposite directions. The
alkali metal atoms normally occupy the hexagonal tunnels only. The
maximum theoretical x is 0.33 when-the tunnels are completely occupied.
At atmospheric pressure only the heavier alkali HTB's (i.e. involving
K, Rb and Cs) are stable. (Thus those of Na and Li HTB's can only
be prepared exclusively at high pressure(8». Mixed HTB's in which
one of the alkali metals is sodium or lithium are also known(9).
In the case of(K,Li)x W03 Banks and Goldstein{lO) have shown that the
smaller Li ions are probably located in the tunnels of trigonal cross-
section, because the maximum value of x is as high as 0.51.

- 7 -
Figure 1.4 The crystal structure of hexagonal tungsten bronze, HTB.
The small circles represent tungsten atoms. The displace
ments of the tungsten atoms in this layer with respect to
the corresponding atoms in the layers above and below are
shown by arrows. The large circles in the hexagonal
tunnels are the alkali metal atoms (K, Rb and Cs). The
unit cell extends over two layers.
A fourth type of bronze, called "Intergrowth tungsten bronze,
ITB" was discovered recently(ll}. This type forms with potassium,
rubidium, cesium and also with thallium. The structure type shown
in Figure 1.5 can be regarded as an intergrowth of HTB and W03 slabs.
The W06 octahedra in the W03 slabs are tilted through 150 (ideally)
in an alternating sequence to make the two structure elements fit
together. The alkali metals are located in the hexagonal tunnels.
ITB's are formed at very low concentrations (x < 0.10) of the heavy
alkali metals.

- 8 -
WO HTB t----
Figure 1.5 The structure of an intergrowth tungsten bronze. The
HTS and W03 slabs are marked. The large circles in
the hexagonal tunnels indicate the positions of the
heavy alkali metal atoms.
Molybdenum Bronzes
Mo03 itself has a layer structure. The layers consist of double
Re03 chains sharing edges in the staggered manner shown in Figure 1.6.
In the hydrogen molybdenum bronze, HxMo03, the H atoms are inserted as
hydroxyl groups· between the layers, in the basic framework. The
lithium molybdenum bronze, Li xMo03 is also closely related structurally
to the parent oxide. In contrast the well characterised molybdenum
bronzes Ko.33Mo03 and KxMo03 (0.28 ~ x ~ 0.30) have structures derived
from octahedral clusters. The red Ka.33MoOJ phase contains a cluster
of six octahedra as shown in Figure 1.7. The potassium ions complete
ly occupy pos; tions of i rregul ar e; ghtfol,d coordination and bond the I ;,
layers together, with a theoretical composition limit of x = 0.33.

- 9 -
(a)
(c)
(b)
Figure 1.6 (a) The double Re03 chain,
(b) Projection ·a1ong chain axis and,
(c) Mo03 layer structure.
Blue KxMo03 (0.28 ~ x ~ 0.30) contains a different cluster consisting
of ten edge-shared octahedra as shown in Figure 1.8. The potassium
ions again occupy sites between the layers which are fully occupied
at x • 0.30. The molybdenum bronzes have been found to be much less
stable than the tungsten bronzes, due mainly, to the tendency of
molybdenum +5 to disproportionate.
Vanadium Bronzes
The idealized V205 structure Figure 1.9(a) can be generated by
linking together single octahedral ribbons, Figure 1.9(b), formed by
sheari ng two: Re03 chai ns together along cOl1lllOn octahedral edges.:
Each ribbon connects via its free vertices to four similar ribbons.

- 10 -
Figure 1.7 Six-unit cluster in red KO. 33Mo03
I, "
Figure 1.8 Ten unit cluster in blue KO. 30Mo03

- 11 -
In the actual structure considerable distortion from this simple
representation occurs; the coordination is closer to fivefold (tri
gonal pyramidal), and the compound has a layer structure rather than
a tunnel structure (Figure 1.9(c)). One vanadium bronze structure,
the a-phase, is based on this structure. It is found for small
concentrations of A atoms, e.g. NaxV 20S (0 ~ x ~ 0.02) where the
inter-layer sites of a more symmetrical V20S lattice are occupied.
The c"'. NaxV20S phase (0.70 ~ x ~ 1) has a similar structure. The
B - NaxV20S structure (0.22 ~ x ~ 0.40) contains irregularly shaped
tunnels enclosed by both double (essentially octahedral) and single
(trigonal bipyramida1) ribbons, as shown in Figure 1.10. The sodium
atoms in the S-phase occupy the tunnel sites Ml , but the proximity of
neighbouring sites prohibit their simultaneous occupation. The
upper composition level is x = 0.33, corresponding to a zig-zag
arrangement by the A ions down the tunnel. The extra positions M2
and M3 may be occupied by smaller insertion elements, e.g. in
1.3 Properties of Oxide Bronzes
The tungsten bronzes have been the subject of many investigations
due to their interesting properties. Some of their physical properties
are described below to illustrate those of oxide bronzes more generally.
1.3.1 Electronic Properties
The oxide bronzes are electronic conductors either metallic, as
for example,Axwo3~12)r AO.StxNb03(~3), NaMo6017(14~ or ~emiconduct~ng as in the case of A V 0 (12) KO 33' M003(lS) and A Mn02(16). A consistent
x 2 5 ' • x

- 12 -
(a)
(b)
(c)
Figure 1.9 (a) V20S
structure (idealised) represented as octahedra,
(b) The single octahedra ribbon, and
(c) V20S represented as bipyramids.

- 13 -
(a)
(b)
(c)
Figure 1.10 (a) The double octahedra ribbon,
(b) p~ojection along ~hain l~rigih. and
(c) 8 - NaxV20S structure

- 14 -
model for their electronic structures suggests that the inserted
element A enters the oxide matrix MOn as a cation and its valence
electrons are donated to the transition metal oxide framework. The
donated electrons either occupy a delocalised conduction band, in
which case metallic behaviour results, or are trapped at individual
metal sites, causing the material to behave as a semiconductor.
The main lines of evidence for this general viewpoint can be summarised
as follows; (a) the nature of A in AxMOn affects the electronic conduct
ivity of the bronze only through the number, Zmx of valence electrons
provided(l7), (b) N.M.R. measurements on Naxwo3(18) and LixV20S(19)
reveal the absence of a Knight shift at the alkali metal nuclei, a
result consistent with their presence as cations, (c) in the case of
the metallic bronzes, collective electron behaviour as determined by
measurements of magnetic susceptibility(20), electronic specific
heat(2l), optical reflectivity(22), and Seebeck and Hall coefficients
(23,24) is consistent with participation of Zrnx nearly free-electrons
in a broad conduction band, and (d) in the case of semiconducting
vanadium bronzes, measurements of magnetic susceptibility(25) and
e.p.r. (19), confirm the presence of isolated V4+ levels.
The band structure in various oxides has been discussed by
Goodenough(26) and his description of the binding in cubic Na xW03 is
a useful prototype for the electronic structures of metallic oxide
bronzes.
The extent of the interaction between the transition metal
orbitals in A MO , either by direct overlap or through M-O-M, will x n depend on the spatial extent of the d orbitals involved. On this
basis the elements of the second and third transition series are more

- 15 -
likely to form de10ca1ised band structures than are the corresponding
(later) members of the first transition series, V, Cr, Mn. The
observed localised electron behaviour of these elements in NaxV20S'
Na2cr309(27) and KxMn02 is consistent with this.
Several, more subtle, relationships between structure and elect
ronic behaviour have not yet been satisfactorily explained. Thus
the origins of the metal-semiconductor transitions in Na xw03(17)
(at x '" 0.25) and KO•30Mo03(15,25) (at T", 173K) are uncertain as is
the observation that superconductivity is found for tetragonal and
hexagonal tungsten bronzes but not for cubic phases(28,29-3l). A
recent study by Sermon et al(32) has shown that tungsten bronzes
prepared under vacuum have ionic conductivity properties.
1.3.2 Magnetic Properties
Greiner(33) measured the magnetic susceptibility of single
crystals of sodium tungsten bronzes and found them to be temperature
independent paramagnetic. Dickens and Whittingham(34) reported that
the measurements made on powder samples of the alkali metal tungsten
bronzes reveal similar behaviour. Sienko measured the susceptibility
of alkali metal tungsten bronzes (Li, Na, K and Rb)(35). They found
Rb(36) and some of the Li(37) and K(38) bronzes diamagnetic while
Na(38) are weakly paramagnetic. The reasons for such deviations is
not clear, however, in some cases it may be due to different measure
ment techniques. It is of interest to mention that Bouchard and
Gillson(39) reported hexagonal indium bronze as diamagnetic. Accord
ing to them this is due to the compensation of the very weak Pauli
paramagnetism by the diamagnetism of the indium ions. Their studies
also included measurements of the magnetic susceptibility of single
crystals of InxW03 along both the crystallographic axes, but no

- 16 -
difference was observed.
1.3.3 Optical Properties
One of the most interesting features of the tungsten bronzes is
their optical properties. The colour of the cubic Na xW03 changes with
increasing sodium content. According to Hagg(40) this is connected
with the proportion of penta- and hexavalent tungsten atoms in the
lattice. Magneli(4l) reported that the colour of the tungsten oxides
and bronzes are dependent on the average valency of the tungsten atoms.
Recently electro-chromic effects were observed in the NaxW03, KxW03 and RbxW03 systems which may have great practical app1icability(42).
1.3.4 Chemical Properties
The tungsten bronzes are characterised by a very great chemical
inertia, which makes chemical analysis difficult(43). They react
only with chemical agents capable of attacking the W03 lattice, the
location of the insertion ions within the channels effectively protecting
them from their usual reagents. Hence acids, even in relatively
strong concentrations, have no reaction with the phases MxW03• These
properties are of obvious applied interest for applications purposes
and their use as catalysts in an acid solution has been considered.
However, tungsten bronzes are unstable in an alkaline medium.
The vanadium bronzes are also very inert to chemical reaction,
except in an oxidising environment. However, they are less resistant
to acid attack than are the tungsten bronzes. One interesting
feature of the vanadium bronzes is that they can fix oxygen which they
lose again at higher temperatures. The amount of fixed. oxygen
dependslg on the composition of the bronze and on the nature and

- 17 -
duration of the heat treatment.
1.4 Preparation of Oxide Bronzes
Generally oxide bronzes may be prepared by thermal and electro
chemical methods. Wohler(l) first prepared tungsten bronzes by
reducing a mixture of sodium tungstate and tungsten trioxide in gas
eous hydrogen. Later(44) reducing agents such as Sn, Zn, and Fe
were used.
Electrolytic reduction is generally used to obtain single bronze
crystals and was applied at an early stage(4S) using a molten mixture
of metal tungstate and tungs~ic acid.
The molybdenum bronzes are much less stable than the tungsten
bronzes and this lack of stability explains why until recently it has
been possible to prepare them by only two methods : electrolytic
reduction and high-pressure synthesis. These two methods give, with
only one exception, phases having entirely different structures.
Whereas the first produces new structural types, the second leads to
the various structures already described for the tungsten bronzes.
Recently Reau et al(14) have studied the Mo03- Mo02M20 (M = Li, Nat K)
systems in sealed gold tubes and in a limited temperature range
(833K - 863K). They found not only the phases obtained by electro
lytic reduction, but also a number of new ones. The role of the
sealed tube is to prevent decomposition.
Hydrogen bronzes may be prepared by spillover from phases active
in hydrogen dissociation(46). Thus the formation of HO•SW03, Hl .7Mo03 and H3.3V308 has been reported(47,48} and also:'Hl'~4Re03 (49).

- 18 -
1.S Catalysis - General Theories
A catalyst is a substance which increases the rate of attainment
of equilibrium of a reacting system without causing any great alter
ation in the free energy changes involved and without itself undergoing
a chemical change. In heterogeneous catalysis, the catalyst is in a
different phase from the reactant and is usually a solid. In such a
system the reaction takes place at the interface between the catalyst
and the less-dense phase. A necessary precursor to reaction is the
adsorption of the reactant at the catalyst surface. The adsorption
of molecules at solid surfaces is a long known and much studied
phenomenon(50). A catalysed reaction must therefore involve more than
one rate process : adsorption, the formation and breakup of an activated
compl~x, and desorption of the products. Each of these has its· own
activation energy. The rate of each is also determined by the total
surface area of the catalyst present, or, more precisely, the number
of active sites, and by the concentration on the catalyst surface of
various adsorbed species.
Heterogeneous catalysts may be divided into two distinct groups:
(i) metals, and (ii) non-metals. The former group is comprised largely
of the metals of Group VIII and IB, and the latter of metal oxides and
sulphides, and acids. The non-metal catalysts may be further sub
divided according to their electrical conductivity into (a) semi
conductors, and (b) insulators. Metals, in general, are good catalysts
for reactions involving hydrogen atom addition or abstraction. Semi
conductor catalysts are good for oxidation-reduction processes#
Insulators, of which alumina and silica are the most important, are good
dehydration catalysts.

- 19 -
1.6 Catalysis and Solid State Chemistry
1.6.1 Oxide Bronzes as Catalysts
Solid state chemistry and physics are incrp.asingly brought to
bear on the formation of catalytic materials. The interdisciplinary
field of solid state science, touching on the relation between the
properties of materials and atomic structure provides a natural matrix
for the elucidation of structure-property relationships of defect
solids used as catalysts. The earliest application of oxide bronzes
for the catalysis of a desired chemical reaction was in the field of electro-
catalysis as electrodes in fuel cells(5l). Recently, there have been·
scattered reports of activity in other processes as well. Bronzes
could play an important role for the correlation of solid state chem-
istry and physics with catalytic properties. Metallic Tungsten
bronzes, MxW03, x ~ 0.25, have been used for various electrode processes
but are particularly interesting as oxygen electrodes (cathodes) in
fuel cells. Sodium tungsten bronzes have shown considerable activity
in the electrode reactions of peroxo species in acid media. The
hydrogen electrode reactions over tungsten bronzes in acid media have
been studied for the cathodic hydrogen evolution reaction and the
anodic hydrogen oxidation reaction
1.6.2 Alcohol Decomposition
The two basic modes of alcohol decomposition are: (a) dehydro
genation to form an aldehyde (in the case of primary alcohols) or a
ketone and hydrogen (in the case of secondary alcohols), and (b)
dehydration to form an alkene and water. According to current theories,
catalyst activity and selectivity in this reaction may be related to
lattice parameters, type of conductivity and width of the forbidden

- 20 -
zone as well as to the acidic properties of the surface(52-55). Many
workers(56-58) have used the activity for the decomposition of 2-
Propanol (Isopropyl alcohol) as a measure of the acidity of various
catalyst systems and found good correlations with acidity measured by
adsorption of ammonia or pyridine. The two main paths of the
decomposition of 2-Propanol (IPA) are given in Figure 1.11. The
catalytic activity for dehydration of IPA to. propene has been found to
CH3 I CH - OH I
CH3
~ CH3COCH3 + H2
---------... CH3CH = CH2 + H20
Figure 1.11
be proportional to the acidity of a catalyst(59), whereas the activity
for dehydrogenation of IPA to acetone is assumed to be proportional to
the basicity of a catalyst(60-62). The tungsten bronzes, MxW03 where
M = Na or K and 0 ~ x ~ 0.8, may be thought to contain both acidic
and basic sites, which vary according to alkali ion content. Thus
the decomposition of isopropanol was chosen as a probe reaction for
characterising the acid-base properties of the sodium and potassium
bronzes prepared::here.
1.6.3 Alkene Metathesis
Since fir~t discovered by Banks and Bailey(63), the alkene
metathesis (disproportionation) reaction has been the subject of many
investigations(64). The reaction may be regarded as a net breaking
and re-formation of two olefinic carbon-carbon bonds, as depicted by , ' j I
Figure 1.1'2 for the metathesis of propene, producing a mixture of ethene
and cis- and trans-2-butene. Olefin metathesis is catalysed by a

- 21 -
~ CH2 =CH2
~CH H ~ /
C = C / \
H CH3
and
CH3 CH3 '\ / C = C
/ "-H H
Figure 1.12
variety of both heterogeneous and homogeneous systems(65), in hetero
geneous catalysts it is known to occur mainly over rhenium, tungsten
and molybdenum compounds(66). For the metathesis of propene in
particular, the catalyst Re207/A1 203 can catalyse the reaction at low
temperatures, with good activity and a high selectivity(67,64). It
has recently been shown for the same metathesis reaction, dimerisation
(producing mainly hexenes) was dominant over insulating W03, while the
major products over metallic Re03 were those of metathesis of propene
(i.e. ethene and but-2-enes). Metallic Re03 may be thought of as an
isoelectronic analog of both NaW03 and KW03. W03 and MW03 (M = Na or K)
are end members of MxW03 and have insulating properties when x < 0.25
and metallic conductivity when x > 0.25(68). Thus an interesting
reaction to probe the bulk properties of the potassium and sodium
bronzes prepared here will be that of the catalytic reaction of propene,
which could change from dimer;sation to metathesis over MxW03 (M = Na or K)
when x is ,increased from zero, to 0.8 due to changes in electrical
properties.

- 22 -
1.6.4 Ammonia Synthesis on Supported Potassium
Tungsten Bronzes
Since the early nineteenth century, many attempts have been made
to cata lyse the synthesis of ammoni a from ni.trogen and hydrogen:
6H = -109kJmol- l
The quantity of nitrogen and hydrogen combining into ammonia depends on
the operating pressure, temperature and H2/N2 ratio. Table 1.1 shows
the equilibrium yields in percentage of ammonia at different pressures
and temperatures.
2.5MPa 5MPa 10MPa 20MPa 40MPa
373K 91.7 94.5 96.5 98.4 99.4
573K 63.6 73.5 82.0 89.0 94.6
673K 27.4 39.6 53.1 66.7 79.7
773K 8.7 15.4 25.4 38.8 55.4
873K 2.9 5.6 10.5 18.3 39.1
Table 1.1 Equilibrium yields of ammonia at different temperatures
and pressures
Two fundamental facts are shown in Table 1.1; (a) under the same
pressure conditions, the ammonia equilibrium yields decrease with
increasing temperature, and (b) under equal temperature conditions,
the equilibrium ammonia yield increases with increasing pressure.
From these facts it is clear that the exothermic synthesis of ammonia
is thermodynamically favoured at low temperature and high pressure.
" ,
The rate-determining step in the reaction was first associated

- 23 -
with the adsorption of nitrogen in the earlyl930s(69). This view was
then substantiated by the pioneering kinetic studies of Emmett and
Brunauer(70) who found that the overall rate of N2 adsorption is of
the same order of magnitude as the rate of ammonia synthesis on the
catalyst surfaces studied. In addition, Kozhenova and Kagan later
showed that the hydrogenation proceeds much faster than nitrogen
adsorption(7l). Although there was a general consensus about the
rate-determining step, the nature of the catalytically active nitrogen
species was in contention. Formally, the overall reaction can be
divided into the following sequence of individual molecular steps
assuming that (a) dissociatively adsorbed nitrogen, Nad , or (b)
molecular nitrogen, N2ad , is hydrogenated stepwise to NH3.
(a) Dissociative mechanism
+ +
+ +
2NHad + 4Had ~ 2NH2ad + 2Had ~
2NH2ad + 2H~d --- 2NH3ad ~
2NH3ad ~ 2NH3 ~ g
(b) Molecular mechanism
N2 + 3H2 ~
~ N2ad + 6Had
N2ad + 6Had ~ N2H2ad + 4Had -, -
N2H2ad + 4Had ~ N2H4ad + 2Had ~
N2H4ad + 2Had ~
2NH3ad ~ :
2NH3ad ---l 2NH3 ~ g

- 24 -
The dissociative adsorption of hydrogen on iron and other metal
catalysts was always well-established and therefore a reaction mechanism
via molecular hydrogen species need not be considered. In the reaction
sequence (a), it is assumed that atomic nitrogen and hydrogen react via
intermediate imine and amine surface species while in sequence (b), the
reaction of molecularly adsorbed N2 proceeds through the formation of
diimine and hydrazine to finally give ammonia. The final step in both
models is the desorption of ammonia from the catalyst surface.
A variety of catalysts have been used for ammonia synthesis, incl
uding Pt foil, Os, dispersed iron and electrolytically deposited Mn.
A promoted iron catalyst that, with the addition or substitution of
other promoters, was eventually developed, and is still the catalyst
universally used today. Recent studies(72) have shown that potassium
tungsten bronzes supported on A1 203 have shown some catalytic activity
for the synthesis of ammonia from its elements. The bronzes were
prepared by i,mpregnation of an alumina support with an aqueous solution
of potassium tungstate followed by reduction in hydrogen at high
temperature. The rate of ammonia synthesis on these bronzes was
observed to increase with temperature, the initial rate however was
seen to decrease rapidly with time. This rapid fall in rate was
explained in terms of an intermediate species being strongly adsorbed
on the surface.
1.6.5 Methanol Synthesis and the Water-Gas-Shift Reaction
on Copper Based Catalysts
Methanol synthesis consists of the hydrogenation of carbon mon
oxide lOr carbon dioxide according to:

- 25 -
and
-1 ~H600K = -lOO.46kJmol
-1 ~H600K = - 61.59kJmol
The catalysts used for this synthesis are based on copper and combin
ations of various oxides (ZnO, A1 203, Cr203 and Ti02). Copper based
catalysts have also shown considerable activity for the water-gas-shift
reaction:-
~H = - 40.6kJmol- l
which is a reaction most frequently used in conjunction with the pro
duction of hydrogen via the steam reforming of hydrocarbons. For
methanol synthesis and the shift reaction, copper is more active when
supported on ZnO than on titania(73). There is current uncertainty
regarding the precise oxidation state of ZnO supported Cu under
conditions of use(74), however very recent work(75) has shown that
Cu (II) in CuFexCrz_x04 spinels is as active as Cu/ZnO under conditions
when it would not have been significantly reduced.
1.7 Present Study
The present study was undertaken to understand the surface and
bulk properties of some unsupported tungsten bronzes MxW03, where
M = Na or K and 0 ~ x ~ 0.8, and establish their catalytic activity
towards the decomposition of isopropanol and the metathesis of propene.
The programme of work was as follows:
(1) Preparation of the potassium and sodium tungsten bronzes by
the following reaction;
3xM2
W04 + (6-4x)W03 + xW ~1173K ..
6MxW03

- 26 -
where M = Na or K
(2) Surface characterisation and morphology of the potassium and
sodium tungsten bronzes.
(3) Study of the thermal stability of the bronzes in hydrogen and
in air.
(4) Characterisation of the bronze samples by x-ray photoelectron
spectroscopy and x-ray diffraction.
(5) Study of the electrical properties of the bronze samples.
(6) Study of the catalytic activity of the bronzes for the decomp
osition of isopropanol and for the metathesis of propene.
(7) Preparation of CUyKXW03 by an ion-exchange method since
preparation of such a sample by a thermal method is difficult
due to thermodynamic limitations required at the high temper
ature to overcame the slow rate of formation.
(8) Previous studies(72) have shown that potassium bronzes
supported on alumina have a slight catalytic activity for
ammonia synthesis. A silica-supported bronze was prepared
for comparison with the alumina supported bronzes.
The results of the work carried out on the alumina-supported potassium
tungsten bronzes is described in Appendix I.

l.
2.
3.
4.
5.
6.
- 27 -
CHAPTER 1
REFERENCES
II F. Wohler, Ann. Chim. Phys., (2), 43,29, (1823).
A. Laurent, Ann. Chim. Phys., (2),.§I, 215, (1838).
G. von Knorre, J. Prakt. Chern., (2), Q, 49, (1883). II E. Schafer, Z. Anorg. Allg. Chern., 38, 142, (1903).
II
G. Hagg, Z. Phys. Chern., B29, 192, (1935).
A.D. Wadsley, Helv. Chim. Acta. Fascic. Extraord., Alfred Werner,
207, (1967).
7. A. Magneli, Nova. Acta. Regiae Soc. Sci., Upsaliensis, li, 4,
(1950).
8. T.A. Bither, J.L. Gillson and H.S. Young, Inorg. Chern., ,§., 1559,
(1966) .
9. E.O. Brimm, J.C. Brantky, J.H. Lorenz and M.H. Je11inek, J. Am.
Chern. Soc., 73, 5427, (1951).
10. E. Banks and A. Goldstein, Inorg. Chern., J..., 966, (1968).
11. A. Hussain, L. Kih1borg, Acta. Crysta11ogr., A32, 551, (1976).
12. P. Hagenrnu11er, 'The Chemistry of Extended Defects in Non
Metallic Solids', (1970), L. Eyring, M.O'Keefe, Editors.
(Amsterdam: North Holland Publishing Co.)
13. D. Ridgley and R. Ward, J. Am. Chern. Soc., ]2, 6132, (1955).
14. J.M. Reau, C. Fouassier and P. Hagenrnu11er J. Solid State Chern.,
1, 326, (1970).
15. G.H. Bouchard, J. Perlstein and M.J. Sienko, Inorg. Chern., ~,
1682, ( 1967) .
16. J.P. Parant, R. 01azcuaga, M. Deva1ette, C. Fouassier and
P. Hagenmu11er, J. Solid State Chern., l, 1, (1971).
17. H.R. ~hanks, P.R. Sidles and G.C. Danielson, 'Non-~toichiornetric
Compounds', Chemistry Series No. 39, 237, (1963).

- 28 -
18. W.H. Jones, E.A. Gabarty and R.G. Barnes, J. Chern. Phys., 36,
494, (1962).
19. G. Gende11, R. Cotts and M.J. Sienko, J. Chern. Phys., ~, 220,
(1962).
20. J.D. Greiner, H.R. Shanks and D.C. Wallace, J. Chern. Phys., 34,
772, (1962).
21. R.W. Vert, M. Griffe1 and J.F. Smith, J. Chern. Phys., 28, 293,
(1958).
22. P.G. Dickens, R.M.P. Qui11iam, M.S. Whittingham, Mater. Res. Bull,
1, 941, (1968).
23. L.D. Muh1estein and G.C. Danielson, Phys. Rev., 158, 825, (1967) .
24. L.D. Muh1estein and G.C. Danielson, Phys. Rev., 160, 562, (1967) .
25. A. Wold, W. Kunnrnann, R.J. Arnott and A. Ferretti, Inorg. Chern. ,
1,545, (1964).
26. J.B. Goodenough, Prog. in Solid State Chern.,!, 145, (1971).
27. T.A. Bither, J.L. Gillson and H.S. Young, Inorg. Chern.,.§., 1559,
(1966) .
28. T.E. Gier, D.C. Pease, A.W. Sleight and T.A. Bither, Inorg. Chern.,
I, 1646, (1968).
29. A. Narath and D.C. Wallace, Phys. Rev. 127, 724, (1962).
30. A.R. Sweed1er, C.J. Raub and B.T. Matthias, Phys. Lett, li, 108,
(1965) .
31. J.R. Rerneika, T.H. Geba11e, B.T. Matthias, A.S. Cooper, G.W. Hall
and E.M. Kelly, Phys. Lett, 24A, 565, (1967).
32. S.A. Lawrence, S. Stevenson, K. Mavadia and P.A. Sermon, Proc. R.
Soc., A411, 95, 1987.
33. J.~. Greiner, H.R. Shanks and D.C. Wallace, J. Chern. Phys., 36,
772, (1962) ~
34. P.G. Dickens and M.S. Whittingham, Quart. Rev., 22, 30, (1968).

- 29 -
35. M.J. Sienko, 'Non-Stoichiometric Compounds I , Adv. in Chemistry
36.
37.
38.
39.
40.
41.
42.
43.
44.
Series No. 39, 224, (1963).
D.R. Wan1ass and J.J. Sienko, J. Solid State Chern., ~, 362, (1975).
M.J. Sienko and S.M. Morehouse, Inorg. Chern., £,485, (1963).
M.J. Sienko and T.B.N. Troung, J. Am. Chern. Soc., 83, 3939, (1961).
R.J. Bouchard and J.L. Gillson, Inorg. Chern., I, 969, (1968). II
G. Hagg, Z. Phys. Chern., B29, 192, (1935).
A. Magne1i, Nova.Acta.Regine.Soc. Sci. Upsa1iensis, 14, 4, (1950).
I. Lefkowitz and G.W. Taylor, Optics Commun., ~, 340, (1975).
A. Magne1i, Arkiv. Kemi., l, 273, (1949).
E. Banks and A. Wold, Prepn. Inorg. Reactions, 4, (1968) Inter-
science.
45. E. Zettnow, Pogg. Ann., 130, 240, (1967).
46. P.A. Sermon and G.C. Bond, CataL Rev., 8, 211, (1973).
47. P.A. Sermon and G.C. Bond, J. Chern. Soc., Faraday Trans. 1,1£,
730, (1976); G.C. Bond, P.A. Sermon and C.J. Wright, Mater. Res.
Bu1L,11, 701, (1984).
48. P.A. Sermon and A.R. Berzins, Metal Hydrogen Systems. Ed. T.N.
Verzirog1u, 451, (1982).
49. P.G. Dickens and M.T. Weller, J. Solid State Chern., 48, 407,
(1983) .
50. G.C. Bond, Heterogeneous Catalysis, Principles and Applications,
Oxford University Press, (Ed. P.W. Atkins, J.S.E. Ho1ker, and
A.K. Holliday), (1974).
51. J. McHardy, J.O'M. Bockris, 'From E1ectrocata1ysis to Fuel Cells',
G. Sandstede, Ed., University of Washington Press, Seattle and
London, (1972).
52. S.Z. R09inski"Zh. Fizo Khimo, i, 3~4., (1935). " '
i: ,
53. SoZ. Roginski, Ook1. Akad. Nauk., USSR, ~, 97, (1949).

- 30 -
54. K. Hauffe. Reactions on Solids and their Surfaces. Russ. L. (1962).
55. G.M. Schwar. Adv. Cata1., .£' 229, (1952).
56. M. Ali and S. Suzuki, Bull. Chern. Soc. , Jap. 47,(12),3074, (1974).
57. M. Ali, S. Suzuki, Bull. Chern. Soc., Jap. 46, 321, (1973).
58. K.T. Sea, S.C. Kang, H.J. Kim and S.K. Moon, Korean J. Chern. Eng.,
l!. (2), 163, (1985).
H. Pines, Adv. Cata1., l§., 49, (1966).
M. Ali, Bull. Jap. Petrol. Inst. , ~, 50, (1976).
M. Ali, Bull. Chern. Soc. Jap., 50,355, (1977).
M. A 1; , Bull Chern. Soc. Jap., 50, 2579, (1977) .

- 31 -
CHAPTER 2
PREPARATION OF POTASSIUM AND SODIUM TUNGSTEN BRONZES
2.1 Introduction
The tungsten bronzes are non-stoichiometric ternary metal oxides
of general formul a MxW03 where Mis a metal and 0< x < 1. These com
pounds have been known from the beginning of the 19th century(l). In
recent years. many research groups have been studying these types of
materials because of their interesting physical and chemical properties.
The metal. ~1. to form bronzes of tungsten include potassium and soCi·ur.1.
2.2 Synthesis of Tungsten Bronzes
A number of methods have been used to prepare tungsten bronzes.
In 1823 Woh1er(1) first prepared the tungsten bronzes by reducing a
mixture of sodium tungstate - tungsten trioxide with hydrogen gas.
In 1838 Laurent(2) obtained a similar product using potassium tungstate.
Later tither reducing agents such as tin. zinc. and iron were also
used(3).
Brunner(4) prepared the potassium bronzes by heating a mixture
of K2W04• W03 and W02 in vacuum. Later Straumanis(S) and also
Brinm(6) used tungsten as a reduci ng agent to prepare sodium and: 'pot
assium bronzes according to the following reaction;
---I.... 6MxW03 1173K
Metal chloride ca~-be used instead of tungstate as a starting mater
ial(7). Conroy and Yokokawa(8) prepared tetragonal barium tungsten
bronzes using barium chloride as a starting material according to the
- 32 -
following reaction;
This method has also been used to prepare other alkaline earth metal
tungsten bronzes with the possible substitution of bromine or iodine
for chlorine(9). Hexagonal tungsten bronzes have been preoared by
the reaction of hexagonal W03 with metal vapours, within the temper
ature range of 473K - 673K(lO). The solid state reaction has been
found quite versatile and is the most frequently used method for the
preparation of bronzes.
Electrolytic reduction is generally used to obtain large single
crystals of bronzes and was first applied by Zettnow(ll) in 1867; a
molten mixture of metal tungstate and tungstic acid was electrolytically
reduced. Hagg(12), in his study of sodium bronzes, used this tech
nique which was then further developed by Ellerbeck(13) and by
Kunnman and Ferretti (14).
Sienko(15} prepared single crystals of Tl xW03 by vapour-phase
reaction of W03 and metallic Tl according to the following reaction;
The crystals were deposited on a cold finger in the reaction vessel.
This method is suitable if the metal is appreciably volatile at high
temperatures. Aluminium bronzes have also been prepared by this
method.
-The hexagonal phases of lithium(16}, ammonium(16), and the cubic
potassium tungsten bronzes(l7) which are not ,possible to: prepare at
atmospheric pressure may be synthesised at high pressure. This
method permits in some cases the extension of compositional range to

- 33 -
higher x values, particularly of atoms having a valency state higher
than one(18).
Tungsten bronzes prepared by the electrolytic methods are often
obtained impure and thus require purification. They are remarkably
stable against chemical reagents such as acids and use of this has been
made in the purification process. Impurities can be removed by
successive treatment of the sample with (i) boiling water(19);
(ii) boiling conc. Hel or aqua regia(20); (iii) boiling in 40% hydro
fluoric acid(20,2l).
Recently(22) supported hexagonal potassium tungsten bronzes
have been prepared by impregnation of a support with a solution of
K2W04, followed by reduction at 1023K in hydrogen gas.
2.3 Present Method of Preparation
2.3.1 Potassium and Sodium Bronzes
In the present study a series of potassium tungsten bronzes
and a series of sodium tungsten bronzes was prepared by the solid
state reaction using tungsten as the reducing agent according to the
fo:" owi ng equa t ion;
" , ,
where M = K or Na
Both potassium and sodium tungstate were commercially available (KOCH
Light Laboratories, 99.9%) together with W03 (Koch-Light, 99.5%),
and W powder (BOH, 98%).
The app~opriate weight of these starting materials was used to give an
alkali metal ion content of 0.05, 0.2, 0.3, 0.6 and 0.8 mole fraction

- 34 -
(0.84% - 13.5%) in both the potassium and sodium tungsten bronzes.
K2W04, W03 and W powder were ground together placed in a silica reactor
and heated at 1173K in flowing argon for approximately 48h - 72h to
produce homogeneous polycrystalline bronze samples. The resultant
bronzes were intensely coloured, those with lower alkali ion content
being generally darker in colour. The samples were labelled and
stored O.05KW, O.2KW, O.3KW, 0.6KW and 0.8KW where K refers to potass
ium, W to tungsten and the preceding number to the intended potassium
ion content on a mole basis. A similar labelling system was used
for the sodium bronzes with Na representing the sodium ion.
2.3.2 Supported Potassium Bronze
A supported potassium tungsten bronze was prepared by impreg
nating a silica support (Aerosil 200, surface area 200m2g- l.) to
incipient wetness with a solution of potassium poly tungstate to give a
tungsten loading of 30% by weight. After removing any excess water
on a steam bath and drying in an air oven at 373K for l2h, the sample
was reduced in flowing hydrogen (40cm3 min- l , 10lkPa) at 770K for about
2h. The poly tungstate solution was obtained by adjusting the pH of a
solution of potassium tungstate to 4 (using nitric acid). Previous
studies(22) by Raman spectroscopy have shown that at such a pH the
paratungstate species (W12042l2-) is formed. Such'species are more
easily reducible to the bronzes than the monotungstate(22). A high
metal loading was selected because it was observed that in the previous
studies(22) the bronzes are more readily formed at loadings much higher
than that required to form a monolayer.
2.3.3 CUy.KxW03
An ion-exchange method was used in trying to obtain highly

- 35 -
dispersed Cu ions in the potassium bronze structure. Attempts to
prepare such a sample by thermal methods have not been very successful
since only a minimum of copper ions enter the lattice framework due to
thermodynamic limitations at the high temperatures required to overcome
kinetics. An initial study was first made in order to establish the
optimum conditions of exchange of potassium ions for cupric ions. A
CuC1 2 (J.M.C. Speciality Products AR:) solution was used as the Cu
precursor and the method was used for the potassium tungsten bronze
with x = 0.2. Jhe initial study involved varying the temperature of
the Cu solution (294K - 353K), the concentration of Cu ions in solution
(between 10 - 300 times the concentration of K ions present) and the
time for exchange (24h - l20h). Usually about 19 of bronze and 60cm3
of cupric chloride solution were used for each study. In e~ch series
of experiments a blank was prepared by allowing 19 of 0.02KW to
equilibrate in 60cm3 of distilled water.
In the first series of experiments the concentration of the Cu
solution was varied between 0.139'N to 4.17M (the amount of copper
present in 60cm3 of solution is between 10 to 300 times those of the K
ions in the bronze). The solutions were allowed to equilibrate with
1 9 of the bronze at room temperature for 24h. A second se·ri es of
experiments in which the concentration of the copper solution, main
tained at room temperature, was kept at a concentration of 2.7BH but
the time period was varied between 24h to 120h in an attempt to follow
the kinetics of ion-exchange. In the final series of experiments the
temperature of the copper solution was varied between 288K and 353K but
the concentration of the solution (Cu2+ = 2.78M) and the time of
equi1i~rium (96h) were kept constant. In each ~ase lthe, s91ution,was ! '
stirred continuously using a magnetic stirrer. After each experiment
the mi xture was centri fuged and the aliquot was ana lysed for potass i urn

- 36 -
content using atomic absorption (Perkin Elmer 2380). It was difficult
to analyse for the high Cu concentration in the solution and hence the
accuracy in determining the amount exchanged. In each case the blank
samples prepared showed no potassium ions present in the aliquot as
observed by atomic absorption.
Figure 2.1 gives the amount of potassium removed from the bronze
as a function of the concentration of copper present in 60cm3 of sol
ution. The isotherm shows that the maximum amount of potassium
removed ;s achieved at a copper concentration of 2.8M after which
increases in the Cu2+ concentration in solution have no effect.
Figure 2.2 shows that maximum amount of potassium exchanged at room
temperature with a solution of 2.78M Cu is achieved after about 48h;
this means exchange kinetics are rather slow. Figure 2.3 shows that
the minimum temperature required to achieve maximum exchange of K ions
with a solution of 2.7BM Cu and a time period of 96h is about 294K.
The study has therefore shown that the optimum conditions required for
the maximum exchange of K ions for Cu ions, (XPS has shown directly
the presence of Cu ions in the bronze Cu K W03 see Chapter 6). These were, y x for 19 of bronze: a solution of 2.78M Cu, a temperature of 294K and a
time period of 48h.
The conditions used for preparation of CUyKxW03 were:- a temper
ature of 313K; 96h equilibrium time and a Cu solution of concentration
2.78M.

cu N C 0 L
..0
e 0 L If-
-0 cu > 0 e cu L
::.c: ~
60
50
40
30
20
10
0.695 2.78 4. 17 Molarity of CuC1 2 solution
Figure 2.1 % K removed from bronze versus molarity of CuC1 2 solution
(room temperature)

60
50
% K 40
removed from 30
bronze
20
10
24 4H 72 96 120
Figure 2.2 % K removed from bronze versus time (2.78M Cu2+, room temperature)
Time/h

60
% K 50 removed from 40 bronze··
30
20
10
/"'
283 293 303 313 323 333 343 353
figure 2.3 % K removed from bronze versus temperature (2.78M Cu2+, after 96h)
Temperature/K

- 37 -
CHAPTER 2
REFERENCES
1. F. W8hler, Ann. Chim. Phys .• (2), 43,29. (1823).
2. A. Laurent, Ann. Chim. Phys., (2), 67, 21S, (1838).
3. E. Banks and A. Wold, Preparative Inorganic Reactions, i, (1968),
Interscience Publi~hers (Ed. L.J. William).
4. O. Brunner, Oiss. Zurich, (1903).
S. M.E. Straumanis, J. Am. Chern. Soc., .?l, 679, (1949).
6. E.O. Brimm, J.C. Brantley, J.H. Lorenz and M.H. Jel1ink, J. Am.
Chern. Soc., ~, 5427, (1951).
7. A. Hussain, Chern. Commun. Univ. Stockholm, No.2, (1978).
L. E. Conroy and T. Yokokawa, Inorg. Chern., i, 994,
L. E. Conroy and G. Podolsky, Inorg. Chern., 7, 614,
8.
9.
10. M. Figlarz and B. Gerand, Mater. Sci. Monogr., lQ,
~), 887, (1982).
11 . E. Zettnow, Pogg. Ann., 130, 240, (l967).
12. G. Hagg, Z. Phys. Chern., B29, 192, (1935).
(1965) .
(1968) .
(Reacts.Solids,
13. L.D. Ellerbeck, H.R. Shanks, P.H. Sidles and G.C. Danielson,
J. Chern. Phys., l§., 298, (l96l).
14. A. Ferretti and W. Kunnmann, Rev. Sci. Inst., ~, 465, (1944).
15. M.J. Sienko, J. Am. Chern. Soc., ~, 5556, (1959).
16. T.E. Gier, D.C. Pease, A.W. Sleight and T.A. Bither, Inorg. Chern.,
7..,1646, (1968).
17. LA. Bither, J.L. Gillson and M.S. Young, Inorg. Chern., 2,1646,
(l 968).
18. P. Hagenmuller, Camp. Inorg. Chern., i, 1973, Pergamon Press, (Ed.
J.C. Bailer, H.J. Emeleus, R. Nyholm and A.F. Tortman~Dickson). : I I
19. M.E. Straumanis and S.S. Hsu, J. Am. Chern. Soc., 72, 4027, (l950).

- 38 -
20. A. Magne1i and B. Blomberg, Acta. Chern. Scand.,~, 372, (1951).
21. E. Banks and A. Goldstein, Inorg. Chern., J..., 966, (1968).
22. S. Stevenson, M. Phil. Thesis, Brune1 University, (1985).

- 39 -
CHAPTER 3
PHYSICAL CHARACTERISATION AND SURFACE MORPHOLOGY
3.1 Introduction
Many reactions of both theoretical and practical interest occur
on the surface of solid catalysts. An important parameter which deter
mines the catalytic activity is the available surface area or the
number of active sites per unit total surface area. The course of
reaction, however, is, in a considerable number of cases, determined
by the acidic number and strength of acid sites at the surface, (or the
acidic nature of the surface).
The potassium tungsten bronzes, the sodium tungsten bronzes and
W03 were analysed for their BET surface area using krypton adsorption.
The use of the physical adsorption of gases by solids for the deter
mination of their surface area, porosity and texture is now well
established in many fields of scientific investigation. The theory
of ga's adsorption by solids with special emphasis on the character
isation of porous solids by gas adsorption has been ~xtensively developed
and discussed in recent years. Transmission Electron Microscopy, (TEM)
was also used to obtain a more detailed morphological study of these
materials. Temperature programmed qesorption of ammonia was used to
measure the amount and distribution of acid sites on W03, KxW03 and
NaxW03 (0.05 s x ~ 0.8). Acidity is often an important characteristic
which makes a solid catalytically effective. Silica-aluminas and,
more recently, zeolites with acidic surfaces playa very important
catalytic role in industrial processes, in particular in the petroleum
industry.
- 40 -
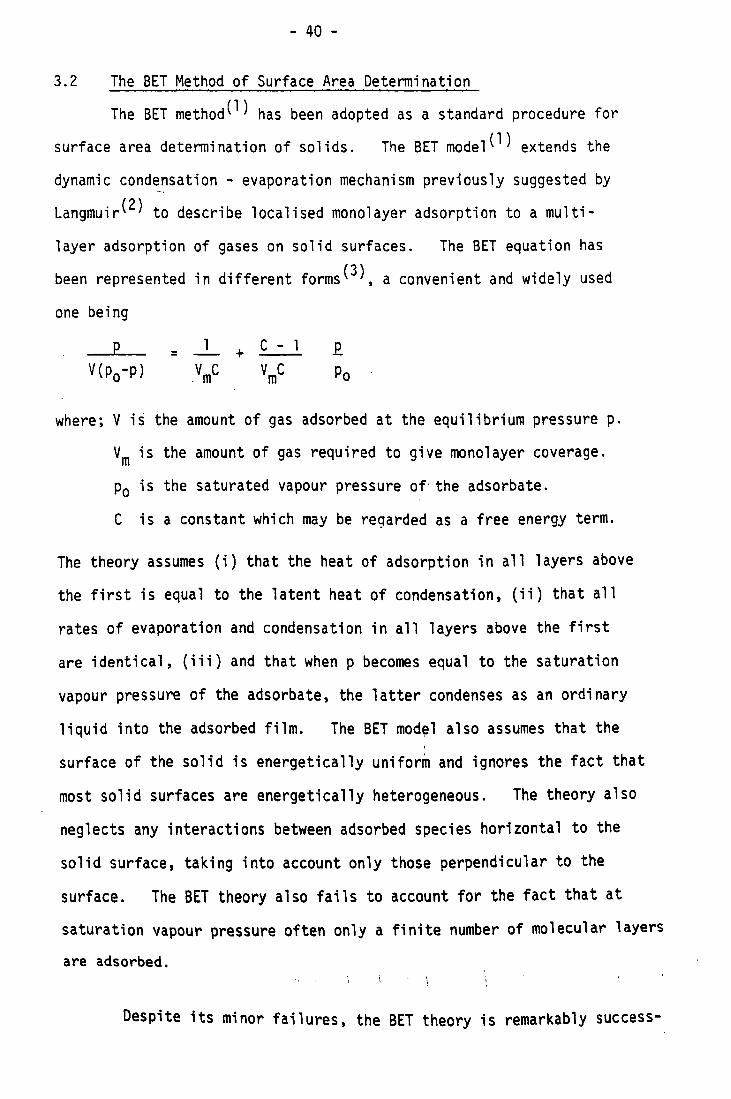
3.2 The BET Method of Surface Area Determination
The BET method(l) has been adopted as a standard procedure for
surface area determination of solids. The BET model(l) extends the
dynamic condensation - evaporation mechanism previously suggested by
Langmuir(2) to describe localised monolayer adsorption to a mUlti-
layer adsorption of gases on solid surfaces. The BET equation has
been represented in different forms(3), a convenient and widely used
one being
p = £ Po
where; V is the amount of gas adsorbed at the equilibrium pressure p.
Vm is the amount of gas required to give monolayer coverage.
Po is the saturated vapour pressure of the adsorbate.
C is a constant which may be regarded as a free energy term.
The theory assumes (i) that the heat of adsorption in all layers above
the first is equal to the latent heat of condensation, (ii) that all
rates of evaporation and condensation in all layers above the first
are identical, (iii) and that when p becomes equal to the saturation
vapour pressure of the adsorbate, the latter condenses as an ordinary
liquid into the adsorbed film. The BET mod~l also assumes that the
surface of the solid is energetically uniform and ignores the fact that
most solid surfaces are energetically heterogeneous. The theory also
neglects any interactions between adsorbed species horizontal to the
solid surface, taking into account only those perpendicular to the
surface. The BET theory also fails to account for the fact that at
saturation vapour pressure often only a finite number of molecular layers
are adsorbed.
Despite its minor failures, the BET theory is remarkably success-

- 41 -
ful when used in the calculation of specific surface area of solids.
The BET equation predicts that a pl~t of p against ~ V(po-p) Po
should be linear, yielding ~ as the slope j, and ~ as the m m
intercept i and solving these two simultaneous equations give
1 = (i +j )
c = i+j
i
The range of linearity of the BET plot is normally, but not always,
between 0.005 < ~ < 0.35. The specific surface area, 2 -1 S, in m g
is given by the relationship
S = Vm N . Am .10-18
22414
where Vm is expressed in cm3 (S.T.P.) of adsorbate per gram of solid,
N is Avogadros constant, 6.023 x 10²³ and Am is the cross-sectional area
of the adsorbed molecules in nm2. Am cannot be measured independently
and its value is usually estimated(4) by assuming (i) close hexagonal
packing of the species in the mono1ayer,and (ii) a packing density in
the monolayer equal to the bulk density of the adsorbate. In general,
the value of Am varies from adsorbate to adsorbate; thus, for krypton
gas as an adsorbate at 77K, the recommended value of Am is 0.195nm2
whilst for water vapour Am is usually taken to be O.106nm2 at 293K.
Nitrogen adsorption is the most commonly used technique for determin
ation of surface areas as low as approximately 1m2 can be measured.
The principle obstacle to measuring areas lower than this with nitrogen
in a volumetric system lies in accurately measuring the void or "dead
space" volume. On small areas, the quantity of adsorbate remaining in
the void volume is large compared to the amount adsorbed, and indeed
- 42 -
the void volume error can be larger than the volume adsorbed. The
number of molecules trapped in the void volume can be reduced by using
adsorbates with low vapour pressures such as krypton. ,The vapour
pressures of krypton at liquid nitrogen temperature is 350.64 Pa.
Therefore, the amount of krypton remaining in the void volume, when
monolayer coverage occurs, will be much less than nitrogen, whereas the
amount of adsorption will be only slightly less by approximately the
ratio of cross-sectional areas of nitrogen and krypton, or about
0.162/0.195. In the present study krypton adsorption at liquid nitro
gen temperature was used to determine the surface areas of the bronzes
and W0 3. At liquid nitrogen temperature, krypton may condense as a
liquid but since the vapour pressure used is very low, such a possibility
is non-existent.
3.3 Surface Acidity
The concept of surface acidity of highly divided solids was
derived originally to explain the action of acid surfaces in catalytic
reactions. A description of acidity in general, and surface acidity
more specifically, requires the determination of the nature, the
strength, and the number of acid sites. A solid acid is capable of
transforming an adsorbed basic molecule into its conjugated acid form.
In its most general definition an acid is an electron-pair acceptor.
So the Bronsted acid site is able to transfer a proton from the solid
to the adsorbed molecule. In this wayan ion is generated and an ion
dipole interaction with the solid exists. The Lewis acid site is able
to accept an electron pair from the adsorbed molecule and a coordina
tive bond with the surface is formed.
3.3.1 Nature of Surface Acidity
Bronsted acid sites in solids can be generated when a trivalent

- 43 -
cation is present in tetrahedral coordination with oxygen. The most
common example is aluminium. When all tetrahedral oxygen anions are
shared between two cations, net negative charges are created for
cations with charges lower than 4. A schematic diagram is given for
a1uminosi1icate, the most common case encountered, in Figure 3.1.
When the excess negative charges are
0 0 0 /0 0
I '\ IV / \ o· / \ " - / \ III IV o II I Si Al Si Al
/ \ / \ / \ 1\ 0 0 0 0 0 0 0 0 I I I I I I I I
Figure 3.1
compensated for by protons, si1ano1 groups are formed, which are
represented in Figure 3.2
H I
0 o 0 /\ / ", / \
Si A1 / \ / \
0 0 o 0 I I I I
Figure 3.2
It has to be understood that in such a structure a trigonal oxygen
does not exist; it indicates only that $i as well as A1 retain their .
tetrahedral coordination. Upon interaction with a basic molecule
(e.g. an alkene), the following equilibrium is established:

H
I o o
/ \ / " , Si /\
o 0
I I
. Al / \
o 0 I I
- 44 -
+R - CH = CH 2
+ R - CH - CH3 +
000 \ / \0-/\
Si Al / \ / \ 000 0 I I I I
II
Depending on the strength of the Bronsted site this equilibrium will
be shifted. It seems, therefore, the surface acidity is dynamic
in character and is dependent on the chemical nature of both the
adsorbed base and the solid. When coordinative unsaturated sites
by some mechanism are generated, acid sites of the Lewis type are
created which are able to accept electrons.
example is schematized in Figure 3.3.
o 0 / \ / \
Al Si / \ / \ o 0 0 0 I I I I
000 / \ / \ / \
Si Al Si
/\ \ / \ o 0 000 I I I I I
Figure 3.3
The silica-aluminium
or

- 45 -
A given acidic solid usually does not have a single class of
acidic sites, but shows a large distribution of strengths of acid
sites. This may be the result of inhomogeneity in the comoosition
of the solid, or the existence of short-range interactions or of
surface structures.
3.3.2 Measurement of Acidity of Surfaces
There are many publications dealing with the measurement of
surface aCidity(S,6) some of which are described below.
3.3.2.1 Non-aqueous titrations
Historically the first method to be used for the determin
ation of surface acid sites concentration (SASe) was by Johnson(7).
He suspended some powdered sample in dry benzene and titrated it by
slowly adding a dilute solution of n-butylamine in benzene until the
indicator adsorbed on the surface was converted permanently to its
basic form. Since an indicator is converted to its conjugate acid
only by acid sites which have acid strengths equal or more than the
pKb of the indicator (i.e. equal or lower than the Bronsted acidity),
use of indicators of varying pKb yields a distribution of acid sites
concentration with strength. By using a series of indicators with
increasing pKb, Johnson, determined the lowest value of pKb for which
the indicator is converted to its conjugate acid. Thus, the limiting
strength for the stronger acid sites can be determined. The dis
advantages of this method are that the equilibrium between the solid
and the base is often reached very slowly and hence the method can be
time-consuming and inaccurate, indicators can alter colour through
physisorption rather than adsorption at acid sites and the base used
is sometimes adsorbed on sites other than acidic ones.

- 46 -
3.3.2.2 Aqueous Titrations
II
This can be used to determine Bronsted acidity. It is
basically an ion exchange method where surface protons are replaced
by other hydrated cations(8). The method consists of equilibrating
the solid with a known amount of base and backtitrating the excess
with acid. The disadvantages of this method are that it will not
distinguish between acid sites of different strength, while the II
addition of water to the system may create new Bronsted sites.
3.3.2.3 Infra-red Spectroscopy
This method enables the measurement of the extent of pro-II
tonation of a chemisorbed base, and therefore Bronsted acidity can be
distinguished from Lewis acidity. Mapes and Eischens(9) studied the
chemisorption of ammonia on catalysts. Infrared spectra of such
samples contained H - N - H bending bands due both the NH4+ and to
coordinated ammonia. This was the first direct evidence of the II
existence of both Bronsted and Lewis acid sites on aluminosi1icate
surfaces. Pyridine is also commonly used, and being a weaker base
than ammonia, is more selective for the stronger acid sites.
Pyridine adsorbs on Bronsted acid sites giving a peak at 1545 cm-1
due to the pyridinium ion, and adsorbs on Lewis acid sites giving a
band in the region 1440 - 1465 cm-1 due to coordinated pyridine.
3.3.2.4 Temperature-programmed desorption
(tpd) of chemisorbed bases
A gaseous base adsorbed on a strong acid site is more stable
than one adsorbed on a weak acid site, and is more difficult to
desorb. As elevated temperatures stimulate desorption of the:'adsorb-
ed bases from acid sites, those at weaker sites will be desorbed,

- 47 -
preferentially. Thus, the proportion of adsorbed base desorbed at
various temperatures can give a measure of the amount and distribution
of acid sites. The bases used normally are quinoline, pyridine or
ammonia. Tpd of ammonia, has been widely used to measure the acidity
of various zeolites(lO). Ammonia is an excellent probe molecule
because it can be stabilised on acid sites and can penetrate into pores
due to its strong basicity and small size. However, the transport of
this base molecule into the zeolite material may not be completely
rapid. In some cases, the thermal behaviour could be influenced by
these diffusion problems. Such a condition may be plausible at lower
temperatures, Kanazirev(ll) used tpd of NH3 to study the problem of
diffusion in a zeolite matrix and found broad peaks around or lower
than 373K influenced .by the diffusibility of ammonia. Hidalgo(lO)
et al overcame this problem by using a relatively high temperature for
attaining equilibrium with the zeolite surface and using a slow rate
of temperature increase.
In the present study tpd of ammonia was used to show the dis
tribution and strength of acid sites on the alkali metal tungsten
bronzes. Ammonia was used as the probing molecule in preference to
other bases because of the low surface area of the bronzes requiring
a molecule with a small cross-sectional area.
3.4 Transmission Electron Microscopy
Electron microscopy is an extremely versatile technique capable
of providing structural information over a wide range of magnification.
At one extreme, scanning electron microscopy (SEM) complements optical --
mi croscopy : fo,r studyi ng ~he texture. tqpography a,nd surface features ~ " ' Ii' ,
of powders; features up to tens of micrometers in size can be seen
and, because of the depth of focus of SEM instruments, the resulting

- 48 -
pictures have a definite three-dimensional quality. At the other
extreme, high resolution electron microscopy (HREM) is capable, under
favourable circumstances of giving information on an atomic scale, by
direct lattice imaging. Resolution of approximately 0.2nm has been
achieved, meaning it has become possible to Isee l individual atoms.
Electron microscopes are of either transmission or reflection
design. For examination in transmission (TEM), samples are usually
thinner than 200nm. This is because electrons interact strongly with
matter and are completely absorbed by thick particles. In order to
use electrons, instead of light, in a microscope it is necessary to
be able to focus them, this is achieved by an electric or magnetic
field. In order to minimise electron scattering a high vacuum is used.
Electron microscopes contain several electromagnetic lenses. The
condenser lenses are used to control the size and angular spread of
the electron beam that is incident on the sample. Transmitted elect
rons then pass through a sequence of lenses, objective, intermediate
and projector, and form a magnified image of the sample on a fluor
escent viewing screen from which photographs are then taken. A schematic
representation of the transmission electron microscope is shown in
Figure 3.4
3.5 Experimental Procedures
3.5.1 Krypton Adsorption Measurement
The BET surface areas of W03, KxW03 and NaxW03 were determined
using krypton adsorption at liquid nitrogen temperature. The
measurements were undertaken on a Micromeritics Surface Area Pore
Volume Analyser 21000. This is a volumetric adsorption apparatus
which essentially consists of:-

- 49 -
Electron source
Condenser lens
Object
Objective lens
Intermediate image
Projection lens
Final image
Figure 3.4 Representation of the transmission electron
microscope
(1) A device for the introduction and removal of the adsorbate.
(2) A system for measuring and recording the equilibrium pressure.
(3) Temperature monitors for measuring both the sample outgassing
and liquid nitrogen temper~tures.
The sample was contained i~ a burette which after connection to
the system manifold was evacuated':at room temperature using rotary and
mercury diffusion pumps to less than lOmPa. The "dead space", i.e.
the volume within the sample burette exclusive of the sample itself
was then determined by expanding helium, a non-adsorbing gas, from a
fixed volume at a known pressure into the sample burette maintained at
liquid nitrogen:temperatu~ and recording the equilibrium pressure.
The sample was again evacuated and krypton adsorption measurements were

- 50 -
performed by repeating the above procedure but using krypton and
increasing the dosing pressure in successive doses. The equilibrium
pressure observed after each dose was corrected for thermal trans-
piration effects. Once the gas volume introduced and the volume not
adsorbed at a given pressure were known (±2%) it was possible to
calculate the volume adsorbed at various equilibrium pressures. The
surface area was calculated by plotting V(p ) against ~ where Po-P Po
Po was the saturation vapour pressure of krypton (0.33kPa).
The analyser allows the measurement of surface areas as low as
0.1 m2g-1 (±2-S%) when krypton gas is used as the adsorbate molecule.
3.5.2 Temperature Programmed Desorption (tpd) of Ammonia
Tpd of ammonia was carried out on W03 and both the potassium
and sodium bronzes. A schematic diagram of the tpd apparatus used is
shown in Figure 3.4. In the apparatus the desorbed ammonia molecules
were measured by a digital conductivity meter, Fissons PTl-18.
Nitrogen gas was purified by passing through a SA molecular
sieve at 298K. 6% NH3/94% N2 was purified by passing through a trap
containing silica gel at 298K. Gas flow rates were kept constant
(to within ±O.Scm3min-1) and were for N2, 20cm3min-1 and 6% NH.3 in 3 . -1 N2, 1 Ocm mln .
The sample (1-2g) was placed in a Pyrex reactor fitted with a
thermocouple (Chromel-Alumel) to measure the sample temperature of
the solig sample, and surrounded by a tubular furnace whose temperature
was contro 11 ed by ali near programmer to wi thi n ± SK. N2 gas was
admitted'and the temperature raised to 773K and held for lh. The
sample was cooled to room temperature in N2 gas. 6% ~H3 in N2 was

N2
6% NH3/N2
computer conductivity meter
....-~ 1\
l./ ~
Thermocouple
1-0' -]
FC
r '-1 Reactor
Furnace
Temperature ProgranJTIer
Figure 3.5 Tpd Apparatus
. MS 5A Molecular sieve trap
SG : Sill el trap
T : Taps
FC : Flo\'1 troller
,.... ....
Electrode
U1 --'
r0o- f-
~ _ Exit
........
,
Conductivity cell

- 52 -
then admitted and the sample allowed to equilibrate for 10 min. The
diluted ammonia flow was then replaced by pure N2. The gas from the
reactor was then bubb1~d through a cell containing 20cm3 of de-ionised
water. The de-ionised water was obtained by passing doubly distilled
water through an ion-exchange column packed with Duolite. The
conductivity of the water in the cell was continuously monitored using
a conductivity meter. When the conductivity of the de-ionised water
was constant, indicating any excess ammonia or physisorbed ammonia had
been removed, the sample temperature was raised to 773K at 5K min- l ,
and the concentration of desorbed ammonia in the exit gas was continu
ously monitored as a change in conductivity of the de-ionised water in
the cell. The output on the conductivity meter and the thermocouple
was fed to a Commodore CBM 4032 computer (1 bit per ~mo1e of ammonia)
through an amplifier and an analogue to digital converter for data
processing.
Calibration of the conductivity meter for ammonia was done by
measuring the conductivity of 20cm3 of de-ionised water containing
varying amounts of ammonia solution.· A calibration curve between the
conductivity and the number of moles of ammonia present was then
derived. The amount of ammonia desorbed was then estimated using this
relationship. A previous study(12) has shown that the results
obtained by the conductivity method are reproducible and the error is
within ±3nmol of ammonia.
3.5.3 Transmission Electron Microscopy
For TEM, the sample was crushed using a pestle and mortar,
ultrasonically dispersed in acetone and a drop of the suspension was
placed onto a 200 mesh carbon coated copper grid. The dried grid,

- 53 -
clamped on the sample holder was transferred to the TEM (Jeol Temscan
100CX). The sample was evacuated to less than 0.1 mPa before
exposure to the electron beam at an accelerating voltage of 100kV.
Micrographs of the magnified samples were taken by a Joel Plate
Camera containing Agfa Gevaert Scientia films. The negatives were
developed using an Agfa G170C developer, fixed by Ilford Hypam fixer
and printed on Kodak Photographic paper.
3~6. Results
3 .. 6.1 BET Surface Area
The surface area of W03 and the sodium and potassium bronzes
was determined from the measurement of krypton adsorption at 77.1SK.
Figures 3.6 - 3.16 show the plots of V(~o-p) versus %; for the differ
ent samples. The gradi ent (ij~t ) and intercept v7 of these plots
permit the monolayer capacity Vm to be derived and hence the surface
area assuming a cross-sectional area of 0.195nm2 for the krypton atom
assuming liquid krypton. Table 3.1 gives the surface area values for
W03, KxW03 and NaxW03 where, 0.05 ~ x ~ O.S.
W03 has a higher surface area than any of the bronze samples;
this could be expected since the bronzes were prepared at a very high
temperature. In general, for any given series of bronze, the surface
area tends to decrease with increasing alkali ion concentration.
This could not be due to a structural effect since although the pot
assium bronzes with low alkali metal content are mostly hexagonal and
those wi th x ~ 0.3 tetragona 1, the sodi urn bronzes wi th x ~ 0.3 are ,
tetragonal and at high sodium content hexagonal. The bronzes were
prepared at high temperature and it is possible that the difference in
surface area is caused by sintering. It appears that the extent to

2. 1
l.8
l.5
l.2
0.9
0.6
0.3
O. 1 0.2 0.3
Figure 3.6 BET plot for W03 (Krypton adsorption)
p 3 -1
0.4 EPa
, ) em 9 ,Po-P
~------------------------------------------------------~
2. 1
1.8
1.5
1.2
0.9
0.6
0.3
0.1 0.2 0.3
Figure 3.7 BET plot for 0.05KW (Krypton adsorption) 0.4 L
Po

28
24
20
16
12
8
4
0.1 0.2 0.3 Figure 3.8 BET plot for 0.2KW (Krypton adsorption)
- cm3g-1 o-p)
9.0
7.5
6.0
4.5
3.0
1.5
0.1 0.2 0.3
Figure 3.9 BET plot for 0.3kW (Krypton adsorptionJ
0.4
0.4
.EPo
EPo

I -p) 8 . 16
14
12
10
B
6
4
2
14
12
10
B
6
4
2
Figure 3.10 BET plot for 0.6KW (Krypton adsorption)
O. 1 0.2 0.3
Figure 3.11 BET plot for O.BKW (Krypton adsorption)
0.4 EPa

p . ... ~;tp -p)
1001 t3g- 1
28
24
20
16
12
8
4
3
2
1
O. 1 0.2 0.3
Figure 3.12 BET plot for 0.05NaW (Krypton adsorption)
0.1 0.2 0.3
Figure 3.13 BET plot for 0.2NaW (Krypton adsorption)
0.4
0.4
EPa
EPo

9.0
7.5
6.0
4.5
3.0
1.5
L JpO-P) 3 -1 9 16
..
14
12
10
8
6
4
Figure 3.14 BET plot for O.3Nal~ (Krypton adsorption)
O. 1 0.2 0.3
Figure 3.15 BET plot for 0.6NaW (Krypton adsorption)
, , I , Ii ~ I ,
0.4 1? Po

. o
-c::: 0 .,... .jj
('f') Q. . S-O 0
III "0 ro c::: 0 .jj Q.
~ ~ -N . 3
0 ro z CO . 0
• S-O
I+-
.jj 0 ..... Q. ..... I-
0 1.1.1 CO
\.0 ..... . M
~ S-:::s C'I .,...
I..&..
1.0 o::t N 0 CO ..... ..... ..... .....
-~ ~~ I I o C'I
Q.M - e > U

i, '
- 54 -
which the bronzes are sintered depend on the alkali metal concentration,
the higher this concentration, the greater is the loss of surface area
due to sintering. Table 3.1
Surface Area Values
Sample surface2Arya/m2g-1
t 0.05m g-
W03 1.15
0.05KW 1.05
0.2KW 0.77
0.3KW 0.26 (0.24)
0.6KW 0.16
O.BKW 0.16
O.05NaW 0.96
0.2NaW 0.64
0.3NaW 0.42 (0.39)
0.6NaW 0.13
O.BNaW 0.13
Good reproducibility is indicated by duplicate data in brackets.
3.6.2 Tpd of Ammonia
3.6.2.1 Tpd of Ammonia on W03 and KxW03-
Temperature programmed desorption of chemisorbed ammonia could
show a picture of the distribution of the strength of the acid sites -
on the alkali metal tungsten bronzes. The rate of ammonia desorption I I "
as a function of temperature is considered for this purpose.

'de dt
1.6
1.4
1.2
1.0
0.8
0.6
0.4
0.2
2.8
2.4
2.0
1.6
1.2
0.8
0.4
323 423 523 623 723 823 T/K
Figure 3.17 Tpd profile of NH3 on W03
323 423 523 623 723 823 T/K
Figure 3.18 Tpd profile of NH3 on O.05KW

ae ,f' ---' dt
de dt
1.05
0.90
0.75
0.60
0.45
0.30
0.15
0.28
0.24
0.20
o. 16
0.12
0.08
0.04
, 323 423 523 623 723 823 T/K Fi gure 3.,19 Tpd profil e of NH3 on o. 2KW
323 423 523 623 723 823 T/K
Figure 3.20 Tpd profile of NH3 on 0.3KW

,.. . de .....
dt 0.15
0.13
0.11
0.09
0.07
0.05
0.03
0.01
323 423 523 623 723 823 T/K
de :-Figure 3.21 Tpd profile of NH3 on O.6KW
dt
0.8
0.7
0.6
0.5
0.4
0.3
0.2
o. 1
323 423 523 623 723 823 T/K
Figure 3.22 Tpd profile of NH3 on O.8KW

- 55 -
The tpd profiles of ammonia on samplesofW03andthe potassium
tungsten bronzes are shown in Figures 3.17 - 3.22 respectively. In
general the profiles obtained for samples W03t O.05KW and O.2KW are
quite similar: showing one broad desorption peak with a maximum at
approximately 398K. The profile obtained for sample O.3KW exhibits
two overlapping peaks with maxima at 448K and 635K. The rate of
ammonia desorption from sample O.6KW also gives two peaks with maxima
at 435K and 729K. The tpd profile for sample O.8KW gives two peaks
with maxima at 363K and 753K with a distinguished shoulder at 473K.
The total amount of ammonia desorbed from these -samples together with -
the temperature at which the maximum rate -of desorption occurs are
summarised in Table 3.2. In general it would appear that there are
at least three different types of acid sites present on the potassium
bronzes and these can then be correlated to the peak maxima. There _
is a low temperature peak at about 390K which is mostly present on
bronzes with x ~ 0.2; however, the peak ;s also present on 0.8KW.
There is a hi gh temperature peak at '" 730K and another at'" 450K for
bronzes with x ~ 0.3.
One obvious factor that can influence the nature of the acid
site is the structure of the b~o~zet since it is possible that bronzes
with the same structure will possess cages which are geometrically
identical thus showing a sim~lar distribution of acid sites. Although
the assumption is true for bronzes with x ~ 0.2 (O.2KW is hexagonal and
O.OSKW is ~n intergrowth tungsten bronze, which is a mixture of hexa-I
gonal and W0 3 phases), O.3KW possessing the hexagonal structure has a
quite similar distribution of acid sites to 0.6KW which has a tetra-
gonal structure. It is possible that the alkali metal ion.modifies 'I ',I • I
the nature of the acid sites probably through an electronic effect;

- 56 -
thus its concentration could be important. It could explain why bronzes
with high alkali metal content show more than one type of acid site.
It will also be interesting to compare the acid site concentration on
the bronzes as the alkali metal ion concentration is increased. Table
3.3 gives the BET surface area of the potassium bronzes and the acid
site concentration (moles of NH3 des orbed per m2 of surface). The
table also reports the surface area of acid sites calculated from the
number of molecules of ammonia desorbed and assuming a cross-sectional
area of 13.2 x 10⁻²⁰m2 for the ammonia molecule. In general both the
acid site surface areas and the acid site surface density tends to
decrease with increasing potassium content; the only exception being
0.3KW which has a slightly higher surface concentration of acid sites
than 0.2KW. Although the difference is within experimental error
(normally ± 20%) for surface area and tpd measurements), it is possible
that the stronger acid sites present on 0.3KW are each capable of
adsorbing more than one molecule of ammonia.
Table 3.2
Sample Molecules NH3 Tma/ K desorbed/g
W03 6.98 x 10¹⁸ 385
0.05KW 4.40 x 10¹⁸ 398
0.2KW 1. 34 x 1018 398
0.3KW '5.28 x 10¹⁷ 448, 635
0.6KW 1.22 x 10¹⁷ 435, 729
0.8KW 3.07 x 10¹⁶ 363, 473(5) 735
(5) = shoulder

- 57 -
Table 3.3
Sample No. of moles of Acid site BET surface NH3 desorbed/m2 surface areal area/m2g- 1 of surface m2g-1
W03 10. 07 x 10-6 0.92 1. 15
O. 05KW 6.96 x 10⁻⁶ 0.58 1.05
0.2KW 2.89 x 10⁻⁶ 0.18 0.77
0.3KW 3.37 x 10⁻⁶ 0.07 0.26
0.6KW 1.27 x 10⁻⁶ 0.016 0.16
0.8KW 0.32 x 10⁻⁶ 0.004 0.16
3.6.2.2 Tpd of Ammonia on Nax~
The tpd, profiles of the sodium tungsten bronzes are shown in
Figures 3.23 - 3.27. The profiles for samples 0.05NaW, 0.2NaW and
0.3NaW comprise a single peak in each case, with the peak for 0.05NaW
being sharper than for the other two bronzes. The peak maximum
tends to move to lower temperatures increasing sodium content. The
rate of ammonia desorption from sample 0.6NaW gives a very broad peak
with a maximum at 493K and distinct shoulders at 4llK and 623K. The
tpd profile of,0.8NaW shows a broad peak with maxima at 543K and 698K
and a shoulder at 4llK. Table 3.4 records the amount of ammonia
desorbed from these samples and the temperature at which the maximum
rate of desorption occurs. As for the potassium bronzes, the sodium
analogues with low alkali ion concentration, x , 0.2, have mostly one
type of acid site present. However Tmax tends to indicate that the
sites present on the sodium bronzes with x ~ 0.2 could be of a stronger
nature than those on the corresponding potassium bronzes. These i I I. !
sodium bronzes have a tetragonal structure and their distribution of
acid sites should relate to those present on 0.6KW which is also
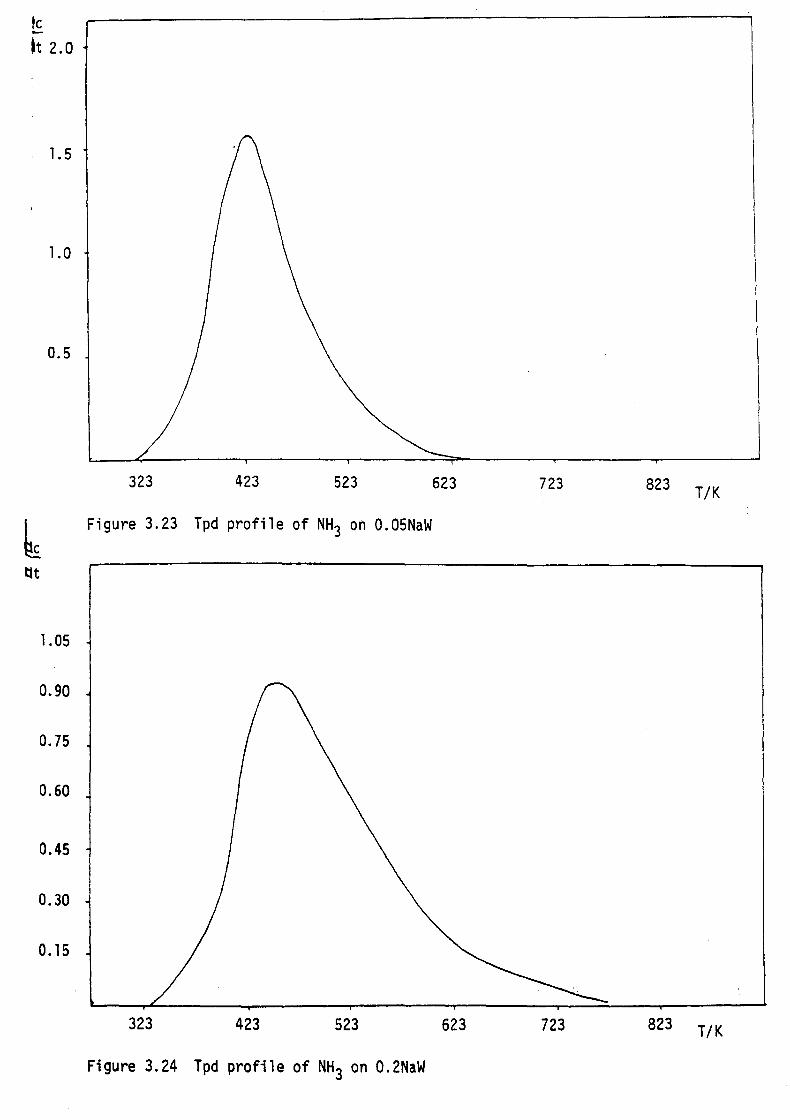
fc -It 2.0
1.5
1.0
0.5
323 423 523 623 723 823 T/K
Figure 3.23 Tpd profile of NH3 on O.05NaW
tit
1.05
0.90
0.75
0.60
0.45
0.30
0.15
323 423 523 623 723 823 T/K
Figure 3.24 Tpd profile of NH3 on O.2NaW

Ie t-
It
0.3
0.25
0.2
0.15
0.1
0.05
de
dt
0.4
0.3
0.2
o. 1
423 523 623 723 823 T/K
Figure 3.25 Tpd profile of NH3 on 0.3NaW
323 423 523 623 723 823 T/K
Figure 3.26 Tpd profile of NH3 on O.6NaW

de
dt
0.3
0.25
0.2
0.15
0.1
0.05
de
dt
0.4
0.3
0.2
0.1
423 523 623 723 823 T/K
Figure 3.25 Tpd profile of NH3 on 0.3NaW
323 423 523 623 723 823 T/K
Figure 3.26 Tpd profile of NH3 on 0.6NaW

I"- 1..0 Ln ~ ("t") . . . . . 0 0 0 0 0
.gl ~ ~
N ,... . . 0 0
("t") N CX)
("t") N I"-
l~ 1..0
("t") N Ln
("t") N ~
("t") N ("t")
:3 tC z: CX) . 0
c: 0
("t") :r:: Z
I+-0
Q,) ,... .,.. '+-0 ~ 0-
~ 0-l-
I"-N . ("t")
Q,) ~ ::::J en .,.. l..!-

- 58 -
tetragonal, but however, possess two types of acid sites with Tmax at
435K and 729K. O.3NaW contains only one type of acid site which is
weaker than those present on the hexagonal O.3KW. The sodium bronzes
with higher sodium concentration contains more than one type of acid
site. Table 3.5 gives the BET surface area of the sodium bronzes, the
acid site concentration and the acid site surface area. The acid site
surface concentration decreases with increasing sodium content similar
to the potassium bronzes.
The type of acid site present on the alkali tungsten bronzes
appears to be influenced by the structure of the bronzes, the concen-
tration and nature of the alkali metal ion. In general there is a
higher concentration of acid sites present on the potassium bronzes
than the corresponding sodium bronzes. However at low alkali metal
ion concentration the acid sites present on the sodium bronzes are of
a stronger nature than those on the potassium bronzes. At high alkali
ion concentration, different types of acid sites are present on both
bronzes. Bronzes with the same structure also give acid sites of
different strengths depending on the concentration and nature of alkali
ion present.
, , , :
The nature of the acid sites present on W03 and the bronze
samples observed from ammonia desorption will be discussed later in
conjunction with the isopropanol decomposition reaction.
3.6.3 Transmission Electron Microscopt
High Resolution Electron Microscopy (HREM) has previously been
~sed to study the structure of tungsten bronzes(13). In the present, , I
study, only in a few cases, especially for sample O.05KW and O.2KW,

- 59 -
Table 3.4
I
Sample Molecules HN3 TmaxK desorbed/g
0.05NaW 1.36 x 10¹⁸ 428
0.2NaW 5.05 x 10¹⁷ 453
0.3NaW 3.20 x 10¹⁷ 416
0.6NaW 3.87 x 10¹⁶ 411 (s),493, 623(s)
0.8NaW 2.80 x 10¹⁶ 411 (s ) ,543 , 698
(s) = shoulder
Table 3.5
Sample No. of moles o~ Acid site BET surface NH3 desorbed/m surface area area/m2g-1 of surface /m2g-1
0.05NaW 2.34 x 10⁻⁶ O. 18 0.96
0.2NaW 1.31 x 10⁻⁶ 0.067 0.64
0.3NaW 1. 26 x 10-6 0.042 0.42
0.6NaW 0.49 x 10⁻⁶ 0.005 O. 13
0.8NaW 0.36 x 10⁻⁶ 0.004 0.13
were successful images obtained. Figures 3.29 - 3.32 show electron
images of samples 0.05KW and 0.2KW. Sample 0.05KW is an intergrowth
tungsten bronze and may be considered as a lamellar intergrowth of
hexagonal tungsten bronze (HTB) and W03. The formation of this type
of structure can be regarded as a way of adapting to alkali poor , '
conditions by IIdiluting" the HTB with slabs of pure W03, whereby a

- 60 -
certain minimum degree of filling of the tunnels can be maintained.
Kihlborg(13) employed HREM to obtain images of ITBs prepared with K,
Rb, Cs and Tl. The images obtained enabled identification of vertical
slabs of HTB and W03 in ITBs and of distorted ITBs containing single
and double HTB tunnel rows and W03 slabs of varying widths. Figures
3.29 and 3.30 give the electron images of the ITB, O.OSKW, and shows
signs of the vertical slabs of HTB and W03 present in this type of
bronze. Figures 3.31 and 3.32 give the electron images of sample
O.2KW, and show signs of vertical slabs and layers. Bando et al(14)
has studied HTBs using HREM and h~s proposed a model in' which layers
occur with the alkali sites. either completely filled or completely
empty. Stacking of these two types of layers occurs so that 4 or 5
filled layers are followed by a vacant one.

- 61 -
Figure 3.29 Electron image of 0.05K~J
Figure 3.30 Electron image of 0.05KW

- 62 -
I
Figure 3.31 Electron image of O.2KW
Figure 3.32 Electron image of O.2KW

- 63 -
CHAPTER 3
REFERENCES
1. S. Brunauer, P.H. Emmett and E. Teller, J.Am. Chern. Soc., 60,
309, (1938).
2. I. Langmuir, J. Am. Chern. Soc., 40,1368, (1918).
3. S.J. Gregg and K.S.W. Sing, Surface and Colloid Science, ~, Ed.
Matijevic, John Wiley and Sons, (1976).
4. S.J. Gregg and K.S.W. Sing, Adsorption, Surface Area and Porosity,
Academic Press, (1984).
5. B.S. Green, M. Lahav and G.M.J. Schmidt, Mol. Cryst. Liq. Cryst.,
29,187, (1975).
6. P.C. Chencha1ah, H.L. Hollands and M.F. Richardson, J. Chern. Soc.
Chern. Commun., 436, (1982).
7. O. Johnson, J. Phys. Chern., .§2., 827, (1955).
8. S. Ramdas, W. Jones, J.M. Thomas and J.P. Desvergne, Chern. Phys.
Lett., ~, 468 (1978).
9. J.E. Mopes and R.P. Eischens, J. Phys. Chern., 58, 1059, (1954).
10. C.V. Hidalgo, H. Itoh, T. Hattori, M. Niwa and Y. Murakami,
J. Ca ta 1., 85, 362, (1984).
11. V. Kanazirev and N. Borisova, Zeolites, ~, 23, (1982).
12. S. Stevenson, M. Phil. Thesis, Brunel University (1985).
13. L. Kih1borg and R. Sharma, J. Microsc. Spectrosc. Electron, I, 1892, 387, (1982).
L. Kih1borg, Solid State Chemistry, 1, 143, (1982).
14. Y. Bando and S. IIJima, Acta. Cryst. A37, C-303, (1981).

- 64 -
CHAPTER 4
THERMAL ANALYSIS
4. 1 Introduction
The alkali metal tungsten bronzes which are non-stoichiometric
compounds attract attention because of the possibility of their use in
modern technology as electrode materials for fuel cells, as electrically
conductive transparent films and in semiconductor devices. Although
they were discovered at the beginning of the last century, their thermo
dynamic properties or chemical stability in the presence of oxidising
or reducing gases is still a subject of great interest.
The reduction of alkali metal tungsten bronzes has previously
appeared in the literature. Dickens(l} has studied the reduction of
the oxides and the bronzes of tungsten. Lower oxides of tungsten
reduced directly to tungsten; the a form in the case of W02 and W1S049 and the s form for W200SS ' W03 however, first formed W200SS in a
hydrogen atmosphere, which then reduced to S tungsten. The low alkali
containing tungsten bronzes were shown to reduce initially to an
oxygen deficient modification of W03 and subsequent reduction gave
sodium tungstate and both forms of tungsten. For the sodium bronzes,
as the sodium content increases it was found that the formation of a
higher content bronze occurred, the excess tungsten initially being
removed as tungsten dioxide and finally a- and s- tungsten. The sod
ium content of the bronze increases until it is converted to the cubic
peroskite structure and finally to NaW03 which then reduced to Na2W04·
For all bronzes the final products of reduction were tungsten metal
and tungstate. \ Bu'lk oxidation of the tungsten bronz'es is thought to
produce either X2W04 and W03 or the x-poly tungstate and W03_x and

- 65 -
involves an oxygen uptake which increases as the alkali metal ion
content increases. Deschanures(2) and Hussain(3) et al suggest con
version of tungsten bronzes to polytungstates quickly at 873 - 973K
and then oxidation of the lower tungsten oxide to the trioxide at
about l223K.
The sodium and potassium bronzes prepared here have been
compared for their reactivities as exemplified by their reduction in
hydrogen gas and their oxidation in a diluted oxygen gas stream.
4.1.2 Thermal Methods of Analysis
Thermal analysis involves heating a sample at a constant rate
in a certain atmosphere or under vacuum and observing some changes in
the sample or its surroundings. Thermogravimetric analysis (tga) is
the simplest of the thermal analysis techniques and involves measure
ment of the mass of the sample- as a function of temperature. Differ
ential thermal analysis (dta) monitors the temperature difference
between the sample and a reference material and thus gives an indi
cation of whether an exothermic or endothermic reaction is occurring
in the sample.
In temperature programmed reduction (tpr) the hydrogen consumed
in a reduction step is being monitored as the sample is being heated
in a diluted hydrogen atmosphere. Temperature programmed oxidation
(tpo) involves measurement of the oxygen uptake as the sample is heated
in a dilute oxygen atmosphere.
4.2 Experimental Thermal Analysis
4.2.1 Tga and Dta Techniques
Thermogravimetric and differential thermal analysis was performed

- 66 -
on a Stanton Redcroft STA 780 Simultaneous Thermal Analyser, which is
designed to give simultaneous thermogravimetric records and differ
ential thermal analysis curves. The sample (usually about 20mg ±
O.Olmg) and the reference material, a-alumina were contained in rhodium-·
platinum crucibles. The crucibles were mounted on top of flat plates,
Pt-Pt/Rh thermocouple system. To eliminate possible factors which
may affect the thermogravimetric and dta curves the same sample size,
heating rate 10K min- l and gas flow rate of 40cm3min- l were used for
the different samples. The nitrogen and hydrogen gases were purified
by passing through a SA molecular sieve trap at 295K. Before each
reduction run, the sample and the system were flushed with nitrogen
for about 15 minutes. The sample was then heated in nitrogen to 373K
to remove any moisture. When the weight had stabilised the sample
was cooled to room temperature and the nitrogen flow was replaced by
hydrogen flow. When the weight was constant, heating was started and
the weight change and the temperature difference between the sample
and the reference material was recorded as a function of temperature
to l223K.
4.2.2 Tpr Technique
A schematic drawing of the tpr apparatus used in the present
work is shown in Figure 4.1.
The sample was placed in a silica reactor fitted with a thermo
couple to measure the sample temperature and surrounded by a tubular
furnace whose temperature was controlled by a linear temperature prog
rammer. The reducing gas 5% H2/9S% Arwas purified by passing
through a trap containing Pd/Al:203 at 29SK to remove any oxygen and
another trap of SA molecular sieve at 29SK to remove any moisture.
It is important that the oxygen content of the gas stream be reduced

H2/N2
N2
T
MS Thermocouple
FC PA
Computer
T.C. Cell
~~J-~I Flowmeter
Power supply
H2
Injection valve
exit
Figure 4.1 Tpr Apparatus
Reactor
Furnance
Temperature progranvner
Cold trap
T = Tap FC = Flow Controller PA = Pd/Al 0 Trap . MS = Molec61~r Sieve

- 67 -
to as low a level as possible. The reducing gas purified and dry was
then directed through one arm of a conductivity cell (Gow Mac Katha
rometer No. 40-201). Leaving the katharometer the gas then passed
through th~ reactor containing the sample and finally via a cold trap
kept at 203K to remove the reduction products. After the trap the
gas stream passed through the other arm of the conductivity cell. In
this way a reduction process on the sample was detected by an imbalance
in the thermal conductivity cell. The change in hydrogen concentration
was displayed as a peak or several peaks on a chart recorder. The
output on the conductivity bridge and thermocouple (Chrome1-A1ume1)
was fed to a SSC microcomputer through an amplifier for data processing.
-Since the gas flow was kept constant, the change in hydrogen con
centration was proportional to the rate of sample reduction. The
experimental conditions used are listed in Table 4.1.
Gas mixture
Heating rate
Flow rate
Mass of sample
Table 4.1
Experimental Conditions
5% H2/95% Ar
5K min-1
40 cm3min-1
~50mg
The amount of hydrogen consumed was determined at the end of
each run by injecting a known volume of pure hydrogen into the gas
stream as a calibration standard. The peak areas were calculated
using the computer data processing facility.
4.2.3 Tpo Technique
A schematic diagram of the tpo system used is shown in

- 68 -
Figure 4.2. A 6% O2 in N2 gas stream was used. The gas stream
(40cm3 min- l ) was purified by passing through a SA molecular sieve
before being admitted to the sample reactor. The sample (1 - 1.5g)
was placed ~n a silica reactor fitted with a thermocouple well to
monitor its temperature. The reactor was placed in a tubular furnace
whose temperature can be raised by linear programming. The sample
was first flushed with argon before admitting the 6% O2 mixture.
The mixture was passed through the sample until the output from the
oxygen detector was stable and the linear heating started. A heating
rate of 10K min- l was used. A calibrated oxygen detector (Draeger
Oxywarn 100R) was used to monitor the oxygen level (with an accuracy
of ± 0.05%) as a function of temperature. The oxygen uptake was
displayed as a peak or peaks on a chart recorder connected to the
oxygen detector. The consumption of O2 was calculated by integration
of the peak areas. Values were expressed as mol 02 per mol sample.
4.3 Results
4.3.1 Tga and Dta Results
4.3.1.1 Reduction of W0 3 and the Potassium Tungsten Bronzes
Tga reveals that there was only a slight weight loss (~O.3%)
on heating the potassium tungsten bronze samples ,;0 nitrogen to 373K. , ,
The results obtained-by tga and dta on heating sa~ples W03, O.OSKW, "
0.2KW, 0.3KW, 0.6KW and O.8KW in hydrogen to l223K are shown in
Figures 4.3 - 4.8 respectively. Reduction of pure W03 is endothermic
starting at 773K with two overlapping processes having minima at 861K
and 98SK. The reduction ;s complete at 998K with a total weight loss
of 2~.09% which agrees well with a theoretical weight loss of 20.70%
assliming that W03 is comp1etely'reduced to; Wmetal. The thermogram
seems to indicate that a suboxide of tungsten is first formed which is

MS Thermocouple
6% 02/N2 T reactor
Ar T
furnace
Figure 4.2 Tpo Apparatus
Oxygen detector
exit
Temperature programmer
Chart Recorder
T = Tap MS = Molecular Sieve FC = Flow Controller

o
4 u 'r-E S-
8 QJ ..r::: +0)
0 X
12 LLI
i 16
~ 20 u
'r-E S-QJ
24 ..r::: +0)
0 '0 c:: UJ
473 673 873 1073 T/K Figure 4.3 Dta and tga curve of W03
0
u 4 ....
E QJ
..r::: +0)
8 0 x
UJ
,: 12 t
16 ~ u ....
20 E QJ
..r::: +0) 0 '0 24 c:: UJ
473 673 873 1073 T/K
Figure 4.4 Dta and tga curve of 0.05KW

o
473 673 873 1073 T/K Figure 4.3 Dta and tga curve of W03
. .
0
u 4 ....
E Q) .c ..,
8 0 x UJ
12 t --.
VI'
~ VI 16 0 ..... . u ..
.~ :3: 20 ~ Q)
.c .. 0
24 ~ c:
UJ
473 673 873 1073
T/K Figure 4.4 Dta and tga curve of O.05KW

a
3
6
9
12
15
18
21
473 673
Figure 4.5 Dta and tga curve of O.2KW
0
3 • 6
9
12
15
18
21
473 673
Figure 4.6 Dta and tga curve of O.3KW
•
873 1073 T/K
•
873 1073 T/K
u ..... E QJ
..c: +-J o x
L.LJ
i
~ u ..... E s... QJ
..c: +-J 0 ~ C
L.LJ
u ..... E QJ
..c: +-J 0 X
L.LJ
i
~ u 'r-
E OJ
..c: ~ 0 ~ c
L.LJ

o
2
4
6
8
~ 10
:f 12 '~
14
473 673 873
Figure 4.7 Dta and tga curves of 0.6KW
o
1.5
3.0
4.5 ~----------____________________ __
6.0
7.5
9.0
'I I
473 673 873
Figure 4.8 Dta and tga curves of O.8KW
1073 T/K
1073 T/K
u ..... t: Q)
.s::: +-l o X
I.LJ
u ..... E r.. Q)
.s::: +J o
'"'0 c:
I.LJ
u .,... E Q)
.s::: .j..I o X
I.LJ
r
I
~ u .... E Q) ~ .j..I o
'1j c:
. I.LJ

- 69 -
then reduced to tungsten. The tga and dta curves obtained on heating
O.OSKW in H2 show much similarity to that of pure W03. A total weight
loss of 20.78% occurred in two overlapping endothermic processes with
minima at 861K and 96SK. The lowest content potassium bronze appears
to reduce initially to an oxygen deficient modification of W03;
subsequent reduction gives sodium tungstate and tungsten. The theore
tical weight loss for such a process agrees well with the observed
weight loss. For the reduction of O.OSKW the following stoichiometric
equation may be written;
The dta and tga results for samples 0.2KW - 0.8KW show that reduction
is a single endothermic process usually in the temperature range
773 - 1123K. The total weight loss in each case agrees well with a
reduction process that leads to the formation of K2W04 and W. Table
2 gives the experimental and theoretical weight loss and the tempera
ture of the minima for the reduction process for each of these samples.
Table 4.2
Sample Theoretical % Experimental % ~~nJK weight loss weight loss endotherm
0.2KW 17.35 19.87 993
0.3KW lS.76 15.96 933
0.6KW 11.28 11.93 965
0.8KW 8.51 8.90 923

- 70 -
4.3.1.2 Reduction of the Sodium Tungsten Bronzes
Tga results show that the sodium bronzes, similar to the pot
assium bronzes lose only minimal weight on heating in nitrogen to 373K.
The dta and tga results obtaine9 for samples 0.05NaW; 0.2NaW; 0.3NaW;
0.6NaW and 0.8NaW on heating in hydrogen to 1223K are shown in
Figures 4.9 - 4.13 respectively. The profiles show a similarity to
those obtained for the reduction of the potassium bronzes. However,
unlike sample 0.05KW, reduction of 0.05NaW occurred in only one step,
with the endotherm having a minimum at 953K, perhaps suggesting no W03 is present in the sodium bronze sample. For samples with x > 0.2 ,
there was an endothermic process usually occuring between 823K and
1123K. In all cases the total weight loss was assumed to be assoc-
iated with the formation of Na 2W04 and W. For the sodium bronzes,
the experimental and theoretical weight losses and the temperature of
the minima for the reduction process is given in Table 4.3
Table 4.3
Sample Theoretical % Experimental % Tmi n,lK weight loss weight loss for
endotherm
0.05NaW 19.91 20.60 953
0.2NaW 17.94 19.25 1003
0.3NaW 16.08 16.45 945
0.6NaW 11.72 12.50 1021
0.8NaW 8.95 10.53 953
In all cases the weight loss obtained on both the potassium and sod
ium br0nzes lagrees we 11 wi th the- theoreti ca 1 wei ght loss for t~e .
reduction of each bronze to the corresponding tungstate and W metal.

o
o
4
8
12
~ 16
~ 20 ~
24
u .... E SO) .c +0) o x
U.J
i
u .... e SClJ -'= +0)
I~ L-------~--------~------~--------~--------~
473 673 873
Figure 4.9 Dta and tga curves of O.OSNaW
473 673 873
Figure 4.10 Dta and tga curves of 0.2NaW
1073 T/K
u .... t: ClJ -'= +0)
o x __ ----__ ----~ U.J
1073 T/K
r
u .~ Q)
.s:: ~ o ~
·c U.J

a
3 u ''-E S-O)
6 ..c .+oJ 0 ><
UJ
9 i •
12
~ 15 ~ I
~ 18
u ''-E S-O)
..c .+oJ 0
21 l-g UJ
473 673 873 1073 T/K
Figure 4.11 Dta and tga curves of 0.3NaW
0
2 .. u .,...
4 ~ Q) ..c +J 0 ><
6 UJ
1 8 ~
VI 10 ~ ,~~
u . 12 ~~ .,...
~~ E ~ ~
Q) ..c +J 0
14 " c UJ
473 673 873 1073
Figure 4.12 Dta and tga curve of 0.6NaW

" .... 10 C ~ Cl)
.1=:0 . --' w
0 coT Q.>
Q.> ::5 ~
coT 10
Q.>
n c ~ < Cl)
0 -t,
0 . co :z Q.> :E:
.1=:0 'oJ W
~ 'oJ W
co 'oJ W
...... o 'oJ W
% Wt. loss
--' --' N 0 co N 0
Endotherm; c ...-. -.. Exothermic

- 71 -
Variation in the temperatur~ at the maximum rate of reduction occurs,
i.e. the minima among the different samples, could be due to experi
mental artefact.
4.3.2 Tpr Results
4.3.2.1 Reduction of W03-
The tpr profile of W03 on heating to l473K is shown in Figure
4.14. The profile shows that reduction started at 758K with two over
lapping processes having maxima at l020K and 1180K. As found by the
tga thermogram, the tpr profile also indicates the formation of a sub
oxide of tungsten which is then reduced to tungsten. The total hydro
gen consumed was found to be 13.3 mmoles g-l sample. The theoretical
amount of hydrogen required for the reduction of W03 to W is 12.9 m
moles g-l sample. This value is lower than the observed and may
partly be due to the accuracy "of the method.
4.3.2.2 Reduction of Potassium Tungsten Bronzes
The tpr profiles of samples O.05KW, O.2KW, O.3KW, O.6KW and
O.SKW are shown in Figures 4.15 - 4.19 respectively. In general the
profiles are similar showing reduction to occur in one step in the
temperature range 850K - l323K. However, the profile of sample O.05KW
appears to show a rather broad peak with a slight shoulder at l123K
perhaps suggesting the presence of two unresolved processes as
indicated more clearly by tga results. The temperature at which each
maxima occurred together with the total hydrogen consumed in the
reduction process is given" in Table 4.4. Similar to the tga results
the total hydrog:en consumed agrees well wi th a reducti on process that : I I' !
leads to the formation of K2W04 and W, which is illustrated below for

-III 6 .., .... e: ~
~ s.. td s.. ..,
4 .... .0 s.. td -e: 0 .... 2 .., c.. e ~ III e: 0 u N 0
::z:
473 673 873 1073 1273 T/K
Figure 4.14 Tpr profi1~ of W03
-III 6 .., ....
e: ~
~ td s.. ..,
4 .... .0 s.. td -e: 0 .... ..,
2 Q.. e ~ II)
e: 0 u N 0 ::z:
473 673 873 1073 1273 T/K
Figure 4.15 ilpr profile of 0.05KW

6
'r-
§ 4 t' to s.. ~ 'r-
f 2 to -c o 'r-~
Ir 0 :::J III C o u
C\J :z:
-III .., 'r-e: :::J
t' co s.. .., 'r-~ s.. co -c 0
'r-.., c.. e :::J III C 0 U
C\J :z:
6
4
2
0
473 673 873 1073 1273 T/K
Figure 4.16 Tpr profile of 0.2KW
473 673 873 1073 1273 T/K
Figurer4.17 Tpr profile of 0.3KW

-III 6 +oJ
'f-
c: ~
~ ttl !..
4 +oJ 'f-
~ !.. ttl -c: 0 .,...
+oJ 2 Cl. E ~ III c: 0 U
N 0 :t:
473 673 873 1073 1273
Figure 4.18 Tpr profile of 0.6KW T/K
-III +J 6 .,.... e: ~
~ co !.. +J
''''' 4 .Q !.. co -e: , , , 0 .,... +J 2 Cl. E ~ III e: 0 u N 0 :t:
473 673 873 1073 1273 T/K
Figure 4.19 Tpr profile of 0'.8Kw

- 72 -
the reduction of sample 0.2KW
The temperature at which the maximum rate of reduction occurs as observed
by tpr is in all cases higher than those found by dta. This could
partly be explained by the fact that in the dta experiment a pure hydro-
gen gas stream was used, whereas in the tpr experiments a dilute H2 gas
stream was used.
Table 4.4
Sample Peak Maxima/ H2 co~sumption/ K x 10- mo1g-
0.05KW 1373 11.40
0.2KW 1143 11.79
0.3KW 1143 9.28
0.6KW 1273 7.00
0.8KW 1273 5.18
4.3.2.3 Reduction of Sodium Tungsten Bronzes
The tpr profiles of the sodium bronzes, 0.05NaW, 0.2NaW, 0.3NaW,
0.6NaW and 0.8NaW on heating to l323K are shown in Figures 4.20 - 4.24
respectively. The profiles show that in all cases reduction occurs
in one step in the temperature range 850K - 1250K, similar to the pot
assium bronzes, if the products of reduction are assumed to be Na2W04
and W, then the observed value of hydrogen consumption agrees well with
the theoretical value. Table 4.5 shows the temperature at which each
maximum occurred together:w1th the total hydrogen consumed in the
reduction process. The tpr profiles for O.OSNaW and O.2NaW show a

-VI 1-J .,...
6 c: :::I
~ to s..
1-J .,... 4 J:l
s.. to -c: 0 .,... 1-J a. 2 E :::I VI c: 0 U
N :z: 0
473 673 873 1073 1273 T/K
Figure 4.20 Tpr profile of 0.05NaW
-VI ~
''''' 6 c: :::I
~ to s.. ~ ....
4 .0 s.. to -c: 0 .,... ~ a.
2 E :::I VI c: 0 U
N :z: a
473 673 873 1073 1273 T/K
Figure 4.21 Tpr profile of 0.2NaW

....... en +-I .... s::: 6 ;:,
t' to ~
+-I .,.. . .L:I 4 ~ to -s::: 0 ..... +-I 0-E 2 ;:, en s::: 0 U
N :J:
a
473 673 873 1073 1273
Figure 4.22 Tpr profile of 0.3NaW T/K
-en +-I .,.. s::: ;:,
6 t' to ~ +-I .,.. .L:I ~
4 to -s::: 0 .,.. +-I Q.
E ;:,
2 en s::: 0 U
N :J:
a
473 673 873 1073 1273 T/K
Figure 4.23 Tpr profile of 0.6NaW

H2 consumption (arbitrary units)
~ ~.
uo c ~ ro ~ . ~ ~ ~
~ UJ
~ ~ ~
~ ~ 0 ~ ~ . ... ro ~
~ 0 UJ ~
C) . 00 ;z ~ ~
00 ~ UJ

- 73 -
slight shoulder at approximately 1098K possibly indicating that
reduction may be occurring through an intermediate step which cannot
be resolved by the techniques used under the present conditions.
Table 4.5
Sample Peak Maxima/ K
H2 Consumpti9n/ x 10-3 molg-
-
O.05NaW 1245 12.40
O.2NaW 1250 10.90
O.3NaW 1250 9.14
O.6NaW 1202 8.69
O.8NaW 1140 5.49
4.3.3 T.p.o. Results
4.3.3.1 Oxidation of W Powder and Potassium Tungsten Bronzes
The sensitivity of the tpo method was demonstrated by a brief
study of the oxidation of pure tungsten powder on heating in a diluted
O2 atmosphere. The profile given in Figure 4.25 shows that oxidation
of tungsten powder starts at 655K and occurs in three overlapping
processes with maxima at 755K, 790K and 935K. It is most likely that
the different peaks can be associated with the gradual oxidation of o 6+ tungsten from W to W The total oxygen consumed (1.531 moles of
O2 per mole of W) is slightly higher than that theoretically required
for the process (1.50 moles of O2 per mole of W).
The tpo profiles obtained on oxidation of the potassium tung
s~eri bronzes are given in Figure 4.26. Table 4.~ ~cords the measured
oxygen consumption and the percentage which this is, of that expected

"TJ ..... to s::: ""\' rtl
~ . N <..n
-; "'0 0
""\' rtl tf)
s::: --' rt tf)
0 ...., ::e:: a
w
~ a a
0'1 a a
00 a a
--' a a a
--' N a a
a
02 uptake (arbitrary uhits)
W N

"'T'l -I.
I.Q C -s (l)
~ . N 0'\
~ 0
--l 0 "C 0
'0 -S 0 -t) -I • .... (l) VI
0'\ 0 0 -t) 0
"C 0 C'+ ell VI VI .... e: 3 00
0 C'+ 0 C ~
I.Q VI C'+ (l) ~
C' -s 0 .... ~ 0 N 0 (l) 0 VI
02 uptake (arbitrary units)
......
0 . 0 (J'1
'" :c
...... ......
0 . 00
'" ~
...... (J'1

- 74 -
on the basis of total oxidation to potassium tungstate and tungsten
trioxide as illustrated below:
It is possible that a poly tungstate first forms which then disproport
ionates to the tungstate and W03. XRD results of the oxidised products
showed only the presence of K2W04 and W03. The values are generally
close to 100%. The table also contains the peak maximum temperatures
observed in the oxidation of the various potassium tungsten bronzes.
The tpo profiles of O.OSKW, O.2KW and O.3KW consist of broad peaks
usually in the temperature range of 820K to 1075K with peak maxima at
approximately 1000K. The tpo profile of 0.6KW shows that oxidation
start;s at 575K and exhibits peaks a.t 760K, 855K and 955K. The
oxidation is complete at l140K. The oxidation of 0.8KW occurs in the
temperature range ~f 575K - 1090K and the profile shows distinct peaks
at 820K and 900K, with a shoulder at 690K. Although the complete
oxidation of all the potassium tungsten bronzes leads to the formation
of K2W04 and W03, the processes involved in the oxidation of the
bronzes with higher potassium content appear more complex than those
with lower alkali ipn concentration. One possible explanation for
this may be that th~ bronzes with low potassium content usually contain
only the hexagonal ,phase which could oxidise in a single step at high ,
temperature, whereas O.6KW and O.8KW contain mixed phases,normally
tetragonal and others. The tetragonal phase could oxidise at lower
temperature. It could be possible that the tetratungstate is more
easily formed than the hexatungstate which then disproportionates.

- 75 -
Table 4.6
Sample Expt. O2 Temperature % of uptake/mmoles/ max;ma/K theoretical mole sample
0.05KW 11. 5 1000 92
O. 2K~~ 55 1000 110
0.3KW 78 968 104
0.6KW 133 760,855,995 88.7
0.8KW 230 690(s),820,900 115
(s) = shoulder
4.3.3.2 Oxidation of Sodium Tungsten Bronzes
The tpo profiles for the sodium tungsten bronzes are shown
in Figure 4.27. Table 4.7 gives the oxygen consumption and the
percentage which this is, of the theoretical assuming that the final
products of oxidation are sodium tungstate and tungsten trioxide.
XRD of the oxidised products showed only the presence of Na2W04 and
W03. The peak maximum temperatures observed in the oxidation of the
sodium tungsten bronzes are also recorded. The tpo profiles show a
different pattern to those observed for the corresponding potassium
tungsten bronzes with the peak maximum occurring at lower temperature.
especially for bronzes with low sodium ion concentration. Sample
0.05NaW consumes oxygen in the temperature range of 560K - 800K in a
single step with a maximum at 680K. The oxidation of sample 0.2NaW
starts at 760K and shows two overlapping processes with maxima at 778K
and 937K. The tpo profile of sample 0.3NaW shows oxidation to begin
at 6l0K with. one distinct maximum at 834K followed by a small shoulder • I '
at 943K. The profiles of samples 0.6NaW and 0.8NaW show oxidation to
be a multistep process which in the case of sample 0.8NaW occurs in the
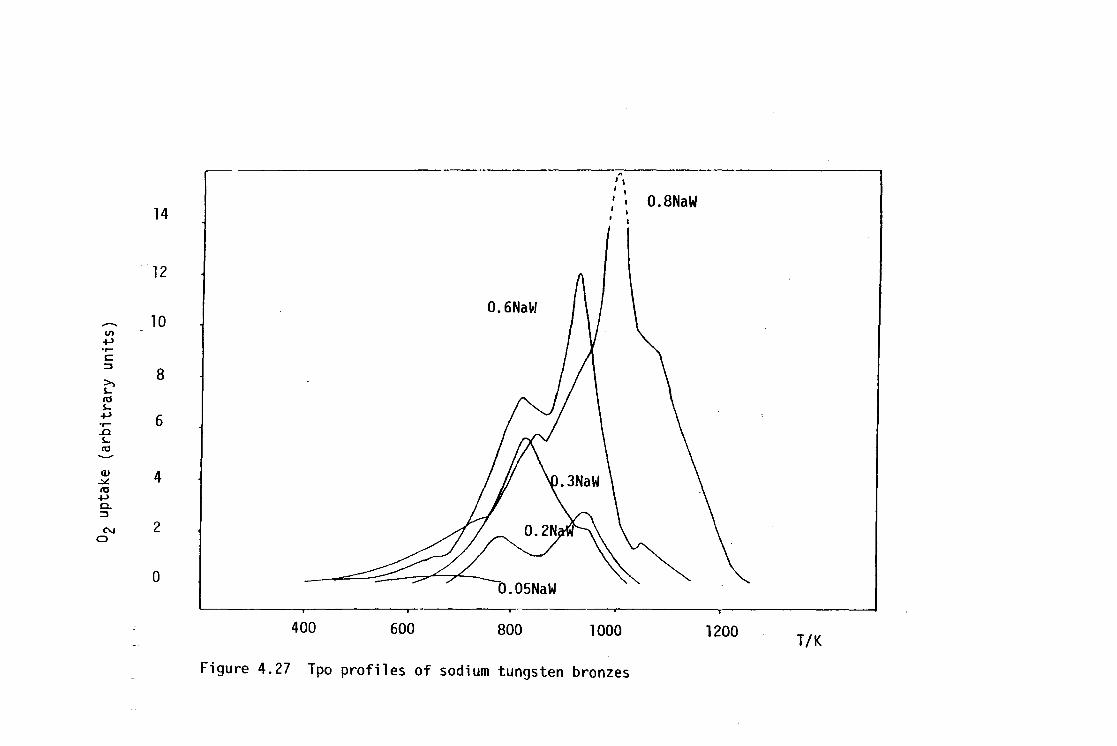
14
~ , , , , O.8NaW

- 76 -
temperature range of 6l0K - l260K. The O2 consumed in the oxidation
of the sodium tungsten bronzes agree well with the theoretical, although
as mentioned previously, a poly tungstate may be first formed which then
disproportionates. The sodium tungsten bronzes with low alkali ion
content are easier to oxidise than the corresponding potassium bronzes.
The sodium bronzes with low alkali ion content have been shown to
contain tetragonal phases; and like the potassium bronzes with similar
phases (those with high alkali ion content) oxidise more readily to the
tetratungstate which then disproportionates. The sodium bronzes with
high alkali ion content contain mainly the cubic phase and this, similar
to the hexagonal phase of the potassium bronzes is more difficult to
oxidise.
Table 4.7
Sample Expt. 0 Temperature % of uPtake/~moles/ maximum/K theoretical mole sample
O.OSNaW 12.4 680 99.2
0.2NaW S7 778,937 114
0.3NaW 64.S 834,943(5) 86
0.6NaW 128 6S0,828, 85.3 930,10SO
0.8NaW 230 72S(s) ,841 11S 1002,1075(s)
(s) = shoulder
4.4 Conclusions
The reduction of the potassium and sodium tungsten bronzes
appears to occur in one or more steps depending upon the' concentration
of the alkali metal ion content. But in all cases the final products

- 77 -
of reduction upon heating the samples to l323K in hydrogen seems to be
the alkali metal tungstate and tungsten metal. The reduction occurs
according to the following stoichiometric equation:
where M = K or Na.
A theoretical consideration of this equation would require both the
hydrogen consumption and the weight. loss to decrease with increasing
alkali metal ion content in the bronze. This agrees with the
observatio'ns made in the present study indicating formation of a
separate tungstate phase. ,Reduction of W0 3 occurs in two steps.
Various mentions have been made in literature(l) of the reduction of
W03, first to an intermediate oxide and then finally to tungsten metal.
It appears that a similar mechanism of reduction occurs on the present
sample although it was not possible to distinguish the sub-oxide formed.
Reduction of the bronzes could be occurring through more than one step
as mentioned in,literature(l)', but the limitations of the present
techniques or possibly the high heating rate used did not allow the
resolution of the different processes, although in some cases more than
one step was observed.
The products of oxidation of the alkali metal tungsten bronzes
are the alkali metal tungstate and W03. There is indication that the
bronzes first oxidise to a poly tungstate and a sub-oxide of tungsten
before complete oxidation. Bronzes with a tetragonal structure oxidise
more easily than those with either an hexagonal or cubic structure,
most probably because the tetratungstate is formed more readily.
From the oxygen consumption ,there was no indication that the bronzes !' I 1 ,~ .! '
prepared by the present method were oxygen deficient, although a recent
study(4) on tungsten bronzes prepared under vacuum have shown such
characteristics.

- 78 -
CHAPTER 4
REFERENCES
1. P.G. Dickens and M.S. Whittingham, Proc. 7th Intern. Sym. on the
React. of Solids, 640, (1972).
2. A. Deschanures, G. Desgardin, B. Raveau and J.C. Thomazeau, Bull.
Soc. Chim. Fr., 4537, (1976).
3. A. Hussain, L. Kih1borg and A. K1ug, J. Solid State Chern., 25,
189 (1978).
4. S.A. Lawrence, S. Stevenson, K. Mavadia and P.A. Sermon, Proc. R.
Soc., A411, 95, (1987).

- 79 -
CHAPTER 5
X-RAY DIFFRACTION STUDIES
5.1 Introduction
X-ray diffraction allows study of the structure of matter and
as such it provides complementary information to optical and electron
microscopy. All the information is extracted by the use of mono
chromatic radiation and a relatively complex mathematical analysis.
If single crystals are examined by this technique it is possible, by
direct interpretation of the diffractogram, to obtain information on
crystal planes and lattice spacing.
X-rays are a form of electromagnetic radiation differing from
light waves (A = 400 to 800nm) in that they have a shorter wavelength
(A = O.lnm). These rays are produced when a metal target is bombarded
with fast electrons in a vacuum tube. The radiation emitted can be
separated into two components, a continuous spectrum which is spread
. over a wide range of wavelengths and a superimposed line spectrum
characteristic of the metal being bombarded. (Figure 5.l(a)). The
energy of the white radiation, as the continuous spectrum is called,
increases as the atomic number of the target and as the square of the
applied voltage, while the characteristic radiation is excited only
when a critical voltage is exceeded. The white radiation results
from the deceleration of the incoming high energy electrons by the
strong electric field provided by the electrons surrounding the nucleus
of an atom. The decrease in energy 6E of these incoming electrons is
given by hv. Concurrent deceleration appears as continuous radiation
over a wide range of wavelength.! . Characteristic spectra are produced
when incident electrons have sufficient energy to dislodge an electron

- 80 -
from one of the inner electron shells. If an electron from a higher
energy shell then decays to the lower shell, the energy released is
in the form of an X-ray. The difference in energy between two given
shells determines the emitted wavelength and although an increase in
electron acceleration voltage increases the intensity of character
istic radiation, it does not alter its wavelength.
If an electron is ejected from the K shell and the vacancy is
filled by an L shell electron, the transition is termed K~ and if the
vacancy is filled by an M shell electron, the transition is termed KS'
The characteristic X-ray produced by elements with low atomic numbers
are very easily absorbed by matter and are therefore of little use in
crystallography, whilst X-rays from target elements of high atomic
number are the most useful for X-ray diffraction. The most often
used target metals include copper, molybdenum and cobalt.
The characteristic radiation for copper shown in Figure S.l(a)
consists of X-rays arising from the Ks' K~l and K~2 transitions.
The respective wavelengths of these transitions are O.139nm, O.lS40Snm
and O.15445nm. Due to the similarity in wavelength of the K~l and
K 2 transitions, the wavelength usually quoted for CuK (weighted for a a
relative intensities) is O.154l8nm. The presence of the Ks radiation
makes interpretation confusing, therefore, a metal foil filter is
employed. Superimposed on Figure S.l(a) is the absorption spectrum
of nickel. It will be noted that the absorption spectrum, unlike
emission spectra for X-rays, consists not of a series of lines but of
one or more absorption edges. Thus for nickel the absorption edge
lies between CUKs and Ka emissions. By calculating the thickness of
nickel foil required to absorb most of the Ks emission without sign
ificantly affecting the K~ emission, a spectrum of the type shown in

- 81 -
Figure 5.1(b) will be obtained. In this way, it is possible to produce
almost monochromatic X-rays which are suitable for X-ray diffraction
purposes.
5.2 Theory
The basic theory of X-ray diffraction was originally deduced by
W.L. Bragg. Consider Figure 5.2, which shows a series of parallel
planes of atoms separated by a uniform distance d. A beam of X-rays
incident at an angle e to the atomic planes will be partially reflected
by the outermost atoms at point A to paint P such that the angle of
incidence will equal the angle of reflection, (i.e. a total of 2e).
The remainder of the X-rays will penetrate the lattice, most being
absorbed by lower planes of atoms. The angle of reflection for the
lower planes of atoms will also be 9. Therefore, all X-rays reflect
ed by a particular plane of atoms will be in phase, but only under
strict angular conditions will X-rays reflected from a series of planes
be in phase with each other and cause constructive interference.
The condition for in phase reflection is that the path length differ
ence must be an integral number of wavelengths (nA) between waves
reflected from successive planes.
Bragg deduced that,
nA = 2dsin6 ................... 5.1
where the critical angular values of 9 for which the law is satisfied
are known as Bragg angles. The directions of the reflected beams
are determined entirely by the geometry of the lattice which in turn
is governed by the orientation and spacing of the crystal planes.

Relative Intensity
Fig 5.1(a)
Cu without filter
Ni absorption edge
-0.04 0.08 0.12
wavelength(nm)
o
-, ti~ -
XRD THEORY
K~ 1
Relative Ka... Intensity
2
O. 16 0.04
Fig. 5.l(b)
Cu with filter
. 0.08 0.12 0.16
wavelength (nm)
• • • • • • • • • • • • • • Figure 5.2
Family of 342 planes
Figure 5.3(a} I,
x
z
R
Q ~~~~----------y
Figure 5.3(b}

- 83 -
5.3 Crystal Planes and Lattice Spacing
The crystalline state is a special form of solid where regular
repeating units (known as the unit cell) are present. By repeated
translations of the unit ceJl in three dimensions the overall crystal
lattice is found. The shape and size of a unit cell is normally
defined by lengths a, band c, and the angles between these vectors
given by a, Band y (the angles between band c, c and a, and a and b
respectively). A regular three-dimensional array of atoms, which
defines the crystalline structure can be considered as a series of
parallel equivalent planes which are more or less densely populated
with these atoms. In 1839, W.H. Miller proposed a system of indices
to define numertcal1y any series of planes. Consider Figure 5.3(a),
the set of planes illustrated intercepting the x, y and z axis may be
defined by the integral number of intercepts, given by h, k and 1 on
the unit cell edges, a, band c. If the intercept is length a
(or b or c), then the value of h (or k or 1) will be 1. If the inter
cept is one half of the unit cell edge, then the corresponding index
will be 2. Thus the values of h, k and 1 can be used to define any
family of planes. Figure 5.3(a) shows a family of 342 planes. For
any lattice it is possible to find a set of axes on which the number of
intercepts (h, k and 1) are small whole numbers, although in some
planes the intercepts are negative and are quoted by a.bar over the
particular index, (e.g. h,k,l). Planes parallel to an axis are
denoted by a zero (e.g. h,k,O).
Consider Figure 5.3(b) which shows the first 342 plane such
that the length d is given by the normal from the origin ° to point
X on the plane which passes through points P, Q and R. The line. so , ! I
constructed can be seen to be perpendicular to the PQR plane and since

- 84 -
the origin lies in the adjacent (hkl) plane, the distance is equal to
the separation between the individual members of the whole family of
planes. The lines OPt OQ and OR have lengths given respectively by
a/h , b/k , and c/l, and desc~ibe the angles a, Sand y respectively,
with the line OX corresponding to distance d.
Therefore, cos a = -; dh cos S = dk -; cos y = -; dl a b c
But for directional cosines
Therefore,
d2h2 + d2k2
+ d212 = 1
a2 7 7 or,
1 h2 + k2
+ 12
d2 = a2 b2 ~
. . . . . . . . . . . . . . . . . . .. 5. 2
Combination of equation 5.2 with the Bragg equation 5.1 gives:
+ + 5.3
, , , , ,
Equation 5.3 can be considered to re1ate to an orthorhombic struc~ure "
in which the three unit lengths are different but distributed along
three mutually perpendicular axes. For a cubic cell in which the
unit cell dimensions are all equal and taken as the value a, the
equation simplifies to:
...... ~ .......... : ... : 5.4

- 85 -
5.4 Apparatus and Procedure
In the present study X-ray diffractometric analysis was
performed on W powder; W03, K2W04, Na 2W04, the potassium tungsten
bronzes and the sodium tungsten bronzes.
A Philips PW 1729 X-ray generator with a copper target was
used. It was operated at 50 kV and 24 rnA and the X-ray beam passed
through a nickel filter to give the CuKal radiation. In the diffract-
ometer, a divergent beam of X-rays converges after reflection from the
specimen, passes through a narrow slit and enters the detector which
is a countertube with electrical circuitry. The detector is driven
at twice the speed of the specimen so that the specimen surface is
always at e when the detector i's at 29. Parallel slits are used
normal to the focusing planes to obtain sharp lines. The intensity
diffracted at the various angles is automatically recorded on a chart
as a function of the reflection angles 29. The detector was scanned
at 0.50 of 29 per minute and the recorder chart speed was Smm min- l
so that 1cm on the chart was equivalent to 10 of 29.
5.5 Results
5.5.1 X-Ray Diffractometer Studies
The parameter measured from the diffractogram was the Bragg
angle 29. The measurement of the Bragg diffraction angles enable the
interp1anar spacings, d, to be calculated since
nX = 2dhk1 Sin Q ................... 5.1
where x is the incident X-ray wavelength~d the interplanar spacing
for any family of crystal planes (hkl), and e the Bragg diffraction
angie.
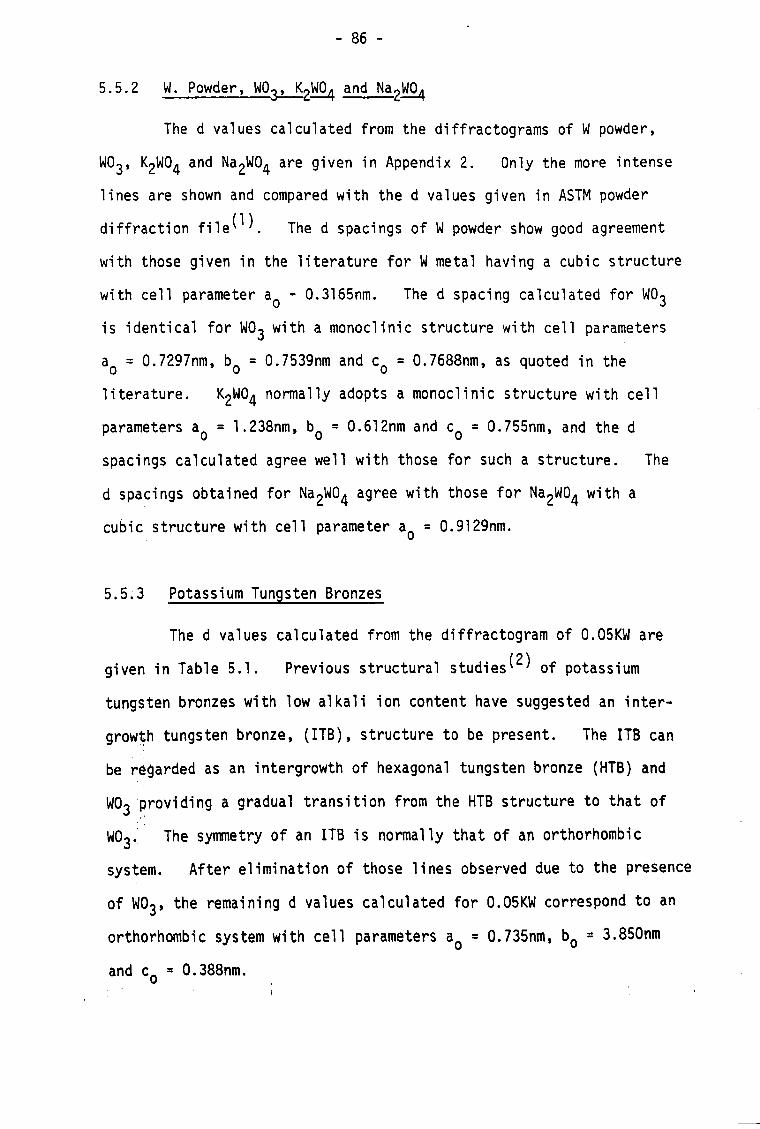
- 86 -
5.5.2 W. Powder, WO~2WO~ and Na2WO~
The d values calculated from the diffractograms of W powder,
W0 3, K2W04 and Na 2W04 are given in Appendix 2. Only the more intense
lines are shown and compared with the d values given in ASTM powder
diffraction file(l). The d spacings of W powder show good agreement
with those given in the literature for W metal having a cubic structure
with cell parameter ao - 0.3165nm. The d spacing calculated for W0 3 is identical for W03 with a monoclinic structure with cell parameters
ao = O.7297nm, bo = O.7539nm and Co = O.7688nm, as quoted in the
literature. K2W04 normally adopts a monoclinic structure with cell
parameters ao = 1.238nm, bo = O.612nm and Co = 0.755nm, and the d
spacings calculated agree well with those for such a structure. The
d spacings obtained for Na2W04 agree with those for Na2W04 with a
cubic structure with cell parameter ao = 0.9l29nm.
5.5.3 Potassium Tungsten Bronzes
The d values calculated from the diffractogram of 0.05KW are
given in Table 5.1. Previous structural studies(2) of potassium
tungsten bronzes with low alkali ion content have suggested an inter
grow~h tungsten bronze, (ITB), structure to be present. The ITB can
be r~9arded as an intergrowth of hexagonal tungsten bronze (HTB) and
W03~roviding a gradual transition from the HTB structure to that of
W03. The symmetry of an ITB is normally that of an orthorhombic
system. After elimination of those lines observed due to the presence
of W03, the remaining d values calculated for O.05KW correspond to an
orthorhombic system with cell parameters ao = O.735nm, bo = 3.850nm
and Co = O.388nm.

- 87 -
Table 5.1
X-ray Diffraction of 0.05KW
I I
9 Sin9 d/nm
6.765 0.117 0.654
11. 390 0.197 0.390
11. 665 0.202 0.381
12.019 0.208 0.370
13.009 0.225 0.342
13.815 0.238 0.322
14.217 0.245 0.314
16.487 0.284 0.271
16.624 0.286 0.269
16.929 0.291 0.264
17.429 0.299 0.257
17.677 0.303 0.254
18.329 0.314 0.245
20.664 0.353 0.218
24.774 0.419 0.184
27.592 0.463 0.166
I
The values of 9 obtained from the diffractograms of samples
0.2KW and 0.3KW were used to determine the unit cells, calculate the
lattice parameters and to index the lines. Structural studies of
potassium tungsten bronzeswhere 0.19 ~ x ~ 0.33(2,3) have suggested
the unit cell to be hexagonal. On this basis the lines obtained for
0.2KW and 0.3KW were indexed employing the method for an hexagonal
system detailed below for sample O.3KW.

- 88 -
For an hexagonal system, equation 5.3 may be written as;
sin2g = A(h2 + hk + k2} + C1 2 5.5
where A ,,2
= 3a2 5.6
and C 1.2
= 4c2 . . . . . . . . . . . . . . . .. 5.7
For the hkO spectra;
· 2g S1 n 100 = A · 29 S1n 210 = 7A
· 29 S1n 110 = 3A · 29 ,S1n ,300 = 9A
· 29 S1n 200 = 4A · 29 S1n 220 = l2A
The ratio 3 occurs frequently, and is representative of the hexagonal
system, occurring in other systems only by chance. If the ratio of
the sin2g values of two of the first three or four lines is 3, then
the first one is probably the 100 line and the other the 110 line.
Once the value of A has been found, the other lines can be indexed and
the value of C can be determined. The lattice parameters can then
be calculated from the values of A and C using equations 5.6 and 5.7.
Table 5.2 shows the line spacings and the sin29 values for the most
intense lines of sample 0.3KW. Initially it is necessary to ,look for
the significant ratio of 3 between two sin2e values. The rat'io of
the third sin2a,va1ue to the first in Table 5.2 is 3.007, hence it may
be assumed that the first line corresponds to the 100 reflection and
the third line, the 110 reflection. The term A which is equal to sin2g
when h,k and 1 correspond to the 100 plane has a value of 0.0144. If
the 1 index of an hkl line is not zero, then the sin2g value of that
line must contain a term Cl 2 in accordance with equation 5.5. To I 'I' ; : 'I
facilitate the search for the factor C, the characteristic multiples
of A are subtracted from the sin2g values as shown in Table 5.2. It

- 89 -
can be seen that the term 0.0105 is common to the second line in the
sin28 column, to the fourth in the sin2e-A column and to the sixth in
the sin2e-3A column and therefore corresponds to the value of C when 1
;s equal to one.
These values of A(0.0144) and C(0.0105) were then used to index
the lines by assuming different values of h, k and using equation 5.5.
These values are shown in Table 5.2. The lattice parameters ao and Co
for the hexagonal structure were calculated from the values of A and C
using equations 5.6 and 5.7 respectively. The values of ao = 0.741nm
and Co = 0.751 for sample 0.3KW obtained from these relationships agree
well with those quoted in literature(3).
The values of e obtained for sample 0.2KW were used to index
the lines and calculate the lattice parameters ao and Co using the same
Table 5.2
X-ray Diffraction of 0.3KW
8 Sin2S Sin2S-A Sin2S-3A d/nm hkl
6.895 0.0144 - - 0.641 100
11.760 0.0415 0.0271 - 0.378 002
12.004 0.0433 0.0289 0.0001 0.370 110
13.405 0.0537 0.0393 0.0105 0.332 111
13.725 0.0563 0.0419 0.0131 0.325 102
13.925 0.0579 0.0435 0.0147 0.320 200
16.964 0.0851 0.0707 0.0419 0.264 112
18.412 0.0998 0.0854 0.0566 0.244 202
19.537 0.1118 0.0974 0.0686 0.230 211
25.724 0.1884 0.1740 0.1452 0.177 310
26.477 0.1988 0.1844 0.1556 0.173 311
27.677 0.2157 0.2013 0.1725 0.166 220

- 90 -
method described previously for an hexagonal system. These values
together with the d values are given in Table 5.3. Sample 0.2KW
corresponds to an hexagonal bronze with cell parameters ao = 0.738nm
and Co = 0.751nm, which agree well with those in the literture(2).
Table 5.3
X-ray Diffraction of 0.2KW
9 Sine d/nm hkl
6.907 0.120 0.640 100
11. e32 0.205 0.376 002
12.042 0.208 0.369 110
13.429 0.232 0.332 111
13.757 0.237 0.324 102
13.917 0.240 0.320 200
17.010 0.292 0.263 112
18.442 0.316 0.243 202
19.557 0.335 0.230 211
24.247 0.411 0.188 004
24.640 0.417 0.185 202
28.412 0.476 0.162 222
28.772
I 0.481 0.160 400
The 9 values obtained from the diffractogram of sample 0.6KW
are given in Table 5.4. Structural studies(4) on potassium bronzes
with higher alkali ion content have suggested the unit cell to be
tetragonal, on this basis the relationships detailed below for a I ,I ~ , I I •
tetragonal system were used to index the lines and calculate the
lattice parameters for sample 0.6KW.

- 91 -
For a tetragonal system, equation 5.3 may be written as:
................. 5.8
where
A 1.2
= - ................. 5.9 4a2
and C = 1.2
. . . . . . . . . . . . . . . .. 5. 10
4c2
For the hkO spectra,
Sin2elOO = A Sin29200 = 4A
Si n2e" 0 = 2A Sin2e220 = 8A
The ratio 2 occurs frequently and except by chance, the only other
system in which this ratio is found is the cubic one. If the ratio
of the sin2e values of two low-angle lines are in the ratio of 2, it
is probable that the substance is tetragonal and that the two lines
are the 100 and 110 or 110 and 200 planes. Once the quantity A has
been found, the other lines can be indexed and the value of C can be
determined. The lattice parameters can then be calculated from the
values of A and C using equations 5.9 and 5.10. Table 5.4 shows
the line spacings and the sin2e values for the most intense lines of
sample 0.6KW. It can be seen that the ratio of the second sin2a value to the first in Table 5.4 is 2.00, hence the first and second
lines correspond to the 100 and 110 planes respectively. The term
A which is equal to sin2a when h, k and 1 correspond to the 100 plane
has a value of 0.005. If the 1 index of an hkl line is not zero,
then the sin2a value of that line must,'contain a term C1 2 in accord
ance with equation 5.8. To find the constant C, characteristic
multiples of A must be subtracted from the sin2a values as shown in

- 92 -
Table 5.4. It can be seen that the term 0.0403 ± 0.0003 is common to
the fifth line in the sin29 column, the fifth line in the sin2e-A column,
and the fifth line in the sin2e-2A column, and corresponds to the value
of C when 1 is equal to one. The values of A(0.0050)and C(O.0403) were
then used to index the lines by using different values of h, k and 1
using equation 5.8. These values are given in Table 5.4. The lattice
parameters ao and Co were calculated from the values of A and C using
Table 5.4
X-ray Diffraction of 0.6KW
I
9 Sin29 Sin2e-A Sin2S-2A d/nm hkl
4.055 0.0050 - - 1.089 100
5.750 0.0100 0.0050 - 0.770 110
8.150 0.0201 0.0151 0.0051 0.542 200
11. 399 0.0391 0.0340 0.0241 0.389 220
11. 542 0.0400 0.0350 0.0250 0.385 001
12.330 0.0456 0.0406 0.0356 0.360 101
12.947 0.0502 0.0452 0.0402 0.344 111
14.492 0.0626 0.0576 0.0476 0.308 320
14.954 0.0665 0.0615 0.0515 0.298 211
16.347 0.0792 0.0742 0.0642 0.274 221
18.454 0.1002 0.0952 0.0902 0.244 420
20.321 0.1206 0.1156 0.1106 0.222 401
23.662 0.1611 0.1561 O. 1461 0.192 002
25.585 0.1865 0.1815 0.1765 0.178 202
26.522 0.1994 0.1944 0.1894 0.173 441
26.657 0.2013 0.1963 0.1863 0.172 222 , , : .

- 93 -
equations 5.9 and 5.10 respectively. For the tetragonal bronze O.6KW.
ao = 1.089nm and Co = 0.384nm which agree well with those quoted in
literature for potassium tungsten bronzes having a tetragonal struct
ure(4).
The diffractogram obtained for sample 0.8K~! was much more
complex than those obtained for the other potassium bronze samples
and proved too complicated to interpret fully. The d values for the
most intense lines obtained on sample 0.8KW are given in Table 5.5.
Table 5.5
X-ray Diffractogram of 0.8KW
9 SinS d/nm
2.949 0.051 1.496
4.304 0.075 1.026
6.394 0.111 0.691 -
6.529 O. 1 3 0.677
7.989 0.139 0.554
9.002 0.156 0.492
9.134 0.159 0.485
9.534 0.165 0.465
9.937 0.172 0.446
10.229 0.177 0.434
11. 352 0.197 0.391
12.552 0.217 0.355
14.059 0.243 0.317
18.637 0.319 0.204
21.302 0.363 0.212
21.602 0.368 0.209
23.472 0.398 0.193
24.052 0.407 0.189

- 94 -
5.5.4 Sodium Tungsten Bronzes
The e values obtained for samples O.05NaW, O.2NaW, and O.3NaW
are given in Tables 5.6, 5.7 and 5.8 respectively. These sodium
bronzes appear to be tetragonal bronzes. The method of calculating the .
lattice parameters and indexing the most intense lines obtained for
these samples was that employed for the potassium bronze sample O.6KW,
and is given in detail in sub-section 3.5.3. Sample O.05NaW has
lattice parameters ao = O.524nm and Co = 0.388nm, which agree well with
those found in the literature(5) the d values for this sample together
with the line indices are given in Table 5.6. The values of e obtain-
ed from the diffractograms of samples O.2NaW and O.3NaW were used to
calculate the lattice parameters and index the most intense lines, these
values are given in Tables 5.7 and 5.B. Sample O.2NaW is a tetragonal
bronze with lattice parameters ao = 1.21Snm and Co = 0.377nm. Sample
0.3NaW also corresponds to a tetragonal bronze with lattice parameters
ao = 1.209nm and Co = 0.375nm. In both cases the calculated cell
parameters agree well with those found in literature(6).
The sodium bronzes with higher alkali ion content, x ~ 0.6,
gave relatively uncomplicated diffractograms. Upon inspection of the
spectra obtained for samples a.6NaW and a.8NaW, a regular pattern was
observed, suggesting the presence of cubic phases for these bronzes.
The d values obtained for sample a.6NaW are detailed in Table 5.9.
For the cubic system;
where
. 2~ Sln ~hk'
A
=
=
. . . . . . . . . . • . . . . . .. 5.4
. . . . . . . . . . . . . . . . .. 5. 11
The characteristic of this system is that the values of sin29 have
a common factor. The values of sin29 for sample 0.6NaW are given

Table 5.6
X-ray Diffractogram of 0.05NaW
Q Sing d/nm hkl
11. 563 0.200 0.384 0.01
11.833 0.205 0.376 110
14.365 0.248 0.310 101
16.675 0.287 0.268 111 - -
17.105 0.294 0.262 200
18.348 0.315 0.245 210
20.808 0.355 0.217 201
23-.593 0.400 0.192 002
25.221 0.426 0.181 102
26.719 0.449 0.171 112
27.939 0.468 0.164 310
30.537 0.508 0.152 311
38.283 0.619 0.124 401 -
i,
Table 5.7
X-ray Diffractogram of 0.2NaW
() Sine d/nm
8.181 0.142 0.541
11. 328 0.196 0.392
11.602 0.201 0.383
11.882 0.206 0.374
14.157 0.244 0.315
16.558 0.285 0.270
20.470. 0.349 0.220
20.607 0.352 . 0.219
23.802 0.403 0.191
24.382 0.413 0.186
24.855 0.420 0.183
26.817 0.451 0.171
27.232 0.457 0.168
27.592 0.463 0.166
hk1
210
300
310
001
211
311
421
440
002
102
112
302
312
322
'-0 U1

- 96 -
Table 5.8
X-ray Oiffractogram of 0.3NaW
8 Sin8 d/nm hkl
8. 143 0.142 0.544 210
11. 642 0.202 0.382 310
12.562 0.217 0.354 101
13.272 0.229 0.335 112
15.244 0.263 0.293 410
16.597 0.286 0.269 311
20.507 0.350 0.220 421
23.852 0.404 0.190 002
25.317 0.427 0.180 202
26.892 0.452 0.170 312
29.654 0.495 0.156 332
in Table 5.9 and it can be seen that the first two lines have a
common factor of about 0.0404 and dividing the first seven lines
obtained by 0.0404, values of around 1, 2, 3, 4, 5, 6 and 8 are
obtained, being characteristic values for a primitive cubic lattice.
Sample 0.6NaW corresponds to a cubic bronze with lattice parameter
ao = 0.383nm, calculated from equation 5.11 with A = 0.0404, and is
in good agreement with literature values of cubic sodium bronzes(7).
The 9 and d values together with the line indices obtained
for sample 0.8NaW are given in Table 5.10. Similar to sample 0.6NaW,
it was found that sample 0.8NaW is a primitive cubic bronze with cell
parameter ao = 0.385n~, which agrees well with those mentioned in ,. i ' I
literature for sodium bronzes with high alkali ion content.

9 SinG
11 .595 0.201
16.504 0.284
20.300 0.347
23.639 0.401
26.639 0.448
29.432 0.491
34.584 0.568
37.013 0.602
39.406 0.635
41. 745 0.666
44.059 0.695
46.377 0.724
48.712 0.751
- 97 -
Table 5.9
X-ray Diffractogram of 0.6NaW
Sin2g d/nm
0.0404 0.386
0.0807 0.272
0.1203 0.222
0.1607 0.192
0.2010 0.172
0.2414 0.157
0.3221 0.135
0.3624 0.128
0.4030 0.121
0.4433 0.116
0.4836 0.111
0.5240 0.106
0.5646 0.103
hkl
100
110
111
200
210
211
220
221
310
311
222
320
321
It can be concluded that both the potassium and sodium bronzes
may be regarded as mainly homogeneous bronzes with the exception of
sample 0.05KW which showed the presence of W03 phases.
I: "

- 98 -
Table 5.10
X-ray Diffractogram of a.8NaW
e SinS d/nm hkl
11 .539 0.200 0.385 100
16.423 0.283 0.272 110
20.272 0.346 0.222 111
23.580 0.400 0.193 200
26.555 0.447 0.172 210
29.405 0.491 0.157 211
34.525 0.567 0.136 220
36.969 0.601 0.128 221
39.349 0.634 0.121 310
41.549 0.663 0.116 311

- 99 -
CHAPTER 5
REFERENCES
1. ASTM, Standard American Society for Testing Materials.
2. P.G. Dickens, Solid State Chemistry, I, 211.
3. P.E. Werner, P. Kierkegaard and A. Magneli, Acta. Chem. Scand.,
~, 427, (1961).
4. A. Magne1i, Arkiv. Kemi., l, 213, 269, (1949).
5. J.M. Reau, C. Fouassier, G. Le F1em, J.Y. Barraud, J.P. Doumerc
and P. Hagenmu11er, Rev. Chim. Miner., I, 975, (1970).
6. F. Takusagawa and R.A. Jacobson, J. Solid State Chem., ~, 163,
(1976).
7. B.W. Brown and E. Banks, J. Am. Chem. Soc., 76, 963, (1954).

- 100 -
CHAPTER 6
X-RAY PHOTOELECTRON SPECTROSCOPY
6.1 Introduction
X-ray photoelectron spectroscopy (XPS), also known as Electron
Spectroscopy for Chemical Analysis (ESCA), has the ability to monitor
the chemistry occurring on the outermost layers of a solid or catalyst,
and irrespective of the elements from which the catalyst is prepared
(with the exception of hydrogen and helium), to detect changes of
relative concentration of surface atoms.
Since the 1970s, X-ray photoelectron spectroscopy has been widely
used in chemical research. The method is based on the photo-electric
effect. Bearing in mind that the physical principles of XPS and the
problems concerned with the interpretation of the spectra have been
reviewed(1-7), consideration will be confined to the basic concepts.
The principles are simple. A sample is bombarded with mono
energetic X-ray photons, normally Al Ka (1486.6eV) or Mg Ka (1253.6eV),
which eject electrons from core and valence shells in which the ion-
isation potential, or binding energy, is less than the primary photon
energy. The kinetic energy of the ejected electron is measured and
is related to the binding energy by the relation:
. . . . . . . . . . . . . . . . .. 6. 1
where hv is the energy of the photon, EBE is the binding energy of the
electrons with respect to the· Fermi level, and ~s is the spectrometer
work function. Samples of ~aterial which are poor conductors of
electricity acquire a positive charge during their examination, and

- 101 -
this leads to the ejected electron having lower kinetic energy than
it should, leading to too high a binding energy. This phenomenon is
called "charging effect"(l ,8-10). The incorporation of ~s' the work
function, in equation 6.1 allows for the "charging effect" to be
assessed since it is a measure of the voltage between the spectrometer
and the sample. Its value should be a constant, thus any variation
could mean a change in the l e1ectronic" state of the sample. In the
case of non-conductive samples, any change in the work function will
probably mean that the sample is being charged.
Although the X-ray photons can penetrate deeply into the sample,
the electrons which escape without energy loss come from the outermost
surface layers, (i.e. from within 2nm of the surface), since low energy
electrons have short, mean free paths. Further, it is only those
electrons ejected which do not lose energy by inelastic scattering on
thei~ passage to the surface which will appear in the kinetic energy
spectrum at their original characteristic positions. The rest con
tribute to the discrete and continuum background at lower kinetic
energy.
The energies of the core electrons of a particular atom are
sufficiently invariant to provide a finger-print of the atom. When
a photon extracts an electron from a core sub-shell, a nholen is
produced, and this stage normally decays by one or two mechanisms;
X-ray fluorescence or an Auger process. These processes are presented
schematically below(7)

- 102 -
x-ray fluorescence C 11. C 1l B i - - - -- - --. hv
B II A '11 A II
'" '" Auger
'- process
" "
C i
B L A 11
/ e
Auger electron
In both cases the vacancy in sub-shell A is filled by an electron
from sub-shell B. The energy t.E released mq,y appear as a photon which
usually belongs to the X-ray region. This is X-ray fluorescence.
Alternatively, the excess energy may be dissipated by ionisation of an
outer electron (from sub-shell C). This non-radiative mode of decay
is the Auger Process, the secondary electron emitted being the Auger
electron; the net result is a double ionisation.
The two relaxation processes (fluorescence and Auger) are competi
tive and their relative rates depend upon the atomic number of the
element involved. High atomic numbers favour fluorescence, while
Auger emission predominates with atoms of very low atomic numbers.
Most of the chemical information available from XPS is from the
chemical shift data. There is a wealth of data now existing on the
use of chemical shifts in XPS to investigate bonding both in the solid
and gas phase(ll,12).

- 103 -
6.2 Experimental Procedure
The XPS measurements were made on a Kratos ES300 spectrophotometer
provided with a dual anode X-ray gun; either Mg Ka or A1 Ka radiation
may be used as the exciting radiation. The latter was used in the
present work. The samples were placed on the sample probe by means of
a double-sided adhesive tape and distributed over it as a very fine
layer. The X-ray supply was run at 14kV and lOrnA. The source slit
and the collector slit were left unchanged during all the runs. With
the sample holder in the spectrometer, the system was evacuated and when
the vacuum was ,sufficiently low,1.33~Pa, a broad scan of the electron
energy spectrum on irradiation was taken. It was then followed by
scans of each element of interest over a narrow eV range. The kinetic
energy of the electron emitted from tbe sample was measured in the'
e1ectro~ ~~~rgy anaiyser and an electron multiplier was employed to
count the electrons.
6.3 Results
6.3.1 Calculation of Oxidation States
From the electron spectrum, the binding energy of the carbon is
state has been noted. This element is always present on the surface
of a sample unless extremely careful precautions are taken, or unless
the sample has been pretreated, (e.g. by argon ion etching). This
, peak has been used to correct for charging in the sample during irr
adiation which displaces peaks from their true positions. Elemental
carbon should give rise to a cts peak at 284.8eV but because of
charging this peak may be found to vary in position. The magnitude of
separation of the observed Cis peak from~'its true binding energy
enabled a charging correction to be made to all other XPS peaks in the
spectrum. The difference between the corrected binding energies and

- 104 -
the true elemental position of the peak, (as given in the table of X-ray
adsorption data (2)), is an indication of the oxidation state of that
particular element.
6.3.2 Experimental Results
X-ray photoelectron spectra of the elements detected on the sur
face of the different samples, (including W powder; W03; K2W04; Na 2W0 4;
O.OSKW; O.2KW; 0.3KW; O.6KW; O.8KW; O.OSNaW; 0.2NaW; 0.3NaW; 0.6NaW and
O.8NaW), are shown in Figures 6.1 to 6.14. Appendix 3 gives the
observed and corrected binding energies in eV for the element of interest
such as W, K, Na and 0 found on the surface of the different samples
found by ESCA.
For the case of tungsten the spectrum of the 4f electrons were
studied in all samples. The spectra of the W4f electrons in W, W03,
K2W04 and Na 2W04 are shown in Figure 6.15. For a single type of
tungsten atom or ion there is a doublet, (with a separation of approx
imately 2eV), due to spin orbit-coupling(13)). The magnitude of the
splitting and the relative line intensity is the same for both tungsten
powder and W03. If only the W4f7/2 line is considered a binding
energy of 33.6eV was obtained for tungsten powder whereas for W03 a
binding energy of 36.0eV was obtained. The chemical shift between W03
and W powder is thus 2.4eV but it must be noted that tungsten powder
necessarily contains certain adsorbed oxygen species on its surface as
shown in the spectrum, thus giving a slightly higher binding e~ergy than
the quoted value, (3l.0eV (2)), for the zero-valent state. The measured
binding energy for the 4f7/2 lines of K2W04 (36.SeV) and Na2W04 (36.5eV)
is close to the value obtained for W03 (36.0eV) indicating that tungsten

\~4d
C1 s 01s
300 600 900 1200 1500 Figure 6.1 XPS of W powder Kinetic energy (eV)
!4f 01s C1s
\lJ4d
300 600 900 1200 1500 Figure 6.2 XPS of W03 Kinetic energy (eV)
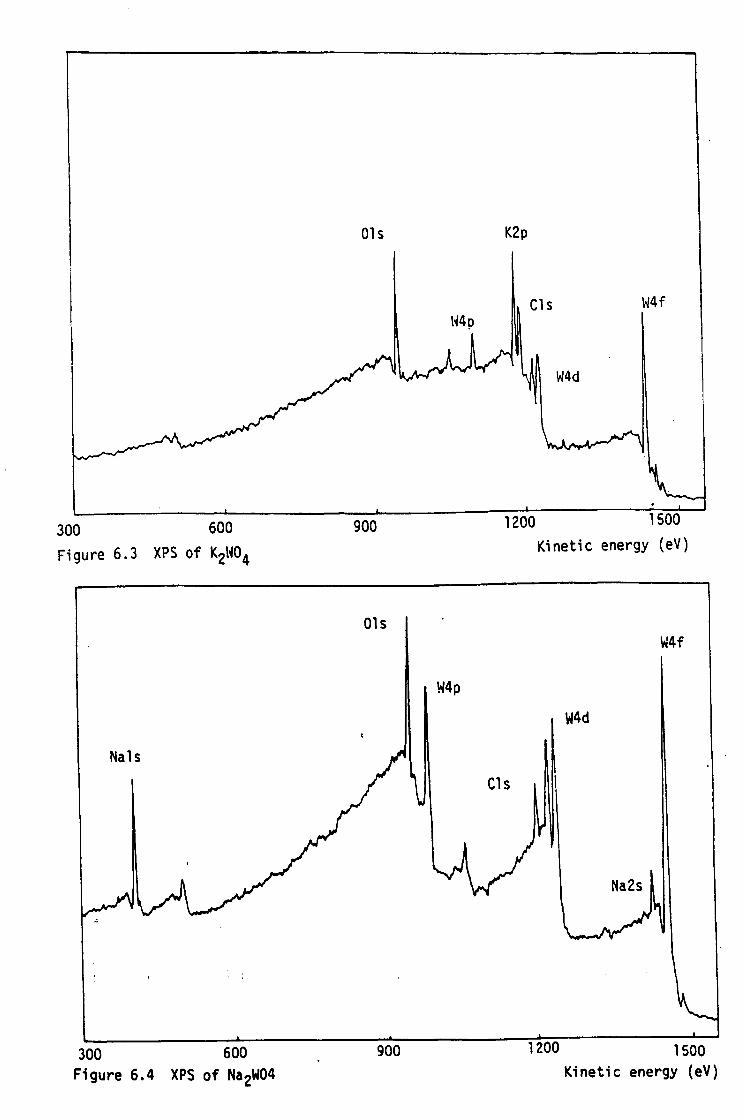
01s K2p
C1s W4f \~4p
W4d
300 600 900 1200 Kinetic energy (eV)
01s W4f
W4p
W4d
C1s
Na2s
300 600 900 1200 1500 Figure 6.4 XPS of Na2W04 Kinetic energy (eV)

01s
\O!4f
Cls W4d
W4p
300 600 900 1200 1500 Kinetic energy (eV)
Figure 6.5 XPS of O.OSKW
" I
300 600 900 1200 1500 Figure 6.6 XPS of 0.2KW Kinetic energy (eV)

01s C1s
K2p
W4f
300 600 900 1200 1500
Figure 6.7 XPS of O.3KW Kinetic energy (eV)
300 600 900 1200 1500 Figure 6.8 XPS of O.6KW Kinetic energy (eV)

01s
300 600 900
Figure 6.9 XPS of 0.8KW
01s
300 600 900 Figure 6.10 XPS of O.OSNaW
K2p C1s W4f
1200 1500 Kinetic energy (eV)
. W4f
C1s l~4d
1200 Kinetic energy1500 (eV)

01s vJ4f
\·J4d
C1s
W4p
300 600 900 1200 1500 Figure 6.11 XPS of 0.2NaW Kinetic energy (eV)
300 600 900 1200 1500 Figure 6.12 XPS of 0.3NaW Kinetic energy (eV)

015
300 600 900 Figure 6.13 XPS of 0.6NaW
300 600 900 Figure 6.14 XPS of O.8NaW
C15 W4f
W4p W4d
1200 1500 Kinetic energy (eV)
1200 1500
I
I I I
I i I
'/ ,
Kinetic energy (eV)

- 105 -
38 36 34 32 eV (BE)
Figure 6.15 (a) W powder, (b) W03,
(c) KZW04, (d) Na2W04
is present in the +6 oxidation state in both samples. The binding
energies of the K2p and Nals peaks agree well with literature values
for compounds of potassium and sodium.
6.3.4 Potassium and Sodium Tungsten Bronze Samples
In all the bronze samples a shift of the W4f peak to a lower
binding energy was observed. Deduction of the oxidation state of W
from the absolute binding energy of this peak is difficult, however, it
can be determined from the spectra that W is present in the +5 and +6
oxidation states. Both the K2p and Nals peaks in the bronze samples
show no evident change in binding energy compared to those of K2W04

- 106 -
and Na2W04'
A quantitative estimation of the relative ratio of tungsten to
alkali metal ion in the bronzes has been attempted. This was carried
out by comparing the peak areas of the W4d and K2p peaks for the pot
assium bronzes and the W4f and Nals peak for the sodium bronzes.
The W4d peak was chosen for the potassium bronzes because of overlapping
between the W4f and K3S peak. A quantitative examination of the
spectra shows that the ratio of the tungsten peak to the oxygen peak is
'almost constantin most bronzes whilst the intensity of the K2p peak
and Nals peak increases with increasing alkali ion concentration.
The method of quantification used was that of peak areas and in cases
where there is a doublet, e.g. W4f, the total peak area was estimated.
The peak areas were calculated using a graphics tablet, Apple II
computer and suitable software, with an accuracy of ±10 - 20%. These
values were then divided by a sensitivity factor, which for different
elemental peaks is listed in Appendix 3. The corrected peak areas for
the alkali ion were normalised with respect to the tungsten peak thus
giving a relative ratio of the two elements present. The relative
peak intensities together with the calculated ratio are given in
Appendix 3. The calculated ratio of the alkali ion to tungsten shows
reasonable agreement in most cases to the bulk atomic ratio of these
elements as defined by the preparation. ,It would appear that there is
no tendency of any particular element to enrich the surface of these
bronzes.
6.4 Conclusions
, ' , The relative chemical shift characteristic of W, has helped 1 ,I,
facilitate detennination of the nature of the tungsten species present

- 107 -
in both the potassium and the sodium bronzes. In all the samples,
tungsten was observed to be in an oxidation state of +5. In complex
ternary materials such as the potassium or sodium bronzes there is the
possibility that the chemical composition close to the surface differs
from that of the bulk. In particular, one can envisage surface Na or
K depletion or enrichment without major structural upheaval. Quantit
ative examination of the X-ray photoelectron spectra of the bronze
samples has shown that the surface of these salnp1es is essentially a
termination of the bulk structure with no pronounced segregation or
depletion of K or Na.
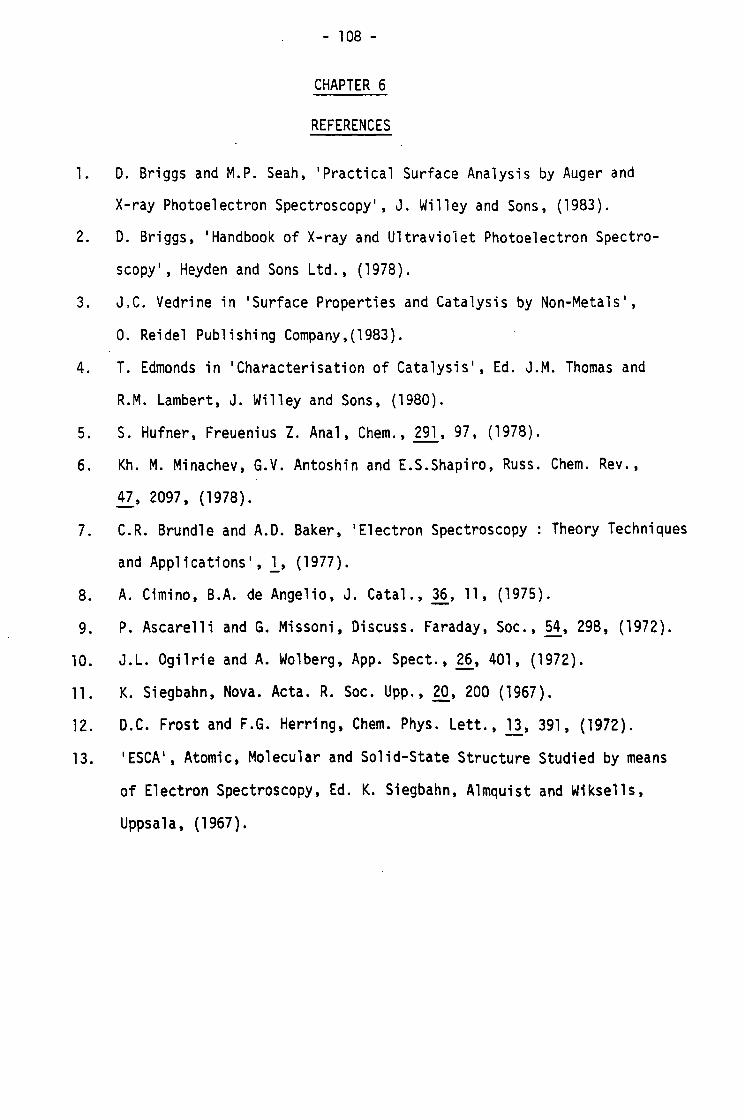
- 108 -
CHAPTER 6
REFERENCES
1. D. Briggs and M.P. Seah, 'Practical Surface Analysis by Auger and
X-ray Photoelectron Spectroscopy', J. Willey and Sons, (1983).
2. D. Briggs, 'Handbook of X-ray and Ultraviolet Photoelectron Spectro
scopy', Heyden and Sons Ltd., (1978).
3. J.C. Vedrine in 'Surface Properties and Catalysis by Non-Metals',
O. Reidel Publishing Company,(1983).
4. T. Edmonds in 'Characterisation of Catalysis', Ed. J.M. Thomas and
R.M. Lambert, J. Willey and Sons, (1980).
5. S. Hufner, Freuenius Z. Anal, Chern., 291, 97, (1978).
6. Kh. M. Minachev, G.V. Antoshin and E.S.Shapiro, Russ. Chern. Rev.,
47,2097, (1978).
7. C.R. Brund1e and A.D. Baker, 'Electron Spectroscopy Theory Techniques
and Applications', l, (1977).
8. A. Cimino, B.A. de Ange1io, J. Cata1., 36, 11, (1975).
9. P. Ascare11i and G. Missoni, Discuss. Faraday, Soc., 54, 29B, (1972).
10. J.L. Ogi1rie and A. Walberg, App. Spect., 26, 401, (1972).
11. K. Siegbahn, Nova. Acta. R. Soc. Upp., 20, 200 (1967).
12. D.C. Frost and F.G. Herring, Chern. Phys. Lett., ll, 391, (1972).
13. 'ESCA', Atomic, Molecular and Solid-State Structure Studied by means
of Electron Spectroscopy, Ed. K. Siegbahn, Almquist and Wiksel1s,
Uppsa1a, (1967).

- 109 -
CHAPTER 7
ELECTRICAL RESISTIVITY
7.1 Introduction
Electrical conductivity is the movement of electric charge from
one location to another. Since the charge may be carried by ions or
electrons whose mobility varies in different materials there is a full
spectrum of conductivities ranging from highly conducting metals to
nearly perfect insulators. Usually conduction by one or the other
type of charge carrier predominates, but in some inorganic materials
both ionic and electronic conduction are appreciable in the same material.
The logarithim of specific conductivity, 10g6 i (ohm cm)-l for ionic
solids has values which vary between -14 and -18 for crystals and ~3 to
+1 for solid electrolytes and for electronic conductors log de has values
of <-12 insulators
-5 to +2 semiconductors
+1 to +5 metals
In ionic conductivity, the carriers may be either negative or
positive ions. In e1ectron,ic conductivity the carriers are electrons
_ or electron 'ho1es'. The charge per electron ;s 1.6 x 10⁻¹⁹ coulomb.
Since ions contain either a deficiency or an excess of electrons, the
charge per ion is an integral multiple of 1.6 x 10⁻¹⁹ coulomb .. This
charge is accelerated as it moves in one direction in the electric field
and decelerated as it reverses its direction. Conductivity,6, may be
expressed as a product of (1) the number of charge carriers, n, in a
material, (2) the charge, q, carried by each and (3) the mobility, u,
of the carriers. That is,
6 = n q u . . . . . . . . . . . . . . . . . .. 7. 1

- 110 -
The mobility of a carrier is its net velocity per unit voltage gradient.
Ionic conductivity in solids is due to the migration of ions from
one lattice site to another. The probability of such movement is low in
most ionic and covalently bonded solids such as oxides and halides.
Rather, the atoms tend to be essentially fixed on their lattice sites
and can only move via crystal defects. Only at high temperature where
the defect concentrations may become quite large and the atoms have a
lot of thermal energy does ionic conductivity become appreciable. If
the ion moves with the electric field it is accelerated and receives
more energy as it vibrates in the favourable direction of the electric
field. Conversly it is decelerated as it moves in the unfavourable'
direction. The result is net ion movement in one direction which gives
ionic conductivity. The ionic conductivities in solids are naturally
low because there is only a very low probability that the energy will be
available for its movement. However, there exists a small group of
solids called solid electrolytes or fast ionic conductors in which one
of the sets of ions can move quite easily. Such materials often have
rather special crystal structures in which there are open tunnels or
layers through which the mobile ions may move.
Electronic conductivity arises by the long range migration of
electrons. In metals, valence electrons are not anchored to any
specific atom and thus their energy permits them to move among the atoms
in all directions with equal velocity. This model was first postulated
in 1900 by Drude(l) who proposed that these valence electrons move
IIfreelyll between the ion cores, which were assumed to be spherically
symmetrical positive charges at rest in a fixed lattice. In this "free
electron gas ll model, an applied electric'field €, accelerates the
lIelectron gas" in a given direction. This motion is opposed by a

- 111 -
viscous drag effect arising from collisions with the lattice cations
resulting in a net movement of electrons towards the positive holes.
In ionically and covalently bonded materials, the electrons are not free
to leave their host atoms and therefore are poor electronic conductors;
these materials can be classified either as semiconductors or insulators
depending on the energy requirement for movement of an electron from its
low energy position so that it may transport a charge. The main differ-
ence between metals, semiconductors and insulators is the magnitude of
their conductivity as given previously; but whereas the conductivity of
most semiconductors and insulators increases rapidly with increasing
temperature, that of metals shows a gradual decrease. The reason for
this can be found by considering equation (7.1). For all electronic
conductors q is a constant independent of temperature and'the mobility
term is similar in most materials in that it usually decreases slightly
with increasing temperature. However, for most metals, n ;s large
and essentially unchanged with temperature, the decrease in ~ causes a
decrease in~. In semiconductors and insulators n usually increases
exponentially with temperature which causes a net increase in6.
The free electron theory was later developed into the Band theory which
was applied to explain the electrical conductivity in metals, insulators
and semiconductors. When atoms approach one another to form solids,
the sharp atomic energy levels spread into wide allowed energy bands
which are separated by forbidden gaps. This band formation is marked
for the valence electrons and negligible for the inner Icore l electrons.
The picture of the electronic structure of a metal given by this theory
is as follows. A solid metal can be considered to possess bands of
electrons which are separated from each other by energy gaps. Further,
these bands can be completely fille~ with loca1i:sed e1ectrorst:or part-t I, 1':. : . I "
ially filled with free electrons whose molecular orbitals extend over

- 112 -
all the atoms in the crystal. In metals such as sodium there are
unfilled orbitals lying very close to the uppermost filled level, the
Fermi level, and so it requires exceptionally little energy to excite
the uppermost - energy electrons. (See Figure 7.1(a)). The electrons
are therefore very mobile, and their mobility is reflected in the ability
of the metal to conduct electricity when small potential differences
are applied. Electrical conductivity of metals is therefore a proper-
ty characteristic of partially filled bands of orbitals. Insulators,
on the other hand, have a full valence band, separated by a large
forbidden gap from the next empty energy band (conduction band) (see
Figure 7.1(b)), thus very few electrons from the upper valence band
states have sufficient energy to overcome the forbidden gap, hence the
electrical conductivity is negligible. In some materials there is a
small gap between the filled band and an empty band, Figure 7.1(c).
If some of the electrons could be excited into the upper band, the holes
in the lower band and the electrons in the upper band could move through
the lattice. This is called semiconductivity. It can be brought
about in several ways. For example, thermal excitation might generate
enough of these carriers. A higher temperature implies more carriers,
and so the conductivity increases with temperature. Another way of
forming carriers is to introduce impurities in an otherwise ultrapure
material. If these impurities can trap electrons they withdraw electrons
from the full band, leaving holes which permit conduction: this is
p-type semiconductivity (p indicating the introduction of holes which
are positive relative to the negatively charged electrons filling the
band). Alternatively, the impurity might carry excess electrons
(e.g. phosphorus atoms introduced into geranium) and these electrons
swim in the otherwise empty bands, giving n-type semiconductivity .' I '
(where n donates negatively charged carriers).

, .. -
(a)
Fenni
+- level
- 113 -
u
. "
(b)
\ \
~ '.' ' ..
.-~
, ..- ... , ....
(c)
Figure 7.1 Band filling leads to' (a) metal,
(b) insulator, and (c) semiconductor
7.2 Experimental Procedure
Resistivity-conductivity measurements on the polycrystalline
bronzes in air were carried out in a Pyrex cell and using Be-Al alloy
electrodes. The sample (about 0.2-0.5g) was first pressed into a
disc using a hydraulic press at a pressure of 10,000kg.: ,The disc was . ,
enveloped with aluminium feil and then held between two 'stainless-, .
steel plates to which the electrodes were connected. The electrodes
and disc were held in place in the Pyrex cell using springs, as shown
in Figure 7.2. Dc resistances were measured using an ohm meter (with
an accuracy of 0.05%) and were then converted to dc resistivities
(p = Ra/t], in ohm.cm (where a and t are the cross-sectional area and
: thickness ,of the sample, measured using a micrometer with an a~curacy
of ± 0.05%. IfOi is significant then dc-resistance measurements are

steel discs
springs
digital thermometer
resistivity meter
Figure 7.2. Apparatus for electrical resistivity measuremen1

- 114 -
likely to lead to polarisation at the sample/electrode interface resulting
in anomalouslY nlgh resistivity values being obtained. Ac modes of
measurement were used to overcome polarisation effects and thus to give
a clear picture of the composite electronic and ionic conductivity of
these bronze materials. In the ac mode V = lZ where Z is impedance
(a complex function of resistance R and capacitance C, i.e. Z = R + jC.).
For a series circuit impedance Z is given by vlfR2 + Xc 2) where Xc is the
capacitive-reactance or l/ZrrFC where F is the ac test frequency (here
1000 Hz). . The ac capacitance was determined using the multimeter
connected to a l~F shunt. A programmabl~ heating coil enables measure
ments to be carried out in air at known temperatures between 298K and
39SK. In ac mode p is given by Za/t.
7.3 Electrical Resistivity Results
The a.c. and d.c. electrical resistivities of the Na and K
tungsten bronzes have been measured in the temperature range 298 - 39SK.
For sodium and potassium tungstates and W02 only the a.c. resistivities
were measured. The d.c. and a.c" resistivities of the sodium bronzes
are plotted as a function of temperature and are shown in Figures 7.3
and 7.4 respectively. The character of the resistivity-temperature
plots indicates that the principle conduction mechanism in the sodium
rich bronzes (x > 0.2) is different from that found in bronzes with
lower sodium content, the former exhibiting typically metallic electrical
properties and samples with x , 0.2 behaving more like semiconductors.
The carriers are electrons at all sodium concentrations. Figures 7.5
and 7.6 show the d.c. and a.c. resistivities of the potassium bronzes
in the temperature range 298 - 373K. The shape of the resistivity __ -
. temperature curve for KO.OSWOg:suggests semiconducting be~aviour, while
those with higher potassium content show properties of metallic conduction.

160 0.05NaW
120
p/nem
80
40
300 320 340 360
Figure 7.3 d.e. resistivity versus temperature for NaxW03
380
0.2NaW
0.3NaW 0.6NaW
0.8NaW
400
T/K

800
600
plncm
400
200
0.05NaW
0.2NaW
• • • • • • • • .0.3NaW •
300 320 340 360
Figure 7.4 a.c. resistivity versus temperature for NaxW03
• • 0.6NaW
380 400 T/K

- 115 -
The d.c. resistivity of W03 as a function of temperature is given in
Figure 7.5 and shows conductivity characteristic of a semiconductor.
Figure 7.7 shows the a.c. resistivity values at 298K of the polycry-
stalline sodium and potassium bronzes as a function of the number of
alkali metal ions inserted. It is evident that the electrical resist-
ivity decreases with increasing value of x. A similar observation has
been made for single crystals of these bronzes but however, it should
be noted that the absolute resistivities are very different as a result
of the physical properties of the bronzes. (It appears that at a
given value of x the resistivity increases only slightly as the inserted
ion is changed from Na+ to K+). The a.c. re.sistivities of Na2W04'
K2W04 and W03 as a function of temperature between 293K and 373K are
shown in Figure 7.8. Clearly, in all cases the resistivity decreases
as a function of temperature. However, the absolute resistivity of the
bronzes is about 106 times lower than for the tungstates, but only
slightly smaller than for the lower oxide of tungsten. The sodium and
potassium tungstates have resist.ivity values characteristic of insulators.
Values of the a.c. resistivity measured at different temper
atures were used to calculate the activation energy for electrical con
duction. Goodenough(2) has indicated that plots of ln (TIp) versus
T- l have a slope of -Ei/86.29 ~eV, and that for fast ionic conduction
in solids Ei: 0.2eV. Figure 7.9 shows these plots for the tungstates,
W03 and the lower oxide of tungsten. Such plots show good linearity
over the entire temperature range and this suggests no dramatic change
in gradient involving a change in the mode of conduction. Table 7.1
gives the· values of the activation energies for conduction for the lower
oxide of tungsten, W02, K2W04 and Na 2W04. Figures 7.10 and 7.11 show
plots of 1n (Tip) versus T- 1 for the Na and K bronzes respectively.

1200
p/ n::m
800
400
W03 •
0.3KW. e • e. :. · i: : ~.6KW .. ~ ~ . . . O.BKW &I •• • ~ •• ~ II .0.2KW
300 320 340 360 3BO
Figure 7.5 d.c. resistivity versus temperature for KxW03 and W03
400 T/K
2000
1600
1200
p/ncm BOO
400
o

2100
p/nem
1500
900
300
0.05KW
0.2KW •
0.3KW •------.-----~------o_----------~.~-----• .-----~.~-----~.~----•• .. . • • • 0 0.6KW
300 320 340 360
Figure 7.6 a.c. resistivity versus temperature for KxW03
380 400
T/K

2000
1000 p/Qcm
500
300
100
50
20
0.1 0.2 0.3 0.4 0.5 0.6 0.7 0.8
x in MxW03
Figure 7.7 a.c resistivity values at 298K versus
x ; n Mxl~03
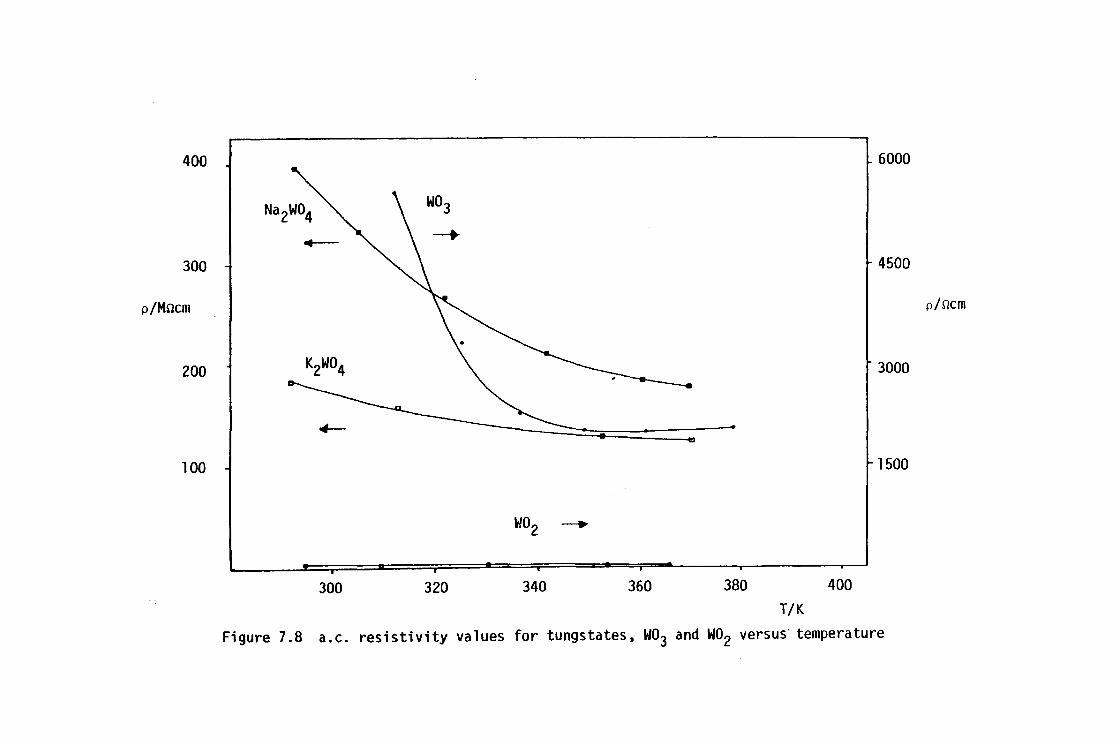
400
1 l- 6000
Na2W04 W03
..-- -+
300
1 ~ 4500
p/Mncm p/rlcm
200 3000
--------------~m
100 J r 1500
\&102 -+
300 320 340 360 380 400
T/K
Figure 7.8 a.c. resistivity values for tungstates, W03 and W02 versus' temperature

4
2
o
1n(T/p}
-2
-4
-6
-8
:
Figure 7.9
6 • ,
g K2W04 • • ....
-Na2W04
2.80 3.00 3.20 3.40 1 x 10³ T
, ,
In(T/p) measured in the a.c. mode versus
~ for tungstates W03 and W02
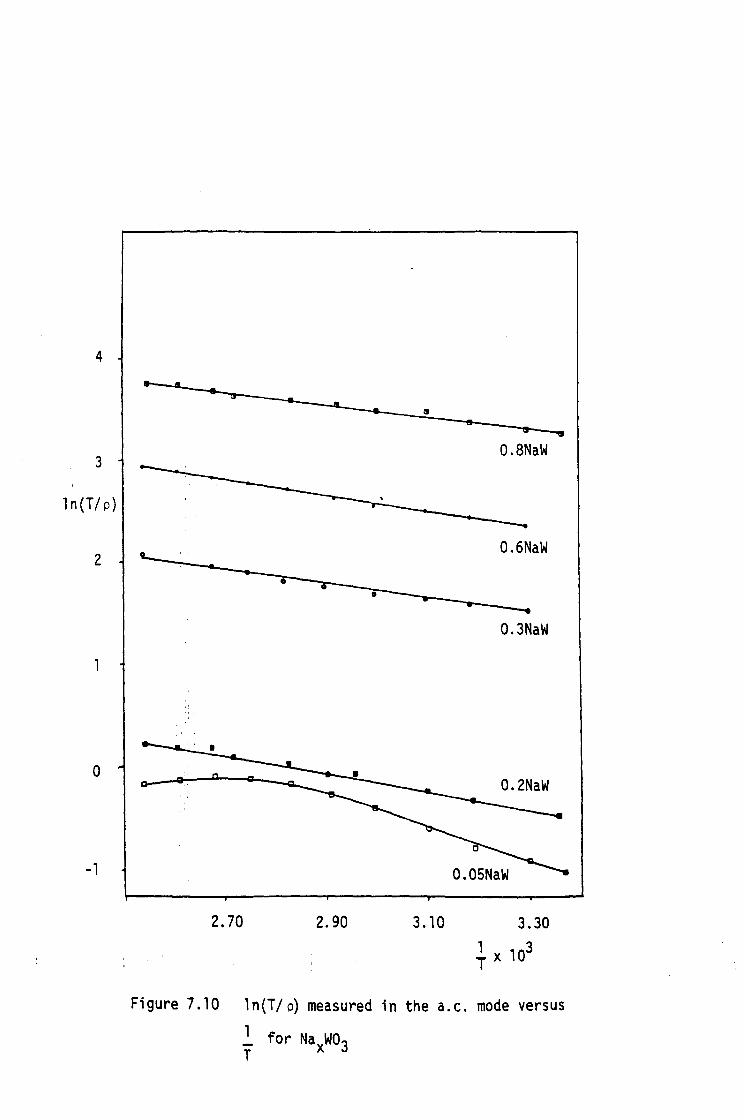
o
-1
•
2.70 2.90 3.10
0.2NaW
O.OSNaW
3.30
1 x 10³ T
Figure 7.10 In(T/o) measured in the a.c. mode versuS
~ for Na xW03 T

2.4
1.6
0.8
1n(T/p)
0.0
-0.8
-1.6
•
..... o o • o
•
2.70 2.90 3.10
. --------0.8KW
0.6KW
• -0.3KW
0.2KW
3.30
1 x 10³ T
Figure 7.11 1n(T/p) measured in the a.c. mode versus 1 T for KxW0 3

- 116 -
The log of the conduction varies linearly with inverse temperature, the
straight line sometimes exhibiting breaks at a certain temperature.
Table 7.2 gives the derived activation energy values for electrical
conduction of the bronzes. In gene~~l, the activation energies decrease
with increasing value of x but are rather similar at one value of x
changing from Na+ to K+.
7.4 Conclusions
The sodium and potassium tungsten bronzes having high concen
trations of the insertion ion show metallic properties while those
with low insertion ion concentration have semiconductor properties.
It appears that at higher concentrations the conducting electrons are
delocalised resulting in metallic conductivity while for lower alkali
content these electrons could be localised, most probably on discreet
tungsten atoms causing semiconductor behaviour. Measurement of the
Hall effect, i.e. measurement of the free electron concentration for
Naxwo3(3) has indicated that the free electron concentration is equal
to the alkali metal concentration and is temperature independent, thus
implying that the conducting electrons arise from the complete ion
isation of the inserted atoms.
The origin of the metallic conductivity of the tungsten bronzes
having large concentr~tion of insertion ions has been very much dis
cussed, the explanation given by Goodenough(2) seems to be the most
plausible. His description of the binding in cubic NaxW03 is a useful
prototype for the electronic structures of metallic oxide bronzes. A
qualitative energy level scheme ;s given ;n Figure 7.12. Each oxygen
has two sp orbitals directed towards neighbouring tungsten atoms. , " ,
The central tungsten atom of a W06 octahedron has Ss,6p and Sd(eg)

- 117 -
orbitals which can combine with the sp oxygen orbitals directed towards
it. In the extended lattice these interactions lead to the formation . * of 6 and <S bands. The remaining oxygen p orbitals (PIT) combine with
* the tungsten Sd (t2g) orbitals to give IT (bonding), IT (anti-bonding)
and PIT+ (non-bonding) bands. The conduction band, which can contain a
* maximum of six electrons per W atom, is IT and is predominantly WSd
(t2g) in character. Sodium atoms donate one electron per atom into the
conduction band which becomes partially filled. The resulting energy
level scheme is similar to that calculated(4) for Re03, a metallic
material isoelectronic and isastructural with Na xW03.
The electrical properties of tungsten bronzes with low insertion
ion concentration has also been adequately investigated to conclude
semiconductor behaviour(S). This behaviour is coincidental with struct
ural distortions of the oxide lattice which probably disrupt the mechan
ism by which the conduction band is formed and instead cause localisation
of electrons in the t2g orbitals of specific tungsten atoms.
The substitution of potassium for sodium as the insertion ion
in the bronze only slightly increases the resistivity values, indicating
that the resistivity is possibly independent of the nature of the
insertion ion. A similar observation has been made by Ellerbeck et
al(6). He concluded that not only was the electron mobility independ
ent of the nature of the insertion ion, but, that it is not influenced
by the number of insertion- ion vacanCies, depending only on the W03 sublattice at sufficiently elevated temperatures.
Recent studies(7) on the conductivity of some polycrystalline
alkali metal tungsten:bronzes have shown that a.c. measurements, above
a certain critical temperature, (Tc)' suggest ionic conductivity to be

'. '
- 118 -
, fI- (4'
t'ItB ' , ,
6p 1 ,'-- fI -'21 ,
a,.' " , , \\
r' ,\
6s , . \\ e. 121 \ \\
Sd{ ,
\\ , \\ Conduct.on , ,,1 .. ell) lc--\\ - band in , tI. (31' , , \' bronzes ,1 ... " ~ , , ,'" ... • , , ' " ,f ,
p. (6) f. p. ·(31 .J' .. .... --:-( " "'1 .. '3'r'" , (6' " , sea.
\\ ,J ,\ ,,~
W " " , 'Iz 0, , ' ,
'.EffiEF'-• (I.'
Figure 7.12 Electronic energy level scheme for
W03 and NaxW03
significant.. This ionic conductivity was thought to arise simult
aneously from the mobility of (i) 02- lattice ions and oxygen vacancies,
'(i1) w5+ ,:,., •• W6+ exchange, arid (iii) aU'ali metal 'ions intercalated,
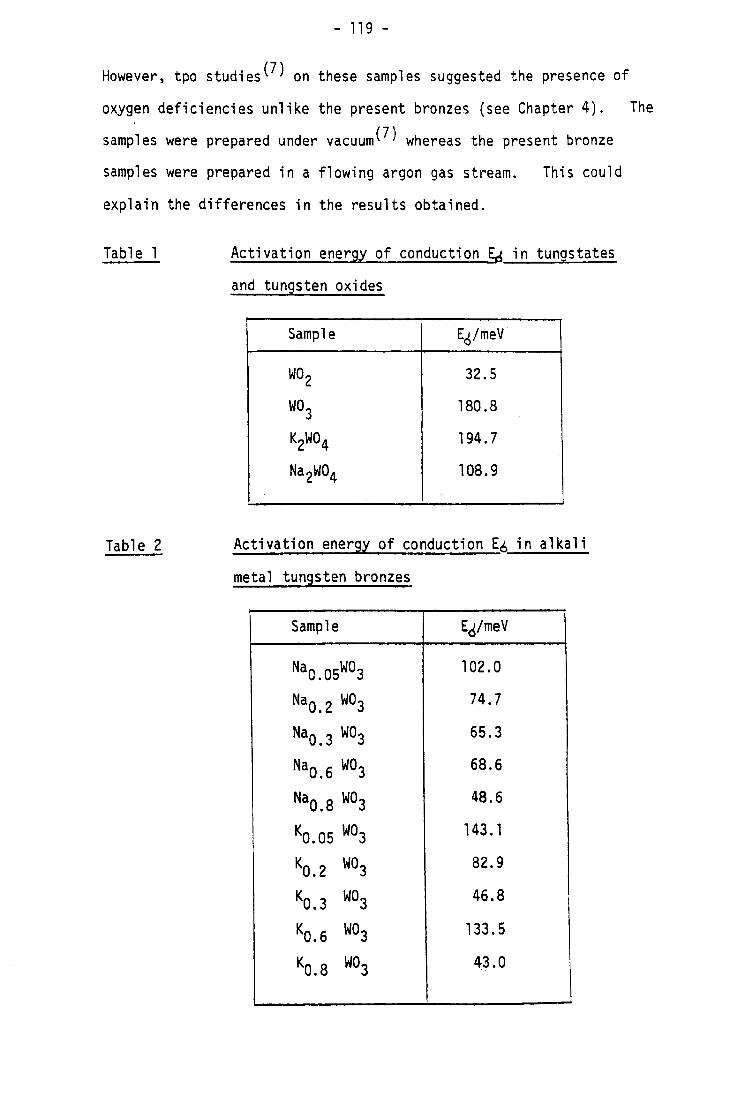
- 119 -
However, tpo studies(7) on these samples suggested the presence of
oxygen deficiencies unlike the present bronzes (see Chapter 4). The
samples were prepared under vacuum(7) whereas the present bronze
samples were prepared in a flowing argon gas stream. This could
explain the differences in the results obtained.
Table 1
Table 2
Activation energy of conduction E6 in tungstates
and tungsten oxides
Sample Ed/meV
W02 32.5
W03 180.8
K2W04 194.7
Na2W04 108.9
Activation energy of conduction E6 in alkali
metal tungsten bronzes
Sample Ed/meV
NaO.OSW03 102.0
NaO. 2 W03 74.7
NaO. 3 W03 6S.3
NaO.6 W03 68.6
NaO.8 W03 48.6
KO.05 W03 143.1
KO.2 W03 82.9
KO.3 W03 46.8
KO.6 W03 133.5
KO.8 W03 43.0

- 120 -
CHAPTER 7
REFERENCES
1. A. Drude, Ann. Phys., i, 1, (1900).
2. J.B. Goodenough, Prog. Sol. State Chern., ~, 145, (1971).
3. W.R. Gardner, Phys. Rev., 46, (1954); 158,825, (1967);
84, 142, (1951).
4. J. Fein1eib, W.J. Scou1er and A. Ferretti, Phys. Rev., 165,765,
(1968) .
5. H.R. Shanks, P.H. Sidles and G.C. Danielson, 'Non-Stoichiometric
Compounds', Adv. in Chern., No. 39, 237, (1963).
6. L.D. E11erbeck, H.R. Shanks and P.A. Sid1es,Proc.Phys. Soc., A62,
416, (1949); Can. J. Phys. 34, 1356, (1956).
7. S.A. Lawrence, S. Stevenson, K. Mavadia and P.A. Sermon, Proc. R.
Soc. A411, 95, (1987).

- 121 -
CHAPTER 8
CATALYTIC ACTIVITY FOR ISOPROPANOL DECOMPOSITION
8.1 Introduction
The decomposition of a secondary alcohol can occur by two routes
(a) dehydrogenation to form a ketone and hydrogen, (b) dehydration to
form an alkene and water. At very high temperatures cleavage of carbon
~ - hydrogen bonds can occur with the formation of alkanes, CO and
CO2. At near ambient temperature ether is the major reaction product.
For the studies of catalyst selection it is sufficient to consider only
the general reactions (a) and (b). Studies of these reactions have
revealed that each of them calls for a different type of active site,
which can be deduced from the various theories of catalysis. (1) From
the electronic theory of catalysis, the rate-determining step for
dehydrogenation is the migration of free electrons in the catalyst;
consequently dehydrogenation is the migration of vacancies while for
dehydration it is the m~gration of free electrons in the catalyst;
consequently dehydrogenation is expected to be catalysed by p-type semi
conductors and dehydration should be catalysed by n-type semiconductors,
however some authors have arrived at opposite conclusions; (2) the
multiplet theory of catalysis implies two-point adsorption as a con-
'dition for alcohol decomposition. Optimum interatomic spacing between
surface atoms of the catalyst for the adsorption leading to dehydration
is greater than that leading to dehydrogenation. Therefore an increase
in crystal lattice parameters will aid dehydration activity, while a
corresponding decrease will aid dehydrogenation; (3) from the classi
fication of catalytic processes, dehydration is an acidic reaction and
therefore should be catalysed by solid, protic and aprotic acids;
dehydrogenation being an electronic reaction should be catalysed by

- 122 -
metals and also by semiconductors; (4) in accordance with the concept
of cyclic complexes in catalysis adsorption of an alcohol involves a
two-point attachment to the electropositive and electronegative surface
atoms; an increase in metal-oxygen distance will facilitate dehydro
genation and a decrease in such distance will facilitate dehydration;
(5) alcohol decomposition is a multistep reaction, dehydration requires
acidic catalysts with n-type conductivity and dehydrogenation requires
basic catalysts with p-type conductivity; (6) allowing for the role of
the width of the forbidden zone, (U), and for the presumption that
catalysis involves specific conductivity, the rate of alcohol dehydro
genation will increase with decreasing value of (U). There should be
no effect of (U) on dehydration, since this is an acid catalysed
reaction.
Decomposition of iso-propylalcohol has gained a prominent place
as a model reaction for studying the principles of catalyst selection.
The two main paths of this decomposition are:
Cr3 ~CH3COCH3 + H2 dehydrogenation
(IPA) CH - OH
C~3 ~ CH3CH = CH2 + H20 dehydration
both of them are free of side reactions
Recently the activity for the dehydration of isopropyl alcohol
is reported to be a good measure of acidity of metal oxide catalysts.
(1-4) Seo et al(5) have found acid-base measurements from their
study of isopropanol decomposition over molybdena~alumina (Mo-A1 203)
catalysts to be in good correlation with those measured by adsorption , "
of ammonia or pyridine. Acidity and basicity on the Mo-A1 203 cata
lysts were found to be affected by the extent of reduction.
- 123 -
(a) Kinetics of IPA Decomposition
Although the decomposition of IPA has been studied frequently
using a variety of catalysts(6), few papers have emphasised the kinetics
of the reaction and information on the kinetic equations is limited.
In dehydrogenation, the possible rate-limiting steps are (a) adsorption
of the alcohol, (b) interaction on the surface, and (c) desorption of
products. These possibilities have been discussed for catalysis on
zinc (II) oxide(7) and a kinetic analysis was carried out. Also, in
general form the following equation has been proposed(2) for the cata
lytic dehydrogenation;
rate = (1 )
where kl , k2 and k3 are, respectively, the rate constants for the de
composition of t~e alcohol, adsorption of acetone, and desorption of
acetone while Palc and Pac are the partial pressures of IPA and acetone
respectively. The equation is in agreement with experimental data(8)
and was derived on the assumption that at the steady-state, the rate
of desorption of acetone is equal to its rate of adsorption plus the
rate of dehydrogenation of the alcohol. For the dehydration of IPA
on metal oxides a similar kinetic treatment(9) yields an equation for the
rate like equation (1) with rate parameters for water substituted for
those of acetone.
A thermodynamic consideration of the isopropanol decomposition
reaction is also of interest. Dehydrogenation of IPA is an exothermic
reaction and hence the products are favoured at low temperature. The
dehydration reaction on the other hand, is an endothermic process and I 'II
I, !"', ; I I ,I
hence the products of dehydration are favoured at higher temperature.

- 124 -
Table 8.1 shows how the equilibrium constant, K, for the two reactions
varies with temperature(s).
Table 8.1 Variation of equilibrium constant, K, with
temperature
Temperature/K Dehydration, Dehydrogenation Kx10-4 K
463 3.49 8.3
473 4.53 7.5
483 5.83 7.2
493 7.42 6.9
503 9.34 6.8
It must be noted that the equilibrium constant for the dehydrogenation
reaction is larger than that for the dehydration reaction at any
temperature, but decreases with temperature. Whereas for the dehydra-
tion reaction, K increases with temperature. However, at lower temp-
eratures both reactions are kinetically limited.
8.2 Experimental Procedure
The decomposition of isopropanol, IPA, was carried out using a
fixed bed reactor in a flow system, as shown in Figure 8.1. The cata
lyst (usually about 0.29) was supported on a sintered disc in a Pyrex
reactor which was connected to the reaction system. The reactor was
placed in an electrically heated furnace and regulated to within ±SK.
The introduction of a thermocouple into the well fitted to the reactor
allowed measurement of the temperature. Prior to activity measure
ments the samples were thermally treated in N2 at 773K for lh. The
sample was then cooled to room temperature in N2 before the reactive

c,
N2
M.S
P.C.
P.1.
F.C.
Pressure controller Pressure indicator Flow controller
P.C. P.1. F.C.
i sopropano 1
F.1.
M.S. T.
Flow indicator Molecular sieve Tap
Thermocouple atmosphere
r-----"
T
Furnace
Iff f .........-ice/water bath
. saturator
Temperature controller
G.C.
Figure 8.1 Activity apparatus for isopropanol decomposition
Chart recorder

- 125 -
mixture was admitted. N2 (White Spot BOC, 99.99% purity) at a flow
rate of 88cm3 min- l was used as a carrier gas. The lPA, fed into the
nitrogen carrier gas stream by a saturator, was carried over the
catalyst at 101.325kPa of total pressure.
The saturator was placed in an ice-water mixture at 273K and
the temperature was found to remain constant to ±2K over at least an
8h period. At the outlet of the reactor, gas samples were injected
to the chromatographic apparatus (Pye Unicam model Fll) which contain
ed a column (5% carbowax on chromosorb P, 80-100 mesh) capable of
separating propene, acetone and isopropanol, and was fitted with a
flame ionisation detector whose output was fed to a chart recorder.
The analysis was carried out under the following conditions:
Temperature of column = 323K
Pressure of N2 g.c. carrier gas= l40kPa
N2 flow rate in column = 15cm3 min- l
Pressure of H2 for FlO = l30kPa
Pressure of Air for FlO = 85kPa
Calibration was achieved by injecting known amounts of acetone,
propene and lPA into the column and plotting a graph of peak areas
versus amount of component injected. From the gradient of these graphs,
response coefficients for each component were obtained. The retention
time and response coefficient for IPA, propene and acetone measured at
the conditions given above are shown below:
Retention ResEonse
time/mins coefficient
IPA 2.05 1.00 :
Acetone 1.33 0.75
Propene 0.58 0.07

- 126 -
The number of moles of the component produced was assumed to be
proportional to the peak area, i.e.
where
N. 1
is the number of moles of component i produced
k. 1
is the response coefficient for component i
A. 1
is the peak area for component i
The percentage conversion of IPA was calculated from the composi
tion of the gas mixture by the equation;
% conversion = lOOA
A + Nisopropanol
where A is the number of moles of IPA transformed to produce propene
and acetone and is calculated from the equation;
A = Npropene + Nacetone
The selectivity for a given product is defined as the number of
moles of that product divided by the number of moles of IPA transformed.
For a reaction product it is given by the equation;
s. = Ni 1
A
The reaction rate (R) is expressed as the moles of IPA transformed
per hour per gram of catalyst. It has been calculated using the
equation;
R = % conversion 100
x F 60 x x 22414 w

- 127 -
where W = weight of sample used. The constant 22414cm3 mol-1 was
considered to be the molar volume of a gas at S.T.P. F is the flow
rate of isopropanol in cm3 min- l and is given by
Flowrate of N2 x vapour pressure of IPA at 273K
carrier gas lOl.325kPa
8.3 Results
The decomposition of isopropanol was studied as a function of
temperature on W03, KxW03 and Na xW03. Figure 8.2 shows the initial
selectivity for IPA decomposition on W03 as a function of temperature.
Selectivity for dehydration increased as a function of temperature and
from 513K, W03 shows total selectivity towards propene formation.
Figures 8.3 - 8.7 show the selectivities for propene and acetone prod
uction as a function of temperature for the potassium tungsten bronzes,
O.05KW ~ O.8KW respectively. For the potassium bronzes, the
selectivities show minimum variation with temperature, in the range in
which they were active (5l3K - 633K) usually with a slight increase in
propene selectivity. It would be more interesting to compare the
selectivities of the potassium bronzes at a fixed temperature. Figure
8.8 shows the variation of selectivities with x in Kx W03 at the test
temperature of 553K. Propene selectivity decreases as the concent
ration of potassium ions in the bronze increases.
Figures 8.9 - 8.13 show the selectivities for propene and acetone
production as a function of temperature for the sodium tungsten bronzes
Similar to the potassium
bronzes, the selectivities for the sodium bronzes show minimum variation , '
with temperature, in the range in which they were active (493K-633K).'

• propene
0.8 ,l( acetone
S; 0.'4
0.0
433 513 593 T/K
F;gure 8.2 S; versus temperature for WO
0.8 ~
S; 0.4
0.0
503 5 3 5 3 T/K
Figure 8.3 S; versus temperature for 0.05KW
0.8
S .. 0.4 1
0.0
543 563 583 T/K
F;gure 8.4 Selectivity (Si) for propene and
acetone versus temperatu're for b. ~KW

s. ,
S· ,
•
)(
O.B
• II( 0.4 • ~
0.0
543 563 5B3 T/K Figure B.5 S· 1 versus temperature for 0.3KW
O.B )Il )( 111 lit •
0.4
• • • • • 0.0
553 5 3 633 T/K Fi gure B.6 s· , versus temperature for 0.6KW
0.8 )If II( :Ie • lie: ..
--.lI(
0.4
0.0 .... __ ~~~-A--~---~ • • • •
533 553 537 593 T/K
propene
acetone
Figure 8.7 Selectivity (S;) for propene and
acetone versus temperature for O.BKW

S. 1
1.0
0.8
0.6
0.4
0.2
0.0
• propene
)I( acetone
0.0 0.1 0.2 0.3 0.4 0.5 0.6 0.7 0.8
x in KxW03
figure 8.8 Selectivity, (Si), for propene and acetone versus
x in KxW03

• propene
• • • • • )( acetone 0.8
S. 1 0.4
0.0 ~ • lI' .. ~
493 533 573 T/K
Figure 8.9 S' versus tern erature for 0.05NaW
• • • • • 0.8
Si 0.4
0.0 !IIi .. .. ., llC
493 533 573 T/K Figure 8.10 S' versus tern erature for 0.2NaW
• • • • • 0.8
S· 1 0.4
0.0 .- • " ~ J(
513 533 553 T/K
Figure 8.11 Selectivity (Si)' for propene and
acetone versus temperature for
0.3NaW

• propene
)C. acetone 0.8 ----- . • • •
S· , 0.4
~ ~ ;l1li ji(
?It"" 0.0
553 593 633 T/K
Figure 8.12 S;' versus temperature for 0.6NaW
0.8 ---- • . • • S· 1
0.4
)( ¥ )( iIII ~
0.0
533 573 613 T/K
Figure 8.13 Selectivity (Si) for propene
and acetone versus tempe ra tu re
for 0.8NaW

- 128 -
However, unlike the potassium bronzes, the sodium bronzes with low
concentration of insertion ion, i.e. x ~ 0.2, produce only propene in
the temperature range of 493K - 573K. Figure 8.14 shows the select
ivity values as a function of x in NaxW03 at the test temperature of
553K. From this graph it can be seen that propene selectivity tends
to decrease as the concentration of sodium ions ;n the bronze increases.
For any given value of x the sodium bronzes show much higher select
ivity for propene than the corresponding potassium bronze.
Table 8.2 gives the total rate for isopropanol decomposition at
the fixed temperature of 553K for W03, KxW03 and Na xW03 where 0.05 ~ x
~ 0.8. In general for either series of bronze the total rate of
decomposition decreases with increase in concentration of insertion ion.
In general, the rate of isopropanol decomposition ;s greater for the
sodium bronzes than for the potassium bronzes with x ~ 0.3, but is less
when x ~ 0.6. The variation of the rates of the decomposition of iso
propanol with K or Na content in the bronze was a common feature at all
temperatures at which activity measurements were made. The variation
of the rate of decomposition of IPA with temperature was used to
calculate the activation energy.
The dependence of the rate constant, k, on temperature T, (Kelvin)
follows the Arrhenius equation (k = A exp.- if where Ea is the
activation energy, R is the gas constant and A th~ pre-exponential
factor). Measurement of k requires the determination of the orders of
reaction at each temperature using the power rate law,
r =
It has to be assumed that a is not temperature dependent and k is

1.0
0.8
0.6
. Si 0.4
0.2
0.0
----.
L )(
0.0 o. 1 0.2 0.3 0.4 0.5 0.6 0.7 0.8
x in NaxW03 Figure 8.14 Se1ectivity,(Si)' for propene and acetone
versus x in NaxW03
• propene
lJ( acetone

Table 8.2
- 129 -
Total rate of Isopropanol Decomposition at 553K
for WO~xW03 and Na xW03-
Sample .!h/mmol f'h-'
W03 15.09
KO.OSW03 3.22
KO.2W03 1.88
KO.3W03 1.21
KO.6W03 0.81
KO. 8~~03 0.73
NaO.OSW03 3.95
NaO.2w03 3.69
NaO.3w03 3.68
NaO.6W03 0.40
NaO.8W03 0.21
proportional to r providing that the reaction is studied at low
conversions and over a moderate temperature range (usually lOOK). The
apparent activation energy can therefore be calculated from the equation;
1n r = 1n A - Ea RT
This is done by determining the rate of reaction at different temper
atures and plotting 1nr versus +. The Arrhenius plots for the initial
rate of isopropanol decomposition on W03, KxW03 and NaxW03, where
0.05 ~ x ~ 0.8, are given in Figures 8.15,8.16 and 8.17 r~spectively.
, Good linear re1atio~ships were obtained for a:l1 samples. 'The pre-

- 130 -
exponential factor, A, and the activation energy, Ea' were calculated
using the least squares method, and are given in Table 8.3 for W03,
KxW03 and NaxW03. Activation energy values for the decomposition of
IPA are within the range of those mentioned in literature(10).
Table 8.3 Activation Energy Values and ln A for the
Decomposition of IPA on WO~xW03 and NaxW03--
Sample ~/kJm01-1 ln A
W03 52.0 14.0
KO.OSW03 76.0 17.7
KO.2W03 75.6 17. 1
KO.3W03 71.3 15.7
KO.6W03 37.8 8.0
KO.8W03 35.0 7.3
NaO.OSW03 61.3 14.7
NaO.2w03 57.2 13.7
NaO.3W03 49.1 12.0
NaO•6W03 69.3 14.1
NaO•8W03 65.6 12.7
8.4 Conclusions
The decomposition of IPA to propene and water (dehydration) or
to acetone and hydrogen (dehydrogenation) is a common probe reaction
that is used with catalysts that have acid and base functions. The
decomposi'tion of IPA on W03 shows selectivity for both dehydration
and dehydrogenation in the temperature range of 433 - 493K but above
493K only propene was produced. These results suggest that in the

•
•
0 Ln 0 , ~ ~ Ln
I I I
~ C ,....
Ln
Ln I
•
0 Ln
~ ~ I I
("t') 0 .-X
.-11-
~
N
("t')
N
N
N ("t') 0 :3
.- ~ 0
N '+-.jj
0 0 .-
0-N
VI :::I
'P-
C 0'\ QJ
or. .- ~ ~
ct:
CO Ln
.- .-. CO
,.... QJ ~ .- :::I C7'I
'P-u..
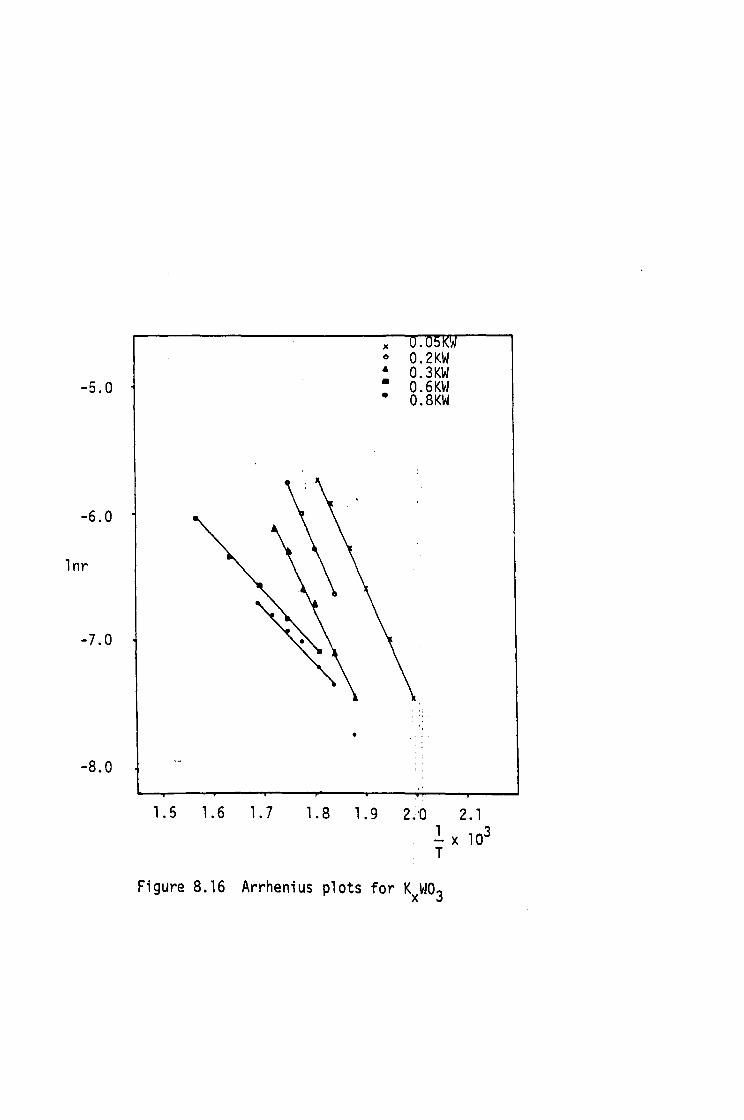
-5.0
-6.0
1nr
-7.0
-B.O
1.5 1.6 1.7
•
,. . o 0.2KW 4 O.3KW • O.6KW • O.BKW
, . ,
loB 1.9 2~'0 2.1
1. x 103 T
Figure B.16 Arrhenius plots for KxW03
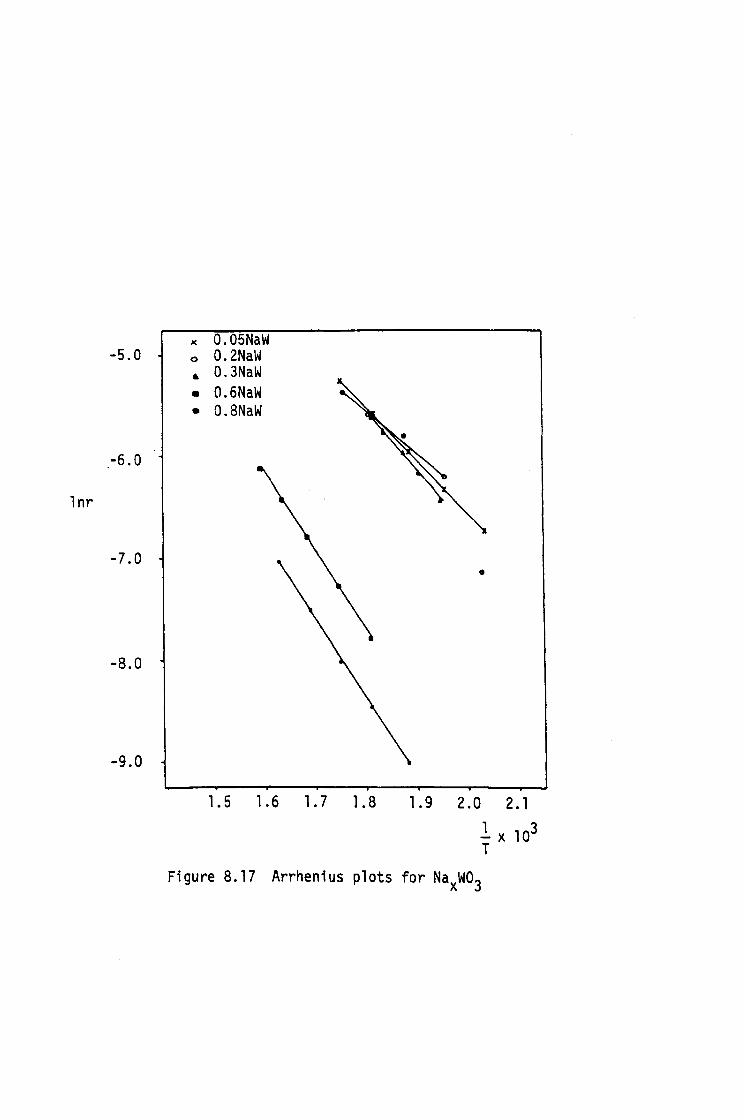
1nr
x 0.05NaW -5.0 0 0.2NaW
~ 0.3NaW • a.6NaW • O.BNaW
-6.0
-7.0
-B.O
-9.0
1.5 1.6 1.7 1.B
•
1.9 2.0 2.1
1. x 103 T
Figure B.17 Arrhenius plots for NaxW03

- 131 -
low temperature range both acidic (required for dehydration) and basic
sites (for dehydrogenation) are present on the surface of W03, but
above 493K only the acidic sites appeared to be active. Selectivity
in IPA decomposition is known to be affected by the temperature at
which the reaction is conducted, higher temperatures (typically above
623K) favouring dehydration(ll). But total selectivity for propene
formation on W03 at temperatures above 493K cannot be due to only this
thermodynamic factor, since acetone formation has been observed on
other catalysts in such temperature ranges. It is most probably
caused by the elimination of the basic sites. According to Krylov(6}
strong metal-oxygen bonds (M - O) gives strong acidity and in oxides
that have weak M - 0 bonds the oxygen lone pair is basic. W03 is
classified as an acidic oxide but there is a possibility of weak W - 0
bonds present on the surface giving rise to basic sites. It is
possible that at temperatures above 493K these weak W - 0 bonds are
reduced by the secondary alcohol thus leaving only the acid sites.
It may also be possible that at higher temperatures there is partial
dehydration of the surface and a decrease in the coordination number
of surface ions thus resulting in a strong M ~ 0 bond.
The decomposition of IPA on the potassium tungsten bronzes
produced both dehydration and dehydrogenation products showing the
presence of both acidic and basic sites. In general, the selectivity
for propene production decreases as the concentration of potassium
ions in the bronze increases. This result could be expected since
the total number of acid sites decrease as x in KxW03 increases.
(see Chapter 3) or alternatively, the number of basic sites increase
with increasing x. However, it would be interesting to consider
whether the same type of reactive acidic sites are present in all of
the potassium bronzes, since ammonia desorption has shown that for

- 132 -
bronzes with x ~ 0.3 at least two types of acidic site are present, as
two or more maxima were observed. This could be done by comparing the
turnover frequency for the dehydration reaction. Table 8.4 gives the
rate Qf dehydration, the number of acid sites present and the turnover
frequency for dehydration for W03 and the potassium tungsten bronzes.
The rate and turnover frequency for the dehydration reaction on W03 are
higher than those for the potassium bronzes with x ~ 0.2. It;s
possible that on W03 the sites are more reactive than on the potassium
bronzes probably because stronger acid sites are formed during the
reaction for reasons previously explained but not observed during
ammonia desorption studies. The turnover frequency for the dehydration
reaction may be considered constant for potassium bronzes with
Table 8.4 Turnover Numbers for Propene Production on
~ and Kx~ at 553K
Sample Rate of No. of acid Turnover No/ dehydration/ sites/molecules molecules nunolg-l(cat) NH3 desorbed per site
h- l 9-1 s-l (cat)
W03 15.09 6.98 x 10¹⁸ 0.36
KO.05W03 2.64 4.40 x 10¹⁸ 0.10
KO. 2W03 0.97 1.34 x 10¹⁸ 0.12
KO.3W03 0.69 5.28 x 10¹⁷ 0.22
KO.6W03 0.16 1.22 x 10¹⁷ 0.22
KO.8W03 0.04 3. 07 x 1016 0.22
x = 0.05 and x = 0.2. ,Temperature programmed desorption of ammonia on , , : '; ~' • t
these samples and on W03 shows only one peak maximum in the low temper-

- 133 -
ature range thus indicating only one type of acid site is present.
Turnover numbers for the dehydration reaction for bronzes with x ~ 0.3
are greater despite the fact that the total number of acid sites has
decreased. However, tpdof ammonia has shown that for these samples
there are at least two different types of acid site present. One
way to distinguish whether more than one type of acid site is present
is to consider the activation energy values for the dehydration reaction.
Many investigations(S) have reported that these values are lower on
catalysts which have both Bronsted and Lewis acid sites than those with
only Lewis acid sites. Table 8.5 gives the activation energy (Ea)
values for the dehydration reaction for W03 and the potassium bronzes.
It appears that Ea is lower for the bronzes with higher potassium
content again possibly indicating that these bronzes contain two types
of acid site, while W03 and the potassium bronzes with x ~ 0.2 contain
only one type of acid site. On Bronsted acid sites it is believed
that IPA is molecularly adsorbed by hydrogen bonding whereas on Lewis
acid sites it is dissociatively adsorbed to form a surface alkoxide
and an adsorbed proton. In general the sodium tungsten bronzes show
greater selectivity for the dehydration reaction than the potassium
bronzes and in fact when x ~ 0.2 total selectivity for propene form
ation was observed. Temperature programmed desorption of ammonia of
the sodium bronzes in most cases gave very broad peaks, possibly
indicating acid sites of different strengths present. Table 8.6 gives
the rate of dehydration, the number of acid sites present and the
turnover number for the dehydration reaction on the sodium tungsten
bronzes. Although the total number of acid sites present on the
sodium bronzes are· smaller than those on the corresponding potassium
bronzes,; th;e rate of dehydration and hence the turnover n,umb~r are
greater, again indicating that the acid sites present on the sodium

- 134 -
Table 8.5 Activation Energy Values and 1n A for the
Dehydration Reaction on W03 and KxW03-
Sample ~/kJm01-1 1 n A
W03 121.3 29.1
KO.OSW03 124.9 28.1
KO.2W03 166.0 36.1
KO.3W03 81.1 17.3
KO.6W03 72.3 13.9
KO.8W03 101.6 18.9
Table 8.6 Turnover Numbers for Propene Production
on Nax~ at S53K
Sample Rate of No. of acid Turnover No./ dehydration/ sites/molecules mo1ecu1ys per
1 -1 NH3 desorbed ~~lg (cat) site s-g-l (cat)
NaO. OSW03 3.95 1.36 x 10¹⁸ 0.49
NaO. 2W03 3.69 5.05 x 10¹⁷ 1. 22
NaO.3W03 3.46 3.20 x 10¹⁷ 1.81
NaO.6W03 0.35 3.87 x 10¹⁶ 1. 51 .-
NaO.8w03 0.17 2.80 x 10¹⁶ 1.02
bronzes are more reactive. The activation energy values for the
dehydration reaction on the sodium bronzes, given in Table 8.7 are in
the:, range of those obta i ned for the potas s-i um bronzes wi th x ~ 0.2 ! ' ' " I '" '
where more than one type or strength of acid site was clearly observed
duri ng t p d of ammoni a.

- 135 -
A comparison between the relative activities of the different
samples for the dehydration reaction can be obtained using the compen
sation effect, where the logarithm of the pre-exponential factor is
plotted against the activation energy. The compensation effect has
Table 8.7 Activation Ener9~ Values and ln A for the
Dehydration Reaction on the Sodium Bronzes
Sample ~/kJm01-1 1 n A
NaO.OSW03 61.3 14.7
NaO.2W03 57.2 13.7
NaO.3W03 85.5 19.8
NaO.6W03 80.5 16.5
NaO.8W03 73.6 14.2
been interpreted and reviewed in several papers(12-14) although the root
of this effect is still uncertain. In general, catalysts lying on the
same line in such a plot show similar activities whereas catalysts
lying to the left show higher activities and those to the right smaller
activities. Figure 8.18 shows the compensation plot for the dehydra
tion reaction on W03, KxW03 and NaxW03. It appears that W03 and
NaxW03, where 0.05 ~ x ~ 0.3, show similar activities whereas the corres
ponding potassium bronzes show slightly less activity. Of the bronzes
with higher alkali ion content the sodium bronzes appear to be more
active.
A similar compensation plot (Figure 8.19) has also been drawn for
the total rate of decomposition of IPA on W03, KxW03 and NaxW03 from \ \ I
values of ln A and Ea given in Table 8.3. The potassium bronzes show

35
25
lnA
15
5
W03 x
./ ... . .
#5 7
4
20 60 100
2
./ 1
140
1. 0.05KW 2. 0.2KW 3. 0.3KW 4. 0.6KW 5. O.BKW 6. 0.05NaW 7. 0.02NaW B. 0.3NaW 9. 0.6NaW
10. O.BNaW
180 -1 EAct/kJmo1
Figure B.18 Compensation plot for the dehydration of isopropanol
on W03, KxW03 and NaxW03

18
14
1nA
10
8
W03
20 40 60 80
1.0.0SKW 2. 0.2KW 3. 0.3KW 4. 0.6KW S. 0.8KW 6. O.OSNaW 7. 0.2NaW 8. 0.3NaW 9. 0.6NaW
10. 0.8NaW
EAct/kJmOl-1
Figure 8.19 Compensation plot for isopropanol decomposition on W03~
KxW03 and NaxW03

- 136 -
similar activities since they lie on the same line. W03 is the most
active with the sodium bronzes with 0.05 ~ x ~ 0.3 showing slightly
less activity. The least active samples appeared to be the sodium
bronzes with high alkali ion content. For the sodium bronzes with
0.05 ~ x ~ 0.3 where dehydration is the most important reaction, the
activity is higher than the potassium bronzes since the acid sites are
more reactive. However, the potassium bronzes with 0.6 ~ x ~ 0.8,
although contain similar acid sites, show less activity for the de
composition reaction probably because dehydrogenation is an important
reaction. The sodium bronzes with 0.6 ~ x ~ 0.8 show lower activities
than the potassium despite containing stronger acid. sites. However,
on these samples acetone formation is also observed and hence the basic
sites present are less reactive. In general, the rate of the dehydra-
tion reaction is greater on the sodium bronzes than the corresponding
potassium bronzes, this has been explained by the presence of stronger
acid sites. The activities of the samples for the dehydrogenation
reaction appears to be higher on the potassium bronzes than the sodium
bronzes,most probably due to the fact that the basic sites on the
potassium tungsten bronzes are more active.

- 137 -
CHAPTER 8
REFERENCES
l. M. Ali and S. Suzuki, J. Catal., 30, 362, (1973).
2. M. Ali, Bull. Jap. Petrol. Inst.,~, 50, (1976).
3. M. Ali, Bull. Chern. Soc. Jap., 49, 1382, (1976); 50, 355, (1977);
50, 2579, (1977).
4. K. Tanabe, 'Catalysis Science and Technology', ~, 231, Springer
Berlag, Berlin, (1981).
5. K.T. Sea, S.C. Kang, H.J. Kim, S.K. Moon, Korean J. Chem.,~, (2),
163, (1985).
6. O.V. Krylov, 'Catalysis by Non-metals', 115, Academic Press, (1970).
7. O.V. Krylov, Russ. J. Phys. Chern., 39, 1554, (1965).
8. J. Germain, J. Bigourd,J. Beaufils, B. Gras and L. Ponsalle. Bull.
Soc. Chim. Fr., 1777, (1961).
9. O.V. Krylov, Russ. J. Phys. Chern., 39, 1422, (1965).
10. Y. Kera, J. Catal., 96, 198, (1986).
11. F. Pepe, F.S. Stone, J. Cata1., 56, 160, (1969). II
12. G.C. Bond, Zeitschrift Fur Physikalische Chemie Neue Folge, 144,
521-23, (1985).
13. G.M. Schwab, Z. Phys. Chern., B5, 405, (1929); J. Catal., 84,1, (1983).
14. W.C. Conner, J. Catal., 78, 238, (1982).

- 138 -
CHAPTER 9
CATALYTIC ACTIVITY FOR PROPENE METATHESIS
9.1 Introduction
(a) Mechanisms and Reactions
Alkene metathesis (disproportionation) is one of the most
recently cata1ysed reactions of hydrocarbons to emerge. Discovered
in 19S9(l,2) this novel reaction opened up a new and exciting field
of hydrocarbon chemistry and provided commercial routes for the inter
conversion of light alkenic hydrocarbons: the backbone of today's
petrol chemical industry. The reaction is general for hydrocarbons
containing C = C double bonds, its scope has broadened, and the
original term "disproportionation", used in the initial publications(l),
no longer app 1 i es . A more appropri ate name, "metathes i S", was
introduced in 1967(3) and is now commonly used. The reaction can be
thought of as a net breaking and re-formation of two carbon = carbon
bonds, as shown in Scheme 1.
R2 I
R3 I
R2 I
R3 I
R1 - C = C R4 Rl C C - R4 .. II II + + ~
RS - C - C R8 RS C C - R8 I I I I R6 R7 R6 R7
Scheme 1 Generalised Metathesis Reaction
Alkene metathesis reactions are believed to proceed through a ,I ; ! '\ ~ . I 'I
single-step meta110carbene scheme involving a metallocyclobutane
intermediate, as shown in Scheme 2. Support for the validity of this

- 139 -
generally accepted mechanism has been provided by very detailed kinetic
and mechanistic studies(4).
I J I I I I -c = c- -C C - -C C-
-. -.. II II ~ ~
M - C- M C- M C-I I I
I I I I I -C C- -C C- -c - c-
II II --. --. ~ ~
M C- M C- M == C-I I I
Scheme 2. Single-step Metallocarbene Mechanism
However, for predicting primary products of metathesis applications, a
simple four-center concerted mechanism (Scheme 3) is adequate and more
direct. As depicted in both schemes, the types and total number of
bonds remain unchanged.
I r -c == c-
--. ~
-C - C-I I
I -c
-C I
I C-
CI
I -C
II -c ,
Scheme 3. Four-Center Mechanism for predicting products
I C-
II CI
Metathesis reactions of acyclic monoa1kenes can be classified
into (1) self-metathesis of a single alkene, and (2) cross-metathesis
of double-bond isomers or of two different a1kenes. In the first
case, two primary metathesis products are produced; e.g. propene yields
ethene and but-2-ene. In the second case, sets of both self- and

- 140 -
cross-metathesis products are obtained; e.g. a pent-l-ene + pent-2-ene
mixture yields ethene + oct-4-ene, propene + hept-3-ene, but-l-ene +
hex-2-ene, and but-2-ene + hex-3-ene. When ethene is.one of the react-
ants (ethene cleavage), a-ethenes are produced; e.g. ethene cleavage of
hex-3-enes yields but-l-ene. Cross-metath~sis of acyclic with cyclic
alkenes yields dialkenes; ethene cleavage of cyclic alkenes provides a
new route to a, w-alkenes as shown in Scheme 4. The metathesis of
other types of alkenes and their mixtures, including dialkenes, ring
substituted alkenes (e.g. styrene), and functionally substituted
alkenes, produces products consistent with schemes 2 and 3. In theory,
the number of olefin metathesis reactions is limited only by the number
of compounds containing carbon-carbon double bonds.
(b) Catalysts Systems
Current industrial applications of alkene metathesis using heter
ogeneous catalysts is high:
Scheme 4. Synthesis of a, w-olefins
Among the more effective metathesis catalysts are the oxides of moly
bdenum, tungsten, and rhenium supported on high-surface-area alumina
or silica(S-lO). Molybdenum oxide-alumina exhibits metathesis act
ivity in the 373K - 473K temperature range. Tungsten oxide-silica is
effectiv~ for metathesis in the 573K - 773K temperature range and is
less susceptible to trace quantities of catalyst poisons in the feed
stream than lower temperature alumina-based catalysts. Rhenium oxide-

- 141 -
alumina compositions are active metathesis catalysts at ambient conditions
making them ideal for fundamental studies.
A typical example of the metathesis reaction is the conversion
of propene into a mixture of ethene and cis- and trans- but-2-ene, which
is catalysed by a variety of supported systems including those mentioned
above. Catalytic reactions of propene have also been investigated
over unsupported Na xw03(11) to see how the metal-insulator transition
of the catalyst affects the selectivity towards dimerisation or meta-
thesis. It was found that dimerisation, producing mainly hexenes, was
dominant over an insulating solid while metathesis, producing ethene and
but-2-enes, was dominant over a conducting solid.
9.2 Experimental Procedure
The propene metathesis reaction was studied in the apparatus
shown in Figure 9.1. It is composed of lines of gase~ that are puri-
fied and controlled before passing through the reactor, R. White spot
nitrogen (BOC, 99.95% pure) was further purified by passing through a
pre reduced 10% Cu/Si02 trap, CS, maintained at 673K, to remove oxygen
and a SA molecular sieve trap, MS. Propene (Matheson, 99.98% pure)
was used as delivered without any extra purification. N2 gas flow
was controlled by a Hoke valve, HV, and measured by a rotameter, RT.
A soap bubble flowmeter, BF, connected by a bypass system was used for
checking the hydrocarbon flow controlled by a Hoke valve. A trap of
silica gel, SG, was connected at the end of the flowmeter for the
removal of water from the hydrocarbon stream. It was changed every
24h. The Cu/Si02 trap in the apparatus was regenerated periodically
by reduction in hydrogen for 2h at 673K.
Quantitative analysis of the metathesis products at the outlet

MS R
CS 10/ SG
SF
RT
HV
T
P
Figure 9.1 Catalytic apparatus for propene metathesis
SV
R = Reactor
CS = Cu/Si02 Catalyst (trap)
RT = Rotameters
BF = Soap bubble flowmeter
SG = Silica gel trap
T = Tap
GC = Gas Chromatograph
SV = Gas sampling valve
P = Propene gas
N2 = Nitrogen gas
HV = Hoke valve
MS = Molecular sieve trap

- 142 -
of the reactor was carried out by a gas chromatograph, GC, Perkin Elmer
model 8500, with flame ionisation detector, and data acquisition and
processing facilities. A column of 3% squalane on Alumina H, 100-200
mesh, was used to separate the products. The effluent from the reactor
was fed to the chromatograph through a gas sampling valve, SV. The
analysis was carried out under the following conditions:-
Pressure at inlet of column = 130kPa
Temperature of column = 353K
N2 flow in column = 30cm3min- l
Pressure of hydrogen = 70kPa
Pressure of air = l40kPa
The g.c. was calibrated by injecting a standard calibration gas mixture
(Phase Separations Ltd.) containing defined amounts of the different
components (i.e. reactant and products). The relative response
coefficients were calculated by comparing the area of each peak with
that of propene. Since the number of moles of each component is pro
portional to the peak area, then in a mixture of gases containing the
different component, the molar percentage, Cj of any of them can be
calculated by the equation:
where
c. = J
100 A. k. J J
A. = peak area of component j J
A. = peak area of each component in effluent , k = response coefficient
The retention times and the response coefficients flo,r' the various: products
measured at the conditions indicated previously are shown in Table 9.1.

~ u ~
"C o So.
r-as ~ o ~
"-o ~ c: OJ c:
60
50
40
30
& 20 E o u ~ 10
M -~
5 35 65
Time/min
Figure 9.2 % component of total product versus time for the
reaction of propene on W03
95
)( C2H4
o C4Ha
• C6H12

60
~ B 50 -0 o Sa.
';; 40 ~ o ~
b 30 ~ c Q.I § 20 a. g u ~ 10
)( )to ~ __ _~
• • • •
5 35 65 95
Time/min.
Figure 9.3 % component of total product versus time for the
reaction of propene on 0.2KW
)( C2H4
o C4H8 • C6H12

60 +I U ;:, -c e 50 0..
r-ttl
"6 40 +I
~ 0
+I 30 c cu c 0
~ 20 0 u ~
10
5 35 65 95 Time/mi n.
Figure 9.4 % component of total product versus time for the
reaction of propene on 0.2NaW
• C2H4
o C4HS
• C6H12

- 143 -
A preliminary study has shown that the bronzes have little activity for
propene reaction at temperatures below 673K. The temperature of 673K
Table 9.1
\ Product Retention time/ Response min. Coefficient
Methane 1.82 2.89
Ethane 2.64 1. 54
Ethene 2.83 1. 54
Propane 4.71 1.02
Propene 5.90 1.00
Butane 9.81 0.82
Butene 14.56 0.82
trans-2-butene 17.42 0.94
cis-2-butene 21.31 0.88
hexenes 29.51 0.54
was therefore selected for activity measurements.Tpr and tga studies
have shown that the bronzes are stable at this temperature in both N2
and H2. Further tga experiments in a propene atmosphere have
demonstrated that W03 and the bronzes showed no weight loss when heated
in such an atmosphere up to a temperature of 723K. So it can be
assumed that at 673K there ;s no bulk or surface reduction in the
bronze in propene. Normally about 1.5g of the bronze was placed
inside a fixed bed reactor fitted with a thermocouple and N2 gas flowed
over it. The sample was then heated to 673K ± 5K at 10Kmin- l and the
nitrogen flow replaced by propene, (10cm3min-1), and activity meas~re
ments were commenced. Activity was measured every 30 min. because of
the high retention time of hexene.

- 144 -
9.3 Results
The catalytic reaction of propene on W03, KxW03 and Na xW03 has
been studied under the conditions previously mentioned. The influence
of the bronze composition on the reaction was investigated by comparing
the changes in activity and selectivity of dimerisation and metathesis
at 673K. It will be particularly interesting to see if the semi-
conductor-metal transition in the bronze affects the selectivity towards
dimeri sation.
The reaction of propene on W03 at 673K gave ethene, but-2-ene
and hexene as the major products. Figure 9.2 shows how the concent
ration and the selectivity of the products vary with time. There are
insignificant changes in product concentration with tne reaction time.
A similar effect was observed on both the potassium and sodium bronzes.
Figures 9.3 and 9.4 are representative of the variation of product
concentration with time for samples 0.2KW and 0.2NaW respectively.
Future reference will be made only to the products obtained after the
sample has been exposed to the reactant for 65 min.
The major products obtained by the reaction of propene on W03 and the potassium bronzes of 673K are given in Table 9.2. Both meta
thesis and dimerisation coexist on these samples as products of both . -
these reactions were obtained. Negligible traces of other hydro-
carbons, (methane, ethane and propane) were also detected (i.e. < 0.1%).
Methane and ethane are most probably formed by the cracking of propane
impurity present in the propene feedstock. Nominal amounts of but-l
ene and pentenes were also detected in most cases. These might have
been the products of homogeneous reactions as a result of .molecular
collisions of propene at the temperature of reaction because they were
produced even in the absence of a sample. The main component of hexene

- 145 -
was 2-methyl-2-pentene. A similar pattern of products was obtained for
the reaction of propene on the sodium bronzes, as shown in Table 9.3.
Table 9.2 Major Products obtained over W03 and KxW03-
% component of total product
!
x in KxW03 C2H4 2-C4HS C6H12
0 26.9 2S.7 44.4
0.05 30.5 31.5 3S.0 --
0.2 45.9 44.5 9.6
0.3 37.S 46.3 15.9
0.6 41.4 37.9 20.7
O.S 37.5 45.S 16.7 I
The rate of metathesis and dimerisation was calculated from the
amount of propene converted either to metathesis products, (ethene and
but-2-enes), or dimerisation products, (hexenes), from the fact that
Table 9.3 Major Products obtained over Na xW03-
% component of total product
x in NaxW03 C2H4 2-C4HS C6H12
0.05 27.9 30.0 42.1
0.2 42.9 44.4 12.7
0.3 43.1 41.3 15.6
0.6 41.0 35.9 23.1
O.S 38.7 40.3 21.0
2 moles of propene are required to produce either 1 mole of but-2-ene

- 146 -
and 1 mole of ethene, or 1 mole of hexenes by the routes shown below:
The percent propene converted in the metathesis and dimerisation
reactions are then given by equations 9.1 and 9.2
% conversion (metathesis) A x 100 = ........... A + B + C3
% conversion (dimerisation) B x 100 = ........... A + B + C3
where A = 2C4 (C4 = cis and trans but-2-ene or ethene).
B = 2C6 (C6 = hexenes)
C3 = propene
9.1
9.2
C. = No. of moles of compound ; calculated from the peak area , using the response coefficient for the FlO detector.
-1 -1 ) The rate (mmo1,g (samp1e)h was then calculated using the percent
conversion, and is given by equation 9.3
-1 h-1 rate (mmo1 g (sample) ) = __ C __ x F x 60 min x 1 x 100 W
1 x 1000 22414
9.3
where C = percent conversion for either metathesis or dimerisation
F = flow rate of propene gas
W = weight of sample used
22414 cm3mo1-1 1 1 f t S T P = mo ar vo ume 0 gas a ...
Tables 9.4 and 9.5 show the rates of metathesis and dimerisation for
W0 3, KxW03 and Na xW03, where 0.05 ~ x ~ 0.8, respectively. It would

- 147 -
be more interesting to compare the rate per unit area of surface for
each of the samples, since krypton adsorption has shown the surface
area of the bronzes varies with alkali ion content. These values are
also quoted in Tables 9.4 and 9.5 (Figures in brackets). Figures 9.5
and 9.6 are reported plots of the rate of dimerisation and metathesis
(mmo1 m- 2 h-1) against alkali ion content for the potassium and sodium
Table 9.4 Rate of Oimerisation and Metathesis for W03-
and KxW03-
x in KxW03 Rate of1dimrrisation/
mmo1g- h-Rate of1met~thesis/
mmo1g- h-
0 0.41 (0.37) 0.09 (0.08)
0.05 0.22 (0.21) 0.19 (0.18)
0.2 0.08 (0.10) 0.38 (0.49)
0.3 0.04 (0.15) 0.12 (0.46)
0.6 0.03 (0.19) 0.06 (0.38)
0.8 0.01 (0.10) 0.03 (0.30)
(Figures in brackets correspond to rates in mmo1 m- 2 h-1)
Table 9.5 Rate of Oimerisation and Metathesis for NaxW03-
x in NaxW03 Rate of1dimrrisation/
111I1101g- h-Rate of1met~thesis/ mmo1g- h-
0.05 O. 19 (0.20) 0.13 (0.14)
0.2 0.10 (0.16) 0.35 (0.55)
0.3 0.05 (0.12) 0.14 (0.33)
0.6 0.03 (0.23) 0.05 (0.38)
0.8 0.04 (0.31 ) 0.07 <.0.54 ) ; : , .
(Figures in brackets correspond to rates in mmo1 m- 2 h-1)

• metathesis
)( dimeri sation
0.6
• /
0.4
I .c
C'-I I e III CIJ 0.2 r0-
o E / '" .l(
" CIJ ..., 10 cc
0.0 L
0.0 0.1 0.2 0.3 0.4 0.5 0.6 0.7 0.8 x in KxWD3
Figure 9.5 Rate ~f dimerisation and metathesis versus x in KxWD3

c: 0
VI .... .... ~ VI to QJ VI
.s:: .... +oJ S-to QJ ~ E QJ .... E "0
tv') 0 :3
x to
Z tv')
c: 0 .... :3 • )It x
X to Z
c: 00 .... 0 X
VI ;:, ,.., VI S-
O QJ > VI
10 .... VI
0 QJ ..c:: +oJ to
I.t') ~ · ~ 0
"0 c: to
~ · c: 0 0 ....
~
("t') to VI · ....
0 S-QJ E ....
"0 N
I+-0 0
QJ ~ .- to · ex
0
10 . 0 0'1 · 0 QJ
S-;:, c:n ....
LL.
10 ~ N o . . . . o o o o

- 148 -
bronzes respectively. The selectivities for dimerisation and metathesis
were also determined. The selectivities were defined by equations 9.4
and 9.5.
So rO
= rO + r m
................. 9.4
r Sm = m
rm + rO ................. 9.5
where So and Sm are the selectivities for dimerisation and metathesis
respectively, and rO and rm are the rates for dimerisation and meta
thesis respectively. Figures 9.7 and 9.8 show the selectivities for
dimerisation and metathesis for the potassium and sodium bronzes
respectively as a function of the alkali ion content.
9.4 Conclusions
Oimerisation of propene has been found to be dominant over W03 and metathesis over Re03. W03 is a semiconductor oxide and Re03 is
electrically metallic. In the present study it was intended to see
whether the selectivity of the reaction changes with increase in alkali
metal ion concentration in the sodium and potassium bronzes, AxW03,
,where A = Na or K and 0.05 ~ x ~ 0.8, since it has been found that
there is a change from semiconductor to metallic properties as x in
creases in either series of bronze (see Chapter 7). The reaction of
.propene over unsupported catalysts is characterised by small turnover
numbers, oxygen vacancy dependencies and stereoselectivity of but-2-
enes(7,12). The sodium and potassium bronzes with x = 0.05 produce
approximately equal amounts of metathesis and dimerisation products
with a slightly higher selectivity toward dimerisation. These bronzes

0.8
0.6
Si
0.4
0.2
• Metathesis
~ Dimeri sation
0.0 0.1 0.2 0.3 0.4 0.5 0.6 0.7 0.8 x in KxW03
Figure 9.7 Selectivity, (Si)' for dimerisation and metathesis versus x in
KxW03

S· 1
0.8
0.6
0.4
0.2
• metathesis
)( dimerisation
x in NaxW03 0.0 0.1 0.2 0.3 0.4 0.5 0.6 0.7 0.8
Figure 9.8 Selectivity, (Si), for dimerisation and metathesis versus x in
Nax~103

- 149 -
have semiconductor properties and perhaps would have been expected to
show a much higher selectivity for dimerisation. One of the possible
explanations for the formation of metathesis products could be the
high temperature used (673K) to enable a reliable activity measurement
to be obtained. However, at such a temperature the reduction of the
bronzes by propene was not appreciable since no weight loss was observed
when the samples were heated in propene to 723K in tga experiments.
It has been reported that reduction of oxides is very effective to
enhance metathesis and to suppress dimerisation. However, for the
present bronzes, activity measurements performed after exposing the
bronzes to propene for over 65 min showed no significant change in
product·distribution. For bronzes with x > 0.05, both metathesis and
dimerisation products were observed and in no case was complete
selectivity for either metathesis or dimerisation obtained. However,
an increase in selectivity for metathesis was observed when x = 0.2 for
both sodium and potassium bronzes, and in all other samples the select
ivity for metathesis was much higher than with x = 0.05. The meta
thesis activity was slightly enhanced with increase in x as seen from
Tables 9.1 and 9.2. As can be seen, C6H12 is appreciable even when
the metathesis reaction is expected to be solely active. On these
samples small amounts of pentenes were also observed. They may be
produced by co-dimerisation of the metathesis products assuming react
ions such as
C4 He + C2 H4 .. C6 H12 ,
C4 He + C4 He ~ C2 H4 + C6 Hl2
The cis/trans ratio of but-2~ene is given as a function of x in Table
9.6. As shown, the ratio appears to increase with x for either series

- 150 -
of bronze. This ratio has often been used as an indication of the
stereoselectivity of the reaction, and for the characterisation of the
reaction centre. For a rhenium/alumina catalyst Lin et al(5) found
that the cis/trans ratio of but-2-ene becomes smaller as the anion
vacancies increased. Davie et al(13) reported that cis- but-2-ene
was sometimes produced more than the trans isomer initially from C3H6
when a supported molybdenum hexacarbonyl catalyst was used. Basset
et al(14) found that the cis/trans ratio of C4 Ha from cis-2-C5 H10 is larger using a supported catalyst than using a homogeneous one.
Katz and McGinnis(15) explained the stereoselectivity by the metal
carbene model and Leconte and Basset(8) explained it in more detail
by taking into account the various static interactions among sub-
stituents in the metallocyclobutane transition state.
Table 9.6 Cis/trans Ratio of but-2-ene obtained for
Sam~le Cis/trans ratio
W03 1. 31
O.05KW 1. 59
O.2KW 1. 38
O.3KW 1. 92
O.6KW 2.23
0.8KW 2.51
0.05NaW 1.68
O.2NaW 1.34
O.3NaW 1.65
O.6NaW 1.84
O.8NaW 2.23

- 151 -
CHAPTER 9
REFERENCES
1. R.L. Banks and G.C. Bailey, Ind. Eng. Chern. Prod. Res. Dev., 1, 170, (1964).
2. R.L. Banks, Chemtech., ~, 494, (1979).
3. N. Calderon, H.Y Chen and K.W. Scott, Tetrahedron Lett., 34, 3327,
(1967) .
4. R.L. Banks, In 'Catalysis' Spec. Period. Rep., i, 100, (C. Kemba11 ed),
Chemical Society, London, (1981).
5. C.J. Lin, A.W. A1dag and A. Clark, J. Catal., 45, 287, (1976).
6. X. Xiaoding, C. Boelhouwer, J.I. Benecke, D. Vonk, and J.C. Mol,
J. Chern. Soc. Faraday Trans. I, 82,1945, (1986).
7. N. Tsuda and A. Fujimori, J. Cata1., 69, 410, (1981).
8. M. Leconte and J.M. Basset, J. Am. Chern. Soc., 101,7296, (1979).
9. R.M. Edreva-Kardjieva and A.A. Andreev, J. Cata1., 97,321, (1986).
10. R. Thomas, J.A. Mou1jin, V.H. J. De Beer and J. Medema, J. Mol. Cata1.,
~, 161, ( 1980 ) .
11. N. Kasaka, Y. Sakai and N. Tsuda, J. Catal., 98, 95, (1986).
12. N. Tsuda, T. Mari and Y. Sakai, J. Mal.Catal., 28, 183, (1985).
13. E.S. Davie, D.A. Whan and C. Kemba11, J. Cata1., 24, 272, (1972).
14. J.M. Basset, J.L. Bi1hau, R. Martin and A. Thea1ier, J. Am. Chern.
Soc., 97,7376, (1975).
15. J.T. Katz and J. McGinnis, J. Am. Chern. Soc., 97, 1592, (1975).

- 152 -
CHAPTER 10
A SILICA-SUPPORTED BRONZE AND A COPPER BRONZE
10.1 Introduction
The tungsten bronzes have shown some interesting catalytic
properties such as in the decomposition of isopropanol, the metathesis
of propene and the electrochemical reduction of oxygen(l). A previous
study by the author(2), has demonstrated that potassium tungsten
bronzes can be prepared on an alumina support, and have shown activity
for ammonia synthesis. It was therefore interesting to investigate
if a potassium tungsten bronze in a highly dispersed state could also
be prepared on a silica support, and its activity compared with that
for the alumina-supported bronze (see Chapter 2). Bronzes prepared on
an inert support would have more surface active sites and hence could be
expected to be more active than the unsupported bronzes.
Copper containing catalysts are widely used in the methanol
synthesis and decomposition reactions and the water-gas-shift reaction.
There is much uncertainty as to the precise oxidation state of Cu in
these catalysts under reaction conditions(3), recent work however,(4)
has suggested that Cu in a positive oxidation state is involved in the
catalysis of these reactions. A copper containing bronze in which
the Cu will be intercalated in a high oxidation state, even under
reaction conditions, could be useful in determining the active sites
in methanol synthesis and the water-gas-shift reactions. However, a
Cu containing bronze is difficult to prepare by a thermal method due
to thermodynamic limitations at the high temperature required to over
come kinetics, hence the preparation of CUyKxW03 was attempted by an
ion-exchange method. (See Chapter 2). The two approaches to producing

- 153 -
bronze catalysts of higher activity have therefore been attempted and
and the results obtained are now described.
10.1.1 Supported Catalysts
A cata1ysed reaction usually occurs on certain specific active
sites at the surface, and it is therefore normally desirable to provide
as much surface area as possible. A widely-used procedure to achieve
a high surface area is to distribute the active component over the
surface of relatively-inert oxide particles of high porosity such as
alumina, silica, titania and activated charcoal supports. The
advantages of using supported catalysts in preference to unsupported
ones (e.g. Pt sols or blacks) have long been appreciated. The supp
ort facilitates the formation of extremely small metal particles
having a high proportion of surface atoms; the particles also have
remarkable thermal stability and the presence of the support allows the
incorporation of beneficial additives usually known as promoters.
Supports were long thought to be catalytically inert, except in the
special case of bifunctional platinum and alumina catalysts for petrol
eum reforming. Recently there has arisen evidence that in some systems
at least the support can exert a marked influence over the properties
of metal particles residing on it, in the form of strong metal support
interaction.
Previous studies(2) have shown that hexagonal potassium tung
sten bronzes supported on alumina have shown some catalytic activity
for the synthesis of ammonia from its molecular elements. In the
present study an hexagonal potassium tungsten bronze supported on
silica was prepared (see Chapter 2) and its catalytic activity for \
ammonia synthesis determined. Silica was chosen as the support to

- 154 -
investigate whether bronze formation is easier on its surface than on
the surface of alumina, (and hence whether the support had a more
positive role in defining catalytic activity).
10.1.2 Copper Catalysts
Copper is one of the most widely used base metals for catalytic
reactions. Two of the most common reactions where copper catalysts
are used are the water-gas-shift reaction and methanol synthesis.
Recently there has been a renaissance of interest concerning copper
catalysis of water-gas-shift, methanol synthesis and methanol decomp-
osition reactions and the role of promoters. However, there is much
uncertainty as to the precise oxidation state of the active copper
phase under reaction conditions(3) and the symmetry of the surface
copper sites and how this is affected by precursor states(5,6). For
methanol synthesis from CO (and its decomposition) Cu is more active
when supported on ZnO than on titania(7);this is also true for the
water-gas-shift reaction. Sermon et al(4) have recently shown that
copper in Cu FexCr2_x04 spinels is as active as Cu/ZnO in the afore
mentioned reactions under conditions where it would not have been
reduced as significantly as Cu/ZnO. Maximum activity was shown in
these spinels at intermediate composition when Cu in a positive oxida
tion state may be close in adjacent octahedral and tetrahedral sites.
It was assumed that Cu in a positive oxidation state can be involved in
the catalysis of these reactions and catalysts where Cu (II) is highly
dispersed in constraining lattices may be useful.
In the present study a sample was prepared whereby K+ ions in
a bronze were ion-exchanged with cupric ions from solution in order t~
insert cupric ions in the bronze. The sample was tested for its
activity in methanol synthesis and the water-gas-shift reaction. N20

- 155 -
decomposition was attempted in order to evaluate the copper surface area.
10.1.3 Catalysed Reactions
Reactions which could be catalysed by the bronze phases des
cribed above were used; in a sense such catalysed reactions were
capable of probing the local chemistry prevailing at these non-stoich
iometric surfaces in a manner not possible by other methods. In
addition, one adsorptive-decomposition (N20) was also used. These
are individually reviewed briefly now.
(i) The Water-Gas-Shift Reaction
The water gas shift (WGS) reaction is a reversible, exothermic
chemical reaction of considerable industrial importance and is the
reaction of water and carbon monoxide to produce carbon dioxide and
hydrogen:-
-::+ -1 CO + H2 ~ CO2 + H2 ~H298K = -40.6kJmo1 . . . . . • . . . . .. 10. 1
The WGS process is most frequently used in conjunction with the prod
uction of hydrogen via the steam reforming of hydrocarbons:-
CnHm + nH20 .... nCO + (n+ m/2) H2 · ........... 10.2
CO + H2O 4 ~ CO2 + H2 · ........... 10.3
CO + 3H2 • • CH4 + H2O · ........... 10.4
Reaction (10.2), under steam-reforming conditions is cons i dered .
irreversible and essentially complete. Normally reactions (10.3) and
(10.4) at the exit of the steam-reforming reaction are nearly at equil
ibrium. The high temperature in the reformer favours H2 production by
shifting the equilibrium of reaction (10.4) far to the left. The

- 156 -
effluent from the steam reformer is then passed to a series of WGS
reactors operated at lower temperatures in order to shift the equil
ibrium of reaction (10.3) to the right. Many materials are capable
of catalysing the WGS reaction. Moe(S) gives a good discussion of
potential shift catalyst systems. Two classes of materials are
almost exclusively used in industry as shift catalysts: the iron-based cata
lysts and the copper based catalysts. The iron-based catalysts are
the so-called high-temperature shift catalysts, operating from about
593K - 723K(9). These materials are an example of some of the
earliest heterogeneous catalysts used industrially. Copper-base shift
catalysts are a more recent development which has now gained wide
industrial acceptance. These are the so-called low-temperature shift
catalysts operating from about.473K - 523K. These catalysts show
good activity at low temperatures and are therefore attractive since
equilibrium is more favourable at lower temperatures(lO). Although
many mecha~istic studies of the water-gas-shift reaction on iron-
based catalysts have been made, there is still considerable dispute
in this area. This concerns whether the correct mechanism is the
oxidation-reduction mechanism proposed by Temkin et al(11,12) or the
mechanism employing stoichiometric numbers proposed by Oki et al(13-l6)
A review by Newsome(17) covers both possible mechanisms in detail and
concludes that the mechanisms suggested by Oki and associates(13-l6)
are theoretically possible while that proposed by Temkin et al{11,12)
is not plausible for the shift reaction over iron-based catalysts.
Since low-temperature shift catalysts, are relatively new, the mechan
ism of the shift reaction on these copper-based catalysts have not
been stu~ied nearly as extensively as with the high-temperature iron
based catalyst systems. Yur'eva et al{lS) offered the fot~owing
mechanism, where the reaction takes place through an active complex on
the surface, including both CO and H20, and where the third step is the

- 157 -
rate-determing step:
co COads
COads + H20ads ~ CO2 + H2 ads ads
CO 2gas
H 2gas
In the present study the CUyKxW03 system was studied for its activity
in the water-gas-shift reaction.
(ii) Methanol Synthesis
Methanol synthesis is a process of major industrial importance
consisting of hydrogenation of carbon monoxide or of carbon dioxide
according to the equations;
and
-1 ~H600K= -lOO.46kJmol
Methanol synthesis from carbon monoxide formally consists of an attach
ment of three hydrogen atoms onto the carbon end and of one hydrogen
atom onto the oxygen end of the CO molecule without the cleavage of
the carbon-oxygen bond. The two bonding rr-orbitals of carbon mono-
* oxide, the lone pair (5a ) orbital of carbon, and the a orbitals of
two hydrogen molecules are utilised to make three C-H sigma bonds,
one O-H sigma bond, and one additional lone pair orbital on the oxygen
atom, schematically;
H H - H
I Ie -- 01 H
H
H-'t-a-H /
H
- 158 -
The carbon-oxygen sigma (30) and the lone-pair oxygen (40) orbitals
remains intact except for a change in electron repulsion. These
features of the reaction impose the following requirements on the
catalyst:
(a) The catalyst must not cleave the carbon-oxygen sigma bond.
(b) The catalyst must activate the carbon monoxide molecule so
that hydrogenation can occur on both ends of the molecule.
(c) The catalyst must be a fairly good hydrogenation catalyst which
activates hydrogen molecules in a manner suitable for the
above reaction.
Good "metallic" catalysts for methanol synthesis have been known for a
long time(19,20). They are based on copper and combinations of various
oxides, (e.g. ZnO, A1 203 and ;Cr203). A recently studied catalyst is
the copper-thoria, (CU/Th02)(21), system which shows good selectivity
for methanol but not as high as that of the. Cu/ZnO catalyst. Among
the transition metals various forms of Pd, Pt, Ir and Rh have been
reported active in methanol synthesis(22-24). In the present study
the CUyKX
W03 sample was studied for its activity in methanol synthesis,
because of the ability of the constraining host lattice to keep the
copper in a high oxidation state.
(iii) Ammonla Synthesis
The fixation of atmospheric nitrogen in the form of ammonia is
one of the foundations of the modern chemi~a1 industry. From 1820 to
1900 many futile attempts were made to use platinum and various other
substances to catalyse the exothermic synthesis reaction;
At the beginning of this century a promoted iron catalyst with the

- 159 -
addition or substitution of other promoters was eventually developed
and is still the catalyst universally used today.
Several "new" ammonia synthesis catalysts have been claimed,
reported and patented. The addition of cobalt and ruthenium to the
currently used iron catalyst has attracted considerable attention.
The use of carbon- and alumina- supported ruthenium catalysts has also
been extensively studied(25-27). Ruthenium supported on silica gel or
alumina shows catalytic behaviour for the ammonia synthesis reaction
similar to that exhibited by ruthenium-carbon catalysts(28). Recent
studies indicate a very good possibility of producing a new catalyst
that would have perhaps twice the activity of today's commercial cata
lyst(29). A number of metallic catalysts have been examined for their
activity in amonia synthesis. In a review by r"'ittasch(30), the
relative efficiencies of pure metals as catalysts for ammonia synthesis
under lOMPa at 823K were given long ago, these are shown in Figure 10.1
as a plot of percent ammonia in the exit gas against the parameter,
(-6H~), for the heat of chemisorption. It is obvious that osmium and
iron are the most effective metals under these conditions.
Os F~ z.o r" -...: !.. 1.5
"" :x: Ru z 1.0 • Mn
~, ;0 •
0.5 W\
0 • zoo 400 600 800
-6H: (k](moC metal atom.- I )
Figure 10.1 The ammonia synt~es;s capacities of metals
as a function of the heat of chemisorption
of nitrogen.

- 160 -
Although tungsten shows a low catalytic activity as a result of its
high strength of nitrogen chemisorption, this could be enhanced by the
presence of potassium and controlled by raising the tungsten to a
higher oxidation state. Recently Ozaki(25) has developed a catalyst
system promoted by metallic potassium. In the present study a silica
supported potassium tungsten bronze was studied for its activity in
ammonia. synthesis (in the light of the author's earlier results, see
Appendix 1), with specific comparison with activities of a1umina
supported potassium tungsten bronzes prepared previously(2).
(iv) ~20 Decomposition
Traditionally, metal surface areas have been determined by
chemisorption of a suitable adsorbate. Both carbon monoxide and hydro
gen have been used to measure copper surface areas although neither
adsorbate is thought to provide accurate results(31). The reaction
of nitrous oxide has been used to measure metal surface areas for both
pure and supported copper catalysts(32-35). The methods are based on
the decomposition of a nitrous oxide molecule on a copper surface which
is accompanied by the liberation of one nitrogen molecule according to:-
10.5
where the subscript s signifies surface atoms. Previous investigations
have differed in the experimental methods and reaction conditions used
to measure the extent of reaction (10). Osinga et al(33) adopted the
method of Dell et al(32) in which nitrogen formed by reaction (10.5)
was determined by freezing out the excess of N20 and measuring the
residual nitrogen pressure in a conventional volumetric adsorption
apparatus. Scholten(34) used both microcatharometric and mass spectro
scopic methods to determine the gas composition in a vacuum apparatus
in which reaction gases were recycled. In the present study the

- 161 -
copper surface area in CUyKxW03 was determined using a volumetric
adsorption apparatus,and a Cu/O atomic adsorption stoichiometry of
2:1 was assumed. It was judged" that the 'equiva1ent' copper surface
area would contain 1.4 x 10¹⁹ Cu atoms per m2.
10.2 Experimental Procedures
10.2.1 Physical Characterisation of Si02 Supported Bronze
and CU:y~xW03-
The different physical methods of characterising catalysts
described in the previous chapters were used to study the Si02 supported sample and the ion exchange sample. Tpr (see Chapter 4)
was used to investigate the reduction of the potassium poly tungstate
on Si02, to determine the temperature at which a bronze is formed and
give information on the nature of the bronze; tpr was also used to
investigate the reducibility of Cu K W03 and whether copper has any y x
effect on the reduction temperature of the bronze. The structures
of the two bronzes were analysed by XRD, (see Chapter 5). Xps, (see
Chapter 6), revealed their compositions and whether there was any
surface enrichment.
10.2.2 Water-Gas-Shift Reaction
Rates of conversion in the water-gas-shift reaction,
were measured in a silica reactor with samples (0.59) of CUyKxW03 which
were first reduced in 6% H2 in N2 (40cm3min-1, 101kPa) during heating
at 4K min-1 from ambient to 623K, at which temperature the sample was
held for 15 min. The sample was then cooled in a flowing N2 stream
t40cm3min-1, 101kPa) to the reaction temperature 523K ± 2K which was
achieved in an electric furnace (VB35; Stanton Redcroft; controlled by

- 162 -
Eurotherm 810 : Thermal Designs Ltd.). After flushing at this temper
ature 2.5% CO/N2 (lOlkPa) was introduced at a constant flow rate
(20cm3min- l ) after it had been saturated with water vapour (2.4kPa;
293K) t~rough the catalyst at 523K and the product stream was analysed
at 5 min intervals on a gas chromatograph (Perkin Elmer Sigma 4; TCD
detector; poropak Q column at 303K). The g.c. was calibrated by
injecting a fixed volume of H2 and the method to calculate conversions
is the same as described previously for other g.c. techniques (e.g.
see isopropanol decomposition, Chapter 8).
10.2.3 Methanol Synthesis
The activity and selectivity of sample CUyKxW03 in the synthesis
of methanol from carbon monoxide and hydrogen was studied at moderate
pressure in an experimental rig constructed of stainless steel. The
sample (0.5g) was packed in the reactor and reduced in a mixture of
6% H2 in N2 (BOC 99.99% pure, 40cm3min- l ) as the temperature of the
sample bed was raised at 5Kmin- l from 293K to 623K, at which upper
temperatures it was held for 5-10 min before cooling to room temperature.
Synthesis gas of 33% C0/67% H2 (BOC 99.99% pure) was then introduced
(180cm3min- l ) through the sample and the pressure in the reactor was
increased to 1.723MPa. The sample wa~ then heated at <lOKmin- l to
573K and the isothermal reaction rate measurements commenced. Samples
of the gaseous products were analysed by gas chromatography (Perkin
Elmer 8410 with an FlO detector and a column: 5% Carbowax on chromo-
sorb WA WH MDS) at 443K. The concentrations of methane and methanol
as the major products were monitored as a function of time until the
reaction reached a steady-state.
was then used in calculation •.
This steady-state rate of reaction
, :
Blank measurements were also carried out with an empty reactor contain
ing a bed of alumina under identical conditions: this showed no

- 163 -
significant activity in CO hydrogenation when used in place of the
sample and so it was judged that the following equilibria(36) could
CO - CO
Fe(steel) .... ~t---. Fe(CO)5 Fe(sample)
303K 573K
LogK = -0.3 10gK = +14.2
not have transferred atomically-dispersed Fe to the sample in significant
quantities. Thus, there was thought to be no need to protect the
sample with a replaceable guard-column of alumina held at 573K to
collect any traces of Fe and prevent these reaching the downstream
sample.
10.2.4 Ammonia Synthesis
The activity of the silica supported sample in cata1ysing the
synthesis of ammonia was measured using a silica flow reactor at 101kPa
with the sample held in a furnace (Stanton Redcroft C1/Pt13/CL) to
within ± 5K of the set temperature. The product stream passed through
20cm3 of de-ionised water (obtained by passing distilled water through
a Duo1ite ion-exchange column) whose conductivity could be monitored
continuously (Fissons PTl-18). The sample (0.5g) was flushed with Ar
(99.9% purity; BOC) for 15 min and the H2 (99.95% purity; BOC) at
ambient temperature and also as the sample temperature was raised to
773K at 10K per min and then held for 2h. Subsequently, the hydro
gen was replaced by flowing argon and the sample cooled to ambient
temperat~re. During the pretreatment the conductivity detector gave
a constant reading. The reactant stream of 75% hydrogen in nitrogen
(99.9% purity; BOC; prepurified by oxygen and water vapour removal)
was introduced at 40cm3min- 1. The sample temperature was then increased

- 164 -
to various temperatures and conductivity vs. time measurements were
taken under isothermal conditions. The error in the assessment of
the quantity of ammonia formed was ±3nmol.
10.2.5 ~20 Decomposition
N20 decomposition(37) was used to determine the equivalent
Cu surface area in CUyKxW03, in a volumetric apparatus with a Bell and
Howell transducer (BHL-270). The sample (1.0g) was reduced in-situ
at 623K in 6% H2 in N2 (40cm3min-1) and then cooled to 473K at which
temperature it was evacuated. After cooling at ambient temperature
N20 was admitted at 5.3kPa and after 30 min unreacted N20 was
removed from the gas phase at 78K and the residual pressure of N2 was
determined. It was assumed that there were 1.41 x 10¹⁹ Cu atoms per
m2 (i.e. that each Cu atom occupies 0.071nm2) and that the Cu/O atomic
adsorption stoichiometry was 2:1.
10.3 Results
10.3.1 Si02 Supported Sample
10.3.1.1 Tpr
The reducibility of the supported potassium poly tungstate formed
by impregnating the Si02 support with a solution of potassium tungstate
at pH 4 was studied by tpr. Figure 10.2 shows the relevant tpr pro
file which shows at least two overlapping consumption peaks in the
temperature range 673K to l273K. The first process starts at 673K
with a maximum at about 773K, the hydrogen consumed in this process is
0.146mmo1g-1 sample. The second process occurs in the temperature
range 873 - 1273K with twin maxima at 1033K and ll13K. The total H2
consumed in the i second prbcess is 1.82 lTITlo1g-1 sample. It" appears
that the first process corresponds to the reduction of the poly tungstate

- 165 -
to a tungsten bronze according to the equation:-
This process requires a H2 consumption of 0.177mmolg- l sample, (for a
loading of 30% w/w tungsten metal), which agrees well with the observed
value. The temperature range at which the second process occurs,
corresponds to the temperature of reduction of the unsupported bronze,
0.3KW, to K2W04 and W, (i.e. 850 - 1273K; Tmax at 1143K; H2 consumption
11.79mmolg-l sample; see Fig. 10.2 and Chapter 4. However, for the
supported bronze this process shows two maxima unlike the unsupported
bronze. Most probably there is a highly dispersed bronze present
which reduces more easily and the second maximum could then correspond
to reduction of larger supported crystallites. On this basis, if a
bronze is to be formed from the supported poly tungstate, a reduction
temperature ~ 873K must be used. In the present study a temperature
of 773K was selected for the reduction of the S;02 supported poly
tungstate in 6% H2/94% N2, (40cm3min-', 2h).
10.3.1.2 Xrd
The bronze formed by the reduction of the Si02 supported poly
tungstate at 773K for 2h in 6% H2/94% N2 (40cm3min- l ) was analysed by
xrd. The diffraction lines due to the Si02 support were first
eliminated before determining the structure of the bronze. The d values
calculated from the diffractogram due to the bronze are given in Table
10.1. These values correspond well to a bronze with an hexagonal
structure having cell parameters ao = 0.734nm and Co = 0.752nm, and
with x having a value of 0.33. The xrd study clearly indicates that
a bronze has been formed by the reduction of the Si02-supported poly
tungstate.

N M 0 r--. .,... c:r (/') .....
:3 ....... . ,;' ~ :3 ~ N ~ ,,' . 0 . ~. 0 M
" . ~ ,,' ,
M ",' ~ ,..... . ,. " N " ..... N - -- 0
Vl .......
c:r 0
M :3: ,..... N 0 ~ ... ..... -.... :3: ... .... ~
0 M
-C c::: 10
M ,..... ~ CO N . 0
4-e Vl C1J
M ..... ,..... .,... \0 4-
e So. c.. s.. c.. I-
M ,..... N c:r 0 ,.... Q) So. ::s O'l ....
u..

- 166 -
Table 10.1
X-ray Diffraction of Silica Supported
Bronze
9 d/nm hk1
6.90 0.641 100
11.85 0.375 002
13.95 0.319 102
14.15 0.315 200
17.05 0.263 112
18.45 0.243 202
19.95 0.226 211
20.25 0.222 300
21.90 0.206 113
24.40 0.186 004
24.65 0.184 302
25.10 0.182 220
27.65 0.166 222
28.40 0.162 204
28.75 0.160 312
10.3.1.3 ~
Xps analysis was carried out on both the unreduced silica
supported sample and the reduced sample (see sub-section 10.3.1.1).
For the case of tungsten the spectrum of the 4f electrons was studied
in both samples. The measured binding energy for the 4f7/2 line of
the unreduced supported sample (36.2eV) is close to the value obtain
ed for W03 (36.0ev) indicating that tungsten is largely p~es~nt in the
+6 oxidation state. The 4f7/2 line for the reduced supported sample

- 167 -
occurred at 35.6eV similar to the values obtained for the unsupported
potassium and sodium tungsten bronzes (see Chapter 6). This decrease
in binding energy suggests a decrease in the oxidation state of tung
sten from +6 to about +5 after reduction of the supported sample.
The xps study also points to the formation of a bronze and little
interaction between the tungsten species and Si02 since the binding
energy of the W4f electrons of the supported and unsupported bronze
agrees well.
10.3.1.4 Activity of the Supported Bronze for Ammonia Synthesis
The catalytic measurements for ammonia formation were carried
out on the supported bronze. The rate and extent of ammonia prod
uction during each catalytic run was estimated from the change in
aqueous conductivity in the detector cell using the calibration curve
shown in Figure 10-3. The activity measurement was carried out for
at least three different temperatures, 520K, 570K and 620K. At each
different temperature the amount of ammonia formed was measured as a
function of time and the rate of ammonia formation was estimated from
the total amount of ammonia produced over a period of 35 min. Table
10.2 shows the rate of ammonia formation at the three different temper-
atures.
Table 10.2
Rate of Ammonia Formation
Temp. /K Rate/nmo1g- lmin- l
520 2.32 x 10⁻³
570 9.14 x_~O -3
: 17.70 x 10⁻³ , 620 :

r- 0.14 0 e ;::I.
~ 0.12 0 .r-+> ::l r-0 ~-O.10 CIl
~ .r-
+> ~ 0.08 QJ CIl QJ S-o. m 0.06 .,.... ~
i E 0.04 m
0.02
0.2 0.4 0.6 0.8 1.0 1.2
conductivity/~Scm-1
Figure 10.3 Calibration plot concentration of ammonia in solution versus
conductivity

- 168 -
The rates given in Table 10.2 were used to estimate the activation
energy for the synthesis process. The Arrhenius plot is shown in
Figure 10.4 and the calculated activation energy is 53.2kJmol- l .
The rate of ammonia formation for the Si02 supported bronze is
much smaller than those observed on the A1 203 supported bronzes(2),
but it must be noted that a much higher tungsten 10ading,(30%), was
used. Indeed, it was observed that for the A1 203 supported bronzes(2),
the rate of ammonia synthesis decreases when the metal loading exceeds
5%. The bronze formed on the A1 203 support containing 10% tungsten
metal has an activity for ammonia synthesis of 0.69nmo1g-1min-1 at
773K compared to that of the present Si02 supported bronze which has an
activity of 17.7 x 10⁻³nmo1g- 1min-1 at 620K. The activation energy
value, (Ea), is also higher than those observed on the A1 203 -
supported bronzes (14-20kJmo1-1).
Either the sites on the Si02-supported bronze are not as active
as those on the A1 203 supported bronzes or there are far fewer of them.
Since the activity of the silica-supported bronze in this reaction was
so low no further consideration was given to other loadings.
10.3.2 CUy.Kx~3-
10.3.2.1 Tpr
The tpr profile of sample CUyKxW03 is shown in Figure 10.5 and
is similar to that obtained for sample 0.2KW (see Chapter 4). Reduction
occurred in one step in the temperature range 845K - 1320K with a total
hydrogen consumption (11.70mmolg-1 sample), which is in good agreement
with that. obtained for the reducti.on of 0.2~W (11.79mmolg- l sample) . . No peak was observed for the reduction of the copper species present,

-2.0
lnr
-4.0
-6.0
1.40 1.60 1.80 2.0 1 x 10³
T

- 169 -
however, this may be due to the sensitivity of the equipment and the
relatively low copper content present. The profile also indicates that
the copper species has no effect on the reduction of the bronze.
10.3.2.2 Xrd
The copper sample obtained by ion-exchange of KO.2W03 with
CuC1 2 was characterised by xrd. The d values calculated from the
diffractogram of the sample are given in Table 10.3. These d values
differ slightly from those obtained for KO•2W03 (see Table 5.3,
Chapter 5). There were a few "new" peaks observed that do not corres-
pond to any copper salt either in the +1 or +2 oxidation state. It
is most probable that a homogeneous compound in which copper ions have
been inserted in the potassium bronze has been formed with the removal
of some potassium ions.
10.3.2.3 ~
The ion-exchange sample, CUyKX
W03, was studied by xps. The
binding energies calculated from the spectra for the peaks due to the
various elements are given in Table 10.4. In the case of tungsten
the 4f electrons were studied, and for copper the binding energy of
the 2p peaks was used. The measured binding energy for the W4f7/2
line was found to be 35.3eV, which is slightly different to that found
for KO. 2W03, (35.geV, see Chapter 6), i~dicating no change in the
oxidation state of tungsten (about +5), and possibly due to interaction
with copper ions. The spectrum for the Cu2p peaks is shown in Figure
10.6. There is a slight indication of the presence of satellite peaks
suggesting that copper could be present in the +2 oxidation state. A
quantitative estimation of the relative ratio of tungsten to potassium,
and tungsten to copper in the bronze was attempted. This was done by

- 170 -
Table 10.3
.;.;.X -.....;,.r...;;:,aYt-..;;.D.....;,.if.....;,.f.....;,.ra;;,.;:c....:..t '..:...;:' o;,.;,;.n....,;o:...:.,f_C:,::U:y Kx_WO 3-
9 Sine d/nm
6.945 0.121 0.637
11 .900 0.206 0.373
12.060 0.209 0.368
13.035 0.226 0.341
13.465 0.233 0.331
13.950 0.241 0.319
17.035 0.293 0.263
18.455 0.317 0.243
19.565 0.335 0.230
20.209 0.345 0.223
24.300 0.412 0.187
24.655 0.417 0.185
27.745 0.466 0.165
28.495 0.477 0.161
28.815 0.482 0.160

Element Signal
C1s
01s
W4fS/ 2
W4f7/ 2
W4d3/2
W4d7/ 2
K2P1/2
K2P3/ 2
CU2P1/2
Cu2P3/2
- 171 -
Table 10.4
X-ray Photoelectron Spectroscopy
CU:y~xW03-
Observed Corrected Binding Binding Energy eV Energy eV
292.5 284.6
536.1 528.2
4S.7 37.8
43.2 35.3
267.7 259.8
255.2 247.3
302.2 294.3
299.1 291.2
960.8 952.9
940.5 932.6
Observed Shift
eV
9.80
4.65
4.30
1.20
0.70
4.70
4.80
5.10
5.40

-> QJ ->, ~ ~ QJ c:
0 QJ Lt') Lt') U
N .,.. '- .+J M QJ
C. c: N .,.. ~ ~
U
0 M Lt')
M 0 ~
X ~
>, ~
U
4-0
0 N VI Lt') C.
x
~ . 0 -~ ~ ~ .,..
1.1..

- 172 -
comparing the peaks areas of the W4d and K2p and Cu2p peaks by the
method described in Chapter 6. The relative peak intensities, the
sensitivity factors used, and the calculated ratios are given in Table
10.5. Xps studies on KO.2W03 (see Chapter 6) have shown a K : W ratio
of 0.238 : 1 whereas on the ion-exchange sample this ratio has
decreased to 0.130 : 1, indicating that about 45% of the potassium ions
Element
K2p
Cu2p
W4d
Sensitivity Factor
1.468
3.043
6.370
Table 10.5
Peak Area
21.6
21.36
720.0
Peak Area Relative ~.F'. Ratio
14.71 0.130
7.02 0.062
113.03 1.000
has been removed by the ion-exchange process. A study by atomic
adsorption (see Chapter 2) of the aliquot obtained after the ion-exchange
process has also shown the removal of about 45% of the potassium ions
present. The bronze obtained by ion-exchange of KO.2W0 3 with CuC1 2
most probably has an empirical formula of (CuO.062KO.130W03)n.
10.3.2.4 ~20 Decomposition
The copper surface area present in the ion-exchange sample,
The residual N2
pressure, after exposing the sample to N20 at a certain pressure and
removing the unreacted N20, was used to estimate the copper surface
area using the gas law PV E = nRT, where VE is the equilibrium volume.
For each mole of N2 in the gas phase there must be an equivalent number
of moles of oxygen atoms which have chemisorbed on the copper surfaces.
It was assumed that there were 1.41 x 10¹⁹ Cu atoms per m2, (i .e. that
each Cu at~m ~'ccupies 0.071nm2) and that It~e' Cu/O atomic adsorption
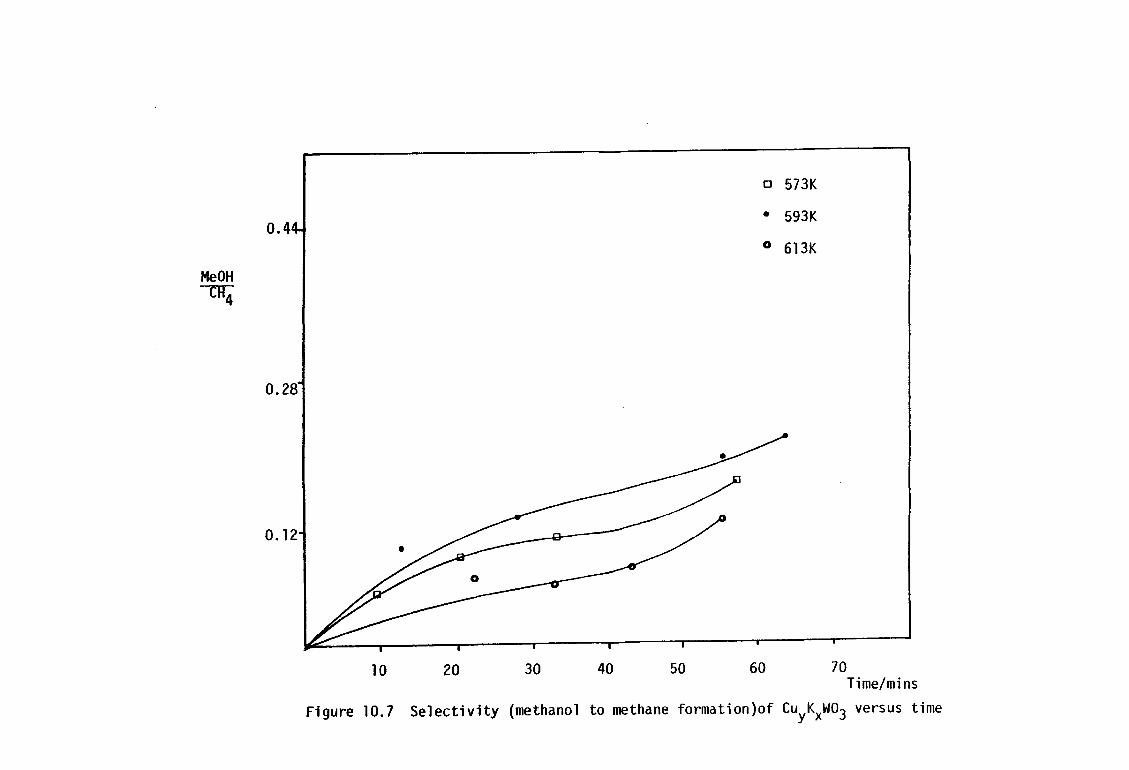
o 573K
• 593K 0.4 o 613K
MeOH ---clI4
0.28
O. 12
10 20 30 40 50 60 70 Time/mins
Figure 10.7 Selectivity (methanol to methane formation)of CUyKxWOJ versus time

c .-E " ~ E ~
~ ~ ~ ~ ~ ~ C) ~ en ... 00 ~ wn wn ~ E .-
~ D •
~ ~
C) ~ ~ ~
~ > ~
C) 3
C) x ~ ~
~ ~ ~
~ 0
C) ~ wn
~ .-~ ~ J: ~
C) C ~ ~
~
... 0 C ~
C) ~ ~ ~
~ ~ 0
C) ~ ~ ~
~ ~
00 C) ... 0 ...
~ ~ en .-~
i.
- 173 -
stoichiometry was 2 : 1. The calculation for the Cu surface area is
given in Appendix 4. The total number of surface copper atoms per gram
of sample was found to be 5.36 x 10¹⁸ , giving a percentage copper dis
persion of 3.4%, if the empirical formula of the compound ;s taken as
CUO.062KO.13W03. This indicates that most of the Cu atoms must have
entered the lattice of the bronze to form a homogeneous compound and
are not available for surface reaction. The copper surface area
calculated from this dispersion ;s 0.38m2g- 1 sample.
10.3.2.5 Methanol Synthesis and the Water-Gas-Shift Reaction
The catalytic measurements in the synthesis of methanol from
carbon monoxide and hydrogen was studied on the ior.-exchanged sample
CUyKXW03. The activity measurements were carried out at three temper
atures; 573K, 593K and 613K. The production of both methanol and
methane was observed on the sample at these three temperatures.
Figure 10.7 shows a plot of the selectivity, (the ratio.of methanol to
methane formation), of CUyKxW03 towards methanol and methane product
ion against time. At all three temperatures the sample has a higher
selectivity for methane than methanol, with methane formation being
slightly more favoured at the highest temperature (6l3K). However,
the selectivity for methanol at each temperature tends to increase with
time, due to a d~op in activity for methane formation, and an increase
in activity for methanol synthesis. Figure 10.8 illustrates the rate
of methanol synthesis with time, at the three reaction temperatures.
Clearly the rate of methanol production increases with increasing temp
erature and a steady-state value is reached after about 60 mins. Table
10.6 gives the steady-state activity and selectivity for methanol syn
thesis of sample CUyKxW03 together with the turnover numbers calculated
assuming a copper surface area of 0.38m2g-1 sample as determined by N20
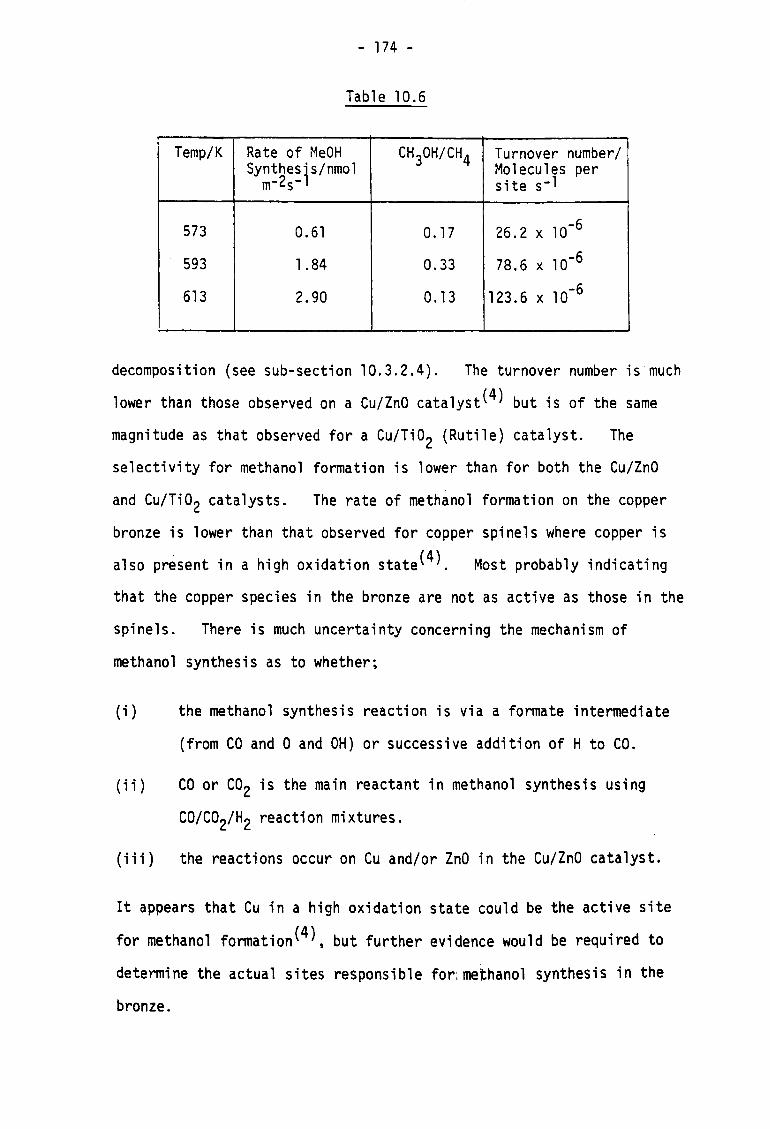
- 174 -
Table 10.6
Temp/K Rate of ~~eOH CH 3OH/CH4 Turnover number/ Synthesis/nmol Molecules per
m- 2s-1 site s-l
573 0.61 0.17 26.2 x 10 -6
593 1.84 0.33 78.6 x 10⁻⁶
613 2.90 0.13 123.6 x 10⁻⁶
decomposition (see sUb-section 10.3.2.4). The turnover number is much
lower than those observed on a Cu/ZnO cata1yst(4) but is of the same
magnitude as that observed for a Cu/Ti02 (Rutile) catalyst. The
selectivity for methanol formation is lower than for both the Cu/ZnO
and Cu/Ti02 catalysts. The rate of methanol formation on the copper
bronze is lower than that observed for copper spinels where copper is
also present in a high oxidation state(4). Most probably indicating
that the copper species in the bronze are not as active as those in the
spinels. There is much uncertainty concerning the mechanism of
methanol synthesis as to whether;
(i) the methanol synthesis reaction is via a formate intermediate
(from CO and 0 and OH) or successive addition of H to CO.
(ii) CO or CO2 is the main reactant in methanol synthesis using
CO/C02/H2 reaction mixtures.
(iii) the reactions occur on Cu and/or ZnO in the Cu/ZnO catalyst.
It appears that Cu in a high oxidation state could be the active site
for methanol formation(4) t but further evidence would be required to
determine the actual sites responsible for:.me~hanol synthesis in the
bronze.

- 175 -
Although the copper bronze shows some activity for methanol
synthesis, no activity was observed in the water-gas-shift reaction up
to a temperature of 723K.

- 176 -
CHAPTER 10
REFERENCES
1. J. McHardy, J.O'M. Bockris, "From E1ectrocata1ysis to Fuel Cells",
G. Sandstede, Ed., 109, University of Washington Press, Seattle
and London, 1972.
2. S. Stevenson, M. Phil. Thesis, Brune1 University, 1985.
3. G.C. Chinchen and K.C. Waugh, J. Cata1., 97, 280, (1986); T.H. F1eioch
and R.I. Mievi11e, J. Cata1., 97, 284, (1986); G.C. Chinchen, K.C.
Waugh and D.A. Whan, App1d. Cata1., ~, 101, (1986).
4. M.S.W. Vong, P.A. Sermon, M.A. Yates, A. Perryman and P. Reyes,
Unpublished Work.
5. P.A. Sermon, K. Rollins, P. Reyes, S.A. Lawrence, M.A.M. Luengo and
M.J. Davies, J. Chern. Soc. Far. Trans. I, 83,1347, (1987).
6. R.H. Hoppener, E.S.M. Doesburg and J.J. F. Scholten, App1d. Cata1.,
25, 109, (1986); J. Cunningham, G.H. A1. Sayyed, J.A. Cronin, C. Healy
and W. Hirschwa1d, App1d. Cata1., 25, 129, (1986).
7. E.M. Calverley and R.B. Anderson, J. Cata1., 104, 434, (1987).
8. J.M. Moe, Am. Chern. Soc., Oiv. Pet. Chern. Prepr., ~, S29, (1963).
9. H. Soh1bro and M.H. Jorgensen, Chern. Eng. World, ~, 46, (1970).
10. R. Habermehl and K. Atwood, Am. Chern. Soc. Div. Fuel. Chern. Prepr.,
~, 10, (1964).
11. N.V. Ku1 1 Kova and M.L Temkin Zh. Fiz. Khim., 23, 695, (1949).
12. G.G. Shchibraya, N.M. Morozov and M.I. Temkin, Kinet. Kata1., ~,
1057 , (1965).
13. R. Mezaki and S. Oki, J. Catal., 30, 488, (1973).
14. Y. Kaneko and S. Oki, J. Res. Inst. Catal., Hokkaido Uni., 13, 55,
(1965); 13, 169, (1965); 15, 185, (1967). i t' -, , _
, 1 I ,I
15. S. Oki, J. Happel, M. Hnatow and Y. Kaneko, Proced. 5th Intern.
Congr. Cata1., l' 173 (1973).

- 177 -
16. S. Oki and R. Mezaki, J. Phys. Chern., 7.1, 447, (1973); 7.1, 1601,
(1973).
17. D.S~ Newsome, Catal. Rev. Sci. Eng., El, 2, 275, (1980).
18. T.M. Yur1eva, G.K. Boreskov and V. Sh. Gruver, Kinet. Katal., lQ,
862, (1969).
19. G.A. Somorjai, Catal. Rev. Sci. Eng., Q, 89, (1981).
20. G. Natta in 'Catalysis', P.H. Emmett, Ed., 3, 349, Reinhold N.Y.,
(1955) .
21. E.G. Bag1in, G.B. Atkinson and L.J. Nicks, Ind. En.g. Chern., 20,87,
(1981 ) .
22. M.L. Poutsma, L.F. Elek, P.A. Lbarbia, A.R. Risch and J.A. Rabo,
J. Catal., g, 151, (1978).
23. M. Ichikawa, Bull. Chern. Soc. Jpn.,~, 2268, (1978).
24. P.C. El1gen, M.M. Bhasin, J.S. Patents 4, 014, 913, (1977), 4096, 164,
(1978) and 4162, 262, (1979).
25. A. Ozaki, K. Aika and H. Hori, Bull. Chern. Soc., Jpn., 44,3216, (1971).
26. A. Ozaki, K. Urabe, K. Shirnazaki and S. Surniga, in "Preparation of
Catalysis", ,£, 381, Elsevier Amsterdam, (1979).
27. K. Aika, H. Hori and A.Ozaki, J. Cata1., '!!...' 424, (1972).
28. P.R. Holzman, W.K. Shiflett and J.A. Dumesic, J. Cata1., 62,167,
(1980) .
29. Applied Industrial Catalysts, l, Ed. B.E. Leach, Academic Press,
(1984) .
30. A. Mittasch, Adv. Cata1., ,£, 81, (1950).
31. J.H. Sinfe1t, W.F. Taylor and D.J.C. Yates, J. Phys. Chern., 69, 95,
(1965).
32. R.M. Dell, F.S. Stone and P.F. Tiley, Trans, Faraday Soc., 49, 195,
(1953) .
33. Th. J. Osinga, B.G. Linsen and W.P. von Beet, 'J.Catal., 7..,277, (1967).
34. J.J.F. Scholten and J.A. Konva1inka, Trans. Faraday Soc., ~, 2465,
(1969) .

- 178 -
35. B. Dvorak and J. Pasek, J. Catal., 18, 108, (1970).
36. L.W. Ross, F.H. Haynie and R.F. Hockman, J. Chern. Eng. Data, ~,
339, (1964).
27. G.C. Chinchen, C.M. Hay, H.D. Vandervall and K.C. Waugh, J. Cata1.,
103,79, (1987).

- 179 -
CHAPTER 11
CONCLUSIONS
The structure and catalytic aspects of a series of potassium
tungsten bronzes and a series of sodium tungsten bronzes have been
considered. They were prepared by a thermal method using tungsten
as the reducing agent according to the following equation:
where M = K or Na.
1173K ----1.~ 6MxW03 Ar
The alkali ion content in the bronzes ranged from O.S% to 11.9%. The
surface area of the bronzes was determined by krypton adsorption and
ranged from 0.13 to 1.OSm2g-1. For both series of bronzes the surface
area tended to decrease with increasing alkali ion concentration
probably due to sintering since they were prepared at high temperature.
The melting point of the bronzes decreases with increasing alkali metal
ion content, W03 = 1746K and KO.3W03 = 1237K. It would appear that
the growth of crystalline particles probably by surface diffusion
involving migration of atoms across the particles surface is influenced
by the melting point of the bronzes and hence the observed drop in
surface area with increasing alkali metal ion content.
X-ray diffraction measurements have given qualitative inform
ation on the crystalline nature of the bronze samples. The potassium
bronze, O.OSKW is an intergrowth tungsten bronze, ITB, being an inter
growth of hexagonal tungsten bronze, HTB, and W03. Potassium bronzes
with x = 0.2 and 0.3 are of hexagonal types, whereas 0.6KW is a tetra
gonal tungsten bronze, TTB. The pattern obtained for 0.8KW was too

- 180 -
complex to fully interpret. The sodium bronzes with low alkali ion
content, 0.05 ~ x ~ 0.3, are tetragonal bronzes. The patterns obtained
for the sodium bronzes with x = 0.6 and 0.8 were relatively uncomp
licated and proved to be cubic. The bronze samples were regarded as
being homogeneous. The X-ray photoelectron spectra of the samples has
shown tungsten to be in an oxidation state of about +5. Quantitative
examination of the spectra showed that the surface of the samples was
essentially a termination of the bulk structure with no pronounced
segregation or depletion of potassium or sodium.
The thermal stability of the potassium and sodium tungsten
bronzes was studied by their reduction in hydrogen gas and their oxid
ation in a diluted oxygen gas stream. The bronzes are stable in hydro
gen up to a temperature of about BOOK below which neither weight loss
nor hydrogen consumption was observed. The weight loss obtained by
heating the samples in H2 to 1173K indicated that the tungstate and W
metal were formed. Reduction in most cases was a single endothermic
process. The tpr profiles of the bronze samples have also shown that
in most cases reduction occurred in one step. From the H2 consumed
in the tpr process, the tungstate and W metal were the final products
of reduction as also observed by tga experiments. Oxidation of the
bronze samples occurred in most cases in overlapping processes. The
bronzes are stable in air up to a temperature of about 600K. The
complete oxidation of all of the bronzes led to the formation of the
tungstate and W03. The initial processes in the oxidation were
attributed to the formation of polytungstates which then disproportionate.
It was observed that the bronzes with a tetragonal structure oxidise
more readily than those with either a cubic or hexagonal structure and : .
is attributed to the ease of formation of the corresponding poly-

- 181 -
tungstates. From the 02 consumption none of the bronze samples were
thought to be oxygen deficient as the observed 02 uptake corresponded
well with the theoretical values required.
Electrical resistivity measurements on the bronze samples have
shown that bronzes with high inserted ion concentrations are metallic
while bronzes with low concentrations of the insertion ion have semi
conductor properties. The resistivity values for both the potassium
and the sodium bronzes were similar, with values for potassium being
slightly higher, indicating that the resistivity was possibly independ
ent of the nature of the insertion ion.
Temperature programmed desorption of chemisorbed ammonia was
used to obtain a picture of the strength and density of the acid sites
on W03 and the bronze samples. The decomposition of isopropanol was
used as a probe reaction to obtain information about the nature of these
acid sites. Temperature programmed desorption of ammonia on W03 and
potassium bronzes with x ~ 0.2 has shown that there is probably only
one type of acid site present. However, for the potassium bronzes
with 0.3 ~ x ~ 0.8 and for most of the sodium bronzes there is more than
one type of acid site present since a second ammonia desorption peak
was observed at higher temperature. A comparison of the acid site
concentration on the bronzes has suggested that the acid site surface
density decreases with increasing alkali metal ion content. In general,
a higher concentration of acid sites was found to be present on the
potassium bronzes than on the corresponding sodium bronzes. The iso
propanol decomposition reaction has often been used to probe the acidic
and basic sites on catalysts. The selectivity of the reaction for
dehydration and dehydrogenation has ~~~n Used to explain the ~atu~e of
these sites. W03 and the bronzes show selectivity for both propene

- 182 -
(dehydration reaction) and acetone (dehydrogenation reaction), except
for some of the sodium bronzes with low alkali ion content which show
total selectivity for propene formation. In general, for any given
sample the selectivity for propene formation increased with temper
ature and this is mostly due to a thermodynamic limitation since the
products of the dehydration reaction are favoured at high temperature
whereas the dehydrogenation reaction is exothermic. The select-
ivity for the dehydration reaction for both the potassium and the sodium
bronzes decreased with increase in alkali metal ion content, due to an
increase in the number of basic sites. The sodium tungsten bronzes
show a greater selectivity for the dehydration reaction than the pota
ssium bronzes with the same alkali ion content. The rate of the dehydr
ation reaction decreases as the sodium and potassium content increases.
However, the rate of dehydration on the sodium bronzes was greater than
that observed for the corresponding potassium bronzes, although the
total number of acid sites was smaller, thus indicating the greater
activity of the acid sites present on the sodium bronzes. Recent
work(l) has also shown that the rate of dehydration tends to decrease
with increasing ion size as observed for the present potassium and sod
ium bronzes, the K+ ion being larger (0.133nm) than the sodium ion,
(0.097nm). The activation energy values for the dehydration reaction
have been used to discuss the nature of these acid sites(2) low act-
ivation energy values for the reaction have been associated on surfaces
where both Lewis and Bronsted acid sites occur, whereas high activation
energy values indicate only Lewis acid sites. The activation energy
values for the dehydration reaction calculated for W03 and KxW03 where
x ~ 0.2 are high whereas those with x ~O.3 and the sodium bronzes have
a lower value. It would appear that the first series of samples ~ • ,j
contain only Lewis acid sites, whereas the second series contain both

- 183 -
Lewis and Bronsted acid sites. It is these Bronsted acid sites which
are of a stronger nature and more active. Lewis acidity is intrinsic
in W03 and the Lewis acid sites present in the bronzes can be
attributed to the W03 matrix. Fig. 11.1 shows such a site on a hexa-
gonal potassium tungsten bronze .
.......
Fig. 11.1 Hexagonal potassium tungsten bronze, I:Qxygen; ..... I, tungsten; K+, potassium ; ~ _" Lewis a.cid site.
The formation of Bronsted acid sites is caused by the addition of the
alkali metal ion and the extent of formation depends on both the nature
and concentratjon of the added metal ion. The activation energy values
for the debydration reaction have indicated that sodium is more effect
ive in fonning Bronsted acid sites in tl:le bronze t~anpotass;um :and this

- 184 -
can be associated with the e1ectronegativity of the alkali metal ion
inserted. Na+ is more electronegative, (0.9, Pauling scale), than
+ K , (0.8, Pauling scale), and is more effective in polarising the W-O
bond in the bronze. The attraction of a proton by 0- leads to the
formation of a Bronsted acid site. Figure 11.2 shows such a site on
an hexagonal sodium tungsten bronze. Bronsted acid sites were not
observed on the potassium bronzes until the alkali metal ion content
reached, x = 0.3, whereas for the sodium bronzes, Bronsted sites were
present at all alkali metal ion concentrations.
Fig. 11.2 Hexagonal sodium tungsten bronze, It oxygen; + " 't tungsten;~Na , sodium;~_/Bronsted acid site;
H, Hydrogen
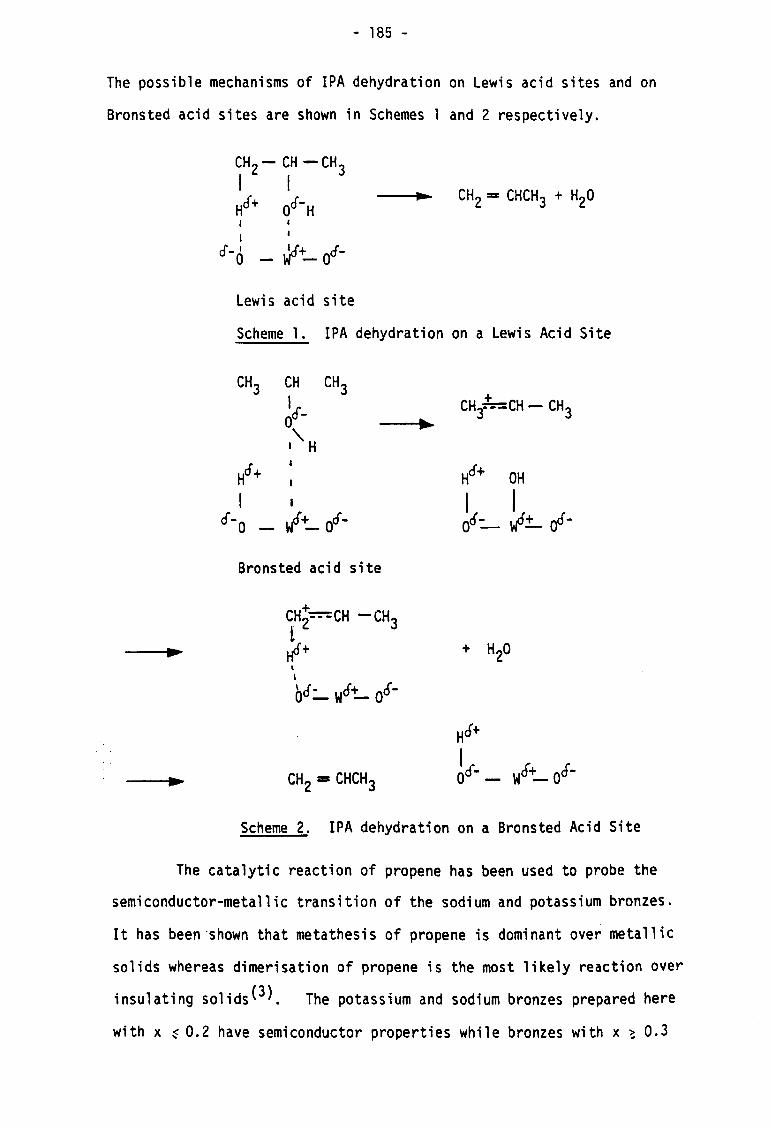
- 185 -
The possible mechanisms of IPA dehydration on Lewis acid sites and on
Bronsted acid sites are shown in Schemes 1 and 2 respectively.
CH - CH -CH I 2 I 3
Hd+ Od-H I
I
0-0 - wa~ Od-
Lewis acid site
Scheme 1. IPA dehydration on a Lewis Acid Site
Bronsted acid site
, , '15- 15+ t-O -w -0
Scheme 2. IPA dehydration on a Bronsted Acid Site
The catalytic reaction of propene has been used to probe the
semiconductor-metallic transition of the sodium and potassium bronzes.
It has been ·shown that metathesis of propene is dominant over metallic
solids whereas dimerisation of propene is the most likely reaction over
insulating solids(3). The potassium and sodium bronzes prepared here
with x ~ 0.2 have semiconductor properties while bronzes with x ~ 0.3

- 186 -
are metallic. The catalytic reaction of propene on W03, the potassium
bronzes and the sodium bronzes gave ethene, but-2-ene (metathesis prod
ucts) and hexenes (dimer;sation products) as the major products. For
both the potassium and the sodium bronzes, selectivity for metathesis
reached a maximum when x was equal to 0.2, although electrical resist
ivity measurements indicated that such a transition occurs between an
alkali ion content of 0.2 and 0.3. A useful comparison can be
obtained if the nature and number of active sites in the bronzes were
defined. If it is assumed that the W atoms are the active sites for
both the metathesis and the dimerisation reactions, it will first be
necessary to calculate how many of these are present in a unit area of
surface. The turnover rates (the number of molecules which react per
active site per second) are routinely measured for many different metal
catalysts because selective chemisorption techniques have been developed
to determine the number of surface atoms. The selective chemisorption
technique unfortunately usually does not work well with metal oxides
and the number of exposed sites in metal oxide catalysts are not
generally known. The number of active sites for oxide catalysts can be
estimated from the number of cations present on the crystal planes most
likely to be exposed at the surface, but in the present study the number
of active sites was assumed to be the total number of W atoms present.
The turnover numbers for the dimerisation and metathesis reactions
on the bronzes are given in Table 11.1 The activity of the bronze
samples show a maximum in turnover number for metathesis when x = 0.2 in
MxW03 whereas the activity for the dimerisation reaction show a decrease
in turnover number with increasing alkali ion content. It is difficult
to assess whether the maximum in activity for metathesis is associated
with the electrical properties of the bronze. However, the' activity

- 187 -
for metathesis is lower at higher alkali ion content suggesting that
both K and Na have a detrimental effect to the reactivity of the active
sites.
Table 11.1 Turnover Numbers for Metathesis and Oimerisation
of Propene on WO~x~ and Nax~
Sample Turnover N01molecu~es per site s- x 10-
Turnover No/molecules per site s-l x 10-5
for metathes is for dimerisation
W03 5.8 2.64
0.05KW 12.3 1. 43
0.2KW 25.3 0.53
0.3KW 8.1 0.27
0.6KW 4.3 0.28·
0.8KW 2.2 0.07
0.05NaW 8.4 1. 23
0.2NaW 22.9 0.65
0.3NaW 9.3 0.33
0.6NaW 3.4 0.20
0.8NaW 4.8 0.28
A potassium tungsten bronze in which copper ions were inserted
by ion-exchange was prepared. Xrd indicated that the compound formed
has a homogeneous bronze structure. The xps of the sample has
suggested that copper may be in the +2 oxidation state, while W is in
an oxidation state of about +5, with the compound having an empirical
formula, CUO.062KO.13W03. The presence of copper in the bronze does
not affect its reducibility. The copper surface area :was est'imated

- 188 -
by N20 decomposition and was calculated to be O.38m2g-1. The copper
bronze is active in methanol synthesis from synthesis gas, but shows
a higher selectivity for methane than methanol formation. The copper
sites are less active than those present in a Cu/ZnO catalyst but are
as active as those on a Cu/Ti02 catalyst(4). It was thought that Cu
in a high oxidation state was the active site in methanol synthesis.
A supported potassium tungsten bronze was prepared by impreg-
nating a silica support with an aqueous solution of potassium tungstate,
(pH 4), followed by reduction in hydrogen gas at 770K. Xrd studies
on the supported bronze suggested it to have an hexagonal structure.
The X-ray photoelectron spectrum of the bronze has shown tungsten to
be in an oxidation state of about +5. The activity of the bronze was
monitored for ammonia synthesis but was lower than that observed for
a potassium tungsten bronze supported on alumina. This may be due to
the larger crystalline particles present on the silica-supported
bronze.

- 189 -
CHAPTER 11
REFERENCES
1. Y. Kera and M. Negoro, J. Catal., 99, 198, (1986).
2. K.T. Sea, S.C. Kang, H.J. Kim and S.K. Moon, Korean J. Chern. Eng.,
~, 2, 163, (1985).
3. N. Tsuda, T. Mar; and Y. Sakai, J. Mol. Catal., 28, 183 (1985).
4. M.S.W. Vong, P.A. Sermon, M.A. Yates, A. Perryman and P. Reyes,
Unpublished work.
-----000-----

APPENDIX 1
* The publication arising from previous work of the author
on supported hexagonal tungsten bronzes ;s appended.
* S. Stevenson and P.A. Sermon, J. Chern. Soc., ~araday Trans. 1,
83, 2175, (1987).

Promotion of Nitrogen and Hydrogen Chemisorption and Ammonia Synthesis on Alumina-supported Hexagonal
Tungsten Bronze, Kx W03
Sheena Stevenson and Paul A. Sermon· Department o/Chemistry, Brunei University, U.'Cbridge. Middlese.'C UB8 3PH
Alumina-supported hexagonal Ks WO. phases have been prepared in the prescnc:e and absence of Pt; K significantly promotes the chemisorption of nitrogen and Pt the chemisorption of hydrogen thereon. The turnover number for the production of ammonia (molecules of ammonia produced per site capable of chemisorbinl hydrogen per second) was very low. but was promoted by K and not Pt. The modes of adsorption and catalysis and the manner of their promotion are considered in detail.
Ammonia synthesis can be catalysed by non-group VllI metals,l their oxyanions' and complexes.s However, for W the enthalpy of hydrogen adsorption [130 kJ mol-Ion polycrystalline surfaces. 38-IS91cJ mol-Ion W(III) and 84-163 kJ mol-Ion W(211)]4 is only about a fifth that of nitrogen (820 kJ mol-I), despite the high bond strength (914 kJ mol-I) of dinitrogen. This mitigates agai~st effective catalysis of ammc;mia synthesis by metallic tungsten. Consideration has been given here to whether the activity ofW surfaces can be promoted to enhance the adsorption of both nitrogen and hydrogen, and subsequently ammonia synthesis. by controlling the oxidation state and symmetry of its reaction centres.' concentrating on supported Ks WOs 'bronze' ·phases where the lattice cation oxidation state and symmetry of location is controlled by the oxide matrix and the size,location and concentration of the intercalated :cK· ions and its xe- electrons.
Alkali-metal bronzes are non-stoichiometric solids, Mz WOs' in which Mil. ions and ne- electrons are inserted (where 0 < .'C < I) into the oxide conduction band and the solid interstitial channels.' Potassium bronzes were selected since alkali-metal oxides are an important group of promoters to transition-metal catalysts' for ammonia synthesis. CO hydrogenation eIC.; for example. KIO markedly accelerates the adsorption of nitrogen on polycrystalline Fe. I In the present bronzes the location and state of the K· could be well defined. unlike some traditional catalysts (e.g. in promoted Fe-based catalysts some of the KIO may be chemically combined with the iron oxide and also in a free surface statel and is mobile on alumina alone at, say. 670 K, to an extent which varies with the prevailing gaseous atmosphere. I. Surprisingly, on Re single crystals and foils. where the rate-detennining step remains N, dissociative chemisorption. no promotional effect of K is observed, 11 which contrasts with the significant promotional effect of K on Fe single crystals.' Sometimes K: M ratios as high as twelve have been recommendedu in ammonia synthesis catalysts.
Doubly and triply promoted iron catalysts13 are the cornerstone of ammonia synthesis. Nevertheless, despite their lower density. supported catalysts (especially those on graphite-containing carbon)l. are being developed where a promoter alkali-metal ion is actively associated with the metallic phase (e.g. Ru or VB-VB-VIIB or VIII transition metal). U Alumina-supported Fe has also been reported for ammonia synthesis. U where act~v~ty at 101 kPa and 593 K was in the range 1-4 Jlmol NH3 per g (Fe) per h. The actIvIty on Ru/MgO and Ru/CaO was promoted by the alkaline-carth support. II where there may have been electron transfer from the support to the Ru.

Ammonia Synlh~s;s on K" WOJ
Tlble I. Catalysts prepared upon Alumin Oxid C·
sample W (wt%) Pt (wt%)
W1.5 1.50 0.00
KWI 1.01 0.00 KW3 3.00 0.00 KW5 5.04 0.00 KWIO 10.14 0.00
PtKW3 3.04 0.527 PtKW5 5. \I 0.556 PtKWIO 10.03 0.640
• 97.0% ,,-AI,O,; < 2000 ppm SiO,. Fe,O,; non-porous; 90. 100. 101. 113 ml I-I indicated by Nt B.E.T. measurements.
Results for supported K:r WOJ catalysts where K and Pt arc the promoting phases for adsorption and catalysis on W surface sites arc now reported.
Experimental
Catalyst Prep •• doa
All alumina-supported catalysts were prepa~· using Aluminium Oxid C (Degussa) whose properties are given in table I. Monolayer coverage of the support by the W phases was thOUght to ~uire on average S W atom m-' and an attempt was made to prepare most catalysts (see table I) below this concentration to minimise the formation of poorly dispersed' bulk' W phases.
WO,/AltO, was prepared at a loading of I.S wt'Y. W by impregnating the alumina to the point of incipient wetness with an aqueous solution of ammonium tungstate (B.D.H. Chemicals Ltd; 95.0% purity). The product (denoted WI.S) was dried at 393 K for 16 h and then calcined in air at 823 K for 2 h. K~ WO,/AltO, samples (denoted KWI. KW3. KWS and KWIO) were prepared by
impregnating the predried alumina with an aqueous solution of potassium tungstate of the correct strength and volume to ultimately give 1.3. Sand 10 wt% Wand to JUSt wet the alumina completely. Samples were dried in an air oven at 373 K for 12 h and stored in air unreduced. The pH of the impregnating solutions varied a tittle (9.04-9.08) depending upon the precise W loading to be achieved. Under these conditions the alumina support is thought to undergo only slight dissolution.
Pt/K~ WO,I AltO, samples were prepared by impregnating the predried alumina with aqueous solutions containing required amounts ofHtPtCI. (Johnson Matthey: Spccpure) and potassium tungstate. In each case the ultimate loading of Pt was O.S wt·:~. but the W concentration varied. The mixed impregnating solution gave strong absorbance at 241 mm. and since this was also true for a solution of hexachoroplatinic acid alone. it was thought that the PtCI!- ions remained intact in the mixed solution at ambient temperatures. Samples (denoted PtK WI. PtK W3. PtK WS and PtK WIO) were also dried in air at 373 K for 12 h. The pH of the mixed-metal impregnating solutions (n,. S.7S) was almost independent of concentration in lhe range used. Al Ihis pH lhe alumina support is thought to undergo meagre dissolutton.
Temperature-programmed bulk reduction (Lp.b.r.) described laler suggested that ea\.:h catalyst should be reduced in flowing H: (40 cm~ min: 101 \cPa) at 1023 K for 16 h. ThIS

S. Stewnson and P. A. Sermon
was carried out upon the samples (and the support alone), and each was then cooled in the reductant stream to ambient temperature and flushed with flowing Ar. Subsequently an in sil&l reduction was carried out.
Experimental Methods
Estimates of the extent of NI physical adsorption at 77 K (determined using a semi-automatic Carlo-Erba Sorptomatic series 1800) was used to determine total accessible surface areas assuming the cross-sectional area of adsorbed Nt to be 0.162 nml.
Raman spectra were recorded on a Spex Ramlab spectrometer using a coherent radiation model S2M.G. Ar/Kr laser with a green-interference filter to remove plasma lines; a cylindrical lens was used before the sample to minimise sample decomposition. Aqueous solutions were analysed in a capillary. Signals were measured at 90° to the incident beam; the laser output was ca. 30-100 mW and the slit-width S em-t.
Thermogravimetric and differential theral analyses were carried out on samples (ca. 30 mg; predried in Rowing N. at 373 K for IS min) using a Stanton Redcroft STA780 analyser, «-alumina references, 10 K min- t heating rate and 40 cmJ min-I flow rate. T.p.b.r. was carried out on samples (0.5-2.0 g) in flowing 6% H, in N. (40 cmJ min-I), from which oxygen and water contaminants had been removed by passage through beds of Pdl AltO, and SA molecular sieve at 295 K. Hydrogen concentrations were measured after removal of product water at 203 K using a hot-wire detector (Gow Mac Katharometer OII06P) during heating at S K min-I.
X-ray photoelectron spectra were measured on a Kratos ES300 instrument using Al X. radiation and were calibrated against the C Lr peak at 284.8 e V. Diffractometry was used to ascertain the structure of catalyst (PWIOSO generator operating at SO kV and 24 rnA via a Ni filter producing Cu K.l radiation).
The extents of chemisorption of hydrogen and nitrogen were measured ± 10% in a volumetric system described previously.17 A known weight of the catalysts (prerecluccd at 1023 K for 16 h in H,) was flushed with flowing Ar for I S min, HI at 773 K ± S K for 3 h, and then flowing Ar for 1 h. Samples were then evacuated to 1-3 mPa at 773 K, after which H, (Research grade; 99.9995% purity; BOC) chemisorption was followed at the same temperature. Equilibration times of 15-20 min were required. Pressures were measured using a mercury manometer/cathetometer and a pressure transducer (Bell &t Howell BHLIOIO; HI vapour was prevented from reaching the catalysts by a trap held at 77 K). After measurement of hydrogen chemisorption. the sample was re~vacuated at 773 K and the extent of nitrogen chemisorption measured at 773 K ± S K (after changing the cold trap separating the sample from the remainder of the system to one at 195 K). 'Monolayer' extents of adsorption were estimated from the gradient of the linear Langmuir plots and also extrapolation of adsorption data at 30-70 kPa to the zero pressure; all isotherms approximated to a Langmuir form.
The activity of samples in catalysing the synthesis of ammonia was measured using a silica flow reactor at 101 kPa with the sample held in a furnace (Stanton Redcroft CIIPt 13/CL) to within ± S K of the set temperature. The product stream flowed through 20 cm3 of de-ionised water (obtained by passing double-deionised water through a Duolite ion~xchange column) whose conductivity could be monitored continuously (Fisons PTI-18). Catalyst samples (ca. O.S g) were flushed with Ar (99.9~,~ purity; BOC) for 15 min and then Ht (99.9S% purity; DOC) at ambient temperature. and as the sample temperature was raised to 1023 K at 10 K per min and then held there for 2 h. Subsequently, the H, was replaced by flowing Ar and the sample cooled to ambient temperature. During this pretreatment the conductivity detector gave a constant reading; the reactant stream of 75,% HI in Nt (99.99~,~ purity: BOC; pre·purified by removal of oxygen and water-vapour in the same was as the gas strean:t used in t.p.b.r. experiments

Ca)
(el
(e)
(f)
(g)
Ammonia Synthesis on K ... WO,
700 wavenumber/em -I
Fil. I. Raman spectra of Kt WO.(aq) at pH - 9.04 (a). Kt WO.(aq) at pH - S.74 (b) and we, (c) and some supported catalysts: (d) unreduced KWIO. (e) unreduced KWS. (f) unreduced
PtKWIO and (g) unreduced PtKWS.
described above) was introduced at 40 ana min-I. The sample temperature was then increased to 523 K (or 573. 673 or 773 K) and conductivity us. time measurements undertaken under isothennal conditions. The conductivity of the water (initially 0.5 Scm-I) rose linearly with ammonia concentration to 140 nmol. The error in the assessment of the quantity of ammonia fonned was ± 3 nmol.
Characterisation Results Raman Spec:troscopy or Unreduced Catalysts
The Raman spectra of K.,O. in solution at pH 5.75 and 9.04 (selected because of their relevance to condition~ ~~ \.:atalyst preparation). W03 and of unreduced samples. K W~. PtKW5. WIO and PtKWIO arc shown in fig. I and main band positions are given an table 2. Spectra of catalysts with lower W contents gave no well defined peaks.
The Raman spectrum of W03 shows expected bands. 1M The peaks of K: WO. arc characteristic of tetrahedral WO~- and this ionic state is known to exist .e,'(clusively in

S. Sle~nson and P. A. Sermon
Table 1. Raman spectroscopic data
sample
Kt WO. (PH 9.04)· KtWO. (PH S.7S" WOI· AltOI
KWS } KWIO
PtKWS } PtKW10
bands/em -I
933. 830. 324 962. 90S. 61S. S60 and 366 807. 712 and 276 890.810. 799 and 73S
94S and 847
1010 and 945
• Assignments: symmetric W=O stretching vibration 933 em-i; Intisymmetric W=O stretchinl vibration 830 em-I; W=O bending vibration 324 em-i; W=O stretching vibration 807 em-I; W=O stretching vibration 712 em-I; W-O-W defonnatioD vibration 276em-'.
neutral .and allealine solutions:" the Raman spectrum of solid KaWO. was identical. However. that for K.WO. in solution at pH 5.75 is similar to that of solid Na,.W110 .. ·18H.O," and it may be that the octahedral WlIOU- ion is present in the acidic solution.
Previous studies of AI.(WO.).lI·1l have shown it e~hibits a characteristic and sharp Raman band at 1046 em- l which may be used here to differentiate and detect this species in present catalysts. Only very small Raman bands were observed for the alumina support used here, and it was not tbought to interfere too seriously with Raman analysis of these supported W catalysts. Raman spectra of unreduced KW5 and KW10 catalysts showed two major bands which were broader than those observed for pure K,WO. and were also shifted slightly to higher wavcnumbers than those for Kl WO. in the impregnated solution at pH 9.04 (;.~. 830 and 933 em- l which can be attributed to symmetric and antisymmetric W=O stretching modes, respectively, in the supported phases). The broadening of these bands could be due to coordination of water to the aluminasupported tungsten complex. No bands were shown at l()()-4()()em- l • a region which reftects the crystallinity of the sample. Thus the supported phases could be in a moderately well dispersed state. All other bands for these catalysts were consistent with those for the support. If water is coordinated to the surface W sites it might produce an octahedral from a tetrahedral symmetry.
Increasing the coordination of W to six should increase the W=O stretching modes to higher wave numbers. Simultaneously the order of the terminal W=O bonds will decrease (with a decrease in the W=O stretching frequency). The symmetric w=o stretching mode in Na,WO. (928 em-I) increases to 931 cm- I in Na:WO,.:' Here the shift for supported catalysts could be attributed to the presence of adsorbed water. No band at 1046 cm-1 was found in unreduced supported catalysts indicating the absence of AI,(WO.)3'
The Raman spectra of unreduced PtKWS and PtKWIO showed bands of W=O stretching modes corresponding to those in K,WO, in acid solution. but shifted ca. 4i~ to higher wavenumber. possibly as a result of an active-phase/support interaction. Similar behaviour has been observed in the Raman spectra of (NH, ).H. W ,.o,n/ AI20 3
catalysts." The absence of bands at low wavenumber and at ,·a. 1046 cm -I again suggests highly dispersed supported phases in the absence of AI.(WO. )3'
Raman spectroscopy then provides valuable evidence of the state of these catalysts

Ammonia Synthesis on K .. WO,
as it has previously. 11 There is no suggestion of WO,-alumina interactions" forming Alt(WO, ) •• which was previously only detected after calcination ca. 1273 K or as a minor component at 863-1123 K." It is very sensitive to the coordination of the W and the vibrational modes of the W=O bonds: there the spectra of KWS. 10 and PtKWS. 10 in fig. I do not correspond to those of crystalline WO,. Kt WO~ or Alt(WO,), [sec fig. 4 in ref. (24)]. although unfortunately peaks below 700 cm-' are obscured.
Thermal Analysis or Reducdon Characteristics
On heating KtWO, in ftaring hydrogen a broad endotherm at 473-700 K with a weight loss of3% is followed by a sharp exotherm at 8SS K with a further weight loss of22.53%. Neither is likely to be associated with loss of water (heating in nitrogen produced only 0.6% weight loss) but possibly to conversion of the tungstate to a bronze. Ko.t• WO, (i.e. K,WO,+0.14Ht - K. .•• WO,+0.86K,0+0.14HtO). T.p.b.r. confirmed a multistep reduction with maxima at 653. 913 and 1018 K. The total hydrogen consumption (0.0430 mmol g-a sample) for the formation of the above bronze. Table 3 gives H, consumption and weight-loss data.
Equivalent data for catalysts are given in fig. 2 and table 3; no weight losses of significance were seen with any sample on heating in nitrogen and for results of heating in hydrogen there is moderate agreement between bronze compositions estimated by t.g.a. and t.p.b.r. For no samples was there reduction to the metallic state ofW on heating to 1023 K in hydrogen. Suppdrted phases reduced at lower temperatures than unsupported K, WO,. partly as a result of the high dispersion. Indeed. temperatures of reduction were lowest at lowest W loadings. Introduction of Pt appears to facilitate lower-temperature reduction and this may be associated with spillover. It is to be expected that reduction of Pt species will occur within the lowest temperature reduction maxima. However. it was not possible to assign to these t.p.b.r. peaks reduction processes of separate and distinct phases" in such complex catalysts.
No hydrogen consumption was observed on heatingWl.S (WO,/AltOs) in hydrogen to 1323 K in t.p.r. It may be that a surface tungsten oxide is obtained at the low WO, loadings which is difficult to reduce further.
X-Ray Photoelectroa Spectroscopy or Unreduced and Reducecl Catalysts
The W 4/7/t peak for unreduced KtWO, was found at a binding energy of 36.S eV and close to the value for WO, (36.0 eV). For KWI-IO its position was unchanged at 37.6 eV. but the full width at half maximum height or-this peak was found to decrease as the metal loading increased (i.e. O.S, 0.4. 0.3 andO}eV for KWI. KW3. KWS and K WI 0): a similar observation was reported for alumina-supported MoO, and WO,."· n and broad~!ling was attributed to charging effects. Her~ the width of the Al tp peaks also decreased in the same sequence and this eliminates ;the possibility that multiple W oxidation states are contributing to this observation ... ·
A linear relationship is to be expected between concentration and X.p.s. intensity for highly dispersed supported W phases. Fig. 3 shows that this does indeed exist for the present catalysts at least up to ca. 6.8 wtO~ W (or 2.25 x IO=Q W atom g-I catalyst). This could correspond to 'monolayer' coverage of bronze.on the support. The lowest B.E.T. area of the alumina support was found to be 90 m' g-I (see table I). and if this has 4.5 OH groups per m' of the surface'" then there are 4.05 x 10tO OH groups at the surface per g. This suggests that two OH groups could be associated with the adsorption of each W ion: this is consistent with the molecular model needed in interpreting Raman spectra. However. it is important to note that X.r.d. reveals well crystallised material.
Similar results were obtained for Pt K W 1-10 samples. K peak intensities were not diminished by reduction and hence K:O is not substantially lost. X.p.s. ?f reduced

S. St~uenson and P. A. Sermon
Table J. Reduction characteristics of catalysts
t.p.r. HI consumption t.g.a. % wt loss
sample endo· exo· :c T/K of max. red. rate total HI
uscdt .t
KWI 0.20 0.50 0.21 418 723 1008 9.60 0.34 KW3 0.45 0.79 0.47 403 726 999 23.70 0.29 KWS 0.68 1.37 0.50 418 746 1003 49.30 0.36 KWIO 1.03 4.10 O.SO 533 823 1010 104.75 0.38
PtKWI 0.82 0.20 0.52 383 5SO 810 1006 62.10 0.40 PtKW3 1.32 0.66 0.40 373 523 773 1018 86.75 . 0.39 PtKW5 2.42 1.00 0.49 383 S08 744 1018 98.79 0.31 PtKWIO 3.2& 2.12 0.42 440 SSg 820 1007 163.96 0.36
• % weight loss below 823 K. • % weight loss at 823-1023 K; C 1IID01 HI g-'. T.g.a. and t.p.r. denote thennogravimmctric analysis and temperature programmed reduction. respectively.
01---""
0.4
c .i Q, e a c 0 .. :£ ... • 0
!It ~ • 0 .. t.g.o. (b) 60 ~
:: :g "-to
0.8 d.t.o.
t 40
1.6 ~"doc.
fiR. 2. T.Il.a',". d.l.a. and t.p.r. proliles for, catalysts (u) K WJ and (h) PtK Wl

Ammonia Synthesis on K ... WO,
(a)
o~--~----~--~----~--~----~~
_0.03 ~ < ~0.02 ~
:::: 0.01
(b)
0.02 0.03 0.0' (W/AI>-.
Fie. 3. W4f11./AI2p X.p.s. intensity as a function of W content in catalysts KWI-IO (a) and as a function of bulk WI Al ratio (b). Open symbols and filled symbols relate to catalysts K W \-1 0 and PtKI-IO. respectively. before reduction. Deviation from linearity above ca. 7% W suggests
the presence of a poorer dispersion.
catalysts found the W 4fpeaks changed to lower binding energies corresponding to those of W'·. but not to the metallic state or that in Alt(WO~)3 (i.e. 36.1 eV." In reduced PtKWI-IO only one Pt peak (4d",) was found at a binding energy of 319.0 eV. which appeared to correspond to the zero-valent state. H
X-Ray Diffraction of Unreducecl and Reduced Catalysts
Diffractometry of pure unreduced K~ WO I was consistent with a monoclinic structure (ao = 1.2382 nm. bo = 0.61194 nm and Co = 0.75526 nm). but after reduction. d values corresponded to a hexagonal structural state (all = bn = 0.734 nm and Co = 0.752 nm). These results agree with data for hexagonal potassium bronzes of tungsten. U
After subtraction of broad peaks for the support. reduced KWIO and PtKWIO were found to exhibit X-ray diffraction patterns which were consistent with hexagonal structures (ao = 713 nm. c. = 0.775 nm and aq = 710 nm. Co = 0.782 nm). KW5 and PtK WS gave similar but weaker diffraction patterns: catalysts of lower W content could not be analysed by this method. None of the catalysts gave diffraction peaks corresponding to AI,(WO. )~. and if present its concentration was judged to be below the limit of detection by XRD.

S. S/~~nson and P. A. Sermon
60 2.4~
PN,IkPI
FiC. 4. Isotherms or nitrogen on KW3 (0). Wl.S «» and PtKW3 (.) at 773 K.
. .. "0
60
~40 =
20
o PH,IkPI
FiC. S. Isotherms of hydrogen on KW3 (0). WI.S «» and PtKW3 (.) at 773 K. These reach a plateau at lower pressures than for Nt.
Summary
Samples of alumina-supported K z W03 appear to have been prepared here by an impregnation-reduction route. X.p.s. intensities suggest the active phase is quite highly dispersed and yet exhibits a hexagonal structure detectable by X-ray diffraction at higher concentration; possibly the active phase exists in both fonns in some catalysts. There was no evidence of bulk reduction of W to the zero-valent state or complete loss of K. Although it would not be possible to rule out the separate retention of KsQ on the alumina. under the conditions of preparation here it would have sublimed and ~en lost if separated. There was no X.p.s. c':idence of loss of K from PtKWIO on reductIon. Hence the interpretation here is in tenns of Kr WO~ upon the alumina support.

0.24
_ .. 0.18 , '0 e :a. :. "" 0.12 ::::: ~ ~
0.06
Z
Ammonia Synthesis on Kx WO,
1 0/
/""0/
/~ ~ ",-
/e
l 4
1.2
• • 0.9 i '0 e :a. .. a.
0.6 oW ::::: ~ ~
0.3
Fil. 6. Linear Langmuir plots for nitrogen (0) and hydrogen (.) chemisorbing upon PtK W) at 773 K.
Table 4.. Adsorptive and catalytic properties
'monolayer' extent of N. or H. adsorption/ pmOI.-1
'!lHa after 20 min H. (773 K) Inmol NHa I-I min-I N;HI at 773 K
N. / I ()I molecule sample (773 K) total max", minw 523 K 573 K 673 K 773K site-I h- I
WI.S 2.06 6.15 0.00 6.15 0.11 0.53
KWI 0.\6 0.20 0.4S KW3 55.S3 12.75 0.00 12.75 0.47 0.73 1.02 2.37 KWS 73.7S 13.00 0.00 13.00 0.54 0.S6 1.21 2.22 4.99 KWIO 35.31 10.5S 0.00 10.5S 0.27 0.45 0.69 1.90
PtKW3 57.08 55.00 13.51 41.49 0.64 1.00 1.46 O.SI (1.09) PtKW5 77.SO 47. SO 14.28 33.22 0.96 1.21 1.74 2.36 1.47 (2.10) PtKWIO 32.S1 31.00 16.40 14.60 0.31 0.44 0.64 0.64 (1.37)
II Apparent turnover frequency was determined by dividinl the rate of ammonia synthesis at 773 K by the extent of hydrogen chemisorption at the same temperature as estimated from the gradient of the linear Langmuir plots (see fig. 6) or by extrapolation of hydrogen chemisorption (see fig. 5) data to the zero-pressure intercept. N has units of NH~ molecules produced per 1000 chemisorption sites per h: bracketed data relate to values of N calculated for W sites chemisorbing hydrogen in the column denoted minw.
Adsorptive-Catalytic Results
Chemisorption Results
Fig. 4 and 5 show the Langmuir-type isothenns as the extent of adsorption (q) ~or N~ and Hs chemisorption upon W 1.501 K W3 Ilnd PtK W3 catalysts as a function of,

140
i' .. 7 .. 60 '0'0 ~ : 40 --O£O£ xx
S. Siewnson and P. A. Sermon
120 tlmin
e __ e.-
J5
30
25 ~ i' .. 20 Q
e <: -15 = z
10
5
FiC.7. Extent ofNH, synthesis over KWl(O). WI.S () and PtKW3 (e) at 773 K as a function of reaction time.
equilibrium pressure (P) at 773 K; extents of adsorption at monolayer coverage were deduced from the gradients of the linear Langmuir plots (see fig. 6) and arc given in table 4 for all catalysts prepared here. First one should note,that the rate of HI adsorption was faster on all samples than Nit and its isotherms appeared to reach' plateau' extents of adsorption at lower pressures. Secondly, the extent of N. chemisorption appears to be dramatically promoted by the presence ofK (cJ. data for Wl.5 and KW3 etc. in table 4), although not by the addition of Pt, but that the extent of adsorption is a maximum close to the maximum dispersion suggested by x.p.s. intensity analysis in fig. 3. Thirdly, the reverse promotional effect appears to be the case for the extent of H~ adsorption in that K has only a small promotional effect. but Pt a large promotional effect (compare data for samples KW3-10 and PtKW3-IO in table 4); again. maximum extent of adsorption is seen at maximum catalysts dispersion, suggested in fig. 3.
Ammonia Syathesis
Fig. 7 shows the extent of synthesis of ammonia on several catalysts at 773 K; Fig. 8 shows the effect of temperature on the rate and extent of ammonia synthesis over PtW3 in the range 573-773 K. It is clear from fig. 8 that rates of synthesis decrease with time at each temperature and indeed only reached steady-state values at ca. I h. Table 4 shows rates measured from gradients in fig. 7 over several catalysts at an arbitrary time into the reaction and also the activation energy calculated over this temperature range. Activation energies for all samples in ammonia synthesis under these conditions were much lower (14-21 kJ per mol) than previously estimated I and this suggests either diffusion limitation or that N. dissociation is not the rate-detennining step. The turnover numbers. N. of ammonia synthesis over catalysts here were calculated in terms of molecules produced per non-Pt site active in hydrogen chemisorption per h: this seemed preferable to using the larger concentration of sites chemisorbing nitrogen. The values of N so calculated (shown in the last column of table 4) are very much lower than found for Group VIII metal catalysts and would be even lower if calculated on the basis of the numbers of sites chemisorbing nitrogen.
However. it is more important to consider the promotional effects of K and Pt upon the catalytic activity. It appears that K has a substantial promotional effect (i.t'. compare

S. Sle~nson and P. A. Sermon
promotion. Interestingly, the extent of chemisorption of nitrogen exceeds that of hydrogen; this suggests that only a small fraction of this chemisorbed nitrogen is in a state which may be activated for ammonia synthesis. Further work is required to define how K promotes this specific type of nitrogen chemisorption (and hence ammonia synthesis).
Discussion aad Coaclusions
The mono tungstate WO:- exists in alkaline solution but polymerises as the pH drops:
6{W0.l·-+7H+ = [HW,0.al' -+3H.0
and in the solid state undergoes transition to polymorphs such as K. W lOll at elevated temperatures; interestingly, the octatungstate is isostructural with the hexagonal tungsten bronze K..'I WO" which together with hexagonal WO, are well known. U Here weight losses and hydrogen consumptions on reduction correspond to 0.29 < x < 0.40. There is no evidence of zero-valent W formation. Raman spectroscopy of unreduced catalysts suggests that W 110:. exists upon the alumina support and that this poly tungstate is readily reduced to these hexagonal bronzes.
On all catalysts here the activity in ammonia synthesis increased with increasing temperature but, under isothermal conditions. also decreased with time. The low activation energy observed might be due to diffusion-limitation (or that the mechanism did not involve Nt dissociation as the rate-determining step) and the isothermal deactivation could result from retention of a strongly bound surface intermediate. The turnover numbers for ammonia synthesis at 773 K calculated using hydrogen adsorption sites were very low. Naturally. ammonia does decompOse over Pt at a rate (Jiven by the Langmuir-Hinshelwood unimolccular rate equationA which amounts to 10" molecule em-I S-l (or a turnover number of 0.36 per h) and could have reduced values of N in table 4. It is possible that metals other than Pt would have a greater promotional effect. Equally, tunptates do catalysc ammonia synthesis,' but not to an extent which would be significant under prescnt conditions. Normally the chemisorption and dissociation of nitrogen is rate-determining. but here it is interesting and surprising that nitrogen adsorption is more extensive than that of hydrogen. Pt had little effect on the extent of Nt adsorption, which reached saturation coverage only at high pressures. but K docs accelerate and promote nitrogen adsorption at 773 K (as it does in commercial synthesis catalysts). but whether this is because of electron donation to the W centres is uncertain; certainly such centres will be far more deficient of d electrons than in zero-valent catalysts. Hydrogen chemisorption was much faster than nitrogen and reached a saturation coverage at a much lower pressure, but this adsorbate may be more mobile on the catalyst surface than nitrogen and consideration needs to be given to why this should be so on the present surfaces.
Nitrogen adsorbs on polycrystalline zero-valent W surfaces. reaching ca. 40% monolayer coverage at room temperature.3 •• However. its rate of adsorption is much slower on some planes [e.g. W(IIl») than on others [e.g. W(IOO)V~ As a result. equilibrium nitrogen adsorption isotherms of the extent of adsorption (q) L'S. pressure (p) on W powder have been difficult to obtain. but generally obeyed the Freundlich model with linear logq I)S. logp plots at moderate pressures; interestingly. the common point of intersection suggests one N atom adsorbed on average per two surface W atoms."~ with a high initial enthalpy of adsorption (335 kJ mol-I). The adsorption of hydrogen on W film and powder at 79-873 K also obeys~' the Freundlich equation. with no maximum extent of adsorption reach at 13 kPa. but the initial enthalpy of adsorption is much smaller and decreased almost linearly with increasing coverage (in contradiction of the Freundlich model). In contrast. here the adsorption isothenns of hydrogen and nitrogen upon the present • bronze' catalysts are approximately Langmuirian. and

Ammonia Sy",h~s;s on Kw. W01
4-
~r·---r--
I I Ie ,/
3-
21- Ie ,i;' ,0·'
, ,
~
1~-----~I-----~I----~------~------~~ -5 -3 -I 3 5 Inp
Ftc. 9. Non-Freundlich behaviour of nitrogen (0) and hydrogen (.) adsorption on PtK W3 at 773 K. where Inp I1S. Inq plots are distinctly non-linear if q is the extent of adsorption and pis
the equilibrium pressure.
certainly not of the Freundlich fonn (see fig. 9); this suggests that the adsorption centres cannot approximate to the zero-valent W state. bearing in mind the past findings of Freundlich-type adsorption of hydrogen and nitrogen upon zero-valent W surfaces.
Although both nitrogen and hydrogen adsorb in several different states upon zero-valent W surfaces". 17. II (with nitrogen even weakly adsorbed" on W(IIO)," it is uncertain whether any of these are truly molecular. The smaller hydrogen adsorbate might interact with sites not accessible to the larger nitrogen. Therefore, the precise location of the adsorbed nitrogen and hydrogen on surfaces of W remains uncertain. M
and this is complicated by the tendency ofW surfaces to reconstruct" during adsorption (i.~. tungsten atoms in the (001) surface readily undergo small lateral displacements).~o Nevertheless. nitrogen and hydrogen may be located in fourfold coordination sites upon W(IOO): on a W(OOI) surface a hydrogen atom is deemedtl to sit midway between two surface W atoms. Present hexagonal tungsten bronzes (see fig. 10) are fonned by comer-shared WO. octahedra (with trigonal holes exceeding the number of hexagonal ones). K + ions sit within the hexagonal channels juts below the plane of the hexagon. in which the W-o-W angle between WO. octahedra centres is rather obtuse. It is necessary to consider how adsorption and catalysis may occur on such a surface and to compare this with what pertains in W complexes and on other transition-metal oxides. The dissociation of dinitrogen upon metal surfacesu is not directly relevant here. It is suggested that N! adsorbs at surface cation sites exposed on TiO! by dehydroxylation. I~ and here a similar adsorption mode is considered. First. it has been shown~t that all such alkali-metal bronzes of Ware oxygen-deficient. and so some of the terminal oxygens above the surface tungstens will be missing. and it is on these centres that electron donation from the K will produce WU centres (where: is 4 or 5). The triple bond of the nitrogen molecule could donate 1t electrons to the K + ion intercalated below the plane of the hexagon and the two ends of dinitrogen with a a-bond to two WU centres. This molecular mode of adsorption of nitrogen upon the hexagonal bronze surface would be readily accepted by the W(l-tl+ with their almost vacant d-orbitals. the process would be promoted by K +. Hydrogen adsorption must involve heterolytic adsorption across

S. S/~v~nson and P. A. S~rmon
F;---,"I I " " \ I • I : / ',' ,,~---' I ,
/ ----~ , "', ~,
',' 0 '.' \ , " ,1', , ,,'I ,"" f '\
\ ",' " " -----~ ......... ~ " , \ ,'i ........ ;. '~---- ", f ,~ 1-, ' N.... , , "
I '. r:;, ,*, t , ... ~, " "" ... , 1/ , " , ,lL- - - -- _____ .... " ........... ,
, ,..,--,,~_ I ........ 'IIIIIIIIf' I I - ---!'i<..... \ '
, - /, ..... ,I <', 0 I '",-' \ ....... '1
1 " " , \ ., '" " ' ____ -:'\1 \ , 'r,._.- , 1', ' : -: , ; ;,' '" ' It •• _._.o!
Fic. 10. Adsorption sites on hexagonal K~ WO, (e, oXYP; •• tungsten in the plane of the hexagons; O. potassium below the plane of tbe beulOns). It. is important to remember that on
W(IOO) Hand N atoms are chemisorbed ill sites with four-fold coordination.
W-o sites and also hydrogen spillover promoted by Pt (which may not-otherwise be involved in the catalytic reaction site).
This model would require the extent of nitrogen chemisorption to be related to the extent of surface oxygen deficiency in these bronzes. 1be size of the Nt molecule (11 Opm bond length) means that it could just stretch across the opening of the hexagonal tunnels (width 260 pm) in this adsorption mode.
The catalysts used here were not seen as potential industrial catalysts (thus tungstates are more generally used as inhibitors,41 although tungstates have been reported to catalyse ammonia synthesis,' and certainly WO, and MoO, have been recommended as additives to Fe ammonia synthesis catalysts."
Studies on W surfacesU emphasise that the state of adsorbates at low pressures may be different from those at industrially relevant pressures. Equally, in catalysis. the effect of the alkali-metal promoter may be high at high pressure. but negative for the atmospheric-pressure synthesis of ammonia.~· Therefore. the function of the present work was not to suggest that comparisons can or should be made between catalysis at low pressures and under commercial conditions. (ndeed. research~' has illustrated the difficulty of extrapolating from surface data at low pressures and temperatures to industrial conditions 723 K and> 100 atm. Nevertheless. the results arc intriguing and do show a relationship between catalysis (of ammonia synthesis) with W ions stabilised in . bronzes' and in complexes;3 this relationship between homogeneous and heterogeneous catalysis is worthy of further fruitful study. It provides an example of a mode of control of an active site at a catalytic surface.' On these ionic surfaces the activation energies to surface diffusion will be larger than on zero-valent metals and migration will be more difficult.24 and this might also contribute to the control of activity and selectivity. Holmes and King" have shown that the tight-binding model provides an insight into

Ammonia Synthesis on K'I( WOa
the electronic structure at the surface of metallic tungsten, and the above localised chemical model of adsorption at these W surfaces may also be justified. Kosaka" al.n
found that whether the bronze Na% WQ, was an insulator or metal determined whether it catalysed dimerisation or metathesis reactions, and it may be that the precise value of x (i.e. the K loading and the associated level of oxygen deficiency) will have an important role in defining the extent of promotion of ammonia synthesis. Unfortunately, as:c is changed. so is the structure and oxygen deficiency, and so itwould be very difficult to separate these effects in the catalysis observed.
The dissociative mechanism on metallic W surfaces is well established," but here on the' bronze' surface, if nitrogen is molecularly (and hence more weakly) adsorbed, it may be that an associative mechanism is also important. It is not yet possible to deduce the relative importance of the two mechanisms. This differentiation would require in silu analysis" using F.t.i.r. which is in progress and will be reported. Interestingly, the activation energy for ammonia synthesis here appears much smaller than that for nitrogen dissociation and this is seen as further evidence of the involvement of a mechanism unlike that on traditional catalysts.
Further in situ analysis is also required to ensure that the active sites and phases are characterised whether these be a highly dispersed oxyanion phase of tungsten anchored to the alumina surface uia W-o-Al bonds (possibly preferentially sensed by Raman) or more poorly dispersed phases (possibly preferentially sensed by X.r.d.) or a combination of both.
We gratefully acknowledge the financial support of S5 by S.E.R.C. and Perkin Elmer.
References I N. D. Spencer IIId O. A. Somorjai. I. CIU ••• 1912. 71. 142: O. Rambeau. A. Jorti and H. Amarialio.
J. CIII ••• 1912. 74. 110: Appl. Clllal •• 1982.3. 273; O. Rambeau and H. Amarillio. J. CIII •.• 1981. 12. 000.
2 L. A. Chemysheva. V. Va. Zabup. N. S. Pivovarova IIId M. V. Tovbin. Vi.m.·Kiio. U"io. ~r. lOt;". .• 1981.2l, S9.
3 J. Shcn. Z. Wanl and X. Huana. Sei. Sill •• 1913.%68. I: O. E. Bossard.. A. T. Georae and R.. K. Lester. Irwrr. Chim. 14"11. 1982. L227; U.S. PalmI 4309311; C. Shao. J. Li. L. raU. X. Tana. M. 8ei and H.Ouo (1982). p. 7IS. FtllldtJ#rwftl. OtptOlfWloilk Clwmil"y. Pr«. Chilra-JllpGlt-US (1982); O. P. Pc%. P. Appr and R.. K. Criaey,l. Am. CIwm. Soc •• 1912. tiM. 482: O. E. Bossard. D. C. Busby. M. Chana. T. A. Georse and S. D. A. lslte. J. Am. CMm. S« .• 1980. 101. 1001: R. B. Shoshan. J. Chall, O. J. Lcilh and W. Hussain. I. CMm. Soc .• DGII"" rrCIIU .. 1980.771: J. Chau. W. Hussain. O. J. Lcip and F. P. Terreros. J. CMm. S« .• 0011011 rrCIIU .. 1980. 1408: J. Cha". W. Hussain. O. J. Lcip. H. Neukomm. C. J. Pickett and D. A. Rankin. J. CIrmt. Soc .• CItnrt. Commlllt .. 1980. 1024: J. A. Baumann and T . .A. Georae. J. Am. CIwm. S« .• 1980. 102. 61S3: T. Takahashi. Y. Mizobe. M. $alO. Y. Uchida and M. Hidai. J. Am. CIwm. S« .. 1980. 101. 7461.
4 O. A. Somorjai. CIII"'. hP .• 1978. '1. 173. S K. Tanaka. Adt. CAtol .• 1985. 33. 99. 6 P. A. Sermon. in Clwmiral RNcliOfU ill CIHU'raj",d Orfattir /JIId InOrfattir S,I'.tltms. ed. R. Sellon
(Reidel. New York. (986). p. 341. 7 T. Matsushima. J. Calol .. 1985.96. 420. 8 Z. PilI. O. Enland S. B. Lee. API'I. Silr/. Sci .• 1981. 8. 231: O. Enl. S. B. Lee and M. Weiss. SlIrf. S<"i ..
1979. 114.527; G. Enl. M. Weiss and S. B. Lee. Clttm. 1'I,,·.f. I...ell •• 1979.60.391. 9 A. Spinzi. O. Galatchi and M. Spinzi. Gtl,rof. KOlal.. 1979.4.439.
10 O. Connell and J. A. Dumesic., J. Calill .• 1985. 91. 17. II M. Asscher. J. Carruza. M. M. Khan. K. B. Lewis ;And G. A. Somorjai. J. CUlol .• 19116.98.277. 12 V. B. Shur. S. M. Yunusov and M. E. Volpin. Dolel. '''lead. NOllk. SSSR. 1984. m. 8114. 13 K. Hanji. H. Shimizu. H. Shindo. T. Onishi and K. TlImaru.J. Re.f. Insl. Cala/.. Hu/d;uidu Un;t· .. 19110.
11. I7S. 14 Brili.rh POU", Appl. 2.034.194; 2.034.292. IS J. E. Sueiras. N. Homs. P. Ramirez de la Pisana. M. Gracia lind J. L. G. Fierro. J. Cala/.. 19116.98.
264. 16 K. Aika. A. Ohya. A. Ozaki. Y. Inoue and I. Yllsumori. J. Calal .. 1985.91. JOS. 17 A. R. Berzins. M. S. W. Vong. P. A. Sermon lind A. T. Wurie. Adh('.fjOtl S<"i. TC'c·h"III .• 19K4. I. SI.

S. Sltvtnson and P. A. Strmon
.8 R. Thomas. F. P. J. M. Kerkhor. J. M. Moulijll.l. Medema and V. H.I. de Beer. J. Calm .• 1980.61. SS9.
19 L. Salvati. L. E. Makovsky.l. M. Stetal. F. R. Brown and O. M. Hercules. J. plt.vs. CM", .• 1981.15. 3700.
~o W. P. Grifthlu and P.I. B. Lesniak J. CIwm. Soc. A. 1969. 1066. 1I R. Thomu. J. A. Moulijn and F. P. J. M. Kerkhor. RIel. Trw. Chi",. Pays-BtU. 1977.96. MI14. !2 R. H. Botey and O. L. Kdler. J. Cit"". Pltys .• 1964.41.215. n T. A. Eaerton and A. H. Hardin. CIIIIII. RIo •• 1975. II. 71. 24 S. S. Chan. 1. E. Wachs. L. L. Murrell and N. C. Oispenziere. J. Calm .• 1985.91. I. 25 R. Thomas. F. P. J. M. Kerkhor. J. A. Moulijn. J. Medema and V. H. J. de Beer. J. Calal .• 1980.61.
SS9. 26 N. O. Hoyle. P. H. Newbill. K. Rollins. P. A. Sermon and A. T. Wurie. J. CM",. Soc .• Foradi:Jy T,tJIU.
I. 1985. I •• 26OS. 27 D. S. Zin ... L. E. Makovsky. R. E. TilCher. F. R. Brown and D. M. Hercules. J. pltys. CM", .• 1980.
14.2898. 28 H. P. Boehm and M. Henman. Z. Allor,. All,. awlll .• 1967.351. 156; 1969.361.13. 29 D. an .... HIIIIIlbooIc of X-Ray _ Ultrllf1iol" Pltoloe/«trOff S~ll'Ost:opy. Heyden. London. 1978. . 30 £SCA AI~. MoI«UItJI411111 SoIId-Sllll' Slrvclun by IfVCIIU of E1«lrtJff Sp«lrDSCOPY. ed. K. Sielbahn
(Almquist and Wikse1ls. Upptala. 1967). . 31 A. Husain and L. KihlborJ, J. Solid SI"" CItmt •• 1978.15.189. 32 Y. M. SoIoain and Y. G. Privalov. DoptJf1. AIuMt. NIMJIc. Ukr. RSR .• :in. B. I98S. 43; B. Gerand.
J. Dessciae. P. Ndata aad M. Fillan. Slud. l-r. CIwm .• 1983.3.457; B. Gerand and M. Fillarz. in Spillowr of AdItritd Sp«Ws ed. G. M. Pajonk. S. J. Teichner and J. E. Gennain (Elsevier. Amsterdam. 1983). 275: M. Fillarz and B. Gerand. Mat". Sci. M-rr .• 1982. 10. 887.
II D. E. Rcsuco. M. C. Abello. C. M. Aldao and D. G. Lomer. R,ocl. Kin". Clllm. Lm .• 1985. 11. 407: M. Grosman and D. G. Lomer. R,oct. KiMI. Cillm. UII •• 1985.11. S3.
3-4 M. W. Roberts and C. S. McKee, Clwmulry of 1M M""I-Ga {II",flla (Oxrord University Press). 35 R. T. Oavis, J. A",. CMIII. Soc •• 1946, 61. 13U 36 W. G. Frankenbllfl, J. A",. CM",. 5« .• 1944.66. 1827; B. M. W. Trapnell. hoc. R. Soc. London. ~r.
A. 1951. _ 39. 37 T. Taman and T. Hamamura. S",f. Sci., 1910.95. L293. 38 K. Griftltba. C. Kendoll. D. A. Kina and J. B. Pendry. plt;vs. Rn. UII .• 1981. ~ IS84. 39 R. Jaqer and D. MeueI.. Swf, Sci .. 1980. lOG. 561. 40 K.. Griftltba. C. Keadon. D. A. Kina and J. B. Pendry. Plt;vs. RIo. UII., 1981.46. 1584: P.I. Estrup
and R. A. Barker. hoc. 1111. CMf. 0'''';''1 Two DilfWfUitIftJ. ed. S. K. Sinha (Elsevier. Amsterdam, 1980).
41 B. K. Apwal. Pltys. R,,, .. 1980.118. 373-4. 42 K. I. Ailta. HyotrWII. \98S. D. 104. 43 D. N. Furlon .. K. S. W. Sinl and G. D. Parfitt. AtiMsiOff Sci. T~dutol .. in press. oW S. A. Lawrence. K. MavadiL P. A. Sennon and S. SlCVenson. hoc. R. Soc. lAItdOff.:in. A. submitted. 4S JaptIIW# 1'""", 51. 224.183 (1983). 46 N. A. Karibdzhanyall.l. A. SimulinL Z. I. Vorotilina and S. S. Mischenko. Kltim. PrOffl. SI. (Moscow).
1980.294. 47 J. Lee.. R. J. Madix. J. E. SchIaeFI and D. J. Auerbach. S""./. Sci .. 1984. 143.626. 48 B. D. Aleksic. I. G. Mitov. D. G. Klisurslti. N. A. Petranovic:. N. N. Jovanovic: and S. S. Bosdanov.
GltII. Hmr. Dnu . .",,.fId .. 1984.49.477. 49 M. Bowker. I. B. Parker and K. C. Waup. Appl. Calm .• 19as. 14. 101. SO M. W. Holmes and O. A. Kin .. PNIC. R. Soc .• l.tIftdon ~,. A. 1981.376. 56S. 51 N. K.osakL Y. Sakai and N. Tsuda. J. CUlul .• 1986.91.95. S2 G. Enl. Clllal. Rft'. Sci. EII~ .. 1980. 11. 201. . 53 W. Liu and T. T. Tsonl. Sur/. Sci .. 1986. 165. L26: G. Enl. D. Prine. R. Schlocgl and M. WClSS. J.
CUlal .. 1983. 79. J59. . I 54 A. lannibello. S. Marengo. P. Tiltarelli. G. Morelli and A. Zecchina. J. Chtm. Sex: .. Forada.l· rrallS •
1984.80.2209: L. Salvati. L. E. Makovsky. J. M. Stencel. F. R. Brown and O. M. Hercules. J. PIt.,·s. Ch~m .• 1981. as. 3700: A. J. M. Roosmalen. D. K.oster and J. C. Mol. J. Plt.I·!. CIt~m .. 1980.84.3075.
PUfWr 6/1434: R~('~i,-e" 18,It Jul.". 1986

APPENDIX 2
X-ray Diffraction of Tungsten Powder
Q SinS dexptJnm d1 i teratur/ nm hk1
20.104 0.344 0.224 0.224 110
20.156 0.345 0.223 0.224 110
29.092 0.486 0.158 0.158 200
36.553 0.596 0.129 0.129 211
36.562 0.596 0.129 0.129 211

APPENDIX 2
X-ray Diffraction of W03-
9 Sine dexpt./nm dliteratur/nm hkl
11 .665 0.202 0.381 0.380 020
12.019 0.208 0.369 0.365 200
14.217 0.245 0.313 0.312 112
16.487 0 .. 283 0.271 0.269 022
16.929 0.291 0.264 0.263 202 -
17.677 0.303 0.253 0.253 122 -
20.664 0.353 0.218 0.218 222
24.774 0.419 0.184 0.183 140 -
27.592 0.463 0.166 0.166 402

APPENDIX 2
X-~ay Diffraction of K2~
9 Sine dexpt.lnm d1 iteratur/nm hk1
-7.80 0.136 0.567 0.570 201
8.00 0.139 0.553 0.556 200
8.25 0.143 0.536 0.536 110 -9.40 0.163 0.471 0.471 111
11.60 0.201 0.383 0.383 111 -12.00 0.208 0.370 0.371 202
12.35 0.214 0.360 0.360 201
13. 15 0.228 0.338 0.339 002
14.05 0.243 0.317 0.317 310
14.60 0.252 0.305 0.305 020 -15.25 0.263 0.293 0.293 312
16.10 0.277 0.278 0.278 400 -16.60 0.286 0.269 0.269 221
17.05 0.293 0.262 0.263 112 -19.00 0.326 0.236 0.236 222
19.80 0.339 0.227 0.227 022
22.85 0.388 0.198 0.198 312 -25.20 0.423 0.181 0.180 314 -26.20 0.445 0.174 0.174 332 -26.85 0.452 0.170 0.170 514 -31. 75 0.526 0.146 0.146 315

APPENDIX 2
X-ray Diffraction of N2~
Q SinQ dexptJnm * d1iterature/nm hk1
8.293 0.144 0.533 0.528 111
13.775 0.238 0.323 0.323 220
16.648 0.286 0.268 0.275 311
19.425 0.333 0.231 0.228 400
20.617 0.352 0.218 0.209 331
27.301 0.459 0.167 0.161 440
* Sample was prepared by heating at 373K a sample of sodium
tungstate dihydrate.

Element Signal
Cl s
W4f5/2
W4f7/2
W4d3/2
W4d5/2
APPENDIX 3
X-ray Photoelectron Spectroscopy
Tungsten Powder
Observed Corrected Binding Binding Energy eV Energy eV
294.1 284.6
45.1 35.6
43.1 33.6
267.6 258.1
254.2 244.7
Observed Shift
eV
2.45
2.60
2.90
3.30

Element Signal
Cls
Ols
W4fS/2
W4f7/2
W4d 3/2
W4d 5/ 2
APPENDIX 3
X-ray Photoelectron Spectroscopy
W03
Observed Corrected Binding Binding Energy eV Energy eV
294.1 284.6
539.6 530.1
47.4 37.9
46.5 36.0
268.5 258.0
256.3 245.8
Observed Shift
eV
7.90
4.75
5.00

APPENDIX 3
X-ray Photoelectron Spectroscopy
Potassium Tungstate
Element Signal Observed Corrected Observed Binding Binding Shift Energy eV Energy eV eV
C1s 297.1 284.6
01s 542.6 530.1 7.90
W4f5/ 51.1 38.6 5.45 2
W4f7/2
49.0 36.5 5.50
W4d3/2
269.9 257.4 3.60
W4dS/2
257.5 245.0 3.00
K2P1/ 308.12 295.62 3.38 2
K2P3/2
305.4 292.9 3.10

APPENDIX 3
X-ray Photoelectron Spectroscopy
Sodium Tungstate ;
Element Signal Observed Corrected Observed Binding Binding Shift Energy eV Energy eV eV
C1s 294.8 284.6
01s 540.9 530.7 7.30
W4f5/ 48.6 38.4 5.25 2
W4f7/ 46.5 36.3 5.30 2
W4d3/ 268.1 257.9 3.10 2
W4d5/ 255.6 245.4 2.60 2
Nal s . 1081. 5 1071. 3 3.70

Element Signal
C1s
01s
W4f5/ 2
W4f7/ 2
W4d3/2
W4d5/2
K2Pl /2
K2 P3/2
APPENDIX 3
X-ray Photoelectron Spectroscopy
Sample 0.05KW
Observed Corrected Binding Binding Energy eV Energy eV
292.3 284.6
536.3 528.6
45.7 38.0
43.7 36.0
266.7 259.0
254.3 246.6
303.2 295.5
299.8 292.1
Observed Shift
eV
9.40
4.85
5.00
2.00
1.40
3.50
3.90

Element Signal
C15
015
W4f5/2
W4f7/2
W4d3/ 2
W4d 5/2
K2P1/2
K2P3/ 2
APPENDIX 3
X-ray Photoelectron Spectroscopy
Sample O.2KW
Observed Corrected Binding Binding Energy eV Energy eV
302.8 284.6
546.1 527.9
56.0 37.8
54.1 35.9
277 .6 259.4
264.5 246.3
312.7 294.5
309.6 291.4
Observed Shift
eV
10.10
4.65
4.90
1.60
1. 70
4.50
4.60

Element signal
C1s
01s
W4f5/2
W4f7/2
W4d3/ 2
W4dS/2
K2P1/2
K2P3/2
APPENDIX 3
X-ray Photoelectron Spectroscopy
Samp 1 eO. 3 KW
Observed Corrected Binding Binding Energy eV Energy eV
298.1 284.6
541.6 528.1
51.6 38.1
49.6 36.1
271.6 258.1
259.2 245.7
307.6 294.1
305.1 291.6
Observed Shift
eV
9.90
4.95
5.10
2.90
2.30
4.90
4.40

APPENDIX 3
X-ray Photoelectron SEectroscopy
Sample 0.6KW
Element Signal Observed Corrected Observed Binding Binding Shift Energy eV Energy eV eV
Cls 292.6 284.6
Ols 541.1 533.1 4.90
W4fS/ 4S.2 37.2 4.05 2
W4f7/2
43.0 3S.0 4.00
W4d3/2
267.7 259.7 1. 30
W4dS/ 254.6 246.6 1.40 2
K2Pl/ 303.7 295.7 3.30 2
K2P3/2
300.8 292.8 3.20

Element Signal
Cls
01s
W4f5/ 2
W4f7/ 2
W4d3/ 2
W4dS/2
K2P1/2
K2P3/ 2
APPENDIX 3
X-ray Photoelectron Spectroscopy
Sample 0.8KW
Observed Corrected Binding Binding Energy eV Energy eV
293.5 284.6
534.8 525.9
46.9 38.0
44.8 35.9
267.1 258.2
254.5 245.6
303.3 294.4
300.3 291.4
Observed Shift
eV
12.10
4.85
4.90
2.80
2.40
4.60
4.60

Element Signal
C15
015
W4f5/ 2
W4f7/ 2
W4d3/ 2
W4dS/ 2
Nals
APPENDIX 3
X-ray Photoelectron Spectroscopy
Sample 0.05NaW
Observed Corrected Binding Binding Energy eV Energy eV
292.7 284.6
539.0 530.9
45.6 37.5
43.6 35.5
268.3 260.2
25S.4 247.3
1079.7 1071 .6
Observed Shift
eV
7.10
4.35
4.50
0.80
0.70
3.40

Element Signal
C1s
01s
W4f5/ 2
W4f7/ 2
W4d3/2
W4d5/2
Na1s
APPENDIX 3
X-ray Photoelectron Spectroscopy
Sample O.2NaW
Observed Corrected Binding Binding Energy eV Energy eV
292.6 284.6
538.7 522.7
45.7 37.7
43.8 35.8
267.8 259.8
254.8 246.8
1079. 1 1071. 1
Observed Shift
eV
15.3
4.55
4.80
1.20
1.20
3.90

APPENDIX 3
X-ray Photoelectron Seectroscoe~
Samele 0.3NaW
Element Signal Observed Corrected Observed Binding Binding Shift Energy eV Energy eV eV
C1s 292.7 284.6
Ols 539.4 531.3 6.70
W4fS/ 45.7 37.6 4.45 2
W4f7/ 43.7 35.6 4.60 2
W4d3/2
267.6 259.S 1. SO
W4dS/2
254.9 246.8 1.20
Na1s 1079.8 1071. 7 3.30

APPENDIX 3
X-ray Photoelectron Spectroscopy
Sample O.GNaW
Element Signal Observed Corrected Observed Binding Binding Shift Energy eV Energy eV eV
Cl s 292.5 284.6
Ols 539.1 531.2 6.80
W4f5/2 45.8 37.9 4.75
W4f7/2
43.6 35.7 4.70
W4d3/2
267.8 259.9 1.10
W4d 5/ 254.9 247.0 1.00 2
Nals 1079.7 1071. 8 3.20

Element Signal
Cls
Ols
W4f5/2
W4f7/2
W4d3/ 2
W4d5/ 2
Nals
APPENDIX 3
X-ray Photoelectron Spectroscopy
Sample 0.8NaW
Observed Corrected Binding Binding Energy eV Energy eV
292.6 284.6
538.6 530.6
45.5 37.5
43.4 35.4
268.0 260.0
254.6 246.6
1079.2 1071. 2
Observed Shift
eV
7.40
4.35
4.40
1.00
1.40
3.80

APPENDIX 3
X-ray Photoelectron Spectroscopy
Sample KO.05 W03
Peak Area Relative Element Peak Area S.F. Ratio
K2p 15.5 10.56 0.101
W4d 665 104.40 1.000
Sample KO. 2 W03
Peak Area Relative Element Peak Area S.F. Ratio
K2p 34.5 23.50 0.238
W4d 630 98.90 1.000
Sample KO.3 W03
Peak Area Relative Element Peak Area S.F. Ratio
K2p 57.0 38.83 0.361
W4d 685 107.54 1.000

APPENDIX 3
X-ray Photoelectron Spectroscopy
Sample KO.6 W03
Peak Area Relative Element Peak Area S.F. Ratio
K2p 95.0 64.71 0.632
W4d 652.5 102.43 1.000
Sample KO.8 W03
Peak Areq Relative Element Peak Area S.F. Ratio
K2p 125.5 85.49 0.807
W4d 675 105.97 1.000
Sample NaO.05 W03
Peak Area Relative Element Peak Area S.F. Ratio
Na1s 103 220.56 0.084
W4f 12255 2627.01 1.000
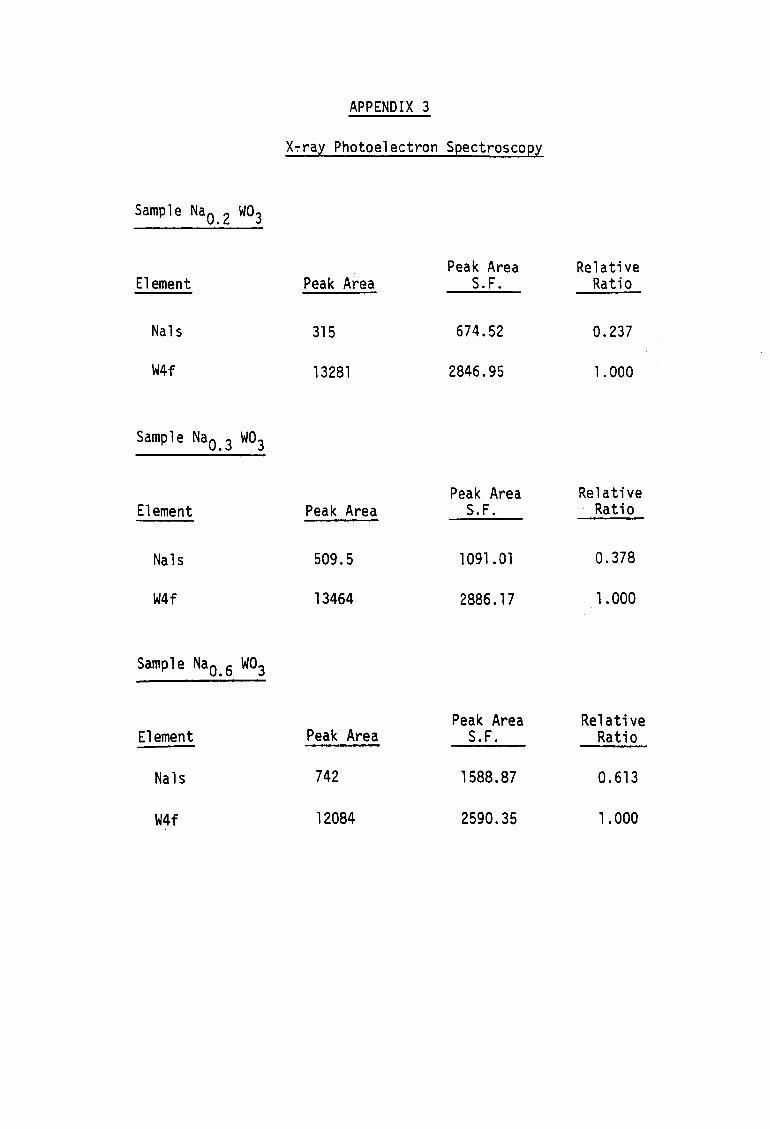
Sample NaO. 2 W03
Element
Na1s
W4f
Sample NaO.3 W03
Element
Na1s
W4f
Sample NaO. 6 W03
Element
Nals
W4f
APPENDIX 3
X~ray Photoelectron Spectroscopy
Peak Area
315
13281
Peak Area
509.5
13464
Peak Area
742
12084
Peak Area S.F.
674.52
2846.95
Peak Area S.F.
1091. 01
2886.17
Peak Area S.F.
1588.87
2590.35
Relative Ratio
0.237
1.000
Relative Ratio
0.378
1.000
Relative Ratio
0.613
1.000

APPENDIX 3
X-ray Photoelectron Spectroscopy
Sample NaO.8 W03
Peak Area Relative Element Peak Area S.F. Ratio
Na1s 908 1944.33 0.823
W4f 11019 2362.06 1.000

Element
K2p
W4d
Nals
W4f
APPENDIX 3
X-ray Photoelectron Spectroscopy
Sensitivity Factors
Photoelectron Signal Intensity
1.468
6.370
0.467
4.665

APPENDIX 4
Calculation of Copper Surface Area in
CUyKxW03 from N20 Decomposition
Weight of sample used
N2 residual pressure
(1 Torr = 133.33Pa)
= 1. 03579.
= 2.77 Torr.
= 369.32Pa.
Using the gas equation;
where PR is the residual N2 pressure (369.32Pa).
VE is the equilibrium volume (30.67 x 10⁻⁶ m3).
R is the gas constant (8.314Jmol- l )
T is room temperature (295K)
n is the number of moles of N2
n = 369.32 x 30.67 x 10-6
8.314 x 295
= 4.62 umoles of N2
Amount of oxygen adsorbed by sample;
= 4.62 umo1es of 0
= 4.46 umo1es of 0 per gram of sample
= 2.68 x 10¹⁸ oxygen atoms per gram of ~amp1e
Assuming Cu : 0 = 2: 1
Therefore copper surface atoms
= 5.36 x 10¹⁸
Assuming there are 1.41 x 10¹⁹ Cu atoms per m2;
Cu surface area = 0.38m2g-1 sample