Resin acids and Rosin acids, hydrogenated, esters with glycerol
151
Substance Evaluation Conclusion document EC No 266-042-9 Evaluating MS: Finland Page 1 8 July 2021 SUBSTANCE EVALUATION CONCLUSION as required by REACH Article 48 and EVALUATION REPORT for Resin acids and Rosin acids, hydrogenated, esters with glycerol EC No 266-042-9 CAS No 65997-13-9 Evaluating Member State(s): Finland Dated: 8 July 2021
-
Upload
khangminh22 -
Category
Documents
-
view
1 -
download
0
Transcript of Resin acids and Rosin acids, hydrogenated, esters with glycerol
Substance Evaluation Conclusion document EC No 266-042-9
Evaluating MS: Finland Page 1 8 July 2021
SUBSTANCE EVALUATION CONCLUSION
as required by REACH Article 48
and
EVALUATION REPORT
for
Resin acids and Rosin acids, hydrogenated, esters with glycerol
EC No 266-042-9
CAS No 65997-13-9
Evaluating Member State(s): Finland
Dated: 8 July 2021
Substance Evaluation Conclusion document EC No 266-042-9
Evaluating MS: Finland Page 2 8 July 2021
Evaluating Member State Competent Authority
Finnish Safety and Chemicals Agency
P.O.Box 66 (Opastinsilta 12B)
FI-00521 Helsinki
Finland
Tel: +358 29 5052 000
Fax: -
Email: [email protected]
Year of evaluation in CoRAP: 2015
Before concluding the substance evaluation a Decision to request further information was
issued on 7 February 2017
Further information on registered substances here:
http://echa.europa.eu/web/guest/information-on-chemicals/registered-substances
Substance Evaluation Conclusion document EC No 266-042-9
Evaluating MS: Finland Page 3 8 July 2021
DISCLAIMER
This document has been prepared by the evaluating Member State as a part of the substance
evaluation process under the REACH Regulation (EC) No 1907/2006. The information and views
set out in this document are those of the author and do not necessarily reflect the position or
opinion of the European Chemicals Agency or other Member States. The Agency does not
guarantee the accuracy of the information included in the document. Neither the Agency nor the
evaluating Member State nor any person acting on either of their behalves may be held liable
for the use which may be made of the information contained therein. Statements made or
information contained in the document are without prejudice to any further regulatory work that
the Agency or Member States may initiate at a later stage.
Substance Evaluation Conclusion document EC No 266-042-9
Evaluating MS: Finland Page 4 8 July 2021
Foreword
Substance evaluation is an evaluation process under REACH Regulation (EC) No.
1907/2006. Under this process the Member States perform the evaluation and ECHA
secretariat coordinates the work. The Community rolling action plan (CoRAP) of substances
subject to evaluation, is updated and published annually on the ECHA web site1.
Substance evaluation is a concern driven process, which aims to clarify whether a
substance constitutes a risk to human health or the environment. Member States evaluate
assigned substances in the CoRAP with the objective to clarify the potential concern and,
if necessary, to request further information from the registrant(s) concerning the
substance. If the evaluating Member State concludes that no further information needs to
be requested, the substance evaluation is completed. If additional information is required,
this is sought by the evaluating Member State. The evaluating Member State then draws
conclusions on how to use the existing and obtained information for the safe use of the
substance.
This Conclusion document, as required by Article 48 of the REACH Regulation, provides the
final outcome of the Substance Evaluation carried out by the evaluating Member State.
The document consists of two parts i.e. A) the conclusion and B) the evaluation report. In
the conclusion part A, the evaluating Member State considers how the information on the
substance can be used for the purposes of regulatory risk management such as
identification of substances of very high concern (SVHC), restriction and/or classification
and labelling. In the evaluation report part B the document provides explanation how the
evaluating Member State assessed and drew the conclusions from the information
available.
With this Conclusion document the substance evaluation process is finished and the
Commission, the Registrant(s) of the substance and the Competent Authorities of the other
Member States are informed of the considerations of the evaluating Member State. In case
the evaluating Member State proposes further regulatory risk management measures, this
document shall not be considered initiating those other measures or processes. Further
analyses may need to be performed which may change the proposed regulatory measures
in this document. Since this document only reflects the views of the evaluating Member
State, it does not preclude other Member States or the European Commission from
initiating regulatory risk management measures which they deem appropriate.
1 http://echa.europa.eu/regulations/reach/evaluation/substance-evaluation/community-rolling-action-plan
Substance Evaluation Conclusion document EC No 266-042-9
Evaluating MS: Finland Page 5 8 July 2021
Contents
Part A. Conclusion ................................................................................................................ 8
1. CONCERN(S) SUBJECT TO EVALUATION .............................................................................. 8
2. OVERVIEW OF OTHER PROCESSES / EU LEGISLATION .......................................................... 8
3. CONCLUSION OF SUBSTANCE EVALUATION ......................................................................... 9
4. FOLLOW-UP AT EU LEVEL .................................................................................................. 9
4.1. Need for follow-up regulatory action at EU level ................................................................. 9
4.1.1. Harmonised Classification and Labelling ......................................................................... 9
4.1.2. Identification as a substance of very high concern, SVHC (first step towards authorisation) .. 9
4.1.3. Restriction ................................................................................................................. 9
4.1.4. Other EU-wide regulatory risk management measures ..................................................... 9
5. CURRENTLY NO FOLLOW-UP FORESEEN AT EU LEVEL ......................................................... 10
5.1. No need for regulatory follow-up at EU level .................................................................... 10
5.2. Other actions .............................................................................................................. 10
6. TENTATIVE PLAN FOR FOLLOW-UP ACTIONS (IF NECESSARY) .............................................. 11
Part B. Substance evaluation ............................................................................................... 12
7. EVALUATION REPORT...................................................................................................... 12
7.1. Overview of the substance evaluation performed ............................................................. 12
7.2. Procedure ................................................................................................................... 13
7.3. Identity of the substance .............................................................................................. 15
7.4. Physico-chemical properties .......................................................................................... 16
7.5. Manufacture and uses .................................................................................................. 17
7.5.1. Quantities ................................................................................................................ 17
7.5.2. Overview of uses ...................................................................................................... 17
7.6. Classification and Labelling ........................................................................................... 18
7.6.1. Harmonised Classification (Annex VI of CLP) ................................................................ 18
7.6.2. Self-classification ...................................................................................................... 18
7.7. Environmental fate properties ....................................................................................... 18
7.7.1. Degradation ............................................................................................................. 18
7.7.1.1. Abiotic degradation .................................................................... 19
7.7.1.1.1 ................................................................................................. Hydrolysis ........................................................................................................... 19
7.7.1.1.2 ........................................................ Phototransformation and photolysis
........................................................................................................... 22
7.7.1.2. Biodegradation in water – estimated data ..................................... 22
7.7.1.3. Biodegradation in water – screening tests ..................................... 25
7.7.1.3.1. Overview of ready biodegradation studies .................................. 25
7.7.1.3.2. OECD TG 310 studies on monoesters of hydrogenated resin acids
with glycerol ......................................................................................... 33
Test substances ..................................................................................... 33
Test conditions and methods ................................................................... 35
Comparison with the requirements of the SEv decision ............................... 35
Recalculations of the CO2 production results by the eMSCA ......................... 35
Substance Evaluation Conclusion document EC No 266-042-9
Evaluating MS: Finland Page 6 8 July 2021
Validity criteria and toxicity controls ......................................................... 35
GC-MS measurements of monoesters: methods ......................................... 36
Presentation of the results ...................................................................... 38
CO2 production in active tests .................................................................. 38
GC-MS measurements of the monoesters: results ...................................... 39
GC-MS measurements of resin acids, diesters, and triesters ........................ 40
HPLC measurements of resin acids, monoesters, diesters, triesters, and heavy ends ............................................................................................ 41
Primary degradation of monoesters: approach ........................................... 42
Primary degradation of monoesters: results .............................................. 43
Estimation of ultimate degradation (% ThIC) of the monoesters .................. 43
Discussion on selected issues important for P/vP assessment ...................... 45
Reliability .............................................................................................. 50
Relevance ............................................................................................. 51
Summary of the OECD TG 310 studies on the monoesters .......................... 52
7.7.1.5. Biodegradation in soil ....................................................................... 83
7.7.1.6 Prediction of microbial transformation of selected monoester constituents 83
7.7.1.7 Biotransformation of resin acids under anoxic/anaerobic conditions ......... 88
7.7.1.8 Other studies on degradation of rosin substances .................................. 90
7.7.2. Distribution .............................................................................................................. 90
7.7.3. Bioaccumulation ....................................................................................................... 93
7.7.3.1 Experimental data ............................................................................. 93
7.7.3.2 Partition coefficients .......................................................................... 94
7.7.3.3 Predicted bioconcentration factors (BCF) and bioaccumulation ................ 96
factors (BAF) ............................................................................................... 96
7.7.3.3.1 Estimation of the applicability of EPI Suite BCFBAF regression model
to the Substance ................................................................................... 97
7.7.3.3.2 Estimation of the applicability of EPI Suite BCFBAF Arnot-Gobas model to the ester constituents of the Substance ....................................... 98
7.7.3.3.3 The whole body primary biotransformation rate constant (kM) model for fish ................................................................................................. 99
7.7.3.4 Molecular size as a limiting factor for bioaccumulation.......................... 101
7.7.3.5 Bioaccumulation potential of the starting materials (resin acids and alcohol) .................................................................................................................... 102
7.7.3.6 Summary and conclusions ................................................................ 102
7.8. Environmental hazard assessment ............................................................................... 103
7.8.1. Aquatic compartment (including sediment)................................................................. 103
7.8.1.1. Fish ........................................................................................ 103
7.8.1.1.1 Short-term toxicity to fish ....................................................... 103
7.8.1.1.2 Long-term toxicity to fish ........................................................ 105
7.8.1.2. Aquatic invertebrates ............................................................... 105
7.8.1.2.1 ........................................... Short-term toxicity to aquatic invertebrates
......................................................................................................... 105
7.8.1.2.2 ............................................ Long-term toxicity to aquatic invertebrates
......................................................................................................... 108
7.8.1.3 Algae and aquatic plants .................................................................. 108
7.8.1.4 Estimated data ................................................................................ 110
Substance Evaluation Conclusion document EC No 266-042-9
Evaluating MS: Finland Page 7 8 July 2021
7.8.1.5 Summary of short-term aquatic toxicity ............................................. 111
7.8.1.6 Sediment organisms ........................................................................ 111
7.8.1.7 Other aquatic organisms .................................................................. 111
7.8.2. Terrestrial compartment .......................................................................................... 112
7.8.3. Microbiological activity in sewage treatment systems ................................................... 112
7.8.4. PNEC derivation and other hazard conclusions ............................................................ 112
7.8.5. Conclusions for classification and labelling .................................................................. 112
7.9 Human Health hazard assessment ................................................................................ 112
7.9.1 Toxicokinetics .......................................................................................................... 113
7.9.2 Acute toxicity and Corrosion/Irritation ........................................................................ 114
7.9.3 Sensitisation ........................................................................................................... 114
7.9.4 Repeated dose toxicity .............................................................................................. 115
7.9.5 Mutagenicity ............................................................................................................ 120
7.9.5.1 Non-human information ................................................................... 120
7.9.5.1.1 In vitro data .......................................................................... 120
7.9.5.1.2 In vivo data ................................................................................. 123
7.9.5.2 Human data .................................................................................... 123
7.9.6 Carcinogenicity ....................................................................................................... 123
7.9.7 Toxicity to reproduction (effects on fertility and developmental toxicity) ......................... 124
7.9.7.1 Non-human information ................................................................... 124
7.9.7.2 Human data .................................................................................... 125
7.9.8 Hazard assessment of physico-chemical properties ....................................................... 125
7.9.9 Selection of the critical DNEL(s)/DMEL(s) and/or qualitative/semi-quantitative descriptors for critical health effects ........................................................................................... 125
7.9.10 Conclusions of the human health hazard assessment and related classification and labelling ........................................................................................................................ 125
7.10 Assessment of endocrine disrupting (ED) properties ...................................................... 126
7.10.1 Endocrine disruption – Environment ......................................................................... 126
7.10.2 Endocrine disruption - Human health ........................................................................ 126
7.10.3 Conclusion on endocrine disrupting properties (combined/separate) ............................. 126
7.11 PBT and vPvB assessment .......................................................................................... 126
7.11.1 Persistence ............................................................................................................ 126
7.11.2 Bioaccumulation ..................................................................................................... 131
7.11.3 Toxicity ................................................................................................................. 133
7.11.4 Overall conclusion .................................................................................................. 134
7.12 Exposure assessment ............................................................................................... 136
7.12.1 Human health ........................................................................................................ 136
7.12.2 Environment ......................................................................................................... 136
7.12.3 Combined exposure assessment ............................................................................... 137
7.13 Risk characterisation ................................................................................................. 137
7.14 References ............................................................................................................... 137
7.15 Abbreviations ........................................................................................................... 143
Substance Evaluation Conclusion document EC No 266-042-9
Evaluating MS: Finland Page 8 8 July 2021
Part A. Conclusion
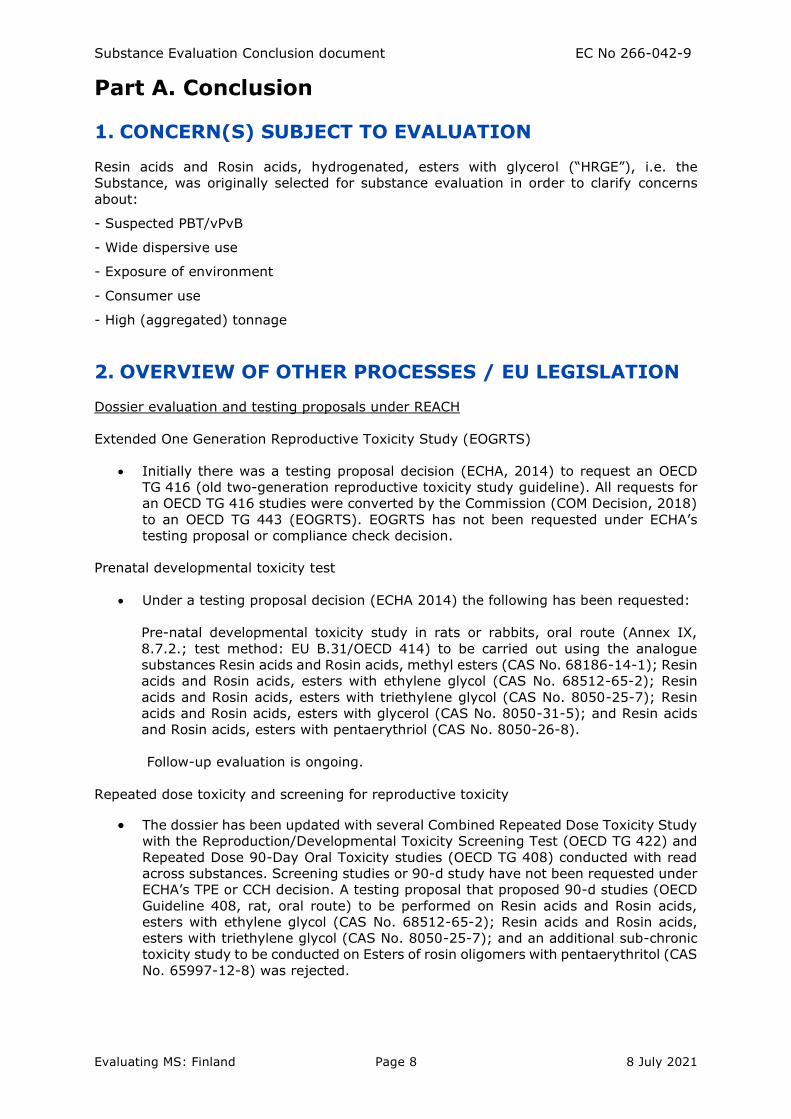
1. CONCERN(S) SUBJECT TO EVALUATION
Resin acids and Rosin acids, hydrogenated, esters with glycerol (“HRGE”), i.e. the
Substance, was originally selected for substance evaluation in order to clarify concerns
about:
- Suspected PBT/vPvB
- Wide dispersive use
- Exposure of environment
- Consumer use
- High (aggregated) tonnage
2. OVERVIEW OF OTHER PROCESSES / EU LEGISLATION
Dossier evaluation and testing proposals under REACH
Extended One Generation Reproductive Toxicity Study (EOGRTS)
• Initially there was a testing proposal decision (ECHA, 2014) to request an OECD
TG 416 (old two-generation reproductive toxicity study guideline). All requests for
an OECD TG 416 studies were converted by the Commission (COM Decision, 2018)
to an OECD TG 443 (EOGRTS). EOGRTS has not been requested under ECHA’s
testing proposal or compliance check decision.
Prenatal developmental toxicity test
• Under a testing proposal decision (ECHA 2014) the following has been requested:
Pre-natal developmental toxicity study in rats or rabbits, oral route (Annex IX,
8.7.2.; test method: EU B.31/OECD 414) to be carried out using the analogue
substances Resin acids and Rosin acids, methyl esters (CAS No. 68186-14-1); Resin
acids and Rosin acids, esters with ethylene glycol (CAS No. 68512-65-2); Resin
acids and Rosin acids, esters with triethylene glycol (CAS No. 8050-25-7); Resin
acids and Rosin acids, esters with glycerol (CAS No. 8050-31-5); and Resin acids
and Rosin acids, esters with pentaerythriol (CAS No. 8050-26-8).
Follow-up evaluation is ongoing.
Repeated dose toxicity and screening for reproductive toxicity
• The dossier has been updated with several Combined Repeated Dose Toxicity Study
with the Reproduction/Developmental Toxicity Screening Test (OECD TG 422) and
Repeated Dose 90-Day Oral Toxicity studies (OECD TG 408) conducted with read
across substances. Screening studies or 90-d study have not been requested under
ECHA’s TPE or CCH decision. A testing proposal that proposed 90-d studies (OECD
Guideline 408, rat, oral route) to be performed on Resin acids and Rosin acids,
esters with ethylene glycol (CAS No. 68512-65-2); Resin acids and Rosin acids,
esters with triethylene glycol (CAS No. 8050-25-7); and an additional sub-chronic
toxicity study to be conducted on Esters of rosin oligomers with pentaerythritol (CAS
No. 65997-12-8) was rejected.
Substance Evaluation Conclusion document EC No 266-042-9
Evaluating MS: Finland Page 9 8 July 2021
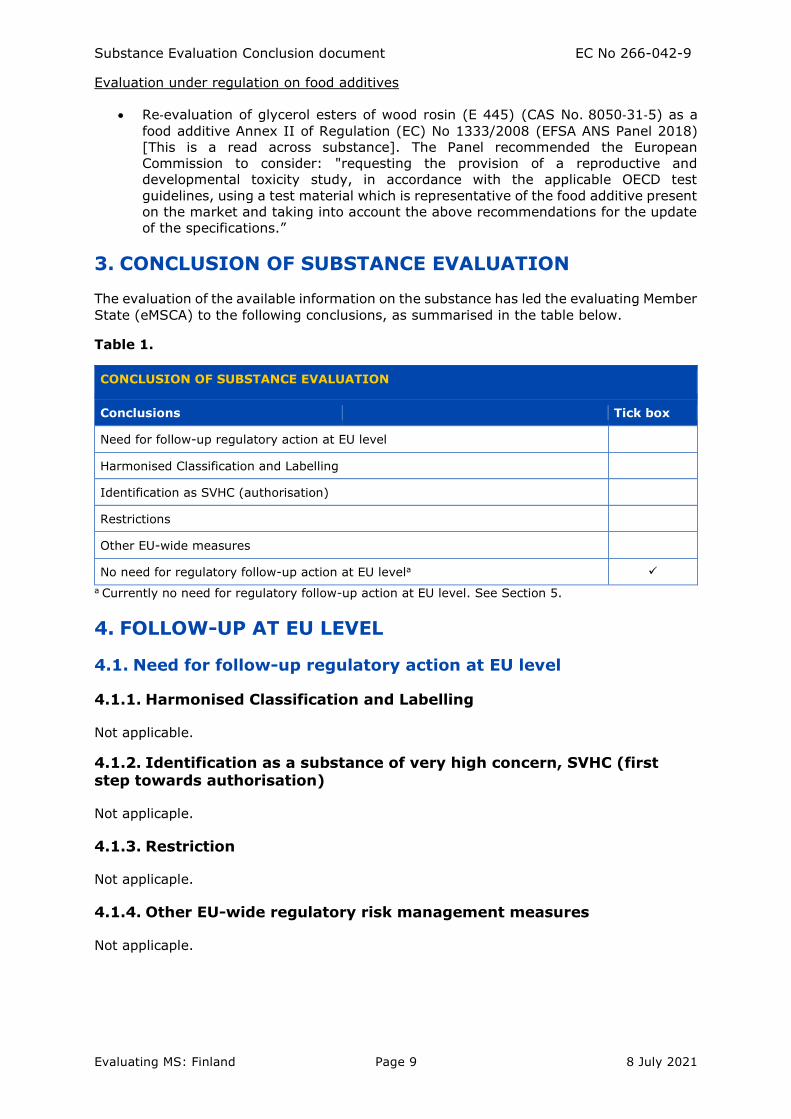
Evaluation under regulation on food additives
• Re‐evaluation of glycerol esters of wood rosin (E 445) (CAS No. 8050‐31‐5) as a
food additive Annex II of Regulation (EC) No 1333/2008 (EFSA ANS Panel 2018)
[This is a read across substance]. The Panel recommended the European
Commission to consider: "requesting the provision of a reproductive and
developmental toxicity study, in accordance with the applicable OECD test
guidelines, using a test material which is representative of the food additive present
on the market and taking into account the above recommendations for the update
of the specifications.”
3. CONCLUSION OF SUBSTANCE EVALUATION
The evaluation of the available information on the substance has led the evaluating Member
State (eMSCA) to the following conclusions, as summarised in the table below.
Table 1.
CONCLUSION OF SUBSTANCE EVALUATION
Conclusions Tick box
Need for follow-up regulatory action at EU level
Harmonised Classification and Labelling
Identification as SVHC (authorisation)
Restrictions
Other EU-wide measures
No need for regulatory follow-up action at EU levela ✓
a Currently no need for regulatory follow-up action at EU level. See Section 5.
4. FOLLOW-UP AT EU LEVEL
4.1. Need for follow-up regulatory action at EU level
4.1.1. Harmonised Classification and Labelling
Not applicable.
4.1.2. Identification as a substance of very high concern, SVHC (first step towards authorisation)
Not applicaple.
4.1.3. Restriction
Not applicaple.
4.1.4. Other EU-wide regulatory risk management measures
Not applicaple.
Substance Evaluation Conclusion document EC No 266-042-9
Evaluating MS: Finland Page 10 8 July 2021
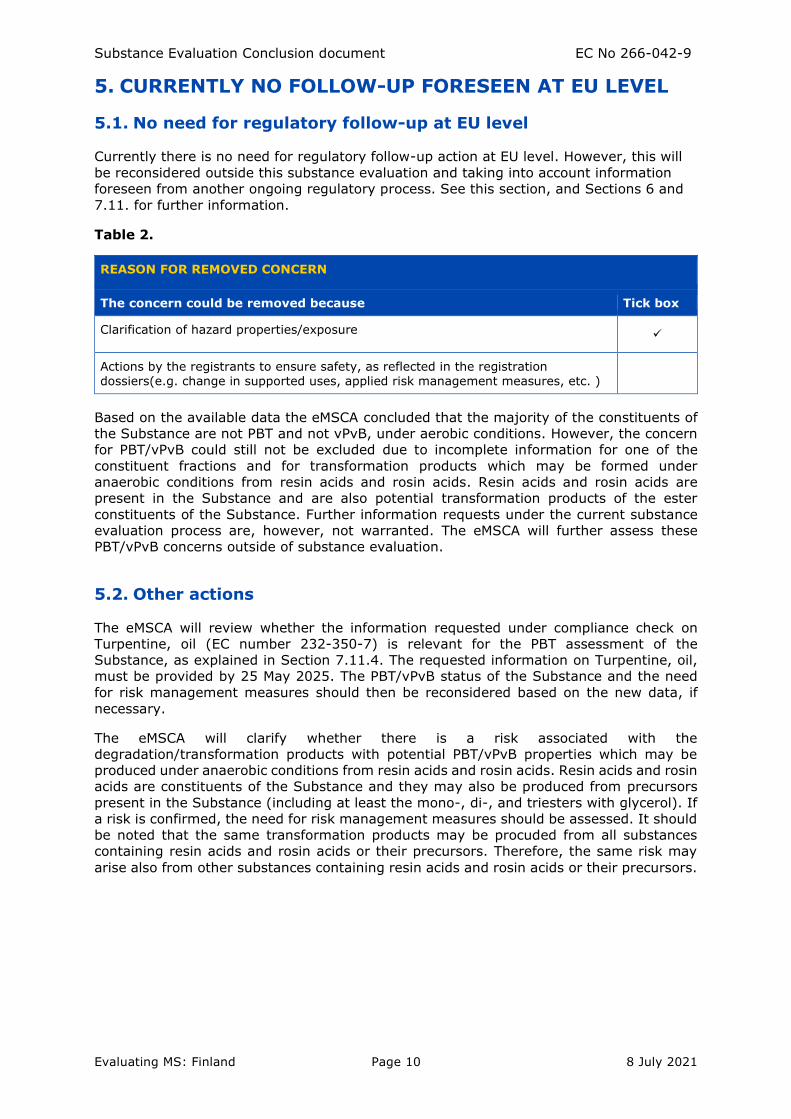
5. CURRENTLY NO FOLLOW-UP FORESEEN AT EU LEVEL
5.1. No need for regulatory follow-up at EU level
Currently there is no need for regulatory follow-up action at EU level. However, this will
be reconsidered outside this substance evaluation and taking into account information
foreseen from another ongoing regulatory process. See this section, and Sections 6 and
7.11. for further information.
Table 2.
REASON FOR REMOVED CONCERN
The concern could be removed because Tick box
Clarification of hazard properties/exposure ✓
Actions by the registrants to ensure safety, as reflected in the registration dossiers(e.g. change in supported uses, applied risk management measures, etc. )
Based on the available data the eMSCA concluded that the majority of the constituents of
the Substance are not PBT and not vPvB, under aerobic conditions. However, the concern
for PBT/vPvB could still not be excluded due to incomplete information for one of the
constituent fractions and for transformation products which may be formed under
anaerobic conditions from resin acids and rosin acids. Resin acids and rosin acids are
present in the Substance and are also potential transformation products of the ester
constituents of the Substance. Further information requests under the current substance
evaluation process are, however, not warranted. The eMSCA will further assess these
PBT/vPvB concerns outside of substance evaluation.
5.2. Other actions
The eMSCA will review whether the information requested under compliance check on
Turpentine, oil (EC number 232-350-7) is relevant for the PBT assessment of the
Substance, as explained in Section 7.11.4. The requested information on Turpentine, oil,
must be provided by 25 May 2025. The PBT/vPvB status of the Substance and the need
for risk management measures should then be reconsidered based on the new data, if
necessary.
The eMSCA will clarify whether there is a risk associated with the
degradation/transformation products with potential PBT/vPvB properties which may be
produced under anaerobic conditions from resin acids and rosin acids. Resin acids and rosin
acids are constituents of the Substance and they may also be produced from precursors
present in the Substance (including at least the mono-, di-, and triesters with glycerol). If
a risk is confirmed, the need for risk management measures should be assessed. It should
be noted that the same transformation products may be procuded from all substances
containing resin acids and rosin acids or their precursors. Therefore, the same risk may
arise also from other substances containing resin acids and rosin acids or their precursors.
Substance Evaluation Conclusion document EC No 266-042-9
Evaluating MS: Finland Page 11 8 July 2021
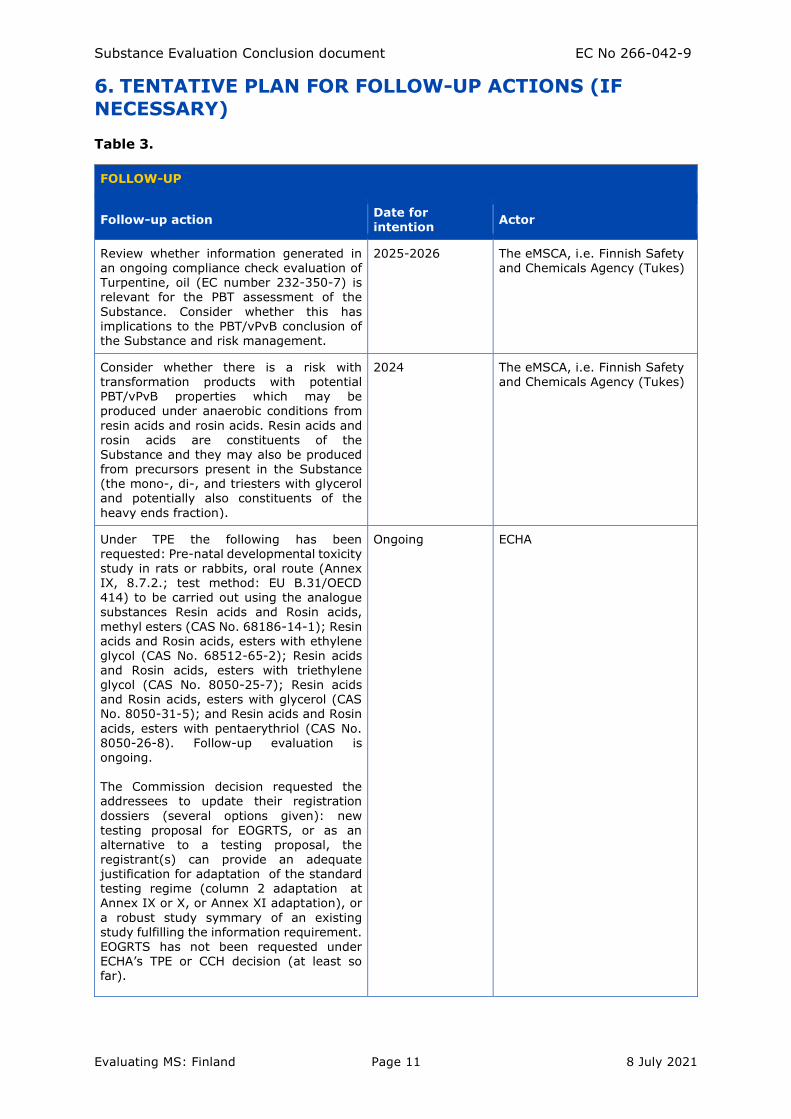
6. TENTATIVE PLAN FOR FOLLOW-UP ACTIONS (IF NECESSARY)
Table 3.
FOLLOW-UP
Follow-up action Date for intention
Actor
Review whether information generated in an ongoing compliance check evaluation of Turpentine, oil (EC number 232-350-7) is relevant for the PBT assessment of the
Substance. Consider whether this has implications to the PBT/vPvB conclusion of the Substance and risk management.
2025-2026 The eMSCA, i.e. Finnish Safety and Chemicals Agency (Tukes)
Consider whether there is a risk with transformation products with potential PBT/vPvB properties which may be produced under anaerobic conditions from
resin acids and rosin acids. Resin acids and rosin acids are constituents of the Substance and they may also be produced from precursors present in the Substance (the mono-, di-, and triesters with glycerol and potentially also constituents of the
heavy ends fraction).
2024 The eMSCA, i.e. Finnish Safety and Chemicals Agency (Tukes)
Under TPE the following has been requested: Pre-natal developmental toxicity study in rats or rabbits, oral route (Annex IX, 8.7.2.; test method: EU B.31/OECD
414) to be carried out using the analogue substances Resin acids and Rosin acids,
methyl esters (CAS No. 68186-14-1); Resin acids and Rosin acids, esters with ethylene glycol (CAS No. 68512-65-2); Resin acids and Rosin acids, esters with triethylene glycol (CAS No. 8050-25-7); Resin acids and Rosin acids, esters with glycerol (CAS No. 8050-31-5); and Resin acids and Rosin
acids, esters with pentaerythriol (CAS No. 8050-26-8). Follow-up evaluation is ongoing. The Commission decision requested the addressees to update their registration
dossiers (several options given): new
testing proposal for EOGRTS, or as an alternative to a testing proposal, the registrant(s) can provide an adequate justification for adaptation of the standard testing regime (column 2 adaptation at Annex IX or X, or Annex XI adaptation), or
a robust study symmary of an existing study fulfilling the information requirement. EOGRTS has not been requested under ECHA’s TPE or CCH decision (at least so far).
Ongoing ECHA
Substance Evaluation Conclusion document EC No 266-042-9
Evaluating MS: Finland Page 12 8 July 2021
Part B. Substance evaluation
7. EVALUATION REPORT
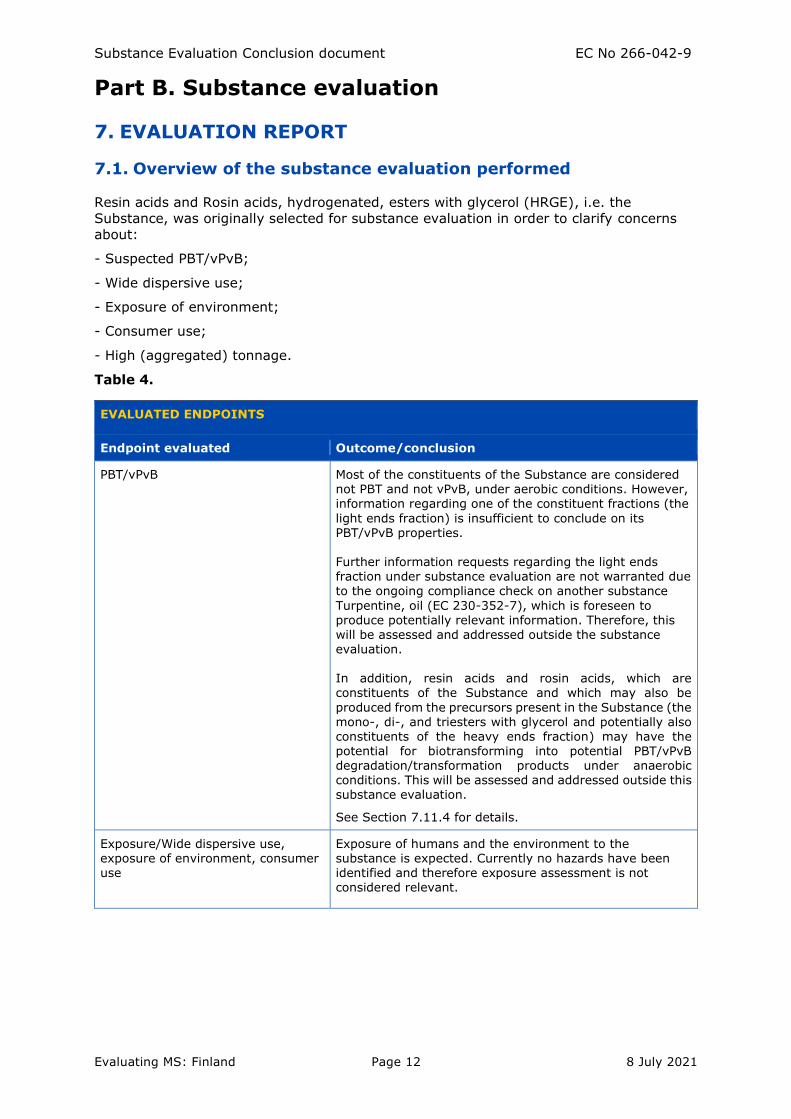
7.1. Overview of the substance evaluation performed
Resin acids and Rosin acids, hydrogenated, esters with glycerol (HRGE), i.e. the
Substance, was originally selected for substance evaluation in order to clarify concerns
about:
- Suspected PBT/vPvB;
- Wide dispersive use;
- Exposure of environment;
- Consumer use;
- High (aggregated) tonnage.
Table 4.
EVALUATED ENDPOINTS
Endpoint evaluated Outcome/conclusion
PBT/vPvB
Most of the constituents of the Substance are considered not PBT and not vPvB, under aerobic conditions. However, information regarding one of the constituent fractions (the
light ends fraction) is insufficient to conclude on its PBT/vPvB properties. Further information requests regarding the light ends fraction under substance evaluation are not warranted due
to the ongoing compliance check on another substance
Turpentine, oil (EC 230-352-7), which is foreseen to produce potentially relevant information. Therefore, this will be assessed and addressed outside the substance evaluation. In addition, resin acids and rosin acids, which are constituents of the Substance and which may also be
produced from the precursors present in the Substance (the mono-, di-, and triesters with glycerol and potentially also constituents of the heavy ends fraction) may have the potential for biotransforming into potential PBT/vPvB degradation/transformation products under anaerobic conditions. This will be assessed and addressed outside this substance evaluation.
See Section 7.11.4 for details.
Exposure/Wide dispersive use, exposure of environment, consumer use
Exposure of humans and the environment to the substance is expected. Currently no hazards have been identified and therefore exposure assessment is not considered relevant.

Substance Evaluation Conclusion document EC No 266-042-9
Evaluating MS: Finland Page 13 8 July 2021
7.2. Procedure
Category and analogue approach
For the purpose of REACH registration, the registrant(s) presented a testing strategy
comprising of categorizing rosin substances, testing of representative substances and
applying read-across to other analogue substances.
The Substance belongs to a category of 12 chemically related rosin esters:
Name Abbreviations
CAS Number
Rosin, methyl ester RME 68186-14-1
Rosin, hydrogenated, methyl ester HRME 8050-15-5
Rosin, ethylene glycol ester REGE 68512-65-2
Rosin, diethylene glycol ester 68153-38-8
Rosin, triethylene glycol ester 8050-25-7
Rosin, hydrogenated triethylene glycol ester 68648-53-3
Rosin, glycerol ester RGE 8050-31-5
Rosin, hydrogenated, glycerol ester (the Substance)
HRGE 65997-13-9
Rosin, pentaerythritol ester RPE 8050-26-8
Rosin, hydrogenated, pentaerythritol ester HRPE 64365-17-9
Rosin, oligomers, glycerol ester 68475-37-6
Rosin, oligomers, pentaerythritol ester 65997-12-8
PBT/vPvB screening
A PBT/vPvB screening was conducted for the Substance in 2012-2013, together with a
structural analogue 'Resin acids and Rosin acids, hydrogenated, esters with pentaerythritol
(HRPE), EC No 264-848-5' and a PBT factsheet was compiled based on the evaluation (No
37 and 38, May 23, 2014). The assessment was discussed in ECHA’s PBT Expert Group in
15 November 2012 and in 12-13 March 2013.
The Substance and HRPE are UVCB substances and based on a screening level assessment,
it was concluded that some of the ester constituents of these substances may have
PBT/vPvB properties, depending on the level of esterification. The conclusion was,
however, based on limited information.
For the screening assessment, experimental data was available only for the UVCB
substances as such (ready biodegradation tests, acute ecotoxicity tests and toxicity tests).
There was no experimental data on bioaccumulation. QSAR predictions (and log Kow and
water solubility values) on the constituents of the UVCB substances showed that the PBT-
properties of the constituents may differ significantly.
Based on molecular size and log Kow values, it could be concluded that the larger molecules
are unlikely to bioaccumulate (log Kow > 10; Dmax aver > 1.7 nm), whereas the smaller
molecules (monoesters) may have bioaccumulation potential (log Kow 5.22 for the
monoester constituents of the Substance). On the other hand QSAR results indicated that
the monoesters may be more easily biodegraded. Nevertheless, it was considered not
possible to conclude on the PBT-properties without more information on the constituents.
Therefore, the substances (HRGE and HRPE) were proposed for Substance Evaluation in
2015.
Substance Evaluation Conclusion document EC No 266-042-9
Evaluating MS: Finland Page 14 8 July 2021
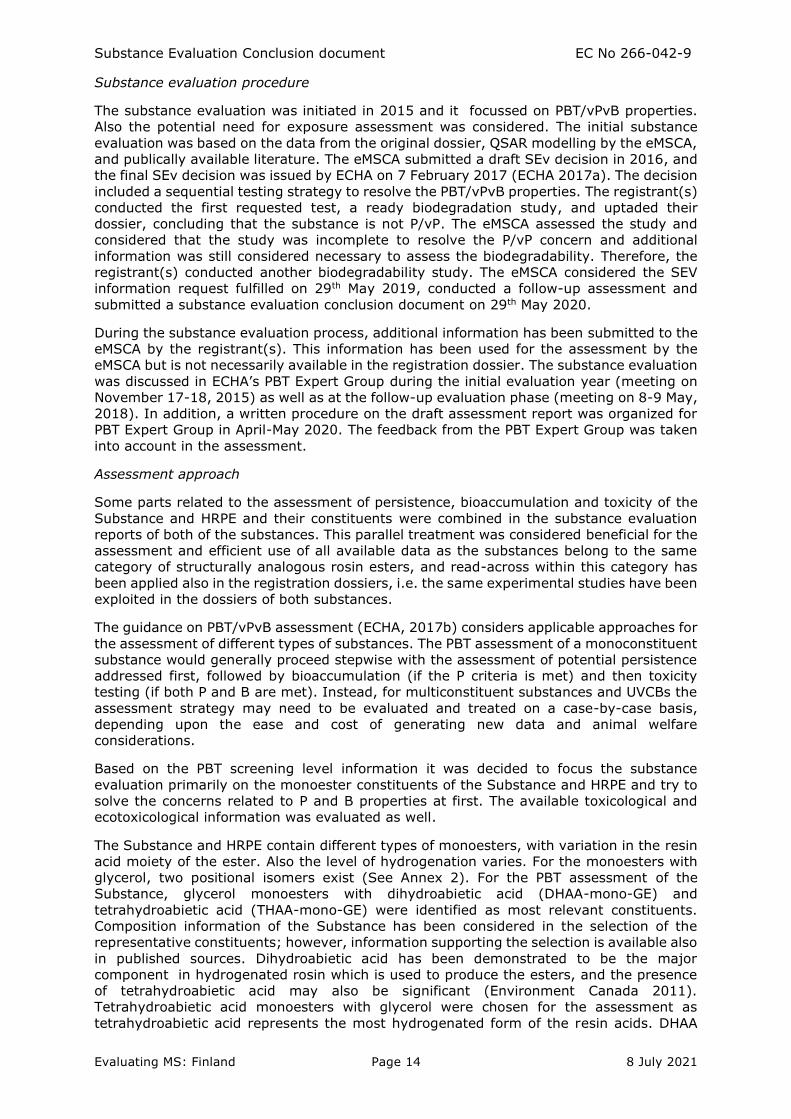
Substance evaluation procedure
The substance evaluation was initiated in 2015 and it focussed on PBT/vPvB properties.
Also the potential need for exposure assessment was considered. The initial substance
evaluation was based on the data from the original dossier, QSAR modelling by the eMSCA,
and publically available literature. The eMSCA submitted a draft SEv decision in 2016, and
the final SEv decision was issued by ECHA on 7 February 2017 (ECHA 2017a). The decision
included a sequential testing strategy to resolve the PBT/vPvB properties. The registrant(s)
conducted the first requested test, a ready biodegradation study, and uptaded their
dossier, concluding that the substance is not P/vP. The eMSCA assessed the study and
considered that the study was incomplete to resolve the P/vP concern and additional
information was still considered necessary to assess the biodegradability. Therefore, the
registrant(s) conducted another biodegradability study. The eMSCA considered the SEV
information request fulfilled on 29th May 2019, conducted a follow-up assessment and
submitted a substance evaluation conclusion document on 29th May 2020.
During the substance evaluation process, additional information has been submitted to the
eMSCA by the registrant(s). This information has been used for the assessment by the
eMSCA but is not necessarily available in the registration dossier. The substance evaluation
was discussed in ECHA’s PBT Expert Group during the initial evaluation year (meeting on
November 17-18, 2015) as well as at the follow-up evaluation phase (meeting on 8-9 May,
2018). In addition, a written procedure on the draft assessment report was organized for
PBT Expert Group in April-May 2020. The feedback from the PBT Expert Group was taken
into account in the assessment.
Assessment approach
Some parts related to the assessment of persistence, bioaccumulation and toxicity of the
Substance and HRPE and their constituents were combined in the substance evaluation
reports of both of the substances. This parallel treatment was considered beneficial for the
assessment and efficient use of all available data as the substances belong to the same
category of structurally analogous rosin esters, and read-across within this category has
been applied also in the registration dossiers, i.e. the same experimental studies have been
exploited in the dossiers of both substances.
The guidance on PBT/vPvB assessment (ECHA, 2017b) considers applicable approaches for
the assessment of different types of substances. The PBT assessment of a monoconstituent
substance would generally proceed stepwise with the assessment of potential persistence
addressed first, followed by bioaccumulation (if the P criteria is met) and then toxicity
testing (if both P and B are met). Instead, for multiconstituent substances and UVCBs the
assessment strategy may need to be evaluated and treated on a case-by-case basis,
depending upon the ease and cost of generating new data and animal welfare
considerations.
Based on the PBT screening level information it was decided to focus the substance
evaluation primarily on the monoester constituents of the Substance and HRPE and try to
solve the concerns related to P and B properties at first. The available toxicological and
ecotoxicological information was evaluated as well.
The Substance and HRPE contain different types of monoesters, with variation in the resin
acid moiety of the ester. Also the level of hydrogenation varies. For the monoesters with
glycerol, two positional isomers exist (See Annex 2). For the PBT assessment of the
Substance, glycerol monoesters with dihydroabietic acid (DHAA-mono-GE) and
tetrahydroabietic acid (THAA-mono-GE) were identified as most relevant constituents.
Composition information of the Substance has been considered in the selection of the
representative constituents; however, information supporting the selection is available also
in published sources. Dihydroabietic acid has been demonstrated to be the major
component in hydrogenated rosin which is used to produce the esters, and the presence
of tetrahydroabietic acid may also be significant (Environment Canada 2011).
Tetrahydroabietic acid monoesters with glycerol were chosen for the assessment as
tetrahydroabietic acid represents the most hydrogenated form of the resin acids. DHAA
Substance Evaluation Conclusion document EC No 266-042-9
Evaluating MS: Finland Page 15 8 July 2021
monoesters with glycerol and pentaerythritol represents a partially hydrogenated rosin.
THAA-mono-GE is considered to present the most persistent of the monoesters present in
HRGE as hydrogenation generally increases stability.
The SMILES codes of the studied constituents are shown in Annex 1 and the structural
formulas in Annex 2.
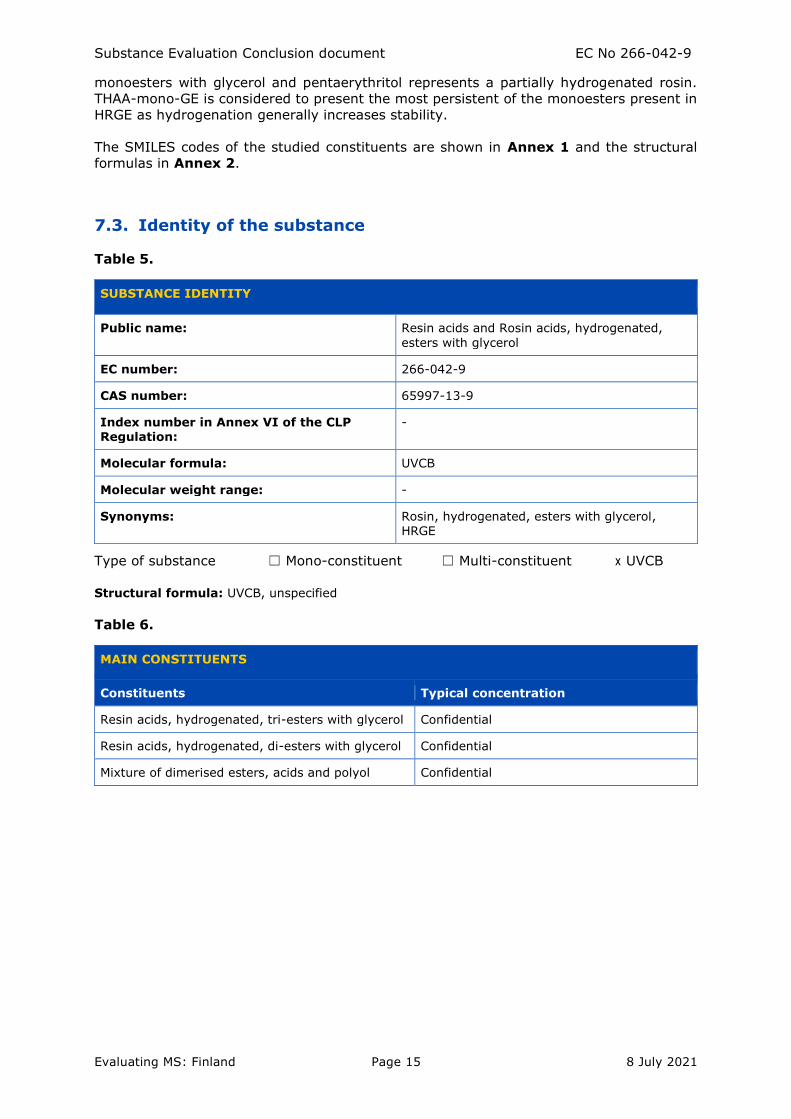
7.3. Identity of the substance
Table 5.
SUBSTANCE IDENTITY
Public name: Resin acids and Rosin acids, hydrogenated,
esters with glycerol
EC number: 266-042-9
CAS number: 65997-13-9
Index number in Annex VI of the CLP Regulation:
-
Molecular formula: UVCB
Molecular weight range: -
Synonyms: Rosin, hydrogenated, esters with glycerol, HRGE
Type of substance ☐ Mono-constituent ☐ Multi-constituent x UVCB
Structural formula: UVCB, unspecified
Table 6.
MAIN CONSTITUENTS
Constituents Typical concentration
Resin acids, hydrogenated, tri-esters with glycerol Confidential
Resin acids, hydrogenated, di-esters with glycerol Confidential
Mixture of dimerised esters, acids and polyol Confidential
Substance Evaluation Conclusion document EC No 266-042-9
Evaluating MS: Finland Page 16 8 July 2021
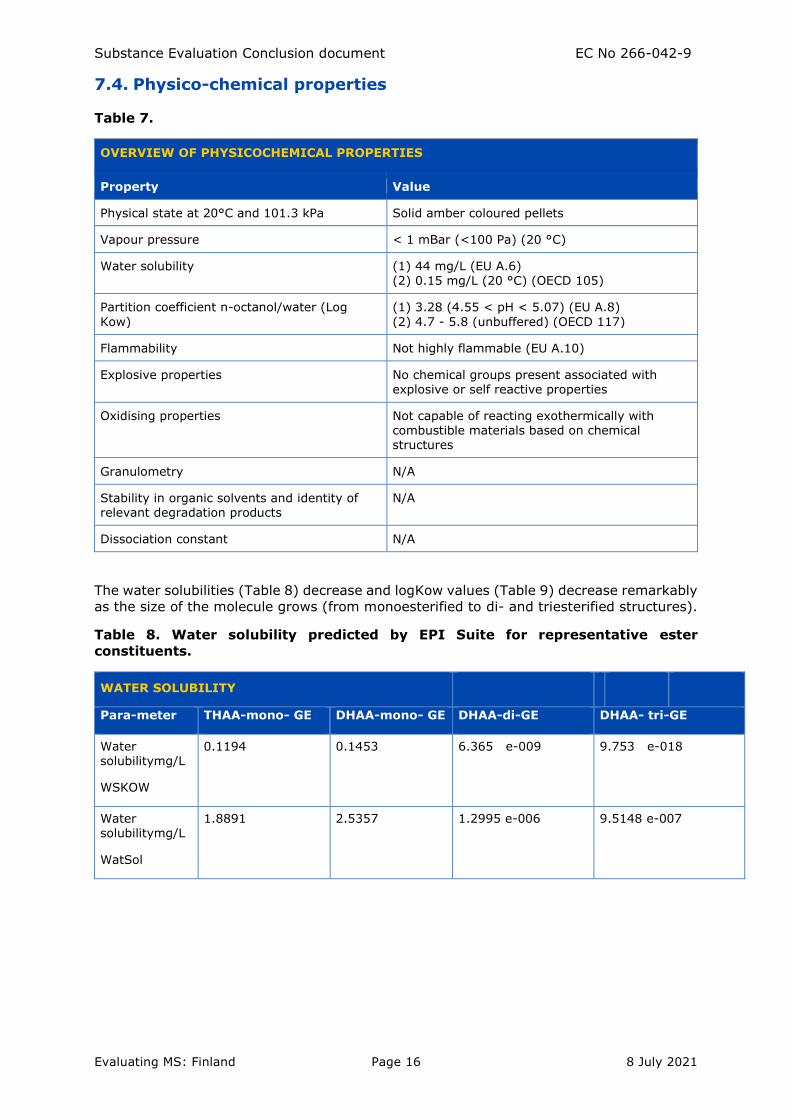
7.4. Physico-chemical properties
Table 7.
OVERVIEW OF PHYSICOCHEMICAL PROPERTIES
Property Value
Physical state at 20°C and 101.3 kPa Solid amber coloured pellets
Vapour pressure < 1 mBar (<100 Pa) (20 °C)
Water solubility (1) 44 mg/L (EU A.6) (2) 0.15 mg/L (20 °C) (OECD 105)
Partition coefficient n-octanol/water (Log
Kow)
(1) 3.28 (4.55 < pH < 5.07) (EU A.8)
(2) 4.7 - 5.8 (unbuffered) (OECD 117)
Flammability Not highly flammable (EU A.10)
Explosive properties No chemical groups present associated with explosive or self reactive properties
Oxidising properties Not capable of reacting exothermically with combustible materials based on chemical structures
Granulometry N/A
Stability in organic solvents and identity of relevant degradation products
N/A
Dissociation constant N/A
The water solubilities (Table 8) decrease and logKow values (Table 9) decrease remarkably
as the size of the molecule grows (from monoesterified to di- and triesterified structures).
Table 8. Water solubility predicted by EPI Suite for representative ester
constituents.
WATER SOLUBILITY
Para-meter THAA-mono- GE DHAA-mono- GE DHAA-di-GE DHAA- tri-GE
Water solubilitymg/L
WSKOW
0.1194 0.1453 6.365 e-009 9.753 e-018
Water
solubilitymg/L
WatSol
1.8891
2.5357 1.2995 e-006 9.5148 e-007
Substance Evaluation Conclusion document EC No 266-042-9
Evaluating MS: Finland Page 17 8 July 2021
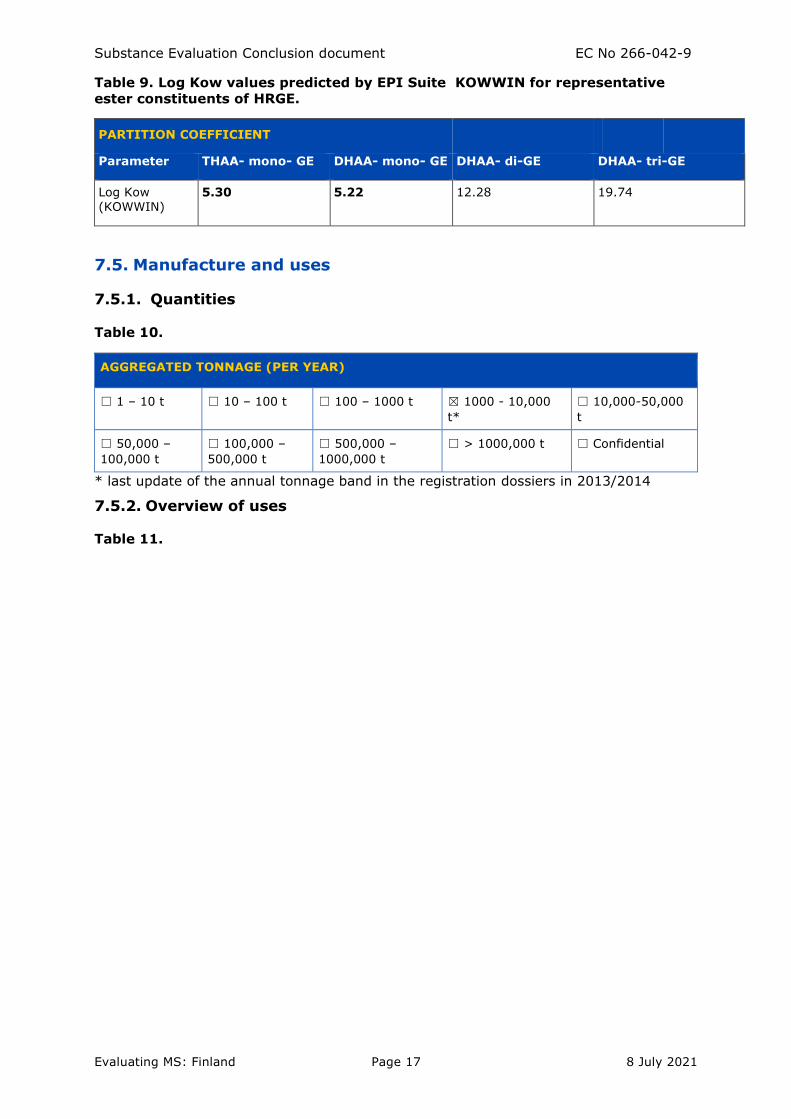
Table 9. Log Kow values predicted by EPI Suite KOWWIN for representative
ester constituents of HRGE.
PARTITION COEFFICIENT
Parameter THAA- mono- GE DHAA- mono- GE DHAA- di-GE DHAA- tri-GE
Log Kow (KOWWIN)
5.30 5.22 12.28 19.74
7.5. Manufacture and uses
7.5.1. Quantities
Table 10.
AGGREGATED TONNAGE (PER YEAR)
☐ 1 – 10 t ☐ 10 – 100 t ☐ 100 – 1000 t ☒ 1000 - 10,000
t*
☐ 10,000-50,000
t
☐ 50,000 –
100,000 t
☐ 100,000 –
500,000 t
☐ 500,000 –
1000,000 t
☐ > 1000,000 t ☐ Confidential
* last update of the annual tonnage band in the registration dossiers in 2013/2014
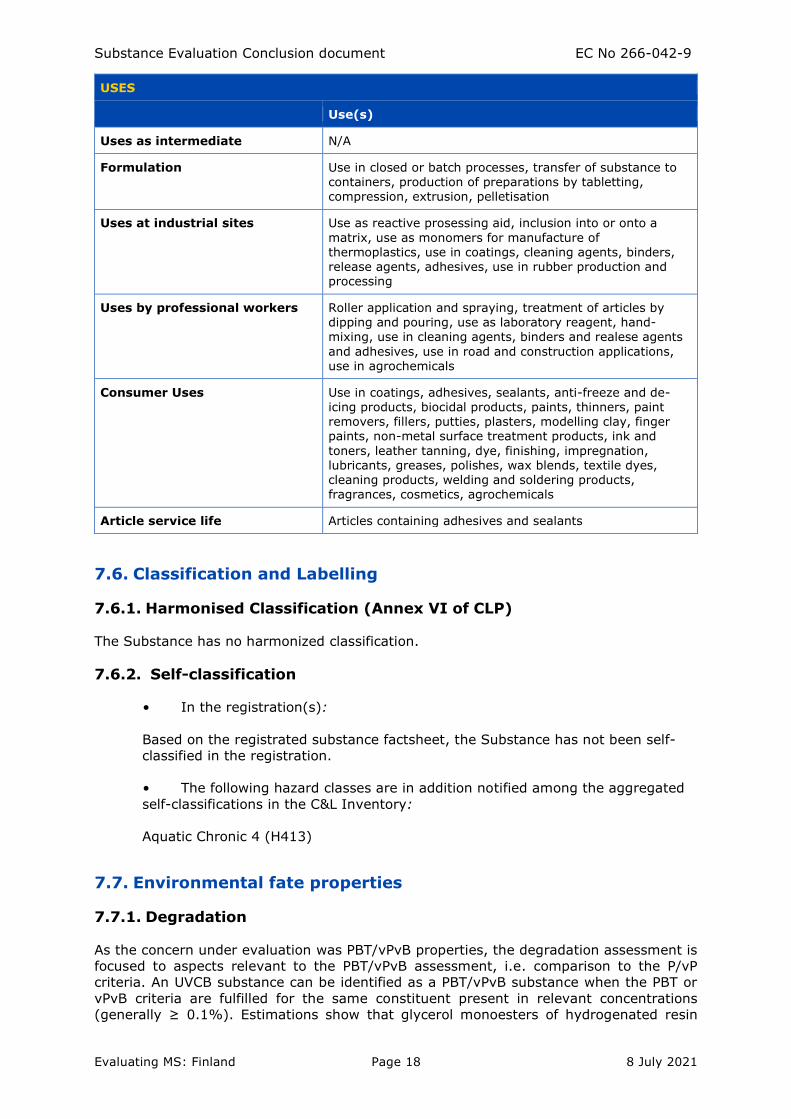
7.5.2. Overview of uses
Table 11.
Substance Evaluation Conclusion document EC No 266-042-9
Evaluating MS: Finland Page 18 8 July 2021
USES
Use(s)
Uses as intermediate N/A
Formulation Use in closed or batch processes, transfer of substance to containers, production of preparations by tabletting, compression, extrusion, pelletisation
Uses at industrial sites Use as reactive prosessing aid, inclusion into or onto a
matrix, use as monomers for manufacture of thermoplastics, use in coatings, cleaning agents, binders, release agents, adhesives, use in rubber production and processing
Uses by professional workers Roller application and spraying, treatment of articles by dipping and pouring, use as laboratory reagent, hand-mixing, use in cleaning agents, binders and realese agents
and adhesives, use in road and construction applications, use in agrochemicals
Consumer Uses Use in coatings, adhesives, sealants, anti-freeze and de-icing products, biocidal products, paints, thinners, paint removers, fillers, putties, plasters, modelling clay, finger paints, non-metal surface treatment products, ink and
toners, leather tanning, dye, finishing, impregnation, lubricants, greases, polishes, wax blends, textile dyes, cleaning products, welding and soldering products, fragrances, cosmetics, agrochemicals
Article service life Articles containing adhesives and sealants
7.6. Classification and Labelling
7.6.1. Harmonised Classification (Annex VI of CLP)
The Substance has no harmonized classification.
7.6.2. Self-classification
• In the registration(s):
Based on the registrated substance factsheet, the Substance has not been self-
classified in the registration.
• The following hazard classes are in addition notified among the aggregated
self-classifications in the C&L Inventory:
Aquatic Chronic 4 (H413)
7.7. Environmental fate properties
7.7.1. Degradation
As the concern under evaluation was PBT/vPvB properties, the degradation assessment is
focused to aspects relevant to the PBT/vPvB assessment, i.e. comparison to the P/vP
criteria. An UVCB substance can be identified as a PBT/vPvB substance when the PBT or
vPvB criteria are fulfilled for the same constituent present in relevant concentrations
(generally ≥ 0.1%). Estimations show that glycerol monoesters of hydrogenated resin
Substance Evaluation Conclusion document EC No 266-042-9
Evaluating MS: Finland Page 19 8 July 2021
acids have the highest likelihood to fulfill the B criterion compared to the respective glycerol
di- and triesters (see 7.7.3). The persistence assessment was focused on the persistence
of the glycerol monoesters of hydrogenated resin acids in relation to the P/vP criteria.
For the PBT assessment, glycerol monoesters with dihydroabietic acid (DHAA-mono-GE)
and tetrahydroabietic acid (THAA-mono-GE) were identified as most relevant constituents
(see 0)
The SMILES codes of the studied constituents are shown in Annex 1 and the structural
formulas in Annex 2.
7.7.1.1. Abiotic degradation
7.7.1.1.1 Hydrolysis
There is no hydrolysis data available in the registrated substance factsheet for the
Substance (“data waiving” is mentioned for hydrolysis). However, the registration dossier
includes a non-guideline hydrolysis test. In addition, the possibility to use HYDROWIN
QSAR model to estimate the hydrolysis of the selected monoesters of resin acids with
glycerol was explored by the eMSCA.
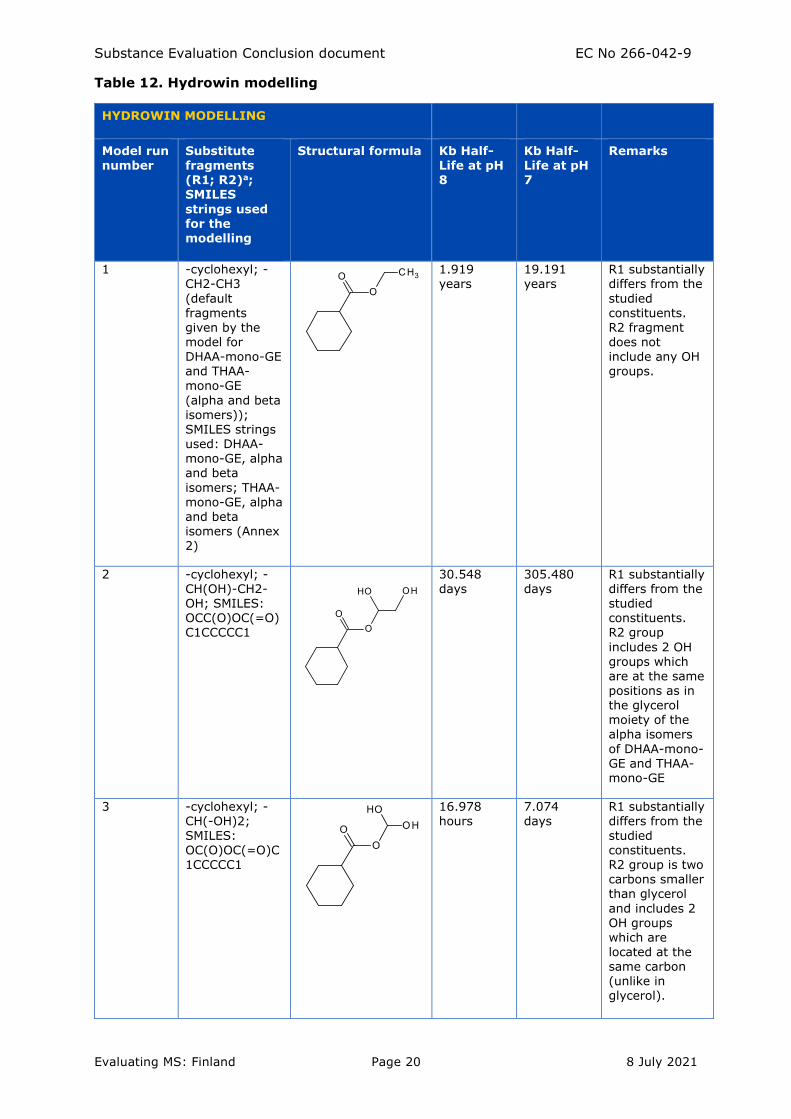
The HYDROWIN v2.00 (U.S. Environmental Protection Agency, 2010) results are presented
in Table 12. The molecular fragments of the selected monoesters were not identified by
HYDROWIN and therefore the program used substitute fragments for the prediction.
HYDROWIN guidance mentions that “the substitute selected by the program may not be
the best substitute selection”. In this case, HYDROWIN used a substitute fragment [-CH2-
CH3] for the glycerol part of the monoestersand, [-cyclohexyl] for the resin acid part. These
substitute fragments clearly differ from the studied constituents. For example, the [-CH2-
CH3] fragment does not have any hydroxy (OH-) groups unlike the glycerol part of the
monoesters. HYDROWIN estimations using substitute fragments with hydroxyl group(s)
give clearly higher hydrolysis rates (Table 12). However, these substitute fragments are
still different from the monoesters of resin acids with glycerol and therefore the hydrolysis
half-lives obtained are consireded not reliable. It can still be noteworthy that the shorter
hydrolysis half-lives with structures with hydroxyl groups suggest that hydrolysis rates of
glycerol monoesters may be higher than those predicted by the default substitute
fragments selected by the model.
Substance Evaluation Conclusion document EC No 266-042-9
Evaluating MS: Finland Page 20 8 July 2021
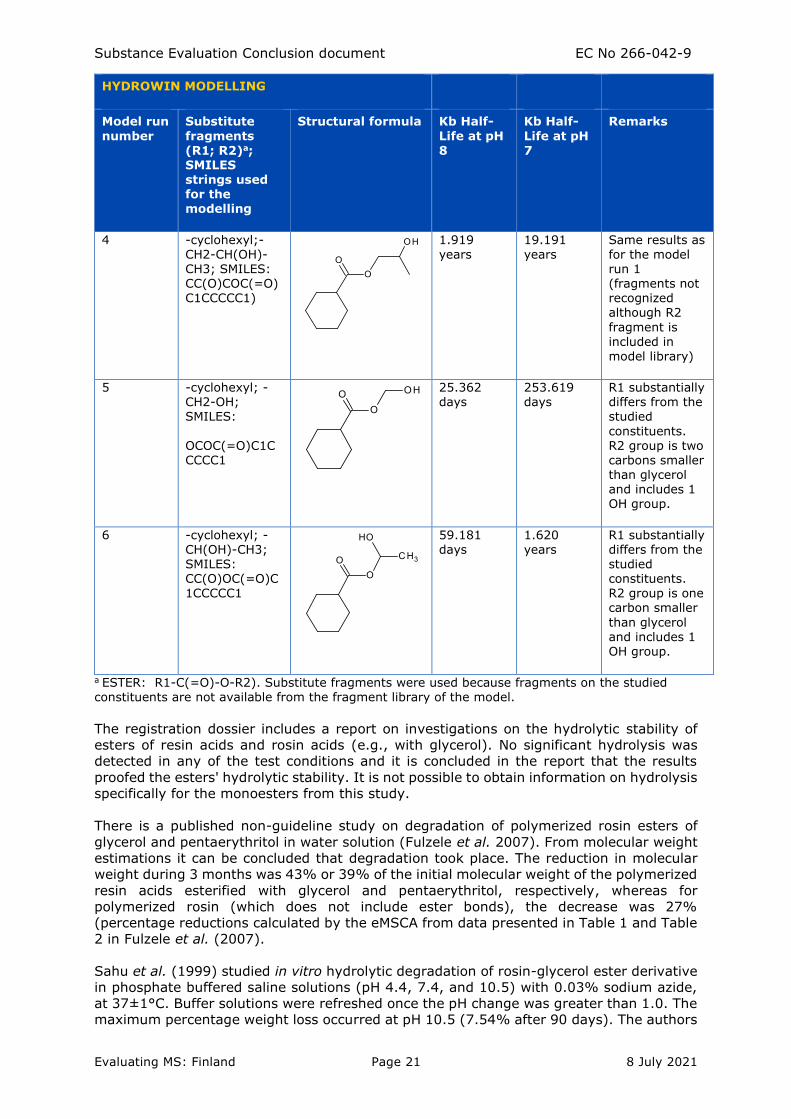
Table 12. Hydrowin modelling
HYDROWIN MODELLING
Model run number
Substitute fragments (R1; R2)a; SMILES
strings used for the modelling
Structural formula Kb Half-Life at pH 8
Kb Half-Life at pH 7
Remarks
1 -cyclohexyl; -CH2-CH3
(default fragments given by the model for
DHAA-mono-GE and THAA-mono-GE
(alpha and beta isomers)); SMILES strings used: DHAA-mono-GE, alpha and beta
isomers; THAA-mono-GE, alpha and beta isomers (Annex 2)
1.919 years
19.191 years
R1 substantially differs from the
studied constituents. R2 fragment does not
include any OH groups.
2 -cyclohexyl; -
CH(OH)-CH2-OH; SMILES: OCC(O)OC(=O)C1CCCCC1
30.548
days
305.480
days
R1 substantially
differs from the studied constituents. R2 group
includes 2 OH groups which are at the same positions as in the glycerol moiety of the alpha isomers
of DHAA-mono-GE and THAA-mono-GE
3 -cyclohexyl; -CH(-OH)2;
SMILES: OC(O)OC(=O)C1CCCCC1
16.978 hours
7.074 days
R1 substantially differs from the
studied constituents. R2 group is two carbons smaller than glycerol
and includes 2 OH groups which are located at the same carbon (unlike in glycerol).
Substance Evaluation Conclusion document EC No 266-042-9
Evaluating MS: Finland Page 21 8 July 2021
HYDROWIN MODELLING
Model run
number
Substitute
fragments (R1; R2)a; SMILES strings used for the modelling
Structural formula Kb Half-
Life at pH 8
Kb Half-
Life at pH 7
Remarks
4 -cyclohexyl;-CH2-CH(OH)-CH3; SMILES: CC(O)COC(=O)C1CCCCC1)
1.919 years
19.191 years
Same results as for the model run 1 (fragments not recognized although R2
fragment is included in
model library)
5 -cyclohexyl; -CH2-OH; SMILES:
OCOC(=O)C1CCCCC1
25.362 days
253.619 days
R1 substantially differs from the studied
constituents. R2 group is two carbons smaller than glycerol and includes 1 OH group.
6 -cyclohexyl; -CH(OH)-CH3; SMILES: CC(O)OC(=O)C
1CCCCC1
59.181 days
1.620 years
R1 substantially differs from the studied constituents.
R2 group is one carbon smaller
than glycerol and includes 1 OH group.
a ESTER: R1-C(=O)-O-R2). Substitute fragments were used because fragments on the studied constituents are not available from the fragment library of the model.
The registration dossier includes a report on investigations on the hydrolytic stability of
esters of resin acids and rosin acids (e.g., with glycerol). No significant hydrolysis was
detected in any of the test conditions and it is concluded in the report that the results
proofed the esters' hydrolytic stability. It is not possible to obtain information on hydrolysis
specifically for the monoesters from this study.
There is a published non-guideline study on degradation of polymerized rosin esters of
glycerol and pentaerythritol in water solution (Fulzele et al. 2007). From molecular weight
estimations it can be concluded that degradation took place. The reduction in molecular
weight during 3 months was 43% or 39% of the initial molecular weight of the polymerized
resin acids esterified with glycerol and pentaerythritol, respectively, whereas for
polymerized rosin (which does not include ester bonds), the decrease was 27%
(percentage reductions calculated by the eMSCA from data presented in Table 1 and Table
2 in Fulzele et al. (2007).
Sahu et al. (1999) studied in vitro hydrolytic degradation of rosin-glycerol ester derivative
in phosphate buffered saline solutions (pH 4.4, 7.4, and 10.5) with 0.03% sodium azide,
at 37±1°C. Buffer solutions were refreshed once the pH change was greater than 1.0. The
maximum percentage weight loss occurred at pH 10.5 (7.54% after 90 days). The authors
Substance Evaluation Conclusion document EC No 266-042-9
Evaluating MS: Finland Page 22 8 July 2021
mention that rosin glycerol ester is hydrophobic in nature and hence may not be expected
to undergo significant hydrolytic degradation without the involvement of a biological
source.
The relevance of the published studies (Fulzele et al. 2007, Sahu et al. 1999) to the present
assessment is rather low as the substances studied were esters of polymerized rosins
(Fulzele et al. 2007), the representativeness of the samples (e.g., pre-treatment) for the
present assessment is questionable or not known, and the concentrations of the
constituents and degradation products were not identified but degradation was only
followed based on decrease in molecular weight or percentage weight loss.
In conclusion, no reliable data is available for concluding on abiotic hydrolysis for the
Substance or for the selected constituents. QSARs (HYDROWIN) provide indications that
hydrolysis is a possible degradation mechanism for the monoesters of resin acids with
glycerol. However, the predicted (HYDROWIN) and observed rates of hydrolysis suggest
that it is highly unlikely that hydrolysis rates in environmentally relevant conditions would
be sufficiently high to rule out PBT/vPvB concern.
7.7.1.1.2 Phototransformation and photolysis
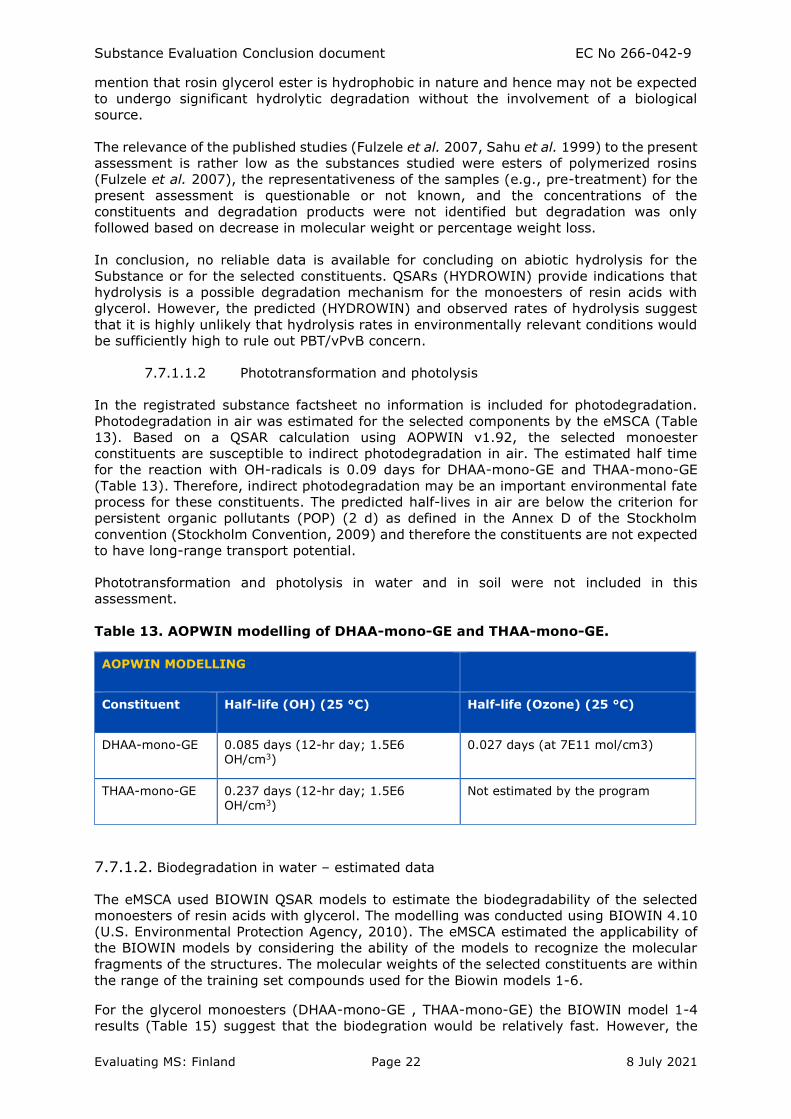
In the registrated substance factsheet no information is included for photodegradation.
Photodegradation in air was estimated for the selected components by the eMSCA (Table
13). Based on a QSAR calculation using AOPWIN v1.92, the selected monoester
constituents are susceptible to indirect photodegradation in air. The estimated half time
for the reaction with OH-radicals is 0.09 days for DHAA-mono-GE and THAA-mono-GE
(Table 13). Therefore, indirect photodegradation may be an important environmental fate
process for these constituents. The predicted half-lives in air are below the criterion for
persistent organic pollutants (POP) (2 d) as defined in the Annex D of the Stockholm
convention (Stockholm Convention, 2009) and therefore the constituents are not expected
to have long-range transport potential.
Phototransformation and photolysis in water and in soil were not included in this
assessment.
Table 13. AOPWIN modelling of DHAA-mono-GE and THAA-mono-GE.
AOPWIN MODELLING
Constituent Half-life (OH) (25 °C) Half-life (Ozone) (25 °C)
DHAA-mono-GE 0.085 days (12-hr day; 1.5E6 OH/cm3)
0.027 days (at 7E11 mol/cm3)
THAA-mono-GE 0.237 days (12-hr day; 1.5E6 OH/cm3)
Not estimated by the program
7.7.1.2. Biodegradation in water – estimated data
The eMSCA used BIOWIN QSAR models to estimate the biodegradability of the selected
monoesters of resin acids with glycerol. The modelling was conducted using BIOWIN 4.10
(U.S. Environmental Protection Agency, 2010). The eMSCA estimated the applicability of
the BIOWIN models by considering the ability of the models to recognize the molecular
fragments of the structures. The molecular weights of the selected constituents are within
the range of the training set compounds used for the Biowin models 1-6.
For the glycerol monoesters (DHAA-mono-GE , THAA-mono-GE) the BIOWIN model 1-4
results (Table 15) suggest that the biodegration would be relatively fast. However, the
Substance Evaluation Conclusion document EC No 266-042-9
Evaluating MS: Finland Page 23 8 July 2021
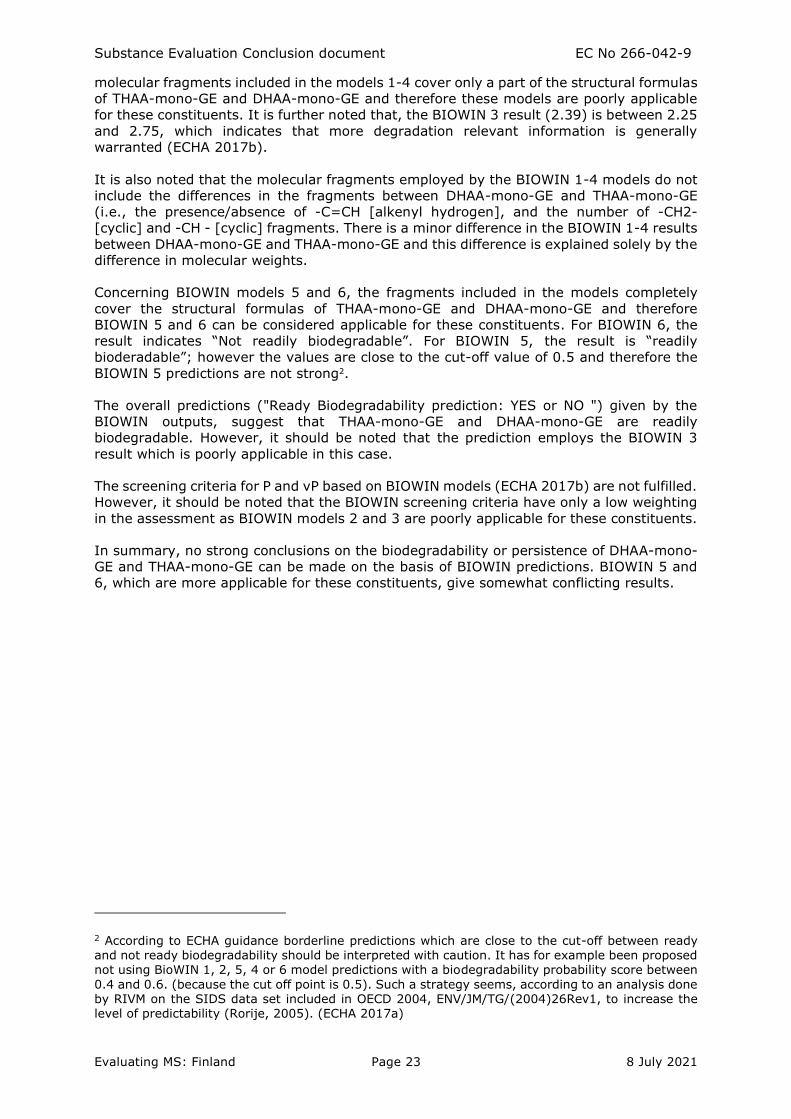
molecular fragments included in the models 1-4 cover only a part of the structural formulas
of THAA-mono-GE and DHAA-mono-GE and therefore these models are poorly applicable
for these constituents. It is further noted that, the BIOWIN 3 result (2.39) is between 2.25
and 2.75, which indicates that more degradation relevant information is generally
warranted (ECHA 2017b).
It is also noted that the molecular fragments employed by the BIOWIN 1-4 models do not
include the differences in the fragments between DHAA-mono-GE and THAA-mono-GE
(i.e., the presence/absence of -C=CH [alkenyl hydrogen], and the number of -CH2-
[cyclic] and -CH - [cyclic] fragments. There is a minor difference in the BIOWIN 1-4 results
between DHAA-mono-GE and THAA-mono-GE and this difference is explained solely by the
difference in molecular weights.
Concerning BIOWIN models 5 and 6, the fragments included in the models completely
cover the structural formulas of THAA-mono-GE and DHAA-mono-GE and therefore
BIOWIN 5 and 6 can be considered applicable for these constituents. For BIOWIN 6, the
result indicates “Not readily biodegradable”. For BIOWIN 5, the result is “readily
bioderadable”; however the values are close to the cut-off value of 0.5 and therefore the
BIOWIN 5 predictions are not strong2.
The overall predictions ("Ready Biodegradability prediction: YES or NO ") given by the
BIOWIN outputs, suggest that THAA-mono-GE and DHAA-mono-GE are readily
biodegradable. However, it should be noted that the prediction employs the BIOWIN 3
result which is poorly applicable in this case.
The screening criteria for P and vP based on BIOWIN models (ECHA 2017b) are not fulfilled.
However, it should be noted that the BIOWIN screening criteria have only a low weighting
in the assessment as BIOWIN models 2 and 3 are poorly applicable for these constituents.
In summary, no strong conclusions on the biodegradability or persistence of DHAA-mono-
GE and THAA-mono-GE can be made on the basis of BIOWIN predictions. BIOWIN 5 and
6, which are more applicable for these constituents, give somewhat conflicting results.
2 According to ECHA guidance borderline predictions which are close to the cut-off between ready and not ready biodegradability should be interpreted with caution. It has for example been proposed not using BioWIN 1, 2, 5, 4 or 6 model predictions with a biodegradability probability score between
0.4 and 0.6. (because the cut off point is 0.5). Such a strategy seems, according to an analysis done by RIVM on the SIDS data set included in OECD 2004, ENV/JM/TG/(2004)26Rev1, to increase the level of predictability (Rorije, 2005). (ECHA 2017a)
Substance Evaluation Conclusion document EC No 266-042-9
Evaluating MS: Finland Page 24 8 July 2021
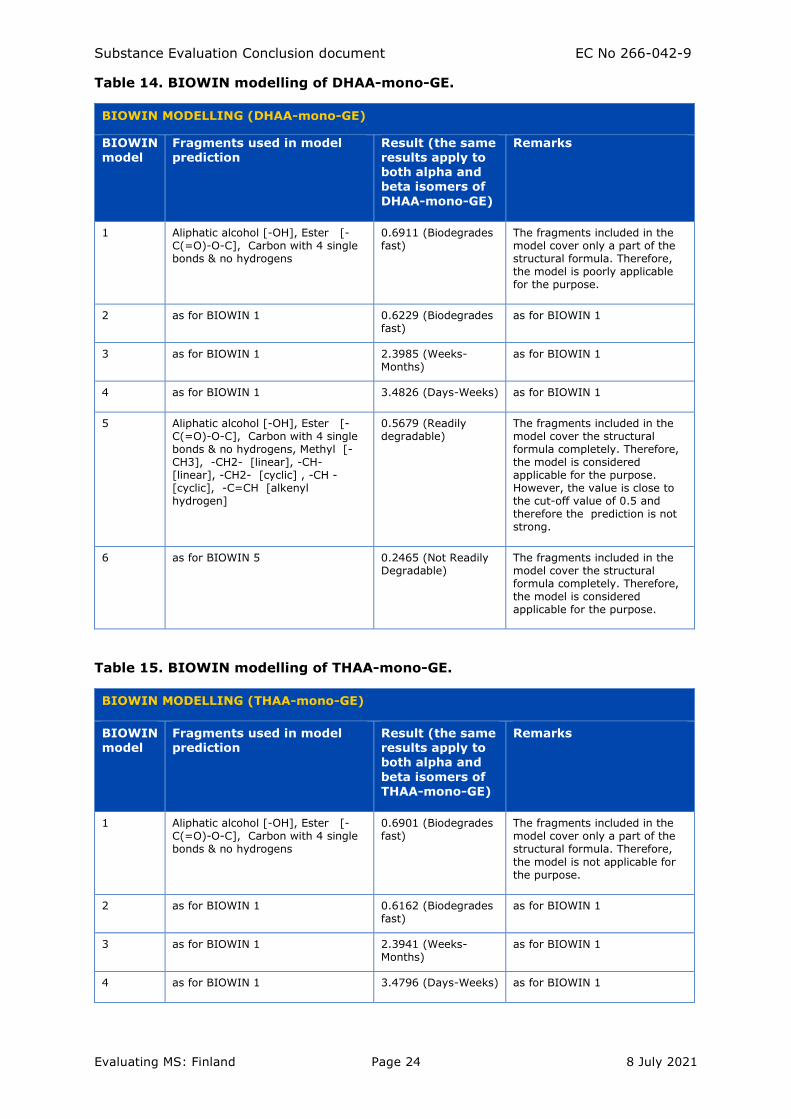
Table 14. BIOWIN modelling of DHAA-mono-GE.
BIOWIN MODELLING (DHAA-mono-GE)
BIOWIN model
Fragments used in model prediction
Result (the same results apply to both alpha and beta isomers of
DHAA-mono-GE)
Remarks
1 Aliphatic alcohol [-OH], Ester [-C(=O)-O-C], Carbon with 4 single bonds & no hydrogens
0.6911 (Biodegrades fast)
The fragments included in the model cover only a part of the structural formula. Therefore, the model is poorly applicable for the purpose.
2 as for BIOWIN 1 0.6229 (Biodegrades fast)
as for BIOWIN 1
3 as for BIOWIN 1 2.3985 (Weeks-Months)
as for BIOWIN 1
4 as for BIOWIN 1 3.4826 (Days-Weeks) as for BIOWIN 1
5 Aliphatic alcohol [-OH], Ester [-C(=O)-O-C], Carbon with 4 single bonds & no hydrogens, Methyl [-CH3], -CH2- [linear], -CH- [linear], -CH2- [cyclic] , -CH - [cyclic], -C=CH [alkenyl hydrogen]
0.5679 (Readily degradable)
The fragments included in the model cover the structural formula completely. Therefore, the model is considered applicable for the purpose. However, the value is close to the cut-off value of 0.5 and therefore the prediction is not strong.
6 as for BIOWIN 5 0.2465 (Not Readily Degradable)
The fragments included in the model cover the structural formula completely. Therefore, the model is considered applicable for the purpose.
Table 15. BIOWIN modelling of THAA-mono-GE.
BIOWIN MODELLING (THAA-mono-GE)
BIOWIN model
Fragments used in model prediction
Result (the same results apply to both alpha and
beta isomers of THAA-mono-GE)
Remarks
1 Aliphatic alcohol [-OH], Ester [-C(=O)-O-C], Carbon with 4 single bonds & no hydrogens
0.6901 (Biodegrades fast)
The fragments included in the model cover only a part of the structural formula. Therefore,
the model is not applicable for the purpose.
2 as for BIOWIN 1 0.6162 (Biodegrades fast)
as for BIOWIN 1
3 as for BIOWIN 1 2.3941 (Weeks-Months)
as for BIOWIN 1
4 as for BIOWIN 1 3.4796 (Days-Weeks) as for BIOWIN 1
Substance Evaluation Conclusion document EC No 266-042-9
Evaluating MS: Finland Page 25 8 July 2021
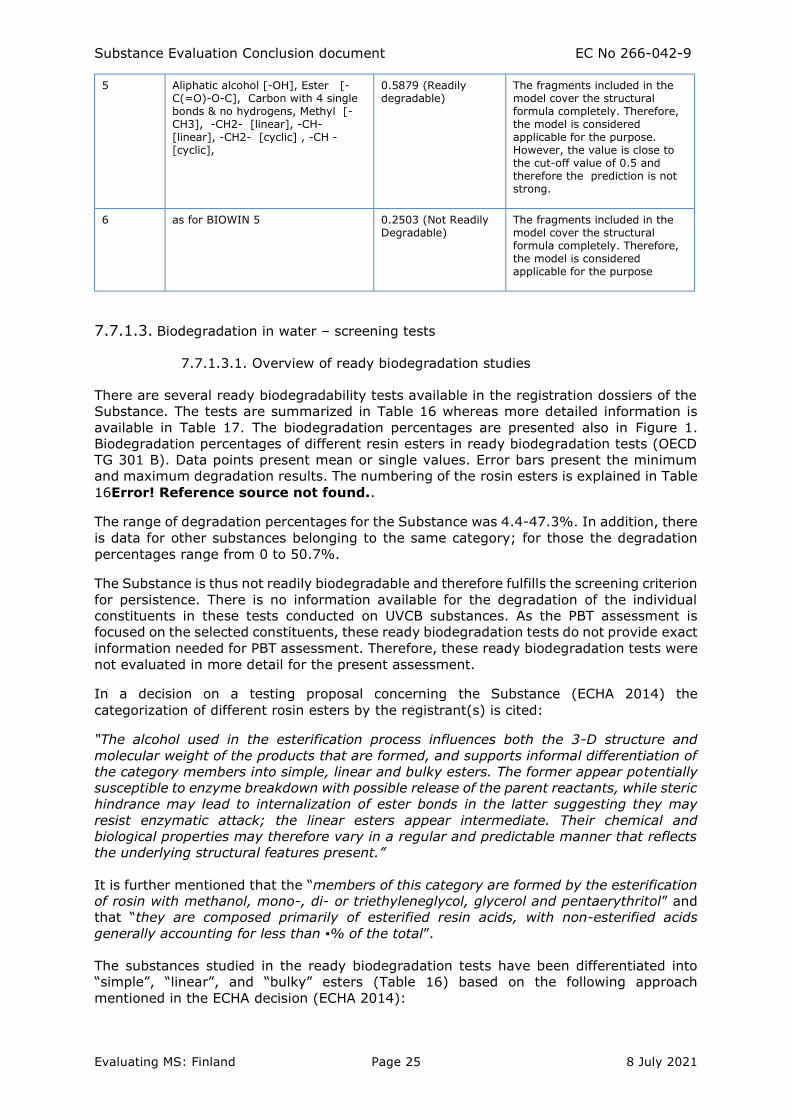
5 Aliphatic alcohol [-OH], Ester [-C(=O)-O-C], Carbon with 4 single bonds & no hydrogens, Methyl [-CH3], -CH2- [linear], -CH- [linear], -CH2- [cyclic] , -CH - [cyclic],
0.5879 (Readily degradable)
The fragments included in the model cover the structural formula completely. Therefore, the model is considered applicable for the purpose. However, the value is close to the cut-off value of 0.5 and therefore the prediction is not strong.
6 as for BIOWIN 5 0.2503 (Not Readily Degradable)
The fragments included in the model cover the structural formula completely. Therefore, the model is considered applicable for the purpose
7.7.1.3. Biodegradation in water – screening tests
7.7.1.3.1. Overview of ready biodegradation studies
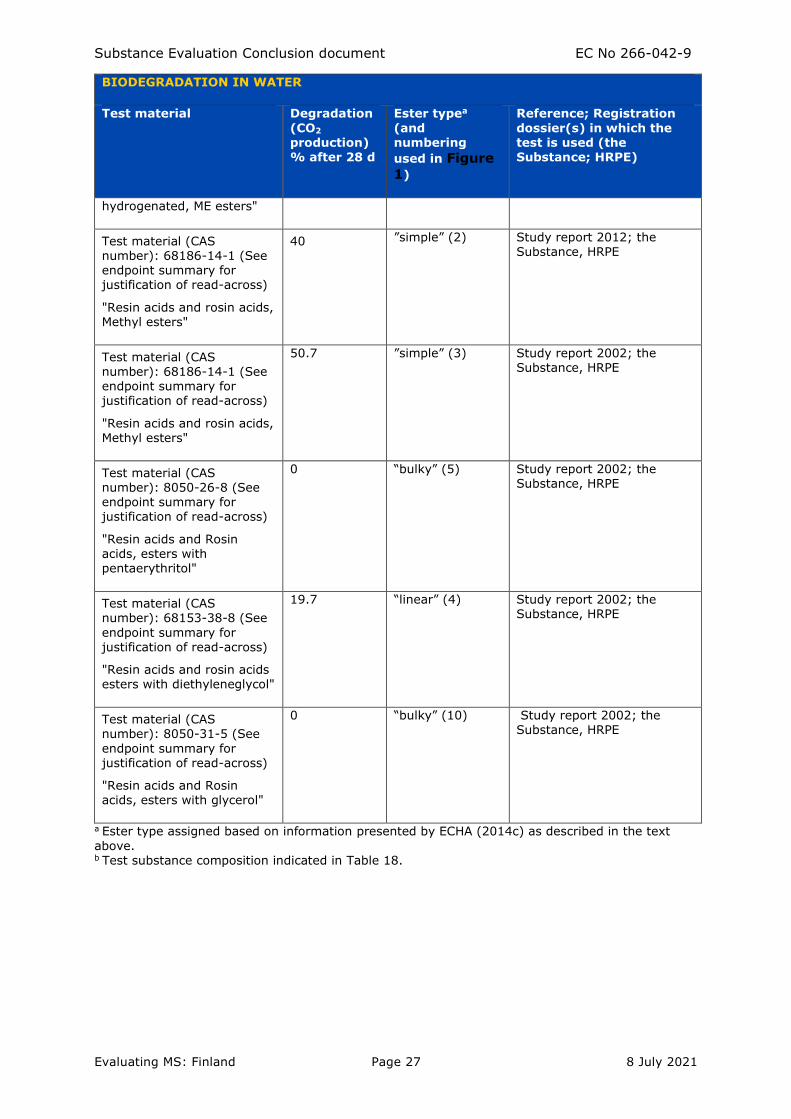
There are several ready biodegradability tests available in the registration dossiers of the
Substance. The tests are summarized in Table 16 whereas more detailed information is
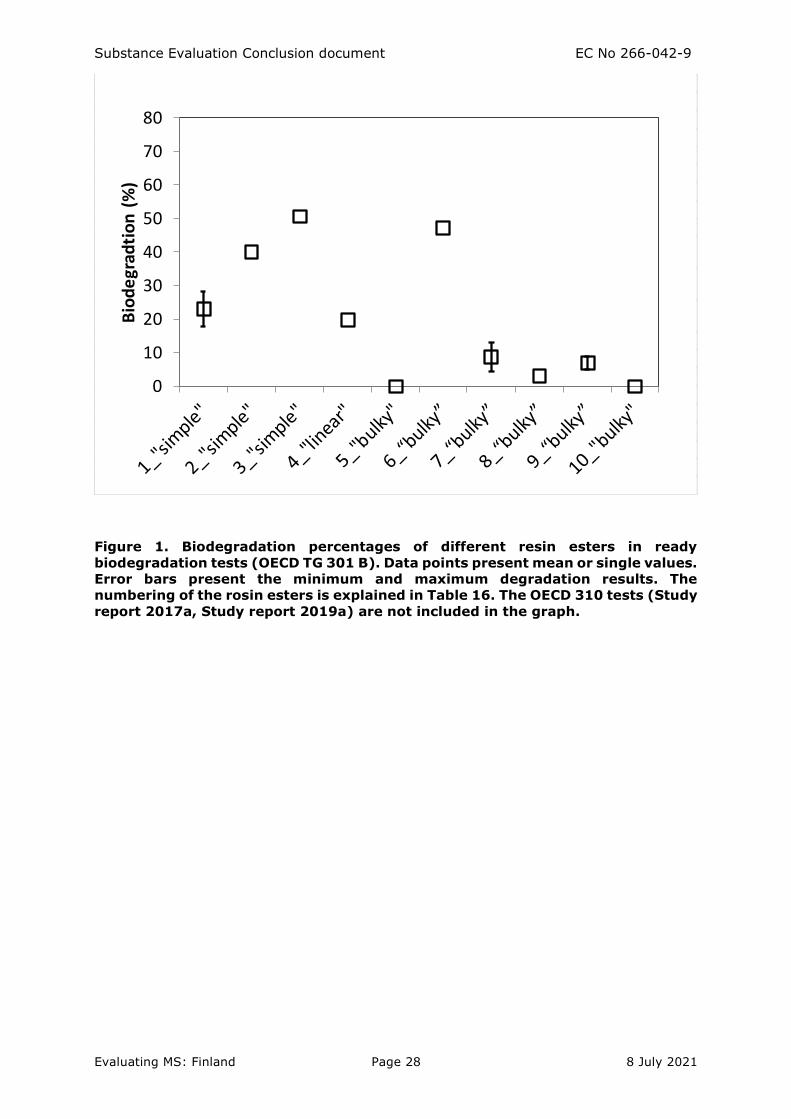
available in Table 17. The biodegradation percentages are presented also in Figure 1.
Biodegradation percentages of different resin esters in ready biodegradation tests (OECD
TG 301 B). Data points present mean or single values. Error bars present the minimum
and maximum degradation results. The numbering of the rosin esters is explained in Table
16Error! Reference source not found..
The range of degradation percentages for the Substance was 4.4-47.3%. In addition, there
is data for other substances belonging to the same category; for those the degradation
percentages range from 0 to 50.7%.
The Substance is thus not readily biodegradable and therefore fulfills the screening criterion
for persistence. There is no information available for the degradation of the individual
constituents in these tests conducted on UVCB substances. As the PBT assessment is
focused on the selected constituents, these ready biodegradation tests do not provide exact
information needed for PBT assessment. Therefore, these ready biodegradation tests were
not evaluated in more detail for the present assessment.
In a decision on a testing proposal concerning the Substance (ECHA 2014) the
categorization of different rosin esters by the registrant(s) is cited:
“The alcohol used in the esterification process influences both the 3-D structure and
molecular weight of the products that are formed, and supports informal differentiation of
the category members into simple, linear and bulky esters. The former appear potentially
susceptible to enzyme breakdown with possible release of the parent reactants, while steric
hindrance may lead to internalization of ester bonds in the latter suggesting they may
resist enzymatic attack; the linear esters appear intermediate. Their chemical and
biological properties may therefore vary in a regular and predictable manner that reflects
the underlying structural features present.”
It is further mentioned that the “members of this category are formed by the esterification
of rosin with methanol, mono-, di- or triethyleneglycol, glycerol and pentaerythritol” and
that “they are composed primarily of esterified resin acids, with non-esterified acids
generally accounting for less than ▪% of the total”.
The substances studied in the ready biodegradation tests have been differentiated into
“simple”, “linear”, and “bulky” esters (Table 16) based on the following approach
mentioned in the ECHA decision (ECHA 2014):
Substance Evaluation Conclusion document EC No 266-042-9
Evaluating MS: Finland Page 26 8 July 2021
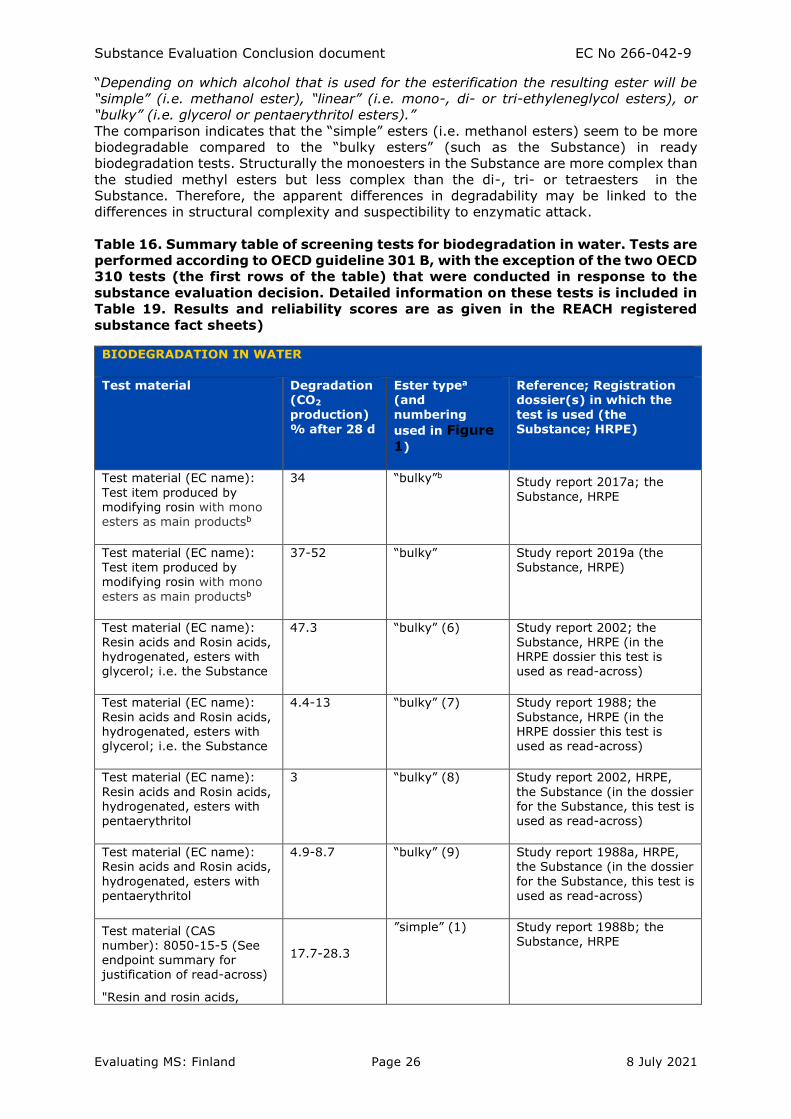
“Depending on which alcohol that is used for the esterification the resulting ester will be
“simple” (i.e. methanol ester), “linear” (i.e. mono-, di- or tri-ethyleneglycol esters), or
“bulky” (i.e. glycerol or pentaerythritol esters).”
The comparison indicates that the “simple” esters (i.e. methanol esters) seem to be more
biodegradable compared to the “bulky esters” (such as the Substance) in ready
biodegradation tests. Structurally the monoesters in the Substance are more complex than
the studied methyl esters but less complex than the di-, tri- or tetraesters in the
Substance. Therefore, the apparent differences in degradability may be linked to the
differences in structural complexity and suspectibility to enzymatic attack.
Table 16. Summary table of screening tests for biodegradation in water. Tests are
performed according to OECD guideline 301 B, with the exception of the two OECD
310 tests (the first rows of the table) that were conducted in response to the
substance evaluation decision. Detailed information on these tests is included in
Table 19. Results and reliability scores are as given in the REACH registered
substance fact sheets)
BIODEGRADATION IN WATER
Test material Degradation (CO2
production) % after 28 d
Ester typea (and
numbering
used in Figure
1)
Reference; Registration dossier(s) in which the
test is used (the Substance; HRPE)
Test material (EC name):
Test item produced by modifying rosin with mono esters as main productsb
34 “bulky”b Study report 2017a; the
Substance, HRPE
Test material (EC name): Test item produced by modifying rosin with mono
esters as main productsb
37-52 “bulky” Study report 2019a (the Substance, HRPE)
Test material (EC name): Resin acids and Rosin acids, hydrogenated, esters with glycerol; i.e. the Substance
47.3 “bulky” (6) Study report 2002; the Substance, HRPE (in the HRPE dossier this test is used as read-across)
Test material (EC name): Resin acids and Rosin acids, hydrogenated, esters with glycerol; i.e. the Substance
4.4-13 “bulky” (7) Study report 1988; the Substance, HRPE (in the HRPE dossier this test is used as read-across)
Test material (EC name):
Resin acids and Rosin acids, hydrogenated, esters with pentaerythritol
3 “bulky” (8) Study report 2002, HRPE,
the Substance (in the dossier for the Substance, this test is used as read-across)
Test material (EC name): Resin acids and Rosin acids,
hydrogenated, esters with pentaerythritol
4.9-8.7 “bulky” (9) Study report 1988a, HRPE, the Substance (in the dossier
for the Substance, this test is used as read-across)
Test material (CAS number): 8050-15-5 (See endpoint summary for justification of read-across)
"Resin and rosin acids,
17.7-28.3
”simple” (1) Study report 1988b; the Substance, HRPE
Substance Evaluation Conclusion document EC No 266-042-9
Evaluating MS: Finland Page 27 8 July 2021
BIODEGRADATION IN WATER
Test material Degradation
(CO2 production) % after 28 d
Ester typea
(and numbering
used in Figure
1)
Reference; Registration
dossier(s) in which the test is used (the Substance; HRPE)
hydrogenated, ME esters"
Test material (CAS number): 68186-14-1 (See endpoint summary for justification of read-across)
"Resin acids and rosin acids, Methyl esters"
40
”simple” (2) Study report 2012; the Substance, HRPE
Test material (CAS number): 68186-14-1 (See endpoint summary for justification of read-across)
"Resin acids and rosin acids, Methyl esters"
50.7 ”simple” (3) Study report 2002; the Substance, HRPE
Test material (CAS number): 8050-26-8 (See endpoint summary for justification of read-across)
"Resin acids and Rosin acids, esters with pentaerythritol"
0 “bulky” (5) Study report 2002; the Substance, HRPE
Test material (CAS number): 68153-38-8 (See
endpoint summary for justification of read-across)
"Resin acids and rosin acids esters with diethyleneglycol"
19.7 “linear” (4) Study report 2002; the Substance, HRPE
Test material (CAS number): 8050-31-5 (See
endpoint summary for justification of read-across)
"Resin acids and Rosin acids, esters with glycerol"
0 “bulky” (10) Study report 2002; the Substance, HRPE
a Ester type assigned based on information presented by ECHA (2014c) as described in the text
above. b Test substance composition indicated in Table 18.
Substance Evaluation Conclusion document EC No 266-042-9
Evaluating MS: Finland Page 28 8 July 2021
Figure 1. Biodegradation percentages of different resin esters in ready
biodegradation tests (OECD TG 301 B). Data points present mean or single values.
Error bars present the minimum and maximum degradation results. The
numbering of the rosin esters is explained in Table 16. The OECD 310 tests (Study
report 2017a, Study report 2019a) are not included in the graph.
-17,7 -40 -50,7 -19,7
17,7 40 50,7 19,7
"simple"
"simple"
"simple"
"linear"
"bulky"
“bulky”
“bulky”
“bulky”
“bulky”
"bulky"
0
10
20
30
40
50
60
70
80B
iod
egr
adti
on
(%
)
Substance Evaluation Conclusion document EC No 266-042-9
Evaluating MS: Finland Page 29 8 July 2021
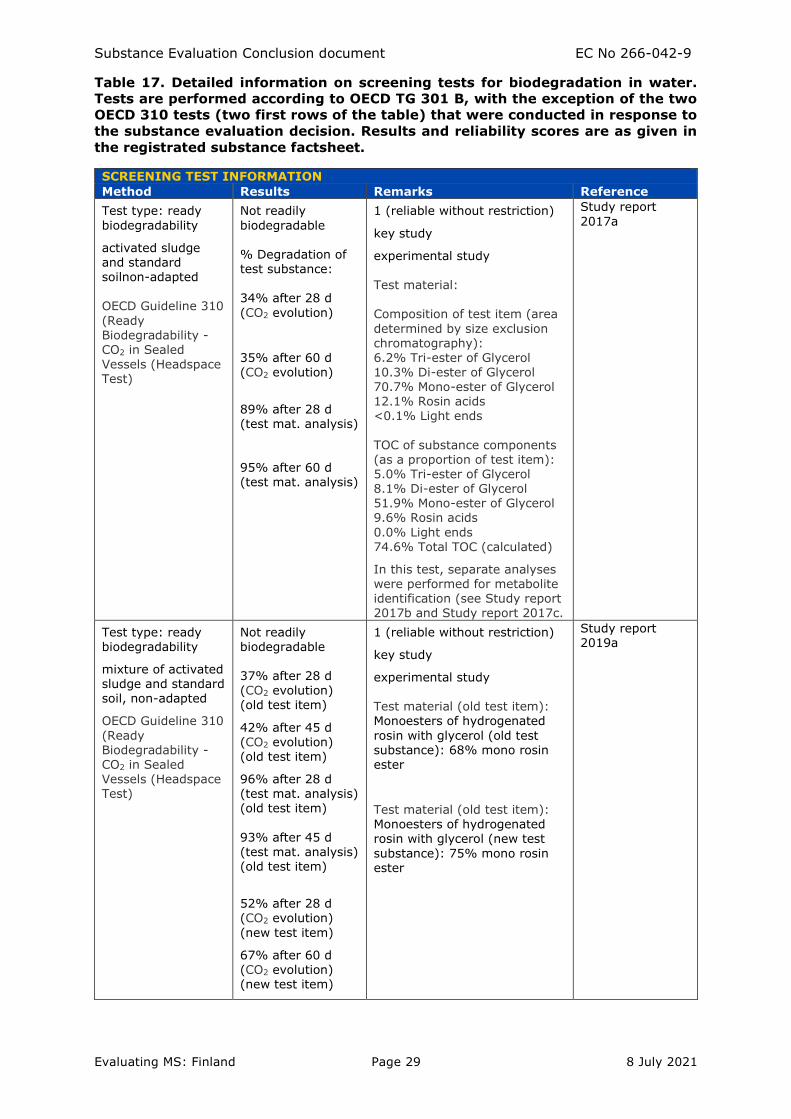
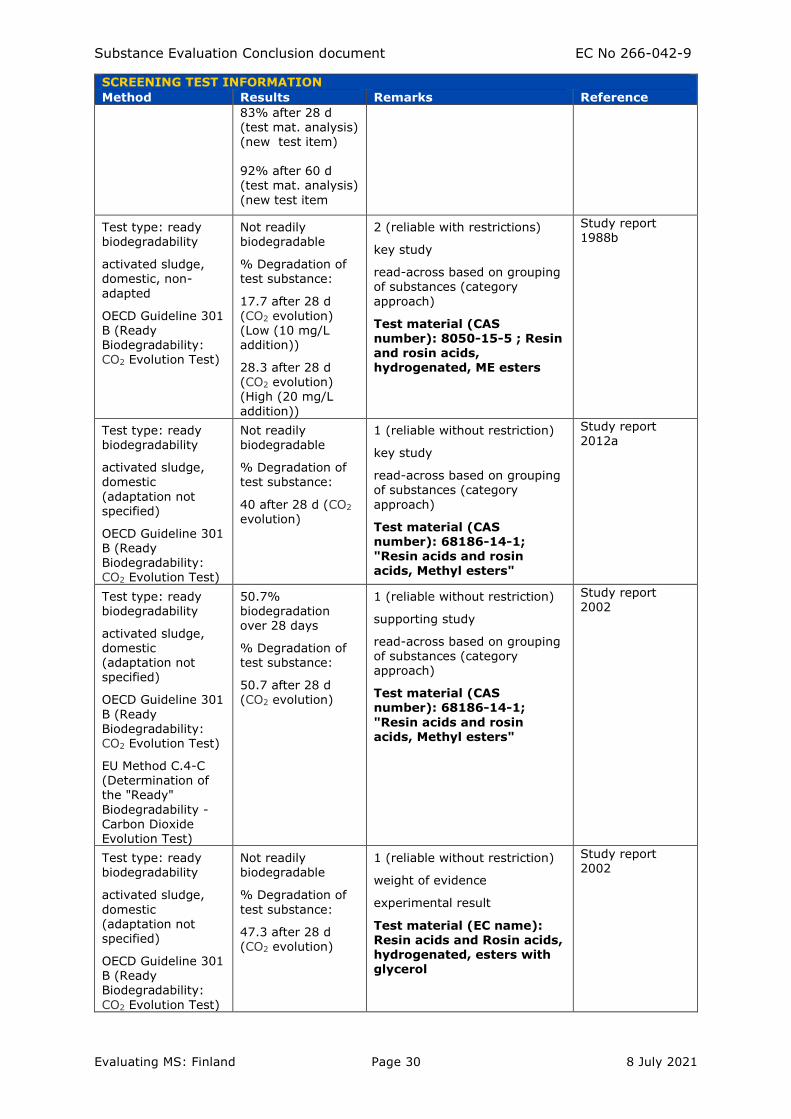
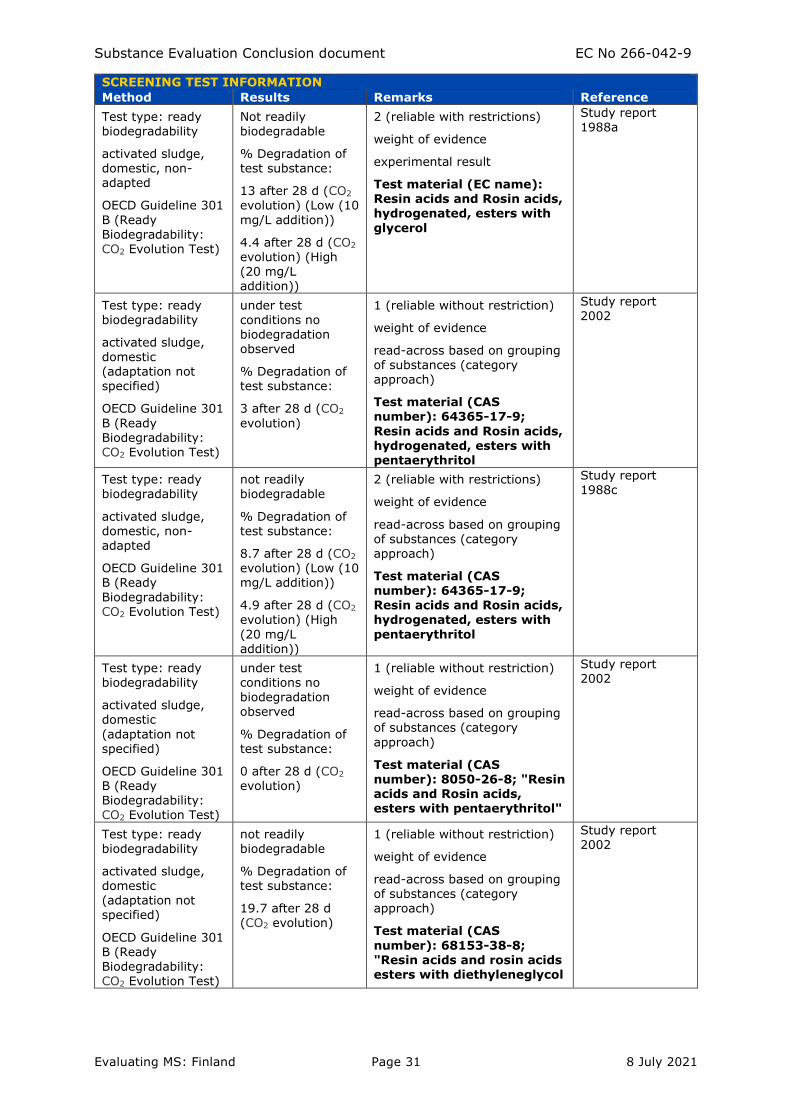
Table 17. Detailed information on screening tests for biodegradation in water.
Tests are performed according to OECD TG 301 B, with the exception of the two
OECD 310 tests (two first rows of the table) that were conducted in response to
the substance evaluation decision. Results and reliability scores are as given in
the registrated substance factsheet.
SCREENING TEST INFORMATION Method Results Remarks Reference
Test type: ready
biodegradability
activated sludge and standard soilnon-adapted OECD Guideline 310
(Ready Biodegradability - CO2 in Sealed
Vessels (Headspace Test)
Not readily
biodegradable % Degradation of test substance: 34% after 28 d
(CO2 evolution)
35% after 60 d (CO2 evolution)
89% after 28 d (test mat. analysis)
95% after 60 d (test mat. analysis)
1 (reliable without restriction)
key study
experimental study Test material: Composition of test item (area
determined by size exclusion chromatography):
6.2% Tri-ester of Glycerol 10.3% Di-ester of Glycerol 70.7% Mono-ester of Glycerol 12.1% Rosin acids <0.1% Light ends
TOC of substance components (as a proportion of test item): 5.0% Tri-ester of Glycerol 8.1% Di-ester of Glycerol 51.9% Mono-ester of Glycerol 9.6% Rosin acids
0.0% Light ends 74.6% Total TOC (calculated)
In this test, separate analyses were performed for metabolite
identification (see Study report 2017b and Study report 2017c.
Study report
2017a
Test type: ready biodegradability
mixture of activated sludge and standard soil, non-adapted
OECD Guideline 310
(Ready Biodegradability - CO2 in Sealed Vessels (Headspace Test)
Not readily biodegradable 37% after 28 d (CO2 evolution) (old test item)
42% after 45 d (CO2 evolution) (old test item)
96% after 28 d (test mat. analysis) (old test item)
93% after 45 d (test mat. analysis) (old test item)
52% after 28 d (CO2 evolution)
(new test item)
67% after 60 d (CO2 evolution) (new test item)
1 (reliable without restriction)
key study
experimental study Test material (old test item): Monoesters of hydrogenated
rosin with glycerol (old test substance): 68% mono rosin ester
Test material (old test item):
Monoesters of hydrogenated rosin with glycerol (new test
substance): 75% mono rosin ester
Study report 2019a
Substance Evaluation Conclusion document EC No 266-042-9
Evaluating MS: Finland Page 30 8 July 2021
SCREENING TEST INFORMATION Method Results Remarks Reference
83% after 28 d
(test mat. analysis) (new test item) 92% after 60 d (test mat. analysis)
(new test item
Test type: ready biodegradability
activated sludge, domestic, non-
adapted
OECD Guideline 301 B (Ready Biodegradability:
CO2 Evolution Test)
Not readily biodegradable
% Degradation of test substance:
17.7 after 28 d (CO2 evolution) (Low (10 mg/L addition))
28.3 after 28 d (CO2 evolution) (High (20 mg/L
addition))
2 (reliable with restrictions)
key study
read-across based on grouping of substances (category
approach)
Test material (CAS number): 8050-15-5 ; Resin
and rosin acids, hydrogenated, ME esters
Study report 1988b
Test type: ready biodegradability
activated sludge, domestic
(adaptation not specified)
OECD Guideline 301 B (Ready Biodegradability: CO2 Evolution Test)
Not readily biodegradable
% Degradation of test substance:
40 after 28 d (CO2 evolution)
1 (reliable without restriction)
key study
read-across based on grouping of substances (category
approach)
Test material (CAS number): 68186-14-1; "Resin acids and rosin acids, Methyl esters"
Study report 2012a
Test type: ready biodegradability
activated sludge, domestic (adaptation not specified)
OECD Guideline 301
B (Ready Biodegradability: CO2 Evolution Test)
EU Method C.4-C (Determination of the "Ready"
Biodegradability -
Carbon Dioxide Evolution Test)
50.7% biodegradation over 28 days
% Degradation of test substance:
50.7 after 28 d (CO2 evolution)
1 (reliable without restriction)
supporting study
read-across based on grouping of substances (category approach)
Test material (CAS number): 68186-14-1;
"Resin acids and rosin acids, Methyl esters"
Study report 2002
Test type: ready biodegradability
activated sludge,
domestic (adaptation not specified)
OECD Guideline 301 B (Ready Biodegradability:
CO2 Evolution Test)
Not readily biodegradable
% Degradation of
test substance:
47.3 after 28 d (CO2 evolution)
1 (reliable without restriction)
weight of evidence
experimental result
Test material (EC name): Resin acids and Rosin acids, hydrogenated, esters with glycerol
Study report 2002
Substance Evaluation Conclusion document EC No 266-042-9
Evaluating MS: Finland Page 31 8 July 2021
SCREENING TEST INFORMATION Method Results Remarks Reference
Test type: ready biodegradability
activated sludge, domestic, non-adapted
OECD Guideline 301
B (Ready Biodegradability: CO2 Evolution Test)
Not readily biodegradable
% Degradation of test substance:
13 after 28 d (CO2 evolution) (Low (10
mg/L addition))
4.4 after 28 d (CO2 evolution) (High (20 mg/L addition))
2 (reliable with restrictions)
weight of evidence
experimental result
Test material (EC name): Resin acids and Rosin acids, hydrogenated, esters with
glycerol
Study report
1988a
Test type: ready biodegradability
activated sludge,
domestic (adaptation not specified)
OECD Guideline 301
B (Ready Biodegradability: CO2 Evolution Test)
under test conditions no biodegradation observed
% Degradation of test substance:
3 after 28 d (CO2
evolution)
1 (reliable without restriction)
weight of evidence
read-across based on grouping of substances (category approach)
Test material (CAS number): 64365-17-9;
Resin acids and Rosin acids, hydrogenated, esters with pentaerythritol
Study report 2002
Test type: ready biodegradability
activated sludge, domestic, non-adapted
OECD Guideline 301 B (Ready
Biodegradability: CO2 Evolution Test)
not readily biodegradable
% Degradation of test substance:
8.7 after 28 d (CO2 evolution) (Low (10 mg/L addition))
4.9 after 28 d (CO2 evolution) (High
(20 mg/L addition))
2 (reliable with restrictions)
weight of evidence
read-across based on grouping of substances (category approach)
Test material (CAS
number): 64365-17-9; Resin acids and Rosin acids, hydrogenated, esters with
pentaerythritol
Study report 1988c
Test type: ready biodegradability
activated sludge, domestic
(adaptation not specified)
OECD Guideline 301 B (Ready Biodegradability: CO2 Evolution Test)
under test conditions no biodegradation observed
% Degradation of test substance:
0 after 28 d (CO2 evolution)
1 (reliable without restriction)
weight of evidence
read-across based on grouping of substances (category
approach)
Test material (CAS number): 8050-26-8; "Resin acids and Rosin acids, esters with pentaerythritol"
Study report 2002
Test type: ready biodegradability
activated sludge, domestic (adaptation not specified)
OECD Guideline 301 B (Ready Biodegradability: CO2 Evolution Test)
not readily biodegradable
% Degradation of test substance:
19.7 after 28 d (CO2 evolution)
1 (reliable without restriction)
weight of evidence
read-across based on grouping of substances (category approach)
Test material (CAS
number): 68153-38-8; "Resin acids and rosin acids esters with diethyleneglycol
Study report 2002

Substance Evaluation Conclusion document EC No 266-042-9
Evaluating MS: Finland Page 32 8 July 2021
SCREENING TEST INFORMATION Method Results Remarks Reference
Test type: ready biodegradability
activated sludge, domestic (adaptation not specified)
OECD Guideline 301 B (Ready Biodegradability: CO2 Evolution Test)
under test conditions no biodegradation observed
% Degradation of test substance:
0 after 28 d (CO2 evolution)
1 (reliable without restriction)
weight of evidence
read-across based on grouping of substances (category approach)
Test material (CAS
number): 8050-31-5; "Resin acids and Rosin acids, esters with glycerol"
Study report
2002
Test type: ready
biodegradability
activated sludge, domestic (adaptation not
specified)
OECD Guideline 301 B (Ready
Biodegradability: CO2 Evolution Test)
under test
conditions no biodegradation observed
% Degradation of
test substance:
3 after 28 d (CO2 evolution)
1 (reliable without restriction)
weight of evidence
experimental result
Test material (EC name): Resin acids and Rosin acids, hydrogenated, esters with pentaerythritol
Study report
2002
Test type: ready biodegradability
activated sludge,
domestic, non-adapted
OECD Guideline 301 B (Ready Biodegradability: CO2 Evolution Test)
Not readily biodegradable
% Degradation of
test substance:
8.7 after 28 d (CO2 evolution) (Low (10 mg/L addition))
4.9 after 28 d (CO2
evolution) (High (20 mg/L
addition))
2 (reliable with restrictions)
weight of evidence
experimental result
Test material (EC name): Resin acids and Rosin acids, hydrogenated, esters with pentaerythritol
Study report 1988a
Test type: ready biodegradability
activated sludge, domestic (adaptation not
specified)
OECD Guideline 301 B (Ready Biodegradability: CO2 Evolution Test)
not readily biodegradable
% Degradation of test substance:
47.3 after 28 d
(CO2 evolution)
1 (reliable without restriction)
weight of evidence
read-across based on grouping of substances (category approach)
Test material (CAS number): 65997-13-9 ; Resin acids and Rosin acids, hydrogenated, esters with glycerol
Study report 2002
Test type: ready
biodegradability
activated sludge, domestic, non-adapted
OECD Guideline 301 B (Ready
Biodegradability: CO2 Evolution Test)
not readily
biodegradable
% Degradation of test substance:
13 after 28 d (CO2 evolution) (Low (10 mg/L addition))
4.4 after 28 d (CO2 evolution) (High (20 mg/L addition))
2 (reliable with restrictions)
weight of evidence
read-across based on grouping of substances (category approach)
Test material (CAS number): 65997-13-9;
Resin acids and Rosin acids, hydrogenated, esters with glycerol
Study report 1988c
Substance Evaluation Conclusion document EC No 266-042-9
Evaluating MS: Finland Page 33 8 July 2021
7.7.1.3.2. OECD TG 310 studies on monoesters of hydrogenated resin acids with glycerol
Two OECD TG 310 studies were conducted in response to the SEv decision (ECHA 2017a),
referred to here as the 2017 study and the 2019 study, respectively. The 2017 study
indicated a CO2 production of 34%, and a significant decrease in monoester concentration
was observed. The study was not fully in compliance with the specific requirements in the
SEv decision. Due to the relatively low level of ultimate degradation there was a concern
that the decrease in monoesters could be partially due to physical removal, such as
adsorption, and the extent of primary degradation remained uncertain. The registrant(s)
conducted a new OECD TG 310 study (test reports dated 2019) to address this uncertainty.
These studies are described in the following study reports:
OECD TG 310 study (2017):
• Study report (2017a): Main study and GC-MS analyses of monoesters.
• Study report (2017b): GC-MS analyses of resin acids and monoesters.
• Study report (2017c): HPLC analyses of mono- di- and triesters, resin
acids, and heavy ends.
OECD TG 310 study (2019):
• Study report (2019a): Main study and GC-MS analyses of
monoesters.
• Study report (2019b): Monoester analysis method validation.
These studies are presented and discussed here in parallel.
Test substances
Both OECD TG 310 studies were conducted on test substances which were produced by
modifying rosin in order to enrich the monoester fraction. In the 2017 study one test
substance was used whereas in the 2019 study two different test substances were used.
The test substances of the 2019 study are referred to as the “old test substance” and the
“new test substance”. Regarding the origin of the test substances, the registrant(s) have
provided the following information3:
• These names (“old” and “new” test substance) in the 2019 study refer to the
different batches of glycerol monoesters of hydrogenated rosin before purification,
which were used to produce the test substances.
• The same batch was used to produce the sample tested in the 2017 study and the
old test substance in the 2019 study.
• A different batch was used to produce the new test substance in the 2019 study.
The compositions of the test substances are summarized in Table 18. Size exclusion
chromatograms were available for the assessment4. The concentrations of each fraction
are assumed to be equal to the relative proportion of each peak of the total area of the
peaks.
It is noted that the compositions of the test substance used for the 2017 study and the old
test substance in the 2019 study were relatively similar whereas the new test substance
in the 2019 study differed from those two substances. The main differences of the new
3 E-mail from the registrant(s) to the evaluating MSCA on 24 February 2020 4 Size exclusion chromatograms for the test substance of the 2017 study are in Study report 2017a and for the test substanes of the 2019 study in additional documents submitted by the registrant(s) to the evaluating MSCA (e-mail on 24 February 2020)
Substance Evaluation Conclusion document EC No 266-042-9
Evaluating MS: Finland Page 34 8 July 2021
test substance were the higher concentrations of the monoesters, resin acids, and the light
ends, and the lower concentrations of di- and triesters. It is also noted that for the old test
substance of the 2019, there was no information of the concentrations of di- and triesters
specifically but only a sum of the concentrations of these two fractions was reported. The
sum of di- and triesters was relatively similar (16.5-19.0 %) in the 2017 study and the old
test substance of the 2019 study and lower (5.4 %) in the new test substance of the 2019
study.
There is uncertainty regarding the composition of the light ends fraction and regarding the
concentration of glycerol in the test substances. It is stated in the registration dossier that
a representative constituent for TOC calculation of the light ends fraction for the OECD TG
310 (2017) study is glycerol. However, in further communications the registrant(s) have
indicated that the light ends fraction obtained by GPC covers compounds described as
neutrals: neutral monoterpenes, and neutral diterpenes5. Regarding the glycerol
concentration in the test substances, the registrant(s) provided the following additional
information5:
• Glycerol was found to be present at 0.7 % in the sample used for the 2017 study.
• The concentration of glycerol in the sample tested in the 2019 study is unknown
since this was not analyzed for free glycerol.
• It is expected that the amount of free glycerol in the test item would be very low.
• When the substance was refined to produce the test item it was extracted with
water/hexane repeatedly and most of the free glycerol will have dissolved into the
water fraction and would have been removed from the sample.
Thus, there is contradictory information regarding the glycerol concentration in the test
substance used for the OECD TG 310 (2017) study. It has not been reported how the
registrant(s) determined the 0.7% glycerol concentration.
Based on the information above it seems likely that the light ends fraction consisted of
monoterpenes and diterpenes rather than of glycerol. Even though the proportion of the
light ends fraction in the test substances (0-1.6 %w/w, or 0-3.5 %TOC) is relatively low,
it affects the calculations which are based on TOC and therefore this uncertainty was
considered in the assessment.
For the test substance in the 2017 study, TOC could not be reliably measured and
consequently a calculated TOC was used for the biodegradation calculations (Table 18,
Table 19). Due to the low concentration of the light ends fraction (< 0.1% w/w) in the
2017 study the way of calculating the TOC for the light ends (i.e. the light ends assumed
to be either glycerol or terpenes) has an insignificant effect on the total TOC (74.60% vs.
74.64%) or proportions of the different fractions of the total TOC (Table 18). Therefore the
eMSCA calculated the biodegradation results using the same TOC as used in the
registration dossier (74.60%). However, additional calculation was performed by the
eMSCA on the assumption that there was 0.0% of terpenes and 0.7% w/w glycerol (total
TOC 74.92%).
For the 2019 study, the concentration of the light ends fraction was 0.8-3.0 % w/w and
thus it has more effect on the calculated TOC compared to the 2017 study. For the 2019
study, a measured TOC was used for calculating the ultimate biodegradation result in
relation to the whole test substance (IC production as a percentage of ThIC of test
substance). However, for the estimation of the ultimate degradation of the monoesters it
was necessary to calculate the proportions of the different fractions of the TOC so that the
IC production per each fraction could be calculated. As the composition affects the TOC
5 E-mail from the registrant(s) to the evaluating MSCA on 7 May 2020
Substance Evaluation Conclusion document EC No 266-042-9
Evaluating MS: Finland Page 35 8 July 2021
proportions, the results were calculated in both ways (i.e., light ends assumed either as
terpenes or as glycerol).
Test conditions and methods
Test conditions and other methodological information are summarized in Table 19. The
duration of the test was 60 and 45 days for the 2017 and 2019 studies, respectively. Thus
both studies were extended beyond the standard duration of 28 days. Mineralisation of the
test item was followed by total inorganic carbon (TIC) analyses to assess CO2 production.
In both studies the concentrations of the monoester fraction in the test medium were
determined. In the 2017 study, also resin acids, diesters, triesters and heavy ends were
measured.
Comparison with the requirements of the SEv decision
In Table 20, the tests are compared with the specifications and recommendations in the
SEv decision (ECHA 2017a). A sterile control was not included in the 2017 study even
though according to the decision it was a mandatory requirement when primary
degradation results are used for the conclusion. The 2019 study included a sterile control
conducted in accordance with the test guideline. The other specifications set in the the SEV
decision are considered either fulfilled or partially fulfilled and no critical deficiencies were
found.
Recalculations of the CO2 production results by the eMSCA
Some of the CO2 production results of the 2019 study were recalculated by the eMSCA.
The reasons are indicated in Table 21.
Regarding the correction for the sterile control, the OECD TG 310 (paragraph 59) states
“If there has been a significant increase in the TIC content of the sterile controls (FS) over
the test period, then it may be concluded that abiotic degradation of the test substance
has occurred and this must be taken into account in the calculation of D in Equation [2]”.
The test guideline (paragraph 65) states “If in flask FS (abiotic) a significant increase
(>10%) in the amount of TIC is observed, abiotic degradation processes may have
occurred.”
It is not known whether the abiotic degradation was similar in sterile controls and active
tests. However, the eMSCA considers that if the test substance degrades to CO2 in the
conditions of the test, for the purpose of the current tests there is no need have a certainty
on whether the degradation is completely biotic or whether part of it can be abiotic. Thus
if abiotic degradation to CO2 has occurred in the sterile control, it may be occurring also in
the active test and in that case it does not need to be differentiated from the degradation
in the biotic test. On the other hand, if the abiotic degradation to CO2 occurred only in the
sterile controls (e.g. if formaldehyde is oxidized to CO2) it should not be taken into account
for calculating the biodegradation. Therefore, no correction for sterile control was
performed for the CO2 production in the active tests.
Validity criteria and toxicity controls
Both OECD TG 310 studies fulfill the validity criteria (Table 22), with the exception that for
the 2019 study the validity criterion regarding TIC was not met for the day 45
measurement; however, based on the value in a NaOH check vessel it was considered that
the TIC in the blanks was <3 mg/L, therefore fulfilling the validity criterion also on day 45.
In toxicity controls CO2 production was 106% and 120% of the theoretical maximum
inorganic carbon production (ThIC) of the reference substance in the 2017 study and 99%
and 119% in the 2019 study, after 14 and 28 days, respectively. The corresponding values
obtained from equation [(DFC1 – DFI
2)/DFC] x 100 (OECD TG 310) on day 28 were -32% in
the 2017 study and -72% in the 2019 study. As the values were below 25%, it can be
concluded that based on the toxicity controls no inhibition by test substance was indicated
Substance Evaluation Conclusion document EC No 266-042-9
Evaluating MS: Finland Page 36 8 July 2021
in either of the studies. For the toxicity controls, test substance was introduced with solvent
in the 2017 study and by direct addition in the 2019 study. For the 2019 study toxicity
control was only conducted with the new test substance but not with the old test substance.
GC-MS measurements of monoesters: methods
In both studies the concentrations of the monoester fraction in the test medium were
determined by GC-MS analysis of representative monoester constituents after liquid-liquid
extraction using dichloromethane (DCM) and derivatisation with trifluoroacetamide (TFAA)
(Table 23). In the 2017 study, the monoester analyses were conducted from combined
fractions of test medium and solvent (acetone) rinse of the test bottle. Whereas in the
2019 study, the test medium and solvent rinse were analysed separately. The sum of the
peak areas of m/z values corresponding the TFAA derivatives of the monoesters were used
to quantify the monoester concentration (see Table 23 for more details) (Study report
2017a, Study report 2019a). Three (2019 study) or four (2017 study) peaks were used for
the quantification. Each of these peaks consisted of a group of monoesters. In the 2017
study, one group of derivatives was quantified using the m/z value 239 and the three other
groups using the m/z values 243, 555, and 570 (Study report 2017a). In the 2019 study,
one group of derivatives was quantified using the m/z value 239 and the two other groups
using the m/z value of 243 (Study report 2019a). It is not indicated why different amounts
of monoester derivatives were used for the quantification in the two studies (2017 and
2019) or to what extent the monoesters studied were the same in both studies. For the
2017, the results were reported also separately for two different fractions of the
monoesters (Study report 2017b).
When a resin acid monoester with glycerol is transformed e.g. by hydrolysis, the resin and
rosin backbone may still remain (e.g. as resin acids). Therefore, resin acids could interfere
with the monoester analysis if co-elution occurred, due to the potential formation of the
same ions in the MS detector. It is not stated in the study reports whether co-elution
occurred. However, according to the registrant(s) the resin acids and monoesters are not
thought to co-elute6. It is also stated (Study report 2017b) that different derivatisation
method was used for the analysis of both monoesters and resin acids compared to the
main study (Study report 2017a) where only the monoesters were quantified. There were
also differences in the ions used for the quantification. Comparable results were obtained
for the monoesters by both methods. Therefore, the eMSCA considers that co-elution of
resin acids and monoesters did not occur and that the use of different ions for the
quantification of the monoesters in the 2017 and 2019 studies did not significantly affect
the results or the comparability of the 2017 and 2019 studies with each other. The
assessment of the degradation of the monoesters in the 2017 study was based on the
results from the Study report 2017a, unless otherwise specified.
Two fractions of monoesters were analysed in the 2017 study, reported to represent the
monoesters of dehydroabietic acid (DeHAA) and the monoesters of hydrogenated resin
acids, respectively (Study report 2017b). Based on the m/z values and structures
presented (Table 23) there was a difference in the level of hydrogenation between the two
fractions. Based on the proportions of the peak areas, ca. 59% of the studied monoesters
in the test substance belonged to the monoesters of DeHAA, and ca. 41% to the
monoesters of hydrogenated resin acids.
The registrant(s) have informed that with the GC-MS only hydrogenated resin acids and
DeHAA and their monoesters have been analysed of the 2017 study7. The other remaining
resin acids (and presumably also the other remaining monoesters) were not taken into
account in the GC-MS analysis but were included in the resin acid (or monoester) fraction
seen on the size exclusion chromatography results (Table 18). It is not known what
proportion of the total monoester fraction the monoesters analysed in the GC-MS
6 E-mail from the registrant(s) to the evaluating MSCA on 7 May 2020. 7 E-mail from the registrant(s) to the evaluating MSCA on 21 November 2017.
Substance Evaluation Conclusion document EC No 266-042-9
Evaluating MS: Finland Page 37 8 July 2021
measurements accounted for. The registrant(s) have informed that, in theory, the abietane
group (Figure 2) represents 60-80% of the monoesters in the test substance used for the
2017 study (based on the generally 60-80% proportion of abietane group in the type of
rosin used for the synthesis of the test substance)7. It is unclear whether the compounds
analysed by GC-MS included only abietane group rosin structures or whether other types
of structures were also included. The structures presented in the 2017 study report only
include abietane structures. However, it was not indicated how reliable and accurate the
presented structures were and whether the peaks could also have included other structures
with the same m/z value. For example, some resin acids belonging to different structural
groups have the same molecular weight and therefore could potentially result in same m/z
values.8
For the 2019 study no calibration curve was derived with the old test substance and the
results of the old test substance were calculated based on calibration curve obtained with
the new test substance. The reason was that due to the small quantity of monoesters of
the test substance available it was not possible to perform the GC-MS analysis using
standards made with the old test substance. As indicated in the test report, the GC-MS
analysis of the monoesters for the old test substance is “more indicative than quantitative”.
The quantification of the monoesters was based on the sum of the areas of the selected
peaks and therefore the eMSCA considers that the calibration curve based on the sum of
the main peaks in the new test substance should be to some extent applicable also to the
old test substance. In the 2019 study it was reported that there was an additional peak in
the old test substance that was not observed in the new test substance (Study report
2019a). The retention time and size of the additional peak were not specified. The eMSCA
considers that the presence of additional peak means that there may have been some
monoesters present in the old test substance (and also in the test substance for the 2017
study, which was produced using the same batch) which were not present in the new test
substance. From the chromatograms (Study report 2019a) for the active tests and sterile
controls on day 3, when no significant primary degradation had occurred yet, the following
observations were made by the eMSCA:
• The number of peaks with retention times <15 min was not higher in the old test
substance compared to the new test substance, despite the higher dilution of the
samples for the new test substance.
• Peaks were observed mostly at the same retention times in both test substances,
but the relative sizes of the peaks varied between the test substances.
• Three peaks were observed only with the old test substance9. However, these peaks
were quantitatively not significant10.
Therefore, the peaks chosen for quantification of the monoesters appear to include the
main peaks of the chosen m/z values in both test substances and thus the presence of
additional peaks does not significantly weaken the reliability of the concentration
measurements based on the selected m/z values. The peaks which were not considered
for the quantification in the 2019 study (some of them were present only in one of the two
test substances) were most likely not significant for the primary degradation measurement.
However, the response of the compounds forming the different peaks in the GC-MS analysis
8 For example for abietic, isopimaric, neoabietic, palustric, and pimaric acids MW = 302.5 and for dehydroabietic and dihydropimaric acids MW = 304.5. 9 Peak 1: retention time (RT) approx. 12.3 min (observed in the active test); peak 2 and peak 3 RT approx. 9.3 min. and 12.4 min. (observed in the active test and sterile control) 10Peak sizes were not reported in numeric form. The eMSCA made a rough estimation based on the chromatograms, which showed that the heights of the peaks present only in the old test substance were < 4% of the height of the highest peak used for the quantification of the monoesters within the same sample. It is noted that peak height is not accurate indicator of concentrations as the width of the peaks also varied. The difference of concentrations may be higher than the difference of peak heights.
Substance Evaluation Conclusion document EC No 266-042-9
Evaluating MS: Finland Page 38 8 July 2021
is not necessarily the same, and therefore the differences in the proportions of the peaks
may influence the quantification. Therefore, the primary degradation results for the old
test substance are associated with increased uncertainty due to the issue with the
calibration.
Presentation of the results
The results are presented in Figure 3, Figure 4, Figure 5, Figure 6, Figure 7, Figure
8, Figure 9, Figure 10,
Substance Evaluation Conclusion document EC No 266-042-9
Evaluating MS: Finland Page 39 8 July 2021
Table 24, and Table 25. The results are presented and discussed in parallel for both
studies (2017 and 2019).
CO2 production in active tests
In both studies (2017 and 2019) biodegradation (based on % ThIC) in the first 3 days was
highest in the 2019 study with the new test substance (2.6% of ThIC) and lower in the
2019 study with the old test substance and in the 2017 study (1-1.5%) (Figure 4).
Biodegradation proceeded in the new test substance (2019 study) at the same rate until
day 10 and after that some increase in rate was observed until day 21. Biodegradation
curve became less steep thereafter, attaining 54% after 28 days and 67% after 45 days,
but a plateau was not reached. In the 2017 study and in the 2019 study with the old test
substance, a fairly similar degradation was obtained for both, with lower biodegradation
(34% after 28 days, 35-36% after 42-45 days). The 2017 study was continued for 60 days
and the biodegradation was 35% at the end of the study.
The differences in the degradation curves particularly between the old and new test
substances in the 2019 study can potentially be explained by the composition of the test
substances and the different methods of introducing the test substance into the test vessels
(discussed below under “Discussion on selected issues important for P/vP assessment”).
CO2 production in sterile controls
Sterile controls were included in the 2019 study but not in the 2017 study. Figure 3 shows
that the IC production in both sterile controls (old and new test substance) increased during
the study roughly in the same way as in the solvent control and inoculum blank. The CO2
production in the sterile control with the old test substance was mostly lower than in the
solvent control (or inoculum blank) (Figure 3) but it is noted that on day 0 CO2 production
was highest in the sterile control. The CO2 production in the sterile control with the new
test substance was lower than in the inoculum blank for the first 21 days but higher on
days 28-45. The CO2 production of the sterile control with the old test substance was lower
than in the sterile control with the new test substance for the first 14 days.
The fact that CO2 production in the sterile controls was mostly lower than in the inoculum
blank or in solvent control indicates that in the sterile control not only the mineralization
of the test substance was inhibited but apparently also CO2 production from the inoculum
was inhibited. This means that correcting the sterile control CO2 production with the solvent
control/inoculum blank (as was done in the test report) results mostly in negative
biodegradation values indicating that this correction is not relevant. These results are still
presented in Figure 4 for completeness (note that the negative values are converted to
zero in Figure 4). These results indicate that in sterile controls, when corrected for the
solvent control or inoculum blank (as appropriate), the biodegradation was 0-2% of ThIC
after 28 days and 0-0.5% after 45 days in both test substances studied in the 2019 study
(Figure 4).
Thus, there was some CO2 production in the sterile controls, increasing during the study.
The test guideline (OECD TG 310) states that “If in flask FS (abiotic) a significant increase
(>10%) in the amount of TIC is observed, abiotic degradation processes may have
occurred.”. Accordingly, in the test report, it can be concluded that abiotic degradation
may have occurred as the difference in the TIC between day 45 and day 0 was greater
than 10%. The increase in the TIC compared to day 0 is greater than 10% on day 45 (and
also e.g. on day 28), as can also be seen from Figure 3.
The eMSCA is not aware of other ready biodegradation tests with sterile controls using
formaldehyde as toxicant and therefore it is not possible to evaluate whether this is a
typical level of IC production in sterile controls with formaldehyde. However, there was a
clear difference in the IC production between the active tests and sterile controls (Figure
3), indicating that mineralization of the test substance in the sterile controls was mostly
inhibited by the toxicant (formaldehyde).
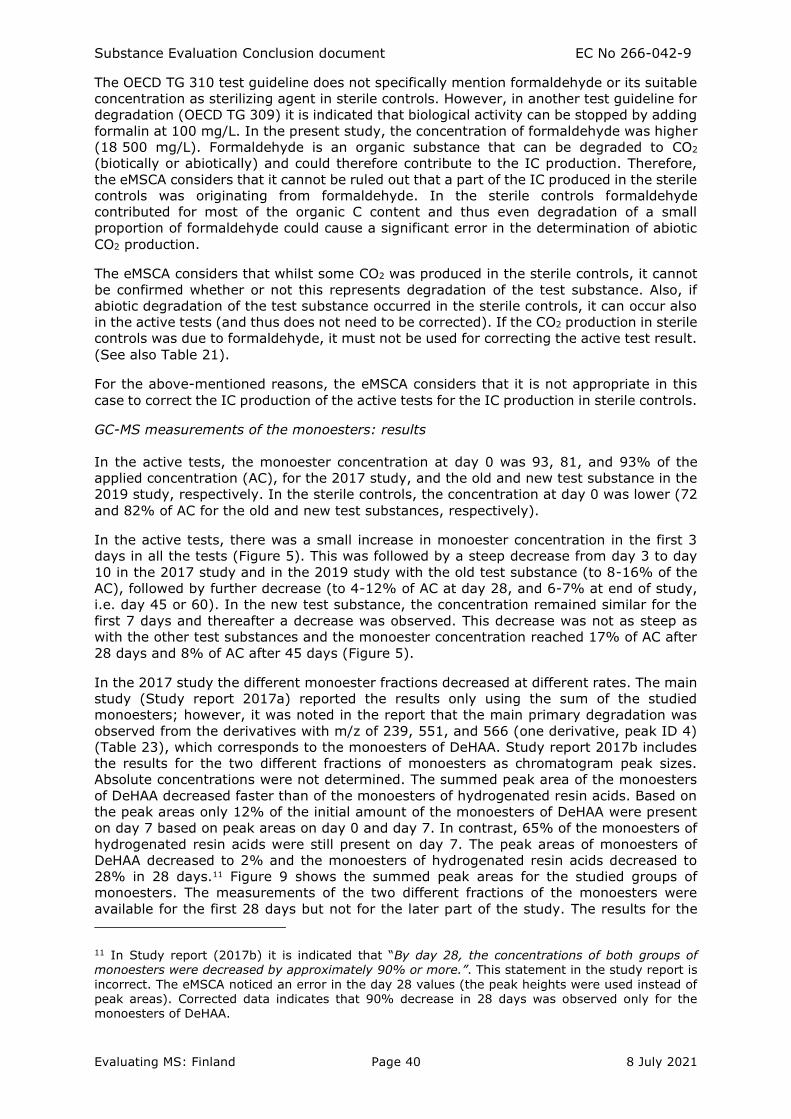
Substance Evaluation Conclusion document EC No 266-042-9
Evaluating MS: Finland Page 40 8 July 2021
The OECD TG 310 test guideline does not specifically mention formaldehyde or its suitable
concentration as sterilizing agent in sterile controls. However, in another test guideline for
degradation (OECD TG 309) it is indicated that biological activity can be stopped by adding
formalin at 100 mg/L. In the present study, the concentration of formaldehyde was higher
(18 500 mg/L). Formaldehyde is an organic substance that can be degraded to CO2
(biotically or abiotically) and could therefore contribute to the IC production. Therefore,
the eMSCA considers that it cannot be ruled out that a part of the IC produced in the sterile
controls was originating from formaldehyde. In the sterile controls formaldehyde
contributed for most of the organic C content and thus even degradation of a small
proportion of formaldehyde could cause a significant error in the determination of abiotic
CO2 production.
The eMSCA considers that whilst some CO2 was produced in the sterile controls, it cannot
be confirmed whether or not this represents degradation of the test substance. Also, if
abiotic degradation of the test substance occurred in the sterile controls, it can occur also
in the active tests (and thus does not need to be corrected). If the CO2 production in sterile
controls was due to formaldehyde, it must not be used for correcting the active test result.
(See also Table 21).
For the above-mentioned reasons, the eMSCA considers that it is not appropriate in this
case to correct the IC production of the active tests for the IC production in sterile controls.
GC-MS measurements of the monoesters: results
In the active tests, the monoester concentration at day 0 was 93, 81, and 93% of the
applied concentration (AC), for the 2017 study, and the old and new test substance in the
2019 study, respectively. In the sterile controls, the concentration at day 0 was lower (72
and 82% of AC for the old and new test substances, respectively).
In the active tests, there was a small increase in monoester concentration in the first 3
days in all the tests (Figure 5). This was followed by a steep decrease from day 3 to day
10 in the 2017 study and in the 2019 study with the old test substance (to 8-16% of the
AC), followed by further decrease (to 4-12% of AC at day 28, and 6-7% at end of study,
i.e. day 45 or 60). In the new test substance, the concentration remained similar for the
first 7 days and thereafter a decrease was observed. This decrease was not as steep as
with the other test substances and the monoester concentration reached 17% of AC after
28 days and 8% of AC after 45 days (Figure 5).
In the 2017 study the different monoester fractions decreased at different rates. The main
study (Study report 2017a) reported the results only using the sum of the studied
monoesters; however, it was noted in the report that the main primary degradation was
observed from the derivatives with m/z of 239, 551, and 566 (one derivative, peak ID 4)
(Table 23), which corresponds to the monoesters of DeHAA. Study report 2017b includes
the results for the two different fractions of monoesters as chromatogram peak sizes.
Absolute concentrations were not determined. The summed peak area of the monoesters
of DeHAA decreased faster than of the monoesters of hydrogenated resin acids. Based on
the peak areas only 12% of the initial amount of the monoesters of DeHAA were present
on day 7 based on peak areas on day 0 and day 7. In contrast, 65% of the monoesters of
hydrogenated resin acids were still present on day 7. The peak areas of monoesters of
DeHAA decreased to 2% and the monoesters of hydrogenated resin acids decreased to
28% in 28 days.11 Figure 9 shows the summed peak areas for the studied groups of
monoesters. The measurements of the two different fractions of the monoesters were
available for the first 28 days but not for the later part of the study. The results for the
11 In Study report (2017b) it is indicated that “By day 28, the concentrations of both groups of monoesters were decreased by approximately 90% or more.”. This statement in the study report is
incorrect. The eMSCA noticed an error in the day 28 values (the peak heights were used instead of peak areas). Corrected data indicates that 90% decrease in 28 days was observed only for the monoesters of DeHAA.
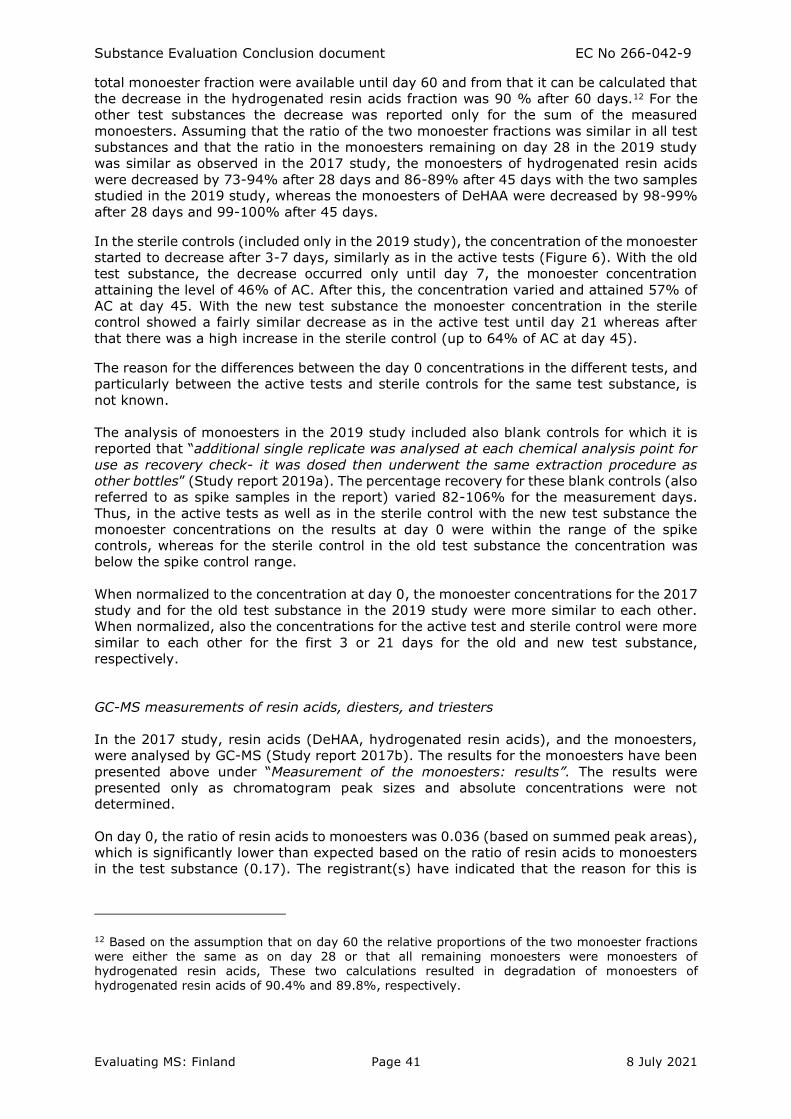
Substance Evaluation Conclusion document EC No 266-042-9
Evaluating MS: Finland Page 41 8 July 2021
total monoester fraction were available until day 60 and from that it can be calculated that
the decrease in the hydrogenated resin acids fraction was 90 % after 60 days.12 For the
other test substances the decrease was reported only for the sum of the measured
monoesters. Assuming that the ratio of the two monoester fractions was similar in all test
substances and that the ratio in the monoesters remaining on day 28 in the 2019 study
was similar as observed in the 2017 study, the monoesters of hydrogenated resin acids
were decreased by 73-94% after 28 days and 86-89% after 45 days with the two samples
studied in the 2019 study, whereas the monoesters of DeHAA were decreased by 98-99%
after 28 days and 99-100% after 45 days.
In the sterile controls (included only in the 2019 study), the concentration of the monoester
started to decrease after 3-7 days, similarly as in the active tests (Figure 6). With the old
test substance, the decrease occurred only until day 7, the monoester concentration
attaining the level of 46% of AC. After this, the concentration varied and attained 57% of
AC at day 45. With the new test substance the monoester concentration in the sterile
control showed a fairly similar decrease as in the active test until day 21 whereas after
that there was a high increase in the sterile control (up to 64% of AC at day 45).
The reason for the differences between the day 0 concentrations in the different tests, and
particularly between the active tests and sterile controls for the same test substance, is
not known.
The analysis of monoesters in the 2019 study included also blank controls for which it is
reported that “additional single replicate was analysed at each chemical analysis point for
use as recovery check- it was dosed then underwent the same extraction procedure as
other bottles” (Study report 2019a). The percentage recovery for these blank controls (also
referred to as spike samples in the report) varied 82-106% for the measurement days.
Thus, in the active tests as well as in the sterile control with the new test substance the
monoester concentrations on the results at day 0 were within the range of the spike
controls, whereas for the sterile control in the old test substance the concentration was
below the spike control range.
When normalized to the concentration at day 0, the monoester concentrations for the 2017
study and for the old test substance in the 2019 study were more similar to each other.
When normalized, also the concentrations for the active test and sterile control were more
similar to each other for the first 3 or 21 days for the old and new test substance,
respectively.
GC-MS measurements of resin acids, diesters, and triesters
In the 2017 study, resin acids (DeHAA, hydrogenated resin acids), and the monoesters,
were analysed by GC-MS (Study report 2017b). The results for the monoesters have been
presented above under “Measurement of the monoesters: results”. The results were
presented only as chromatogram peak sizes and absolute concentrations were not
determined.
On day 0, the ratio of resin acids to monoesters was 0.036 (based on summed peak areas),
which is significantly lower than expected based on the ratio of resin acids to monoesters
in the test substance (0.17). The registrant(s) have indicated that the reason for this is
12 Based on the assumption that on day 60 the relative proportions of the two monoester fractions were either the same as on day 28 or that all remaining monoesters were monoesters of hydrogenated resin acids, These two calculations resulted in degradation of monoesters of hydrogenated resin acids of 90.4% and 89.8%, respectively.
Substance Evaluation Conclusion document EC No 266-042-9
Evaluating MS: Finland Page 42 8 July 2021
not known but could be related e.g. to differences of the analytical methods used13. The
eMSCA considers that this may mean that the measured resin acids cover a relatively low
proportion of the total resin acids in the test bottles and that the representativeness of the
measured resin acids of the total resin acids in the test substance may be lower than for
the monoesters. Therefore, these results should not be used for estimating total
concentrations of resin acids or their changes during the study, or for a fully quantitative
comparison of the concentrations of monoesters and resin acids. However, the results show
clear changes in the concentrations of the measured resin acids during the study14.
There was a decline in resin acids (sum of hydrogenated resin acids and DeHAA) between
day 0 and day 3 (to 27% of the initial level) whereas an increase was observed on day 7
(to 56 %). The amount of resin acids decreased between day 7 and day 10 (to 16 %),
remaining at 10-17% for the rest of the study (measurements on days 14, 21, and 28).
There was a considerable difference between the changes in DeHAA and the hydrogenated
resin acids. On day 3, DeHAA was decreased to 6% of its initial level, increased to 15% on
day 7, and then declined to 13% on day 10 and to 3-4% on days 14, 21, and 28. The
hydrogenated resin acids decreased to 57% of their initial level on day 3, then increased
(113% on day 7), and decreased again (21% on day 10) and remained 21-38% on days
14, 21, and 28.
HPLC measurements of resin acids, monoesters, diesters, triesters, and heavy ends
In the 2017 study, monoesters, diesters, triesters, resin acids, and heavy ends were
analysed by HPLC (Study report 2017c). The results were presented only as chromatogram
peak sizes and concentrations were not determined, with the exception of monoesters.
Two sets of samples were analysed: P1 (day 0 and day 28) and P2 (day 0 and day 28) and
the percentage changes on day 28 compared to day 0 were -75% and -68% for the peak
including monoesters and internal standard, -52% and -66% for the diester peak, -12%
and -53% for the triester peak, -11% and +12% for the rosin acids peak, and +93% and
-3% for the heavy ends peak. According to the Study report (2017b) P1 samples showed
a reduction in the diester constituents over the course of the study, with the triester
constituents decreasing slightly, showing that the diester constituents appear to degrade
and the triester constituents may degrade, but to a lesser extent. P2 results were
considered less clear for these constituents as the peaks were less distinct, but appeared
according to the report to show a reduction in diester constituents between day 0 and day
28 and a possible reduction in triester constituents as well. It was stated that the P1
samples showed that the amount of resin acids decreased between day 0 and day 28, and
the P2 samples showed a slight increase in resin acids between the two time points. The
report stated that the resin acid signal is complex, as resin acids are likely to degrade, but
will also be produced as degradation products following degradation of other constituents
within the test item. The peaks for the resin acids in the chromatograms were also
considered difficult to interpret and it was reported that this may contribute to the
differences between the two sets of results.
The Study report (2017c) further states that the analysis of two sets of samples from day
0 and day 28 of the ready biodegradation study showed a reduction in the monoester
fraction, consistent with that shown in Study report 2017b. This was reported to indicate
significant primary degradation of the monoester fraction. The monoester peak co-eluted
with internal standard which was added in different amounts in day 0 and day 28 samples.
With a number of assumptions the decrease in monoester concentration was calculated as
74% and 67% in P1 and P2, respectively. Analysis of the diester fraction was considered
to show that this fraction decreased between 0 and 28 days. Peaks for the triester
constituents were less clear, but it was reported that there may be a reduction in these
13 E-mail from the registrant(s) to the eMSCA on 21 November 2017. 14 In the study report the results were presented as areas of the individual peaks, and as a percentage of peak area of the resin acids of the initial sum of the monoester peak areas. The eMSCA calculated the results (for the two fractions and their sum) as areas of the respective peaks in percentage of the areas of the same peaks on day 0.
Substance Evaluation Conclusion document EC No 266-042-9
Evaluating MS: Finland Page 43 8 July 2021
constituents over the course of the study as well. The resin acid signal was not consistent,
as P1 samples showed a slight decrease and P2 samples a slight increase between 0 and
28 days.
It was stated (Study report 2017c) that although some assumptions have had to be made
in the quantification, the % change results confirmed the significant reduction in monoester
constituents, reduction in diester constituents and some reduction in triester constituents
between 0 and 28 days.
It is unclear what is the composition of the peak named “heavy ends” in this study as this
fraction was not indicated in the composition of the test substance.
Primary degradation of monoesters: approach
The OECD TG 310 test guideline does not include specific instructions whether and how
the sterile control should be used for determination of the primary degradation in the active
tests. Whilst there was a considerable decrease in the monoester concentration in the
sterile controls, it cannot be confirmed whether and to what extent this was due to primary
degradation. It is also not known whether the abiotic primary degradation of the
monoesters was similar in the active tests and sterile controls. However, the eMSCA
considers that if the monoesters undergo primary degradation in the conditions of the
active test, for the purpose of the current tests there is no need have a certainty on whether
the degradation is completely biotic or whether part of it can be abiotic. For example, it is
possible that there were enzymes present in the inoculum which were still able to catalyse
the hydrolysis of the monoesters, despite the presence of formaldehyde. However, this
was not confirmed as there were no controls without inoculum (these were not required
by the test guideline or by the SEv decision). If the decrease in sterile controls was due to
enzyme activity, at least the same amount of hydrolysis would be expected to occur also
in the active test. Thus, if abiotic primary degradation has occurred in the sterile control,
it may be occurring also in the active test and in that case it does not need to be
differentiated from the primary degradation observed in the biotic test. On the other hand,
if the abiotic primary degradation/transformation of the monoesters occurred only in the
sterile controls (e.g. due to reaction with formaldehyde) it should not be taken into account
for calculating the primary degradation in the active test. Therefore, no correction for
sterile control was performed for the primary degradation of the monoesters in the active
tests.
The concentration of the monoesters was lower in the sterile controls on day 0. The reason
for this is not known. The main difference between the biotic tests and sterile controls was
the addition of formaldehyde in the sterile controls. The concentration of formaldehyde
used in the present study was high. Formaldehyde is used as a fixative of tissues samples
and reacts with biological material. Chemical reactions between formaldehyde and mono-
esters are unlikely to occur in the conditions of biodegradation tests. There were micro-
organisms and organic matter in the test medium which might react with formaldehyde.
However, there is no evidence of any effect of formaldehyde in the present test conditions
which could decrease the concentration or extractability of the monoesters. If
formaldehyde had an effect on the (actual or measured) monoester concentration in the
sterile controls, the same effect would not occur in the active study. Therefore, there is no
need to correct the results of the active study.
The fact that in the sterile controls with the new test substance the monoester
concentration first had a significant decrease but increased again to a substantial level
(64% AC) indicates that the monoester concentrations in the sterile controls may have
been affected by dissipation phenomena such as adsorption. Therefore, it cannot be
confirmed that abiotic degradation of the monoesters occurred in the sterile controls. It is
possible that there was even more non-degraded monoester constituents present in the
sterile controls which was not exctractable with the method used.
Substance Evaluation Conclusion document EC No 266-042-9
Evaluating MS: Finland Page 44 8 July 2021
The results from the sterile controls suggest that the concentrations may be affected by
non-degradative phenomena also in the active tests. Therefore, no conclusions on the
primary degradation of the monoesters can be done only based on the concentration
measurements in the active tests. However, the eMSCA considers that the decrease of the
monoesters in the active tests was due to biotransformation, as indicated by the following
additional evidence:
• CO2 production and the decrease in monoester concentration were considerably
higher in the active tests compared to the sterile controls.
• In the active tests, the decrease in the monoester concentration was mostly
consistent and non-reversible during the study period in the active tests. The
concentrations either remained similar or decreased in the course of the
experiment, with only a few exceptions where the concentration increased. At
maximum, an increase of 5 percentage points (from 8% to 13% AC) was seen
(2019 study, new test substance) (Figure 5), which is relatively low compared to
the overall decrease from 81% to <10% AC during the study). No increasing trends
in the monoester concentration were observed in the active tests.
• The liquid-liquid extraction (LLE) and solvent rinse (SR) of the test bottles in the
2019 study (data not shown) showed that in the active tests the amount of the
monoesters in the test medium (determined by LLE) was mostly below the detection
limit and the majority of the monoesters were detected in the solvent rinse. The
amount of the monoesters on the inside of the bottle (determined by the SR)
decreased faster in the active tests with both test substances. In the sterile controls,
there was an increasing trend in the amount of the monoesters in the test medium.
The results suggest that in the active tests, once released to the test medium, the
monoesters were removed fast, whereas in the sterile controls there was no such
removal or the removal was slower.
Therefore, the primary degradation in the active tests was estimated based on the
concentration measurements, on the assumption that the decrease in the monoester
concentration was solely due to degradation/transformation and not e.g. due to adsorption.
Primary degradation of monoesters: results
The estimated primary degradation is presented in
Substance Evaluation Conclusion document EC No 266-042-9
Evaluating MS: Finland Page 45 8 July 2021
Table 24. The primary degradation was 83-96% after 28 days, and 92-94% after 45-60
days in both studies (2017 and 2019). It should be noted that these values may be
underestimated as monoesters can be produced during the study from the degradation of
the di- and triesters.
Substance Evaluation Conclusion document EC No 266-042-9
Evaluating MS: Finland Page 46 8 July 2021
Table 24 also presents primary degradation percentages corrected for the production of
monoesters from a complete hydrolysis of the di- and triesters (i.e., one mole of monoester
is produced per each mole of di- or triester). These are likely to be overestimates (as also
indicated by the >100% values obtained in some cases) as a complete hydrolysis of the
di- and triesters is unlikely.
Low solubility of the monoesters limited the primary degradation, as indicated by the
LLE+SR results.
Estimation of ultimate degradation (% ThIC) of the monoesters
The degradation of monoesters (% of ThIC) is not necessarily the same as the degradation
of the test substance (% of ThIC) because the test substances included also other
constituents which may have degraded to a varying extent. Therefore, information on test
substance composition were used for the estimation of ultimate degradation of the
monoesters. The estimated biodegradation using different calculation scenarios is
presented in Table 25 and in Figure 8.
For the new test substance in the 2019 study, the scenarios 1, 3, and 4 gave monoester
degradation of 51-59 % ThIC after 28 days and 67-75% ThIC after 45 days. Whereas for
the other test substances, the degradation of the monoesters by these scenarios was lower
and there was more variability, particularly the Scenario 4 indicates a lower biodegradation
result. The low variability of the results with the new test substance can be explained by
the differences in the test substances as the new test substance had a higher concentration
of monoesters and a lower concentration of di- and triesters compared to the other test
substances. Scenario 2 gave the highest biodegradability results with each of the test
substances.
The eMSCA considers that the degradation of the monoesters is most likely between the
predictions of Scenarios 3 and 4. For the new test substance, these scenarios gave
relatively similar results (51-59% after 28 days, 70-75% after 45 days). For the other two
test substances, the variability between scenarios 3 and 4 was high, due to the higher
proportion of di- and triesters.
Based on three of the four scenarios, for each three test substances, the biodegradation of
the monoesters was below 60% during 28 days. Only Scenario 2 gave a biodegradation
≥60%. However, this is considered an overestimate as Scenario 2 assumes that all CO2 is
from monoesters. Therefore, it can be concluded that the degradation of the monoesters
did not fulfill the criterion for ready biodegradability (≥60% biodegradation based on ThIC)
during 28 days. The degradation of the monoesters was 67% or higher for the new test
substance after 45 days based on all four scenarios.
The biodegradation results (% ThIC) for the test substance (Figure 4) in the 2017 study
have been calculated using calculated TOC whereas in the 2019 study they are based on
measured TOC. In the 2017 study, measured and calculated TOC differed (Table 18, Table
19). In the 2017 study, it is mentioned that the measured TOC values were not considered
to be accurate and the calculated values were used in the report. It is also stated that the
use of a significantly lower TOC value would result in false positive biodegradation results
and to avoid this, the conservative approach to use the higher theoretical values was
chosen. As the calculations for ultimate degradation of the monoesters for the 2017 study
are also based on the calculated TOC, the results (Table 25, Figure 8) may be
underestimated compared to what would be obtained if the same calculations were
performed with a successfully measured TOC. This should be considered when comparing
the results obtained with the 2017 and 2019 studies. However, it is still not possible to
conclude that with a correct TOC, the pass level of 60% would have been reached in the
2017 study.
For the 2019 study, the calculations for the monoester biodegradation (Table 25) were
based on both measured and calculated TOCs (with the exception of Scenario 1, which for
Substance Evaluation Conclusion document EC No 266-042-9
Evaluating MS: Finland Page 47 8 July 2021
the 2019 study was based on measured TOC). The calculated TOC was used for estimating
the relative proportions of TOC of each fraction for the Scenarios 2, 3, and 4. For the
calculation of the amount of CO2 produced from each fraction, also the measured TOC was
used. It was done by multiplying the relative TOC proportion of the fraction by the expected
biodegradation (% ThIC) of the fraction and the measured TOC of the test substance
(mg/L). In the 2019 study, no difficulties in the TOC analysis were reported and the
measured TOC is considered valid. In the 2019 study, the calculated TOC differed from the
measured TOC (Table 19), but as the calculated TOC was used only to derive the relative
TOC proportions of the fractions, the potential error caused by this is probably lower than
in the 2017 study. It is not possible to estimate whether it would lead to under- or
overestimation of the biodegradation of the monoesters.
The uncertainties related to the test substance compositions (glycerol and terpene
concentrations), and consequently on the calculated TOC of the test substance and on the
calculated TOC proportions of the fractions, were taken into account by additional
calculations based on the different assumed compositions of the test substance. For each
test substance, the estimated degradation of the monoesters was very similar between the
assumed test substance compositions (See footnotes in Table 25) and therefore this
uncertainty is not considered significant.
Overall, the uncertainties related to TOC content or test substance composition (glycerol
and terpene concentrations) do not affect the conclusions on whether or not the ultimate
degradation of the monoesters achieved the level 60 %ThIC.
Discussion on selected issues important for P/vP assessment
There were differences in the primary degradation and ultimate degradation of the
monoesters observed with the three test substances. It is important to assess the potential
reasons for these differences to understand the relevance of the results for P/vP
assessment of the monoesters. The eMSCA considered four main issues in this context:
• Representativeness of monoester measurements
The high levels of primary and ultimate degradation of the monoesters with the new test
substance in the 2019 study indicate that the monoesters measured with GC-MS were well
representative of the degradation of the whole monoester fraction in that test substance.
In contrast, in the 2017 study and the old test substance in the 2019 study, the ultimate
degradation of the monoesters was clearly below 60 % ThIC, whereas the primary
degradation of the monoesters was high (88-96%). These results could mean either that
a significant part of the monoesters which underwent primary degradation could not be
mineralised, or, that a significant part of the monoesters did not undergo degradation at
all and were not covered by the GC-MS measurements. If the latter case was true, the
reported primary degradation results of the monoesters would be overestimated for these
two test substances.
The eMSCA considered whether poor representativeness of the monoester measurements
could be a plausible explanation. This was a relevant concern as the measured monoesters
either did not cover the complete monoester fraction of the test substance (2017 study)
or this issue was not clarified (2019 study) and also considering that different monoesters
may have different degradability, as also indicated by the 2017 study (Study report
2017b). Therefore, the observed primary degradation could depend on the selection of the
m/z values used for the quantification of the monoesters. Consequently the selection of
monoesters for analysis could also affect the differences in the primary degradation
observed between the different test substances studied, if their monoester compositions
differs.
The eMSCA considers that the measured monoesters were most likely representative of
the monoesters of the test substance, considering that for one test substance both primary
and ultimate degradation achieved high levels, and that all the three test substances were
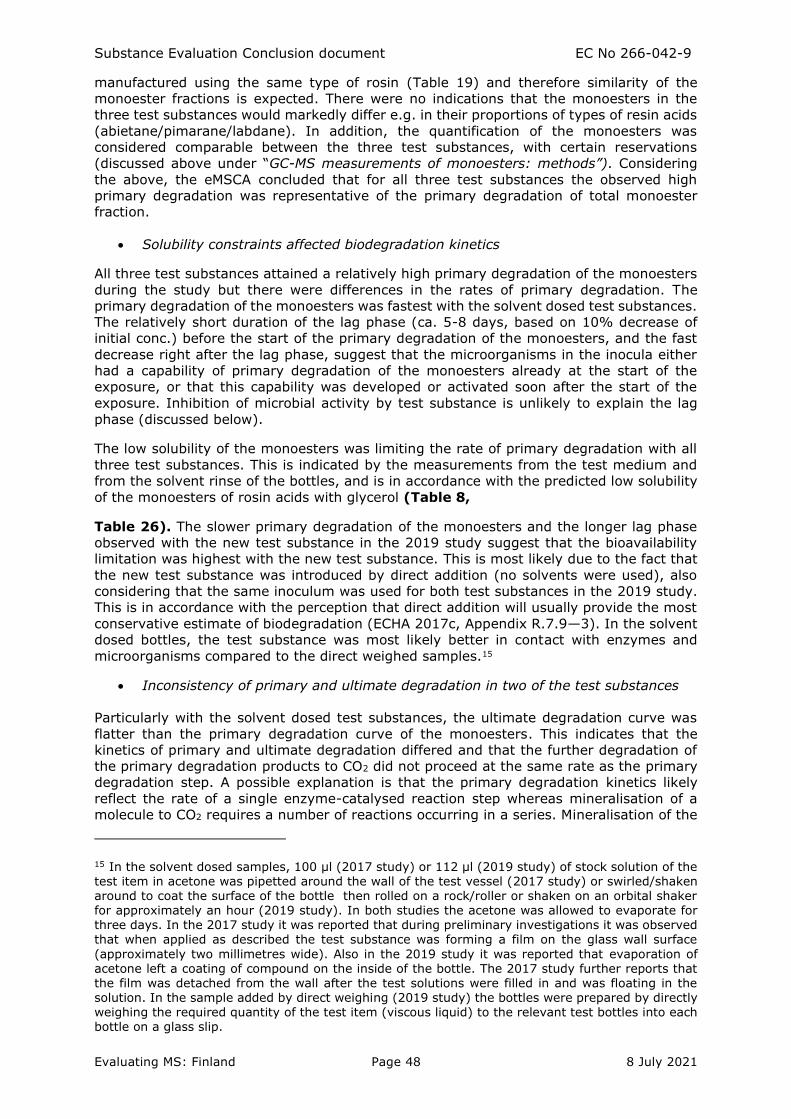
Substance Evaluation Conclusion document EC No 266-042-9
Evaluating MS: Finland Page 48 8 July 2021
manufactured using the same type of rosin (Table 19) and therefore similarity of the
monoester fractions is expected. There were no indications that the monoesters in the
three test substances would markedly differ e.g. in their proportions of types of resin acids
(abietane/pimarane/labdane). In addition, the quantification of the monoesters was
considered comparable between the three test substances, with certain reservations
(discussed above under “GC-MS measurements of monoesters: methods”). Considering
the above, the eMSCA concluded that for all three test substances the observed high
primary degradation was representative of the primary degradation of total monoester
fraction.
• Solubility constraints affected biodegradation kinetics
All three test substances attained a relatively high primary degradation of the monoesters
during the study but there were differences in the rates of primary degradation. The
primary degradation of the monoesters was fastest with the solvent dosed test substances.
The relatively short duration of the lag phase (ca. 5-8 days, based on 10% decrease of
initial conc.) before the start of the primary degradation of the monoesters, and the fast
decrease right after the lag phase, suggest that the microorganisms in the inocula either
had a capability of primary degradation of the monoesters already at the start of the
exposure, or that this capability was developed or activated soon after the start of the
exposure. Inhibition of microbial activity by test substance is unlikely to explain the lag
phase (discussed below).
The low solubility of the monoesters was limiting the rate of primary degradation with all
three test substances. This is indicated by the measurements from the test medium and
from the solvent rinse of the bottles, and is in accordance with the predicted low solubility
of the monoesters of rosin acids with glycerol (Table 8,
Table 26). The slower primary degradation of the monoesters and the longer lag phase
observed with the new test substance in the 2019 study suggest that the bioavailability
limitation was highest with the new test substance. This is most likely due to the fact that
the new test substance was introduced by direct addition (no solvents were used), also
considering that the same inoculum was used for both test substances in the 2019 study.
This is in accordance with the perception that direct addition will usually provide the most
conservative estimate of biodegradation (ECHA 2017c, Appendix R.7.9—3). In the solvent
dosed bottles, the test substance was most likely better in contact with enzymes and
microorganisms compared to the direct weighed samples.15
• Inconsistency of primary and ultimate degradation in two of the test substances
Particularly with the solvent dosed test substances, the ultimate degradation curve was
flatter than the primary degradation curve of the monoesters. This indicates that the
kinetics of primary and ultimate degradation differed and that the further degradation of
the primary degradation products to CO2 did not proceed at the same rate as the primary
degradation step. A possible explanation is that the primary degradation kinetics likely
reflect the rate of a single enzyme-catalysed reaction step whereas mineralisation of a
molecule to CO2 requires a number of reactions occurring in a series. Mineralisation of the
15 In the solvent dosed samples, 100 µl (2017 study) or 112 µl (2019 study) of stock solution of the test item in acetone was pipetted around the wall of the test vessel (2017 study) or swirled/shaken around to coat the surface of the bottle then rolled on a rock/roller or shaken on an orbital shaker for approximately an hour (2019 study). In both studies the acetone was allowed to evaporate for three days. In the 2017 study it was reported that during preliminary investigations it was observed that when applied as described the test substance was forming a film on the glass wall surface
(approximately two millimetres wide). Also in the 2019 study it was reported that evaporation of acetone left a coating of compound on the inside of the bottle. The 2017 study further reports that the film was detached from the wall after the test solutions were filled in and was floating in the solution. In the sample added by direct weighing (2019 study) the bottles were prepared by directly weighing the required quantity of the test item (viscous liquid) to the relevant test bottles into each bottle on a glass slip.
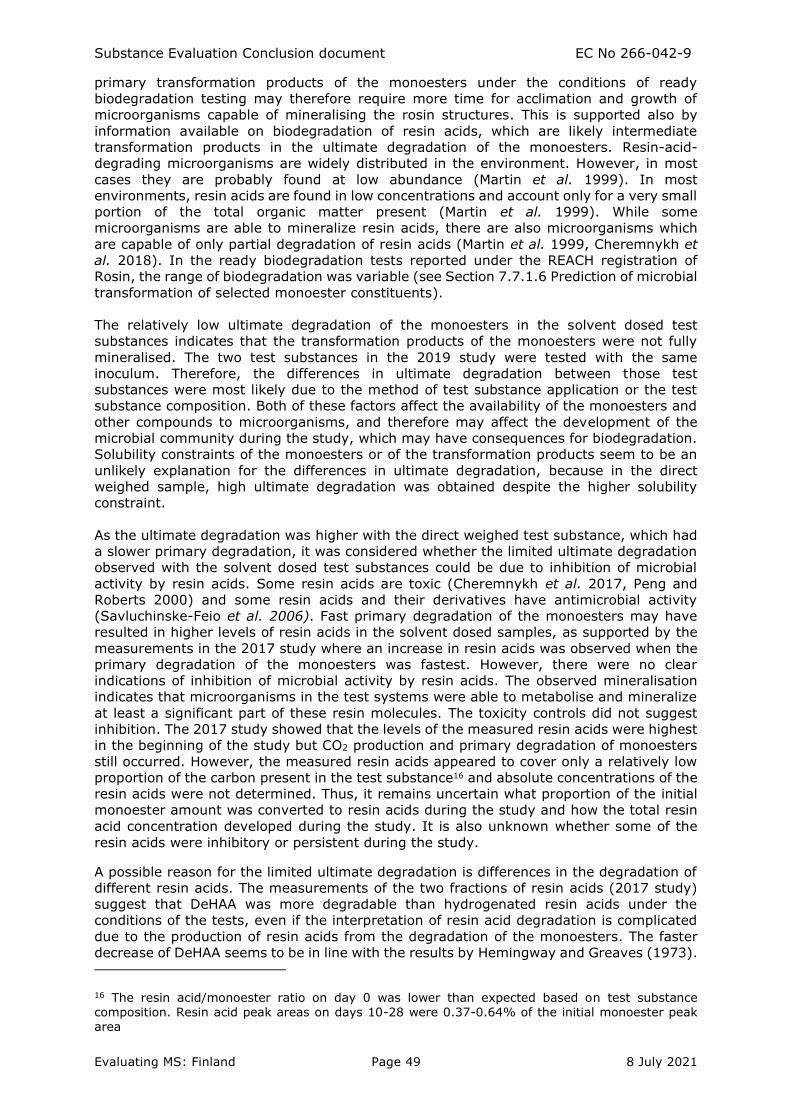
Substance Evaluation Conclusion document EC No 266-042-9
Evaluating MS: Finland Page 49 8 July 2021
primary transformation products of the monoesters under the conditions of ready
biodegradation testing may therefore require more time for acclimation and growth of
microorganisms capable of mineralising the rosin structures. This is supported also by
information available on biodegradation of resin acids, which are likely intermediate
transformation products in the ultimate degradation of the monoesters. Resin-acid-
degrading microorganisms are widely distributed in the environment. However, in most
cases they are probably found at low abundance (Martin et al. 1999). In most
environments, resin acids are found in low concentrations and account only for a very small
portion of the total organic matter present (Martin et al. 1999). While some
microorganisms are able to mineralize resin acids, there are also microorganisms which
are capable of only partial degradation of resin acids (Martin et al. 1999, Cheremnykh et
al. 2018). In the ready biodegradation tests reported under the REACH registration of
Rosin, the range of biodegradation was variable (see Section 7.7.1.6 Prediction of microbial
transformation of selected monoester constituents).
The relatively low ultimate degradation of the monoesters in the solvent dosed test
substances indicates that the transformation products of the monoesters were not fully
mineralised. The two test substances in the 2019 study were tested with the same
inoculum. Therefore, the differences in ultimate degradation between those test
substances were most likely due to the method of test substance application or the test
substance composition. Both of these factors affect the availability of the monoesters and
other compounds to microorganisms, and therefore may affect the development of the
microbial community during the study, which may have consequences for biodegradation.
Solubility constraints of the monoesters or of the transformation products seem to be an
unlikely explanation for the differences in ultimate degradation, because in the direct
weighed sample, high ultimate degradation was obtained despite the higher solubility
constraint.
As the ultimate degradation was higher with the direct weighed test substance, which had
a slower primary degradation, it was considered whether the limited ultimate degradation
observed with the solvent dosed test substances could be due to inhibition of microbial
activity by resin acids. Some resin acids are toxic (Cheremnykh et al. 2017, Peng and
Roberts 2000) and some resin acids and their derivatives have antimicrobial activity
(Savluchinske-Feio et al. 2006). Fast primary degradation of the monoesters may have
resulted in higher levels of resin acids in the solvent dosed samples, as supported by the
measurements in the 2017 study where an increase in resin acids was observed when the
primary degradation of the monoesters was fastest. However, there were no clear
indications of inhibition of microbial activity by resin acids. The observed mineralisation
indicates that microorganisms in the test systems were able to metabolise and mineralize
at least a significant part of these resin molecules. The toxicity controls did not suggest
inhibition. The 2017 study showed that the levels of the measured resin acids were highest
in the beginning of the study but CO2 production and primary degradation of monoesters
still occurred. However, the measured resin acids appeared to cover only a relatively low
proportion of the carbon present in the test substance16 and absolute concentrations of the
resin acids were not determined. Thus, it remains uncertain what proportion of the initial
monoester amount was converted to resin acids during the study and how the total resin
acid concentration developed during the study. It is also unknown whether some of the
resin acids were inhibitory or persistent during the study.
A possible reason for the limited ultimate degradation is differences in the degradation of
different resin acids. The measurements of the two fractions of resin acids (2017 study)
suggest that DeHAA was more degradable than hydrogenated resin acids under the
conditions of the tests, even if the interpretation of resin acid degradation is complicated
due to the production of resin acids from the degradation of the monoesters. The faster
decrease of DeHAA seems to be in line with the results by Hemingway and Greaves (1973).
16 The resin acid/monoester ratio on day 0 was lower than expected based on test substance composition. Resin acid peak areas on days 10-28 were 0.37-0.64% of the initial monoester peak area
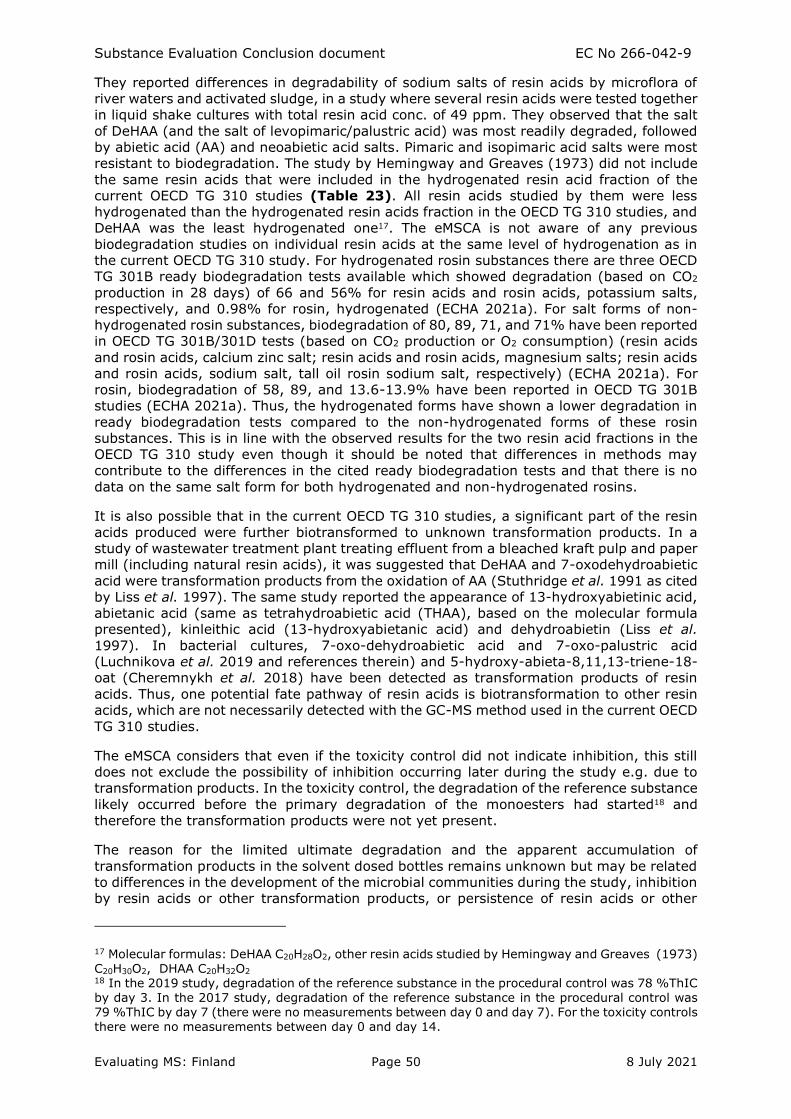
Substance Evaluation Conclusion document EC No 266-042-9
Evaluating MS: Finland Page 50 8 July 2021
They reported differences in degradability of sodium salts of resin acids by microflora of
river waters and activated sludge, in a study where several resin acids were tested together
in liquid shake cultures with total resin acid conc. of 49 ppm. They observed that the salt
of DeHAA (and the salt of levopimaric/palustric acid) was most readily degraded, followed
by abietic acid (AA) and neoabietic acid salts. Pimaric and isopimaric acid salts were most
resistant to biodegradation. The study by Hemingway and Greaves (1973) did not include
the same resin acids that were included in the hydrogenated resin acid fraction of the
current OECD TG 310 studies (Table 23). All resin acids studied by them were less
hydrogenated than the hydrogenated resin acids fraction in the OECD TG 310 studies, and
DeHAA was the least hydrogenated one17. The eMSCA is not aware of any previous
biodegradation studies on individual resin acids at the same level of hydrogenation as in
the current OECD TG 310 study. For hydrogenated rosin substances there are three OECD
TG 301B ready biodegradation tests available which showed degradation (based on CO2
production in 28 days) of 66 and 56% for resin acids and rosin acids, potassium salts,
respectively, and 0.98% for rosin, hydrogenated (ECHA 2021a). For salt forms of non-
hydrogenated rosin substances, biodegradation of 80, 89, 71, and 71% have been reported
in OECD TG 301B/301D tests (based on CO2 production or O2 consumption) (resin acids
and rosin acids, calcium zinc salt; resin acids and rosin acids, magnesium salts; resin acids
and rosin acids, sodium salt, tall oil rosin sodium salt, respectively) (ECHA 2021a). For
rosin, biodegradation of 58, 89, and 13.6-13.9% have been reported in OECD TG 301B
studies (ECHA 2021a). Thus, the hydrogenated forms have shown a lower degradation in
ready biodegradation tests compared to the non-hydrogenated forms of these rosin
substances. This is in line with the observed results for the two resin acid fractions in the
OECD TG 310 study even though it should be noted that differences in methods may
contribute to the differences in the cited ready biodegradation tests and that there is no
data on the same salt form for both hydrogenated and non-hydrogenated rosins.
It is also possible that in the current OECD TG 310 studies, a significant part of the resin
acids produced were further biotransformed to unknown transformation products. In a
study of wastewater treatment plant treating effluent from a bleached kraft pulp and paper
mill (including natural resin acids), it was suggested that DeHAA and 7-oxodehydroabietic
acid were transformation products from the oxidation of AA (Stuthridge et al. 1991 as cited
by Liss et al. 1997). The same study reported the appearance of 13-hydroxyabietinic acid,
abietanic acid (same as tetrahydroabietic acid (THAA), based on the molecular formula
presented), kinleithic acid (13-hydroxyabietanic acid) and dehydroabietin (Liss et al.
1997). In bacterial cultures, 7-oxo-dehydroabietic acid and 7-oxo-palustric acid
(Luchnikova et al. 2019 and references therein) and 5-hydroxy-abieta-8,11,13-triene-18-
oat (Cheremnykh et al. 2018) have been detected as transformation products of resin
acids. Thus, one potential fate pathway of resin acids is biotransformation to other resin
acids, which are not necessarily detected with the GC-MS method used in the current OECD
TG 310 studies.
The eMSCA considers that even if the toxicity control did not indicate inhibition, this still
does not exclude the possibility of inhibition occurring later during the study e.g. due to
transformation products. In the toxicity control, the degradation of the reference substance
likely occurred before the primary degradation of the monoesters had started18 and
therefore the transformation products were not yet present.
The reason for the limited ultimate degradation and the apparent accumulation of
transformation products in the solvent dosed bottles remains unknown but may be related
to differences in the development of the microbial communities during the study, inhibition
by resin acids or other transformation products, or persistence of resin acids or other
17 Molecular formulas: DeHAA C20H28O2, other resin acids studied by Hemingway and Greaves (1973) C20H30O2, DHAA C20H32O2 18 In the 2019 study, degradation of the reference substance in the procedural control was 78 %ThIC by day 3. In the 2017 study, degradation of the reference substance in the procedural control was 79 %ThIC by day 7 (there were no measurements between day 0 and day 7). For the toxicity controls there were no measurements between day 0 and day 14.
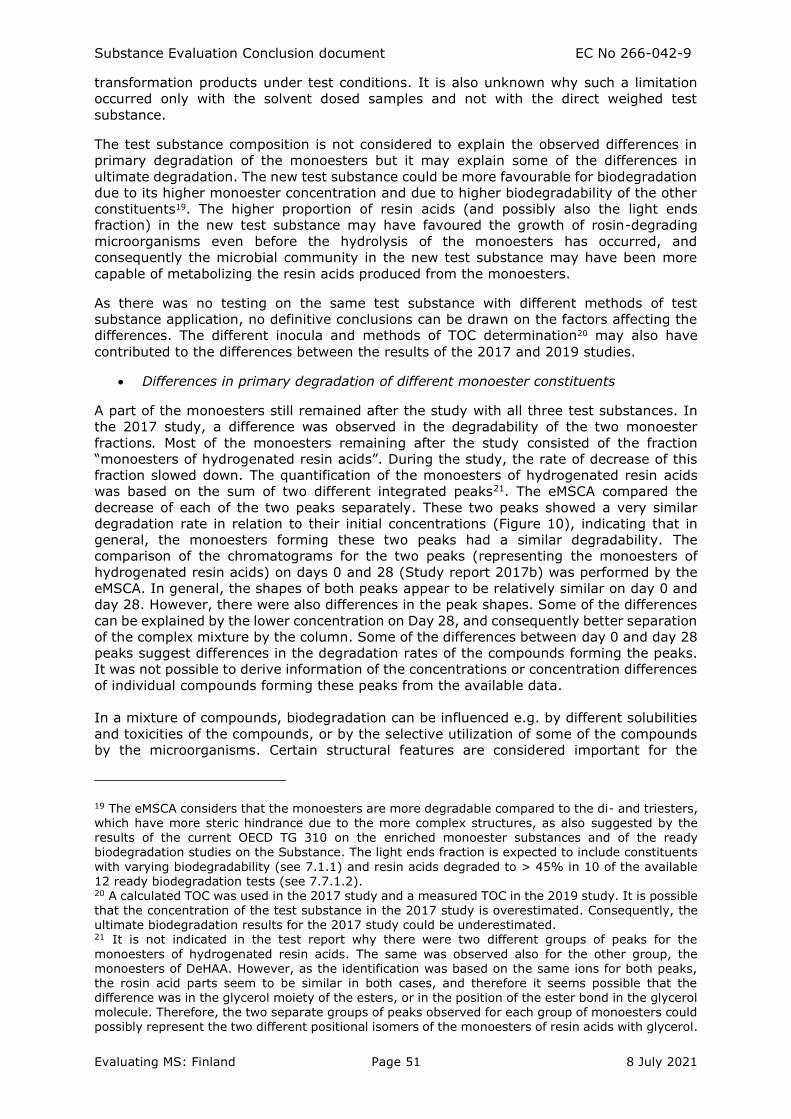
Substance Evaluation Conclusion document EC No 266-042-9
Evaluating MS: Finland Page 51 8 July 2021
transformation products under test conditions. It is also unknown why such a limitation
occurred only with the solvent dosed samples and not with the direct weighed test
substance.
The test substance composition is not considered to explain the observed differences in
primary degradation of the monoesters but it may explain some of the differences in
ultimate degradation. The new test substance could be more favourable for biodegradation
due to its higher monoester concentration and due to higher biodegradability of the other
constituents19. The higher proportion of resin acids (and possibly also the light ends
fraction) in the new test substance may have favoured the growth of rosin-degrading
microorganisms even before the hydrolysis of the monoesters has occurred, and
consequently the microbial community in the new test substance may have been more
capable of metabolizing the resin acids produced from the monoesters.
As there was no testing on the same test substance with different methods of test
substance application, no definitive conclusions can be drawn on the factors affecting the
differences. The different inocula and methods of TOC determination20 may also have
contributed to the differences between the results of the 2017 and 2019 studies.
• Differences in primary degradation of different monoester constituents
A part of the monoesters still remained after the study with all three test substances. In
the 2017 study, a difference was observed in the degradability of the two monoester
fractions. Most of the monoesters remaining after the study consisted of the fraction
“monoesters of hydrogenated resin acids”. During the study, the rate of decrease of this
fraction slowed down. The quantification of the monoesters of hydrogenated resin acids
was based on the sum of two different integrated peaks21. The eMSCA compared the
decrease of each of the two peaks separately. These two peaks showed a very similar
degradation rate in relation to their initial concentrations (Figure 10), indicating that in
general, the monoesters forming these two peaks had a similar degradability. The
comparison of the chromatograms for the two peaks (representing the monoesters of
hydrogenated resin acids) on days 0 and 28 (Study report 2017b) was performed by the
eMSCA. In general, the shapes of both peaks appear to be relatively similar on day 0 and
day 28. However, there were also differences in the peak shapes. Some of the differences
can be explained by the lower concentration on Day 28, and consequently better separation
of the complex mixture by the column. Some of the differences between day 0 and day 28
peaks suggest differences in the degradation rates of the compounds forming the peaks.
It was not possible to derive information of the concentrations or concentration differences
of individual compounds forming these peaks from the available data.
In a mixture of compounds, biodegradation can be influenced e.g. by different solubilities
and toxicities of the compounds, or by the selective utilization of some of the compounds
by the microorganisms. Certain structural features are considered important for the
19 The eMSCA considers that the monoesters are more degradable compared to the di- and triesters, which have more steric hindrance due to the more complex structures, as also suggested by the
results of the current OECD TG 310 on the enriched monoester substances and of the ready biodegradation studies on the Substance. The light ends fraction is expected to include constituents
with varying biodegradability (see 7.1.1) and resin acids degraded to > 45% in 10 of the available 12 ready biodegradation tests (see 7.7.1.2). 20 A calculated TOC was used in the 2017 study and a measured TOC in the 2019 study. It is possible that the concentration of the test substance in the 2017 study is overestimated. Consequently, the ultimate biodegradation results for the 2017 study could be underestimated. 21 It is not indicated in the test report why there were two different groups of peaks for the
monoesters of hydrogenated resin acids. The same was observed also for the other group, the monoesters of DeHAA. However, as the identification was based on the same ions for both peaks, the rosin acid parts seem to be similar in both cases, and therefore it seems possible that the difference was in the glycerol moiety of the esters, or in the position of the ester bond in the glycerol molecule. Therefore, the two separate groups of peaks observed for each group of monoesters could possibly represent the two different positional isomers of the monoesters of resin acids with glycerol.
Substance Evaluation Conclusion document EC No 266-042-9
Evaluating MS: Finland Page 52 8 July 2021
biodegradation of resin acids (Martin et al. 1999, Luchnikova et al. 2018). The same
features may be relevant for the ultimate degradation of the monoesters, which is expected
to occur via resin acid intermediates. However, it is not known whether the same features
are also important for the primary degradation of the monoesters.
Based on the structural formulas (Table 23), the difference in primary degradability of
the two monoester fractions may be linked to the structural differences such as the level
of hydrogenation of the rosin moiety. The eMSCA considered whether there could be a
difference also in solubility between the two fractions. For the monoesters of resin acids
with glycerol, there was no experimental water solubility data available. However, the
relative solubilities of the different monoesters of resin acids with glycerol can be generally
expected to follow a similar pattern observed for the respective resin acids, as the rosin
moiety forms a major part of the monoester molecule. This is supported by the QSAR
predictions for AA, DeHAA, dihydroabietic acid (DHAA), and tetrahydroabietic acid (THAA)
and their monoesters with glycerol (
Table 26). According to Peng and Roberts (2000), DeHAA was the most soluble (pH 7 ±
0.2, temperature 20 °C) compared to other studied resin acids (i.e. isopimaric, sandara-
copimaric, pimaric, palustric, neoabietic, levopimaric, and AA). The WSKOW model predicts
that AA and DeHAA are more soluble than DHAA and THAA (range 0.06-0.09 mg/L for the
four compounds, when predictions based on estimated log Kow are used). According to the
Watsol model, DeHAA has the lowest solubility (range 0.13-0.28 mg/L for the four
compounds). In DeHAA, one of the fused rings is aromatic whereas in palustric and
levopimaric acids the corresponding ring has 2 double bonds and there are no aromatic
rings (Figure 2)22. The measured solubility of DeHAA (5.11 mg/L) was higher compared
to palustric (2.41mg/L) and levopimaric (2.54 mg/L) acids (Peng and Roberts 2000). As
the solubilities of monoesters or resin acids with glycerol are expected to follow a similar
pattern as the solubilities of resin acids, the monoesters of DeHAA may have a relatively
high solubility among the monoesters followed in the OECD TG 310 studies. Therefore,
solubilities may have contributed to the faster primary degradation of the DeHAA
monoesters.
Reliability
Regarding the 2017 study, a reliability score of 2 (reliable with restrictions) is assigned by
the eMSCA. The study was conducted according to GLP and no deviations from test
guideline were indicated. The results reported were reproducible by the eMSCA from the
raw data presented with only insignificant deviations in some of the values. The eMSCA
noted the following deficiencies:
• The lack of a measured TOC value, and consequent uncertainty (potential
underestimation) of the ultimate biodegradation result
• The limited reliability of the primary degradation determination due to the lack of
sterile control (it is noted that a sterile control is not an obligatory requirement in
the test guideline and does not affect the reliability of the ultimate degradation
results)
• The primary degradation measurement of the monoesters was based on the
analysis of only a part of the monoester fraction of the test substance; it was not
explained why the measured monoesters were assumed to be representative of the
whole monoester fraction of the test substance
22 Molecular formulas: DeHAA C20H28O2, other resin acids studied by Peng and Roberts (2000) C20H30O2, DHAA C20H32O2, THAA C20H34O2
Substance Evaluation Conclusion document EC No 266-042-9
Evaluating MS: Finland Page 53 8 July 2021
Regarding the 2019 study, a reliability score of 2 (reliable with restrictions) is assigned by
the eMSCA. The study was conducted according to GLP. The eMSCA noted the following
deficiencies:
• The storage time of the soil used for the inoculum was 38 days, whereas according
to the test guideline the maximum time is one month.
• Some of the calculations were not in accordance with the test guideline such as the
subtraction of the sterile control (instead of solvent control or inoculum blank) from
the results of the test substance bottles; however, this does not prevent the use of
the study for the assessment as recalculation was possible from the raw data.
It was not indicated whether the measured monoesters covered the complete
monoester fraction of the test substance or only a part of it.
• For the GC-MS analysis of the monoesters, there was no calibration curve for the
old test substance and the results were based on the calibration curve obtained with
the new test substance.
Regarding the primary degradation determination, the reliability of the 2017 study is
supported by the results of the 2019 study, particularly for the old test substance which
had a composition close to that in the 2017 study and the same method of introducing the
test substance. The CO2 production and monoester concentration curves were relatively
similar between these two studies (although the results are not fully comparable due e.g.
to differences in inocula and in calibration of the analytical method). The 2019 study, which
included sterile controls, and monoester analyses from both the test medium and solvent
rinse of the bottles, allows to conclude that the decrease in the monoester concentration
also in the 2017 study was due to primary degradation, as explained above in ‘Primary
degradation results’.
Relevance
Both OECD TG 310 studies are considered relevant for the purpose of P and vP assessment
of the Substance. This is based on the following considerations:
• The tests were performed in general accordance with the test guideline and SEV
decision.
• All three test substances are considered relevant for the assessment.
The relevance of the test substances was considered based on the following three points:
1) The primary degradation results are representative of the monoesters of the test
substance, as discussed above under “Discussion on selected issues important for
P/vP assessment”
2) The monoesters of the test substances are considered representative of the
monoesters of the Substance.
Regarding the representativeness of the monoesters in the test substances of the
monoesters in the Substance, it should be noted that the exact composition of the
monoester fractions is not known. There may be differences between the composition of
the monoester fractions of the test substances and the monoester fraction of the
Substance, due to different production processes and starting materials. The registrant(s)
have indicated that the type of rosin used to produce the test materials represents one of
the most common types of rosin on the market. Therefore, the eMSCA considers that it is
reasonable to expect that the monoester composition of the test substances was
representative to the Substance.
Substance Evaluation Conclusion document EC No 266-042-9
Evaluating MS: Finland Page 54 8 July 2021
3) The test substances are suitable for assessing the degradability of the monoesters
of Substance.
Regarding the potential influence of the other constituents of the test substance, the
eMSCA paid attention in particular to the fractions which are considered potentially more
degradable than the monoesters and which could influence the degradation of the
monoesters either positively or neatively (discussed above under “Discussion on selected
issues important for P/vP assessment”). This is relevant because the presence of the other
constituents in the test substance was unwanted but unavoidable due to technical difficulty
of producing a pure monoester fraction. Exposure to a pure monoester fraction may be
also an environmentally relevant scenario because after release to the environment the
different constituents of an UVCB substance may have different fate and distribution.
Therefore, organisms may be exposed to the constituents/fractions in proportions differing
from the initial composition of the substance. The eMSCA considers that the test substance
composition may potentially explain some of the differences in the biodegradation of the
monoesters. However, this could not be confirmed as the differences in test conditions and
methods may also have an influence. Despite the uncertainty regarding the influence of
test substance composition, the data for all three test substances are considered applicable
for the assessment of the degradability of the monoesters of the Substance. In addition,
the fact that the highest ultimate degradation of the monoesters was seen with the test
substance with the highest monoester concentration should be taken into account.
The composition of the test substances was also compared to the composition of the
Substance, as in some cases the environmental exposure may be to the whole UVCB
substance, or to several constituents representing different fractions, rather than to an
individual constituent or fraction. This included comparison of the concentrations of certain
fractions. Also the available information on biodegradability of the relevant fractions was
used for this comparison. Details of this comparison are not presented in this report due
to confidentiality of the composition of the Substance. Based on this comparison, the
eMSCA considers that it cannot be concluded that the test substance compositions would
be significantly more favourable or unfavourable for the biodegradation of the monoesters
compared to the composition of the Substance.
Summary of the OECD TG 310 studies on the monoesters
Two OECD TG 310 studies are available and both are considered reliable (with restricions)
and relevant for PBT assessment. The studies included testing on three different test
substances enriched in monoesters of resin acids with glycerol.
The estimated degradation of the monoesters was below 60% (% ThIC) with all three test
substances after 28 days whereas with one of the test substances it was above 60% after
45 days. The primary degradation of the monoesters was 83-96% after 28 days, and 92-
94% after 45-60 days with all three test substances. A part of the monoesters still
remained after the study. Based on the study where more detailed analytical information
was available, the remaining monoesters mostly belonged to the fraction “monoesters of
hydrogenated resin acids”.
The primary degradation of the monoesters was thus high already in 28 days, whereas
mineralisation was relatively low with two test substances and higher with one of them.
Potential explanations to the different biodegradation results were considered23 to
23 The ECHA guidance (ECHA 2017) states that “Realising that ready biodegradability tests may sometime fail because of the stringent test conditions, positive test results should generally supersede negative test results.”. The guidance further mentions that when conflicting test results
are reported, possible differences in the test conditions and design should be investigated. In particular the origin of the inocula should be examined in order to verify whether or not there are differences in the adaptation of the inocula which may explain the differences in the results (OECD, 2006b). The guidance further mentions that when faced with conflicting results using different ready
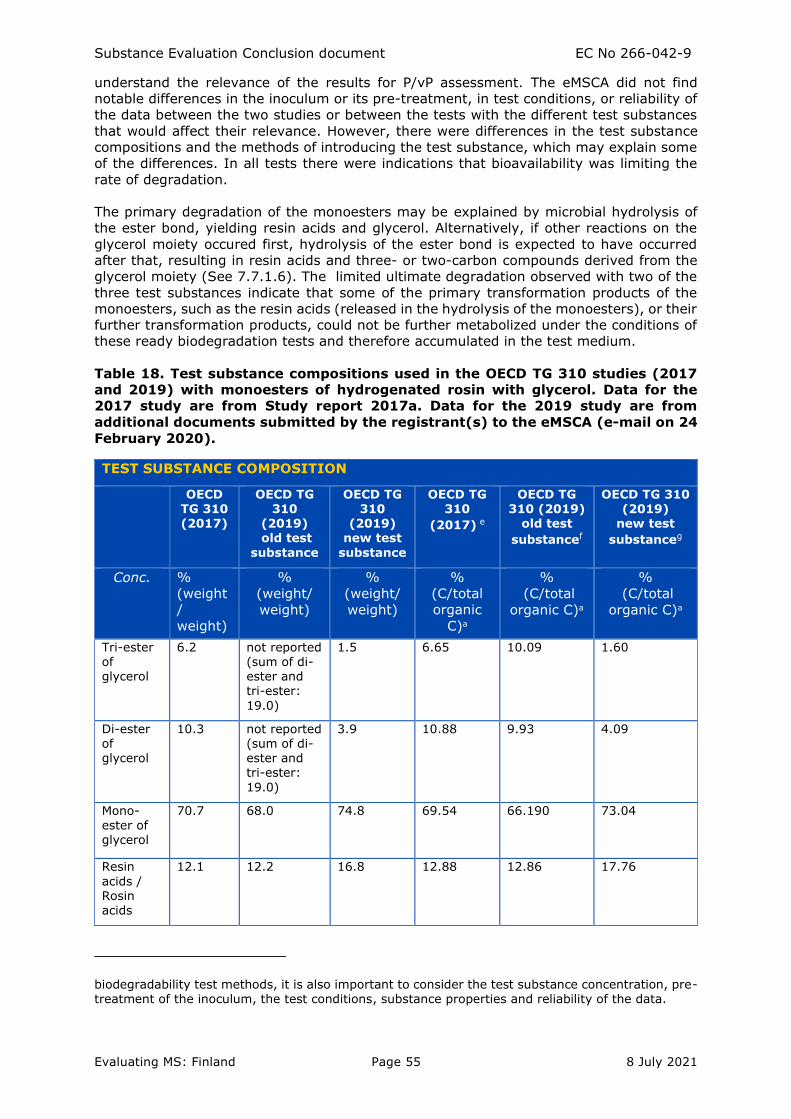
Substance Evaluation Conclusion document EC No 266-042-9
Evaluating MS: Finland Page 55 8 July 2021
understand the relevance of the results for P/vP assessment. The eMSCA did not find
notable differences in the inoculum or its pre-treatment, in test conditions, or reliability of
the data between the two studies or between the tests with the different test substances
that would affect their relevance. However, there were differences in the test substance
compositions and the methods of introducing the test substance, which may explain some
of the differences. In all tests there were indications that bioavailability was limiting the
rate of degradation.
The primary degradation of the monoesters may be explained by microbial hydrolysis of
the ester bond, yielding resin acids and glycerol. Alternatively, if other reactions on the
glycerol moiety occured first, hydrolysis of the ester bond is expected to have occurred
after that, resulting in resin acids and three- or two-carbon compounds derived from the
glycerol moiety (See 7.7.1.6). The limited ultimate degradation observed with two of the
three test substances indicate that some of the primary transformation products of the
monoesters, such as the resin acids (released in the hydrolysis of the monoesters), or their
further transformation products, could not be further metabolized under the conditions of
these ready biodegradation tests and therefore accumulated in the test medium.
Table 18. Test substance compositions used in the OECD TG 310 studies (2017
and 2019) with monoesters of hydrogenated rosin with glycerol. Data for the
2017 study are from Study report 2017a. Data for the 2019 study are from
additional documents submitted by the registrant(s) to the eMSCA (e-mail on 24
February 2020).
TEST SUBSTANCE COMPOSITION
OECD TG 310 (2017)
OECD TG 310
(2019) old test
substance
OECD TG 310
(2019) new test
substance
OECD TG 310
(2017) e
OECD TG 310 (2019)
old test
substancef
OECD TG 310 (2019)
new test
substanceg
Conc. %
(weight
/
weight)
%
(weight/
weight)
%
(weight/
weight)
%
(C/total
organic
C)a
%
(C/total
organic C)a
%
(C/total
organic C)a
Tri-ester of glycerol
6.2 not reported (sum of di-ester and tri-ester:
19.0)
1.5 6.65 10.09 1.60
Di-ester of glycerol
10.3 not reported (sum of di-ester and tri-ester:
19.0)
3.9 10.88 9.93 4.09
Mono-
ester of glycerol
70.7 68.0 74.8 69.54 66.190 73.04
Resin
acids / Rosin acids
12.1 12.2 16.8 12.88 12.86 17.76
biodegradability test methods, it is also important to consider the test substance concentration, pre-treatment of the inoculum, the test conditions, substance properties and reliability of the data.
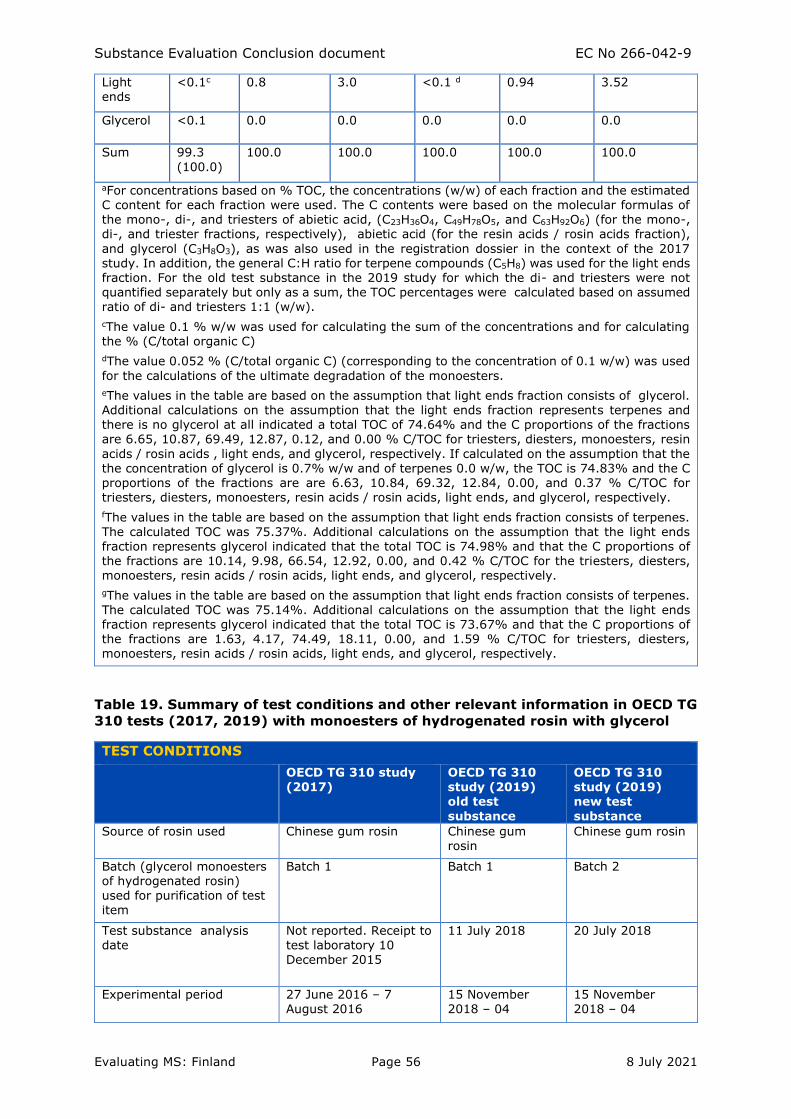
Substance Evaluation Conclusion document EC No 266-042-9
Evaluating MS: Finland Page 56 8 July 2021
Light ends
<0.1c 0.8 3.0 <0.1 d 0.94 3.52
Glycerol <0.1 0.0 0.0 0.0 0.0 0.0
Sum 99.3
(100.0)
100.0 100.0 100.0 100.0 100.0
aFor concentrations based on % TOC, the concentrations (w/w) of each fraction and the estimated C content for each fraction were used. The C contents were based on the molecular formulas of the mono-, di-, and triesters of abietic acid, (C23H36O4, C49H78O5, and C63H92O6) (for the mono-, di-, and triester fractions, respectively), abietic acid (for the resin acids / rosin acids fraction),
and glycerol (C3H8O3), as was also used in the registration dossier in the context of the 2017 study. In addition, the general C:H ratio for terpene compounds (C5H8) was used for the light ends fraction. For the old test substance in the 2019 study for which the di- and triesters were not quantified separately but only as a sum, the TOC percentages were calculated based on assumed ratio of di- and triesters 1:1 (w/w).
cThe value 0.1 % w/w was used for calculating the sum of the concentrations and for calculating the % (C/total organic C)
dThe value 0.052 % (C/total organic C) (corresponding to the concentration of 0.1 w/w) was used
for the calculations of the ultimate degradation of the monoesters.
eThe values in the table are based on the assumption that light ends fraction consists of glycerol. Additional calculations on the assumption that the light ends fraction represents terpenes and there is no glycerol at all indicated a total TOC of 74.64% and the C proportions of the fractions are 6.65, 10.87, 69.49, 12.87, 0.12, and 0.00 % C/TOC for triesters, diesters, monoesters, resin
acids / rosin acids , light ends, and glycerol, respectively. If calculated on the assumption that the the concentration of glycerol is 0.7% w/w and of terpenes 0.0 w/w, the TOC is 74.83% and the C proportions of the fractions are are 6.63, 10.84, 69.32, 12.84, 0.00, and 0.37 % C/TOC for triesters, diesters, monoesters, resin acids / rosin acids, light ends, and glycerol, respectively.
fThe values in the table are based on the assumption that light ends fraction consists of terpenes. The calculated TOC was 75.37%. Additional calculations on the assumption that the light ends fraction represents glycerol indicated that the total TOC is 74.98% and that the C proportions of the fractions are 10.14, 9.98, 66.54, 12.92, 0.00, and 0.42 % C/TOC for the triesters, diesters, monoesters, resin acids / rosin acids, light ends, and glycerol, respectively.
gThe values in the table are based on the assumption that light ends fraction consists of terpenes. The calculated TOC was 75.14%. Additional calculations on the assumption that the light ends fraction represents glycerol indicated that the total TOC is 73.67% and that the C proportions of the fractions are 1.63, 4.17, 74.49, 18.11, 0.00, and 1.59 % C/TOC for triesters, diesters, monoesters, resin acids / rosin acids, light ends, and glycerol, respectively.
Table 19. Summary of test conditions and other relevant information in OECD TG
310 tests (2017, 2019) with monoesters of hydrogenated rosin with glycerol
TEST CONDITIONS
OECD TG 310 study (2017)
OECD TG 310 study (2019) old test
substance
OECD TG 310 study (2019) new test
substance
Source of rosin used Chinese gum rosin Chinese gum rosin
Chinese gum rosin
Batch (glycerol monoesters of hydrogenated rosin) used for purification of test item
Batch 1 Batch 1 Batch 2
Test substance analysis date
Not reported. Receipt to test laboratory 10 December 2015
11 July 2018 20 July 2018
Experimental period 27 June 2016 – 7 August 2016
15 November 2018 – 04
15 November 2018 – 04
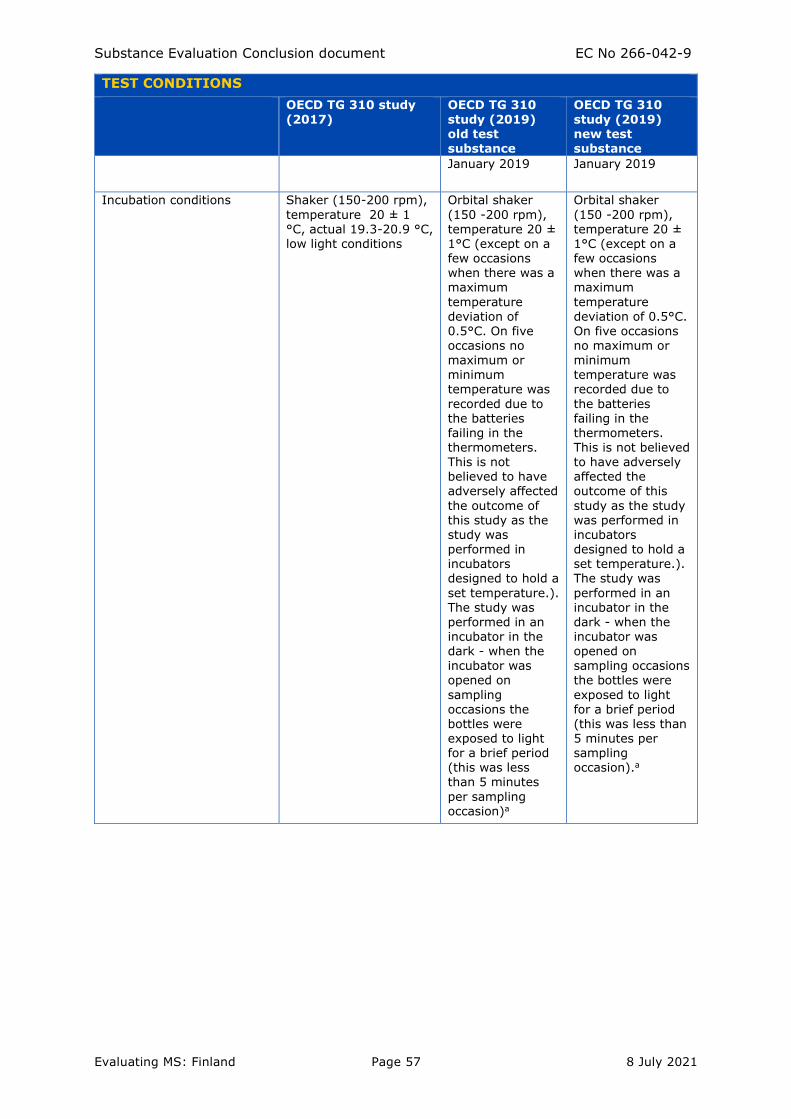
Substance Evaluation Conclusion document EC No 266-042-9
Evaluating MS: Finland Page 57 8 July 2021
TEST CONDITIONS
OECD TG 310 study
(2017)
OECD TG 310
study (2019) old test substance
OECD TG 310
study (2019) new test substance
January 2019 January 2019
Incubation conditions Shaker (150-200 rpm),
temperature 20 ± 1 °C, actual 19.3-20.9 °C, low light conditions
Orbital shaker
(150 -200 rpm), temperature 20 ± 1°C (except on a few occasions when there was a maximum
temperature deviation of 0.5°C. On five occasions no
maximum or minimum temperature was
recorded due to the batteries failing in the thermometers. This is not believed to have adversely affected
the outcome of this study as the study was performed in incubators designed to hold a
set temperature.). The study was performed in an incubator in the dark - when the incubator was opened on
sampling occasions the bottles were exposed to light for a brief period (this was less than 5 minutes
per sampling occasion)a
Orbital shaker
(150 -200 rpm), temperature 20 ± 1°C (except on a few occasions when there was a maximum
temperature deviation of 0.5°C. On five occasions no maximum or
minimum temperature was recorded due to
the batteries failing in the thermometers. This is not believed to have adversely affected the outcome of this
study as the study was performed in incubators designed to hold a set temperature.). The study was
performed in an incubator in the dark - when the incubator was opened on sampling occasions the bottles were
exposed to light for a brief period (this was less than 5 minutes per sampling occasion).a
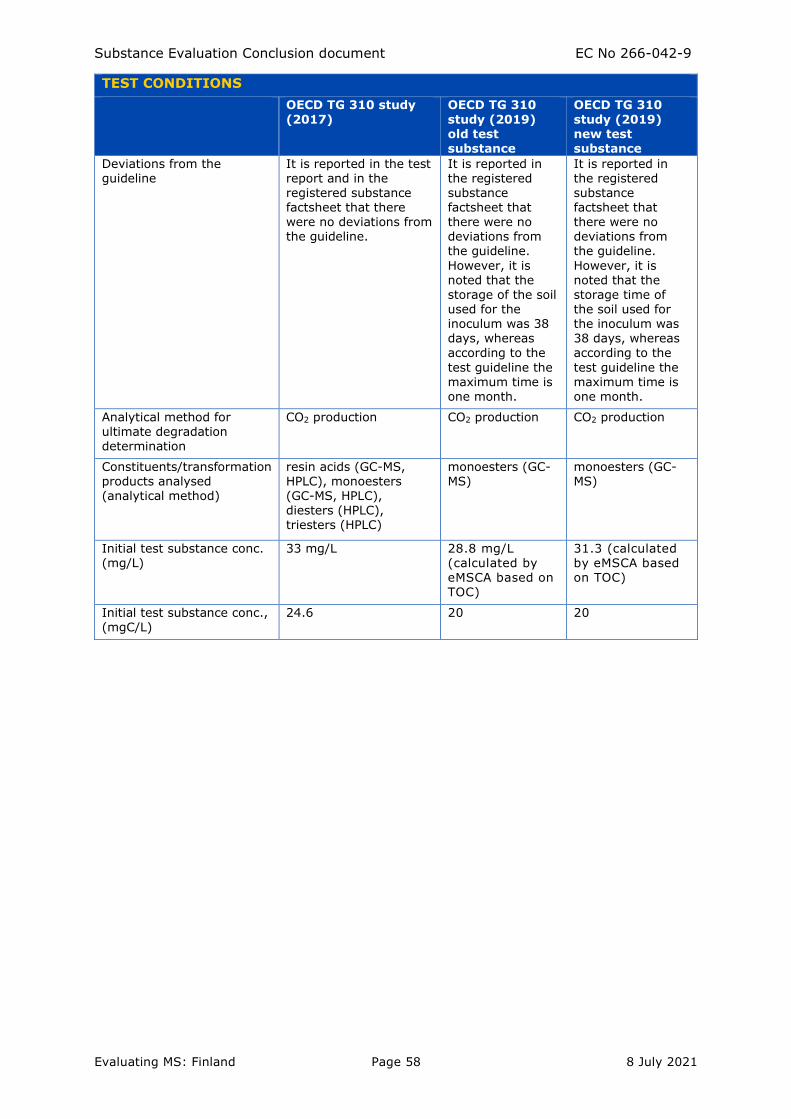
Substance Evaluation Conclusion document EC No 266-042-9
Evaluating MS: Finland Page 58 8 July 2021
TEST CONDITIONS
OECD TG 310 study
(2017)
OECD TG 310
study (2019) old test substance
OECD TG 310
study (2019) new test substance
Deviations from the guideline
It is reported in the test report and in the registered substance factsheet that there were no deviations from the guideline.
It is reported in the registered substance factsheet that there were no deviations from the guideline.
However, it is noted that the storage of the soil used for the inoculum was 38 days, whereas
according to the
test guideline the maximum time is one month.
It is reported in the registered substance factsheet that there were no deviations from the guideline.
However, it is noted that the storage time of the soil used for the inoculum was 38 days, whereas
according to the
test guideline the maximum time is one month.
Analytical method for ultimate degradation determination
CO2 production CO2 production CO2 production
Constituents/transformation products analysed (analytical method)
resin acids (GC-MS, HPLC), monoesters (GC-MS, HPLC), diesters (HPLC), triesters (HPLC)
monoesters (GC-MS)
monoesters (GC-MS)
Initial test substance conc. (mg/L)
33 mg/L 28.8 mg/L (calculated by eMSCA based on
TOC)
31.3 (calculated by eMSCA based on TOC)
Initial test substance conc., (mgC/L)
24.6 20 20
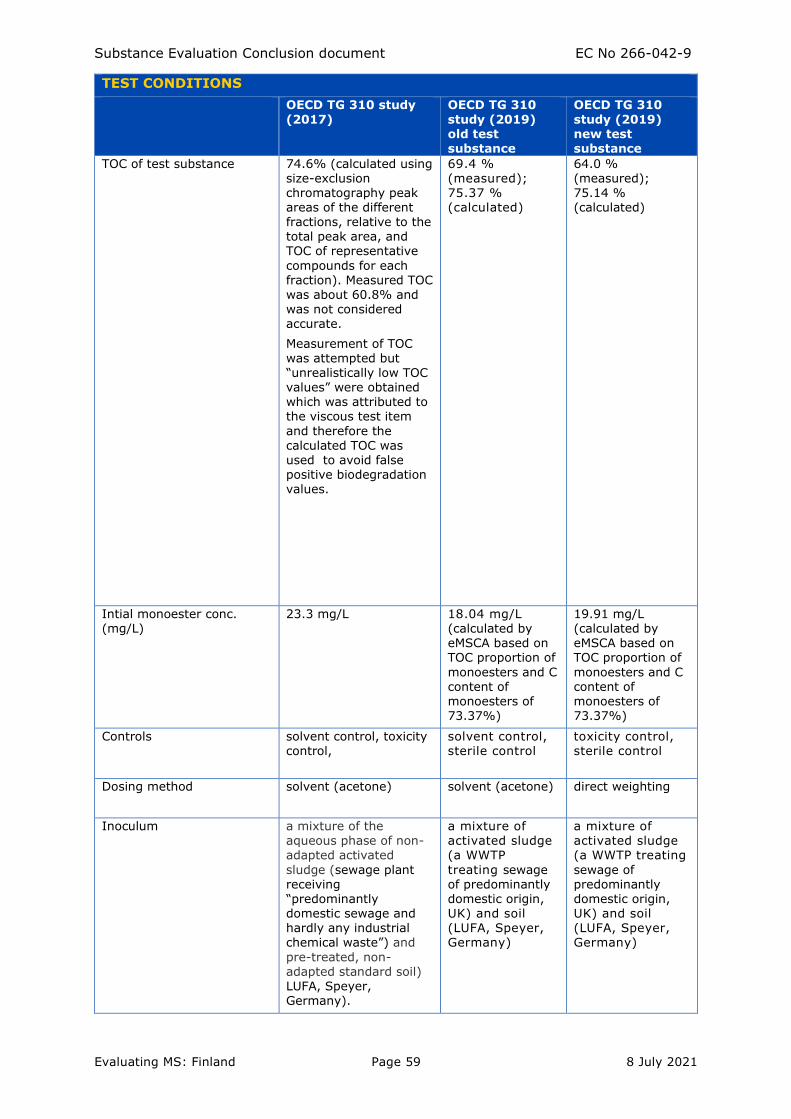
Substance Evaluation Conclusion document EC No 266-042-9
Evaluating MS: Finland Page 59 8 July 2021
TEST CONDITIONS
OECD TG 310 study
(2017)
OECD TG 310
study (2019) old test substance
OECD TG 310
study (2019) new test substance
TOC of test substance 74.6% (calculated using size-exclusion chromatography peak areas of the different fractions, relative to the total peak area, and TOC of representative
compounds for each fraction). Measured TOC was about 60.8% and was not considered accurate.
Measurement of TOC
was attempted but “unrealistically low TOC values” were obtained which was attributed to the viscous test item
and therefore the calculated TOC was used to avoid false positive biodegradation values.
69.4 % (measured); 75.37 % (calculated)
64.0 % (measured); 75.14 % (calculated)
Intial monoester conc. (mg/L)
23.3 mg/L 18.04 mg/L (calculated by eMSCA based on TOC proportion of
monoesters and C content of monoesters of 73.37%)
19.91 mg/L (calculated by eMSCA based on TOC proportion of
monoesters and C content of monoesters of 73.37%)
Controls solvent control, toxicity control,
solvent control, sterile control
toxicity control, sterile control
Dosing method solvent (acetone) solvent (acetone) direct weighting
Inoculum a mixture of the aqueous phase of non-adapted activated
sludge (sewage plant receiving “predominantly domestic sewage and hardly any industrial chemical waste”) and
pre-treated, non-adapted standard soil) LUFA, Speyer, Germany).
a mixture of activated sludge (a WWTP
treating sewage of predominantly domestic origin, UK) and soil (LUFA, Speyer, Germany)
a mixture of activated sludge (a WWTP treating
sewage of predominantly domestic origin, UK) and soil (LUFA, Speyer, Germany)
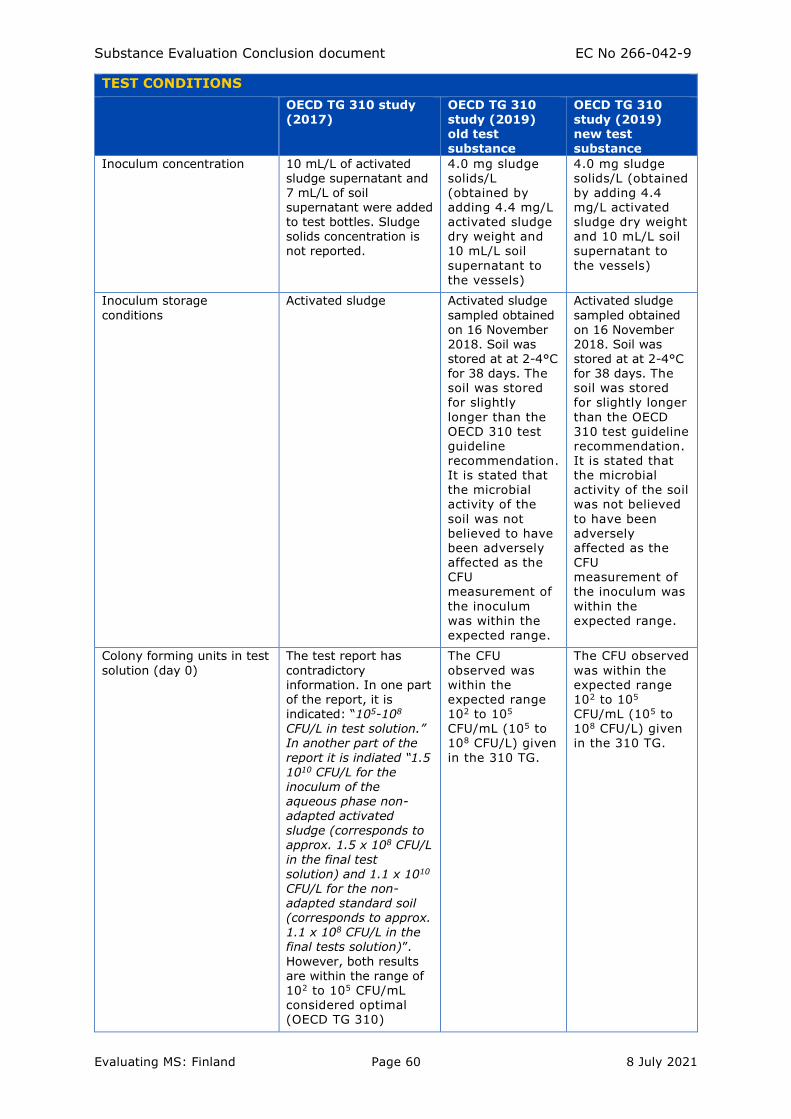
Substance Evaluation Conclusion document EC No 266-042-9
Evaluating MS: Finland Page 60 8 July 2021
TEST CONDITIONS
OECD TG 310 study
(2017)
OECD TG 310
study (2019) old test substance
OECD TG 310
study (2019) new test substance
Inoculum concentration 10 mL/L of activated sludge supernatant and 7 mL/L of soil supernatant were added to test bottles. Sludge solids concentration is not reported.
4.0 mg sludge solids/L (obtained by adding 4.4 mg/L activated sludge dry weight and 10 mL/L soil
supernatant to the vessels)
4.0 mg sludge solids/L (obtained by adding 4.4 mg/L activated sludge dry weight and 10 mL/L soil supernatant to
the vessels)
Inoculum storage
conditions
Activated sludge Activated sludge
sampled obtained on 16 November 2018. Soil was
stored at at 2-4°C for 38 days. The soil was stored for slightly
longer than the OECD 310 test guideline recommendation. It is stated that the microbial activity of the
soil was not believed to have been adversely affected as the CFU
measurement of
the inoculum was within the expected range.
Activated sludge
sampled obtained on 16 November 2018. Soil was
stored at at 2-4°C for 38 days. The soil was stored for slightly longer
than the OECD 310 test guideline recommendation. It is stated that the microbial activity of the soil was not believed
to have been adversely affected as the CFU measurement of
the inoculum was
within the expected range.
Colony forming units in test
solution (day 0)
The test report has
contradictory information. In one part of the report, it is indicated: “105-108 CFU/L in test solution.” In another part of the
report it is indiated “1.5 1010 CFU/L for the inoculum of the aqueous phase non-adapted activated
sludge (corresponds to approx. 1.5 x 10⁸ CFU/L
in the final test solution) and 1.1 x 10¹⁰
CFU/L for the non-adapted standard soil (corresponds to approx. 1.1 x 10⁸ CFU/L in the final tests solution)”.
However, both results are within the range of 102 to 105 CFU/mL considered optimal (OECD TG 310)
The CFU
observed was within the expected range 102 to 105 CFU/mL (105 to 108 CFU/L) given
in the 310 TG.
The CFU observed
was within the expected range 102 to 105 CFU/mL (105 to 108 CFU/L) given in the 310 TG.
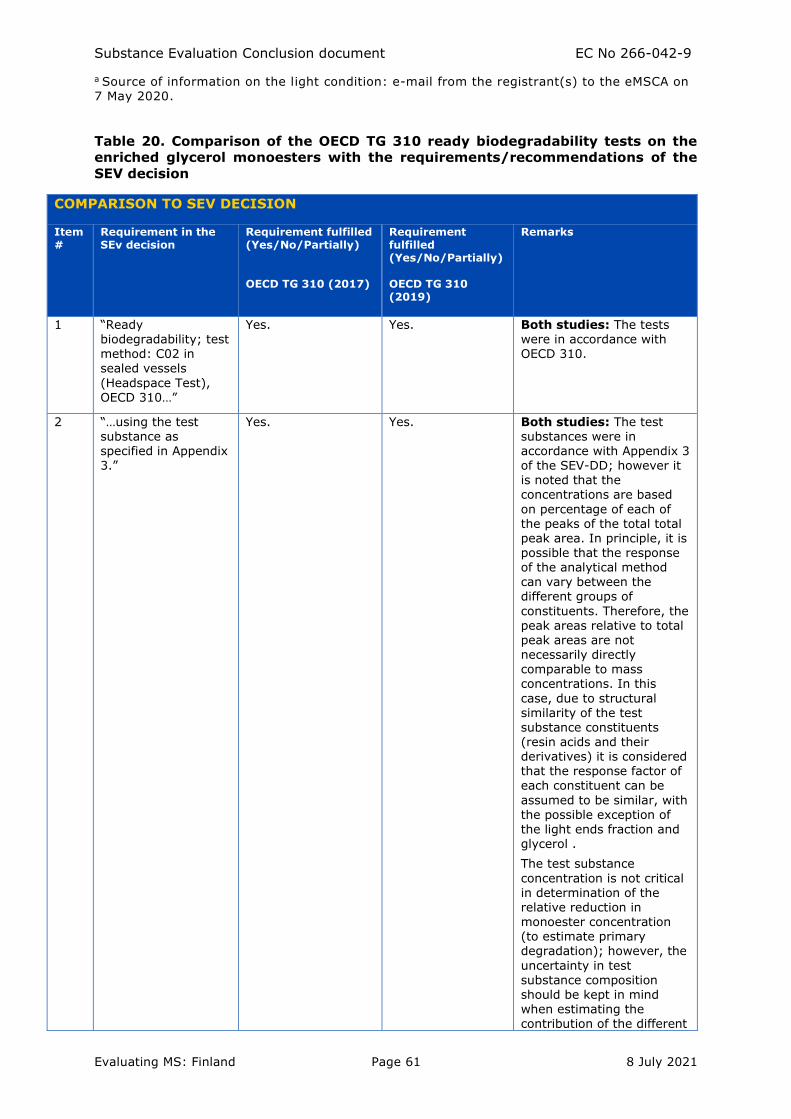
Substance Evaluation Conclusion document EC No 266-042-9
Evaluating MS: Finland Page 61 8 July 2021
a Source of information on the light condition: e-mail from the registrant(s) to the eMSCA on 7 May 2020.
Table 20. Comparison of the OECD TG 310 ready biodegradability tests on the
enriched glycerol monoesters with the requirements/recommendations of the
SEV decision
COMPARISON TO SEV DECISION
Item #
Requirement in the SEv decision
Requirement fulfilled (Yes/No/Partially)
OECD TG 310 (2017)
Requirement fulfilled (Yes/No/Partially)
OECD TG 310 (2019)
Remarks
1 “Ready biodegradability; test
method: C02 in sealed vessels
(Headspace Test), OECD 310…”
Yes. Yes. Both studies: The tests were in accordance with
OECD 310.
2 “…using the test substance as specified in Appendix 3.”
Yes. Yes. Both studies: The test substances were in accordance with Appendix 3 of the SEV-DD; however it is noted that the concentrations are based
on percentage of each of the peaks of the total total peak area. In principle, it is possible that the response of the analytical method can vary between the
different groups of
constituents. Therefore, the peak areas relative to total peak areas are not necessarily directly comparable to mass concentrations. In this
case, due to structural similarity of the test substance constituents (resin acids and their derivatives) it is considered that the response factor of each constituent can be
assumed to be similar, with the possible exception of
the light ends fraction and glycerol .
The test substance
concentration is not critical in determination of the relative reduction in monoester concentration (to estimate primary degradation); however, the
uncertainty in test substance composition should be kept in mind when estimating the contribution of the different
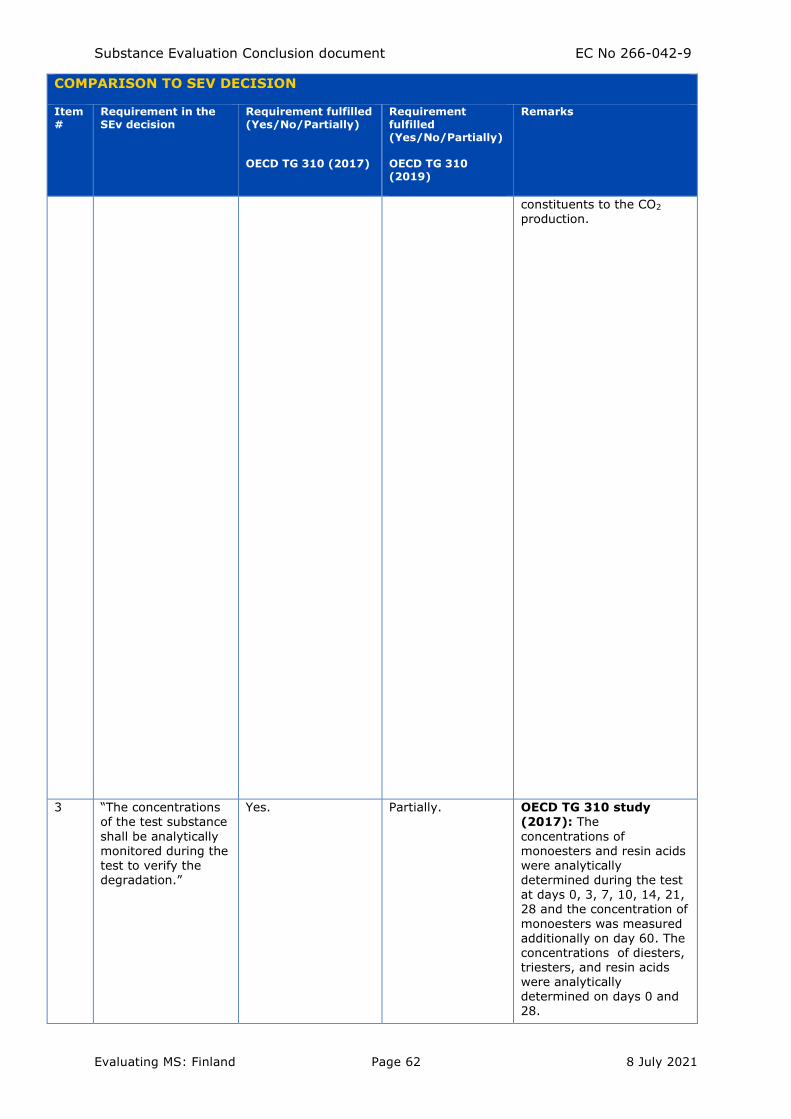
Substance Evaluation Conclusion document EC No 266-042-9
Evaluating MS: Finland Page 62 8 July 2021
COMPARISON TO SEV DECISION
Item #
Requirement in the SEv decision
Requirement fulfilled (Yes/No/Partially)
OECD TG 310 (2017)
Requirement fulfilled (Yes/No/Partially)
OECD TG 310 (2019)
Remarks
constituents to the CO2 production.
3 “The concentrations of the test substance
shall be analytically monitored during the test to verify the degradation.”
Yes. Partially. OECD TG 310 study (2017): The
concentrations of monoesters and resin acids were analytically determined during the test at days 0, 3, 7, 10, 14, 21, 28 and the concentration of
monoesters was measured additionally on day 60. The concentrations of diesters, triesters, and resin acids were analytically determined on days 0 and 28.
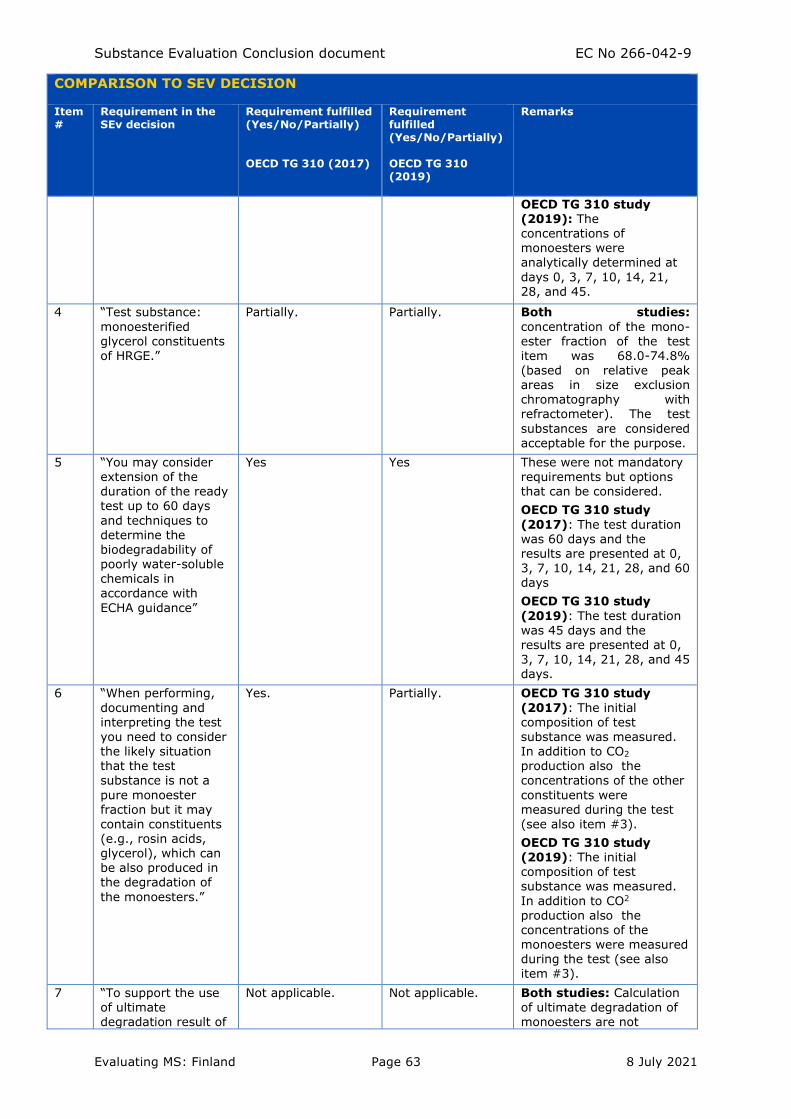
Substance Evaluation Conclusion document EC No 266-042-9
Evaluating MS: Finland Page 63 8 July 2021
COMPARISON TO SEV DECISION
Item #
Requirement in the SEv decision
Requirement fulfilled (Yes/No/Partially)
OECD TG 310 (2017)
Requirement fulfilled (Yes/No/Partially)
OECD TG 310 (2019)
Remarks
OECD TG 310 study (2019): The concentrations of monoesters were analytically determined at
days 0, 3, 7, 10, 14, 21, 28, and 45.
4 “Test substance:
monoesterified glycerol constituents
of HRGE.”
Partially. Partially. Both studies:
concentration of the mono-ester fraction of the test
item was 68.0-74.8% (based on relative peak areas in size exclusion chromatography with refractometer). The test
substances are considered acceptable for the purpose.
5 “You may consider extension of the duration of the ready test up to 60 days
and techniques to determine the biodegradability of poorly water-soluble chemicals in
accordance with
ECHA guidance”
Yes Yes These were not mandatory requirements but options that can be considered.
OECD TG 310 study
(2017): The test duration was 60 days and the results are presented at 0, 3, 7, 10, 14, 21, 28, and 60 days
OECD TG 310 study
(2019): The test duration was 45 days and the results are presented at 0, 3, 7, 10, 14, 21, 28, and 45 days.
6 “When performing,
documenting and interpreting the test you need to consider the likely situation that the test substance is not a
pure monoester fraction but it may
contain constituents (e.g., rosin acids, glycerol), which can be also produced in the degradation of
the monoesters.”
Yes. Partially. OECD TG 310 study
(2017): The initial composition of test substance was measured. In addition to CO2 production also the concentrations of the other
constituents were measured during the test
(see also item #3).
OECD TG 310 study (2019): The initial composition of test substance was measured.
In addition to CO2 production also the concentrations of the monoesters were measured during the test (see also item #3).
7 “To support the use of ultimate degradation result of
Not applicable. Not applicable. Both studies: Calculation of ultimate degradation of monoesters are not
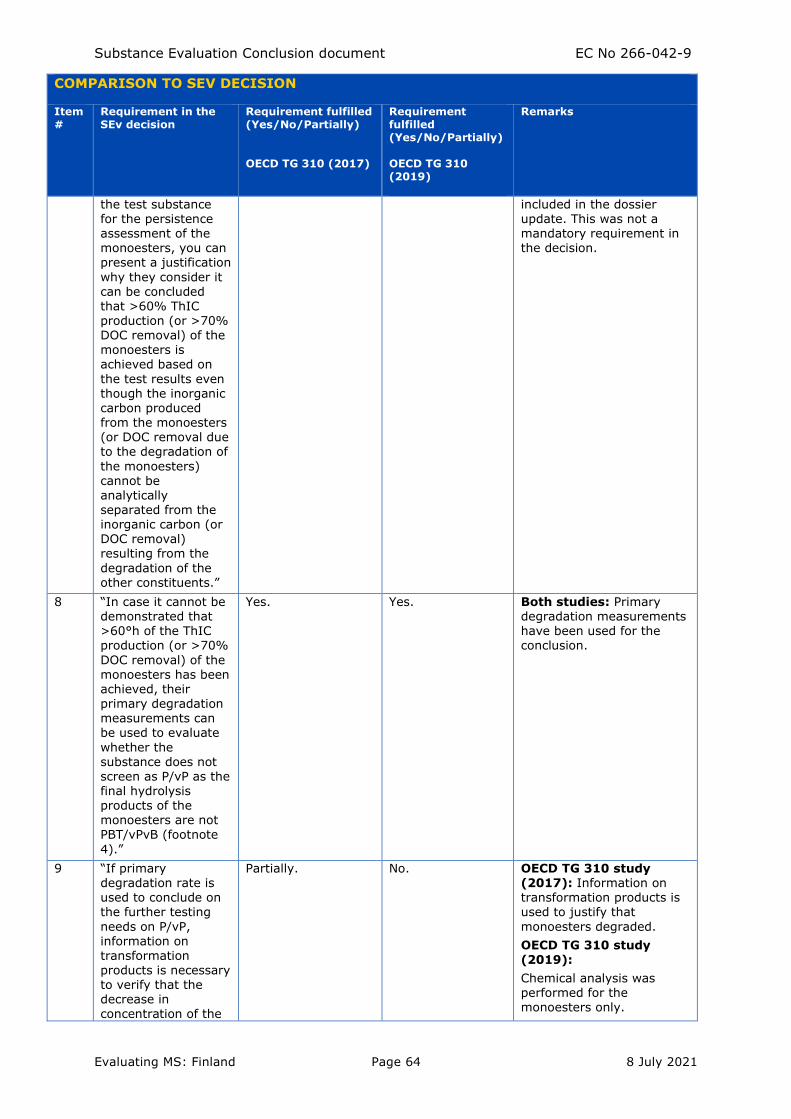
Substance Evaluation Conclusion document EC No 266-042-9
Evaluating MS: Finland Page 64 8 July 2021
COMPARISON TO SEV DECISION
Item #
Requirement in the SEv decision
Requirement fulfilled (Yes/No/Partially)
OECD TG 310 (2017)
Requirement fulfilled (Yes/No/Partially)
OECD TG 310 (2019)
Remarks
the test substance for the persistence assessment of the monoesters, you can present a justification
why they consider it can be concluded that >60% ThIC production (or >70% DOC removal) of the monoesters is
achieved based on
the test results even though the inorganic carbon produced from the monoesters (or DOC removal due to the degradation of
the monoesters) cannot be analytically separated from the inorganic carbon (or DOC removal) resulting from the
degradation of the other constituents.”
included in the dossier update. This was not a mandatory requirement in the decision.
8 “In case it cannot be demonstrated that >60°h of the ThIC production (or >70%
DOC removal) of the monoesters has been achieved, their primary degradation measurements can be used to evaluate
whether the substance does not screen as P/vP as the final hydrolysis products of the monoesters are not
PBT/vPvB (footnote
4).”
Yes. Yes. Both studies: Primary degradation measurements have been used for the conclusion.
9 “If primary degradation rate is used to conclude on the further testing
needs on P/vP, information on transformation products is necessary to verify that the decrease in concentration of the
Partially. No. OECD TG 310 study (2017): Information on transformation products is used to justify that
monoesters degraded.
OECD TG 310 study (2019):
Chemical analysis was performed for the monoesters only.
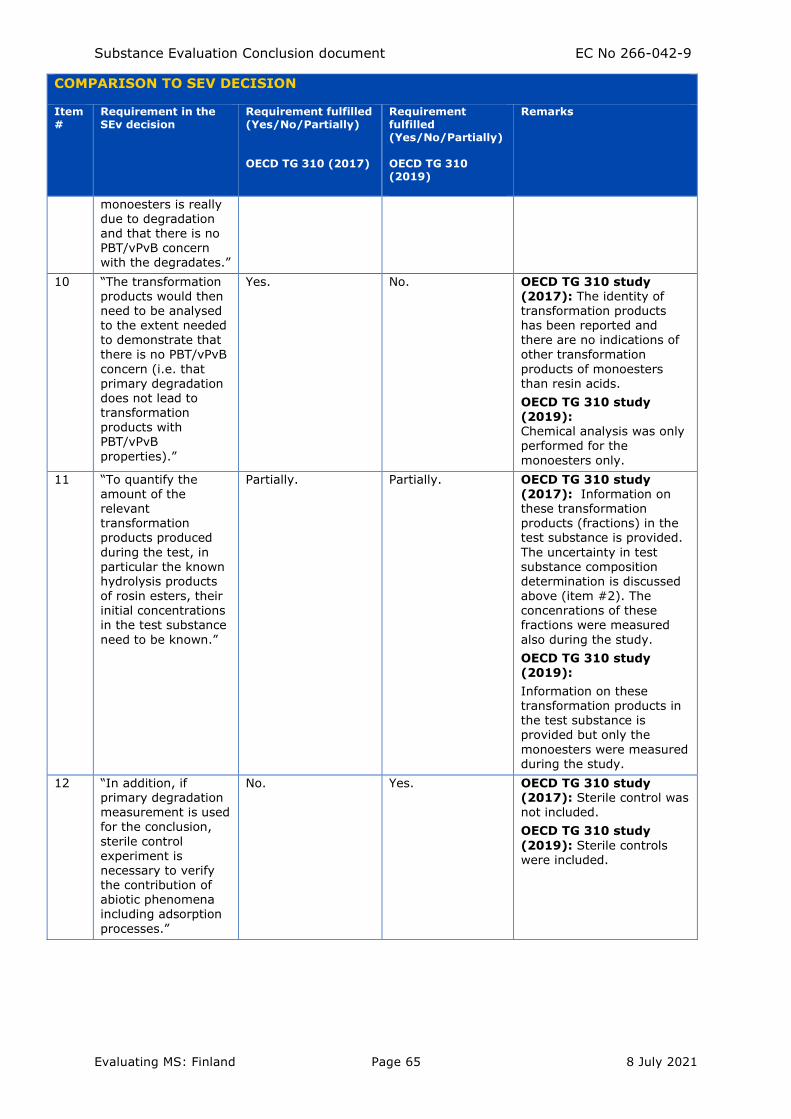
Substance Evaluation Conclusion document EC No 266-042-9
Evaluating MS: Finland Page 65 8 July 2021
COMPARISON TO SEV DECISION
Item #
Requirement in the SEv decision
Requirement fulfilled (Yes/No/Partially)
OECD TG 310 (2017)
Requirement fulfilled (Yes/No/Partially)
OECD TG 310 (2019)
Remarks
monoesters is really due to degradation and that there is no PBT/vPvB concern with the degradates.”
10 “The transformation products would then need to be analysed to the extent needed to demonstrate that
there is no PBT/vPvB
concern (i.e. that primary degradation does not lead to transformation products with PBT/vPvB
properties).”
Yes. No. OECD TG 310 study (2017): The identity of transformation products has been reported and there are no indications of
other transformation
products of monoesters than resin acids.
OECD TG 310 study (2019): Chemical analysis was only performed for the
monoesters only.
11 “To quantify the amount of the relevant transformation products produced
during the test, in particular the known hydrolysis products
of rosin esters, their initial concentrations in the test substance
need to be known.”
Partially. Partially. OECD TG 310 study (2017): Information on these transformation products (fractions) in the test substance is provided.
The uncertainty in test substance composition determination is discussed
above (item #2). The concenrations of these fractions were measured
also during the study.
OECD TG 310 study (2019):
Information on these transformation products in the test substance is provided but only the
monoesters were measured during the study.
12 “In addition, if primary degradation measurement is used
for the conclusion,
sterile control experiment is necessary to verify the contribution of abiotic phenomena including adsorption
processes.”
No. Yes. OECD TG 310 study (2017): Sterile control was not included.
OECD TG 310 study
(2019): Sterile controls were included.
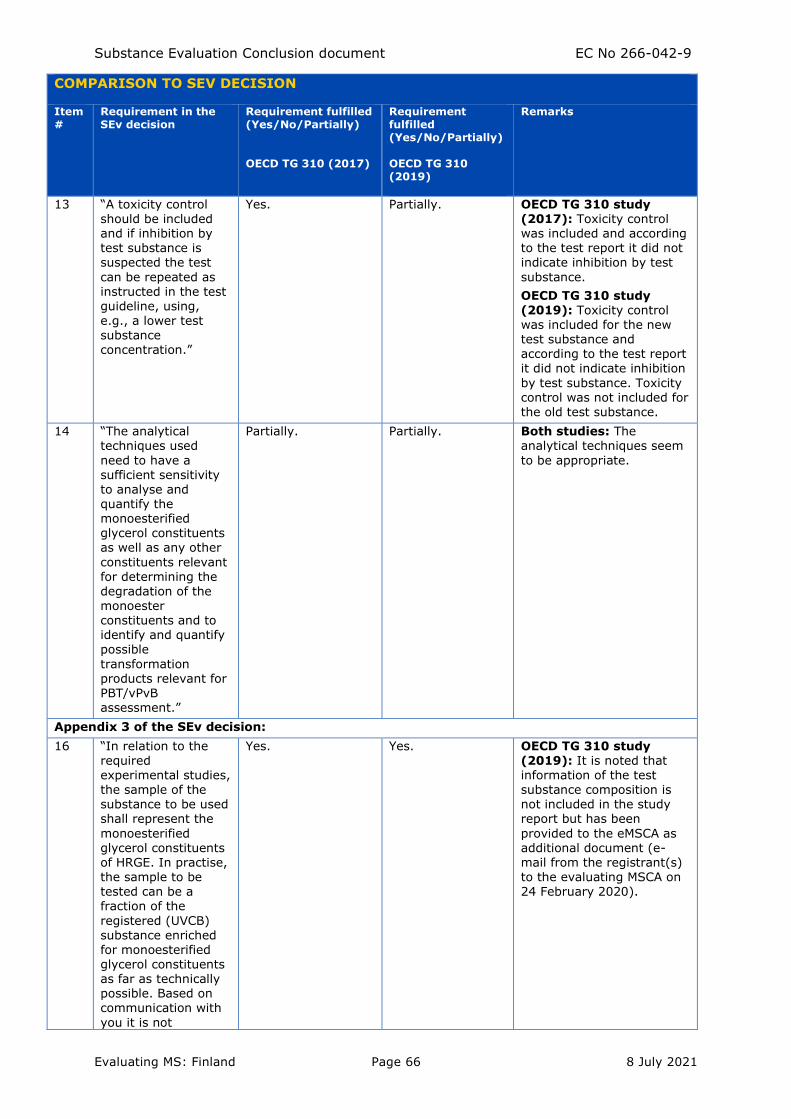
Substance Evaluation Conclusion document EC No 266-042-9
Evaluating MS: Finland Page 66 8 July 2021
COMPARISON TO SEV DECISION
Item #
Requirement in the SEv decision
Requirement fulfilled (Yes/No/Partially)
OECD TG 310 (2017)
Requirement fulfilled (Yes/No/Partially)
OECD TG 310 (2019)
Remarks
13 “A toxicity control should be included and if inhibition by test substance is suspected the test
can be repeated as instructed in the test guideline, using, e.g., a lower test substance concentration.”
Yes. Partially. OECD TG 310 study (2017): Toxicity control was included and according to the test report it did not indicate inhibition by test
substance.
OECD TG 310 study (2019): Toxicity control was included for the new test substance and
according to the test report it did not indicate inhibition
by test substance. Toxicity control was not included for the old test substance.
14 “The analytical techniques used
need to have a sufficient sensitivity to analyse and quantify the monoesterified glycerol constituents as well as any other
constituents relevant for determining the
degradation of the monoester constituents and to identify and quantify possible
transformation products relevant for PBT/vPvB assessment.”
Partially. Partially. Both studies: The analytical techniques seem
to be appropriate.
Appendix 3 of the SEv decision:
16 “In relation to the required experimental studies, the sample of the substance to be used shall represent the
monoesterified glycerol constituents of HRGE. In practise, the sample to be tested can be a fraction of the
registered (UVCB) substance enriched for monoesterified glycerol constituents as far as technically possible. Based on communication with
you it is not
Yes. Yes. OECD TG 310 study (2019): It is noted that information of the test substance composition is not included in the study report but has been
provided to the eMSCA as additional document (e-mail from the registrant(s) to the evaluating MSCA on 24 February 2020).
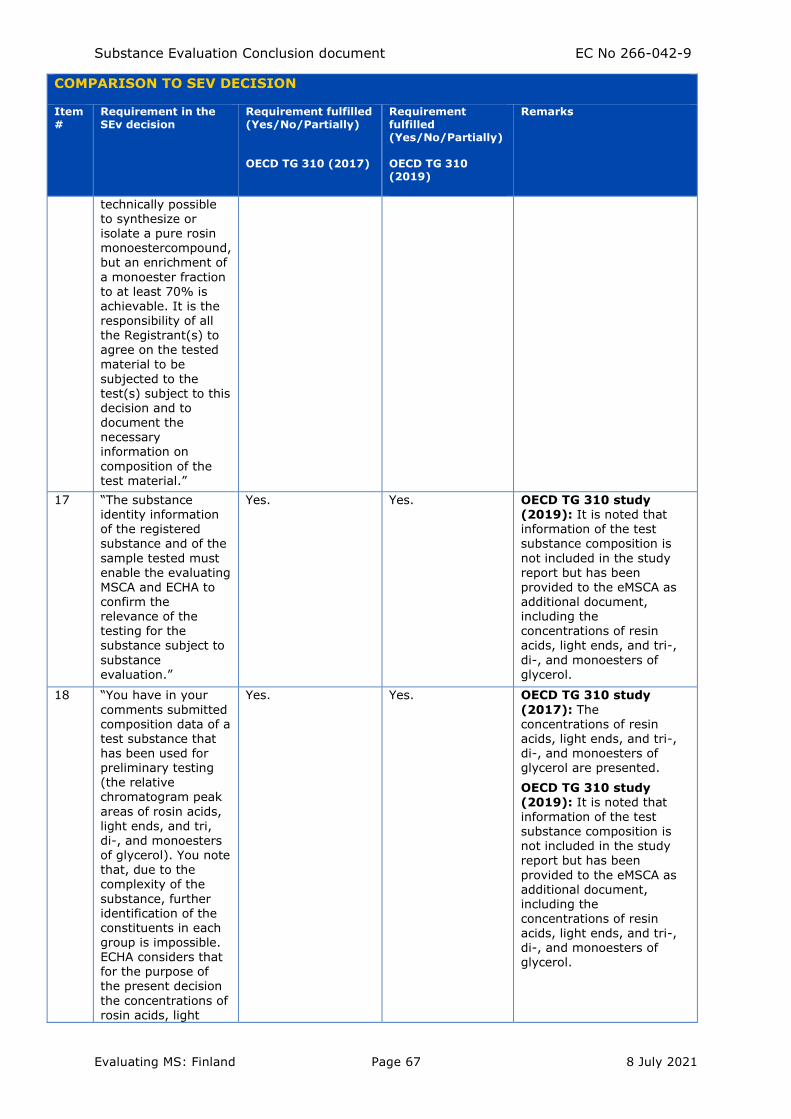
Substance Evaluation Conclusion document EC No 266-042-9
Evaluating MS: Finland Page 67 8 July 2021
COMPARISON TO SEV DECISION
Item #
Requirement in the SEv decision
Requirement fulfilled (Yes/No/Partially)
OECD TG 310 (2017)
Requirement fulfilled (Yes/No/Partially)
OECD TG 310 (2019)
Remarks
technically possible to synthesize or isolate a pure rosin monoestercompound, but an enrichment of
a monoester fraction to at least 70% is achievable. It is the responsibility of all the Registrant(s) to agree on the tested
material to be
subjected to the test(s) subject to this decision and to document the necessary information on
composition of the test material.”
17 “The substance identity information of the registered substance and of the
sample tested must enable the evaluating
MSCA and ECHA to confirm the relevance of the testing for the substance subject to
substance evaluation.”
Yes. Yes.
OECD TG 310 study (2019): It is noted that information of the test substance composition is
not included in the study report but has been
provided to the eMSCA as additional document, including the concentrations of resin acids, light ends, and tri-,
di-, and monoesters of glycerol.
18 “You have in your
comments submitted composition data of a test substance that has been used for preliminary testing (the relative chromatogram peak
areas of rosin acids,
light ends, and tri, di-, and monoesters of glycerol). You note that, due to the complexity of the
substance, further identification of the constituents in each group is impossible. ECHA considers that for the purpose of the present decision
the concentrations of rosin acids, light
Yes. Yes. OECD TG 310 study
(2017): The concentrations of resin acids, light ends, and tri-, di-, and monoesters of glycerol are presented.
OECD TG 310 study (2019): It is noted that information of the test
substance composition is not included in the study report but has been
provided to the eMSCA as additional document, including the concentrations of resin acids, light ends, and tri-, di-, and monoesters of glycerol.
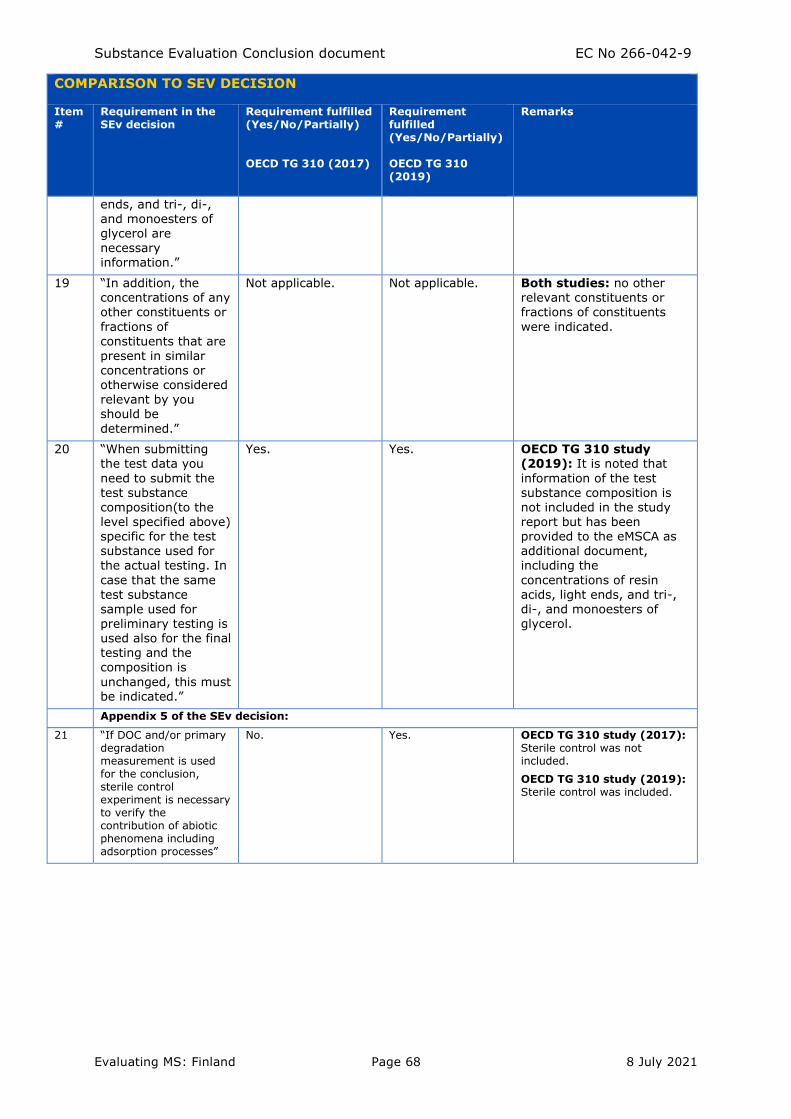
Substance Evaluation Conclusion document EC No 266-042-9
Evaluating MS: Finland Page 68 8 July 2021
COMPARISON TO SEV DECISION
Item #
Requirement in the SEv decision
Requirement fulfilled (Yes/No/Partially)
OECD TG 310 (2017)
Requirement fulfilled (Yes/No/Partially)
OECD TG 310 (2019)
Remarks
ends, and tri-, di-, and monoesters of glycerol are necessary information.”
19 “In addition, the concentrations of any other constituents or
fractions of constituents that are
present in similar concentrations or otherwise considered relevant by you should be
determined.”
Not applicable. Not applicable. Both studies: no other relevant constituents or fractions of constituents
were indicated.
20 “When submitting the test data you
need to submit the test substance composition(to the level specified above) specific for the test substance used for the actual testing. In
case that the same
test substance sample used for preliminary testing is used also for the final testing and the composition is
unchanged, this must be indicated.”
Yes. Yes. OECD TG 310 study (2019): It is noted that
information of the test substance composition is not included in the study report but has been provided to the eMSCA as additional document, including the
concentrations of resin
acids, light ends, and tri-, di-, and monoesters of glycerol.
Appendix 5 of the SEv decision:
21 “If DOC and/or primary degradation measurement is used for the conclusion, sterile control experiment is necessary to verify the contribution of abiotic phenomena including adsorption processes”
No. Yes. OECD TG 310 study (2017): Sterile control was not included.
OECD TG 310 study (2019): Sterile control was included.
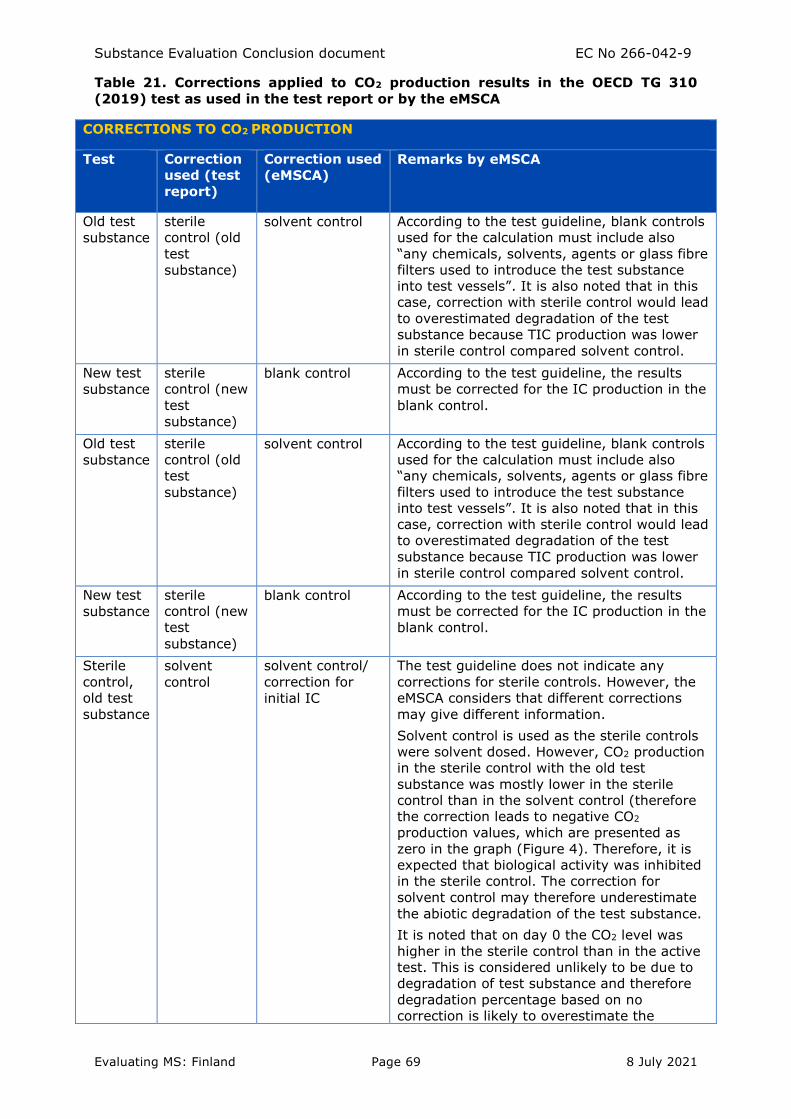
Substance Evaluation Conclusion document EC No 266-042-9
Evaluating MS: Finland Page 69 8 July 2021
Table 21. Corrections applied to CO2 production results in the OECD TG 310
(2019) test as used in the test report or by the eMSCA
CORRECTIONS TO CO2 PRODUCTION
Test Correction
used (test
report)
Correction used
(eMSCA)
Remarks by eMSCA
Old test
substance
sterile
control (old
test
substance)
solvent control According to the test guideline, blank controls
used for the calculation must include also
“any chemicals, solvents, agents or glass fibre
filters used to introduce the test substance
into test vessels”. It is also noted that in this
case, correction with sterile control would lead
to overestimated degradation of the test
substance because TIC production was lower
in sterile control compared solvent control.
New test
substance
sterile
control (new
test
substance)
blank control According to the test guideline, the results
must be corrected for the IC production in the
blank control.
Sterile
control,
old test
substance
solvent
control
solvent control/
correction for
initial IC
The test guideline does not indicate any
corrections for sterile controls. However, the
eMSCA considers that different corrections
may give different information.
Solvent control is used as the sterile controls
were solvent dosed. However, CO2 production
in the sterile control with the old test
substance was mostly lower in the sterile
control than in the solvent control (therefore
the correction leads to negative CO2
production values, which are presented as
zero in the graph (Figure 4). Therefore, it is
expected that biological activity was inhibited
in the sterile control. The correction for
solvent control may therefore underestimate
the abiotic degradation of the test substance.
It is noted that on day 0 the CO2 level was
higher in the sterile control than in the active
test. This is considered unlikely to be due to
degradation of test substance and therefore
degradation percentage based on no
correction is likely to overestimate the
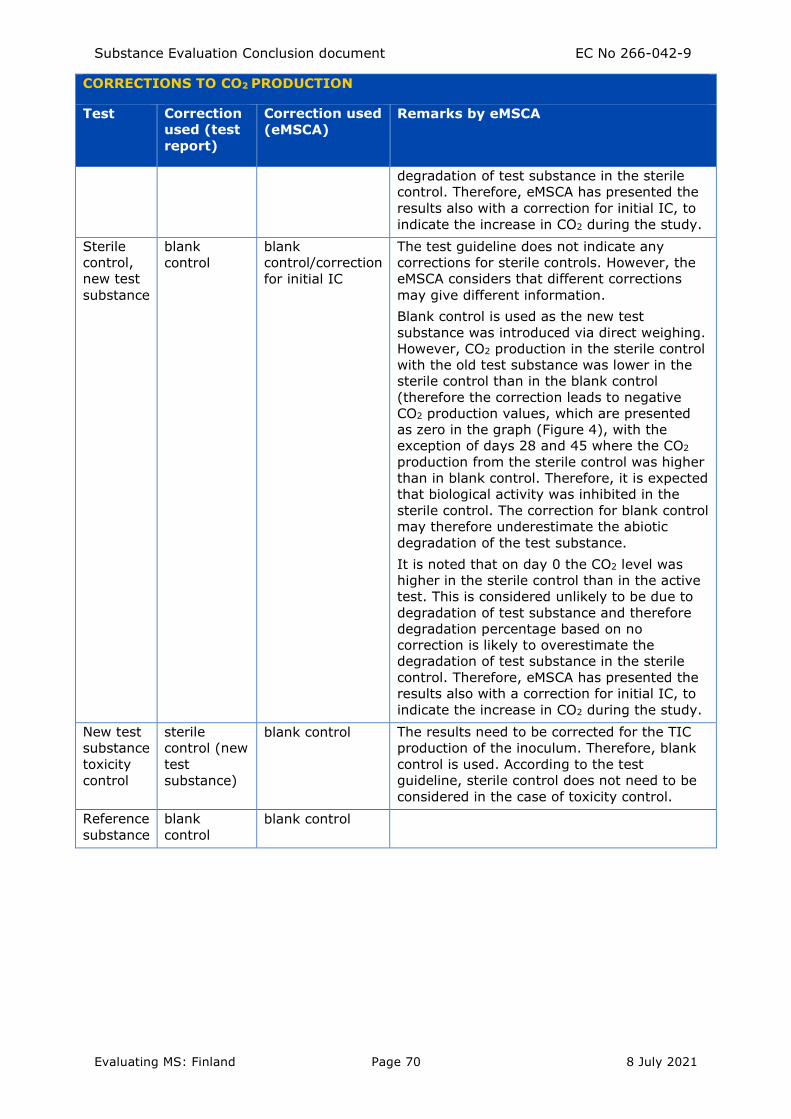
Substance Evaluation Conclusion document EC No 266-042-9
Evaluating MS: Finland Page 70 8 July 2021
CORRECTIONS TO CO2 PRODUCTION
Test Correction
used (test
report)
Correction used
(eMSCA)
Remarks by eMSCA
degradation of test substance in the sterile
control. Therefore, eMSCA has presented the
results also with a correction for initial IC, to
indicate the increase in CO2 during the study.
Sterile
control,
new test
substance
blank
control
blank
control/correction
for initial IC
The test guideline does not indicate any
corrections for sterile controls. However, the
eMSCA considers that different corrections
may give different information.
Blank control is used as the new test
substance was introduced via direct weighing.
However, CO2 production in the sterile control
with the old test substance was lower in the
sterile control than in the blank control
(therefore the correction leads to negative
CO2 production values, which are presented
as zero in the graph (Figure 4), with the
exception of days 28 and 45 where the CO2
production from the sterile control was higher
than in blank control. Therefore, it is expected
that biological activity was inhibited in the
sterile control. The correction for blank control
may therefore underestimate the abiotic
degradation of the test substance.
It is noted that on day 0 the CO2 level was
higher in the sterile control than in the active
test. This is considered unlikely to be due to
degradation of test substance and therefore
degradation percentage based on no
correction is likely to overestimate the
degradation of test substance in the sterile
control. Therefore, eMSCA has presented the
results also with a correction for initial IC, to
indicate the increase in CO2 during the study.
New test
substance
toxicity
control
sterile
control (new
test
substance)
blank control The results need to be corrected for the TIC
production of the inoculum. Therefore, blank
control is used. According to the test
guideline, sterile control does not need to be
considered in the case of toxicity control.
Reference
substance
blank
control
blank control
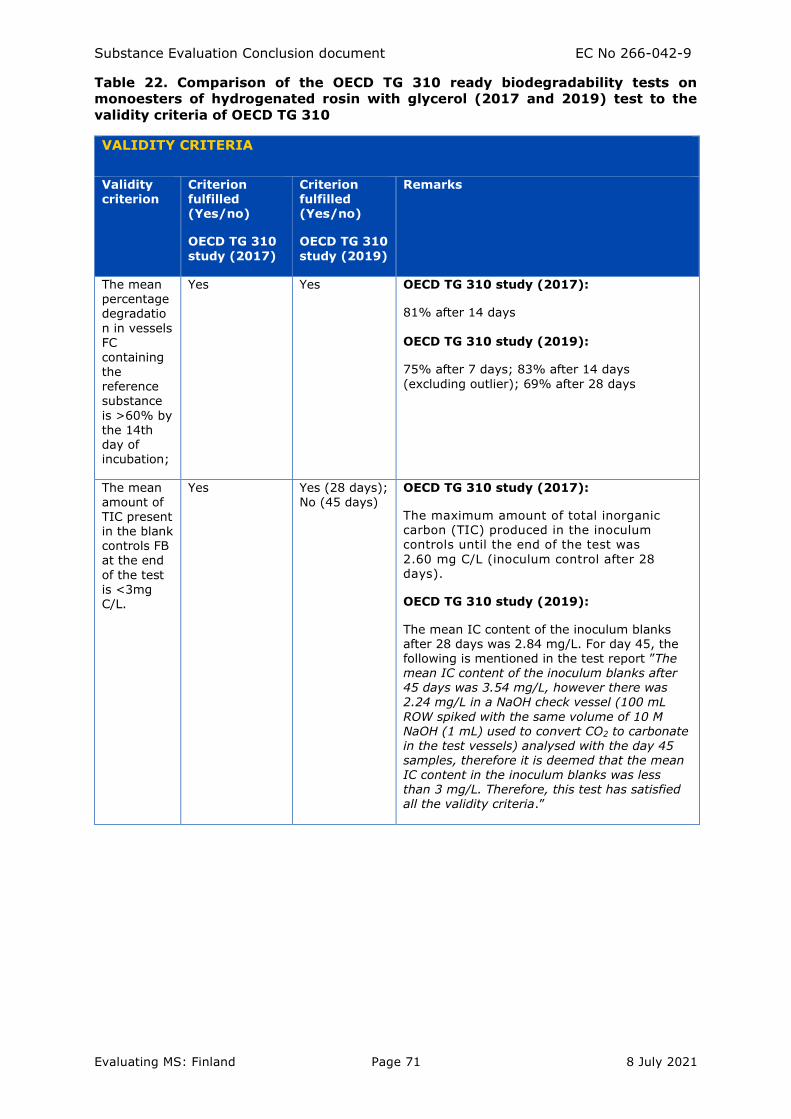
Substance Evaluation Conclusion document EC No 266-042-9
Evaluating MS: Finland Page 71 8 July 2021
Table 22. Comparison of the OECD TG 310 ready biodegradability tests on
monoesters of hydrogenated rosin with glycerol (2017 and 2019) test to the
validity criteria of OECD TG 310
VALIDITY CRITERIA
Validity criterion
Criterion fulfilled (Yes/no)
OECD TG 310
study (2017)
Criterion fulfilled (Yes/no)
OECD TG 310
study (2019)
Remarks
The mean percentage degradatio
n in vessels FC
containing the reference substance
is >60% by the 14th day of incubation;
Yes Yes OECD TG 310 study (2017):
81% after 14 days OECD TG 310 study (2019):
75% after 7 days; 83% after 14 days
(excluding outlier); 69% after 28 days
The mean amount of TIC present in the blank controls FB at the end
of the test
is <3mg C/L.
Yes Yes (28 days); No (45 days)
OECD TG 310 study (2017):
The maximum amount of total inorganic carbon (TIC) produced in the inoculum controls until the end of the test was
2.60 mg C/L (inoculum control after 28 days).
OECD TG 310 study (2019):
The mean IC content of the inoculum blanks after 28 days was 2.84 mg/L. For day 45, the following is mentioned in the test report ”The mean IC content of the inoculum blanks after 45 days was 3.54 mg/L, however there was 2.24 mg/L in a NaOH check vessel (100 mL
ROW spiked with the same volume of 10 M NaOH (1 mL) used to convert CO2 to carbonate in the test vessels) analysed with the day 45 samples, therefore it is deemed that the mean IC content in the inoculum blanks was less than 3 mg/L. Therefore, this test has satisfied all the validity criteria.”
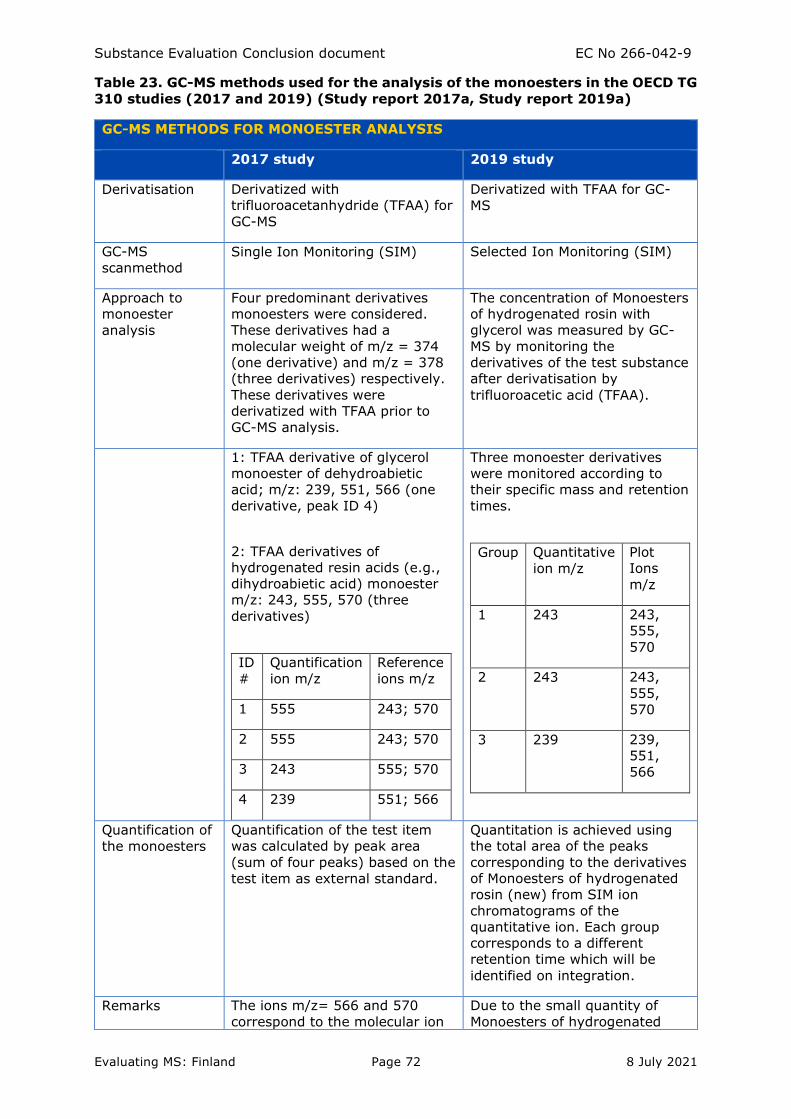
Substance Evaluation Conclusion document EC No 266-042-9
Evaluating MS: Finland Page 72 8 July 2021
Table 23. GC-MS methods used for the analysis of the monoesters in the OECD TG
310 studies (2017 and 2019) (Study report 2017a, Study report 2019a)
GC-MS METHODS FOR MONOESTER ANALYSIS
2017 study 2019 study
Derivatisation Derivatized with
trifluoroacetanhydride (TFAA) for
GC-MS
Derivatized with TFAA for GC-
MS
GC-MS
scanmethod
Single Ion Monitoring (SIM) Selected Ion Monitoring (SIM)
Approach to
monoester
analysis
Four predominant derivatives
monoesters were considered.
These derivatives had a
molecular weight of m/z = 374
(one derivative) and m/z = 378
(three derivatives) respectively.
These derivatives were
derivatized with TFAA prior to
GC-MS analysis.
The concentration of Monoesters
of hydrogenated rosin with
glycerol was measured by GC-
MS by monitoring the
derivatives of the test substance
after derivatisation by
trifluoroacetic acid (TFAA).
1: TFAA derivative of glycerol
monoester of dehydroabietic
acid; m/z: 239, 551, 566 (one
derivative, peak ID 4)
2: TFAA derivatives of
hydrogenated resin acids (e.g.,
dihydroabietic acid) monoester
m/z: 243, 555, 570 (three
derivatives)
ID
#
Quantification
ion m/z
Reference
ions m/z
1 555 243; 570
2 555 243; 570
3 243 555; 570
4 239 551; 566
Three monoester derivatives
were monitored according to
their specific mass and retention
times.
Group Quantitative
ion m/z
Plot
Ions
m/z
1 243 243,
555,
570
2 243 243,
555,
570
3 239 239,
551,
566
Quantification of
the monoesters
Quantification of the test item
was calculated by peak area
(sum of four peaks) based on the
test item as external standard.
Quantitation is achieved using
the total area of the peaks
corresponding to the derivatives
of Monoesters of hydrogenated
rosin (new) from SIM ion
chromatograms of the
quantitative ion. Each group
corresponds to a different
retention time which will be
identified on integration.
Remarks The ions m/z= 566 and 570
correspond to the molecular ion
Due to the small quantity of
Monoesters of hydrogenated
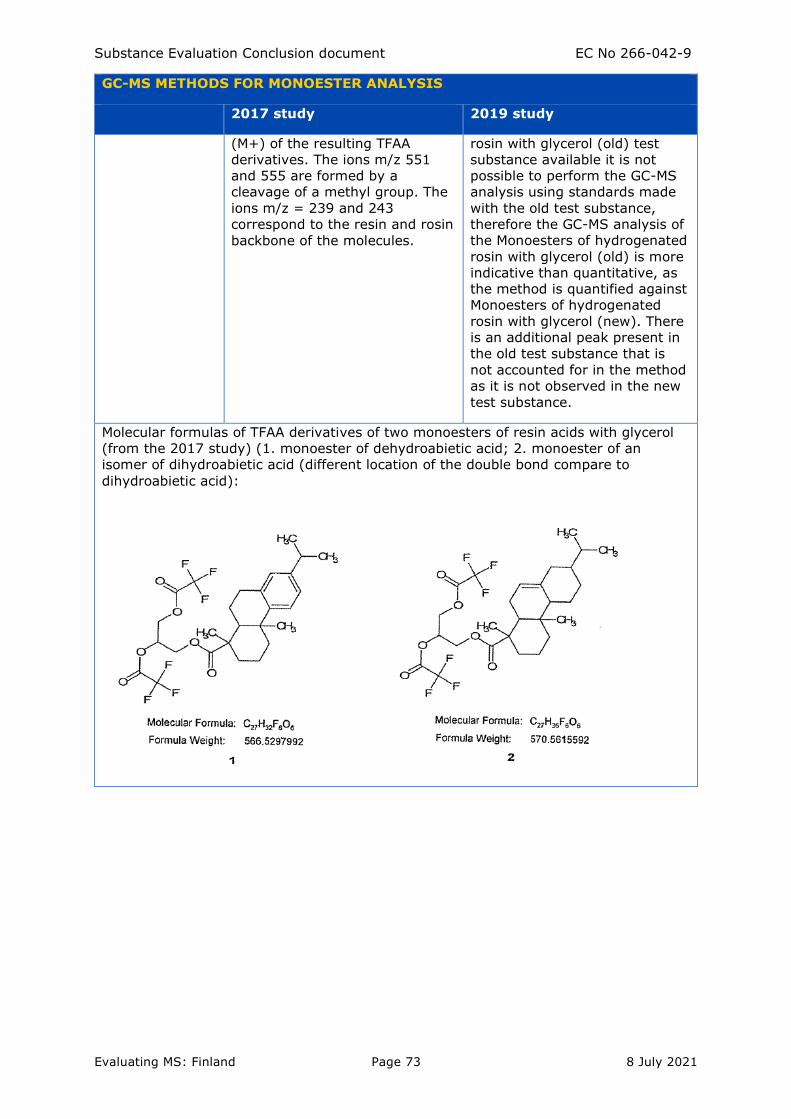
Substance Evaluation Conclusion document EC No 266-042-9
Evaluating MS: Finland Page 73 8 July 2021
GC-MS METHODS FOR MONOESTER ANALYSIS
2017 study 2019 study
(M+) of the resulting TFAA
derivatives. The ions m/z 551
and 555 are formed by a
cleavage of a methyl group. The
ions m/z = 239 and 243
correspond to the resin and rosin
backbone of the molecules.
rosin with glycerol (old) test
substance available it is not
possible to perform the GC-MS
analysis using standards made
with the old test substance,
therefore the GC-MS analysis of
the Monoesters of hydrogenated
rosin with glycerol (old) is more
indicative than quantitative, as
the method is quantified against
Monoesters of hydrogenated
rosin with glycerol (new). There
is an additional peak present in
the old test substance that is
not accounted for in the method
as it is not observed in the new
test substance.
Molecular formulas of TFAA derivatives of two monoesters of resin acids with glycerol
(from the 2017 study) (1. monoester of dehydroabietic acid; 2. monoester of an
isomer of dihydroabietic acid (different location of the double bond compare to
dihydroabietic acid):

Substance Evaluation Conclusion document EC No 266-042-9
Evaluating MS: Finland Page 74 8 July 2021
Table 24. Primary degradation of the monoesters in the OECD TG 310 studies as
calculated based on the monoester concentration measurements (Study report
2017a, Study report 2019a). The values in parentheses are calculated on the
assumptions that complete hydrolysis of di- and triesters occurred by day 28 and
the monoesters formed were not further degraded during the study.
PRIMARY DEGRADATION OF MONOESTERS
Measurement time (d)
2017 studya 2019 study old test substance a
2019 study new test substance a
28 88 (99) 96 (109) 83 (86)
42/45 n.d. 93 (106) 92 (95)
60 94 (105) n.d. n.d.
aThe formation of monoesters was calculated from the proportions of the different fractions
of TOC of test substance, on the basis that 1 mole of monoester was formed per mole of
di- or triester. For the old test substance of the 2019 study as there was only a combined
concentration of di- and triesters, the ratio of C of di- and triesters in the test substance
was assumed to be 1:1. The amount of carbon in the monoesters formed from the di- and
triesters was calculated, and the corrected primary degradation of the monoesters was
then calculated (based on amounts of carbon in each fraction) by subtracting the calculated
amount of formed monoesters from the observed residual amount in the monoesters.
Table 25. Estimated ultimate degradation (% ThIC) of the monoesters based on
different calculation scenarios. (n.d.= not determined)
ULTIMATE DEGRADATION OF MONOESTERS
Monoester degradation (% ThIC)a
Scenariob Measurement time (d)
2017 study
2019 study
old TS
2019 study new TS
Remarks
1 28 34.26 34.47 53.53 May under- or overestimate degradation of monoesters,
depending on the extent of degradation of the monoesters and the other constituents.
1 42/45 36.10 35.44
67.37
1 60 34.57 n.d. n.d.
2 28 49.27 52.07 73.30 Overestimates the degradation of the monoesters, as CO2 is produced also from the other
constituents.
2 42/45 51.91 53.54 92.24
2 60 49.72 n.d. n.d.
3 28 43.77 45.60 59.06 May overestimate the degradation of
monoesters, as it is assumed in this scenario that no CO2 is produced from di- and triesters.
3 42/45 n.d. 46.85 74.76
3 60 44.22 n.d. n.d.
4 28 22.99 21.43 51.15 May underestimate the CO2 production from the monoesters, depending on
4 42/45 25.63 22.89 70.09
4 60 23.43 n.d. n.d.
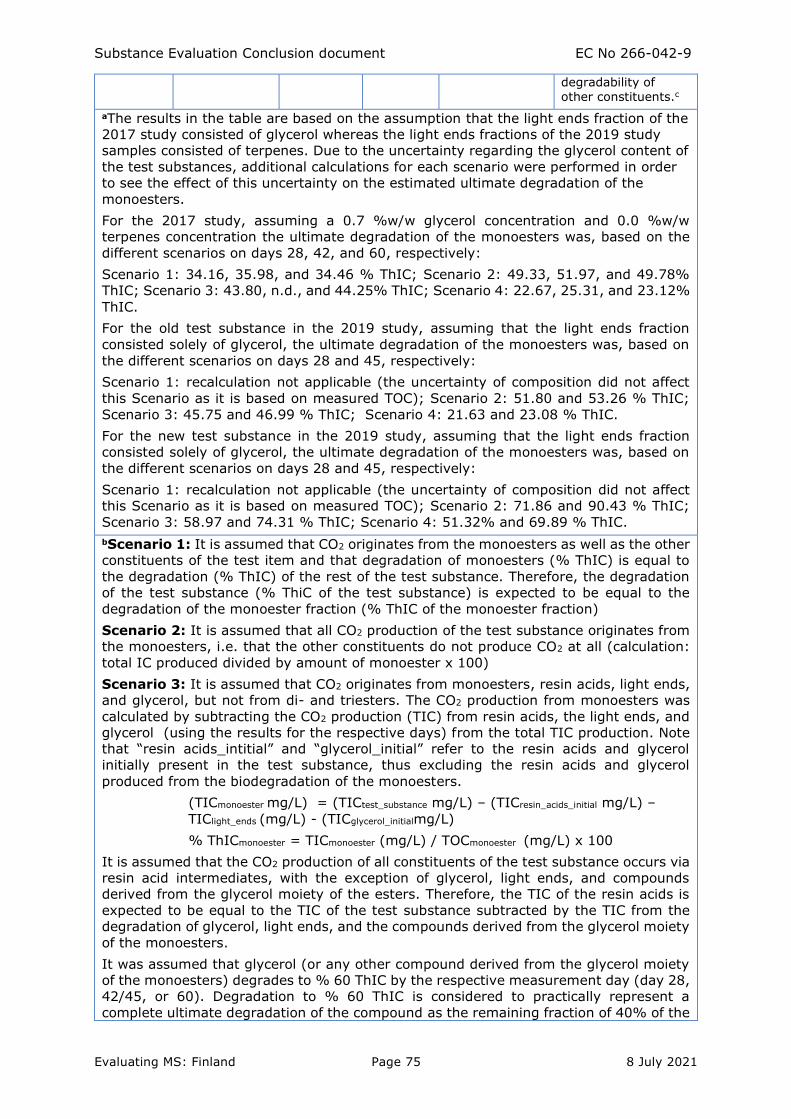
Substance Evaluation Conclusion document EC No 266-042-9
Evaluating MS: Finland Page 75 8 July 2021
degradability of other constituents.c
aThe results in the table are based on the assumption that the light ends fraction of the
2017 study consisted of glycerol whereas the light ends fractions of the 2019 study
samples consisted of terpenes. Due to the uncertainty regarding the glycerol content of
the test substances, additional calculations for each scenario were performed in order
to see the effect of this uncertainty on the estimated ultimate degradation of the
monoesters.
For the 2017 study, assuming a 0.7 %w/w glycerol concentration and 0.0 %w/w
terpenes concentration the ultimate degradation of the monoesters was, based on the
different scenarios on days 28, 42, and 60, respectively:
Scenario 1: 34.16, 35.98, and 34.46 % ThIC; Scenario 2: 49.33, 51.97, and 49.78%
ThIC; Scenario 3: 43.80, n.d., and 44.25% ThIC; Scenario 4: 22.67, 25.31, and 23.12%
ThIC.
For the old test substance in the 2019 study, assuming that the light ends fraction
consisted solely of glycerol, the ultimate degradation of the monoesters was, based on
the different scenarios on days 28 and 45, respectively:
Scenario 1: recalculation not applicable (the uncertainty of composition did not affect
this Scenario as it is based on measured TOC); Scenario 2: 51.80 and 53.26 % ThIC;
Scenario 3: 45.75 and 46.99 % ThIC; Scenario 4: 21.63 and 23.08 % ThIC.
For the new test substance in the 2019 study, assuming that the light ends fraction
consisted solely of glycerol, the ultimate degradation of the monoesters was, based on
the different scenarios on days 28 and 45, respectively:
Scenario 1: recalculation not applicable (the uncertainty of composition did not affect
this Scenario as it is based on measured TOC); Scenario 2: 71.86 and 90.43 % ThIC;
Scenario 3: 58.97 and 74.31 % ThIC; Scenario 4: 51.32% and 69.89 % ThIC.
bScenario 1: It is assumed that CO2 originates from the monoesters as well as the other
constituents of the test item and that degradation of monoesters (% ThIC) is equal to
the degradation (% ThIC) of the rest of the test substance. Therefore, the degradation
of the test substance (% ThiC of the test substance) is expected to be equal to the
degradation of the monoester fraction (% ThIC of the monoester fraction)
Scenario 2: It is assumed that all CO2 production of the test substance originates from
the monoesters, i.e. that the other constituents do not produce CO2 at all (calculation:
total IC produced divided by amount of monoester x 100)
Scenario 3: It is assumed that CO2 originates from monoesters, resin acids, light ends,
and glycerol, but not from di- and triesters. The CO2 production from monoesters was
calculated by subtracting the CO2 production (TIC) from resin acids, the light ends, and
glycerol (using the results for the respective days) from the total TIC production. Note
that “resin acids_intitial” and “glycerol_initial” refer to the resin acids and glycerol
initially present in the test substance, thus excluding the resin acids and glycerol
produced from the biodegradation of the monoesters.
(TICmonoester mg/L) = (TICtest_substance mg/L) – (TICresin_acids_initial mg/L) –
TIClight_ends (mg/L) - (TICglycerol_initialmg/L)
% ThICmonoester = TICmonoester (mg/L) / TOCmonoester (mg/L) x 100
It is assumed that the CO2 production of all constituents of the test substance occurs via
resin acid intermediates, with the exception of glycerol, light ends, and compounds
derived from the glycerol moiety of the esters. Therefore, the TIC of the resin acids is
expected to be equal to the TIC of the test substance subtracted by the TIC from the
degradation of glycerol, light ends, and the compounds derived from the glycerol moiety
of the monoesters.
It was assumed that glycerol (or any other compound derived from the glycerol moiety
of the monoesters) degrades to % 60 ThIC by the respective measurement day (day 28,
42/45, or 60). Degradation to % 60 ThIC is considered to practically represent a
complete ultimate degradation of the compound as the remaining fraction of 40% of the
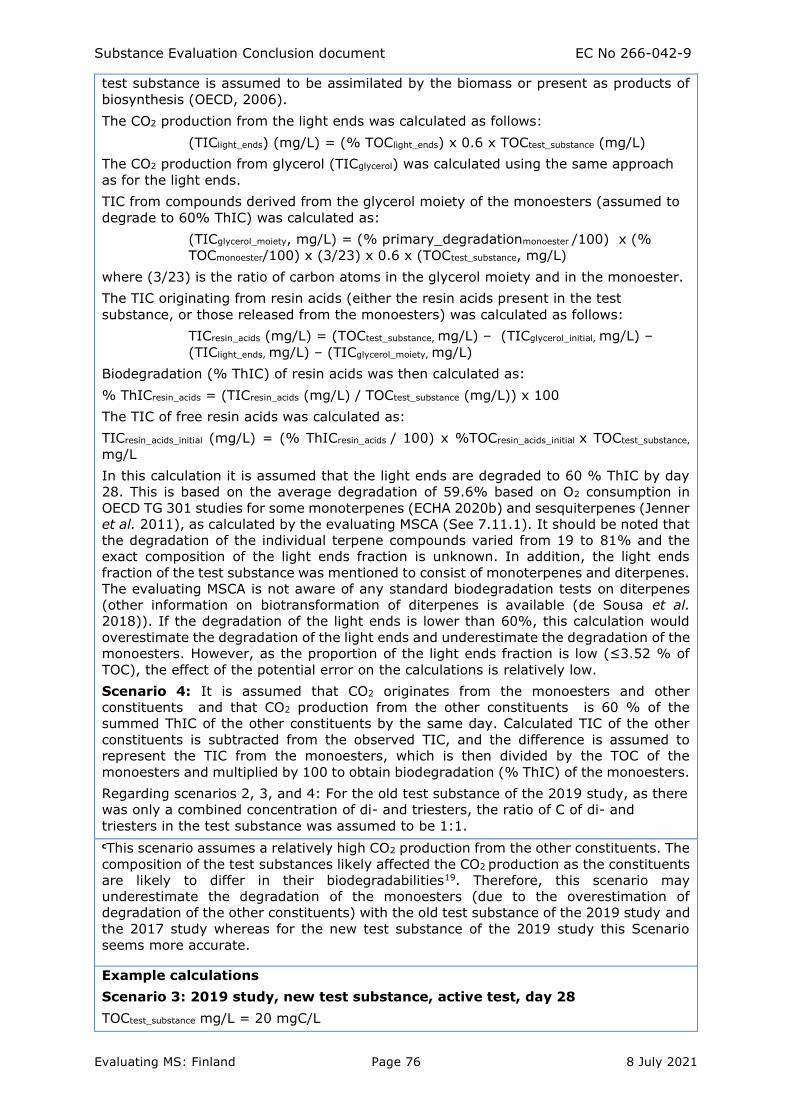
Substance Evaluation Conclusion document EC No 266-042-9
Evaluating MS: Finland Page 76 8 July 2021
test substance is assumed to be assimilated by the biomass or present as products of
biosynthesis (OECD, 2006).
The CO2 production from the light ends was calculated as follows:
(TIClight_ends) (mg/L) = (% TOClight_ends) x 0.6 x TOCtest_substance (mg/L)
The CO2 production from glycerol (TICglycerol) was calculated using the same approach
as for the light ends.
TIC from compounds derived from the glycerol moiety of the monoesters (assumed to
degrade to 60% ThIC) was calculated as:
(TICglycerol_moiety, mg/L) = (% primary_degradationmonoester /100) x (%
TOCmonoester/100) x (3/23) x 0.6 x (TOCtest_substance, mg/L)
where (3/23) is the ratio of carbon atoms in the glycerol moiety and in the monoester.
The TIC originating from resin acids (either the resin acids present in the test
substance, or those released from the monoesters) was calculated as follows:
TICresin_acids (mg/L) = (TOCtest_substance, mg/L) – (TICglycerol_initial, mg/L) –
(TIClight_ends, mg/L) – (TICglycerol_moiety, mg/L)
Biodegradation (% ThIC) of resin acids was then calculated as:
% ThICresin_acids = (TICresin_acids (mg/L) / TOCtest_substance (mg/L)) x 100
The TIC of free resin acids was calculated as:
TICresin_acids_initial (mg/L) = (% ThICresin_acids / 100) x %TOCresin_acids_initial x TOCtest_substance,
mg/L
In this calculation it is assumed that the light ends are degraded to 60 % ThIC by day
28. This is based on the average degradation of 59.6% based on O2 consumption in
OECD TG 301 studies for some monoterpenes (ECHA 2020b) and sesquiterpenes (Jenner
et al. 2011), as calculated by the evaluating MSCA (See 7.11.1). It should be noted that
the degradation of the individual terpene compounds varied from 19 to 81% and the
exact composition of the light ends fraction is unknown. In addition, the light ends
fraction of the test substance was mentioned to consist of monoterpenes and diterpenes.
The evaluating MSCA is not aware of any standard biodegradation tests on diterpenes
(other information on biotransformation of diterpenes is available (de Sousa et al.
2018)). If the degradation of the light ends is lower than 60%, this calculation would
overestimate the degradation of the light ends and underestimate the degradation of the
monoesters. However, as the proportion of the light ends fraction is low (≤3.52 % of
TOC), the effect of the potential error on the calculations is relatively low.
Scenario 4: It is assumed that CO2 originates from the monoesters and other
constituents and that CO2 production from the other constituents is 60 % of the
summed ThIC of the other constituents by the same day. Calculated TIC of the other
constituents is subtracted from the observed TIC, and the difference is assumed to
represent the TIC from the monoesters, which is then divided by the TOC of the
monoesters and multiplied by 100 to obtain biodegradation (% ThIC) of the monoesters.
Regarding scenarios 2, 3, and 4: For the old test substance of the 2019 study, as there
was only a combined concentration of di- and triesters, the ratio of C of di- and
triesters in the test substance was assumed to be 1:1.
cThis scenario assumes a relatively high CO2 production from the other constituents. The
composition of the test substances likely affected the CO2 production as the constituents
are likely to differ in their biodegradabilities19. Therefore, this scenario may
underestimate the degradation of the monoesters (due to the overestimation of
degradation of the other constituents) with the old test substance of the 2019 study and
the 2017 study whereas for the new test substance of the 2019 study this Scenario
seems more accurate.
Example calculations
Scenario 3: 2019 study, new test substance, active test, day 28
TOCtest_substance mg/L = 20 mgC/L
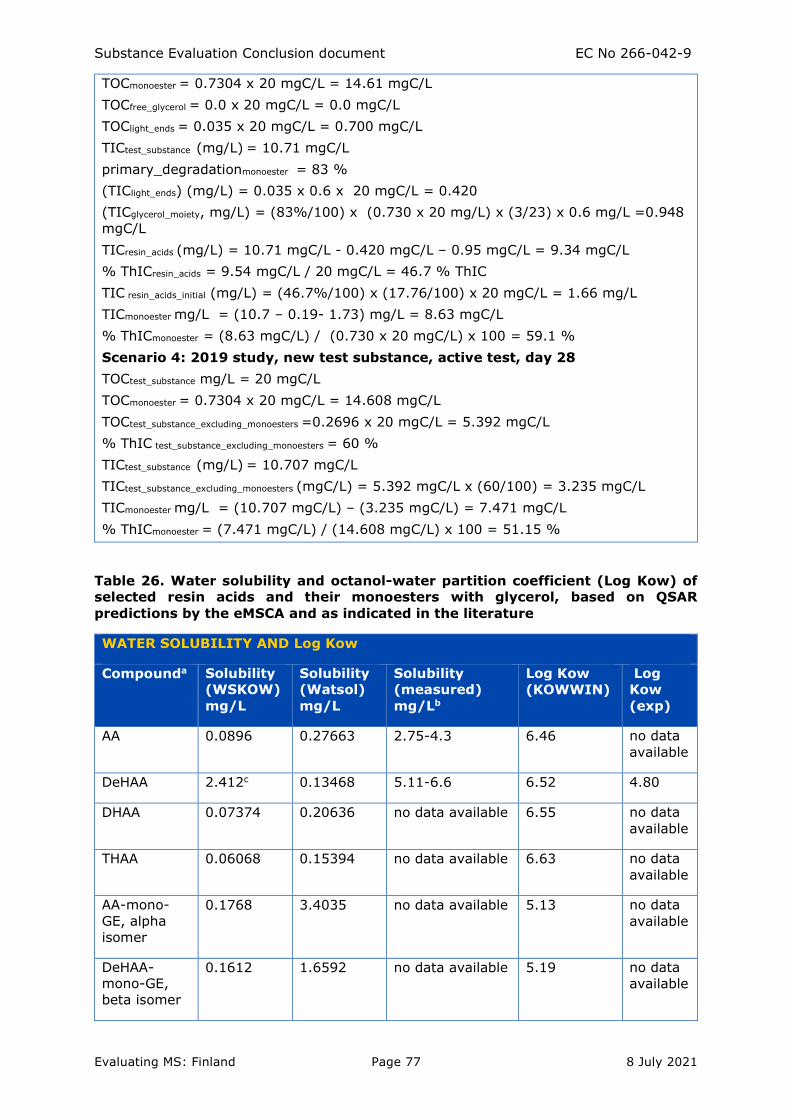
Substance Evaluation Conclusion document EC No 266-042-9
Evaluating MS: Finland Page 77 8 July 2021
TOCmonoester = 0.7304 x 20 mgC/L = 14.61 mgC/L
TOCfree_glycerol = 0.0 x 20 mgC/L = 0.0 mgC/L
TOClight_ends = 0.035 x 20 mgC/L = 0.700 mgC/L
TICtest_substance (mg/L) = 10.71 mgC/L
primary_degradationmonoester = 83 %
(TIClight_ends) (mg/L) = 0.035 x 0.6 x 20 mgC/L = 0.420
(TICglycerol_moiety, mg/L) = (83%/100) x (0.730 x 20 mg/L) x (3/23) x 0.6 mg/L =0.948
mgC/L
TICresin_acids (mg/L) = 10.71 mgC/L - 0.420 mgC/L – 0.95 mgC/L = 9.34 mgC/L
% ThICresin_acids = 9.54 mgC/L / 20 mgC/L = 46.7 % ThIC
TIC resin_acids_initial (mg/L) = (46.7%/100) x (17.76/100) x 20 mgC/L = 1.66 mg/L
TICmonoester mg/L = (10.7 – 0.19- 1.73) mg/L = 8.63 mgC/L
% ThICmonoester = (8.63 mgC/L) / (0.730 x 20 mgC/L) x 100 = 59.1 %
Scenario 4: 2019 study, new test substance, active test, day 28
TOCtest_substance mg/L = 20 mgC/L
TOCmonoester = 0.7304 x 20 mgC/L = 14.608 mgC/L
TOCtest_substance_excluding_monoesters =0.2696 x 20 mgC/L = 5.392 mgC/L
% ThIC test_substance_excluding_monoesters = 60 %
TICtest_substance (mg/L) = 10.707 mgC/L
TICtest_substance_excluding_monoesters (mgC/L) = 5.392 mgC/L x (60/100) = 3.235 mgC/L
TICmonoester mg/L = (10.707 mgC/L) – (3.235 mgC/L) = 7.471 mgC/L
% ThICmonoester = (7.471 mgC/L) / (14.608 mgC/L) x 100 = 51.15 %
Table 26. Water solubility and octanol-water partition coefficient (Log Kow) of
selected resin acids and their monoesters with glycerol, based on QSAR
predictions by the eMSCA and as indicated in the literature
WATER SOLUBILITY AND Log Kow
Compounda Solubility
(WSKOW)
mg/L
Solubility
(Watsol)
mg/L
Solubility
(measured)
mg/Lb
Log Kow
(KOWWIN)
Log
Kow
(exp)
AA 0.0896 0.27663 2.75-4.3 6.46 no data
available
DeHAA 2.412c 0.13468 5.11-6.6 6.52 4.80
DHAA 0.07374 0.20636 no data available 6.55 no data
available
THAA 0.06068 0.15394 no data available 6.63 no data
available
AA-mono-
GE, alpha
isomer
0.1768 3.4035 no data available 5.13 no data
available
DeHAA-
mono-GE,
beta isomer
0.1612 1.6592 no data available 5.19 no data
available
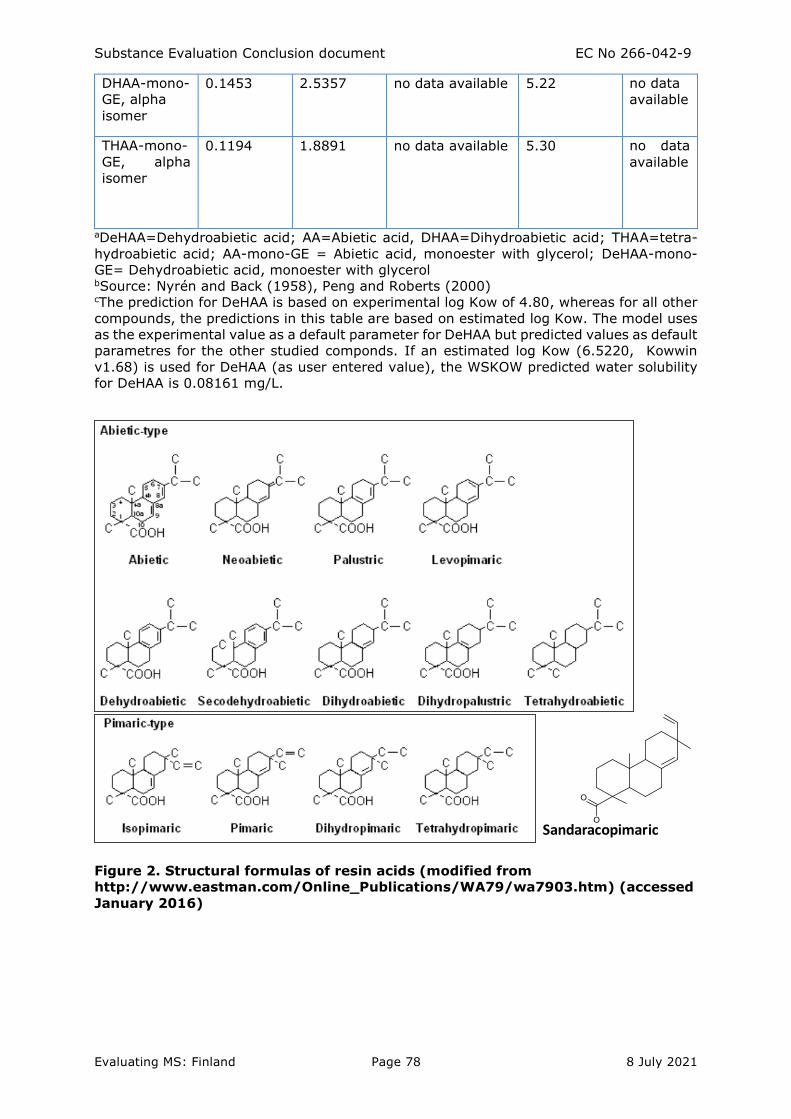
Substance Evaluation Conclusion document EC No 266-042-9
Evaluating MS: Finland Page 78 8 July 2021
DHAA-mono-
GE, alpha
isomer
0.1453 2.5357 no data available 5.22 no data
available
THAA-mono-
GE, alpha
isomer
0.1194 1.8891 no data available 5.30 no data
available
aDeHAA=Dehydroabietic acid; AA=Abietic acid, DHAA=Dihydroabietic acid; THAA=tetra-
hydroabietic acid; AA-mono-GE = Abietic acid, monoester with glycerol; DeHAA-mono-
GE= Dehydroabietic acid, monoester with glycerol bSource: Nyrén and Back (1958), Peng and Roberts (2000) cThe prediction for DeHAA is based on experimental log Kow of 4.80, whereas for all other
compounds, the predictions in this table are based on estimated log Kow. The model uses
as the experimental value as a default parameter for DeHAA but predicted values as default
parametres for the other studied componds. If an estimated log Kow (6.5220, Kowwin
v1.68) is used for DeHAA (as user entered value), the WSKOW predicted water solubility
for DeHAA is 0.08161 mg/L.
Figure 2. Structural formulas of resin acids (modified from
http://www.eastman.com/Online_Publications/WA79/wa7903.htm) (accessed
January 2016)
Sandaracopimaric
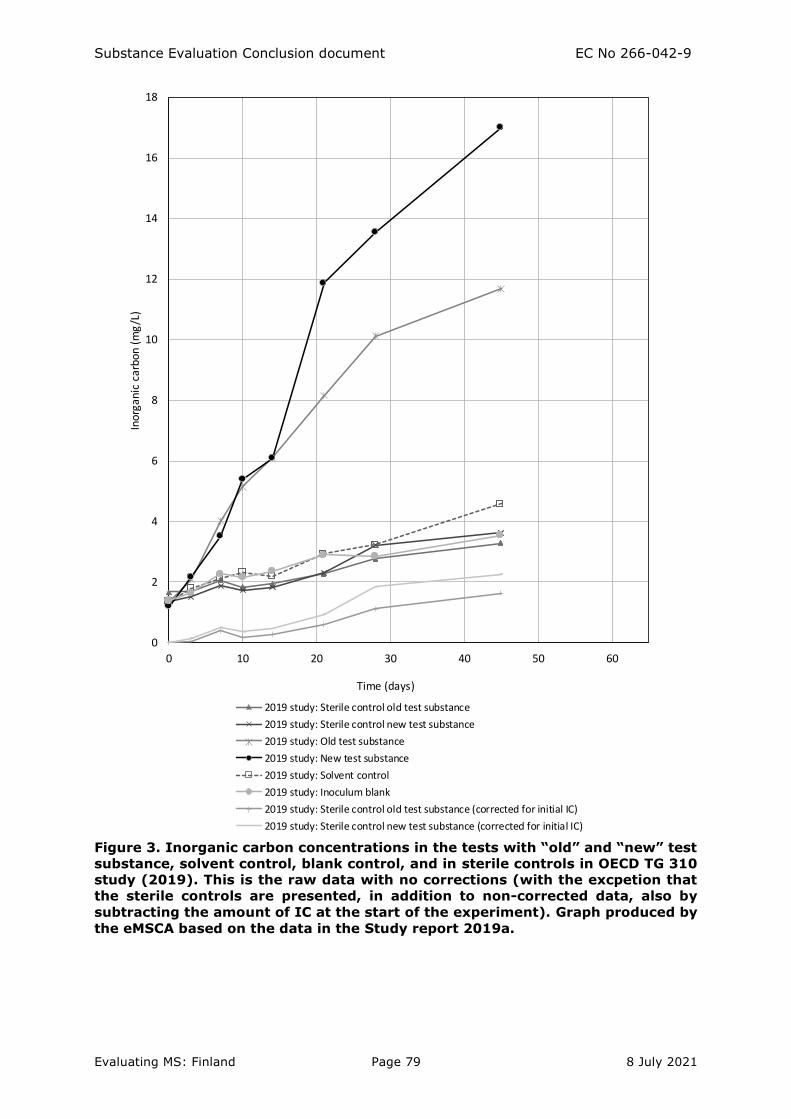
Substance Evaluation Conclusion document EC No 266-042-9
Evaluating MS: Finland Page 79 8 July 2021
Figure 3. Inorganic carbon concentrations in the tests with “old” and “new” test
substance, solvent control, blank control, and in sterile controls in OECD TG 310
study (2019). This is the raw data with no corrections (with the excpetion that
the sterile controls are presented, in addition to non-corrected data, also by
subtracting the amount of IC at the start of the experiment). Graph produced by
the eMSCA based on the data in the Study report 2019a.
2017 study: Monoester conc.
2017 study: % ThIC
2019 study: Old test substance, monoester conc.
2019 study: Old test substance, % ThIC
2019 study: New test substance, monoester conc.
2019 study: New test substance, % ThIC
0
2
4
6
8
10
12
14
16
18
0 10 20 30 40 50 60
Inor
gani
c ca
rbon
(m
g/L
)
Time (days)
2019 study: Sterile control old test substance
2019 study: Sterile control new test substance
2019 study: Old test substance
2019 study: New test substance
2019 study: Solvent control
2019 study: Inoculum blank
2019 study: Sterile control old test substance (corrected for initial IC)
2019 study: Sterile control new test substance (corrected for initial IC)
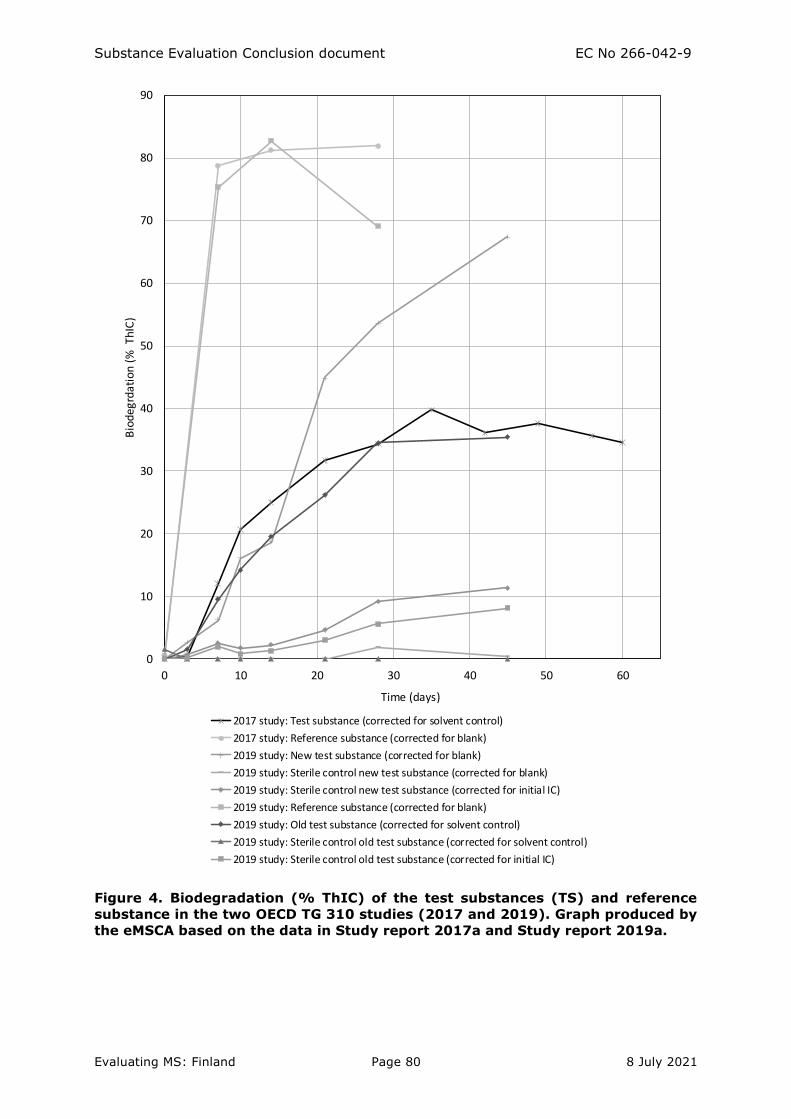
Substance Evaluation Conclusion document EC No 266-042-9
Evaluating MS: Finland Page 80 8 July 2021
Figure 4. Biodegradation (% ThIC) of the test substances (TS) and reference
substance in the two OECD TG 310 studies (2017 and 2019). Graph produced by
the eMSCA based on the data in Study report 2017a and Study report 2019a.
0
10
20
30
40
50
60
70
80
90
0 10 20 30 40 50 60
Bio
de
grd
ati
on
(%
T
hIC
)
Time (days)
2017 study: Test substance (corrected for solvent control)
2017 study: Reference substance (corrected for blank)
2019 study: New test substance (corrected for blank)
2019 study: Sterile control new test substance (corrected for blank)
2019 study: Sterile control new test substance (corrected for initial IC)
2019 study: Reference substance (corrected for blank)
2019 study: Old test substance (corrected for solvent control)
2019 study: Sterile control old test substance (corrected for solvent control)
2019 study: Sterile control old test substance (corrected for initial IC)

Substance Evaluation Conclusion document EC No 266-042-9
Evaluating MS: Finland Page 81 8 July 2021
Figure 5. Concentration of the monoesters of hydrogenated rosin with glycerol
in OECD TG 310 studies (2017 and 2019) in the active tests. Graph produced by
the eMSCA based on the data in Study report 2017a and Study report 2019a.
2017 study: Monoester conc.
2017 study: % ThIC
2019 study: Old test substance, monoester conc.
2019 study: Old test substance, % ThIC
0
20
40
60
80
100
120
0 10 20 30 40 50 60
Mon
oest
er c
onc.
(%
of
init
ial)
Time (days)
2019 study: Old test substance
2019 study: New test substance
2017 study
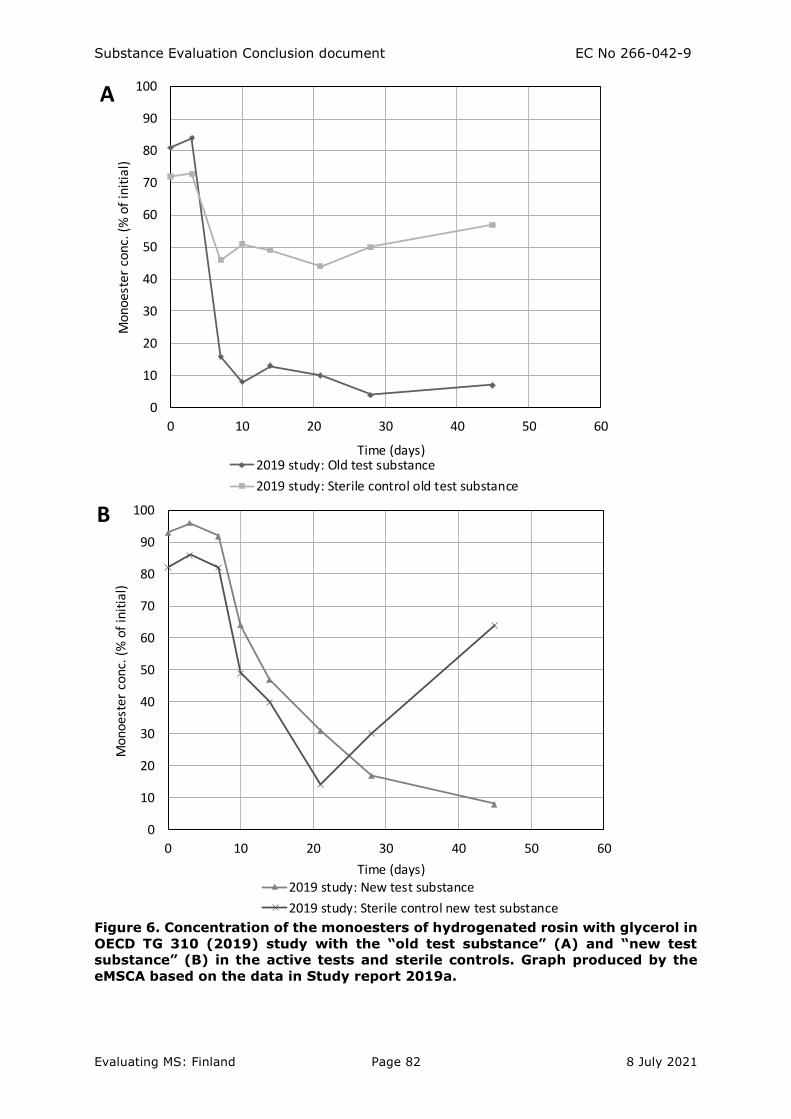
Substance Evaluation Conclusion document EC No 266-042-9
Evaluating MS: Finland Page 82 8 July 2021
Figure 6. Concentration of the monoesters of hydrogenated rosin with glycerol in
OECD TG 310 (2019) study with the “old test substance” (A) and “new test
substance” (B) in the active tests and sterile controls. Graph produced by the
eMSCA based on the data in Study report 2019a.
2017 study: Monoester conc.
2017 study: % ThIC
2019 study: Old test substance, monoester conc.
2019 study: Old test substance, % ThIC
2019 study: New test substance, monoester conc.
2019 study: New test substance, % ThIC
0
10
20
30
40
50
60
70
80
90
100
0 10 20 30 40 50 60
Mo
no
est
er
con
c. (
% o
f in
itia
l)
Time (days)2019 study: Old test substance
2019 study: Sterile control old test substance
A
0
10
20
30
40
50
60
70
80
90
100
0 10 20 30 40 50 60
Mon
oest
er c
onc.
(%
of
init
ial)
Time (days)2019 study: New test substance
2019 study: Sterile control new test substance
B
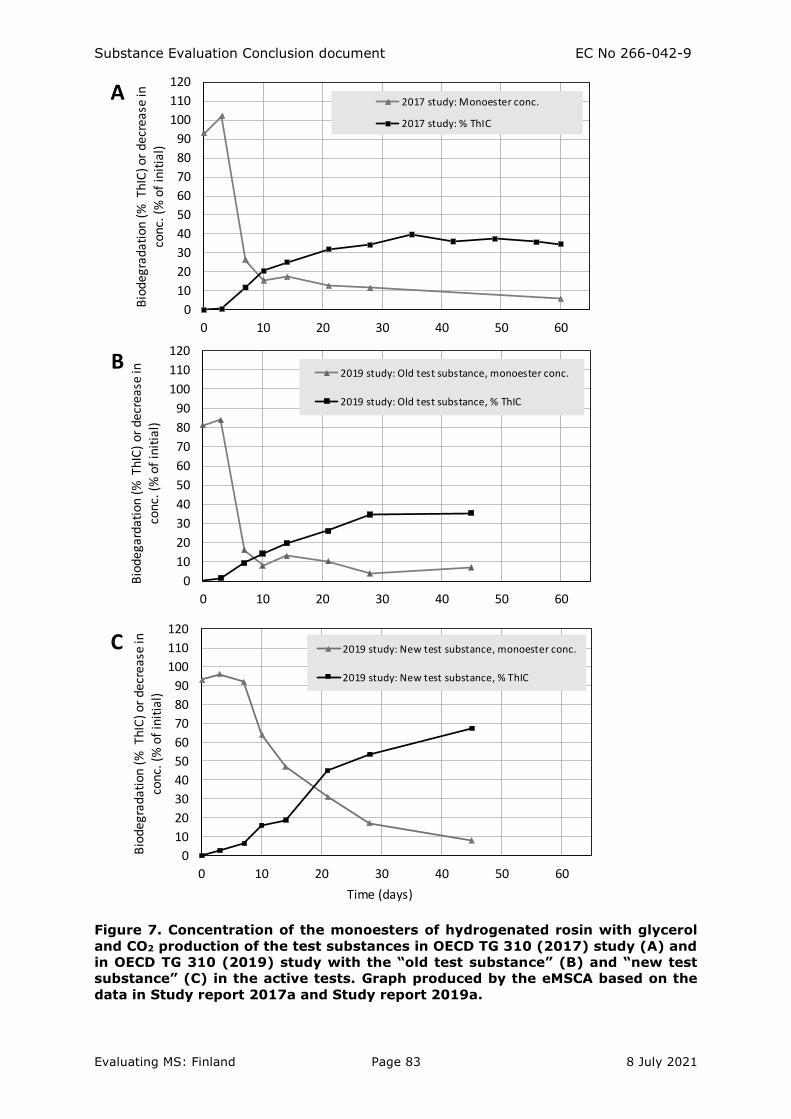
Substance Evaluation Conclusion document EC No 266-042-9
Evaluating MS: Finland Page 83 8 July 2021
Figure 7. Concentration of the monoesters of hydrogenated rosin with glycerol
and CO2 production of the test substances in OECD TG 310 (2017) study (A) and
in OECD TG 310 (2019) study with the “old test substance” (B) and “new test
substance” (C) in the active tests. Graph produced by the eMSCA based on the
data in Study report 2017a and Study report 2019a.
2017 study: Monoester conc.
2017 study: % ThIC
2019 study: Old test substance, monoester conc.
2019 study: Old test substance, % ThIC
2019 study: New test substance, monoester conc.
2019 study: New test substance, % ThIC
0
10
20
30
40
50
60
70
80
90
100
110
120
0 10 20 30 40 50 60
Bio
deg
rad
atio
n (
% T
hIC
) or
dec
rea
se in
con
c. (
% o
f in
itia
l)
2017 study: Monoester conc.
2017 study: % ThIC
A
0
10
20
30
40
50
60
70
80
90
100
110
120
0 10 20 30 40 50 60
Bio
dega
rdat
ion
(% T
hIC
) or
dec
reas
e in
co
nc.
(%
of
init
ial)
2019 study: Old test substance, monoester conc.
2019 study: Old test substance, % ThIC
B
0
10
20
30
40
50
60
70
80
90
100
110
120
0 10 20 30 40 50 60
Bio
de
gra
da
tio
n (
% T
hIC
) or
de
cre
ase
in
con
c. (
% o
f in
itia
l)
Time (days)
2019 study: New test substance, monoester conc.
2019 study: New test substance, % ThIC
C
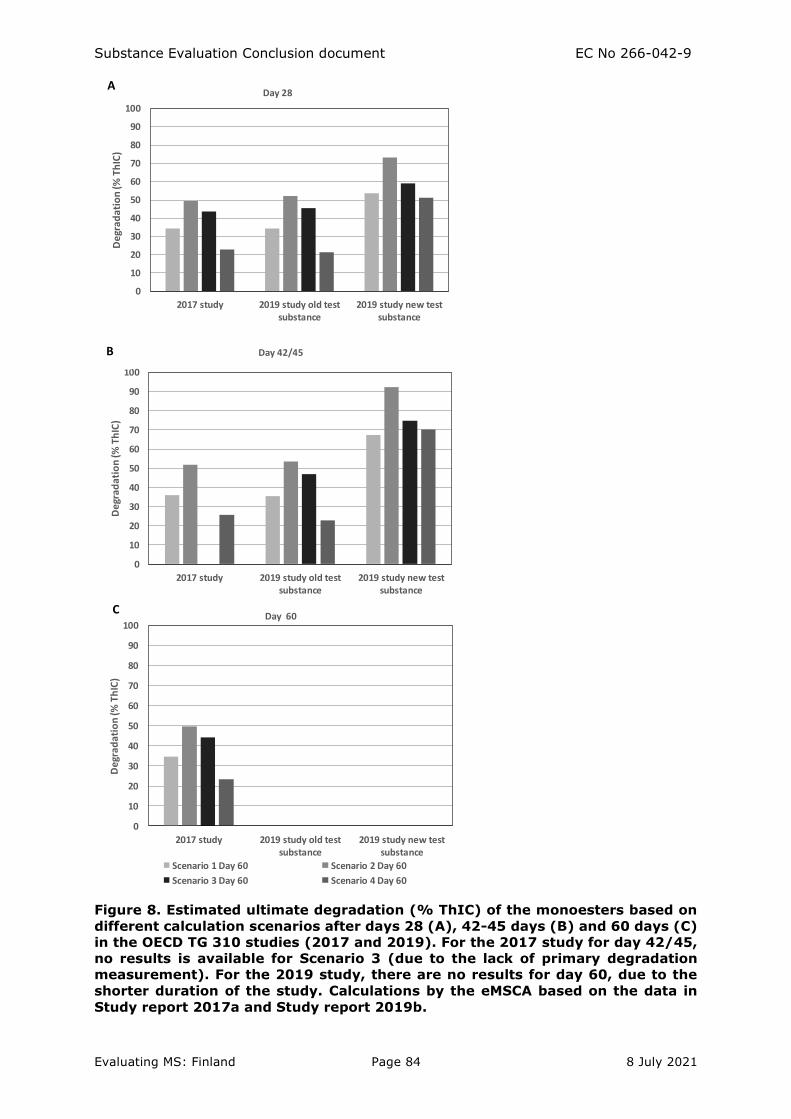
Substance Evaluation Conclusion document EC No 266-042-9
Evaluating MS: Finland Page 84 8 July 2021
Figure 8. Estimated ultimate degradation (% ThIC) of the monoesters based on
different calculation scenarios after days 28 (A), 42-45 days (B) and 60 days (C)
in the OECD TG 310 studies (2017 and 2019). For the 2017 study for day 42/45,
no results is available for Scenario 3 (due to the lack of primary degradation
measurement). For the 2019 study, there are no results for day 60, due to the
shorter duration of the study. Calculations by the eMSCA based on the data in
Study report 2017a and Study report 2019b.
0
10
20
30
40
50
60
70
80
90
100
2017 study 2019 study old testsubstance
2019 study new testsubstance
De
gra
da
tio
n (%
Th
IC)
Day 28 A
0
10
20
30
40
50
60
70
80
90
100
2017 study 2019 study old testsubstance
2019 study new testsubstance
Deg
rad
atio
n (%
Th
IC)
Day 42/45B
0
10
20
30
40
50
60
70
80
90
100
2017 study 2019 study old testsubstance
2019 study new testsubstance
Deg
rad
atio
n (%
Th
IC)
Day 60
Scenario 1 Day 60 Scenario 2 Day 60
Scenario 3 Day 60 Scenario 4 Day 60
C
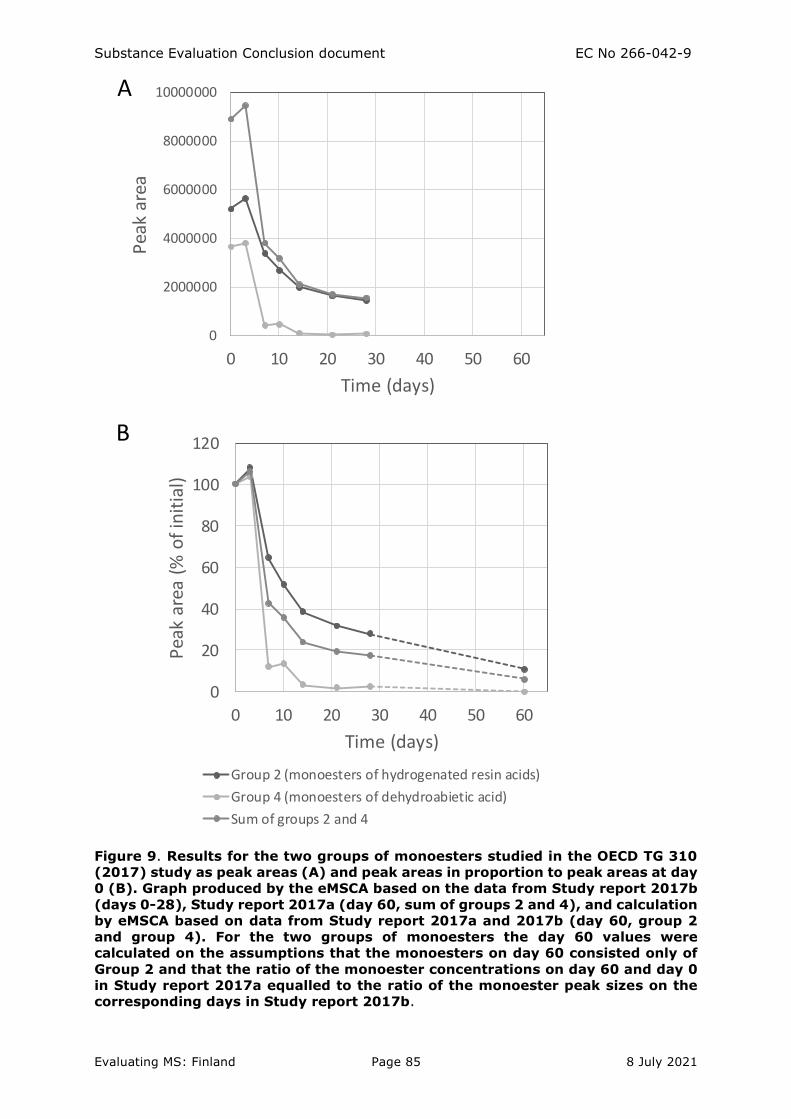
Substance Evaluation Conclusion document EC No 266-042-9
Evaluating MS: Finland Page 85 8 July 2021
Figure 9. Results for the two groups of monoesters studied in the OECD TG 310
(2017) study as peak areas (A) and peak areas in proportion to peak areas at day
0 (B). Graph produced by the eMSCA based on the data from Study report 2017b
(days 0-28), Study report 2017a (day 60, sum of groups 2 and 4), and calculation
by eMSCA based on data from Study report 2017a and 2017b (day 60, group 2
and group 4). For the two groups of monoesters the day 60 values were
calculated on the assumptions that the monoesters on day 60 consisted only of
Group 2 and that the ratio of the monoester concentrations on day 60 and day 0
in Study report 2017a equalled to the ratio of the monoester peak sizes on the
corresponding days in Study report 2017b.
c
0
2000000
4000000
6000000
8000000
10000000
0 10 20 30 40 50 60
Pea
k ar
ea
Time (days)
A
0
20
40
60
80
100
120
0 10 20 30 40 50 60
Pea
k ar
ea (
% o
f in
itia
l)
Time (days)
Group 2 (monoesters of hydrogenated resin acids)
Group 4 (monoesters of dehydroabietic acid)
Sum of groups 2 and 4
B
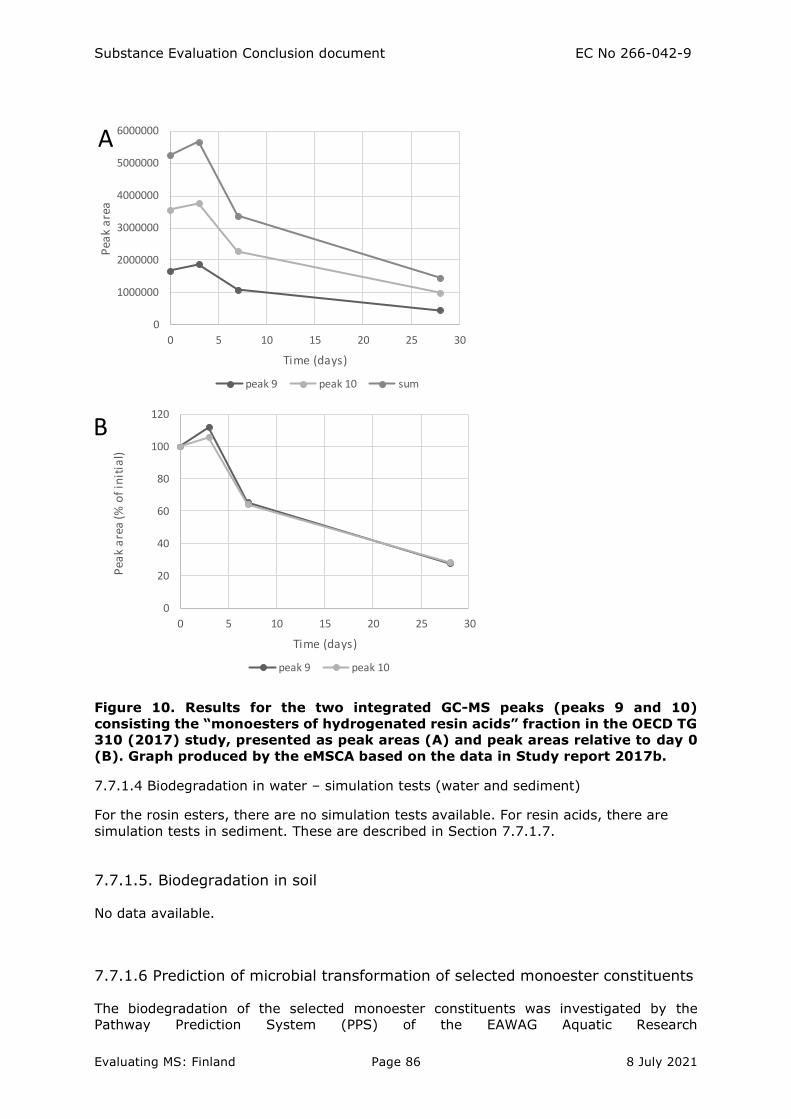
Substance Evaluation Conclusion document EC No 266-042-9
Evaluating MS: Finland Page 86 8 July 2021
Figure 10. Results for the two integrated GC-MS peaks (peaks 9 and 10)
consisting the “monoesters of hydrogenated resin acids” fraction in the OECD TG
310 (2017) study, presented as peak areas (A) and peak areas relative to day 0
(B). Graph produced by the eMSCA based on the data in Study report 2017b.
7.7.1.4 Biodegradation in water – simulation tests (water and sediment)
For the rosin esters, there are no simulation tests available. For resin acids, there are
simulation tests in sediment. These are described in Section 7.7.1.7.
7.7.1.5. Biodegradation in soil
No data available.
7.7.1.6 Prediction of microbial transformation of selected monoester constituents
The biodegradation of the selected monoester constituents was investigated by the
Pathway Prediction System (PPS) of the EAWAG Aquatic Research
0
1000000
2000000
3000000
4000000
5000000
6000000
0 5 10 15 20 25 30
Pea
k a
rea
Time (days)
peak 9 peak 10 sum
0
20
40
60
80
100
120
0 5 10 15 20 25 30
Pea
k a
rea
(% o
f in
itia
l)
Time (days)
peak 9 peak 10
B
A
Substance Evaluation Conclusion document EC No 266-042-9
Evaluating MS: Finland Page 87 8 July 2021
Biocatalysis/Biodegradation Database (http://eawag-bbd.ethz.ch/predict/). Possible
biodegradation metabolites predicted by the PPS are presented in
Figure 11 and Figure 12 and the degradation routes are shown in Table 27.
For the glycerol monoesters, one predicted transformation route is the formation of glycerol
and a resin acid (DHAA or THAA). The other predicted primary transformations are the
oxidation of either of the hydroxy groups of the glycerol part (to a carbonyl group) and the
resulting transformation products still include the ester bond. These can be further
transformed (through a different number of transformations) to resin acids and the two-
or three-carbon compounds glyceric acid, hydroxypyruvic acid, tartronic acid, or acetic
acid.
In case that a primary degradation rate is used for P/vP assessment it is necessary to
consider whether the transformation products have PBT/vPvB properties.
DHAA and THAA belong to the most hydrogenated resin acids; THAA being the fully
saturated resin acid and DHAA containing one double bond. A hazard assessment has been
conducted for Rosin, hydrogenated, of which resin acids are the predominant components
( > 85%). The outcome was that the substance is not considered to meet the PBT/vPvB
criteria based on the available, mainly screening level, information (Tukes 2015).
Regarding persistence, it is stated for Rosin, hydrogenated (Tukes 2015): “In the
registration dossiers, results from 13 ready biodegradation tests are available. The test
materials used are rosin and rosin acids, their K-, Ca- and Zn- salts and hydrogenated
forms of rosin acids. In four tests the substance degraded to the extent that the criteria
for ready biodegradation were fulfilled. In two tests, the substance was readily
biodegradable, but failed the 10-day window. In six tests, the substance was not readily
biodegradable. Of these, in four tests degradation was > 45 %; in two tests degradation
was 13.6 % and 0.9 %. In an OECD 302B inherent test, 73.3 % of the substance (rosin,
K-salt) degraded within 28 days.
The Episuite Biowin predictions for biodegradation indicate that individual constituents of
the substance are not readily biodegradable. However, the results do not allow a screening
assignment (P) in accordance with ECHA PBT guidance (R.11) Table R. 11-2.
In conclusion it can be stated that no final conclusion on P is possible based on the available
data. Nevertheless, taking into account the percentages of degradation in the ready and
inherent biodegradation test results, it seems unlikely that the P/vP-criterion would be
fulfilled. However, no definitive conclusion can be made based on the available data.”
Regarding bioaccumulation it is stated for Rosin, hydrogenated (Tukes 2015) that “In
conclusion it can be stated that, based on measured BCF-values in fish and mussels, the
substance does not fulfil the B/vB-criteria.”.
It should be noted that there are indications that transformation products with potential
PBT/vPvB properties may be produced from resin acids and rosin acids under anaerobic
conditions (see 7.7.1.7). This was not considered in the previous assessment (Tukes
2015).
It can be concluded that the resin acid acid constituents of the Substance are not PBT and
not vPvB, under aerobic conditions. However, further assessment is needed regarding
transformation products that may be formed from resin acids and rosin acids under
anaerobic conditions.
Glycerol is readily biodegradable according to the information on the REACH registered
substance factsheet (ECHA 2020a) and according to OECD (2005).
Based on the above, the eMSCA considers that glycerol is not a PBT/vPvB substance.
The eMSCA considers that there is no PBT/vPvB concern with the other transformation
products predicted to be derived from the glycerol moiety of the monoesters (Table 27).
Substance Evaluation Conclusion document EC No 266-042-9
Evaluating MS: Finland Page 88 8 July 2021
If the primary degradation half-life of the monoesters would be shorter than the P criterion
half-life and if the transformation products would only consist of glycerol, other compounds
derived from the glycerol moiety, and DHAA/THAA, then DHAA-mono-GE and THAA-mono-
GE could be considered as not P/ and not vP. Identification of further transformation
products that may be produced from DHAA/THAA or other resin acids under aerobic
conditions is not considered relevant for the present assessment (as they are not
considered to be PBT/vPvB) and thus these were not investigated.
Some of the predicted transformation products of the monoesters (by Routes G1 and G3
in Table 27) still have the ester bond. For these products, PBT/vPvB assessment have not
been previously conducted.
Information on the reaction rates and half-lives cannot be obtained from PPS predictions.
However, the “Aerobic likelihood” indicated in the PPS predictions can be used for relative
comparison of reactions. It is noted that for each of the predicted transformation products
which have more than one possible further transformation routes according to the PPS, the
ester hydrolysis route is always equally or more likely than the other possibility. Moreover,
even if a non-hydrolytic reaction occurs first, it is predicted to be followed by a hydrolysis
reaction (with or without intermediate steps), eventually leading to resin acid and glycerol
or other derivative from the glycerol moiety.
It should be noted that the current predictions using the PPS were performed using the
default option, showing aerobic biotransformations only.
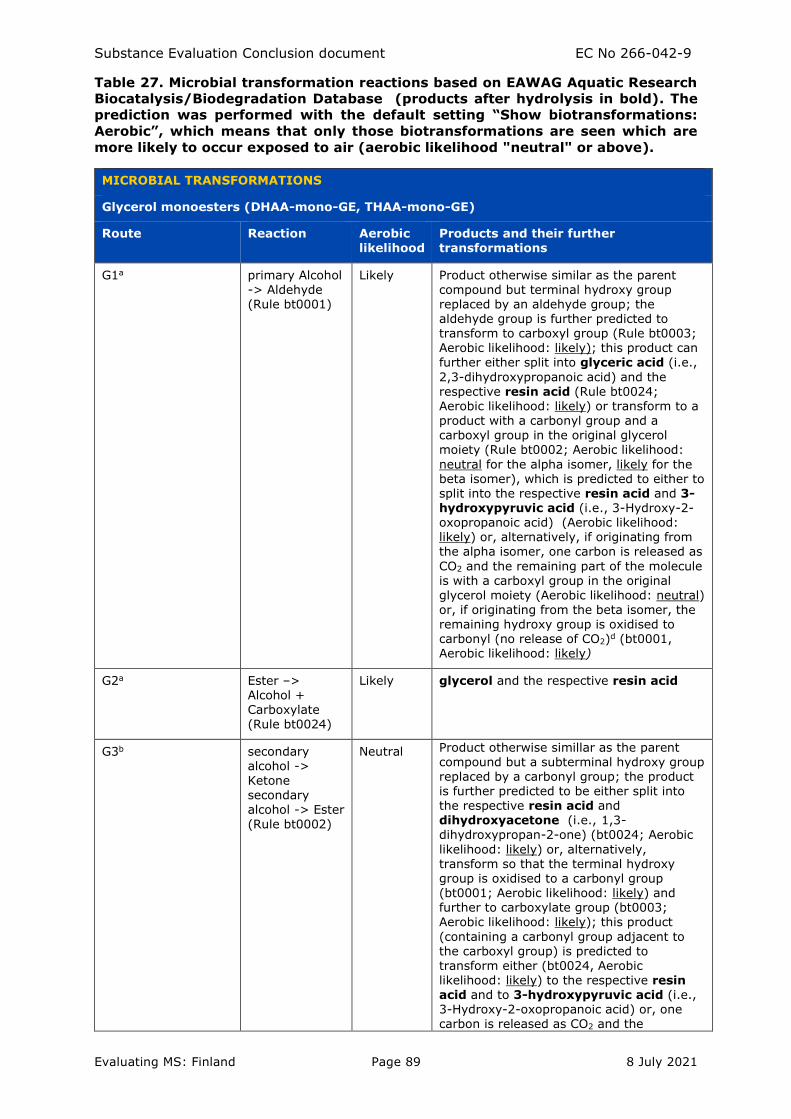
Substance Evaluation Conclusion document EC No 266-042-9
Evaluating MS: Finland Page 89 8 July 2021
Table 27. Microbial transformation reactions based on EAWAG Aquatic Research
Biocatalysis/Biodegradation Database (products after hydrolysis in bold). The
prediction was performed with the default setting “Show biotransformations:
Aerobic”, which means that only those biotransformations are seen which are
more likely to occur exposed to air (aerobic likelihood "neutral" or above).
MICROBIAL TRANSFORMATIONS
Glycerol monoesters (DHAA-mono-GE, THAA-mono-GE)
Route Reaction Aerobic likelihood
Products and their further transformations
G1a primary Alcohol -> Aldehyde (Rule bt0001)
Likely Product otherwise similar as the parent compound but terminal hydroxy group replaced by an aldehyde group; the aldehyde group is further predicted to transform to carboxyl group (Rule bt0003; Aerobic likelihood: likely); this product can
further either split into glyceric acid (i.e.,
2,3-dihydroxypropanoic acid) and the respective resin acid (Rule bt0024; Aerobic likelihood: likely) or transform to a product with a carbonyl group and a carboxyl group in the original glycerol moiety (Rule bt0002; Aerobic likelihood:
neutral for the alpha isomer, likely for the beta isomer), which is predicted to either to split into the respective resin acid and 3-hydroxypyruvic acid (i.e., 3-Hydroxy-2-oxopropanoic acid) (Aerobic likelihood: likely) or, alternatively, if originating from the alpha isomer, one carbon is released as
CO2 and the remaining part of the molecule is with a carboxyl group in the original
glycerol moiety (Aerobic likelihood: neutral) or, if originating from the beta isomer, the remaining hydroxy group is oxidised to carbonyl (no release of CO2)d (bt0001, Aerobic likelihood: likely)
G2a Ester –> Alcohol + Carboxylate (Rule bt0024)
Likely glycerol and the respective resin acid
G3b secondary alcohol -> Ketone secondary alcohol -> Ester
(Rule bt0002)
Neutral Product otherwise simillar as the parent compound but a subterminal hydroxy group replaced by a carbonyl group; the product is further predicted to be either split into the respective resin acid and dihydroxyacetone (i.e., 1,3-
dihydroxypropan-2-one) (bt0024; Aerobic
likelihood: likely) or, alternatively, transform so that the terminal hydroxy group is oxidised to a carbonyl group (bt0001; Aerobic likelihood: likely) and further to carboxylate group (bt0003; Aerobic likelihood: likely); this product
(containing a carbonyl group adjacent to the carboxyl group) is predicted to transform either (bt0024, Aerobic likelihood: likely) to the respective resin acid and to 3-hydroxypyruvic acid (i.e., 3-Hydroxy-2-oxopropanoic acid) or, one carbon is released as CO2 and the
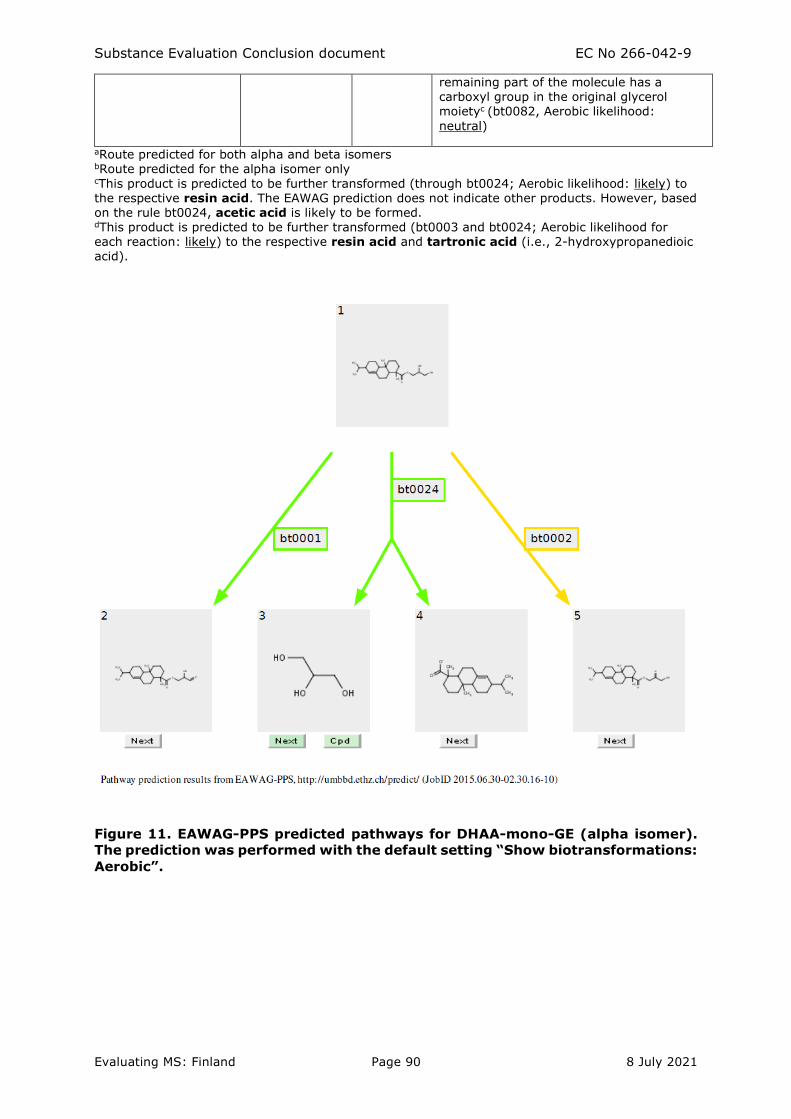
Substance Evaluation Conclusion document EC No 266-042-9
Evaluating MS: Finland Page 90 8 July 2021
remaining part of the molecule has a carboxyl group in the original glycerol moietyc (bt0082, Aerobic likelihood:
neutral)
aRoute predicted for both alpha and beta isomers bRoute predicted for the alpha isomer only cThis product is predicted to be further transformed (through bt0024; Aerobic likelihood: likely) to the respective resin acid. The EAWAG prediction does not indicate other products. However, based on the rule bt0024, acetic acid is likely to be formed. dThis product is predicted to be further transformed (bt0003 and bt0024; Aerobic likelihood for each reaction: likely) to the respective resin acid and tartronic acid (i.e., 2-hydroxypropanedioic acid).
Figure 11. EAWAG-PPS predicted pathways for DHAA-mono-GE (alpha isomer).
The prediction was performed with the default setting “Show biotransformations:
Aerobic”.
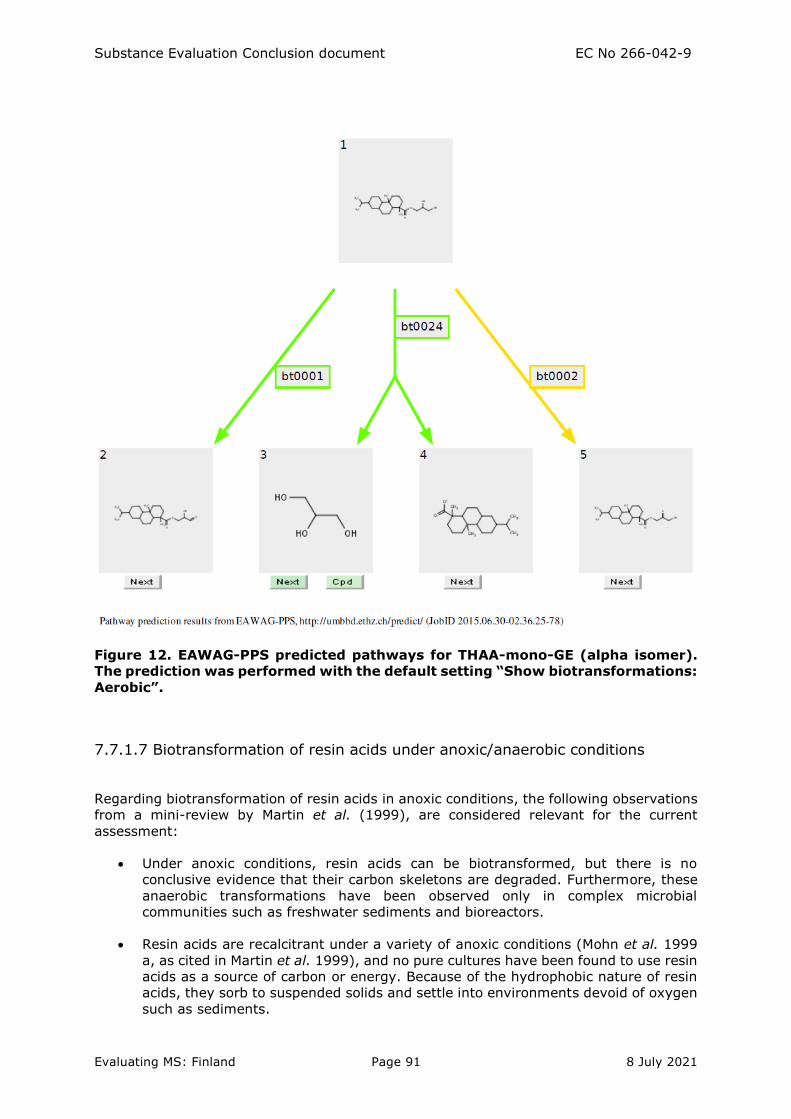
Substance Evaluation Conclusion document EC No 266-042-9
Evaluating MS: Finland Page 91 8 July 2021
Figure 12. EAWAG-PPS predicted pathways for THAA-mono-GE (alpha isomer).
The prediction was performed with the default setting “Show biotransformations:
Aerobic”.
7.7.1.7 Biotransformation of resin acids under anoxic/anaerobic conditions
Regarding biotransformation of resin acids in anoxic conditions, the following observations
from a mini-review by Martin et al. (1999), are considered relevant for the current
assessment:
• Under anoxic conditions, resin acids can be biotransformed, but there is no
conclusive evidence that their carbon skeletons are degraded. Furthermore, these
anaerobic transformations have been observed only in complex microbial
communities such as freshwater sediments and bioreactors.
• Resin acids are recalcitrant under a variety of anoxic conditions (Mohn et al. 1999
a, as cited in Martin et al. 1999), and no pure cultures have been found to use resin
acids as a source of carbon or energy. Because of the hydrophobic nature of resin
acids, they sorb to suspended solids and settle into environments devoid of oxygen
such as sediments.
Substance Evaluation Conclusion document EC No 266-042-9
Evaluating MS: Finland Page 92 8 July 2021
• A biological transformation pathway for DeHAA in anoxic sediments has been
described (Tavendale et al. 1997a as cited in Martin et al. 1999). Deuterated DeHAA
was incubated with anaerobic sediments and compared to a parallel autoclaved
control sample. In a 264-day incubation period, dehydroabietin and
tetrahydroretene were minor and major transformation products of DeHAA,
respectively. These compounds had been previously observed in lake sediments
(Wakeham et al. 1980 as cited in Martin et al. 1999) and were considered by Martin
et al. (1999) to probably represent the principal path of anaerobic transformation
of resin acids.
• Tetrahydroretene may be formed in a one-step reaction or may involve the
formation of 20-norabietapentaenoic acid (simonellite), a short-lived intermediate
measured at very low concentration. A very small percentage of tetrahydroretene
was converted to retene (1.1%) and methyltetrahydrophenathrene, but the
majority of the tetrahydroretene was transformed to unidentified compound(s). The
time scale of these experiments clearly indicates that anaerobic transformation of
resin acids is slow relative to aerobic degradation. The evidence for the anaerobic
biotransformation of pimerane-type resin acids is less conclusive. Anaerobic
incubation of lake sediments receiving bleached kraft mill effluent has been found
to significantly reduce pimaric and isopimaric acids as compared to autoclaved
control samples (Tavendale et al. 1997b as cited in Martin et al. 1999).
• The studies on the anaerobic fate of resin acids indicate that aromatization and
decarboxylation to alkylated polycyclic aromatic hydrocarbons occurs and that the
resulting compounds persist in the environment, as evidenced by the presence of
retene and pimanthrene in dated samples. However, nitrate-reducing bacteria have
recently been isolated with monoterpenes and cholesterol as sole carbon sources
(Harder and Probian 1997 as cited in Martin et al. 1999; Foss and Harder 1998 as
cited in Martin et al. 1999). It has been found that these organisms mineralize the
organic substrates to carbon dioxide during anaerobic growth. These results suggest
that resin acids may be mineralized under the appropriate anoxic culture conditions.
Resin acids and their degradation product retene have been found in sediments, especially
in sediments adjacent to pulp and paper industries (Leppänen and Oikari 2001, Lahdelma
and Oikari 2005). Also, the distribution modelling (Section 7.7.2) suggests that resin acids
as well as other constituents of the Substance may end up in sediment.
Thus, the available information indicate that resin acids and their precursors may end up
in anoxic/anaerobic sediments and may be transformed to e.g. aromatic three-ring
compounds such as retene and tetrahydroretene. Several structurally relatively similar
substances, such as anthracene and phenanthrene, have been identified as PBT or vPvB
substances. Therefore, these transformation products form a potential PBT/vPvB concern
that should be assessed further.
The Substance has uses with release to the environment. This together with the properties
of the constituents (e.g., low water solubility, adsorption potential, not readily
biodegradable nature) indicates that some of the constituents might reach sediments and
be exposed to anaerobic conditions.
It should be noted that resin acids are constituents of many REACH registered substances.
There is currently no clear guidance on how the transformation products which are formed
only under anaerobic conditions should be assessed. Therefore, the eMSCA considers that
this concern for the anaerobic transformation products should be also be discussed on a
more generic level to assess the need for further action. Therefore, this concern is not
addressed in detail in the present substance evaluation. It is noted that information on the
relative proportions of the transformation products formed is available (e.g. Tavendale et
al. 1997a, 1997b), which may be important for assessing the relevance of these products
under REACH. It should also be noted that the studies by Tavendale et al. were conducted
on a sediment exposed to bleached kraft mill effluent and therefore the sediment was likely
Substance Evaluation Conclusion document EC No 266-042-9
Evaluating MS: Finland Page 93 8 July 2021
to be exposed to high concentrations of resin acids, which may affect the adaptation of
microorganisms and biotransformation rates. For assessing the potential concern of the
anaerobic transformation products, it may also be important to assess whether this would
have a significant effect for the levels of these compounds (e.g., retene) in the
environment.
7.7.1.8 Other studies on degradation of rosin substances
Some published studies on biodegradation of rosin ester substances (Sahu et al. 1999,
Fulzele et al. 2003, Fulzele et al. 2007, Satturwar et al. 2003) are available but their
significance for this assessment is considered low. These studies are mainly dealing with
degradation of resin substances in animal tissues (e.g. studies on biopolymers for delivery
of drugs) and not microbial degradation.
The article by Sahu et al (1999) includes biodegradation studies with a fungus Aspergillus
niger, mixed culture of compost and garden soil, and sewage sludge. The rosin glycerol
ester was the sole carbon source for the microorganisms. An abundant growth of A. niger
was observed and the authors concluded that the rosin glycerol ester was utilized as a
carbon source. However, it is mentioned that contamination of the agar with other
microorganisms was observed along with A. niger. The authors mention that the
contamination may be due to the fact that the rosin derivative material itself carried some
microorganisms. Growth was also detected in cultures isolated from the garden soil. It is
noted that degradation was monitored only by percentage weight loss, visual observations,
and microscopy. Neither the concentrations of the constituents of the test substance nor
the degradates were studied. The weight loss was 40-44% in 90 days in the different
cultures (A.niger, compost elute:garden soil 50:50, and sewage sludge). It is not reported
whether a sterile control experiment was included in the biodegradation studies to
differentiate abiotic degradation.
The relevance of the results by Sahu et al. (1999) for the present assessment is considered
rather low because the representativeness of the samples (e.g., pre-treatment) for the
present assessment are questionable or not known, the concentrations of the constituents
and degradation products were not identified, and the only quantitative parameter used
for determination of degradation was percentage decrease in weight loss. The study set-
up is not comparable, e.g., to ready biodegradation tests or simulation tests; nevertheless
it is noted that the rate of degradation (40-44% decrease in weight in 90 days) is in line
with potential persistence of the substance. Although the conclusion that the rosin glycerol
ester was degraded and utilized as a microbial carbon source is interesting, no quantitative
results for microbial growth (e.g. microbial biomass, cell counts) or mineralization are
presented.
7.7.2. Distribution
In the registrated substance factsheet for the Substance, under the Chapter Environmental
fate/Transport and distribution, there is information on adsorption but no other information
on distribution in the environment.
The eMSCA has conducted distribution modelling for selected resin acid and monoester
constituents (Table 29, Table 30).
With the default emission pattern of the software, i.e., equal emissions to air, water, and
soil, the following observations were made:
• For the selected resin acids, the distribution was approximately 14% to
water, 15% to sediment, 71% to soil, and 0.02-0.3% to air.
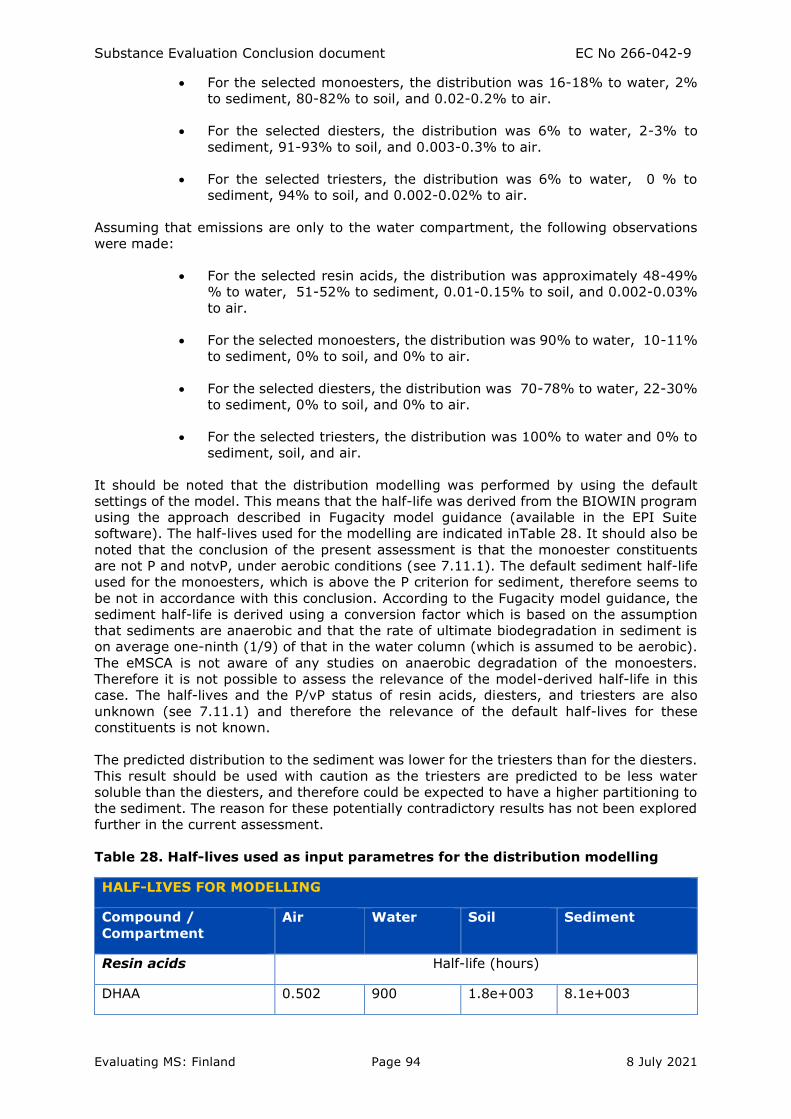
Substance Evaluation Conclusion document EC No 266-042-9
Evaluating MS: Finland Page 94 8 July 2021
• For the selected monoesters, the distribution was 16-18% to water, 2%
to sediment, 80-82% to soil, and 0.02-0.2% to air.
• For the selected diesters, the distribution was 6% to water, 2-3% to
sediment, 91-93% to soil, and 0.003-0.3% to air.
• For the selected triesters, the distribution was 6% to water, 0 % to
sediment, 94% to soil, and 0.002-0.02% to air.
Assuming that emissions are only to the water compartment, the following observations
were made:
• For the selected resin acids, the distribution was approximately 48-49%
% to water, 51-52% to sediment, 0.01-0.15% to soil, and 0.002-0.03%
to air.
• For the selected monoesters, the distribution was 90% to water, 10-11%
to sediment, 0% to soil, and 0% to air.
• For the selected diesters, the distribution was 70-78% to water, 22-30%
to sediment, 0% to soil, and 0% to air.
• For the selected triesters, the distribution was 100% to water and 0% to
sediment, soil, and air.
It should be noted that the distribution modelling was performed by using the default
settings of the model. This means that the half-life was derived from the BIOWIN program
using the approach described in Fugacity model guidance (available in the EPI Suite
software). The half-lives used for the modelling are indicated inTable 28. It should also be
noted that the conclusion of the present assessment is that the monoester constituents
are not P and notvP, under aerobic conditions (see 7.11.1). The default sediment half-life
used for the monoesters, which is above the P criterion for sediment, therefore seems to
be not in accordance with this conclusion. According to the Fugacity model guidance, the
sediment half-life is derived using a conversion factor which is based on the assumption
that sediments are anaerobic and that the rate of ultimate biodegradation in sediment is
on average one-ninth (1/9) of that in the water column (which is assumed to be aerobic).
The eMSCA is not aware of any studies on anaerobic degradation of the monoesters.
Therefore it is not possible to assess the relevance of the model-derived half-life in this
case. The half-lives and the P/vP status of resin acids, diesters, and triesters are also
unknown (see 7.11.1) and therefore the relevance of the default half-lives for these
constituents is not known.
The predicted distribution to the sediment was lower for the triesters than for the diesters.
This result should be used with caution as the triesters are predicted to be less water
soluble than the diesters, and therefore could be expected to have a higher partitioning to
the sediment. The reason for these potentially contradictory results has not been explored
further in the current assessment.
Table 28. Half-lives used as input parametres for the distribution modelling
HALF-LIVES FOR MODELLING
Compound /
Compartment
Air Water Soil Sediment
Resin acids Half-life (hours)
DHAA 0.502 900 1.8e+003 8.1e+003
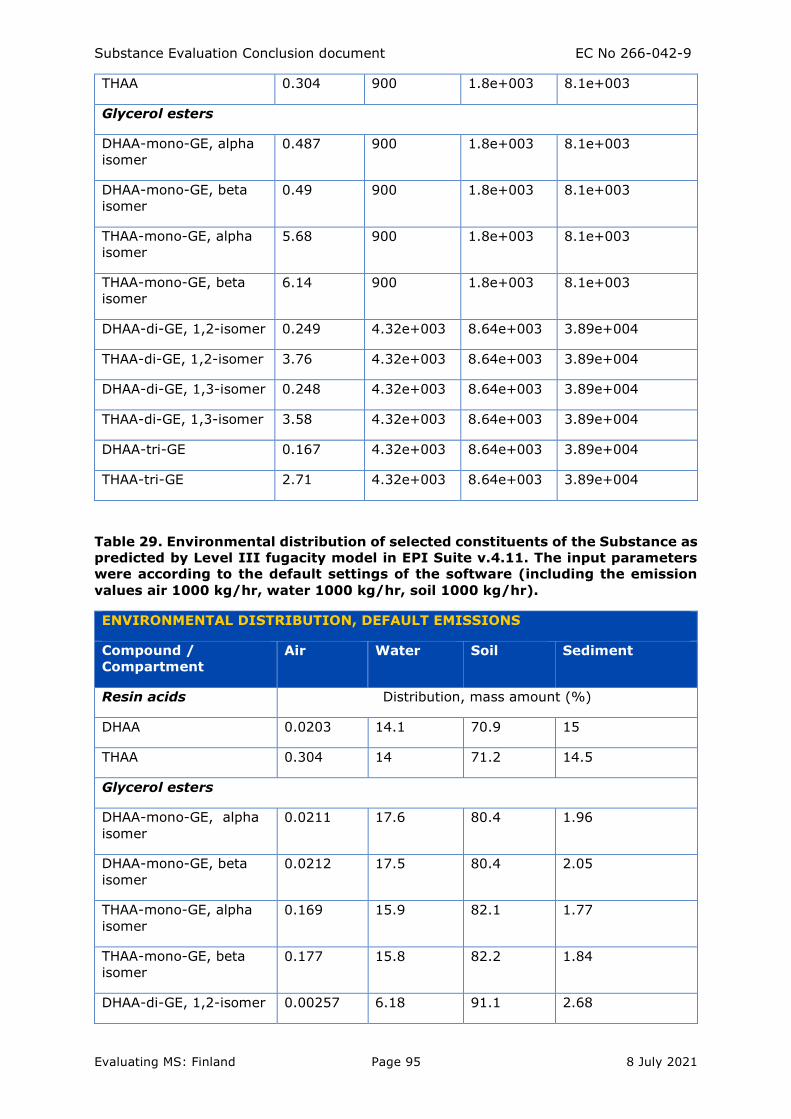
Substance Evaluation Conclusion document EC No 266-042-9
Evaluating MS: Finland Page 95 8 July 2021
THAA 0.304 900 1.8e+003 8.1e+003
Glycerol esters
DHAA-mono-GE, alpha
isomer
0.487 900 1.8e+003 8.1e+003
DHAA-mono-GE, beta
isomer
0.49 900 1.8e+003 8.1e+003
THAA-mono-GE, alpha
isomer
5.68 900 1.8e+003 8.1e+003
THAA-mono-GE, beta
isomer
6.14 900 1.8e+003 8.1e+003
DHAA-di-GE, 1,2-isomer 0.249 4.32e+003 8.64e+003 3.89e+004
THAA-di-GE, 1,2-isomer 3.76 4.32e+003 8.64e+003 3.89e+004
DHAA-di-GE, 1,3-isomer 0.248 4.32e+003 8.64e+003 3.89e+004
THAA-di-GE, 1,3-isomer 3.58 4.32e+003 8.64e+003 3.89e+004
DHAA-tri-GE 0.167 4.32e+003 8.64e+003 3.89e+004
THAA-tri-GE 2.71 4.32e+003 8.64e+003 3.89e+004
Table 29. Environmental distribution of selected constituents of the Substance as
predicted by Level III fugacity model in EPI Suite v.4.11. The input parameters
were according to the default settings of the software (including the emission
values air 1000 kg/hr, water 1000 kg/hr, soil 1000 kg/hr).
ENVIRONMENTAL DISTRIBUTION, DEFAULT EMISSIONS
Compound /
Compartment
Air Water Soil Sediment
Resin acids Distribution, mass amount (%)
DHAA 0.0203 14.1 70.9 15
THAA 0.304 14 71.2 14.5
Glycerol esters
DHAA-mono-GE, alpha
isomer
0.0211 17.6 80.4 1.96
DHAA-mono-GE, beta
isomer
0.0212 17.5 80.4 2.05
THAA-mono-GE, alpha
isomer
0.169 15.9 82.1 1.77
THAA-mono-GE, beta
isomer
0.177 15.8 82.2 1.84
DHAA-di-GE, 1,2-isomer 0.00257 6.18 91.1 2.68
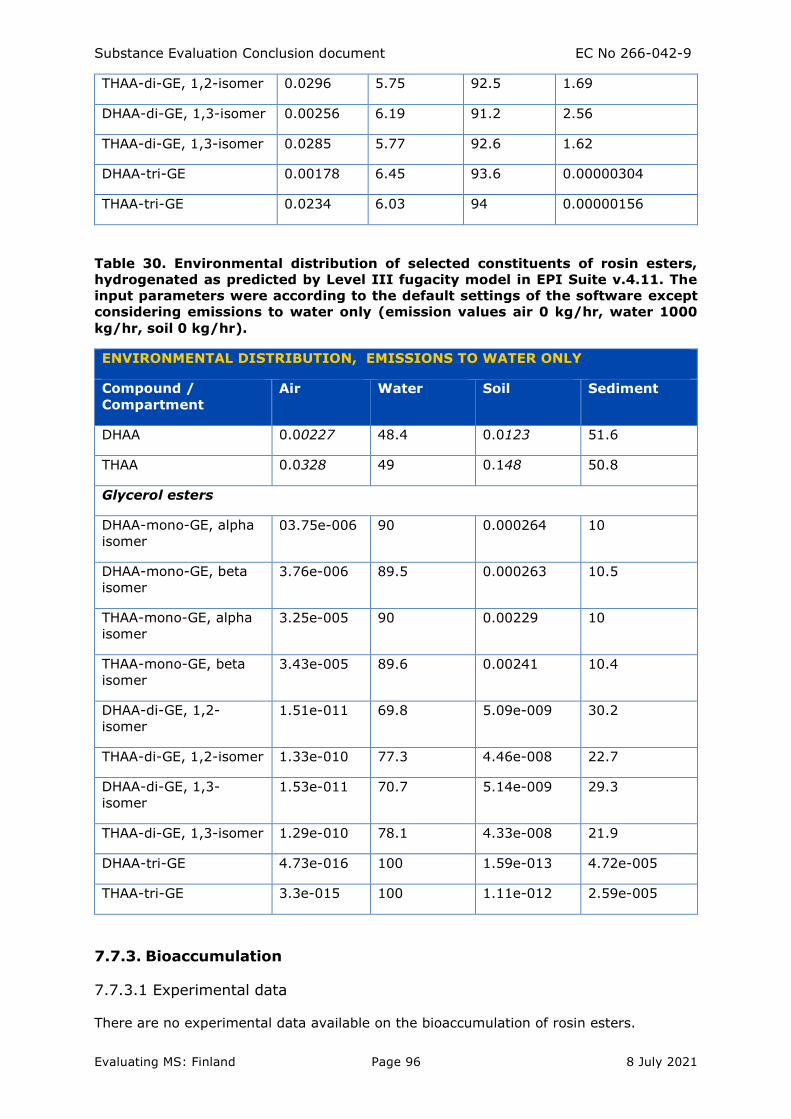
Substance Evaluation Conclusion document EC No 266-042-9
Evaluating MS: Finland Page 96 8 July 2021
THAA-di-GE, 1,2-isomer 0.0296 5.75 92.5 1.69
DHAA-di-GE, 1,3-isomer 0.00256 6.19 91.2 2.56
THAA-di-GE, 1,3-isomer 0.0285 5.77 92.6 1.62
DHAA-tri-GE 0.00178 6.45 93.6 0.00000304
THAA-tri-GE 0.0234 6.03 94 0.00000156
Table 30. Environmental distribution of selected constituents of rosin esters,
hydrogenated as predicted by Level III fugacity model in EPI Suite v.4.11. The
input parameters were according to the default settings of the software except
considering emissions to water only (emission values air 0 kg/hr, water 1000
kg/hr, soil 0 kg/hr).
ENVIRONMENTAL DISTRIBUTION, EMISSIONS TO WATER ONLY
Compound /
Compartment
Air Water Soil Sediment
DHAA 0.00227 48.4 0.0123 51.6
THAA 0.0328 49 0.148 50.8
Glycerol esters
DHAA-mono-GE, alpha
isomer
03.75e-006 90 0.000264 10
DHAA-mono-GE, beta
isomer
3.76e-006 89.5 0.000263 10.5
THAA-mono-GE, alpha
isomer
3.25e-005 90 0.00229 10
THAA-mono-GE, beta
isomer
3.43e-005 89.6 0.00241 10.4
DHAA-di-GE, 1,2-
isomer
1.51e-011 69.8 5.09e-009 30.2
THAA-di-GE, 1,2-isomer 1.33e-010 77.3 4.46e-008 22.7
DHAA-di-GE, 1,3-
isomer
1.53e-011 70.7 5.14e-009 29.3
THAA-di-GE, 1,3-isomer 1.29e-010 78.1 4.33e-008 21.9
DHAA-tri-GE 4.73e-016 100 1.59e-013 4.72e-005
THAA-tri-GE 3.3e-015 100 1.11e-012 2.59e-005
7.7.3. Bioaccumulation
7.7.3.1 Experimental data
There are no experimental data available on the bioaccumulation of rosin esters.
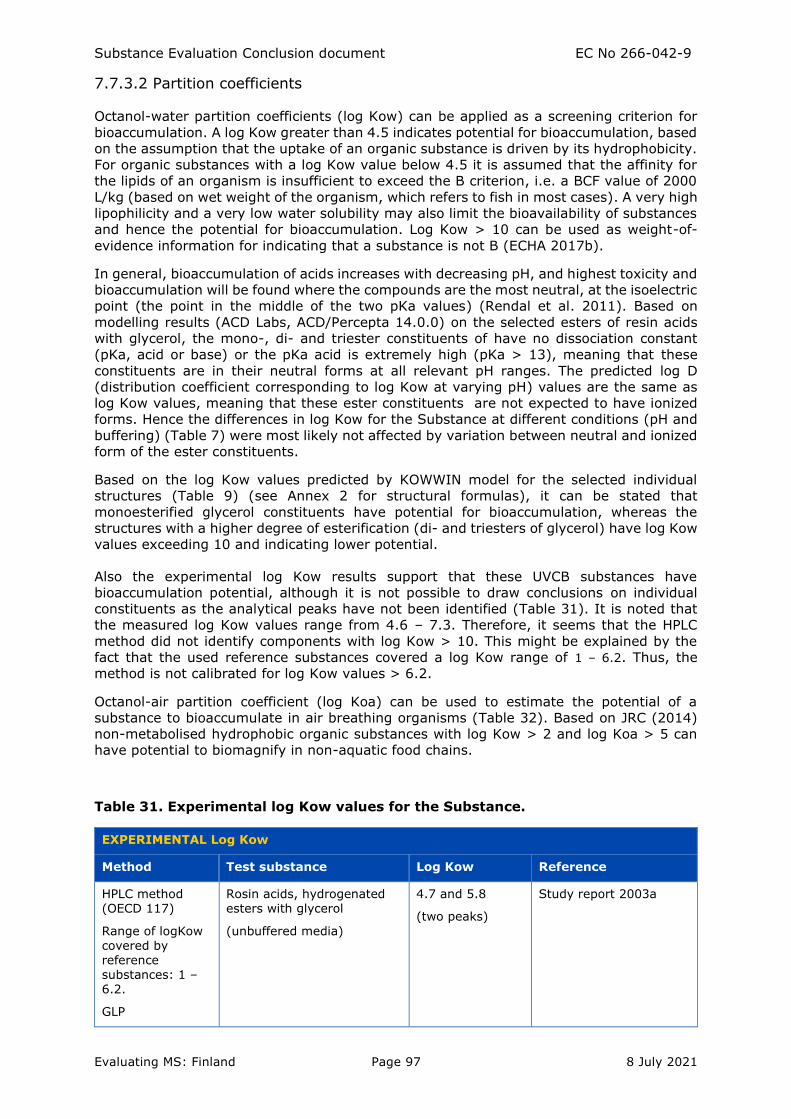
Substance Evaluation Conclusion document EC No 266-042-9
Evaluating MS: Finland Page 97 8 July 2021
7.7.3.2 Partition coefficients
Octanol-water partition coefficients (log Kow) can be applied as a screening criterion for
bioaccumulation. A log Kow greater than 4.5 indicates potential for bioaccumulation, based
on the assumption that the uptake of an organic substance is driven by its hydrophobicity.
For organic substances with a log Kow value below 4.5 it is assumed that the affinity for
the lipids of an organism is insufficient to exceed the B criterion, i.e. a BCF value of 2000
L/kg (based on wet weight of the organism, which refers to fish in most cases). A very high
lipophilicity and a very low water solubility may also limit the bioavailability of substances
and hence the potential for bioaccumulation. Log Kow > 10 can be used as weight-of-
evidence information for indicating that a substance is not B (ECHA 2017b).
In general, bioaccumulation of acids increases with decreasing pH, and highest toxicity and
bioaccumulation will be found where the compounds are the most neutral, at the isoelectric
point (the point in the middle of the two pKa values) (Rendal et al. 2011). Based on
modelling results (ACD Labs, ACD/Percepta 14.0.0) on the selected esters of resin acids
with glycerol, the mono-, di- and triester constituents of have no dissociation constant
(pKa, acid or base) or the pKa acid is extremely high (pKa > 13), meaning that these
constituents are in their neutral forms at all relevant pH ranges. The predicted log D
(distribution coefficient corresponding to log Kow at varying pH) values are the same as
log Kow values, meaning that these ester constituents are not expected to have ionized
forms. Hence the differences in log Kow for the Substance at different conditions (pH and
buffering) (Table 7) were most likely not affected by variation between neutral and ionized
form of the ester constituents.
Based on the log Kow values predicted by KOWWIN model for the selected individual
structures (Table 9) (see Annex 2 for structural formulas), it can be stated that
monoesterified glycerol constituents have potential for bioaccumulation, whereas the
structures with a higher degree of esterification (di- and triesters of glycerol) have log Kow
values exceeding 10 and indicating lower potential.
Also the experimental log Kow results support that these UVCB substances have
bioaccumulation potential, although it is not possible to draw conclusions on individual
constituents as the analytical peaks have not been identified (Table 31). It is noted that
the measured log Kow values range from 4.6 – 7.3. Therefore, it seems that the HPLC
method did not identify components with log Kow > 10. This might be explained by the
fact that the used reference substances covered a log Kow range of 1 – 6.2. Thus, the
method is not calibrated for log Kow values > 6.2.
Octanol-air partition coefficient (log Koa) can be used to estimate the potential of a
substance to bioaccumulate in air breathing organisms (Table 32). Based on JRC (2014)
non-metabolised hydrophobic organic substances with log Kow > 2 and log Koa > 5 can
have potential to biomagnify in non-aquatic food chains.
Table 31. Experimental log Kow values for the Substance.
EXPERIMENTAL Log Kow
Method Test substance Log Kow Reference
HPLC method (OECD 117)
Range of logKow covered by reference substances: 1 – 6.2.
GLP
Rosin acids, hydrogenated esters with glycerol
(unbuffered media)
4.7 and 5.8
(two peaks)
Study report 2003a
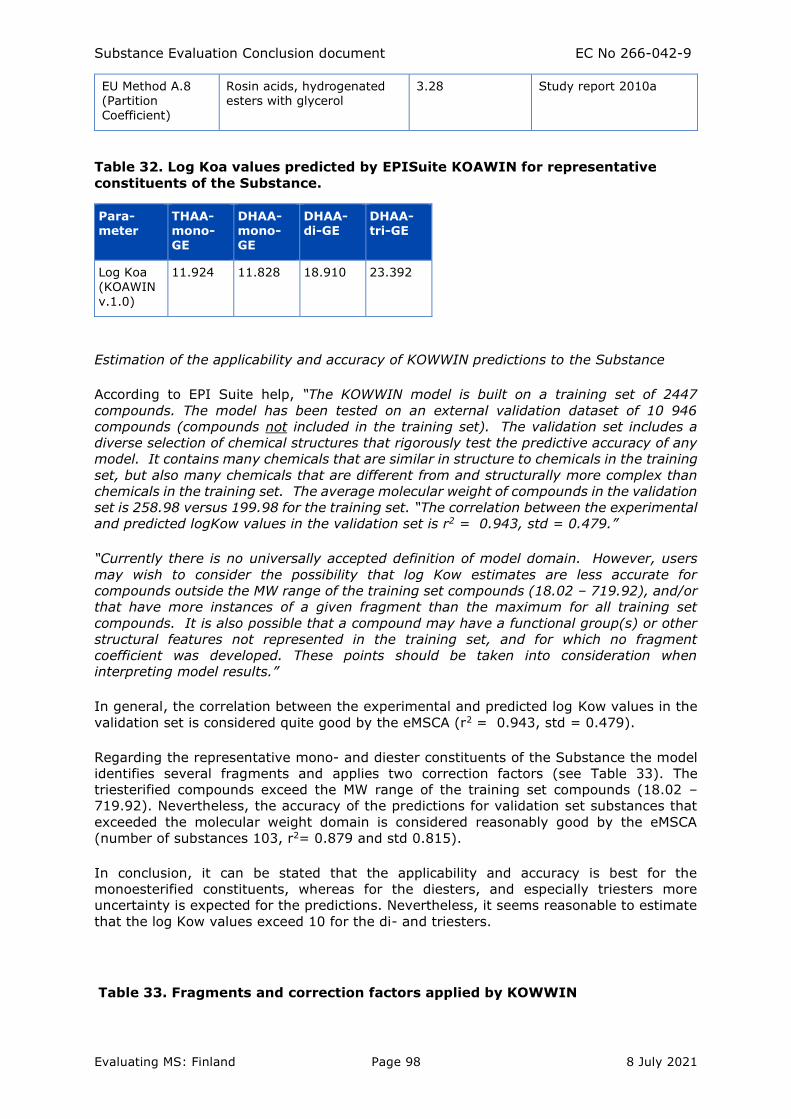
Substance Evaluation Conclusion document EC No 266-042-9
Evaluating MS: Finland Page 98 8 July 2021
EU Method A.8 (Partition
Coefficient)
Rosin acids, hydrogenated esters with glycerol
3.28 Study report 2010a
Table 32. Log Koa values predicted by EPISuite KOAWIN for representative
constituents of the Substance.
Para-meter
THAA- mono-GE
DHAA- mono-GE
DHAA- di-GE
DHAA- tri-GE
Log Koa (KOAWIN
v.1.0)
11.924 11.828 18.910 23.392
Estimation of the applicability and accuracy of KOWWIN predictions to the Substance
According to EPI Suite help, “The KOWWIN model is built on a training set of 2447
compounds. The model has been tested on an external validation dataset of 10 946
compounds (compounds not included in the training set). The validation set includes a
diverse selection of chemical structures that rigorously test the predictive accuracy of any
model. It contains many chemicals that are similar in structure to chemicals in the training
set, but also many chemicals that are different from and structurally more complex than
chemicals in the training set. The average molecular weight of compounds in the validation
set is 258.98 versus 199.98 for the training set. “The correlation between the experimental
and predicted logKow values in the validation set is r2 = 0.943, std = 0.479.”
“Currently there is no universally accepted definition of model domain. However, users
may wish to consider the possibility that log Kow estimates are less accurate for
compounds outside the MW range of the training set compounds (18.02 – 719.92), and/or
that have more instances of a given fragment than the maximum for all training set
compounds. It is also possible that a compound may have a functional group(s) or other
structural features not represented in the training set, and for which no fragment
coefficient was developed. These points should be taken into consideration when
interpreting model results.”
In general, the correlation between the experimental and predicted log Kow values in the
validation set is considered quite good by the eMSCA (r2 = 0.943, std = 0.479).
Regarding the representative mono- and diester constituents of the Substance the model
identifies several fragments and applies two correction factors (see Table 33). The
triesterified compounds exceed the MW range of the training set compounds (18.02 –
719.92). Nevertheless, the accuracy of the predictions for validation set substances that
exceeded the molecular weight domain is considered reasonably good by the eMSCA
(number of substances 103, r2= 0.879 and std 0.815).
In conclusion, it can be stated that the applicability and accuracy is best for the
monoesterified constituents, whereas for the diesters, and especially triesters more
uncertainty is expected for the predictions. Nevertheless, it seems reasonable to estimate
that the log Kow values exceed 10 for the di- and triesters.
Table 33. Fragments and correction factors applied by KOWWIN
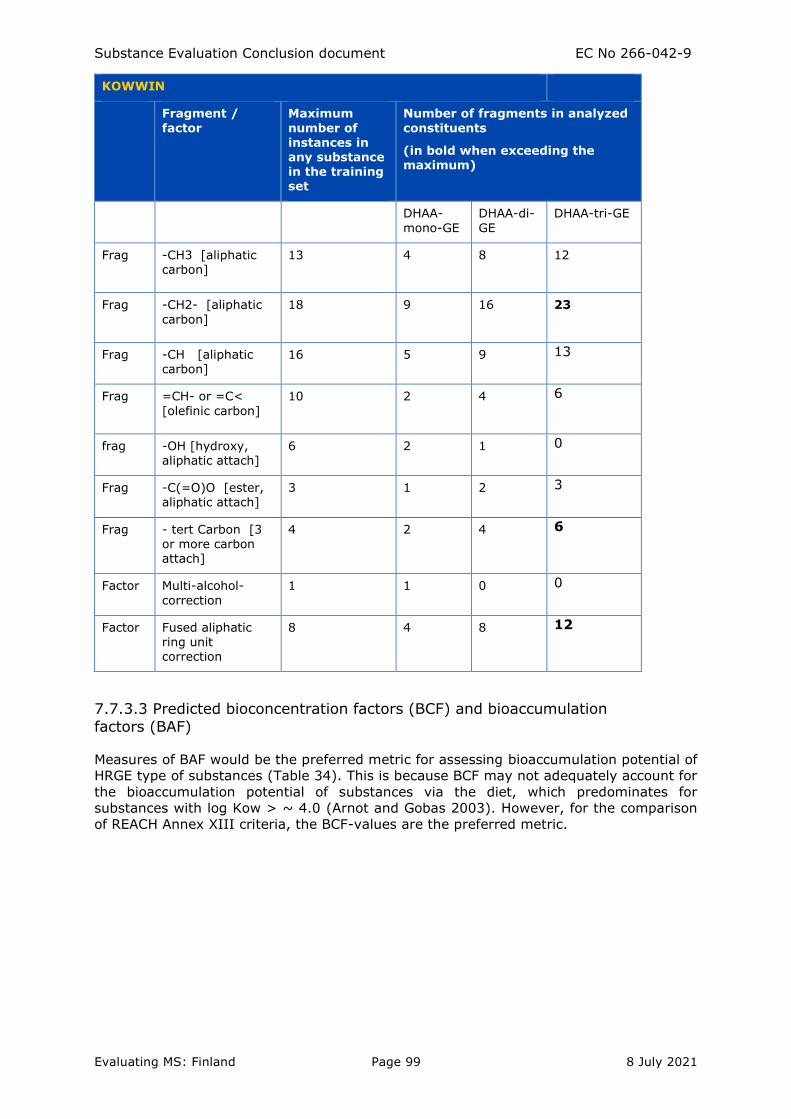
Substance Evaluation Conclusion document EC No 266-042-9
Evaluating MS: Finland Page 99 8 July 2021
KOWWIN
Fragment /
factor
Maximum
number of instances in any substance in the training set
Number of fragments in analyzed
constituents
(in bold when exceeding the maximum)
DHAA-
mono-GE
DHAA-di-
GE
DHAA-tri-GE
Frag -CH3 [aliphatic carbon]
13 4 8
12
Frag -CH2- [aliphatic
carbon]
18 9 16
23
Frag -CH [aliphatic carbon]
16 5 9 13
Frag =CH- or =C<
[olefinic carbon]
10 2 4
6
frag -OH [hydroxy, aliphatic attach]
6 2 1 0
Frag -C(=O)O [ester, aliphatic attach]
3 1 2 3
Frag - tert Carbon [3 or more carbon attach]
4 2 4 6
Factor Multi-alcohol-
correction
1 1 0 0
Factor Fused aliphatic ring unit correction
8 4 8
12
7.7.3.3 Predicted bioconcentration factors (BCF) and bioaccumulation
factors (BAF)
Measures of BAF would be the preferred metric for assessing bioaccumulation potential of
HRGE type of substances (Table 34). This is because BCF may not adequately account for
the bioaccumulation potential of substances via the diet, which predominates for
substances with log Kow > ~ 4.0 (Arnot and Gobas 2003). However, for the comparison
of REACH Annex XIII criteria, the BCF-values are the preferred metric.
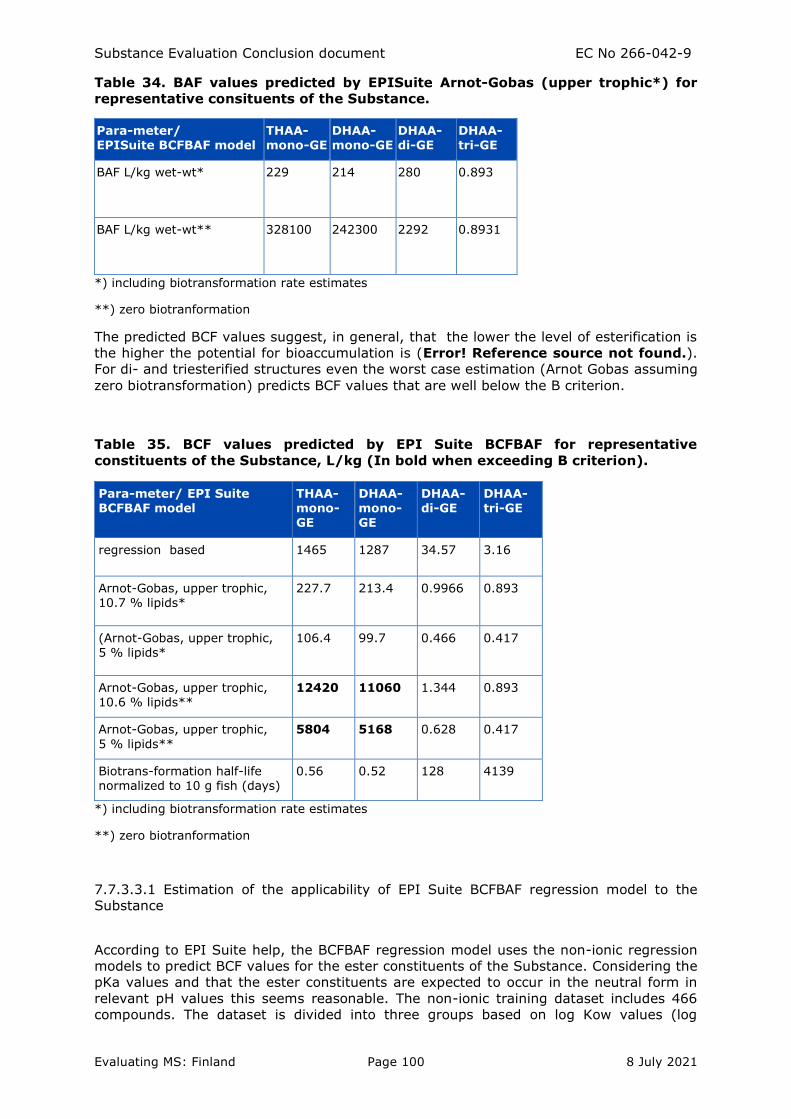
Substance Evaluation Conclusion document EC No 266-042-9
Evaluating MS: Finland Page 100 8 July 2021
Table 34. BAF values predicted by EPISuite Arnot-Gobas (upper trophic*) for
representative consituents of the Substance.
Para-meter/ EPISuite BCFBAF model
THAA-mono-GE
DHAA-mono-GE
DHAA-di-GE
DHAA-tri-GE
BAF L/kg wet-wt*
229 214 280 0.893
BAF L/kg wet-wt**
328100 242300 2292 0.8931
*) including biotransformation rate estimates
**) zero biotranformation
The predicted BCF values suggest, in general, that the lower the level of esterification is
the higher the potential for bioaccumulation is (Error! Reference source not found.).
For di- and triesterified structures even the worst case estimation (Arnot Gobas assuming
zero biotransformation) predicts BCF values that are well below the B criterion.
Table 35. BCF values predicted by EPI Suite BCFBAF for representative
constituents of the Substance, L/kg (In bold when exceeding B criterion).
Para-meter/ EPI Suite BCFBAF model
THAA- mono-GE
DHAA- mono- GE
DHAA- di-GE
DHAA- tri-GE
regression based 1465 1287 34.57 3.16
Arnot-Gobas, upper trophic, 10.7 % lipids*
227.7
213.4
0.9966
0.893
(Arnot-Gobas, upper trophic, 5 % lipids*
106.4 99.7
0.466 0.417
Arnot-Gobas, upper trophic, 10.6 % lipids**
12420 11060 1.344 0.893
Arnot-Gobas, upper trophic,
5 % lipids**
5804 5168 0.628 0.417
Biotrans-formation half-life normalized to 10 g fish (days)
0.56 0.52 128 4139
*) including biotransformation rate estimates
**) zero biotranformation
7.7.3.3.1 Estimation of the applicability of EPI Suite BCFBAF regression model to the
Substance
According to EPI Suite help, the BCFBAF regression model uses the non-ionic regression
models to predict BCF values for the ester constituents of the Substance. Considering the
pKa values and that the ester constituents are expected to occur in the neutral form in
relevant pH values this seems reasonable. The non-ionic training dataset includes 466
compounds. The dataset is divided into three groups based on log Kow values (log
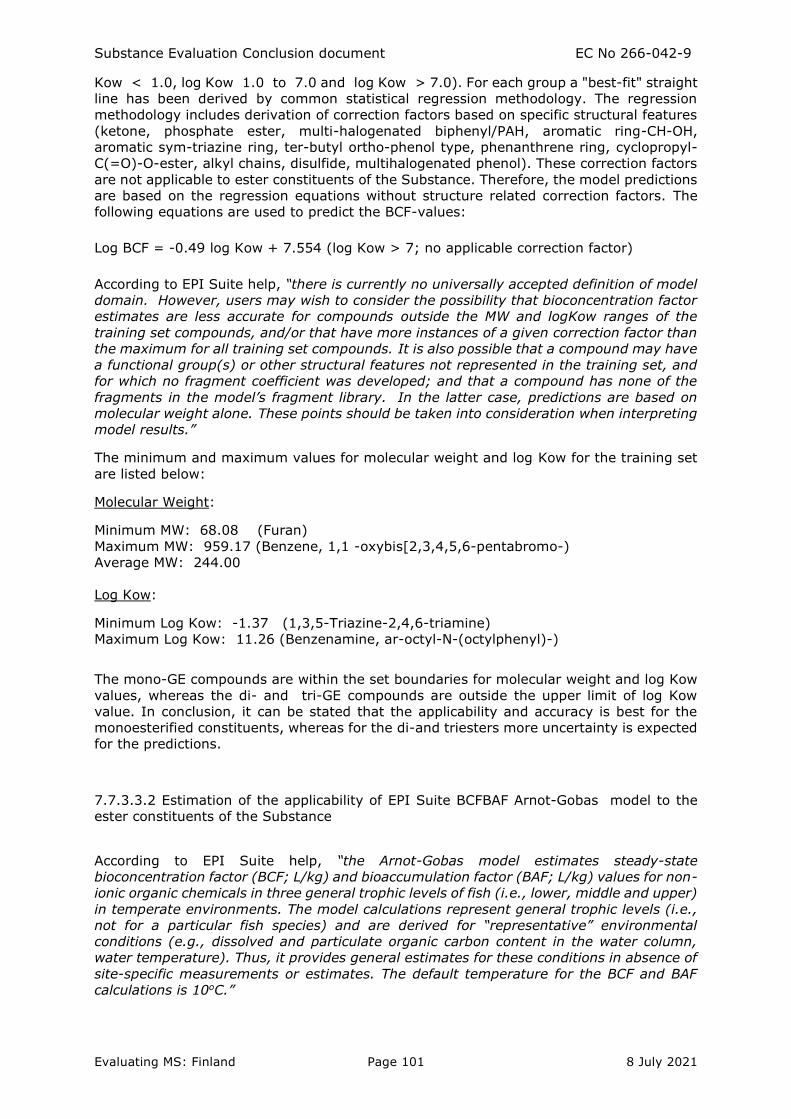
Substance Evaluation Conclusion document EC No 266-042-9
Evaluating MS: Finland Page 101 8 July 2021
Kow < 1.0, log Kow 1.0 to 7.0 and log Kow > 7.0). For each group a "best-fit" straight
line has been derived by common statistical regression methodology. The regression
methodology includes derivation of correction factors based on specific structural features
(ketone, phosphate ester, multi-halogenated biphenyl/PAH, aromatic ring-CH-OH,
aromatic sym-triazine ring, ter-butyl ortho-phenol type, phenanthrene ring, cyclopropyl-
C(=O)-O-ester, alkyl chains, disulfide, multihalogenated phenol). These correction factors
are not applicable to ester constituents of the Substance. Therefore, the model predictions
are based on the regression equations without structure related correction factors. The
following equations are used to predict the BCF-values:
Log BCF = -0.49 log Kow + 7.554 (log Kow > 7; no applicable correction factor)
According to EPI Suite help, “there is currently no universally accepted definition of model
domain. However, users may wish to consider the possibility that bioconcentration factor
estimates are less accurate for compounds outside the MW and logKow ranges of the
training set compounds, and/or that have more instances of a given correction factor than
the maximum for all training set compounds. It is also possible that a compound may have
a functional group(s) or other structural features not represented in the training set, and
for which no fragment coefficient was developed; and that a compound has none of the
fragments in the model’s fragment library. In the latter case, predictions are based on
molecular weight alone. These points should be taken into consideration when interpreting
model results.”
The minimum and maximum values for molecular weight and log Kow for the training set
are listed below:
Molecular Weight:
Minimum MW: 68.08 (Furan)
Maximum MW: 959.17 (Benzene, 1,1 -oxybis[2,3,4,5,6-pentabromo-)
Average MW: 244.00
Log Kow:
Minimum Log Kow: -1.37 (1,3,5-Triazine-2,4,6-triamine)
Maximum Log Kow: 11.26 (Benzenamine, ar-octyl-N-(octylphenyl)-)
The mono-GE compounds are within the set boundaries for molecular weight and log Kow
values, whereas the di- and tri-GE compounds are outside the upper limit of log Kow
value. In conclusion, it can be stated that the applicability and accuracy is best for the
monoesterified constituents, whereas for the di-and triesters more uncertainty is expected
for the predictions.
7.7.3.3.2 Estimation of the applicability of EPI Suite BCFBAF Arnot-Gobas model to the
ester constituents of the Substance
According to EPI Suite help, “the Arnot-Gobas model estimates steady-state
bioconcentration factor (BCF; L/kg) and bioaccumulation factor (BAF; L/kg) values for non-
ionic organic chemicals in three general trophic levels of fish (i.e., lower, middle and upper)
in temperate environments. The model calculations represent general trophic levels (i.e.,
not for a particular fish species) and are derived for “representative” environmental
conditions (e.g., dissolved and particulate organic carbon content in the water column,
water temperature). Thus, it provides general estimates for these conditions in absence of
site-specific measurements or estimates. The default temperature for the BCF and BAF
calculations is 10oC.”
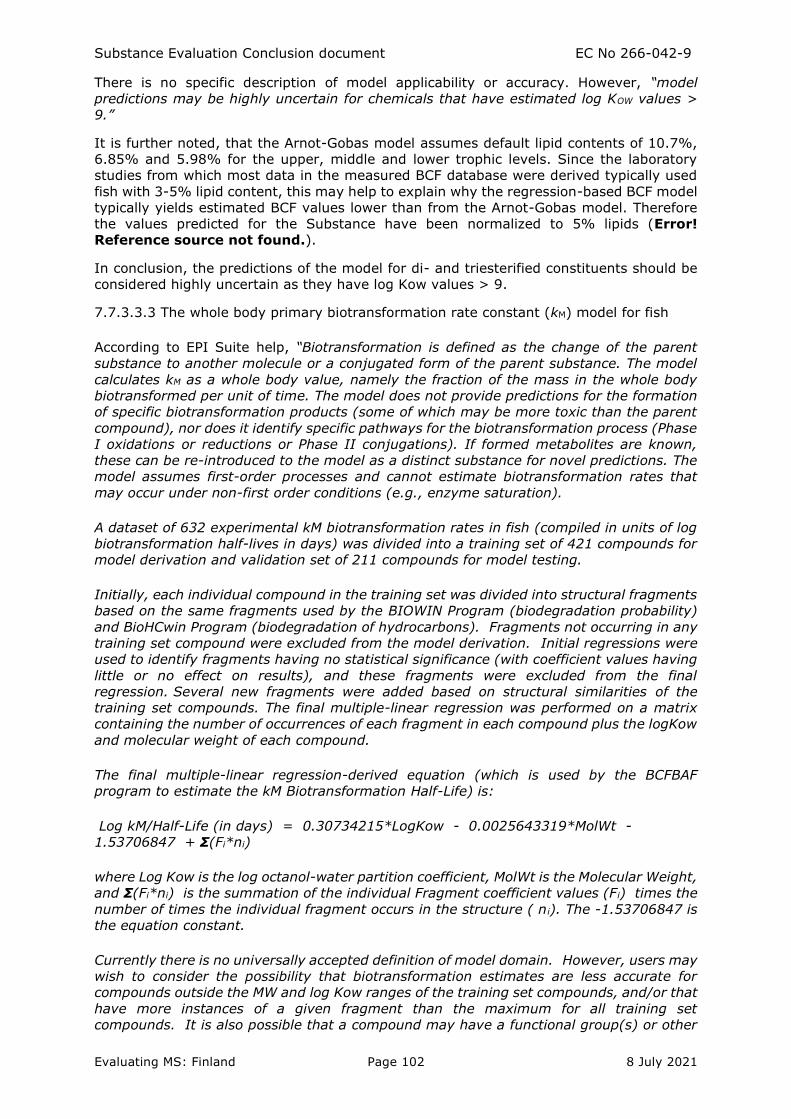
Substance Evaluation Conclusion document EC No 266-042-9
Evaluating MS: Finland Page 102 8 July 2021
There is no specific description of model applicability or accuracy. However, “model
predictions may be highly uncertain for chemicals that have estimated log KOW values >
9.”
It is further noted, that the Arnot-Gobas model assumes default lipid contents of 10.7%,
6.85% and 5.98% for the upper, middle and lower trophic levels. Since the laboratory
studies from which most data in the measured BCF database were derived typically used
fish with 3-5% lipid content, this may help to explain why the regression-based BCF model
typically yields estimated BCF values lower than from the Arnot-Gobas model. Therefore
the values predicted for the Substance have been normalized to 5% lipids (Error!
Reference source not found.).
In conclusion, the predictions of the model for di- and triesterified constituents should be
considered highly uncertain as they have log Kow values > 9.
7.7.3.3.3 The whole body primary biotransformation rate constant (kM) model for fish
According to EPI Suite help, “Biotransformation is defined as the change of the parent
substance to another molecule or a conjugated form of the parent substance. The model
calculates kM as a whole body value, namely the fraction of the mass in the whole body
biotransformed per unit of time. The model does not provide predictions for the formation
of specific biotransformation products (some of which may be more toxic than the parent
compound), nor does it identify specific pathways for the biotransformation process (Phase
I oxidations or reductions or Phase II conjugations). If formed metabolites are known,
these can be re-introduced to the model as a distinct substance for novel predictions. The
model assumes first-order processes and cannot estimate biotransformation rates that
may occur under non-first order conditions (e.g., enzyme saturation).
A dataset of 632 experimental kM biotransformation rates in fish (compiled in units of log
biotransformation half-lives in days) was divided into a training set of 421 compounds for
model derivation and validation set of 211 compounds for model testing.
Initially, each individual compound in the training set was divided into structural fragments
based on the same fragments used by the BIOWIN Program (biodegradation probability)
and BioHCwin Program (biodegradation of hydrocarbons). Fragments not occurring in any
training set compound were excluded from the model derivation. Initial regressions were
used to identify fragments having no statistical significance (with coefficient values having
little or no effect on results), and these fragments were excluded from the final
regression. Several new fragments were added based on structural similarities of the
training set compounds. The final multiple-linear regression was performed on a matrix
containing the number of occurrences of each fragment in each compound plus the logKow
and molecular weight of each compound.
The final multiple-linear regression-derived equation (which is used by the BCFBAF
program to estimate the kM Biotransformation Half-Life) is:
Log kM/Half-Life (in days) = 0.30734215*LogKow - 0.0025643319*MolWt -
1.53706847 + Σ(Fi*ni)
where Log Kow is the log octanol-water partition coefficient, MolWt is the Molecular Weight,
and Σ(Fi*ni) is the summation of the individual Fragment coefficient values (Fi) times the
number of times the individual fragment occurs in the structure ( n i). The -1.53706847 is
the equation constant.
Currently there is no universally accepted definition of model domain. However, users may
wish to consider the possibility that biotransformation estimates are less accurate for
compounds outside the MW and log Kow ranges of the training set compounds, and/or that
have more instances of a given fragment than the maximum for all training set
compounds. It is also possible that a compound may have a functional group(s) or other
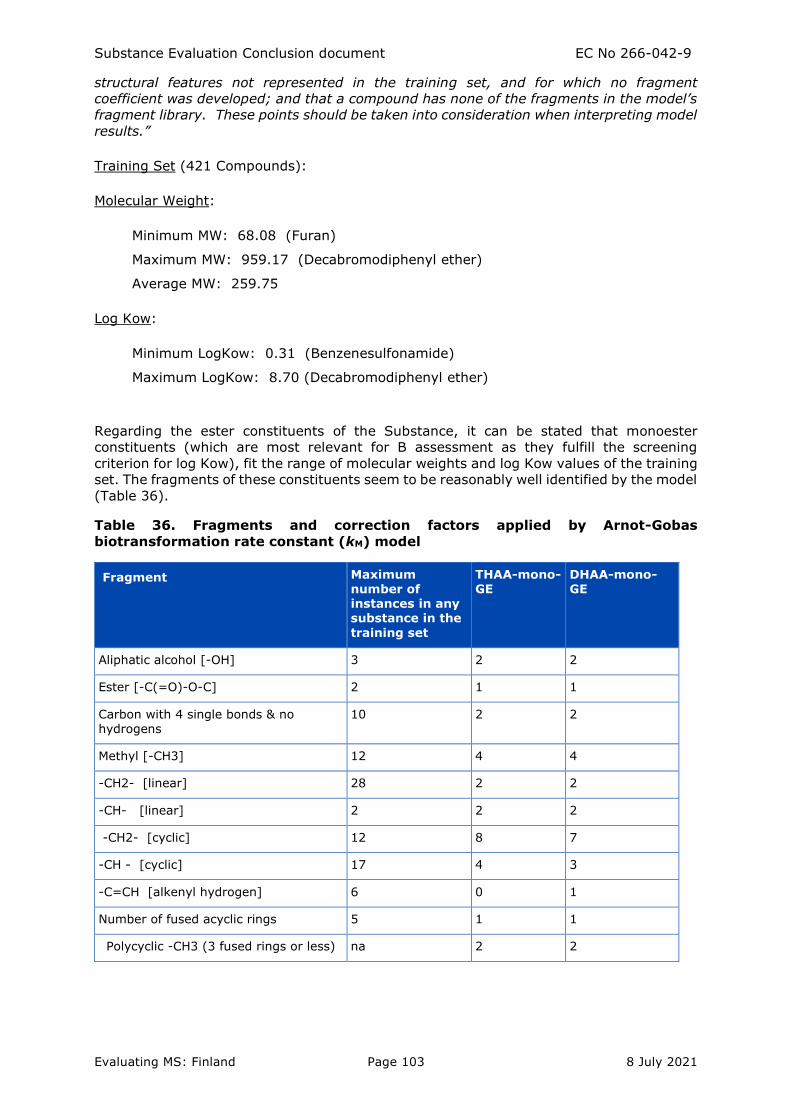
Substance Evaluation Conclusion document EC No 266-042-9
Evaluating MS: Finland Page 103 8 July 2021
structural features not represented in the training set, and for which no fragment
coefficient was developed; and that a compound has none of the fragments in the model’s
fragment library. These points should be taken into consideration when interpreting model
results.”
Training Set (421 Compounds):
Molecular Weight:
Minimum MW: 68.08 (Furan)
Maximum MW: 959.17 (Decabromodiphenyl ether)
Average MW: 259.75
Log Kow:
Minimum LogKow: 0.31 (Benzenesulfonamide)
Maximum LogKow: 8.70 (Decabromodiphenyl ether)
Regarding the ester constituents of the Substance, it can be stated that monoester
constituents (which are most relevant for B assessment as they fulfill the screening
criterion for log Kow), fit the range of molecular weights and log Kow values of the training
set. The fragments of these constituents seem to be reasonably well identified by the model
(Table 36).
Table 36. Fragments and correction factors applied by Arnot-Gobas
biotransformation rate constant (kM) model
Fragment Maximum
number of instances in any substance in the
training set
THAA-mono-
GE
DHAA-mono-
GE
Aliphatic alcohol [-OH] 3 2 2
Ester [-C(=O)-O-C] 2 1 1
Carbon with 4 single bonds & no hydrogens
10 2 2
Methyl [-CH3] 12 4 4
-CH2- [linear] 28 2 2
-CH- [linear] 2 2 2
-CH2- [cyclic] 12 8 7
-CH - [cyclic] 17 4 3
-C=CH [alkenyl hydrogen] 6 0 1
Number of fused acyclic rings 5 1 1
Polycyclic -CH3 (3 fused rings or less) na 2 2

Substance Evaluation Conclusion document EC No 266-042-9
Evaluating MS: Finland Page 104 8 July 2021
7.7.3.4 Molecular size as a limiting factor for bioaccumulation
ECHA's Guidance on information requirements and chemical safety assessment (Chapter
R.11 PBT assessment) (2017b) presents indicators that can be used to strengthen the
evidence for limited bioaccumulation potential of a substance, such as information on
molecular size (maximum molecular length (MML), average maximum diameter (Dmax
aver) or molecular weight (MW) of a substance).
The size related screening criteria indicating limited possibility of the molecules to
penetrate through the cell membranes are:
Not B: Dmax aver > 1.7 nm and MW > 1100
Not vB: Dmax aver > 1.7 nm and MW > 700
The strict cut-off values for molecular weight and size in predicting bioaccumulation
potential have been under scientific evaluation in 2000's (e.g. Dimitrov et al. 2005,
Sakuratani et al. 2008, Arnot et al. 2010). The overall conclusion is that size parameters
should be applied with caution in predicting bioaccumulation potential, as, in some cases,
large molecules with slow uptake rates may show even slower elimination rates, which
could lead to bioaccumulation. It has also been stated that the length of a needle shape
large molecule has little limiting effect on the cell uptake rate and hence the shape of
molecule should be carefully considered. Here, the molecules of the ester constituents of
the Substance are branched and especially the higher esters have large cross-sectional
diameters, which imply that size limiters can be applied with some reliability.
The molecular sizes and molecular weights presented in Table 37 indicate that the more
complete the esterification of the rosin esters is, the more reduced bioaccumulation
potential can be expected for these substances due to the slower uptake rates of the
molecules.
Based on the molecular size estimates, triesters have probably low potential for
bioaccumulation, diesters are borderline cases and monoesters can be potentially
bioaccumulable.
The (Q)SAR estimates for BCF-values also indicate that the bioaccumulation decreases with
increasing rate of esterification (and concurrently with increasing molecular size).
Table 37. Molecular sizes established for the Substance (*)
MOLECULAR SIZES
Molecular weight (g/mol) monoester
diester
triester
378.6
665.0
951.5
Molecular size,
min-max Dmax (nm)
monoester
diester
triester
1.27 - 1.90
1.59 - 3.05
1.98 - 2.72
*) Canadian POPs Model, 2008 in Environment Canada (2011)
Substance Evaluation Conclusion document EC No 266-042-9
Evaluating MS: Finland Page 105 8 July 2021
7.7.3.5 Bioaccumulation potential of the starting materials (resin acids and alcohol)
The starting alcohol, glycerol (EC 200-289-5) does not have potential to bioaccumulate,
based on the measured partition coefficient value, log Kow -1.75 (ECHA, Registered
substances database), which is well below the screening criterion of bioaccumulation (log
Kow ≥ 4.5).
The starting component hydrogenated resin (HR) (EC 266-041-3) is also not
bioaccumulable according to QSAR evaluation (EPI Suite BSFBAF v3.00). The estimated
log BCF is 0.5 (regression based method) and log BAF is 2.4 (Arnot-Gobas upper trophic
method). The measured value of log Kow 3.42 supports this estimate.
In the registration dossiers, one experimental bioaccumulation study on resin acids is
available, which shows that resin acids (abietic, dehydroabietic, chlorohydroabietic,
dichlorohydroabietic, neoabietic, pimaric, isopimaric, sandracopimaric, palustric acids) are
unlikely to bioaccumulate in fish (Niimi and Lee 1992). The relevance of this study in
assessing the bioaccumalation potential of the corresponding esters is considered low, as
there is no indication that rosin esters would significantly hydrolyse into the acid and
alcohol.
7.7.3.6 Summary and conclusions
Experimental results
Experimental study results are not available for the estimation of bioconcentration or
bioaccumulation of hydrogenated rosin esters in fish. The only available experimental study
results concerned bioaccumulation of single resin acids in fish, which is considered of
limited relevance for the assessment of rosin esters.
Modelling
The estimation of bioaccumulation potential of the Substance is based on partition
coefficients and predicted values obtained by modelling. Moreover, information on the
molecular sizes of the substances was taken into account in comparison with the screening
criteria.
Bioconcentration/bioaccumulation has been estimated using (Q)SAR estimation software
(EPI Suite BCFBAF v3.01), in accordance with REACH Annex XI.
The (Q)SAR estimates show variation in bioaccumulation in relation to the level of
esterification of the substances. In general, the higher the level of esterification, the lower
the bioaccumulation potential, which is supported also by the water solubility estimates
and is in line with the values of log Kow > 10 for di- and triesters (Table 9) and the
molecular sizes (Table 37). The results suggest that the B/vB criteria (BCF > 2000/5000)
are probably not fulfilled for the ester constituents of the Substance, when the
biotransformation rate estimates are taken into account (Error! Reference source not
found.). This is supported by the experimental results of bioaccumulation potential and
short depuration half-lives of single resin acids (Niimi and Lee 1992).
The predicted BCF/BAF values contain uncertainties for poorly soluble substances and large
molecules, and hence the actual B/vB estimation should be based on experimental data.
Substance Evaluation Conclusion document EC No 266-042-9
Evaluating MS: Finland Page 106 8 July 2021
7.8. Environmental hazard assessment
The evaluation of potential environmental toxicity of the Substnace is based on short-term
aquatic toxicity available for the Substance and/or structural analogues of the same
category of rosin esters. The experimental information concerned only the registered UVCB
substances as such and no constituent related information was available.
The experimental toxicity data was compared to the PBT/vPvB criteria given in the PBT
guidance (ECHA 2017b).
The screening criteria for toxicity are the following:
Type of screening information Criterion Conclusion
Short-term aquatic toxicity
(algae, daphnia, fish)
EC50 or LC50 < 0.01
mg/L
T, criterion considered to
be definitely fulfilled
Short-term aquatic toxicity
(algae, daphnia, fish)
EC50 or LC50 < 0.1 mg/L Potentially T
The given definitive criterion for environmental toxicity is:
Property PBT-criterion
Toxicity NOEC (long-term) < 0.01
mg/L for marine or
freshwater organisms,
In addition, model predictions were compiled for the representative constituents of the
Substance, but the applicability of the model was restricted by the low water solubility and
high lipophilicity of these substances.
7.8.1. Aquatic compartment (including sediment)
7.8.1.1. Fish
7.8.1.1.1 Short-term toxicity to fish
Five experimental studies were available on short-term toxicity to fish for several
chemically related rosin esters belonging to the same structural category, of which two
were considered not reliable (Klimisch 3) in the registration information, because the
exposure solutions were prepared as dilutions of single water accommodated fraction
(WAF), instead of preparing individual WAF for each concentration as required in the test
guidance.
The results showed no short-term toxicity to fish caused by rosin esters (see table below),
and the short-term toxicity screening criterion for PBT (E/LC50 < 0.1 mg/L) was not met
in any of the studies.
Table 38. Overview of short-term effects on fish (reliability rating by the
registrant(s))
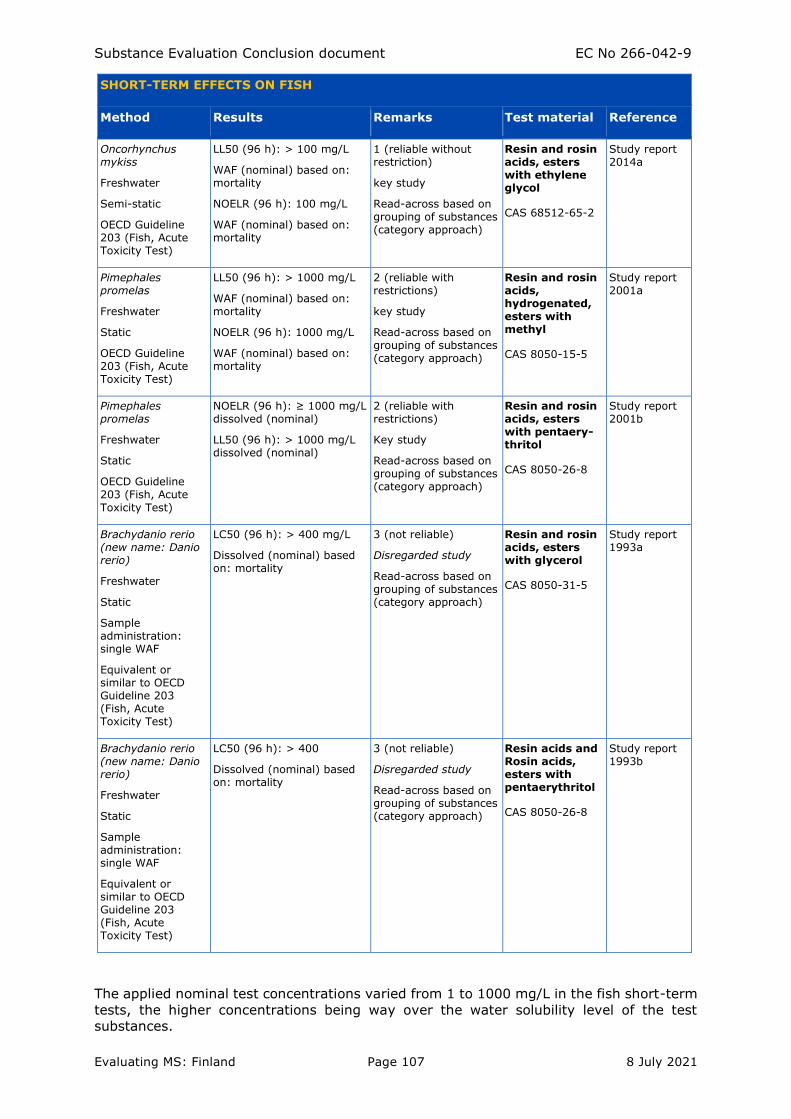
Substance Evaluation Conclusion document EC No 266-042-9
Evaluating MS: Finland Page 107 8 July 2021
SHORT-TERM EFFECTS ON FISH
Method Results Remarks Test material Reference
Oncorhynchus mykiss
Freshwater
Semi-static
OECD Guideline 203 (Fish, Acute Toxicity Test)
LL50 (96 h): > 100 mg/L
WAF (nominal) based on: mortality
NOELR (96 h): 100 mg/L
WAF (nominal) based on: mortality
1 (reliable without restriction)
key study
Read-across based on grouping of substances (category approach)
Resin and rosin acids, esters with ethylene glycol
CAS 68512-65-2
Study report 2014a
Pimephales promelas
Freshwater
Static
OECD Guideline 203 (Fish, Acute Toxicity Test)
LL50 (96 h): > 1000 mg/L
WAF (nominal) based on: mortality
NOELR (96 h): 1000 mg/L
WAF (nominal) based on: mortality
2 (reliable with restrictions)
key study
Read-across based on grouping of substances (category approach)
Resin and rosin acids, hydrogenated, esters with methyl
CAS 8050-15-5
Study report 2001a
Pimephales promelas
Freshwater
Static
OECD Guideline 203 (Fish, Acute
Toxicity Test)
NOELR (96 h): ≥ 1000 mg/L dissolved (nominal)
LL50 (96 h): > 1000 mg/L dissolved (nominal)
2 (reliable with restrictions)
Key study
Read-across based on grouping of substances (category approach)
Resin and rosin acids, esters with pentaery-thritol
CAS 8050-26-8
Study report 2001b
Brachydanio rerio (new name: Danio rerio)
Freshwater
Static
Sample administration: single WAF
Equivalent or similar to OECD Guideline 203 (Fish, Acute Toxicity Test)
LC50 (96 h): > 400 mg/L
Dissolved (nominal) based on: mortality
3 (not reliable)
Disregarded study
Read-across based on grouping of substances (category approach)
Resin and rosin acids, esters with glycerol
CAS 8050-31-5
Study report 1993a
Brachydanio rerio (new name: Danio rerio)
Freshwater
Static
Sample administration: single WAF
Equivalent or similar to OECD Guideline 203 (Fish, Acute Toxicity Test)
LC50 (96 h): > 400
Dissolved (nominal) based on: mortality
3 (not reliable)
Disregarded study
Read-across based on grouping of substances (category approach)
Resin acids and Rosin acids, esters with pentaerythritol
CAS 8050-26-8
Study report 1993b
The applied nominal test concentrations varied from 1 to 1000 mg/L in the fish short-term
tests, the higher concentrations being way over the water solubility level of the test
substances.
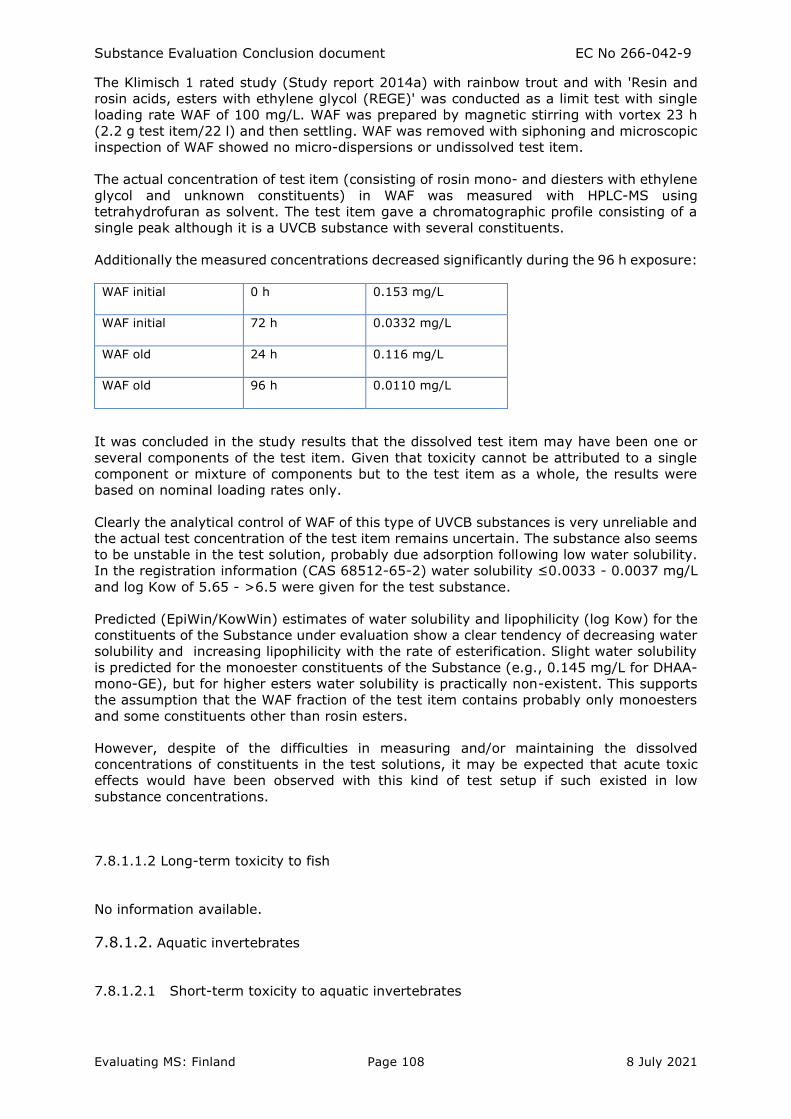
Substance Evaluation Conclusion document EC No 266-042-9
Evaluating MS: Finland Page 108 8 July 2021
The Klimisch 1 rated study (Study report 2014a) with rainbow trout and with 'Resin and
rosin acids, esters with ethylene glycol (REGE)' was conducted as a limit test with single
loading rate WAF of 100 mg/L. WAF was prepared by magnetic stirring with vortex 23 h
(2.2 g test item/22 l) and then settling. WAF was removed with siphoning and microscopic
inspection of WAF showed no micro-dispersions or undissolved test item.
The actual concentration of test item (consisting of rosin mono- and diesters with ethylene
glycol and unknown constituents) in WAF was measured with HPLC-MS using
tetrahydrofuran as solvent. The test item gave a chromatographic profile consisting of a
single peak although it is a UVCB substance with several constituents.
Additionally the measured concentrations decreased significantly during the 96 h exposure:
WAF initial 0 h 0.153 mg/L
WAF initial 72 h 0.0332 mg/L
WAF old 24 h 0.116 mg/L
WAF old 96 h 0.0110 mg/L
It was concluded in the study results that the dissolved test item may have been one or
several components of the test item. Given that toxicity cannot be attributed to a single
component or mixture of components but to the test item as a whole, the results were
based on nominal loading rates only.
Clearly the analytical control of WAF of this type of UVCB substances is very unreliable and
the actual test concentration of the test item remains uncertain. The substance also seems
to be unstable in the test solution, probably due adsorption following low water solubility.
In the registration information (CAS 68512-65-2) water solubility ≤0.0033 - 0.0037 mg/L
and log Kow of 5.65 - >6.5 were given for the test substance.
Predicted (EpiWin/KowWin) estimates of water solubility and lipophilicity (log Kow) for the
constituents of the Substance under evaluation show a clear tendency of decreasing water
solubility and increasing lipophilicity with the rate of esterification. Slight water solubility
is predicted for the monoester constituents of the Substance (e.g., 0.145 mg/L for DHAA-
mono-GE), but for higher esters water solubility is practically non-existent. This supports
the assumption that the WAF fraction of the test item contains probably only monoesters
and some constituents other than rosin esters.
However, despite of the difficulties in measuring and/or maintaining the dissolved
concentrations of constituents in the test solutions, it may be expected that acute toxic
effects would have been observed with this kind of test setup if such existed in low
substance concentrations.
7.8.1.1.2 Long-term toxicity to fish
No information available.
7.8.1.2. Aquatic invertebrates
7.8.1.2.1 Short-term toxicity to aquatic invertebrates
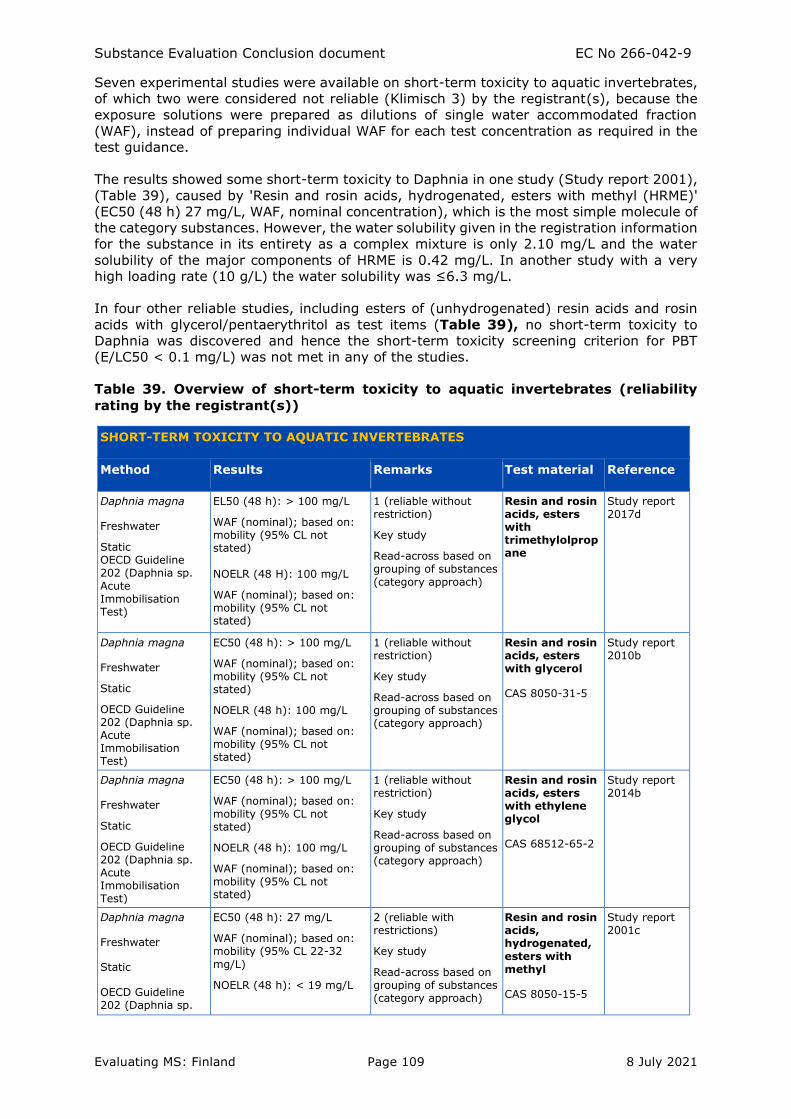
Substance Evaluation Conclusion document EC No 266-042-9
Evaluating MS: Finland Page 109 8 July 2021
Seven experimental studies were available on short-term toxicity to aquatic invertebrates,
of which two were considered not reliable (Klimisch 3) by the registrant(s), because the
exposure solutions were prepared as dilutions of single water accommodated fraction
(WAF), instead of preparing individual WAF for each test concentration as required in the
test guidance.
The results showed some short-term toxicity to Daphnia in one study (Study report 2001),
(Table 39), caused by 'Resin and rosin acids, hydrogenated, esters with methyl (HRME)'
(EC50 (48 h) 27 mg/L, WAF, nominal concentration), which is the most simple molecule of
the category substances. However, the water solubility given in the registration information
for the substance in its entirety as a complex mixture is only 2.10 mg/L and the water
solubility of the major components of HRME is 0.42 mg/L. In another study with a very
high loading rate (10 g/L) the water solubility was ≤6.3 mg/L.
In four other reliable studies, including esters of (unhydrogenated) resin acids and rosin
acids with glycerol/pentaerythritol as test items (Table 39), no short-term toxicity to
Daphnia was discovered and hence the short-term toxicity screening criterion for PBT
(E/LC50 < 0.1 mg/L) was not met in any of the studies.
Table 39. Overview of short-term toxicity to aquatic invertebrates (reliability
rating by the registrant(s))
SHORT-TERM TOXICITY TO AQUATIC INVERTEBRATES
Method Results Remarks Test material Reference
Daphnia magna
Freshwater
Static OECD Guideline 202 (Daphnia sp.
Acute Immobilisation Test)
EL50 (48 h): > 100 mg/L
WAF (nominal); based on: mobility (95% CL not stated)
NOELR (48 H): 100 mg/L
WAF (nominal); based on: mobility (95% CL not stated)
1 (reliable without restriction)
Key study
Read-across based on grouping of substances
(category approach)
Resin and rosin acids, esters with trimethylolpropane
Study report 2017d
Daphnia magna
Freshwater
Static
OECD Guideline 202 (Daphnia sp. Acute Immobilisation Test)
EC50 (48 h): > 100 mg/L
WAF (nominal); based on: mobility (95% CL not stated)
NOELR (48 h): 100 mg/L
WAF (nominal); based on: mobility (95% CL not stated)
1 (reliable without restriction)
Key study
Read-across based on grouping of substances (category approach)
Resin and rosin acids, esters with glycerol
CAS 8050-31-5
Study report 2010b
Daphnia magna
Freshwater
Static
OECD Guideline 202 (Daphnia sp. Acute Immobilisation Test)
EC50 (48 h): > 100 mg/L
WAF (nominal); based on: mobility (95% CL not stated)
NOELR (48 h): 100 mg/L
WAF (nominal); based on: mobility (95% CL not stated)
1 (reliable without restriction)
Key study
Read-across based on grouping of substances (category approach)
Resin and rosin acids, esters with ethylene glycol
CAS 68512-65-2
Study report 2014b
Daphnia magna
Freshwater
Static
OECD Guideline 202 (Daphnia sp.
EC50 (48 h): 27 mg/L
WAF (nominal); based on: mobility (95% CL 22-32
mg/L)
NOELR (48 h): < 19 mg/L
2 (reliable with restrictions)
Key study
Read-across based on grouping of substances (category approach)
Resin and rosin acids, hydrogenated,
esters with methyl
CAS 8050-15-5
Study report 2001c
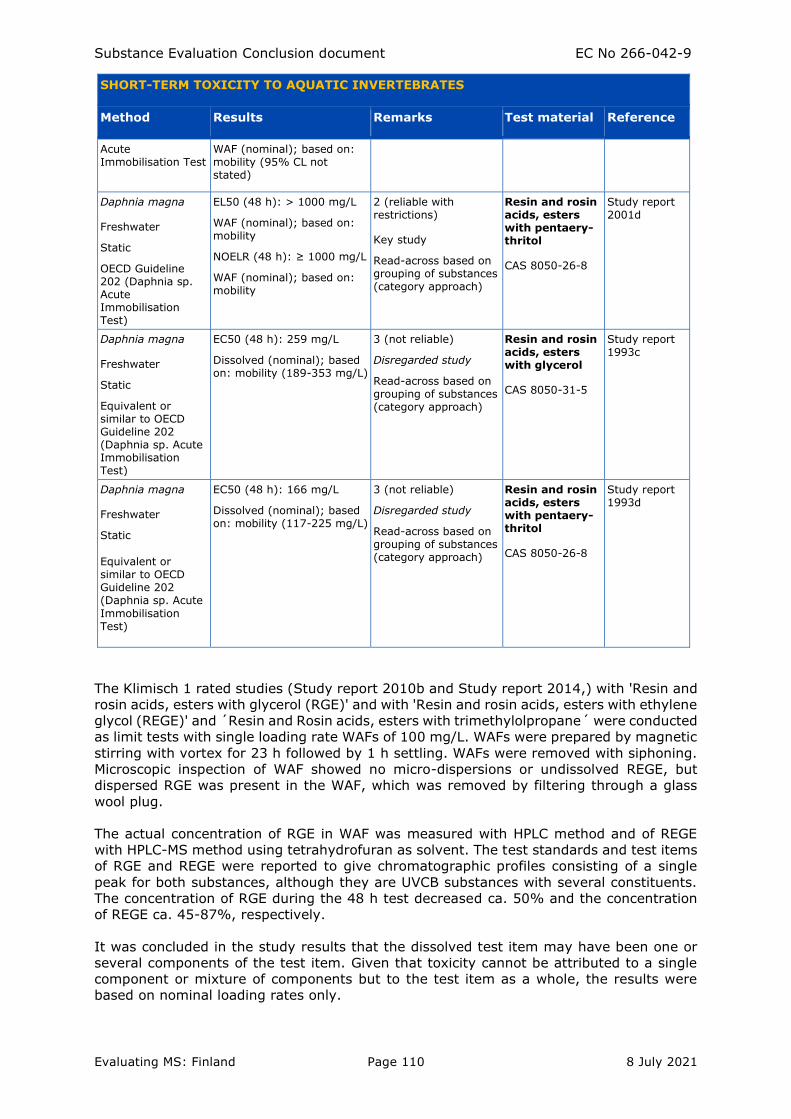
Substance Evaluation Conclusion document EC No 266-042-9
Evaluating MS: Finland Page 110 8 July 2021
SHORT-TERM TOXICITY TO AQUATIC INVERTEBRATES
Method Results Remarks Test material Reference
Acute Immobilisation Test
WAF (nominal); based on: mobility (95% CL not stated)
Daphnia magna
Freshwater
Static
OECD Guideline 202 (Daphnia sp. Acute Immobilisation Test)
EL50 (48 h): > 1000 mg/L
WAF (nominal); based on: mobility
NOELR (48 h): ≥ 1000 mg/L
WAF (nominal); based on: mobility
2 (reliable with restrictions)
Key study
Read-across based on grouping of substances (category approach)
Resin and rosin acids, esters with pentaery-thritol
CAS 8050-26-8
Study report 2001d
Daphnia magna
Freshwater
Static
Equivalent or similar to OECD Guideline 202 (Daphnia sp. Acute Immobilisation Test)
EC50 (48 h): 259 mg/L
Dissolved (nominal); based on: mobility (189-353 mg/L)
3 (not reliable)
Disregarded study
Read-across based on grouping of substances (category approach)
Resin and rosin acids, esters with glycerol
CAS 8050-31-5
Study report 1993c
Daphnia magna
Freshwater
Static
Equivalent or similar to OECD Guideline 202 (Daphnia sp. Acute
Immobilisation Test)
EC50 (48 h): 166 mg/L
Dissolved (nominal); based on: mobility (117-225 mg/L)
3 (not reliable)
Disregarded study
Read-across based on grouping of substances (category approach)
Resin and rosin acids, esters with pentaery-thritol
CAS 8050-26-8
Study report 1993d
The Klimisch 1 rated studies (Study report 2010b and Study report 2014,) with 'Resin and
rosin acids, esters with glycerol (RGE)' and with 'Resin and rosin acids, esters with ethylene
glycol (REGE)' and ́ Resin and Rosin acids, esters with trimethylolpropane´ were conducted
as limit tests with single loading rate WAFs of 100 mg/L. WAFs were prepared by magnetic
stirring with vortex for 23 h followed by 1 h settling. WAFs were removed with siphoning.
Microscopic inspection of WAF showed no micro-dispersions or undissolved REGE, but
dispersed RGE was present in the WAF, which was removed by filtering through a glass
wool plug.
The actual concentration of RGE in WAF was measured with HPLC method and of REGE
with HPLC-MS method using tetrahydrofuran as solvent. The test standards and test items
of RGE and REGE were reported to give chromatographic profiles consisting of a single
peak for both substances, although they are UVCB substances with several constituents.
The concentration of RGE during the 48 h test decreased ca. 50% and the concentration
of REGE ca. 45-87%, respectively.
It was concluded in the study results that the dissolved test item may have been one or
several components of the test item. Given that toxicity cannot be attributed to a single
component or mixture of components but to the test item as a whole, the results were
based on nominal loading rates only.
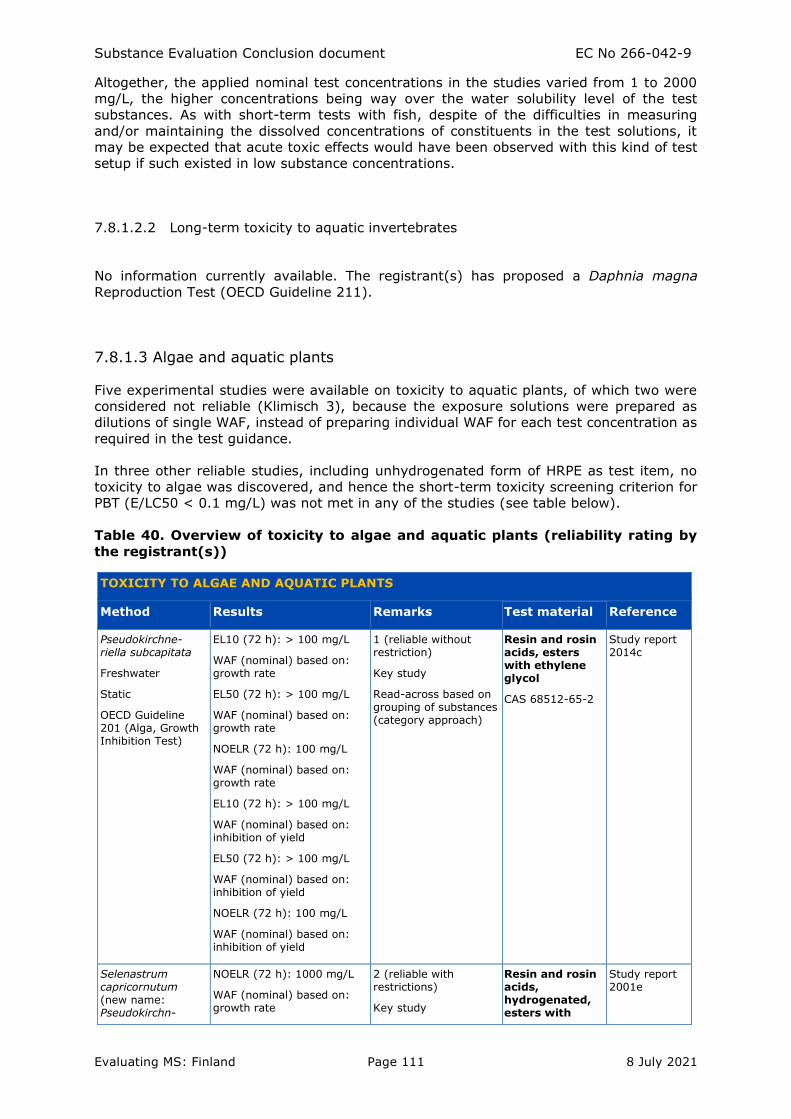
Substance Evaluation Conclusion document EC No 266-042-9
Evaluating MS: Finland Page 111 8 July 2021
Altogether, the applied nominal test concentrations in the studies varied from 1 to 2000
mg/L, the higher concentrations being way over the water solubility level of the test
substances. As with short-term tests with fish, despite of the difficulties in measuring
and/or maintaining the dissolved concentrations of constituents in the test solutions, it
may be expected that acute toxic effects would have been observed with this kind of test
setup if such existed in low substance concentrations.
7.8.1.2.2 Long-term toxicity to aquatic invertebrates
No information currently available. The registrant(s) has proposed a Daphnia magna
Reproduction Test (OECD Guideline 211).
7.8.1.3 Algae and aquatic plants
Five experimental studies were available on toxicity to aquatic plants, of which two were
considered not reliable (Klimisch 3), because the exposure solutions were prepared as
dilutions of single WAF, instead of preparing individual WAF for each test concentration as
required in the test guidance.
In three other reliable studies, including unhydrogenated form of HRPE as test item, no
toxicity to algae was discovered, and hence the short-term toxicity screening criterion for
PBT (E/LC50 < 0.1 mg/L) was not met in any of the studies (see table below).
Table 40. Overview of toxicity to algae and aquatic plants (reliability rating by
the registrant(s))
TOXICITY TO ALGAE AND AQUATIC PLANTS
Method Results Remarks Test material Reference
Pseudokirchne-riella subcapitata
Freshwater
Static
OECD Guideline 201 (Alga, Growth Inhibition Test)
EL10 (72 h): > 100 mg/L
WAF (nominal) based on: growth rate
EL50 (72 h): > 100 mg/L
WAF (nominal) based on: growth rate
NOELR (72 h): 100 mg/L
WAF (nominal) based on: growth rate
EL10 (72 h): > 100 mg/L
WAF (nominal) based on: inhibition of yield
EL50 (72 h): > 100 mg/L
WAF (nominal) based on: inhibition of yield
NOELR (72 h): 100 mg/L
WAF (nominal) based on: inhibition of yield
1 (reliable without restriction)
Key study
Read-across based on grouping of substances (category approach)
Resin and rosin acids, esters with ethylene glycol
CAS 68512-65-2
Study report 2014c
Selenastrum capricornutum (new name: Pseudokirchn-
NOELR (72 h): 1000 mg/L
WAF (nominal) based on: growth rate
2 (reliable with restrictions)
Key study
Resin and rosin acids, hydrogenated, esters with
Study report 2001e
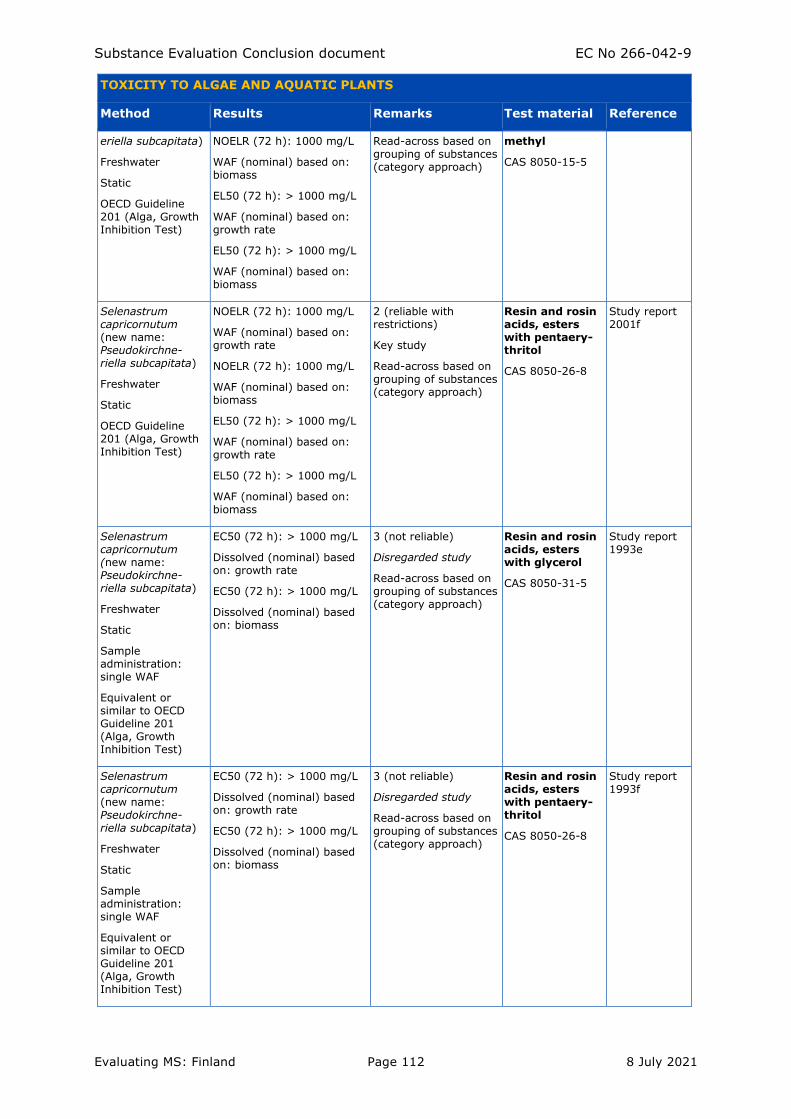
Substance Evaluation Conclusion document EC No 266-042-9
Evaluating MS: Finland Page 112 8 July 2021
TOXICITY TO ALGAE AND AQUATIC PLANTS
Method Results Remarks Test material Reference
eriella subcapitata)
Freshwater
Static
OECD Guideline 201 (Alga, Growth Inhibition Test)
NOELR (72 h): 1000 mg/L
WAF (nominal) based on: biomass
EL50 (72 h): > 1000 mg/L
WAF (nominal) based on: growth rate
EL50 (72 h): > 1000 mg/L
WAF (nominal) based on: biomass
Read-across based on grouping of substances (category approach)
methyl
CAS 8050-15-5
Selenastrum capricornutum (new name: Pseudokirchne-riella subcapitata)
Freshwater
Static
OECD Guideline 201 (Alga, Growth Inhibition Test)
NOELR (72 h): 1000 mg/L
WAF (nominal) based on: growth rate
NOELR (72 h): 1000 mg/L
WAF (nominal) based on: biomass
EL50 (72 h): > 1000 mg/L
WAF (nominal) based on: growth rate
EL50 (72 h): > 1000 mg/L
WAF (nominal) based on: biomass
2 (reliable with restrictions)
Key study
Read-across based on grouping of substances (category approach)
Resin and rosin acids, esters with pentaery-thritol
CAS 8050-26-8
Study report 2001f
Selenastrum capricornutum (new name: Pseudokirchne-riella subcapitata)
Freshwater
Static
Sample administration: single WAF
Equivalent or similar to OECD Guideline 201 (Alga, Growth Inhibition Test)
EC50 (72 h): > 1000 mg/L
Dissolved (nominal) based on: growth rate
EC50 (72 h): > 1000 mg/L
Dissolved (nominal) based on: biomass
3 (not reliable)
Disregarded study
Read-across based on grouping of substances (category approach)
Resin and rosin acids, esters with glycerol
CAS 8050-31-5
Study report 1993e
Selenastrum capricornutum (new name: Pseudokirchne-riella subcapitata)
Freshwater
Static
Sample administration: single WAF
Equivalent or similar to OECD Guideline 201 (Alga, Growth Inhibition Test)
EC50 (72 h): > 1000 mg/L
Dissolved (nominal) based on: growth rate
EC50 (72 h): > 1000 mg/L
Dissolved (nominal) based on: biomass
3 (not reliable)
Disregarded study
Read-across based on grouping of substances (category approach)
Resin and rosin acids, esters with pentaery-thritol
CAS 8050-26-8
Study report 1993f
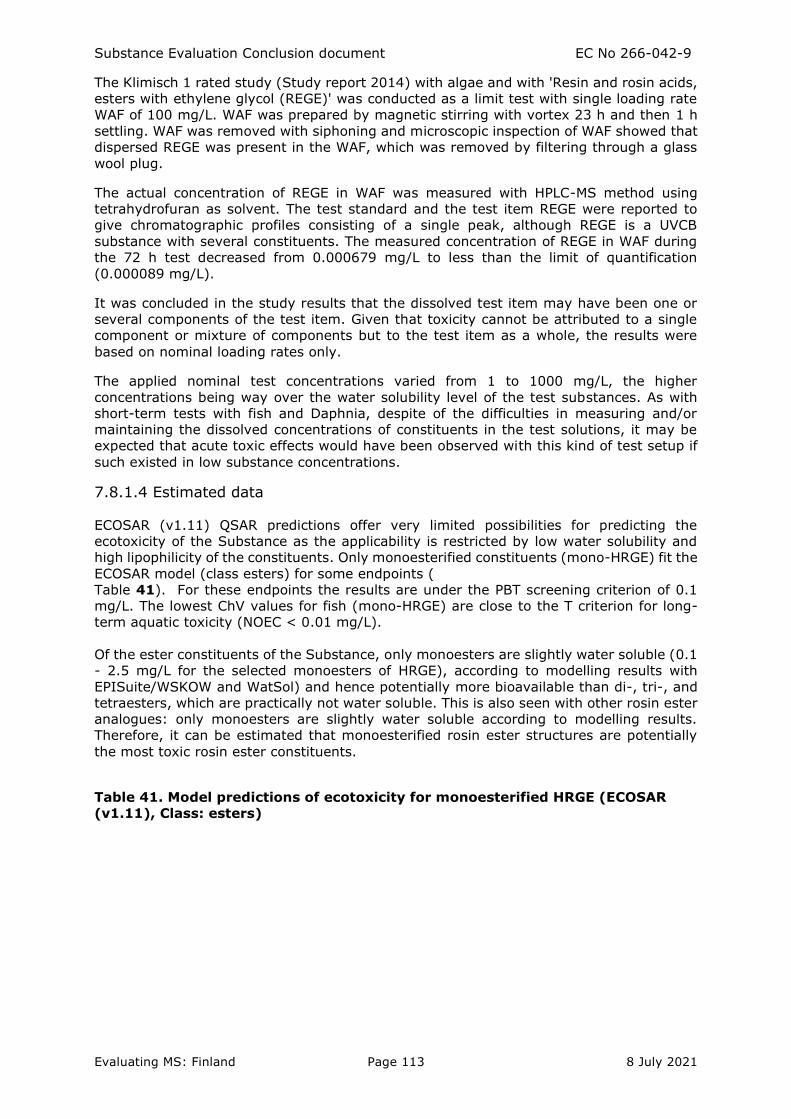
Substance Evaluation Conclusion document EC No 266-042-9
Evaluating MS: Finland Page 113 8 July 2021
The Klimisch 1 rated study (Study report 2014) with algae and with 'Resin and rosin acids,
esters with ethylene glycol (REGE)' was conducted as a limit test with single loading rate
WAF of 100 mg/L. WAF was prepared by magnetic stirring with vortex 23 h and then 1 h
settling. WAF was removed with siphoning and microscopic inspection of WAF showed that
dispersed REGE was present in the WAF, which was removed by filtering through a glass
wool plug.
The actual concentration of REGE in WAF was measured with HPLC-MS method using
tetrahydrofuran as solvent. The test standard and the test item REGE were reported to
give chromatographic profiles consisting of a single peak, although REGE is a UVCB
substance with several constituents. The measured concentration of REGE in WAF during
the 72 h test decreased from 0.000679 mg/L to less than the limit of quantification
(0.000089 mg/L).
It was concluded in the study results that the dissolved test item may have been one or
several components of the test item. Given that toxicity cannot be attributed to a single
component or mixture of components but to the test item as a whole, the results were
based on nominal loading rates only.
The applied nominal test concentrations varied from 1 to 1000 mg/L, the higher
concentrations being way over the water solubility level of the test substances. As with
short-term tests with fish and Daphnia, despite of the difficulties in measuring and/or
maintaining the dissolved concentrations of constituents in the test solutions, it may be
expected that acute toxic effects would have been observed with this kind of test setup if
such existed in low substance concentrations.
7.8.1.4 Estimated data
ECOSAR (v1.11) QSAR predictions offer very limited possibilities for predicting the
ecotoxicity of the Substance as the applicability is restricted by low water solubility and
high lipophilicity of the constituents. Only monoesterified constituents (mono-HRGE) fit the
ECOSAR model (class esters) for some endpoints (
Table 41). For these endpoints the results are under the PBT screening criterion of 0.1
mg/L. The lowest ChV values for fish (mono-HRGE) are close to the T criterion for long-
term aquatic toxicity (NOEC < 0.01 mg/L).
Of the ester constituents of the Substance, only monoesters are slightly water soluble (0.1
- 2.5 mg/L for the selected monoesters of HRGE), according to modelling results with
EPISuite/WSKOW and WatSol) and hence potentially more bioavailable than di-, tri-, and
tetraesters, which are practically not water soluble. This is also seen with other rosin ester
analogues: only monoesters are slightly water soluble according to modelling results.
Therefore, it can be estimated that monoesterified rosin ester structures are potentially
the most toxic rosin ester constituents.
Table 41. Model predictions of ecotoxicity for monoesterified HRGE (ECOSAR
(v1.11), Class: esters)
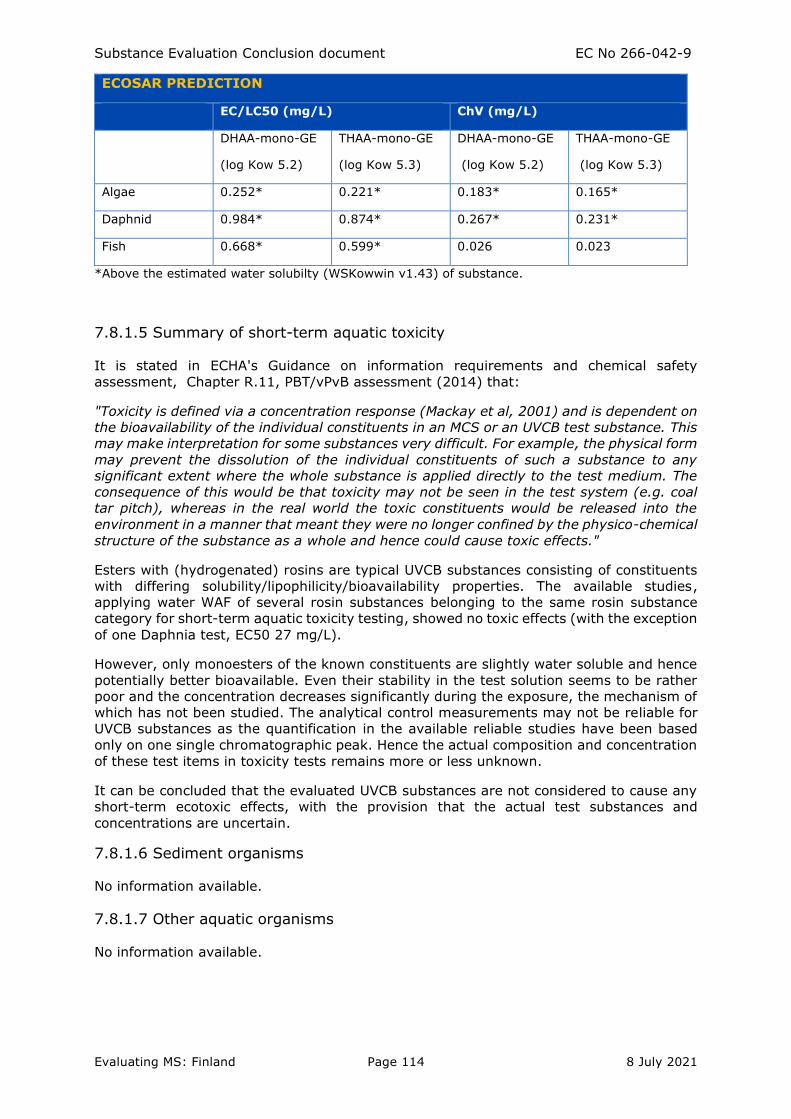
Substance Evaluation Conclusion document EC No 266-042-9
Evaluating MS: Finland Page 114 8 July 2021
ECOSAR PREDICTION
EC/LC50 (mg/L) ChV (mg/L)
DHAA-mono-GE
(log Kow 5.2)
THAA-mono-GE
(log Kow 5.3)
DHAA-mono-GE
(log Kow 5.2)
THAA-mono-GE
(log Kow 5.3)
Algae 0.252* 0.221* 0.183* 0.165*
Daphnid 0.984* 0.874* 0.267* 0.231*
Fish 0.668* 0.599* 0.026 0.023
*Above the estimated water solubilty (WSKowwin v1.43) of substance.
7.8.1.5 Summary of short-term aquatic toxicity
It is stated in ECHA's Guidance on information requirements and chemical safety
assessment, Chapter R.11, PBT/vPvB assessment (2014) that:
"Toxicity is defined via a concentration response (Mackay et al, 2001) and is dependent on
the bioavailability of the individual constituents in an MCS or an UVCB test substance. This
may make interpretation for some substances very difficult. For example, the physical form
may prevent the dissolution of the individual constituents of such a substance to any
significant extent where the whole substance is applied directly to the test medium. The
consequence of this would be that toxicity may not be seen in the test system (e.g. coal
tar pitch), whereas in the real world the toxic constituents would be released into the
environment in a manner that meant they were no longer confined by the physico-chemical
structure of the substance as a whole and hence could cause toxic effects."
Esters with (hydrogenated) rosins are typical UVCB substances consisting of constituents
with differing solubility/lipophilicity/bioavailability properties. The available studies,
applying water WAF of several rosin substances belonging to the same rosin substance
category for short-term aquatic toxicity testing, showed no toxic effects (with the exception
of one Daphnia test, EC50 27 mg/L).
However, only monoesters of the known constituents are slightly water soluble and hence
potentially better bioavailable. Even their stability in the test solution seems to be rather
poor and the concentration decreases significantly during the exposure, the mechanism of
which has not been studied. The analytical control measurements may not be reliable for
UVCB substances as the quantification in the available reliable studies have been based
only on one single chromatographic peak. Hence the actual composition and concentration
of these test items in toxicity tests remains more or less unknown.
It can be concluded that the evaluated UVCB substances are not considered to cause any
short-term ecotoxic effects, with the provision that the actual test substances and
concentrations are uncertain.
7.8.1.6 Sediment organisms
No information available.
7.8.1.7 Other aquatic organisms
No information available.
Substance Evaluation Conclusion document EC No 266-042-9
Evaluating MS: Finland Page 115 8 July 2021
7.8.2. Terrestrial compartment
No information available.
7.8.3. Microbiological activity in sewage treatment systems
Not evaluated.
7.8.4. PNEC derivation and other hazard conclusions
Not evaluated.
7.8.5. Conclusions for classification and labelling
Not evaluated.
7.9 Human Health hazard assessment
The human health hazard assessment is based on available information on a number of
studies on toxicokinetics (rat), repeated dose toxicity (rat), mutagenicity/genotoxicity
(bacteria, mammalian cells) and toxicity to reproduction (rat). No carcinogenicity studies
were available, and a pre-natal developmental toxicity study (PNDT) is under way. The
UVCB substances tested belonged to the rosin ester category and were applied as such.
The experimental information was compared to the toxicity criteria for human health given
in the PBT guidance (ECHA 2017b) for PBT assessment.
The PBT-criteria for human health toxicity are the following:
Property PBT-criteria
Toxicity − substance is classified as carcinogenic (category 1A or 1B),
germ cell mutagenic (category 1A or 1B), or toxic for
reproduction (category 1A, 1B or 2), or
− there is other evidence of chronic toxicity, as identified by the
classifications: STOT (repeated exposure), category 1 (oral,
dermal, inhalation of gases/vapours, inhalation of
dust/mist/fume) or category 2 (oral, dermal, inhalation of
gases/vapours, inhalation of dust/mist/fume) according to the
CLP Regulation.
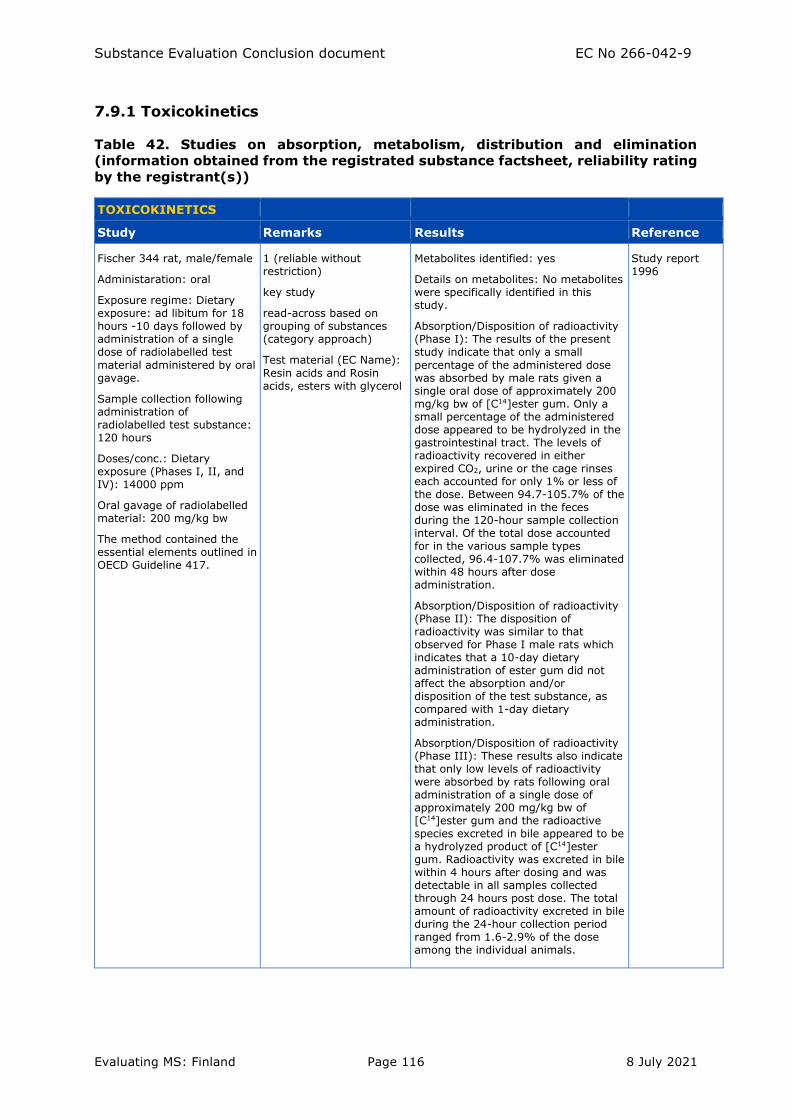
Substance Evaluation Conclusion document EC No 266-042-9
Evaluating MS: Finland Page 116 8 July 2021
7.9.1 Toxicokinetics
Table 42. Studies on absorption, metabolism, distribution and elimination
(information obtained from the registrated substance factsheet, reliability rating
by the registrant(s))
TOXICOKINETICS
Study Remarks Results Reference
Fischer 344 rat, male/female
Administaration: oral
Exposure regime: Dietary exposure: ad libitum for 18 hours -10 days followed by administration of a single dose of radiolabelled test
material administered by oral gavage.
Sample collection following administration of radiolabelled test substance: 120 hours
Doses/conc.: Dietary exposure (Phases I, II, and IV): 14000 ppm
Oral gavage of radiolabelled material: 200 mg/kg bw
The method contained the essential elements outlined in OECD Guideline 417.
1 (reliable without restriction)
key study
read-across based on grouping of substances (category approach)
Test material (EC Name):
Resin acids and Rosin acids, esters with glycerol
Metabolites identified: yes
Details on metabolites: No metabolites were specifically identified in this study.
Absorption/Disposition of radioactivity (Phase I): The results of the present study indicate that only a small
percentage of the administered dose was absorbed by male rats given a single oral dose of approximately 200 mg/kg bw of [C14]ester gum. Only a small percentage of the administered dose appeared to be hydrolyzed in the gastrointestinal tract. The levels of radioactivity recovered in either expired CO2, urine or the cage rinses each accounted for only 1% or less of the dose. Between 94.7-105.7% of the dose was eliminated in the feces during the 120-hour sample collection interval. Of the total dose accounted for in the various sample types collected, 96.4-107.7% was eliminated within 48 hours after dose administration.
Absorption/Disposition of radioactivity (Phase II): The disposition of radioactivity was similar to that observed for Phase I male rats which indicates that a 10-day dietary administration of ester gum did not affect the absorption and/or disposition of the test substance, as compared with 1-day dietary administration.
Absorption/Disposition of radioactivity (Phase III): These results also indicate that only low levels of radioactivity were absorbed by rats following oral administration of a single dose of approximately 200 mg/kg bw of [C14]ester gum and the radioactive species excreted in bile appeared to be a hydrolyzed product of [C14]ester gum. Radioactivity was excreted in bile within 4 hours after dosing and was detectable in all samples collected through 24 hours post dose. The total amount of radioactivity excreted in bile during the 24-hour collection period ranged from 1.6-2.9% of the dose among the individual animals.
Study report 1996
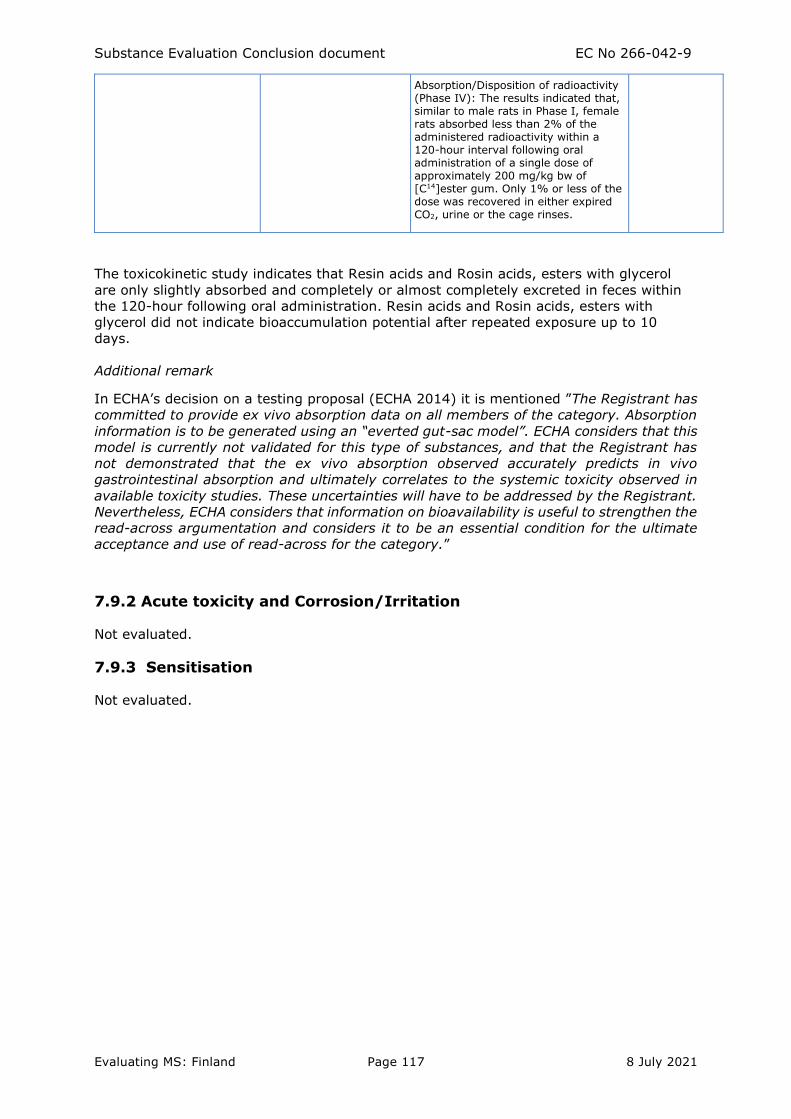
Substance Evaluation Conclusion document EC No 266-042-9
Evaluating MS: Finland Page 117 8 July 2021
Absorption/Disposition of radioactivity (Phase IV): The results indicated that, similar to male rats in Phase I, female rats absorbed less than 2% of the administered radioactivity within a 120-hour interval following oral administration of a single dose of approximately 200 mg/kg bw of [C14]ester gum. Only 1% or less of the dose was recovered in either expired CO2, urine or the cage rinses.
The toxicokinetic study indicates that Resin acids and Rosin acids, esters with glycerol
are only slightly absorbed and completely or almost completely excreted in feces within
the 120-hour following oral administration. Resin acids and Rosin acids, esters with
glycerol did not indicate bioaccumulation potential after repeated exposure up to 10
days.
Additional remark
In ECHA’s decision on a testing proposal (ECHA 2014) it is mentioned ”The Registrant has
committed to provide ex vivo absorption data on all members of the category. Absorption
information is to be generated using an “everted gut-sac model”. ECHA considers that this
model is currently not validated for this type of substances, and that the Registrant has
not demonstrated that the ex vivo absorption observed accurately predicts in vivo
gastrointestinal absorption and ultimately correlates to the systemic toxicity observed in
available toxicity studies. These uncertainties will have to be addressed by the Registrant.
Nevertheless, ECHA considers that information on bioavailability is useful to strengthen the
read-across argumentation and considers it to be an essential condition for the ultimate
acceptance and use of read-across for the category.”
7.9.2 Acute toxicity and Corrosion/Irritation
Not evaluated.
7.9.3 Sensitisation
Not evaluated.
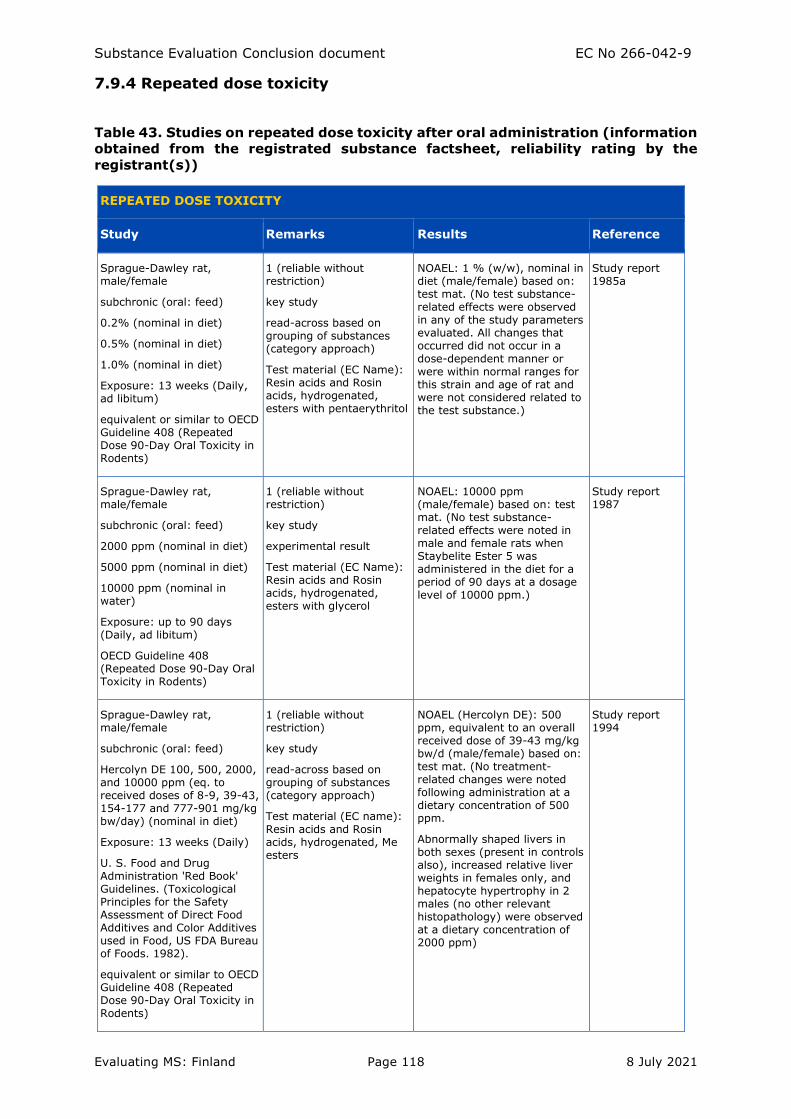
Substance Evaluation Conclusion document EC No 266-042-9
Evaluating MS: Finland Page 118 8 July 2021
7.9.4 Repeated dose toxicity
Table 43. Studies on repeated dose toxicity after oral administration (information
obtained from the registrated substance factsheet, reliability rating by the
registrant(s))
REPEATED DOSE TOXICITY
Study Remarks Results Reference
Sprague-Dawley rat, male/female
subchronic (oral: feed)
0.2% (nominal in diet)
0.5% (nominal in diet)
1.0% (nominal in diet)
Exposure: 13 weeks (Daily, ad libitum)
equivalent or similar to OECD Guideline 408 (Repeated Dose 90-Day Oral Toxicity in Rodents)
1 (reliable without restriction)
key study
read-across based on grouping of substances (category approach)
Test material (EC Name): Resin acids and Rosin acids, hydrogenated, esters with pentaerythritol
NOAEL: 1 % (w/w), nominal in diet (male/female) based on: test mat. (No test substance-related effects were observed in any of the study parameters evaluated. All changes that occurred did not occur in a dose-dependent manner or were within normal ranges for this strain and age of rat and were not considered related to the test substance.)
Study report 1985a
Sprague-Dawley rat, male/female
subchronic (oral: feed)
2000 ppm (nominal in diet)
5000 ppm (nominal in diet)
10000 ppm (nominal in water)
Exposure: up to 90 days (Daily, ad libitum)
OECD Guideline 408 (Repeated Dose 90-Day Oral Toxicity in Rodents)
1 (reliable without restriction)
key study
experimental result
Test material (EC Name): Resin acids and Rosin acids, hydrogenated, esters with glycerol
NOAEL: 10000 ppm (male/female) based on: test mat. (No test substance-related effects were noted in male and female rats when Staybelite Ester 5 was administered in the diet for a period of 90 days at a dosage level of 10000 ppm.)
Study report 1987
Sprague-Dawley rat, male/female
subchronic (oral: feed)
Hercolyn DE 100, 500, 2000, and 10000 ppm (eq. to received doses of 8-9, 39-43, 154-177 and 777-901 mg/kg bw/day) (nominal in diet)
Exposure: 13 weeks (Daily)
U. S. Food and Drug Administration 'Red Book' Guidelines. (Toxicological Principles for the Safety Assessment of Direct Food Additives and Color Additives used in Food, US FDA Bureau of Foods. 1982).
equivalent or similar to OECD Guideline 408 (Repeated Dose 90-Day Oral Toxicity in Rodents)
1 (reliable without restriction)
key study
read-across based on grouping of substances (category approach)
Test material (EC name): Resin acids and Rosin acids, hydrogenated, Me esters
NOAEL (Hercolyn DE): 500 ppm, equivalent to an overall received dose of 39-43 mg/kg bw/d (male/female) based on: test mat. (No treatment-related changes were noted following administration at a dietary concentration of 500 ppm.
Abnormally shaped livers in both sexes (present in controls also), increased relative liver weights in females only, and hepatocyte hypertrophy in 2 males (no other relevant histopathology) were observed at a dietary concentration of 2000 ppm)
Study report 1994
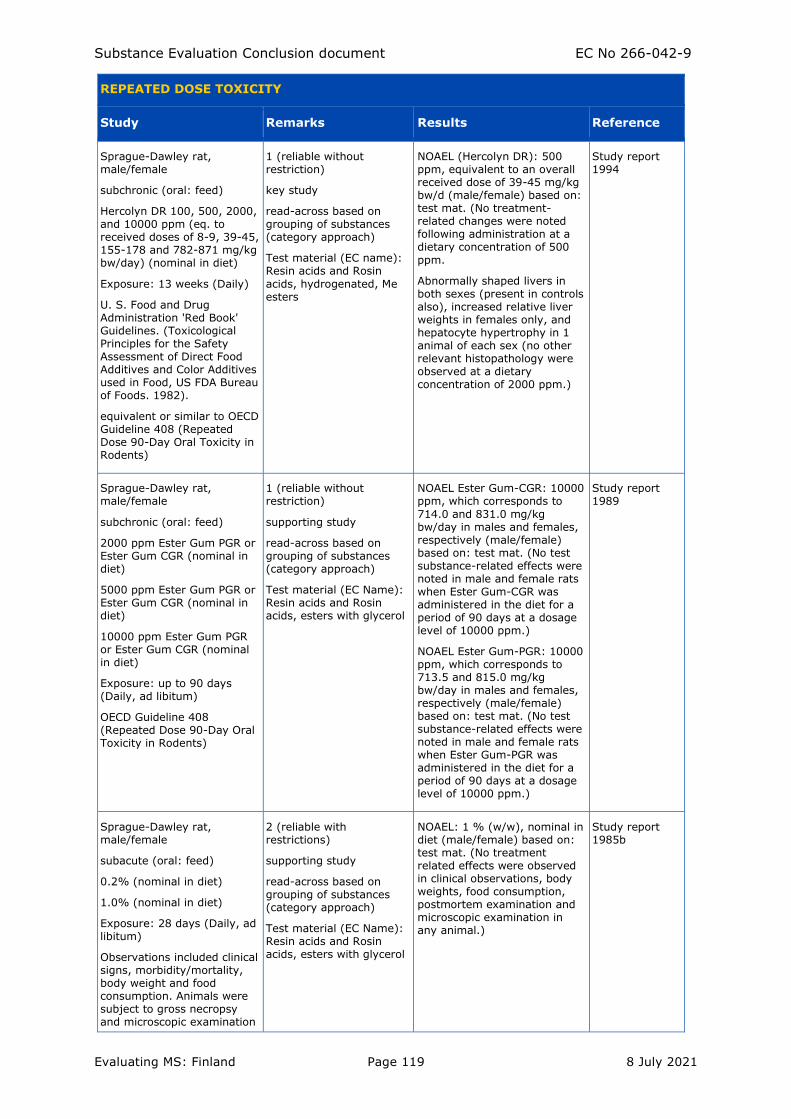
Substance Evaluation Conclusion document EC No 266-042-9
Evaluating MS: Finland Page 119 8 July 2021
REPEATED DOSE TOXICITY
Study Remarks Results Reference
Sprague-Dawley rat, male/female
subchronic (oral: feed)
Hercolyn DR 100, 500, 2000, and 10000 ppm (eq. to received doses of 8-9, 39-45, 155-178 and 782-871 mg/kg bw/day) (nominal in diet)
Exposure: 13 weeks (Daily)
U. S. Food and Drug Administration 'Red Book' Guidelines. (Toxicological Principles for the Safety Assessment of Direct Food Additives and Color Additives used in Food, US FDA Bureau of Foods. 1982).
equivalent or similar to OECD Guideline 408 (Repeated Dose 90-Day Oral Toxicity in Rodents)
1 (reliable without restriction)
key study
read-across based on grouping of substances (category approach)
Test material (EC name): Resin acids and Rosin
acids, hydrogenated, Me esters
NOAEL (Hercolyn DR): 500 ppm, equivalent to an overall received dose of 39-45 mg/kg bw/d (male/female) based on: test mat. (No treatment-related changes were noted following administration at a dietary concentration of 500
ppm.
Abnormally shaped livers in both sexes (present in controls also), increased relative liver weights in females only, and hepatocyte hypertrophy in 1 animal of each sex (no other relevant histopathology were observed at a dietary concentration of 2000 ppm.)
Study report 1994
Sprague-Dawley rat, male/female
subchronic (oral: feed)
2000 ppm Ester Gum PGR or Ester Gum CGR (nominal in diet)
5000 ppm Ester Gum PGR or Ester Gum CGR (nominal in diet)
10000 ppm Ester Gum PGR or Ester Gum CGR (nominal in diet)
Exposure: up to 90 days (Daily, ad libitum)
OECD Guideline 408 (Repeated Dose 90-Day Oral Toxicity in Rodents)
1 (reliable without restriction)
supporting study
read-across based on grouping of substances (category approach)
Test material (EC Name): Resin acids and Rosin acids, esters with glycerol
NOAEL Ester Gum-CGR: 10000 ppm, which corresponds to
714.0 and 831.0 mg/kg bw/day in males and females, respectively (male/female) based on: test mat. (No test substance-related effects were noted in male and female rats when Ester Gum-CGR was administered in the diet for a period of 90 days at a dosage level of 10000 ppm.)
NOAEL Ester Gum-PGR: 10000 ppm, which corresponds to 713.5 and 815.0 mg/kg bw/day in males and females, respectively (male/female) based on: test mat. (No test substance-related effects were noted in male and female rats when Ester Gum-PGR was administered in the diet for a period of 90 days at a dosage level of 10000 ppm.)
Study report 1989
Sprague-Dawley rat, male/female
subacute (oral: feed)
0.2% (nominal in diet)
1.0% (nominal in diet)
Exposure: 28 days (Daily, ad libitum)
Observations included clinical signs, morbidity/mortality, body weight and food consumption. Animals were subject to gross necropsy and microscopic examination
2 (reliable with restrictions)
supporting study
read-across based on grouping of substances (category approach)
Test material (EC Name): Resin acids and Rosin acids, esters with glycerol
NOAEL: 1 % (w/w), nominal in diet (male/female) based on: test mat. (No treatment related effects were observed in clinical observations, body weights, food consumption, postmortem examination and microscopic examination in any animal.)
Study report 1985b
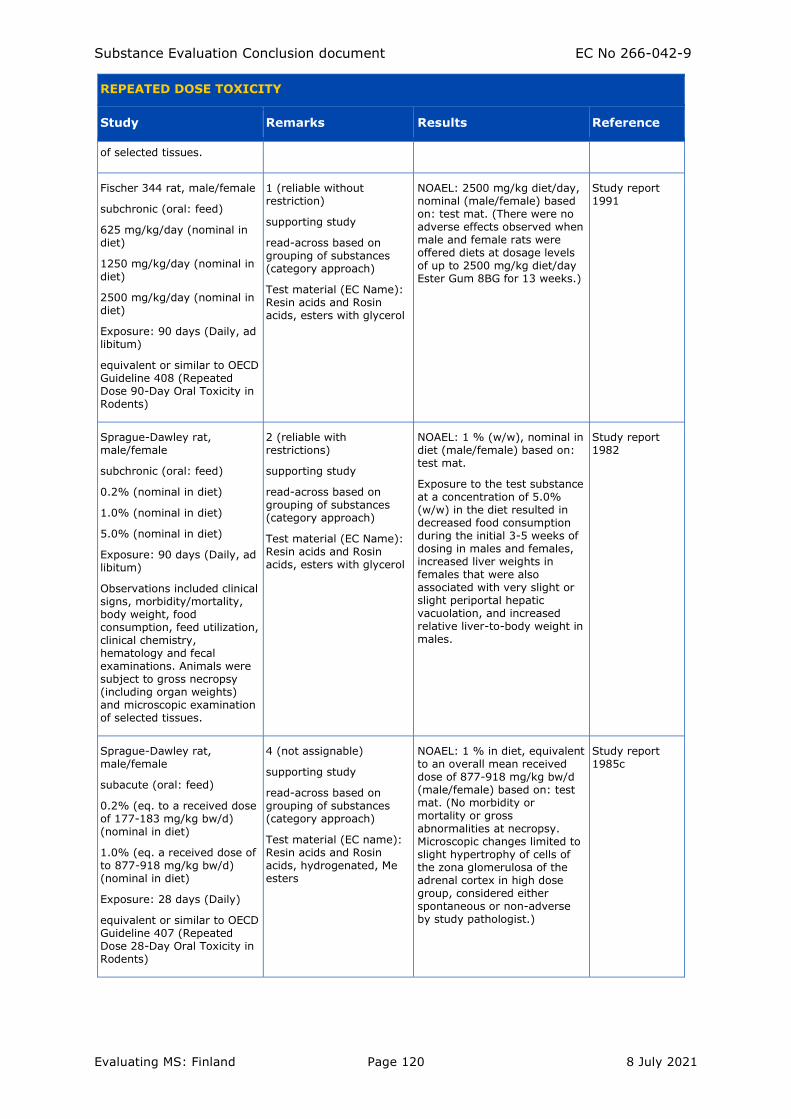
Substance Evaluation Conclusion document EC No 266-042-9
Evaluating MS: Finland Page 120 8 July 2021
REPEATED DOSE TOXICITY
Study Remarks Results Reference
of selected tissues.
Fischer 344 rat, male/female
subchronic (oral: feed)
625 mg/kg/day (nominal in diet)
1250 mg/kg/day (nominal in diet)
2500 mg/kg/day (nominal in diet)
Exposure: 90 days (Daily, ad libitum)
equivalent or similar to OECD Guideline 408 (Repeated Dose 90-Day Oral Toxicity in Rodents)
1 (reliable without restriction)
supporting study
read-across based on grouping of substances (category approach)
Test material (EC Name): Resin acids and Rosin acids, esters with glycerol
NOAEL: 2500 mg/kg diet/day, nominal (male/female) based on: test mat. (There were no adverse effects observed when male and female rats were offered diets at dosage levels of up to 2500 mg/kg diet/day Ester Gum 8BG for 13 weeks.)
Study report 1991
Sprague-Dawley rat, male/female
subchronic (oral: feed)
0.2% (nominal in diet)
1.0% (nominal in diet)
5.0% (nominal in diet)
Exposure: 90 days (Daily, ad libitum)
Observations included clinical signs, morbidity/mortality, body weight, food consumption, feed utilization, clinical chemistry, hematology and fecal examinations. Animals were subject to gross necropsy (including organ weights) and microscopic examination of selected tissues.
2 (reliable with restrictions)
supporting study
read-across based on grouping of substances (category approach)
Test material (EC Name): Resin acids and Rosin acids, esters with glycerol
NOAEL: 1 % (w/w), nominal in diet (male/female) based on: test mat.
Exposure to the test substance at a concentration of 5.0% (w/w) in the diet resulted in decreased food consumption during the initial 3-5 weeks of dosing in males and females, increased liver weights in females that were also associated with very slight or slight periportal hepatic vacuolation, and increased relative liver-to-body weight in males.
Study report 1982
Sprague-Dawley rat, male/female
subacute (oral: feed)
0.2% (eq. to a received dose of 177-183 mg/kg bw/d) (nominal in diet)
1.0% (eq. a received dose of to 877-918 mg/kg bw/d) (nominal in diet)
Exposure: 28 days (Daily)
equivalent or similar to OECD Guideline 407 (Repeated Dose 28-Day Oral Toxicity in Rodents)
4 (not assignable)
supporting study
read-across based on grouping of substances (category approach)
Test material (EC name): Resin acids and Rosin acids, hydrogenated, Me esters
NOAEL: 1 % in diet, equivalent to an overall mean received dose of 877-918 mg/kg bw/d (male/female) based on: test mat. (No morbidity or mortality or gross abnormalities at necropsy. Microscopic changes limited to slight hypertrophy of cells of the zona glomerulosa of the adrenal cortex in high dose group, considered either spontaneous or non-adverse by study pathologist.)
Study report 1985c
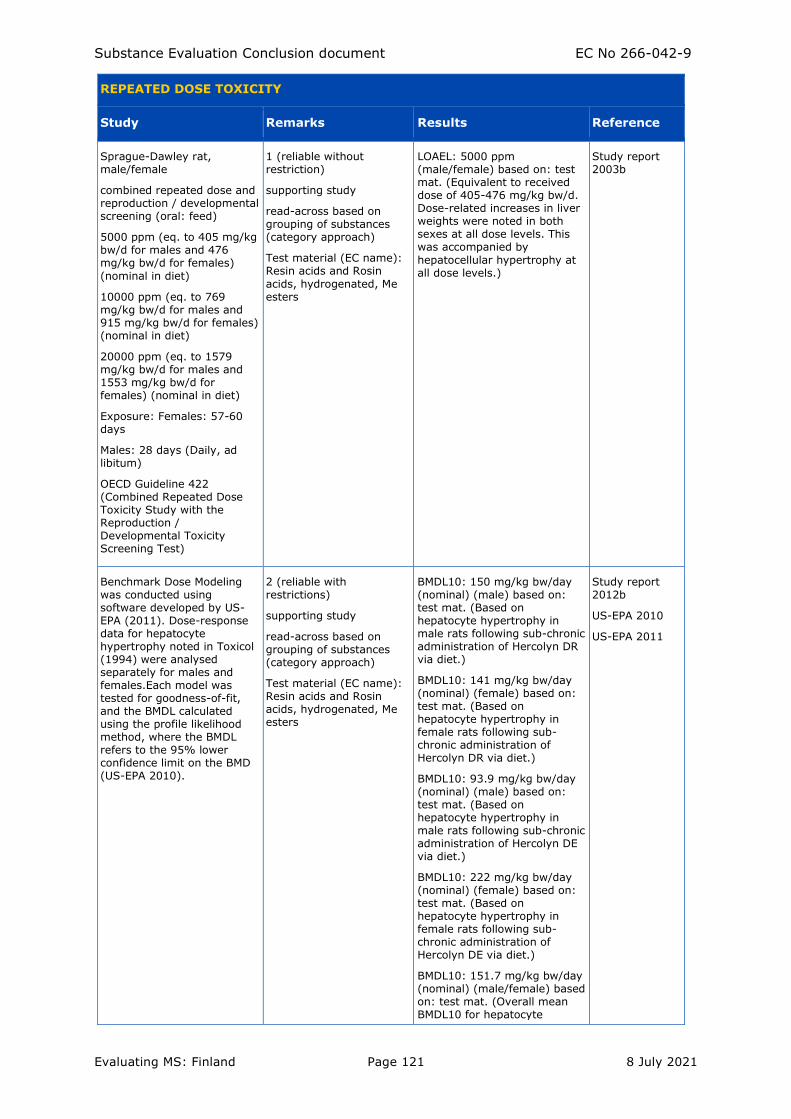
Substance Evaluation Conclusion document EC No 266-042-9
Evaluating MS: Finland Page 121 8 July 2021
REPEATED DOSE TOXICITY
Study Remarks Results Reference
Sprague-Dawley rat, male/female
combined repeated dose and reproduction / developmental screening (oral: feed)
5000 ppm (eq. to 405 mg/kg bw/d for males and 476 mg/kg bw/d for females)
(nominal in diet)
10000 ppm (eq. to 769 mg/kg bw/d for males and 915 mg/kg bw/d for females) (nominal in diet)
20000 ppm (eq. to 1579 mg/kg bw/d for males and 1553 mg/kg bw/d for females) (nominal in diet)
Exposure: Females: 57-60 days
Males: 28 days (Daily, ad libitum)
OECD Guideline 422 (Combined Repeated Dose Toxicity Study with the Reproduction / Developmental Toxicity Screening Test)
1 (reliable without restriction)
supporting study
read-across based on grouping of substances (category approach)
Test material (EC name): Resin acids and Rosin
acids, hydrogenated, Me esters
LOAEL: 5000 ppm (male/female) based on: test mat. (Equivalent to received dose of 405-476 mg/kg bw/d. Dose-related increases in liver weights were noted in both sexes at all dose levels. This was accompanied by
hepatocellular hypertrophy at all dose levels.)
Study report 2003b
Benchmark Dose Modeling was conducted using software developed by US-EPA (2011). Dose-response data for hepatocyte hypertrophy noted in Toxicol (1994) were analysed separately for males and females.Each model was tested for goodness-of-fit, and the BMDL calculated using the profile likelihood method, where the BMDL refers to the 95% lower confidence limit on the BMD (US-EPA 2010).
2 (reliable with restrictions)
supporting study
read-across based on grouping of substances (category approach)
Test material (EC name): Resin acids and Rosin acids, hydrogenated, Me esters
BMDL10: 150 mg/kg bw/day (nominal) (male) based on: test mat. (Based on hepatocyte hypertrophy in male rats following sub-chronic administration of Hercolyn DR via diet.)
BMDL10: 141 mg/kg bw/day (nominal) (female) based on: test mat. (Based on hepatocyte hypertrophy in female rats following sub-chronic administration of Hercolyn DR via diet.)
BMDL10: 93.9 mg/kg bw/day (nominal) (male) based on: test mat. (Based on hepatocyte hypertrophy in male rats following sub-chronic administration of Hercolyn DE via diet.)
BMDL10: 222 mg/kg bw/day (nominal) (female) based on: test mat. (Based on hepatocyte hypertrophy in female rats following sub-chronic administration of Hercolyn DE via diet.)
BMDL10: 151.7 mg/kg bw/day (nominal) (male/female) based on: test mat. (Overall mean BMDL10 for hepatocyte
Study report 2012b
US-EPA 2010
US-EPA 2011
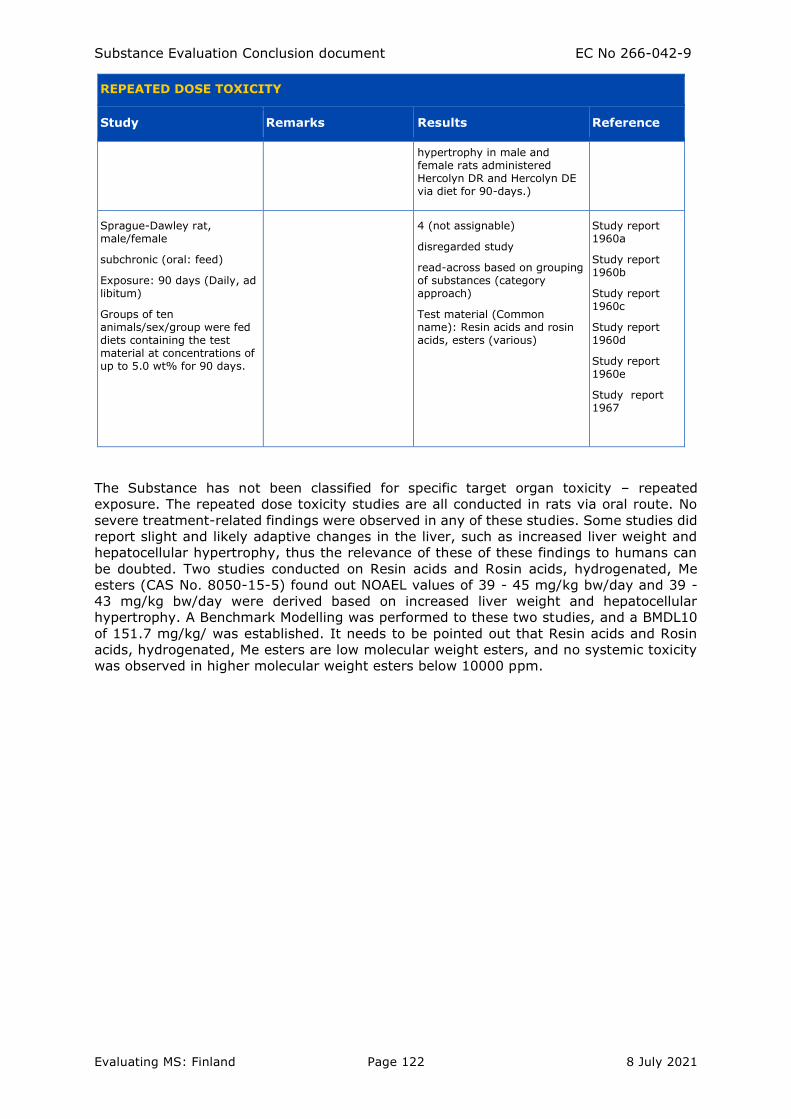
Substance Evaluation Conclusion document EC No 266-042-9
Evaluating MS: Finland Page 122 8 July 2021
REPEATED DOSE TOXICITY
Study Remarks Results Reference
hypertrophy in male and female rats administered Hercolyn DR and Hercolyn DE via diet for 90-days.)
Sprague-Dawley rat, male/female
subchronic (oral: feed)
Exposure: 90 days (Daily, ad libitum)
Groups of ten animals/sex/group were fed diets containing the test material at concentrations of up to 5.0 wt% for 90 days.
4 (not assignable)
disregarded study
read-across based on grouping of substances (category approach)
Test material (Common name): Resin acids and rosin acids, esters (various)
Study report 1960a
Study report 1960b
Study report 1960c
Study report 1960d
Study report 1960e
Study report 1967
The Substance has not been classified for specific target organ toxicity – repeated
exposure. The repeated dose toxicity studies are all conducted in rats via oral route. No
severe treatment-related findings were observed in any of these studies. Some studies did
report slight and likely adaptive changes in the liver, such as increased liver weight and
hepatocellular hypertrophy, thus the relevance of these of these findings to humans can
be doubted. Two studies conducted on Resin acids and Rosin acids, hydrogenated, Me
esters (CAS No. 8050-15-5) found out NOAEL values of 39 - 45 mg/kg bw/day and 39 -
43 mg/kg bw/day were derived based on increased liver weight and hepatocellular
hypertrophy. A Benchmark Modelling was performed to these two studies, and a BMDL10
of 151.7 mg/kg/ was established. It needs to be pointed out that Resin acids and Rosin
acids, hydrogenated, Me esters are low molecular weight esters, and no systemic toxicity
was observed in higher molecular weight esters below 10000 ppm.
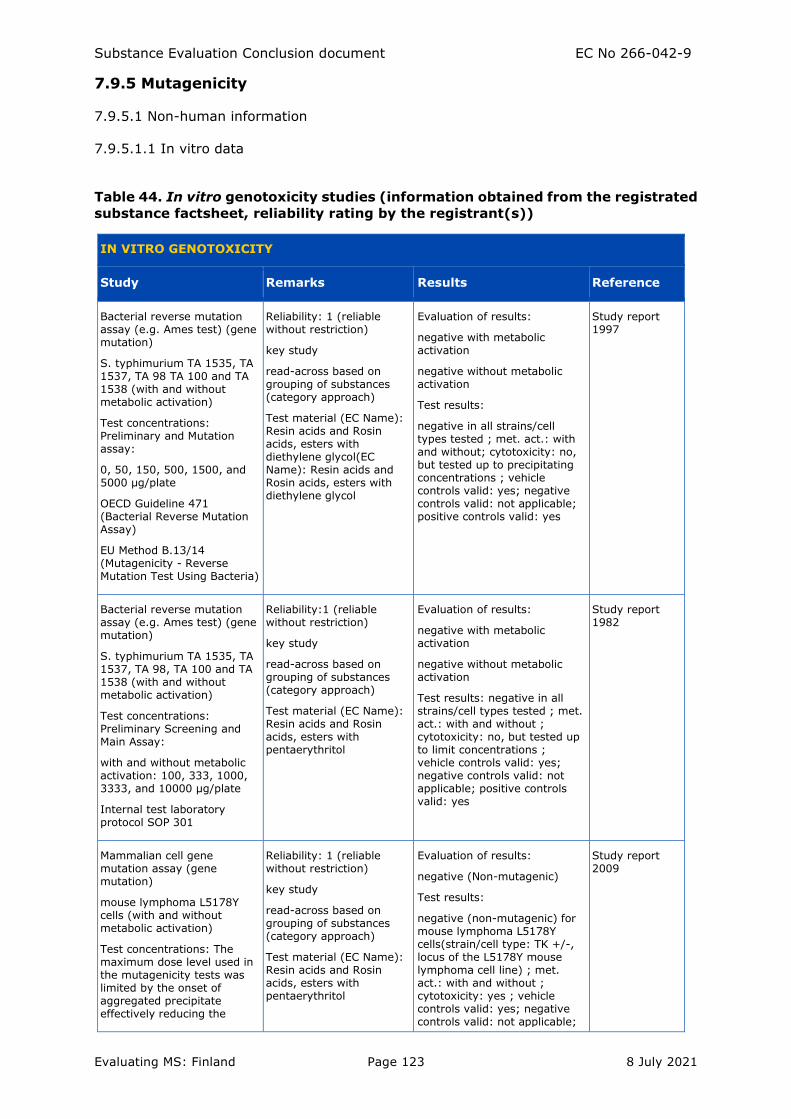
Substance Evaluation Conclusion document EC No 266-042-9
Evaluating MS: Finland Page 123 8 July 2021
7.9.5 Mutagenicity
7.9.5.1 Non-human information
7.9.5.1.1 In vitro data
Table 44. In vitro genotoxicity studies (information obtained from the registrated
substance factsheet, reliability rating by the registrant(s))
IN VITRO GENOTOXICITY
Study Remarks Results Reference
Bacterial reverse mutation assay (e.g. Ames test) (gene mutation)
S. typhimurium TA 1535, TA 1537, TA 98 TA 100 and TA 1538 (with and without metabolic activation)
Test concentrations: Preliminary and Mutation assay:
0, 50, 150, 500, 1500, and 5000 μg/plate
OECD Guideline 471 (Bacterial Reverse Mutation Assay)
EU Method B.13/14 (Mutagenicity - Reverse Mutation Test Using Bacteria)
Reliability: 1 (reliable without restriction)
key study
read-across based on grouping of substances (category approach)
Test material (EC Name): Resin acids and Rosin acids, esters with diethylene glycol(EC Name): Resin acids and Rosin acids, esters with diethylene glycol
Evaluation of results:
negative with metabolic activation
negative without metabolic activation
Test results:
negative in all strains/cell types tested ; met. act.: with and without; cytotoxicity: no, but tested up to precipitating concentrations ; vehicle controls valid: yes; negative controls valid: not applicable; positive controls valid: yes
Study report 1997
Bacterial reverse mutation assay (e.g. Ames test) (gene mutation)
S. typhimurium TA 1535, TA 1537, TA 98, TA 100 and TA 1538 (with and without metabolic activation)
Test concentrations: Preliminary Screening and Main Assay:
with and without metabolic activation: 100, 333, 1000, 3333, and 10000 μg/plate
Internal test laboratory protocol SOP 301
Reliability:1 (reliable without restriction)
key study
read-across based on grouping of substances (category approach)
Test material (EC Name): Resin acids and Rosin acids, esters with pentaerythritol
Evaluation of results:
negative with metabolic activation
negative without metabolic activation
Test results: negative in all strains/cell types tested ; met. act.: with and without ; cytotoxicity: no, but tested up to limit concentrations ; vehicle controls valid: yes; negative controls valid: not applicable; positive controls valid: yes
Study report 1982
Mammalian cell gene mutation assay (gene mutation)
mouse lymphoma L5178Y cells (with and without metabolic activation)
Test concentrations: The maximum dose level used in the mutagenicity tests was limited by the onset of aggregated precipitate effectively reducing the
Reliability: 1 (reliable without restriction)
key study
read-across based on grouping of substances (category approach)
Test material (EC Name): Resin acids and Rosin acids, esters with pentaerythritol
Evaluation of results:
negative (Non-mutagenic)
Test results:
negative (non-mutagenic) for mouse lymphoma L5178Y cells(strain/cell type: TK +/-, locus of the L5178Y mouse lymphoma cell line) ; met. act.: with and without ; cytotoxicity: yes ; vehicle controls valid: yes; negative controls valid: not applicable;
Study report 2009
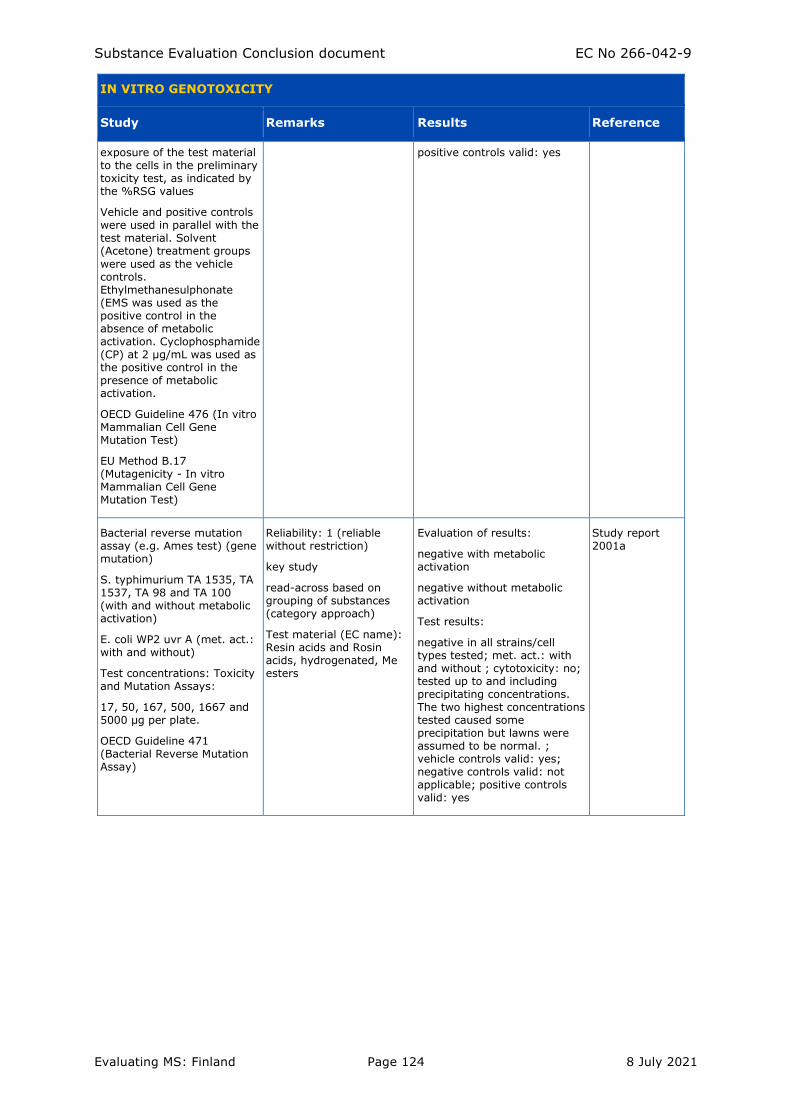
Substance Evaluation Conclusion document EC No 266-042-9
Evaluating MS: Finland Page 124 8 July 2021
IN VITRO GENOTOXICITY
Study Remarks Results Reference
exposure of the test material to the cells in the preliminary toxicity test, as indicated by the %RSG values
Vehicle and positive controls were used in parallel with the test material. Solvent (Acetone) treatment groups
were used as the vehicle controls. Ethylmethanesulphonate (EMS was used as the positive control in the absence of metabolic activation. Cyclophosphamide (CP) at 2 μg/mL was used as the positive control in the presence of metabolic activation.
OECD Guideline 476 (In vitro Mammalian Cell Gene Mutation Test)
EU Method B.17 (Mutagenicity - In vitro Mammalian Cell Gene Mutation Test)
positive controls valid: yes
Bacterial reverse mutation assay (e.g. Ames test) (gene mutation)
S. typhimurium TA 1535, TA 1537, TA 98 and TA 100 (with and without metabolic activation)
E. coli WP2 uvr A (met. act.: with and without)
Test concentrations: Toxicity and Mutation Assays:
17, 50, 167, 500, 1667 and 5000 μg per plate.
OECD Guideline 471 (Bacterial Reverse Mutation Assay)
Reliability: 1 (reliable without restriction)
key study
read-across based on grouping of substances (category approach)
Test material (EC name): Resin acids and Rosin acids, hydrogenated, Me esters
Evaluation of results:
negative with metabolic activation
negative without metabolic activation
Test results:
negative in all strains/cell types tested; met. act.: with and without ; cytotoxicity: no; tested up to and including precipitating concentrations. The two highest concentrations tested caused some precipitation but lawns were assumed to be normal. ; vehicle controls valid: yes; negative controls valid: not applicable; positive controls valid: yes
Study report 2001a
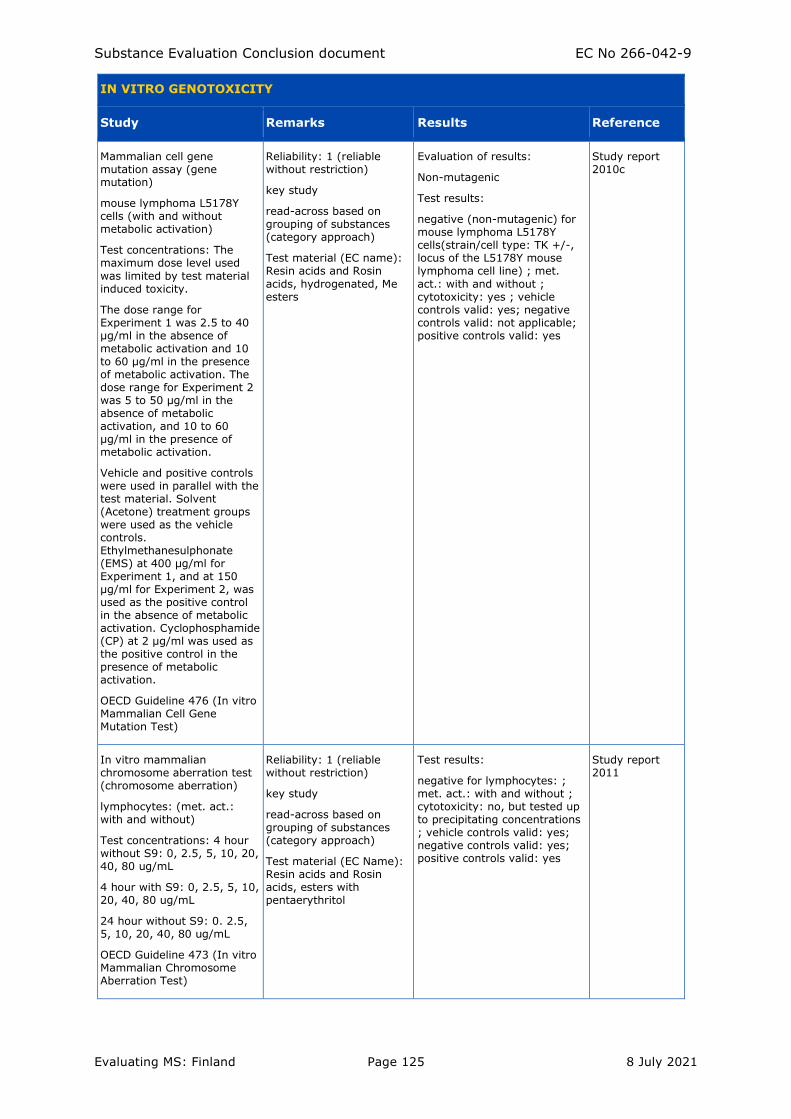
Substance Evaluation Conclusion document EC No 266-042-9
Evaluating MS: Finland Page 125 8 July 2021
IN VITRO GENOTOXICITY
Study Remarks Results Reference
Mammalian cell gene mutation assay (gene mutation)
mouse lymphoma L5178Y cells (with and without metabolic activation)
Test concentrations: The maximum dose level used
was limited by test material induced toxicity.
The dose range for Experiment 1 was 2.5 to 40 μg/ml in the absence of metabolic activation and 10 to 60 μg/ml in the presence of metabolic activation. The dose range for Experiment 2 was 5 to 50 μg/ml in the absence of metabolic activation, and 10 to 60 μg/ml in the presence of metabolic activation.
Vehicle and positive controls were used in parallel with the test material. Solvent (Acetone) treatment groups were used as the vehicle controls. Ethylmethanesulphonate (EMS) at 400 μg/ml for Experiment 1, and at 150 μg/ml for Experiment 2, was used as the positive control in the absence of metabolic activation. Cyclophosphamide (CP) at 2 μg/ml was used as the positive control in the presence of metabolic activation.
OECD Guideline 476 (In vitro Mammalian Cell Gene Mutation Test)
Reliability: 1 (reliable without restriction)
key study
read-across based on grouping of substances (category approach)
Test material (EC name): Resin acids and Rosin
acids, hydrogenated, Me esters
Evaluation of results:
Non-mutagenic
Test results:
negative (non-mutagenic) for mouse lymphoma L5178Y cells(strain/cell type: TK +/-, locus of the L5178Y mouse lymphoma cell line) ; met.
act.: with and without ; cytotoxicity: yes ; vehicle controls valid: yes; negative controls valid: not applicable; positive controls valid: yes
Study report 2010c
In vitro mammalian chromosome aberration test (chromosome aberration)
lymphocytes: (met. act.: with and without)
Test concentrations: 4 hour without S9: 0, 2.5, 5, 10, 20, 40, 80 ug/mL
4 hour with S9: 0, 2.5, 5, 10, 20, 40, 80 ug/mL
24 hour without S9: 0. 2.5, 5, 10, 20, 40, 80 ug/mL
OECD Guideline 473 (In vitro Mammalian Chromosome Aberration Test)
Reliability: 1 (reliable without restriction)
key study
read-across based on grouping of substances (category approach)
Test material (EC Name): Resin acids and Rosin acids, esters with pentaerythritol
Test results:
negative for lymphocytes: ; met. act.: with and without ; cytotoxicity: no, but tested up to precipitating concentrations ; vehicle controls valid: yes; negative controls valid: yes; positive controls valid: yes
Study report 2011
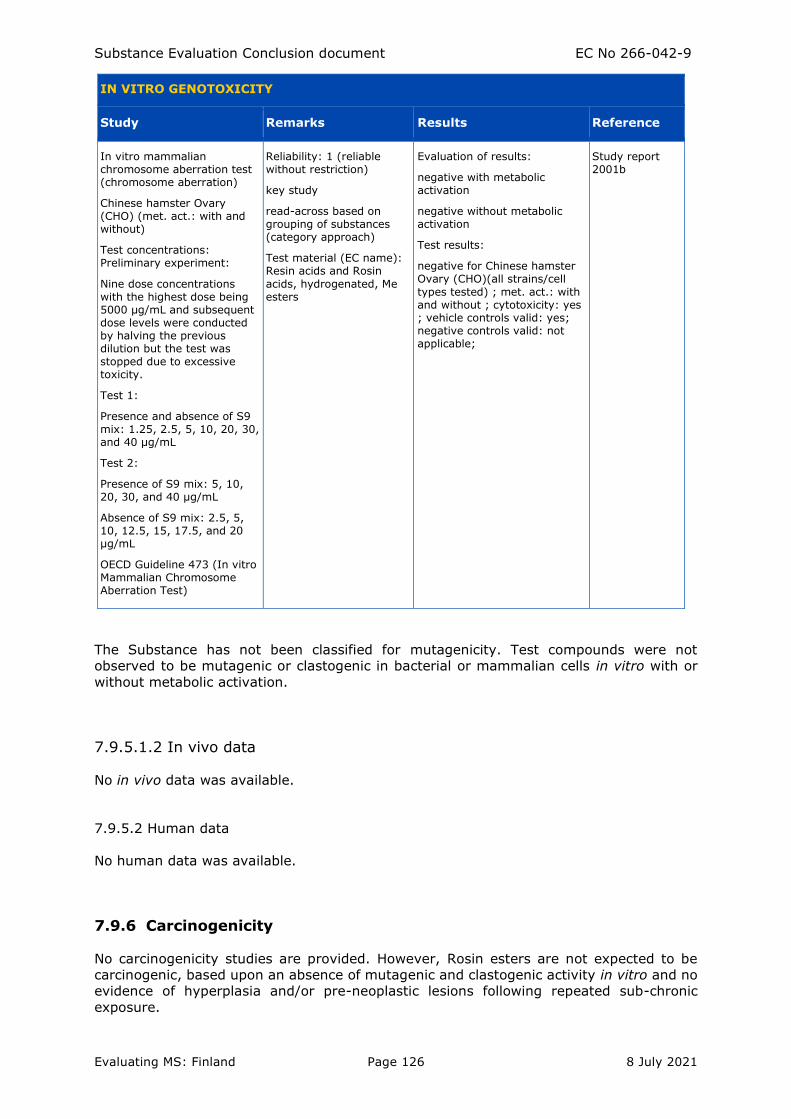
Substance Evaluation Conclusion document EC No 266-042-9
Evaluating MS: Finland Page 126 8 July 2021
IN VITRO GENOTOXICITY
Study Remarks Results Reference
In vitro mammalian chromosome aberration test (chromosome aberration)
Chinese hamster Ovary (CHO) (met. act.: with and without)
Test concentrations: Preliminary experiment:
Nine dose concentrations with the highest dose being 5000 μg/mL and subsequent dose levels were conducted by halving the previous dilution but the test was stopped due to excessive toxicity.
Test 1:
Presence and absence of S9 mix: 1.25, 2.5, 5, 10, 20, 30, and 40 μg/mL
Test 2:
Presence of S9 mix: 5, 10, 20, 30, and 40 μg/mL
Absence of S9 mix: 2.5, 5, 10, 12.5, 15, 17.5, and 20 μg/mL
OECD Guideline 473 (In vitro Mammalian Chromosome Aberration Test)
Reliability: 1 (reliable without restriction)
key study
read-across based on grouping of substances (category approach)
Test material (EC name): Resin acids and Rosin
acids, hydrogenated, Me esters
Evaluation of results:
negative with metabolic activation
negative without metabolic activation
Test results:
negative for Chinese hamster Ovary (CHO)(all strains/cell
types tested) ; met. act.: with and without ; cytotoxicity: yes ; vehicle controls valid: yes; negative controls valid: not applicable;
Study report 2001b
The Substance has not been classified for mutagenicity. Test compounds were not
observed to be mutagenic or clastogenic in bacterial or mammalian cells in vitro with or
without metabolic activation.
7.9.5.1.2 In vivo data
No in vivo data was available.
7.9.5.2 Human data
No human data was available.
7.9.6 Carcinogenicity
No carcinogenicity studies are provided. However, Rosin esters are not expected to be
carcinogenic, based upon an absence of mutagenic and clastogenic activity in vitro and no
evidence of hyperplasia and/or pre-neoplastic lesions following repeated sub-chronic
exposure.
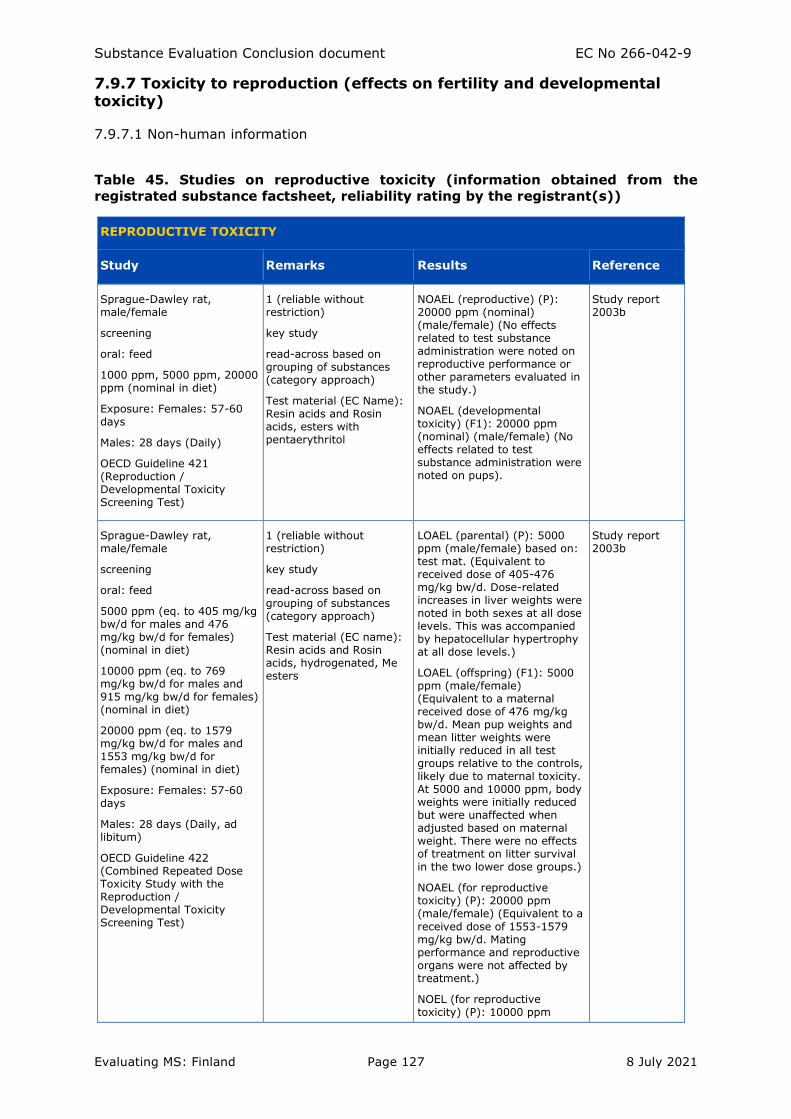
Substance Evaluation Conclusion document EC No 266-042-9
Evaluating MS: Finland Page 127 8 July 2021
7.9.7 Toxicity to reproduction (effects on fertility and developmental toxicity)
7.9.7.1 Non-human information
Table 45. Studies on reproductive toxicity (information obtained from the
registrated substance factsheet, reliability rating by the registrant(s))
REPRODUCTIVE TOXICITY
Study Remarks Results Reference
Sprague-Dawley rat, male/female
screening
oral: feed
1000 ppm, 5000 ppm, 20000 ppm (nominal in diet)
Exposure: Females: 57-60 days
Males: 28 days (Daily)
OECD Guideline 421 (Reproduction / Developmental Toxicity Screening Test)
1 (reliable without restriction)
key study
read-across based on grouping of substances (category approach)
Test material (EC Name): Resin acids and Rosin acids, esters with pentaerythritol
NOAEL (reproductive) (P): 20000 ppm (nominal) (male/female) (No effects related to test substance administration were noted on reproductive performance or other parameters evaluated in the study.)
NOAEL (developmental toxicity) (F1): 20000 ppm (nominal) (male/female) (No effects related to test substance administration were noted on pups).
Study report 2003b
Sprague-Dawley rat, male/female
screening
oral: feed
5000 ppm (eq. to 405 mg/kg bw/d for males and 476 mg/kg bw/d for females) (nominal in diet)
10000 ppm (eq. to 769 mg/kg bw/d for males and 915 mg/kg bw/d for females) (nominal in diet)
20000 ppm (eq. to 1579 mg/kg bw/d for males and 1553 mg/kg bw/d for females) (nominal in diet)
Exposure: Females: 57-60 days
Males: 28 days (Daily, ad libitum)
OECD Guideline 422 (Combined Repeated Dose Toxicity Study with the Reproduction / Developmental Toxicity Screening Test)
1 (reliable without restriction)
key study
read-across based on grouping of substances (category approach)
Test material (EC name): Resin acids and Rosin acids, hydrogenated, Me esters
LOAEL (parental) (P): 5000 ppm (male/female) based on: test mat. (Equivalent to received dose of 405-476 mg/kg bw/d. Dose-related increases in liver weights were noted in both sexes at all dose levels. This was accompanied by hepatocellular hypertrophy at all dose levels.)
LOAEL (offspring) (F1): 5000 ppm (male/female) (Equivalent to a maternal received dose of 476 mg/kg bw/d. Mean pup weights and mean litter weights were initially reduced in all test groups relative to the controls, likely due to maternal toxicity. At 5000 and 10000 ppm, body weights were initially reduced but were unaffected when adjusted based on maternal weight. There were no effects of treatment on litter survival in the two lower dose groups.)
NOAEL (for reproductive toxicity) (P): 20000 ppm (male/female) (Equivalent to a
received dose of 1553-1579 mg/kg bw/d. Mating performance and reproductive organs were not affected by treatment.)
NOEL (for reproductive toxicity) (P): 10000 ppm
Study report 2003b
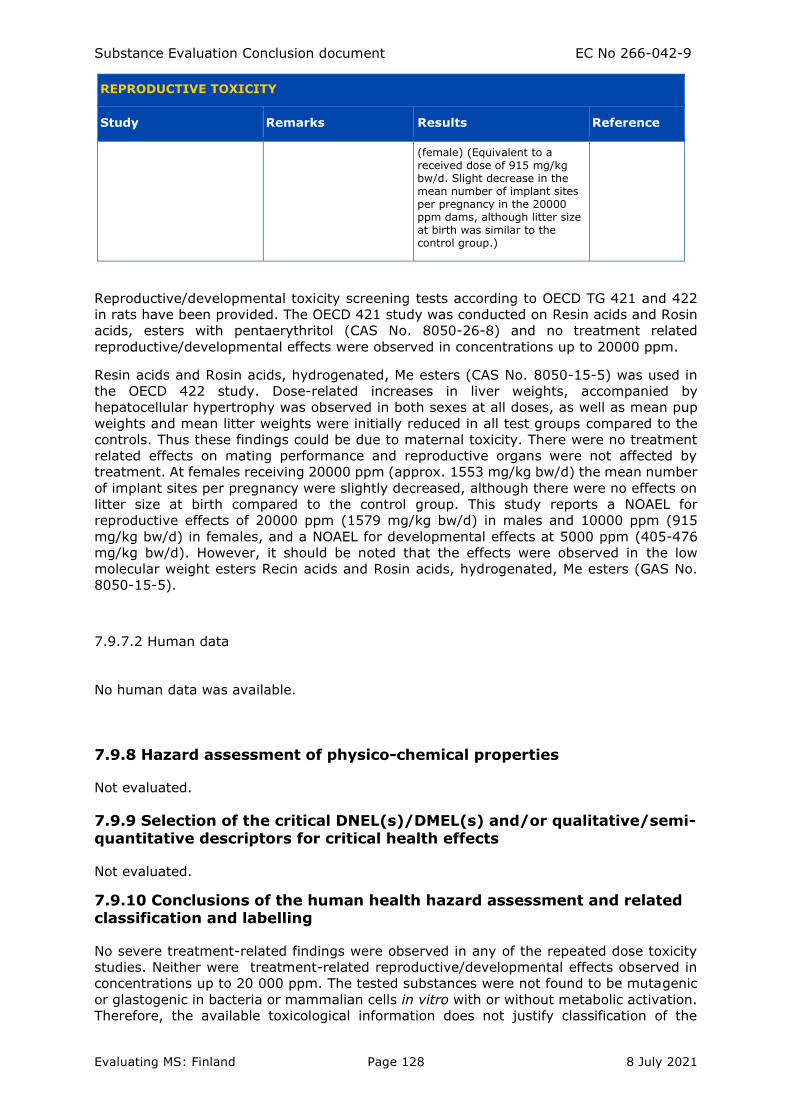
Substance Evaluation Conclusion document EC No 266-042-9
Evaluating MS: Finland Page 128 8 July 2021
REPRODUCTIVE TOXICITY
Study Remarks Results Reference
(female) (Equivalent to a received dose of 915 mg/kg bw/d. Slight decrease in the mean number of implant sites per pregnancy in the 20000 ppm dams, although litter size at birth was similar to the control group.)
Reproductive/developmental toxicity screening tests according to OECD TG 421 and 422
in rats have been provided. The OECD 421 study was conducted on Resin acids and Rosin
acids, esters with pentaerythritol (CAS No. 8050-26-8) and no treatment related
reproductive/developmental effects were observed in concentrations up to 20000 ppm.
Resin acids and Rosin acids, hydrogenated, Me esters (CAS No. 8050-15-5) was used in
the OECD 422 study. Dose-related increases in liver weights, accompanied by
hepatocellular hypertrophy was observed in both sexes at all doses, as well as mean pup
weights and mean litter weights were initially reduced in all test groups compared to the
controls. Thus these findings could be due to maternal toxicity. There were no treatment
related effects on mating performance and reproductive organs were not affected by
treatment. At females receiving 20000 ppm (approx. 1553 mg/kg bw/d) the mean number
of implant sites per pregnancy were slightly decreased, although there were no effects on
litter size at birth compared to the control group. This study reports a NOAEL for
reproductive effects of 20000 ppm (1579 mg/kg bw/d) in males and 10000 ppm (915
mg/kg bw/d) in females, and a NOAEL for developmental effects at 5000 ppm (405-476
mg/kg bw/d). However, it should be noted that the effects were observed in the low
molecular weight esters Recin acids and Rosin acids, hydrogenated, Me esters (GAS No.
8050-15-5).
7.9.7.2 Human data
No human data was available.
7.9.8 Hazard assessment of physico-chemical properties
Not evaluated.
7.9.9 Selection of the critical DNEL(s)/DMEL(s) and/or qualitative/semi-quantitative descriptors for critical health effects
Not evaluated.
7.9.10 Conclusions of the human health hazard assessment and related classification and labelling
No severe treatment-related findings were observed in any of the repeated dose toxicity
studies. Neither were treatment-related reproductive/developmental effects observed in
concentrations up to 20 000 ppm. The tested substances were not found to be mutagenic
or glastogenic in bacteria or mammalian cells in vitro with or without metabolic activation.
Therefore, the available toxicological information does not justify classification of the
Substance Evaluation Conclusion document EC No 266-042-9
Evaluating MS: Finland Page 129 8 July 2021
category substances as mutagenic or toxic for reproduction. No other evidence of chronic
toxicity was observed in the experimental data either that would justify STOT RE
classification.
7.10 Assessment of endocrine disrupting (ED) properties
Not evaluated.
7.10.1 Endocrine disruption – Environment
Not evaluated.
7.10.2 Endocrine disruption - Human health
Not evaluated.
7.10.3 Conclusion on endocrine disrupting properties
(combined/separate)
Not evaluated.
7.11 PBT and vPvB assessment
Assessment approach
The PBT/vPvB assessment shall take into account of the PBT/vPvB-properties of relevant
constituents of a substance and relevant transformation and/or degradation products. In
general, constituents and transformation/degradation products are considered relevant for
the PBT/vPvB assessment when they are present in concentration of ≥ 0.1% (w/w).
The Substance is a UVCB and includes mono-, di-, and triesters of hydrogenated resin acids
with glycerol, as well as the fractions named as “light ends” (mono- and sesquiterpenes)
and “heavy ends” (a mixture of dimerised esters, acids and polyol). All of these fractions
are present at concentrations of ≥0.1 w/w.
Based on the PBT screening level results it was anticipated that, of the mono-, di-, and
triesters probably only the monoesters had potential to bioaccumulate according to their
bioavailability properties. Moreover, it was expected that there might be significant
differences in biodegradability between the rosin constituents of different level of
esterification.
Therefore, it was decided to focus the substance evaluation primarily on the monoester
constituents of the Substance and try to solve the concerns related to B and P properties
at first. Monoesters of dihydroabietic acid and tetrahydroabietic acid glycerol (DHAA-mono-
GE, THAA-mono-GE) were identified as representative constituents for persistence
assessment.
7.11.1 Persistence
Monoester constituents
The estimated half time for the photodegradation with OH-radicals is 0.09 days for DHAA-
mono-GE and THAA-mono-GE. Therefore, indirect photodegradation may be an important
environmental fate process for these constituents and the constituents do not have long-
range transport potential.
Substance Evaluation Conclusion document EC No 266-042-9
Evaluating MS: Finland Page 130 8 July 2021
No reliable data is available for concluding on abiotic hydrolysis for the Substance and its
selected constituents. However, the hydrolysis rates predicted for DHAA-mono-GE and
THAA-mono-GE and observed rates of hydrolysis of esters of resin acids and rosin acids
(e.g., with glycerol) suggest that it is highly unlikely that abiotic hydrolysis rates in
environmentally relevant conditions would be sufficiently high to rule out PBT/vPvB
concern.
No strong conclusions can be made on the biodegradability of the selected monoester
constituents on the basis of BIOWIN models. The screening criteria for P and vP based on
BIOWIN models (ECHA 2017b) are not fulfilled. However, it should be noted that the
BIOWIN results have only a low weighting in the assessment as BIOWIN 2 and 3 are poorly
applicable and as BIOWIN 5 and 6, which are applicable, give somewhat conflicting results.
For the glycerol monoesters DHAA-mono-GE and THAA-mono-GE the BIOWIN 5 and 6
results as a whole are somewhat more towards to the outcome “not readily biodegradable”
than “readily biodegradable”.
Based on the ready biodegradation tests, the Substance is not readily biodegradable
(degradation was 4 - 47% during 28 days ) and therefore fulfills the screening criterion for
persistence. The concentrations of test substance constituents were not determined in
these ready biodegradation tests and therefore degradation of individual constituents or
fractions in these tests is not known. A comparison between analogous substances
indicates that methyl esters of resin acids and rosin acids (belonging to “simple” esters)
seem to be more biodegradable compared to “bulky” esters (such as the Substance) in
ready biodegradation tests. Structurally the monoesters in the Substance are more
complex than the methyl esters of resin acids and rosin acids but less complex than the
di- or triesters in the Substance.
Two ready biodegradation studies (OECD TG 310) were conducted on enriched monoesters
of resin acids and rosin acids with glycerol, in response to the SEv decision. Three different
enriched monoester substances were tested in these studies. Degradation of the test
substances (consisting of 68-75% of monoesters) was 34-54 % ThIC during 28 days and
34-67 % ThIC during 45-60 days.
Estimated ultimate degradation of the monoesters (based on two different calculation
scenarios, Scenarios 3 and 4, See 7.7.1.3.2 and Table 25) was 21-59 % ThIC after 28 days
and 23-75 % ThIC after 42-60 days. The estimated degradation of the monoesters was
below 60 % ThIC after 28 days with each of the three test substances whereas with one
of the test substances it was above 60% ThIC after 45 days. The highest ultimate
degradation of the monoesters (51-59 % ThIC after 28 days and 70-75% % ThIC after 45
days) was obtained with the test substance which had a higher concentration of the
monoesters (74.8%), resin acids and light ends, and a lower proportion of di- and triesters,
compared to the other test substances. The primary degradation of the monoesters was
83-96% after 28 days, and 92-94% after 45-60 days with the three test substances.
Therefore, 4-17% of the monoesters remained undegraded after 28 days and 6-8% after
45-60 days.24
The pass level of ≥60% (ThCO2) of the monoesters was only reached with one of the three
test substances and only during the extended test period. The guidance (ECHA 2017c)
mentions that “positive test results should generally supersede negative test results”. The
positive test result means that the ultimate degradation of a test substance or a compound
of concern exceeded the pass level for ready biodegradability or for screening as not P and
not vP. However, according to the guidance (ECHA 2017b, ECHA 2017c) degradation
achieving the pass level during extended test period can be used for P/vP assessment only
in certain specific cases. One precondition for this is that there is “some initial, slow but
24 It is noted that these values are based on the assumption that the di- and triesters were not degraded to monoesters during the study. The primary degradation of the monoesters may have been higher (and the amount of remaining monoesters lower) if monoesters were produced from the di- and triesters during the study.
Substance Evaluation Conclusion document EC No 266-042-9
Evaluating MS: Finland Page 131 8 July 2021
steady, biodegradation but did not reach a plateau by the end of the ready biodegradability
test, i.e. after 28 days”. The guidance does not specify how to define whether there is
“some initial, slow but steady, biodegradation”. In addition, the eMSCA considers that this
part of the guidance is not fully applicable in this case because in the present OECD TG
310 studies, the overall degradation kinetics of the test substance (based on % ThIC)
reflect the degradation of several constituents and the exact ultimate degradation kinetics
of the monoesters are not known. As in the present case also primary degradation was
measured, the ultimate degradation results were not used on their own but in combination
with primary degradation and other available data, to obtain a more complete view of the
degradation occurring in these studies, for the purpose of P/vP assessment.
ECHA guidance documents do not include specific advice (such as pass levels) on how to
use primary degradation in ready biodegradation tests for P assessment. Normally, a “not
P and not vP” conclusion from ready biodegradation tests can be drawn only when the pass
level for ultimate degradation is reached, which practically presents a complete ultimate
degradation of the test substance according to OECD (2006).25 It should also be considered
that residual parent substance analysis is not a requirement in OECD TG 310 or in most of
the other OECD ready biodegradation test guidelines and that the pass level for a “not
P/vP” conclusion in ECHA guidance is based on ultimate degradation. The eMSCA considers
that even if a pass level (e.g., ≥60% ThIC) is reached a small amount of the parent
substance may still remain. Therefore, the eMSCA considers that the incomplete primary
degradation of the monoesters in the OECD TG 310 studies should not be taken strictly as
an indication of potential P/vP properties but all available information need to be assessed,
including the potential reasons for the incomplete degradation.
The measurements of the monoesters from the test medium and from the solvent rinse of
the test bottles indicated that the low water solubility limited the rate of primary
degradation of the monoesters. In addition, with the test substance applied by direct
weighing the monoesters were released to the test medium more slowly than with the
solvent dosed test substances. This could explain the slower primary degradation of the
monoesters in the test substance applied by direct weighing and could also be a reason
why a degradation ≥60 %ThIC was reached only during the extended test period. The
eMSCA considers that, in the case of the test substance applied with direct weighing, the
use of the extended period for P/vP assessment is in general accordance with the guidance
text26, as the primary degradation, and consequently also the ultimate degradation,
appeared to be limited by bioavailability constraints in this test. Even if the shape of the
primary degradation curve does not necessarily comply with the precondition regarding
the use of the extended test period, it should be noted that this precondition (ECHA 2017b,
ECHA 2017c) does not consider primary degradation or the potential difference between
primary and ultimate degradation kinetics, which in this case may be influenced by the
presence of the ester functional group in the studied compounds.
The lower ultimate biodegradability of the monoesters observed in the solvent dosed test
substances does not seem to be convincingly explained by solubility constraints, even
considering that based on visual assessment the ultimate degradation curve could be
interpreted as “slow but steady degradation”. In these bottles, a high primary degradation
of the monoesters occurred early and therefore primary transformation products were
expected to be available for further degradation. The potential reasons for the incomplete
25 According to OECD (2006) the pass levels of either 60% ThOD (or ThCO2) or 70% DOC removal practically represent complete ultimate degradation of the test substance as the remaining fraction of 30-40% of the test substance is assumed to be assimilated by the biomass or present as products
of biosynthesis. 26 For example the purpose of the enhancements of the biodegradation screening tests, such as the prolongation of the test duration, should only be to compensate the poor bioavailability to the degrading microorganisms of poorly soluble and/or adsorptive substances, but should not be used to induce additional adaptation of the inoculum. Also, a late acceleration of biodegradation is likely to reflect an adaptation of the microorganisms and in that case the prolongation of the test duration
should not be regarded as adequate for the P/vP assessment (ECHA 2017b).
Substance Evaluation Conclusion document EC No 266-042-9
Evaluating MS: Finland Page 132 8 July 2021
degradation of the transformation products were considered but no firm conclusions could
be drawn. The incomplete primary degradation obviously restricted also ultimate
degradation but this explains only a relatively minor part of the lacking ultimate
degradation in the solvent dosed bottles and it does not explain why the ultimate
degradation in the solvent dosed samples remained lower than in the direct weighed
sample, which had a similar or lower primary degradation.
In one of the OECD TG 310 studies there is more detailed analytical information available
for the monoester fraction. The decrease in GC-MS peak areas of the monoesters of
dehydroabietic acid and monoesters of hydrogenated resin acids were 98% and 72% after
28 days. At the study end (60 days) the monoesters of hydrogenated resin acids attained
roughly a decrease of 90%. The reasons for the lower degradation of this fraction of
monoesters are not known but may be related to differences in solubility. The constraints
to the biodegradation are probably more pronounced in a ready biodegradation study as
the test substance concentration is higher compared to the concentrations used in
simulation tests or concentrations expected in the environment. Therefore, even if a part
of the monoesters did not degrade, the reasons for this are possibly explained by the high
test substance concentration in the ready biodegradation test. It is not possible from the
current data to identify and quantify the individual remaining monoesters in more detail.
Microbial transformation prediction for the selected monoester constituents (DHAA-mono-
E, THAA-mono-GE) using the Pathway Prediction System (PPS) of the EAWAG Aquatic
Research Biocatalysis/Biodegradation Database predicts primary degradates that include
DHAA/THAA, glycerol, and other three- or two-carbon compounds derived from the glycerol
moiety, all of which are considered not PBT and not vPvB under aerobic conditions. Also
transformation products which still include the ester bond may be formed based on the
predictions and for these PBT/vPvB assessment has not been previously conducted. For
the parent monoesters as well as each of the predicted transformation products which have
more than one possible transformation routes according to the predictions, the ester
hydrolysis route is always equally or more likely than the other routes. Moreover, even if
a non-hydrolytic reaction occurs first, it is predicted to be followed by a hydrolysis reaction
(with or without intermediate reaction steps), eventually leading to a resin acid and a
three- or two-carbon compound.
The ultimate degradation of the monoesters is expected to occur through the hydrolysis of
the ester bond. The relatively high ultimate degradation in one of the OECD TG 310 tests,
and the fast primary degradation in all three OECD TG 310 tests, suggest that hydrolysis
of the ester bond of the monoesters took place. Also taking into account the predicted
likelihoods of ester hydrolysis and other transformations of the monoesters, it is unlikely
that any of the predicted transformation products which still have an ester bond would be
more persistent than the parent monoesters.
Primary degradation of the monoesters is therefore expected to proceed to non PBT/vPvB
transformation products, at least under aerobic conditions. These transformation products
include most likely resin acids, glycerol, or other three- or two-carbon compounds derived
from the glycerol moiety. The compounds derived from the glycerol moiety are expected
to mineralise relatively fast whereas resin acids may be either further biotransformed or
mineralised, or they may accumulate, depending on the potential of the microbial
communities to metabolise these compounds, or their sensitivity to inhibition by resin acids
or other transformation products. It should be noted that the P/vP status of resin acids is
not known. In addition, resin acids may have the potential for biotransforming into
PBT/vPvB degradation/transformation products under anaerobic conditions (See 7.7.1.7
and 7.11.4).
The eMSCA considers that the high primary degradation of the monoesters observed with
all three test substances and the significant ultimate degradation of the monoesters in the
OECD TG 310 studies point to the conclusion that the monoesters are not P and not vP. It
can be concluded that the monoesters undergo substantial and fast primary biodegradation
under the conditions of ready biodegradability testing. Even if the primary degradation in
Substance Evaluation Conclusion document EC No 266-042-9
Evaluating MS: Finland Page 133 8 July 2021
the OECD TG 310 studies was not complete it is noted that there were indications that
primary degradation was limited by the low water solubility of the monoesters under the
conditions of ready biodegradability testing. The part of the monoesters which showed a
slower degration rate still showed a consistent decrease until the end of the study (Figure
9), suggesting that these monoesters continued to degrade. Hence the eMSCA considers
that there is only a very low probability that the remaining monoesters in the OECD TG
310 study would be P or vP. The high primary degradation also suggests that the main
reason why the ultimate degradation of the monoesters was below 60% ThIC with two of
the test substances was the accumulation of transformation products of the monoesters
and not the presence of undegraded monoesters.
Therefore, the monoester constituents of the Substance are considered to be not P and not
vP under aerobic conditions, when the parent compounds are considered. It should be
noted that transformation of the monoesters into P and/or vP transformation products
could not be excluded. Resin acids, which are potentially P and potentially vP, were shown
to be present throughout the study in the OECD TG 310 study (however, it has to be noted
that resin acids were also constituents of the test substance). Resin acids are potentially P
and potentially vP but they are not PBT and not vPvB under aerobic conditions (see 7.11.4).
Other constituents
Regarding the resin acid and rosin acid constituents of the Substance, the OECD TG 310
studies on enriched monoesters are to some extent relevant, as a significant part of the
carbon in the test substances used consisted of the rosin backbone and as there were also
resin acids and rosin acids in the test substances. The present results indicate that a
significant part of the rosin moieties of the monoesters were biodegraded. However, the
present results cannot be used to definitively assess the ready biodegradability or (non-)
persistence of resin acids. It should be noted that the monoesters contain a glycerol moiety
which is likely to be more biodegradable than the resin acid part. The previous assessment
on Rosin, hydrogenated (Tukes 2015) concluded that no definitive conclusion on
persistence can be made based on the available data. The eMSCA considers that this
conclusion is still valid even after considering the new data. Therefore, resin acids and rosin
acids are considered potentially P and potentially vP. In addition, it should be noted there
is some remaining concern also for the potential transformation products formed from resin
acids and rosin acids under anaerobic conditions, (See 7.7.1.7 and 7.11.4).
The di- and triesters are considered potentially P and potentially vP based on ready
biodegradation tests conducted on the Substance. Di- and triesters were also present in
the OECD TG 310 studies with enriched monoesters and in one of the studies di- and
triesters were measured (Study report 2017c). Reduction in the peak areas of di- and
triesters was reported. However, it is not known to what extent the reduction was due to
degradation as the recovery rate of the extraction and analytical method was not
determined and as there were no sterile controls. In addition, the remaining concern for
anaerobic transformation products of resin acids and rosin acids is relevant also for the di-
and triesters, as resin acids and rosin acids are potential transformation products of these
constituents.
For the light ends fraction (mono- and sesquiterpenes), relevant information is available
in the registration data for Turpentine, oil (EC 232-350-7) (ECHA 2021c). Turpentine, oil
is composed primarily of the C10H16 terpene hydrocarbons: α-pinene, β-pinene, limonene,
3-carene, camphene (ECHA 2021c). It may contain other acyclic, monocyclic, or bicyclic
terpenes, oxygenated terpenes, and anethole. For Turpentine, oil, two OECD TG 301 F
studies are available and indicate 71.7-72.7% degradation in 28 days (ECHA 2021b). As
noted in the CCH decision (ECHA 2020b), in the studies conducted with a multi-constituent
substance the biodegradation may be related only for some constituents and the studies
do not allow assessment of ready biodegradability of each relevant constituent of
Turpentine, oil.
OECD TG 301 D studies for several individual terpene compounds are available and
indicated the following degaradation percentages in 28 days: β-pinene 76 %, Delta-3-
Substance Evaluation Conclusion document EC No 266-042-9
Evaluating MS: Finland Page 134 8 July 2021
carene 73.8 %, dipentene multi-constituent 80%, myrcene 76% , and terpinolene 81 %,
(ECHA 2020b). Each of these compounds belongs to monoterpenes. The eMSCA considers
that these data suggest a relatively high degradability of monoterpenes. Regarding
sesquiterpenes, there are indications of potential persistence. Jenner et al. (2011) studied
selected cyclic sesquiterpenes and reported that 60% degradation (% theoretical oxygen
demand, ThOD) during 28 days in an OECD TG 301 F study was reached for alpha-
humulene (64 % ThOD) beta-caryophyllene (70 %), and alpha-cedrene (78 %) whereas it
was not reached for delta-cadinene (50 %), germarcrene D (19 %) , alpha-gurjunene (43
%), himalachines (alpha , beta, gamma) (38 %), longifolene (50%), and (−)-thujopsene
(36 %). There is data for at least one sesquiterpene, caryophyllene, in the REACH
registration database (ECHA 2021d). Caryophyllene attained a degradation percentage of
-0.8, 3.2, 63.9, 54.4, 60.2, 58.8, 64.3, and 56 % after 0, 3, 5, 7, 10, 14, 21, and 28 days
in an OECD TG 310 study. There was a fast degradation up to the pass level of ≥60% by
day 5 of the study but then the degradation plateaued and the pass level was not
consistently exceeded in the following measurement days.
Based on the available data the eMSCA considers that currently the light ends fraction
should be considered potentially P and potentially vP, particularly due to the presence of
sesquiterpenes. ECHA has requested further information on degradation of Turpentine, oil,
in a compliance check (ECHA 2020b). When available, that information should be
considered for its potential relevance for the light ends fraction of the Substance.
For the heavy ends fraction (a mixture of dimerised esters, acids and polyol), the eMSCA
considers that at least the dimers of resin acids and rosin acids, as well as the dimerised
esters, are potentially P and potentially vP. The dimers of resin acids and rosin acids include
the (dimerised) rosin backbone but due to the dimerization have more complex structures
and higher molecular weights than resin acids and rosin acids. According to the registration
dossier for rosin, oligomers (consisting of, e.g., rosin dimers and trimers), the substance
is readily biodegradable (ECHA 2021e). However, this conclusion is based on a category
approach and no studies conducted on rosin, oligomers are presented (ECHA 2021e). The
eMSCA assumes that “dimerised esters” refer to esters in which at least one of the acid
groups is a rosin dimer and which have two glycerol moieties. These are considered
potentially P and potentially vP due to the more complex structure and higher molecular
weight compared to the dimers of resin acids and rosin acids. The same conclusion would
apply also to glycerol esters including a dimerised rosin acid moiety and only one glycerol
moiety although it is unclear whether these are present in the Substance.
Conclusion on persistence
The monoester constituents of the Substance should be considered not P and not vP under
aerobic conditions, when considering the parent compounds only. It should be noted that
the monoesters may transform into compounds that are potentially P and potentially vP,
as specified above.
For the other constituents (resin acids and rosin acids, di- and triesters, light ends, and
heavy ends) no definitive conclusion on the P/vP property can be drawn based on the
available data and therefore these fractions are considered potentially P and potentially vP.
7.11.2 Bioaccumulation
Monoesters
The monoester constituents may have bioaccumulation potential as their log Kow values
exceed 4.5 (5.3 and 5.2 for THAA-mono-GE and DHAA-mono-GE, respectively). BCF values
predicted by BCFBAF regression model do not exceed the B criterion of 2000 for THAA-
mono-GE and DHAA-mono-GE (1465 and 1287, respectively). The Arnot Gobas model
predicts BCF and BAF levels well below the B criterion (< 300) when biotransformation rate
estimation is included in the estimation. However, applying a worst case assessment
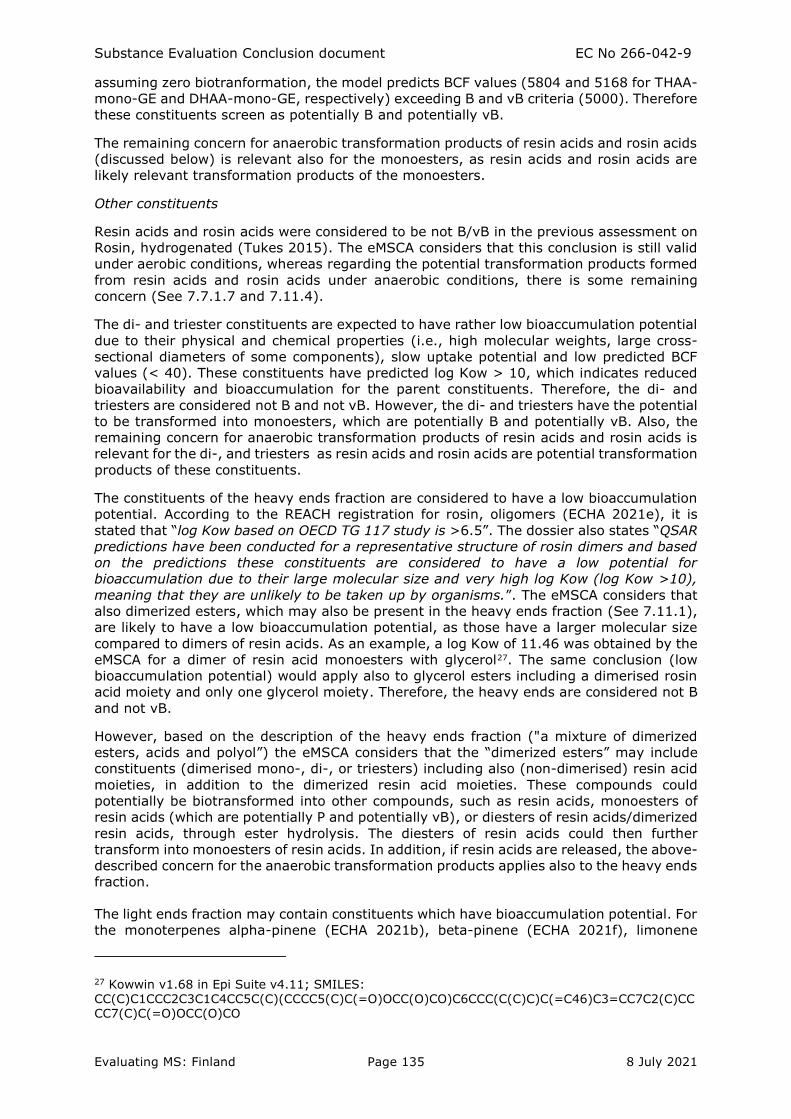
Substance Evaluation Conclusion document EC No 266-042-9
Evaluating MS: Finland Page 135 8 July 2021
assuming zero biotranformation, the model predicts BCF values (5804 and 5168 for THAA-
mono-GE and DHAA-mono-GE, respectively) exceeding B and vB criteria (5000). Therefore
these constituents screen as potentially B and potentially vB.
The remaining concern for anaerobic transformation products of resin acids and rosin acids
(discussed below) is relevant also for the monoesters, as resin acids and rosin acids are
likely relevant transformation products of the monoesters.
Other constituents
Resin acids and rosin acids were considered to be not B/vB in the previous assessment on
Rosin, hydrogenated (Tukes 2015). The eMSCA considers that this conclusion is still valid
under aerobic conditions, whereas regarding the potential transformation products formed
from resin acids and rosin acids under anaerobic conditions, there is some remaining
concern (See 7.7.1.7 and 7.11.4).
The di- and triester constituents are expected to have rather low bioaccumulation potential
due to their physical and chemical properties (i.e., high molecular weights, large cross-
sectional diameters of some components), slow uptake potential and low predicted BCF
values (< 40). These constituents have predicted log Kow > 10, which indicates reduced
bioavailability and bioaccumulation for the parent constituents. Therefore, the di- and
triesters are considered not B and not vB. However, the di- and triesters have the potential
to be transformed into monoesters, which are potentially B and potentially vB. Also, the
remaining concern for anaerobic transformation products of resin acids and rosin acids is
relevant for the di-, and triesters as resin acids and rosin acids are potential transformation
products of these constituents.
The constituents of the heavy ends fraction are considered to have a low bioaccumulation
potential. According to the REACH registration for rosin, oligomers (ECHA 2021e), it is
stated that “log Kow based on OECD TG 117 study is >6.5”. The dossier also states “QSAR
predictions have been conducted for a representative structure of rosin dimers and based
on the predictions these constituents are considered to have a low potential for
bioaccumulation due to their large molecular size and very high log Kow (log Kow >10),
meaning that they are unlikely to be taken up by organisms.”. The eMSCA considers that
also dimerized esters, which may also be present in the heavy ends fraction (See 7.11.1),
are likely to have a low bioaccumulation potential, as those have a larger molecular size
compared to dimers of resin acids. As an example, a log Kow of 11.46 was obtained by the
eMSCA for a dimer of resin acid monoesters with glycerol27. The same conclusion (low
bioaccumulation potential) would apply also to glycerol esters including a dimerised rosin
acid moiety and only one glycerol moiety. Therefore, the heavy ends are considered not B
and not vB.
However, based on the description of the heavy ends fraction ("a mixture of dimerized
esters, acids and polyol”) the eMSCA considers that the “dimerized esters” may include
constituents (dimerised mono-, di-, or triesters) including also (non-dimerised) resin acid
moieties, in addition to the dimerized resin acid moieties. These compounds could
potentially be biotransformed into other compounds, such as resin acids, monoesters of
resin acids (which are potentially P and potentially vB), or diesters of resin acids/dimerized
resin acids, through ester hydrolysis. The diesters of resin acids could then further
transform into monoesters of resin acids. In addition, if resin acids are released, the above-
described concern for the anaerobic transformation products applies also to the heavy ends
fraction.
The light ends fraction may contain constituents which have bioaccumulation potential. For
the monoterpenes alpha-pinene (ECHA 2021b), beta-pinene (ECHA 2021f), limonene
27 Kowwin v1.68 in Epi Suite v4.11; SMILES: CC(C)C1CCC2C3C1C4CC5C(C)(CCCC5(C)C(=O)OCC(O)CO)C6CCC(C(C)C)C(=C46)C3=CC7C2(C)CCCC7(C)C(=O)OCC(O)CO
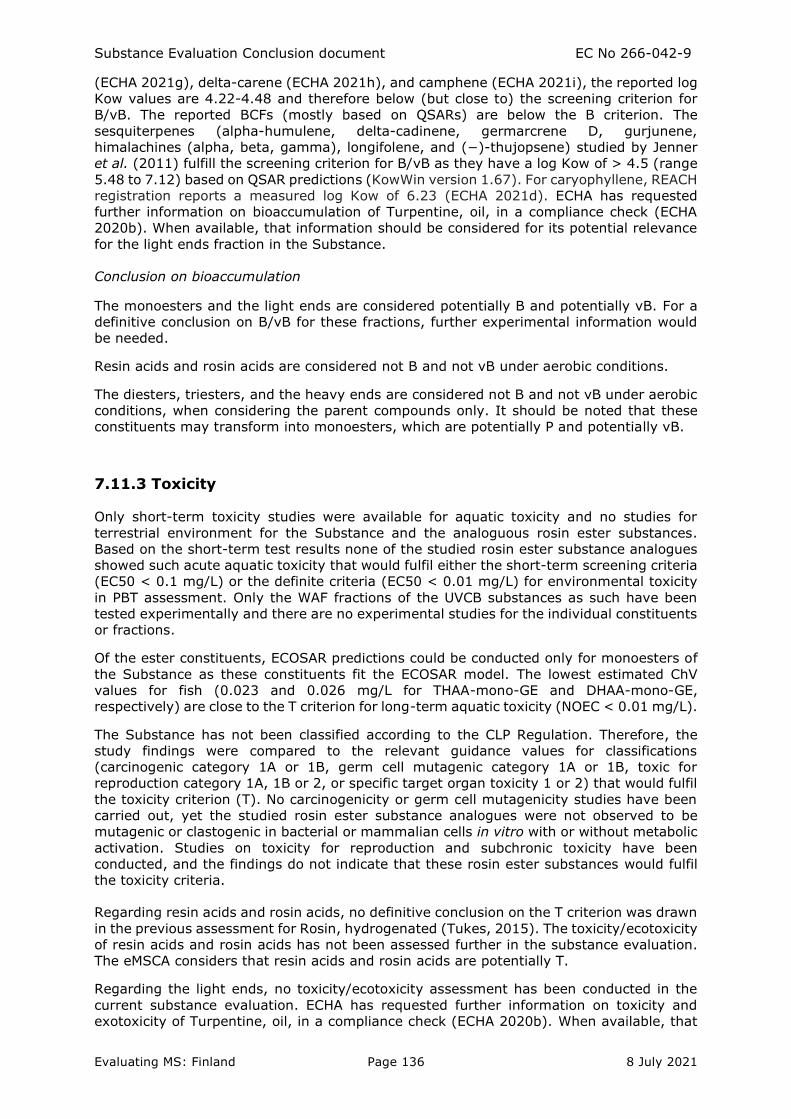
Substance Evaluation Conclusion document EC No 266-042-9
Evaluating MS: Finland Page 136 8 July 2021
(ECHA 2021g), delta-carene (ECHA 2021h), and camphene (ECHA 2021i), the reported log
Kow values are 4.22-4.48 and therefore below (but close to) the screening criterion for
B/vB. The reported BCFs (mostly based on QSARs) are below the B criterion. The
sesquiterpenes (alpha-humulene, delta-cadinene, germarcrene D, gurjunene,
himalachines (alpha, beta, gamma), longifolene, and (−)-thujopsene) studied by Jenner
et al. (2011) fulfill the screening criterion for B/vB as they have a log Kow of > 4.5 (range
5.48 to 7.12) based on QSAR predictions (KowWin version 1.67). For caryophyllene, REACH
registration reports a measured log Kow of 6.23 (ECHA 2021d). ECHA has requested
further information on bioaccumulation of Turpentine, oil, in a compliance check (ECHA
2020b). When available, that information should be considered for its potential relevance
for the light ends fraction in the Substance.
Conclusion on bioaccumulation
The monoesters and the light ends are considered potentially B and potentially vB. For a
definitive conclusion on B/vB for these fractions, further experimental information would
be needed.
Resin acids and rosin acids are considered not B and not vB under aerobic conditions.
The diesters, triesters, and the heavy ends are considered not B and not vB under aerobic
conditions, when considering the parent compounds only. It should be noted that these
constituents may transform into monoesters, which are potentially P and potentially vB.
7.11.3 Toxicity
Only short-term toxicity studies were available for aquatic toxicity and no studies for
terrestrial environment for the Substance and the analoguous rosin ester substances.
Based on the short-term test results none of the studied rosin ester substance analogues
showed such acute aquatic toxicity that would fulfil either the short-term screening criteria
(EC50 < 0.1 mg/L) or the definite criteria (EC50 < 0.01 mg/L) for environmental toxicity
in PBT assessment. Only the WAF fractions of the UVCB substances as such have been
tested experimentally and there are no experimental studies for the individual constituents
or fractions.
Of the ester constituents, ECOSAR predictions could be conducted only for monoesters of
the Substance as these constituents fit the ECOSAR model. The lowest estimated ChV
values for fish (0.023 and 0.026 mg/L for THAA-mono-GE and DHAA-mono-GE,
respectively) are close to the T criterion for long-term aquatic toxicity (NOEC < 0.01 mg/L).
The Substance has not been classified according to the CLP Regulation. Therefore, the
study findings were compared to the relevant guidance values for classifications
(carcinogenic category 1A or 1B, germ cell mutagenic category 1A or 1B, toxic for
reproduction category 1A, 1B or 2, or specific target organ toxicity 1 or 2) that would fulfil
the toxicity criterion (T). No carcinogenicity or germ cell mutagenicity studies have been
carried out, yet the studied rosin ester substance analogues were not observed to be
mutagenic or clastogenic in bacterial or mammalian cells in vitro with or without metabolic
activation. Studies on toxicity for reproduction and subchronic toxicity have been
conducted, and the findings do not indicate that these rosin ester substances would fulfil
the toxicity criteria.
Regarding resin acids and rosin acids, no definitive conclusion on the T criterion was drawn
in the previous assessment for Rosin, hydrogenated (Tukes, 2015). The toxicity/ecotoxicity
of resin acids and rosin acids has not been assessed further in the substance evaluation.
The eMSCA considers that resin acids and rosin acids are potentially T.
Regarding the light ends, no toxicity/ecotoxicity assessment has been conducted in the
current substance evaluation. ECHA has requested further information on toxicity and
exotoxicity of Turpentine, oil, in a compliance check (ECHA 2020b). When available, that
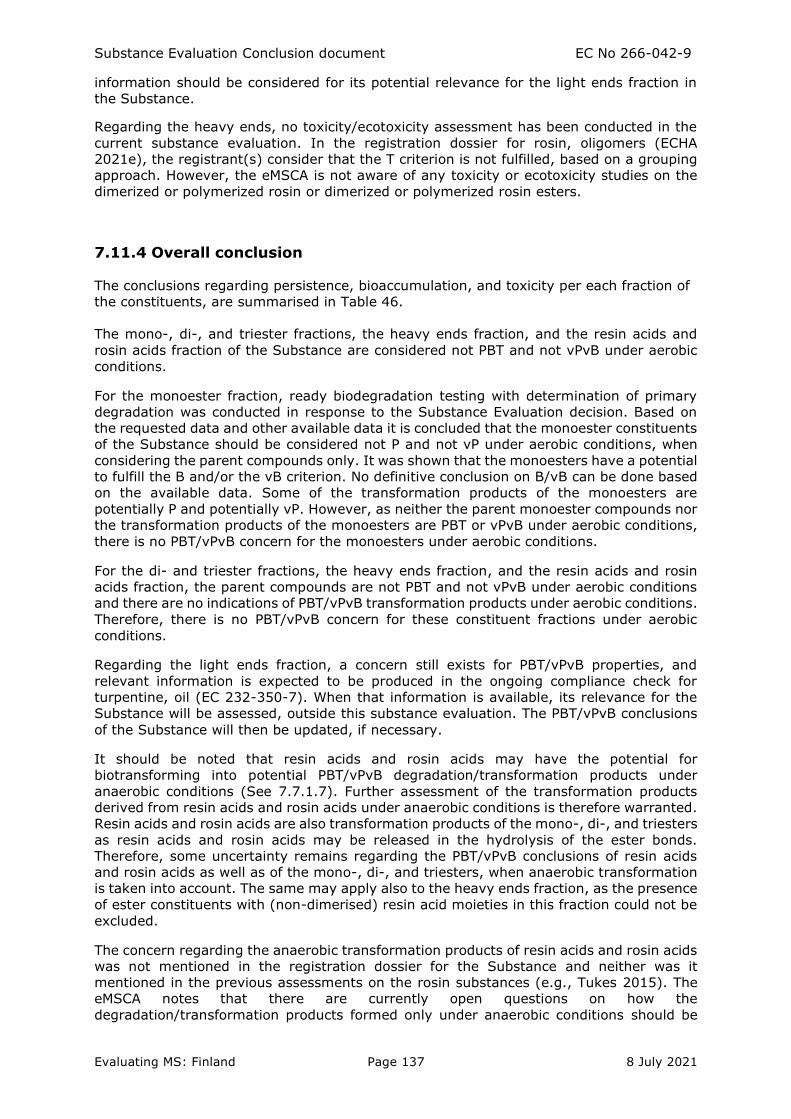
Substance Evaluation Conclusion document EC No 266-042-9
Evaluating MS: Finland Page 137 8 July 2021
information should be considered for its potential relevance for the light ends fraction in
the Substance.
Regarding the heavy ends, no toxicity/ecotoxicity assessment has been conducted in the
current substance evaluation. In the registration dossier for rosin, oligomers (ECHA
2021e), the registrant(s) consider that the T criterion is not fulfilled, based on a grouping
approach. However, the eMSCA is not aware of any toxicity or ecotoxicity studies on the
dimerized or polymerized rosin or dimerized or polymerized rosin esters.
7.11.4 Overall conclusion
The conclusions regarding persistence, bioaccumulation, and toxicity per each fraction of
the constituents, are summarised in Table 46.
The mono-, di-, and triester fractions, the heavy ends fraction, and the resin acids and
rosin acids fraction of the Substance are considered not PBT and not vPvB under aerobic
conditions.
For the monoester fraction, ready biodegradation testing with determination of primary
degradation was conducted in response to the Substance Evaluation decision. Based on
the requested data and other available data it is concluded that the monoester constituents
of the Substance should be considered not P and not vP under aerobic conditions, when
considering the parent compounds only. It was shown that the monoesters have a potential
to fulfill the B and/or the vB criterion. No definitive conclusion on B/vB can be done based
on the available data. Some of the transformation products of the monoesters are
potentially P and potentially vP. However, as neither the parent monoester compounds nor
the transformation products of the monoesters are PBT or vPvB under aerobic conditions,
there is no PBT/vPvB concern for the monoesters under aerobic conditions.
For the di- and triester fractions, the heavy ends fraction, and the resin acids and rosin
acids fraction, the parent compounds are not PBT and not vPvB under aerobic conditions
and there are no indications of PBT/vPvB transformation products under aerobic conditions.
Therefore, there is no PBT/vPvB concern for these constituent fractions under aerobic
conditions.
Regarding the light ends fraction, a concern still exists for PBT/vPvB properties, and
relevant information is expected to be produced in the ongoing compliance check for
turpentine, oil (EC 232-350-7). When that information is available, its relevance for the
Substance will be assessed, outside this substance evaluation. The PBT/vPvB conclusions
of the Substance will then be updated, if necessary.
It should be noted that resin acids and rosin acids may have the potential for
biotransforming into potential PBT/vPvB degradation/transformation products under
anaerobic conditions (See 7.7.1.7). Further assessment of the transformation products
derived from resin acids and rosin acids under anaerobic conditions is therefore warranted.
Resin acids and rosin acids are also transformation products of the mono-, di-, and triesters
as resin acids and rosin acids may be released in the hydrolysis of the ester bonds.
Therefore, some uncertainty remains regarding the PBT/vPvB conclusions of resin acids
and rosin acids as well as of the mono-, di-, and triesters, when anaerobic transformation
is taken into account. The same may apply also to the heavy ends fraction, as the presence
of ester constituents with (non-dimerised) resin acid moieties in this fraction could not be
excluded.
The concern regarding the anaerobic transformation products of resin acids and rosin acids
was not mentioned in the registration dossier for the Substance and neither was it
mentioned in the previous assessments on the rosin substances (e.g., Tukes 2015). The
eMSCA notes that there are currently open questions on how the
degradation/transformation products formed only under anaerobic conditions should be
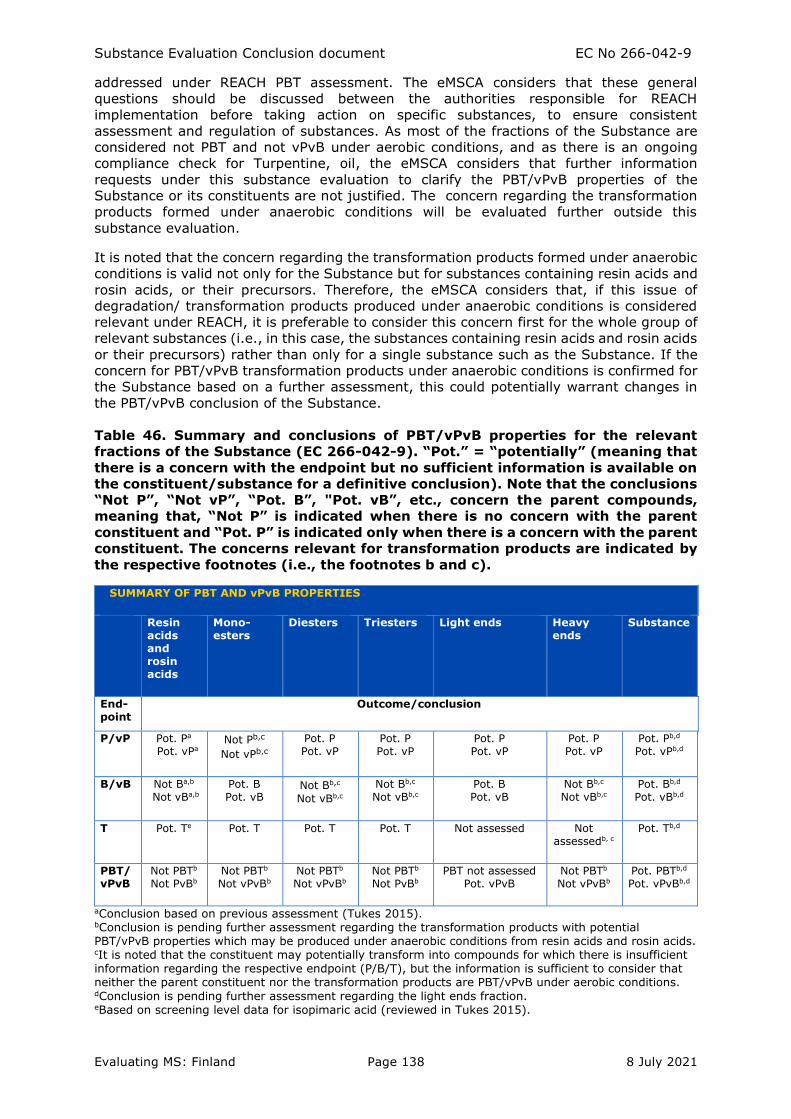
Substance Evaluation Conclusion document EC No 266-042-9
Evaluating MS: Finland Page 138 8 July 2021
addressed under REACH PBT assessment. The eMSCA considers that these general
questions should be discussed between the authorities responsible for REACH
implementation before taking action on specific substances, to ensure consistent
assessment and regulation of substances. As most of the fractions of the Substance are
considered not PBT and not vPvB under aerobic conditions, and as there is an ongoing
compliance check for Turpentine, oil, the eMSCA considers that further information
requests under this substance evaluation to clarify the PBT/vPvB properties of the
Substance or its constituents are not justified. The concern regarding the transformation
products formed under anaerobic conditions will be evaluated further outside this
substance evaluation.
It is noted that the concern regarding the transformation products formed under anaerobic
conditions is valid not only for the Substance but for substances containing resin acids and
rosin acids, or their precursors. Therefore, the eMSCA considers that, if this issue of
degradation/ transformation products produced under anaerobic conditions is considered
relevant under REACH, it is preferable to consider this concern first for the whole group of
relevant substances (i.e., in this case, the substances containing resin acids and rosin acids
or their precursors) rather than only for a single substance such as the Substance. If the
concern for PBT/vPvB transformation products under anaerobic conditions is confirmed for
the Substance based on a further assessment, this could potentially warrant changes in
the PBT/vPvB conclusion of the Substance.
Table 46. Summary and conclusions of PBT/vPvB properties for the relevant
fractions of the Substance (EC 266-042-9). “Pot.” = “potentially” (meaning that
there is a concern with the endpoint but no sufficient information is available on
the constituent/substance for a definitive conclusion). Note that the conclusions
“Not P”, “Not vP”, “Pot. B”, "Pot. vB”, etc., concern the parent compounds,
meaning that, “Not P” is indicated when there is no concern with the parent
constituent and “Pot. P” is indicated only when there is a concern with the parent
constituent. The concerns relevant for transformation products are indicated by
the respective footnotes (i.e., the footnotes b and c).
SUMMARY OF PBT AND vPvB PROPERTIES
Resin acids and rosin acids
Mono-esters
Diesters Triesters Light ends Heavy ends
Substance
End- point
Outcome/conclusion
P/vP Pot. Pa
Pot. vPa Not Pb,c
Not vPb,c
Pot. P Pot. vP
Pot. P Pot. vP
Pot. P Pot. vP
Pot. P Pot. vP
Pot. Pb,d Pot. vPb,d
B/vB Not Ba,b
Not vBa,b Pot. B Pot. vB
Not Bb,c
Not vBb,c
Not Bb,c Not vBb,c
Pot. B Pot. vB
Not Bb,c Not vBb,c
Pot. Bb,d Pot. vBb,d
T Pot. Te Pot. T Pot. T Pot. T Not assessed Not assessedb, c
Pot. Tb,d
PBT/ vPvB
Not PBTb Not PvBb
Not PBTb Not vPvBb
Not PBTb Not vPvBb
Not PBTb Not PvBb
PBT not assessed Pot. vPvB
Not PBTb Not vPvBb
Pot. PBTb,d
Pot. vPvBb,d
aConclusion based on previous assessment (Tukes 2015). bConclusion is pending further assessment regarding the transformation products with potential PBT/vPvB properties which may be produced under anaerobic conditions from resin acids and rosin acids. cIt is noted that the constituent may potentially transform into compounds for which there is insufficient information regarding the respective endpoint (P/B/T), but the information is sufficient to consider that neither the parent constituent nor the transformation products are PBT/vPvB under aerobic conditions. dConclusion is pending further assessment regarding the light ends fraction. eBased on screening level data for isopimaric acid (reviewed in Tukes 2015).
Substance Evaluation Conclusion document EC No 266-042-9
Evaluating MS: Finland Page 139 8 July 2021
7.12 Exposure assessment
The Substance has industrial, professional as well as consumer use (See 7.5.2).
The Substance does not have harmonised classification according to the CLP Regulation
(1272/2008/EC) nor has the registrant(s) self-classified the Substance.
Regarding environmental classification, most of the available experimental studies have
been performed with the UVCB substances (rosin ester substance analogues) as such
(ready biodegradation tests [also with the Substance] and acute ecotoxicity tests). In
addition, there are two ready biodegradability studies on test substances with enriched
glycerol monoesters of rosin (See 7.7.1.3). No studies for terrestrial environment have
been submitted. The lowest EC50 from available acute aquatic toxicity studies is 27 mg/L
from a Daphnia study with an analogue substance resin acids and rosin acids,
hydrogenated, methyl ester. No ecotoxicity studies performed exactly with the Substance
are available. The lowest test result (27 mg/L) with an analogue substance has been used
in the CSR for PNEC derivation. Resin acids and rosin acids, Me esters is self-classified to
Chronic Category 3 as the lowest EC50 value 27 mg/l is > 10 and < 100 mg/l, and it is
considered not readily biodegradable substance. However, the registrant(s) has not used
a read-across approach for the classification of the Substance as no self-classification is
applied.
Acknowledging the identified short-comings in the acute ecotoxicity studies (see 7.11.3)
based on the available information the Substance does not meet the criteria for
classification as hazardous to the aquatic environment according to CLP (1272/2008/EC).
Therefore, the criteria of article 14(4) REACH are currently not fulfilled based on
environmental hazards and the exposure assessment including the generation of exposure
scenarios and exposure estimation, and also risk characterisation for the environment is
not warranted. However, as the available Chemical safety report for the Substance includes
also exposure assessment for the environment, this brief review of the environmental risk
characterisation values was conducted. It is noticed that based on the available information
all RCRs are presently below 1, and no risk for any environment compartment has been
identified.
No hazards have been identified, therefore no exposure assessment and risk
characterisation regarding workers and consumers are needed, Annex I: 0.6.2./0.6.3.).
It is noted that the need for exposure assessment of the Substance should be reviewed in
case relevant new experimental information becomes available (See Section 2, Section
7.11.4).
7.12.1 Human health
Worker
See above (section 7.12.).
Consumer
See above (section 7.12.).
7.12.2 Environment
Aquatic compartment (incl. sediment)
See above (section 7.12.).
Terrestrial compartment

Substance Evaluation Conclusion document EC No 266-042-9
Evaluating MS: Finland Page 140 8 July 2021
See above (section 7.12.).
Atmospheric compartment
See above (section 7.12.).
7.12.3 Combined exposure assessment
No hazards have been identified, therefore assessment of combined exposure is not
considered relevant.
7.13 Risk characterisation
Not evaluated.
7.14 References
Arnot J, Arnot M, Mackay D, Couillard Y, MacDonald D, Bonnell M, Doyle P (2009). Molecular
size cutoff criteria for screening bioaccumulation potential: fact or fiction? Integ. Env. Ass.
Manag. 6(2), 210-224.
Bornscheuer UT (2002). Microbial carboxyl esterases: classi¢cation, properties and
application in biocatalysis FEMS Microbiology Reviews 26 (2002) 73-81
Burggraaf S, Langdon AG, Alistair LW, Roper DS (1996). Accumulation and depuration of
resin acids and fichtelite by the freshwater mussel Hyridella Menziesi. Environ Toxicol Chem
15, 369–375.
Cheremnykh KM, Grishko VV, Ivshina IB (2017). Bacterial degradation of ecotoxic
dehydroabietic acid. Catalysis in Industry 9, 331–338.
Cheremnykh KM, Luchnikova NA, Grishko VV, Ivshina IB (2018). Bioconversion of ecotoxic
dehydroabietic acid using Rhodococcus a ctinobacteria. Journal of Hazardous Materials 346,
103–112.
Commission implementing decision, C(2017) 5834 final.
de Sousa IP, Sousa Teixeira MV, Jacometti Cardoso Furtado NA (2018). An overview of
biotransformation and toxicity of diterpenes. Molecules 23, 1387.
Dimitrov S, Dimitrova N, Parkerton T, Comber M Bonnell M, Mekenyan O (2005). Base-line
model for identifying the bioaccumulation potential of chemicals. SAR and QSAR in Env.
Res. 16 (6), 531-554.
ECHA (2011). Decision on a compliance check of a registration pursuant to article 41(3) of
regulation (EC) No 1907/2006. For Resin acids and rosin acids, hydrogenated, esters with
glycerol. Helsinki 04/11/2011. European Chemicals Agency. Available at:
https://echa.europa.eu/fi/information-on-chemicals/dossier-evaluation-status/-
/dislist/substance/100.060.020 (accessed January 2021).
ECHA 2014. Decision on a testing proposal set out in a registration pursuant to article
40(3) (EC No 266-042-9). Decision number: TPE-D-0000004925-66-05/F. Helsinki, 14
August 2014. European Chemicals Agency. Available at:
https://echa.europa.eu/fi/information-on-chemicals/dossier-evaluation-status/-
/dislist/substance/100.060.020 (accessed March 2021)
ECHA 2017a. Decision on substance evaluation. Resin acids and rosin acids, hydrogenated,
esters with glycerol. EC 266-042-9, CAS 65997-13-9. Helsinki,7 February 2017. European
Chemicals Agency. Available at: https://echa.europa.eu/fi/information-on-

Substance Evaluation Conclusion document EC No 266-042-9
Evaluating MS: Finland Page 141 8 July 2021
chemicals/evaluation/community-rolling-action-plan/corap-table/-
/dislist/details/0b0236e1807e9747 (ccessed January 2021).
ECHA 2017b. Guidance on Information Requirements and Chemical Safety Assessment
Chapter R.11: PBT/vPvB assessment Version 3.0 June 2017. European Chemicals Agency.
ECHA 2017c. Guidance on Information Requirements and Chemical Safety Assessment
Chapter R.7b: Endpoint specific guidance Version 4.0 June 2017. European Chemicals
Agency.
ECHA 2020a. REACH Registrated substance fact sheet. Glycerol (EC 200-289-5),
https://echa.europa.eu/fi/registration-dossier/-/registered-dossier/14481 (accessed May
2020)
ECHA (2020b). Decision on a compliance check. Turpentine, oil (EC 232-350-7, CAS 8006-
64-2. Helsinki, 3 August 2020. European Chemicals Agency. Available at:
https://echa.europa.eu/fi/information-on-chemicals/dossier-evaluation-status/-
/dislist/substance/100.029.407 (accessed January 2021).
ECHA (2021a). Registrated substance fact sheet. Rosin, hydrogenated (EC 266-041-3).
https://echa.europa.eu/fi/registration-dossier/-/registered-dossier/2086 (accessed April
2021)
ECHA (2021b). Registrated substance fact sheet. Alpha-pinene (EC 201-291-9).
https://echa.europa.eu/fi/registration-dossier/-/registered-dossier/14724 (accessed
January 2021)
ECHA (2021c). Registrated substance fact sheet. Turpentine, oil (EC 232-350-7).
https://echa.europa.eu/fi/registration-dossier/-/registered-dossier/15489 (accessed
January 2021)
ECHA (2021d). Registrated substance fact sheet. Caryophyllene (EC 201-746-1).
https://echa.europa.eu/fi/registration-dossier/-/registered-dossier/20872 (accessed
January 2021)
ECHA (2021e). Registrated substance fact sheet. Rosin, oligomers (EC 500-163-2).
https://echa.europa.eu/fi/registration-dossier/-/registered-dossier/13162 (accessed
January 2021)
ECHA (2021f). Registrated substance fact sheet. Beta-pinene (EC 242-060-2).
https://echa.europa.eu/fi/registration-dossier/-/registered-dossier/15934 (accessed
January 2021)
ECHA (2021g). Registrated substance fact sheet. Limonene (EC 227-813-5).
https://echa.europa.eu/fi/registration-dossier/-/registered-dossier/15256 (accessed
January 2021)
ECHA (2021h). Registrated substance fact sheet. Delta-3-carene (EC 207-856-6).
https://echa.europa.eu/fi/registration-dossier/-/registered-dossier/24165 (accessed
January 2021)
ECHA (2021i). Registrated substance fact sheet. Camphene (EC 201-234-8).
https://echa.europa.eu/fi/registration-dossier/-/registered-dossier/14290 (accessed
January 2021)
FSA ANS Panel (EFSA Panel on Food Additives and Nutrient Sources added to Food), Younes
M, Aggett P, Aguilar F, Crebelli R, Filipic M, Frutos MJ, Galtier P, Gott D, Gundert-Remy U,
Kuhnle GG, Lambre C, Leblanc J-C, Lillegaard IT, Moldeus P, Mortensen A, Oskarsson A,
Stankovic I, Waalkens-Berendsen I, Woutersen RA, Wright M, Briemer L, Pasquale M,
Christodoulidou A, Horvath Zs, Lodi F, Tard A and Dusemund B, 2018. Scienti c Opinion
on the re-evaluation of glycerol esters of wood rosin (E 445) as a food additive. EFSA
Journal 2018;16(7):5370, 47 pp. https://doi.org/10.2903/j.efsa.2018.5370
FSA ANS Panel (EFSA Panel on Food Additives and Nutrient Sources added to Food), Younes
M, Aggett P, Aguilar F, Crebelli R, Filipic M, Frutos MJ, Galtier P, Gott D, Gundert-Remy U,
Substance Evaluation Conclusion document EC No 266-042-9
Evaluating MS: Finland Page 142 8 July 2021
Kuhnle GG, Lambre C, Leblanc J-C, Lillegaard IT, Moldeus P, Mortensen A, Oskarsson A,
Stankovic I, Waalkens-Berendsen I, Woutersen RA, Wright M, Briemer L, Pasquale M,
Christodoulidou A, Horvath Zs, Lodi F, Tard A and Dusemund B, 2018. Scienti c Opinion
on the re-evaluation of glycerol esters of wood rosin (E 445) as a food additive. EFSA
Journal 2018;16(7):5370, 47 pp. https://doi.org/10.2903/j.efsa.2018.5370
EFSA ANS Panel (EFSA Panel on Food Additives and Nutrient Sources added to Food)
(2018). Scientifc Opinion on the re-evaluation of glycerol esters of wood rosin (E 445) as
a food additive. EFSA Journal 16(7): 5370, 47
Environment Canada (2011). Screening Assessment for the Challenge - Resin,
hydrogenated; Resin acids and rosin acids, hydrogenated, esters with
pentaerythritol; Resin acids and rosin acids, hydrogenated, esters with glycerol; Resin
acids and rosin acids, hydrogenated, esters triethylene glycol. available at:
https://www.ec.gc.ca/ese-ees/default.asp?lang=En&n=8E8373E7-1
Foss S, Harder J (1998). Thauera linaloolentis sp. nov. and Thauera terpenica sp. nov.
isolated on oxygen-containing monoterpenes (linalool, menthol and eucalyptol) and nitate.
Systematic and Applied Microbiology 21, 365–373.
Fulzele SV, Satturwar PM, Dorle AK (2003). Study of the biodegradation and in vivo
biocompatibility of novel biomaterials. European Journal of Pharmaceutical Sciences 20,
53-61.
Fulzele SV, Satturwar PM, Dorle AK (2007). Novel biopolymers as implant matrix for the
delivery of ciprofloxacin: Biocompatibility, degradation, and in vitro antibiotic release.
Journal of Pharmaceutical Sciences 96, 132–144.
Harder J, Probian C (1997). Anaerobic mineralization of cholesterol by a novel type of
denitrifying bacterium. Archives of Microbiology 167, 269–274.
Hemingway RW, Greaves H (1973). Biodegradation of resin acid sodium salts. Tappi
56(12), 189-192.
JRC (2014). Gottardo, S., Hartmann, N. and Sokull-Kluettgen, B. Review of available
criteria for non-aquatic organisms within PBT/vPvB frameworks. JRC Science and Policy
Report. European Commisison. Report EUR 26802 EN.
Lahdelma I, Oikari A (2005). Resin Acids and Retene in Sediments Adjacent to Pulp and
Paper Industries (8 pp). Journal of Soils and Sediments, 5(2), 74–81.
McLeay DJ, Walden CC, Munro JR (1979). Effect of pH on toxicity of kraft pulp and paper
mill effluent to Salmonid fish in fresh and saltwater. Water Res 13, 249–254.
Leppänen H, Oikari A (2001). Retene and resin acid concentrations in sediment profiles of
a lake recovering from exposure to pulp mill effluents Journal of Paleolimnology, 25(3),
367–374.
Liss, SN, Bicho, PA, Saddled, JN (1997). Microbiology and biodegradation of resin acids in
pulp mill effluents: a minireview. Can J Microbiol 75, 599-611.
Luchnikova NA, Ivanova KM, Tarasova EV, Grishko VV, Ivshina IB (2019). Microbial
Conversion of Toxic Resin Acids. Molecules 24, 4121.
Martin VJJ, Yu Z, Mohn WW (1999). Recent advances in understanding resin acid
biodegradation:microbial diversity and metabolism. Arch Microbiol (1999) 172 :131–138.
Mattson FH and Volpenhein RA (1972). Hydrolysis of fully esterified alcohols containing
from one to eight hydroxyl groups by the lipolytic enzymes of rat pancreatic juice. J Lipid
Res. 1972 May;13(3):325-8.
Mohn WW, Wilson AE, Bicho P, Moore ERB (1999) Physiological and phylogenetic diversity
of bacteria growing on resin acids. Syst Appl Microbiol 22:68–78
National Center for Biotechnology Information (2021a). PubChem Compound Summary for
CID 10569, Abietic acid. https://pubchem.ncbi.nlm.nih.gov/compound/Abietic-acid.
(accessed February 2021)
Substance Evaluation Conclusion document EC No 266-042-9
Evaluating MS: Finland Page 143 8 July 2021
National Center for Biotechnology Information (2021b). PubChem Compound Summary for
CID 94391, Dehydroabietic
acid. https://pubchem.ncbi.nlm.nih.gov/compound/Dehydroabietate. (accessed February
2021)
National Center for Biotechnology Information (2021c). PubChem Compound Summary for
CID 227277, Dihydroabietic
acid. https://pubchem.ncbi.nlm.nih.gov/compound/Dihydroabietic-acid. (accessed
February 2021)
National Center for Biotechnology Information (2021d). PubChem Compound Summary for
CID 72941537, Tetrahydroabietic
acid. https://pubchem.ncbi.nlm.nih.gov/compound/Tetrahydroabietic-acid. (accessed
February 2021)
National Center for Biotechnology Information (2021e). PubChem Compound Summary for
CID 11852355, Glyceryl 1-
abietate. https://pubchem.ncbi.nlm.nih.gov/compound/Glyceryl-1-abietate. (accessed
February 2021)
National Center for Biotechnology Information (2021). PubChem Compound Summary for
CID 124081842, Glyceryl 2-
dehydroabietate. https://pubchem.ncbi.nlm.nih.gov/compound/Glyceryl-2-
dehydroabietate. (accessed February 2021)
Niimi AJ and Lee HB (1992). Free and Conjugated concentrations of nine resin acids in
rainbow trout (Oncorhynchus mykiss) following waterborne exposure. Environmental
Toxicology and Chemistry 11, 1403-1407.
Nyrén V and Back E (1958). The ionisation constant, solubility product and solubility of
abietic and dehydroabietic acid. Acta Chemica Scandinavica 12, 1516-1520.
OECD (2006). Guidelines for the testing of chemicals. Revised introduction to the OECD
guidelines for testing of chemicals, Section 3 Part 1: Principles and strategies related to
the testing of degradation of organic chemicals degradation of organic chemicals.
Savluchinske-Feio S, Curto MJM, Gigante B, Roseiro JC (2006). Antimicrobial activity of
resin acid derivatives. Appl Microbiol Biotechnol (2006) 72:430–436
Study report (1960a). Ninety Day Subacute Oral Toxicity of Pentalyn A Resin. Unpublished
report.
Study report (1960b). Ninety Day Subacute Oral Toxicity of Ester Gum 8D. Unpublished
report.
Study report (1960c). Ninety Day Subacute Oral Toxicity of Pentalyn H. Unpublished
report.
Study report (1960d). Ninety-day Subacute Oral Toxicity of Poly-pale Ester 10.
Unpublished report.
Study report (1960e). Ninety Day Subacute Oral Toxicity of Staybelite Ester 3.
Unpublished report.
Study report (1967). 90-Day Subacute Oral Toxicity of Staybelite Ester 5 (HT-355-62-2)
XA 112-128 Albino Rats. Unpublished report.
Study report (1982a). Three Month Toxicity Study on Ester Gum 8D-SP Given Orally (Diet)
to Rats. Unpublishedreport.
Study report (1982b). Ames Salmonella/Microsome Plate Test PC 12-99. Unpublished
report.
Study report (1985a). 91-Day Subchronic Dietary Toxicity Study in the Rat with Pentalyn
HD-CGR. Unpublished report.
Substance Evaluation Conclusion document EC No 266-042-9
Evaluating MS: Finland Page 144 8 July 2021
Study report (1985b). 28-Day Dietary Screening Study for Rosin Derivative, Ester Gum
8D. Unpublished report.
Study report (1985c). 28-Day Dietary Screening Study for Rosin Derivative, Hercolyn D.
Study number: Hercules Project No. 83-21. Unpublished report.
Study report (1987). 90-Day Dietary Study in Rats with Staybelite Ester 5 (X24343-83-1,
CGR). Unpublished report.
Study report (1988a). Biodegradability study of pentalyn HE in the modified sturm test. .
Unpublished report.
Study report (1988b). Biodegradability study of Hercolyn D in the modified sturm test. .
Unpublished report.
Study report (1988c). Biodegradability study of staybelite ester 10E in the modified sturm
test. Unpublished report.
Study report (1989). 90-Day Dietary Study in Rats with Ester Gum-CGR and Ester Gum-
PGR. . Unpublished report.
Study report (1991). 13-Week Dietary Toxicity Study in Rats. Unpublished report.
Study report (1993a). Fish Acute Toxicity Test of Glycerol Ester of Rosin with Zebrafish
(Brachydanio rerio). Unpublished report.
Study report (1993b). Fish Acute Toxicity Test of Pentaerythritol Ester of Rosin with
Zebrafish (Brachydanio rerio). Unpublished report.
Study report (1993c). Immobilization Test of Glycerol Ester of Rosin with the crustacean
Daphnia magna. Unpublished report.
Study report (1993d). Immobilization Test of Pentaerythritol Ester of Rosin with the
crustacean Daphnia magna. Unpublished report.
Study report (1993e). Growth inhibition test of Glycerol Ester of Rosin with the micro algae
Selenastrum capricornutum. Unpublished report.
Study report (1993f). Growth inhibition test of Pentaerythritol Ester of Rosin with the micro
algae Selenastrum capricornutum. Unpublished report.
Study report (1994). Hercules Incorporated-Hercolyn DR and Hercolyn DE, 13-Week Oral
(Dietary) Toxicity Study in the Rat. Unpublished report).
Study report (1996). Pharmacokinetic Study of Ester Gum 8BG in Rats. Unpublished report.
Study report (1997). ZONESTER® 25: Acute Oral Toxicity (Limit Test) in the Rat.
Unpublished report
Study report (2001a). Rosin, partially hydrogenated, methyl ester, CAS No. 8050-15-5
Determination of Acute Toxicity (LL50) to Fathead Minnows (96 h, Static). Unpublished
report.
Study report (2001b). Rosin esters with Pentaerythritol, CAS No. 8050-26-8 Determination
of Acute Toxicity (LL50) to Fathead Minnows (96 h, Static). Unpublished report.
Study report (2001c). Rosin, partially hydrogenated, methyl ester, CAS No. 8050-15-5
Determination of Acute Toxicity (EL50) to Daphnia (48 h, Static). Unpublished report.
Study report (2001d). Rosin, esters with Pentaerythritol, CAS No. 8050-26-8
Determination of Acute Toxicity (EL50) to Daphnia (48 h, Static). Unpublished report.
Study report (2001e). Rosin, partially hydrogenated, methyl ester, CAS No. 8050-15-5
Alga, Growth Inhibition Test (72 h, EL50). Unpublished report.
Study report (2001f). Rosin, esters with Pentaerythritol, CAS No. 8050-26-8 Alga, Growth
Inhibition Test (72 h, EL50). Unpublished report.
Study report (2002). Determination of Ready Biodegradability of Six Rosin Esters by the
Modified Sturm Test. Unpublished report.
Substance Evaluation Conclusion document EC No 266-042-9
Evaluating MS: Finland Page 145 8 July 2021
Study report (2003a). Determination of the Partition Coefficient of Rosins, Rosin Salts,
Rosin Adducts, Adduct Salts and Rosin Esters. Unpublished report.
Study report (2003b). Rosin, PHME (Cas No. 8050-15-5) Combined Repeated Dose Toxicity
Study with Reproduction/Developmental Toxicity Screening Test. Unpublished report.
Study report (2009). CAS No 8050-26-8 Resin acids and rosin acids, esters with
pentaerythritol: L5178Y TK +/- MOUSE LYMPHOMA ASSAY. Unpublished report.
Study report (2010a). Phys/Chem Testing on a Sample of Glycerol Ester of Hydrogenated
Rosin (CAS 65997-13-9). Unpublished report.
Study report (2010b). CAS No 8050-31-5 Resin and rosin acids, esters with glycerol, Acute
toxicity to Daphnia magna. Unpublished report.
Study report (2010c). CAS No 8050-15-5 Resin acids and rosin acids, hydrogenated,
methyl esters: L5178Y TK +/- MOUSE LYMPHOMA ASSAY. Unpublished report.
Study report (2011). Chromosome Aberration Test in Human Lymphocytes in vitro.
Unpublished report.
Study report (2012a). Resin acids and rosin acids, Me esters 68186-14-1: Assessment of
ready biodegradability; CO2 evolution test. Unpublished report.
Study report (2012b). Benchmark dose modelling of Hercolyn DR and Hercolyn DE.
Unpublished report.
Study report (2014a). Rosin, ethylene glycol ester CAS No. 68512-65-2: Acute Toxicity to
Rainbow Trout (Oncorhynchus mykiss). Unpublished report.
Study report (2014b). Rosin, ethylene glycol ester CAS No. 68512-65-2: Daphnia sp., 48-
Hour Acute Immobilization Test. Unpublished report.
Study report (2014c). Rosin, ethylene glycol ester CAS No. 68512-65-2: Algal Growth
Inhibition Test. Unpublished report.
Study report (2017a). Monoesters of hydrogenated rosin with glycerol: Ready
biodegradability CO2 in sealed vessels (headspace test). Unpublished report.
Study report (2017b). Monoesters of hydrogenated rosin with glycerol: Ready
biodegradability CO2 in sealed vessels (headspace test) – Metabolite identification.
Unpublished report.
Study report (2017c). Analysis of extracts from the ready biodegradability study with
Mono-esters of hydrogenated rosin with glycerol. Unpublished report.
Study report (2017d). Short-term toxicity to aquatic invertebrates. Unpublished report.
Study report (2019a). Monoesters of hydrogenated rosin with glycerol: Determination of
ready biodegradability - CO2 in sealed vessels (Headspace Test). Unpublished report.
Study report (2019b). Monoesters of hydrogenated rosin with glycerol: Analytical method
validation in support of TG 310, Ready Biodegradability – CO2 in sealed vessels (Headspace
Test). Unpublished report.
OECD (2005). SIDS Glycerol. CAS N°: 56-81-5. UNEP Publications.
https://hpvchemicals.oecd.org/UI/handler.axd?id=4b0a2d87-3183-40d4-84f5-
0e118c647b19 (accessed May 2020)
OECD (2002). SIDS Pentaerytritol. CAS N°: 115-77-5. UNEP Publications.
https://hpvchemicals.oecd.org/UI/handler.axd?id=612aeade-0c0d-4fb7-ab3d-
c1b117780e7e (accessed May 2020)
OECD (2006). Guidelines for the testing of chemicals. Revised introduction to the OECD
guidelines for testing of chemicals, Section 3 Part 1: Principles and strategies related to
the testing of degradation of organic chemicals degradation of organic chemicals
Peng G and Roberts JC (2000). Wat. Res. Vol. 34, No. 10, pp. 2779 -2785, 2000
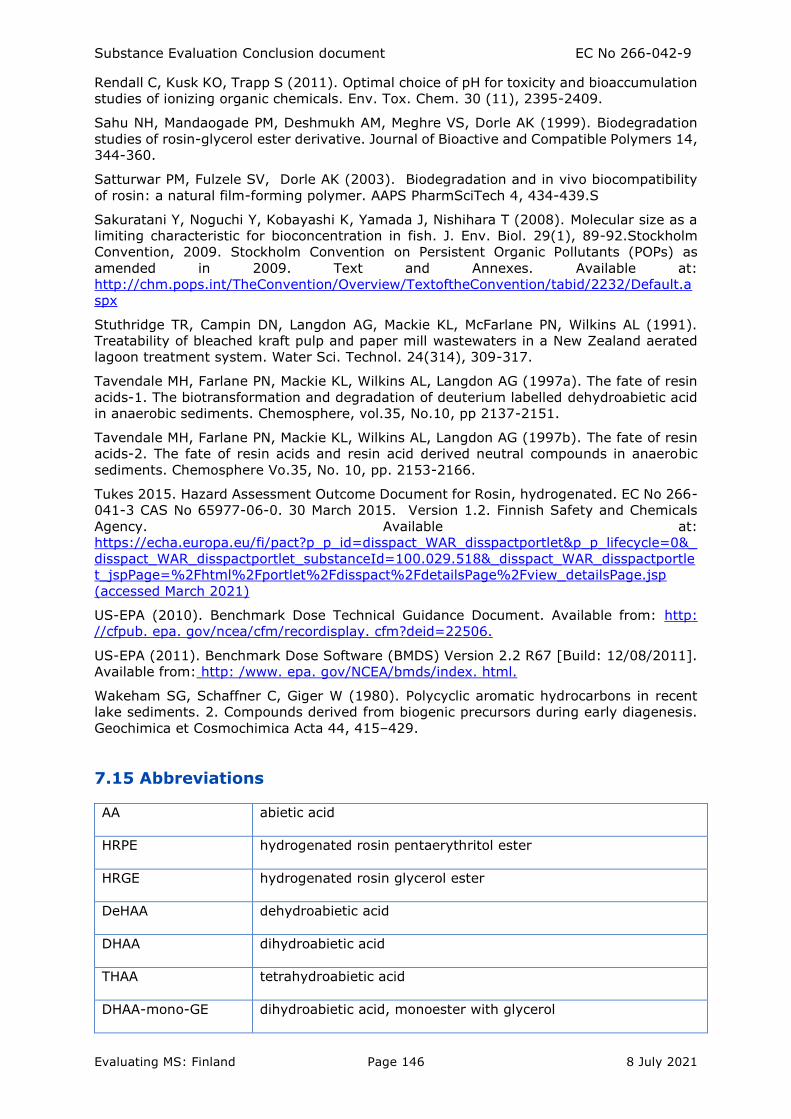
Substance Evaluation Conclusion document EC No 266-042-9
Evaluating MS: Finland Page 146 8 July 2021
Rendall C, Kusk KO, Trapp S (2011). Optimal choice of pH for toxicity and bioaccumulation
studies of ionizing organic chemicals. Env. Tox. Chem. 30 (11), 2395-2409.
Sahu NH, Mandaogade PM, Deshmukh AM, Meghre VS, Dorle AK (1999). Biodegradation
studies of rosin-glycerol ester derivative. Journal of Bioactive and Compatible Polymers 14,
344-360.
Satturwar PM, Fulzele SV, Dorle AK (2003). Biodegradation and in vivo biocompatibility
of rosin: a natural film-forming polymer. AAPS PharmSciTech 4, 434-439.S
Sakuratani Y, Noguchi Y, Kobayashi K, Yamada J, Nishihara T (2008). Molecular size as a
limiting characteristic for bioconcentration in fish. J. Env. Biol. 29(1), 89-92.Stockholm
Convention, 2009. Stockholm Convention on Persistent Organic Pollutants (POPs) as
amended in 2009. Text and Annexes. Available at:
http://chm.pops.int/TheConvention/Overview/TextoftheConvention/tabid/2232/Default.a
spx
Stuthridge TR, Campin DN, Langdon AG, Mackie KL, McFarlane PN, Wilkins AL (1991).
Treatability of bleached kraft pulp and paper mill wastewaters in a New Zealand aerated
lagoon treatment system. Water Sci. Technol. 24(314), 309-317.
Tavendale MH, Farlane PN, Mackie KL, Wilkins AL, Langdon AG (1997a). The fate of resin
acids-1. The biotransformation and degradation of deuterium labelled dehydroabietic acid
in anaerobic sediments. Chemosphere, vol.35, No.10, pp 2137-2151.
Tavendale MH, Farlane PN, Mackie KL, Wilkins AL, Langdon AG (1997b). The fate of resin
acids-2. The fate of resin acids and resin acid derived neutral compounds in anaerobic
sediments. Chemosphere Vo.35, No. 10, pp. 2153-2166.
Tukes 2015. Hazard Assessment Outcome Document for Rosin, hydrogenated. EC No 266-
041-3 CAS No 65977-06-0. 30 March 2015. Version 1.2. Finnish Safety and Chemicals
Agency. Available at:
https://echa.europa.eu/fi/pact?p_p_id=disspact_WAR_disspactportlet&p_p_lifecycle=0&_
disspact_WAR_disspactportlet_substanceId=100.029.518&_disspact_WAR_disspactportle
t_jspPage=%2Fhtml%2Fportlet%2Fdisspact%2FdetailsPage%2Fview_detailsPage.jsp
(accessed March 2021)
US-EPA (2010). Benchmark Dose Technical Guidance Document. Available from: http:
//cfpub. epa. gov/ncea/cfm/recordisplay. cfm?deid=22506.
US-EPA (2011). Benchmark Dose Software (BMDS) Version 2.2 R67 [Build: 12/08/2011].
Available from: http: /www. epa. gov/NCEA/bmds/index. html.
Wakeham SG, Schaffner C, Giger W (1980). Polycyclic aromatic hydrocarbons in recent
lake sediments. 2. Compounds derived from biogenic precursors during early diagenesis.
Geochimica et Cosmochimica Acta 44, 415–429.
7.15 Abbreviations
AA abietic acid
HRPE hydrogenated rosin pentaerythritol ester
HRGE hydrogenated rosin glycerol ester
DeHAA dehydroabietic acid
DHAA dihydroabietic acid
THAA tetrahydroabietic acid
DHAA-mono-GE dihydroabietic acid, monoester with glycerol
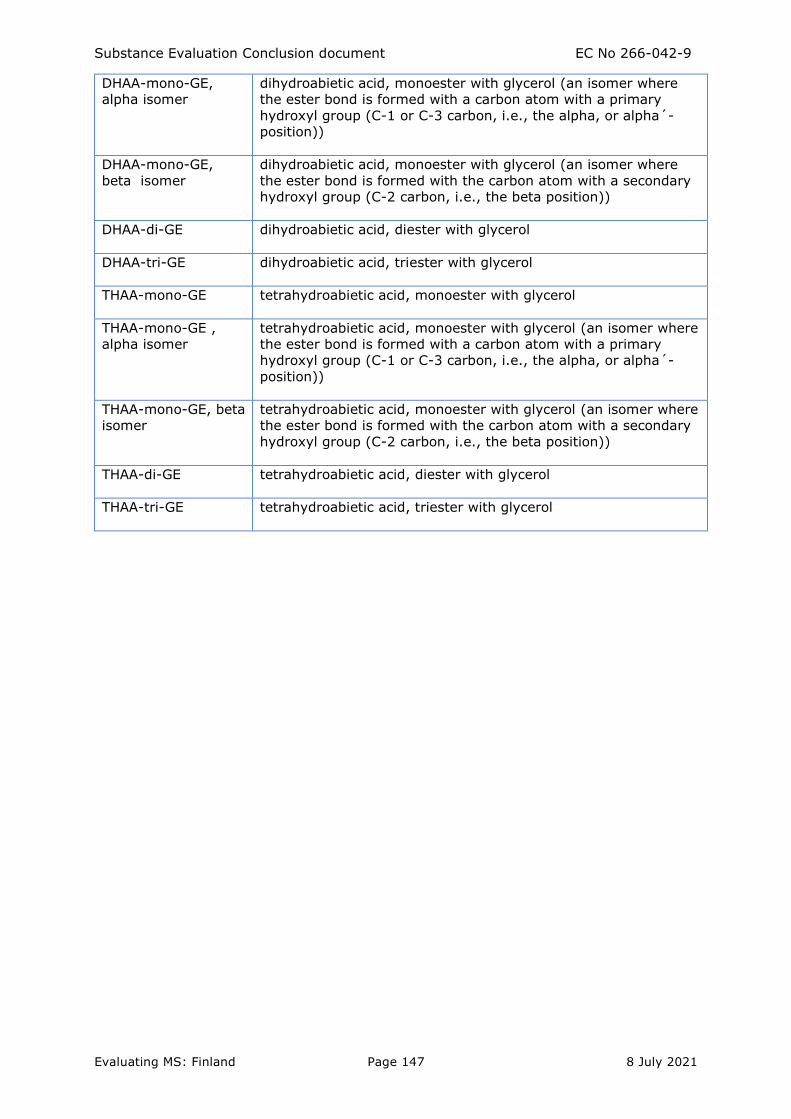
Substance Evaluation Conclusion document EC No 266-042-9
Evaluating MS: Finland Page 147 8 July 2021
DHAA-mono-GE,
alpha isomer
dihydroabietic acid, monoester with glycerol (an isomer where
the ester bond is formed with a carbon atom with a primary
hydroxyl group (C-1 or C-3 carbon, i.e., the alpha, or alpha´-
position))
DHAA-mono-GE,
beta isomer
dihydroabietic acid, monoester with glycerol (an isomer where
the ester bond is formed with the carbon atom with a secondary
hydroxyl group (C-2 carbon, i.e., the beta position))
DHAA-di-GE dihydroabietic acid, diester with glycerol
DHAA-tri-GE dihydroabietic acid, triester with glycerol
THAA-mono-GE tetrahydroabietic acid, monoester with glycerol
THAA-mono-GE ,
alpha isomer
tetrahydroabietic acid, monoester with glycerol (an isomer where
the ester bond is formed with a carbon atom with a primary
hydroxyl group (C-1 or C-3 carbon, i.e., the alpha, or alpha´-
position))
THAA-mono-GE, beta
isomer
tetrahydroabietic acid, monoester with glycerol (an isomer where
the ester bond is formed with the carbon atom with a secondary
hydroxyl group (C-2 carbon, i.e., the beta position))
THAA-di-GE tetrahydroabietic acid, diester with glycerol
THAA-tri-GE tetrahydroabietic acid, triester with glycerol
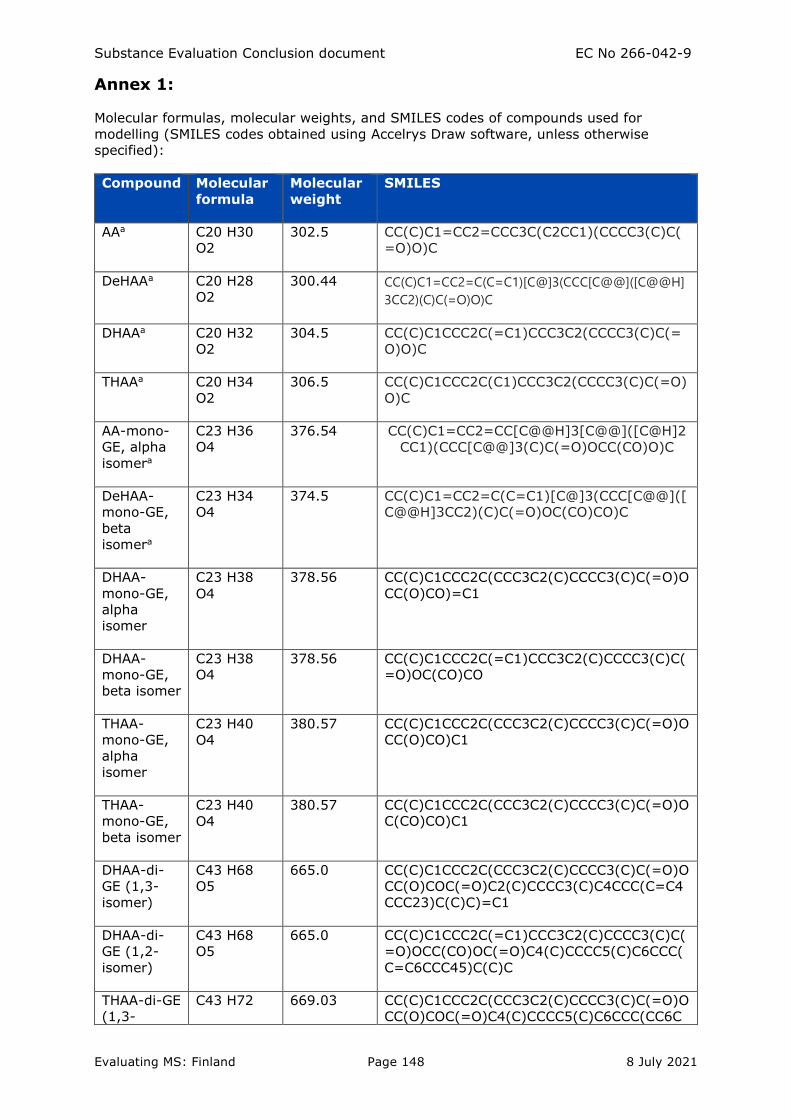
Substance Evaluation Conclusion document EC No 266-042-9
Evaluating MS: Finland Page 148 8 July 2021
Annex 1:
Molecular formulas, molecular weights, and SMILES codes of compounds used for
modelling (SMILES codes obtained using Accelrys Draw software, unless otherwise
specified):
Compound Molecular
formula
Molecular
weight
SMILES
AAa C20 H30
O2
302.5 CC(C)C1=CC2=CCC3C(C2CC1)(CCCC3(C)C(
=O)O)C
DeHAAa C20 H28
O2
300.44 CC(C)C1=CC2=C(C=C1)[C@]3(CCC[C@@]([C@@H]
3CC2)(C)C(=O)O)C
DHAAa C20 H32
O2
304.5 CC(C)C1CCC2C(=C1)CCC3C2(CCCC3(C)C(=
O)O)C
THAAa C20 H34
O2
306.5 CC(C)C1CCC2C(C1)CCC3C2(CCCC3(C)C(=O)
O)C
AA-mono-
GE, alpha
isomera
C23 H36
O4
376.54 CC(C)C1=CC2=CC[C@@H]3[C@@]([C@H]2
CC1)(CCC[C@@]3(C)C(=O)OCC(CO)O)C
DeHAA-
mono-GE,
beta
isomera
C23 H34
O4
374.5 CC(C)C1=CC2=C(C=C1)[C@]3(CCC[C@@]([
C@@H]3CC2)(C)C(=O)OC(CO)CO)C
DHAA-
mono-GE,
alpha
isomer
C23 H38
O4
378.56 CC(C)C1CCC2C(CCC3C2(C)CCCC3(C)C(=O)O
CC(O)CO)=C1
DHAA-
mono-GE,
beta isomer
C23 H38
O4
378.56 CC(C)C1CCC2C(=C1)CCC3C2(C)CCCC3(C)C(
=O)OC(CO)CO
THAA-
mono-GE,
alpha
isomer
C23 H40
O4
380.57 CC(C)C1CCC2C(CCC3C2(C)CCCC3(C)C(=O)O
CC(O)CO)C1
THAA-
mono-GE,
beta isomer
C23 H40
O4
380.57 CC(C)C1CCC2C(CCC3C2(C)CCCC3(C)C(=O)O
C(CO)CO)C1
DHAA-di-
GE (1,3-
isomer)
C43 H68
O5
665.0 CC(C)C1CCC2C(CCC3C2(C)CCCC3(C)C(=O)O
CC(O)COC(=O)C2(C)CCCC3(C)C4CCC(C=C4
CCC23)C(C)C)=C1
DHAA-di-
GE (1,2-
isomer)
C43 H68
O5
665.0 CC(C)C1CCC2C(=C1)CCC3C2(C)CCCC3(C)C(
=O)OCC(CO)OC(=O)C4(C)CCCC5(C)C6CCC(
C=C6CCC45)C(C)C
THAA-di-GE
(1,3-
C43 H72 669.03 CC(C)C1CCC2C(CCC3C2(C)CCCC3(C)C(=O)O
CC(O)COC(=O)C4(C)CCCC5(C)C6CCC(CC6C
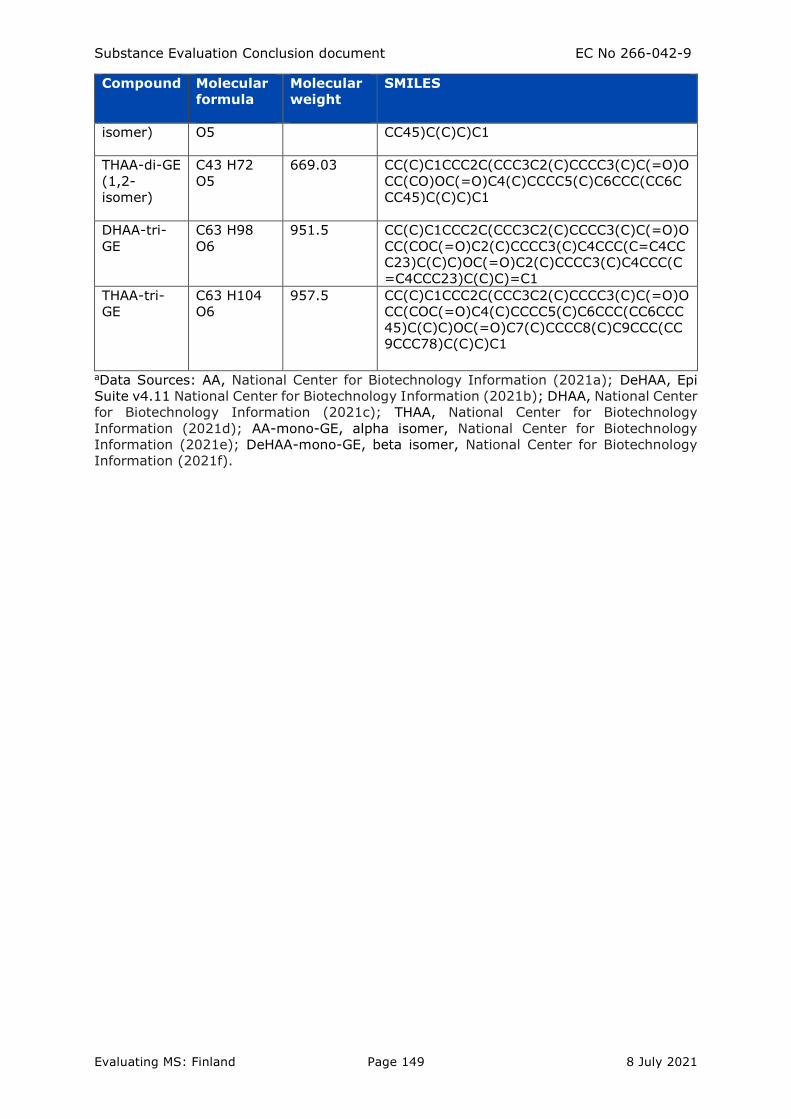
Substance Evaluation Conclusion document EC No 266-042-9
Evaluating MS: Finland Page 149 8 July 2021
Compound Molecular
formula
Molecular
weight
SMILES
isomer) O5 CC45)C(C)C)C1
THAA-di-GE
(1,2-
isomer)
C43 H72
O5
669.03 CC(C)C1CCC2C(CCC3C2(C)CCCC3(C)C(=O)O
CC(CO)OC(=O)C4(C)CCCC5(C)C6CCC(CC6C
CC45)C(C)C)C1
DHAA-tri-
GE
C63 H98
O6
951.5 CC(C)C1CCC2C(CCC3C2(C)CCCC3(C)C(=O)O
CC(COC(=O)C2(C)CCCC3(C)C4CCC(C=C4CC
C23)C(C)C)OC(=O)C2(C)CCCC3(C)C4CCC(C
=C4CCC23)C(C)C)=C1
THAA-tri-
GE
C63 H104
O6
957.5 CC(C)C1CCC2C(CCC3C2(C)CCCC3(C)C(=O)O
CC(COC(=O)C4(C)CCCC5(C)C6CCC(CC6CCC
45)C(C)C)OC(=O)C7(C)CCCC8(C)C9CCC(CC
9CCC78)C(C)C)C1
aData Sources: AA, National Center for Biotechnology Information (2021a); DeHAA, Epi
Suite v4.11 National Center for Biotechnology Information (2021b); DHAA, National Center
for Biotechnology Information (2021c); THAA, National Center for Biotechnology
Information (2021d); AA-mono-GE, alpha isomer, National Center for Biotechnology
Information (2021e); DeHAA-mono-GE, beta isomer, National Center for Biotechnology
Information (2021f).
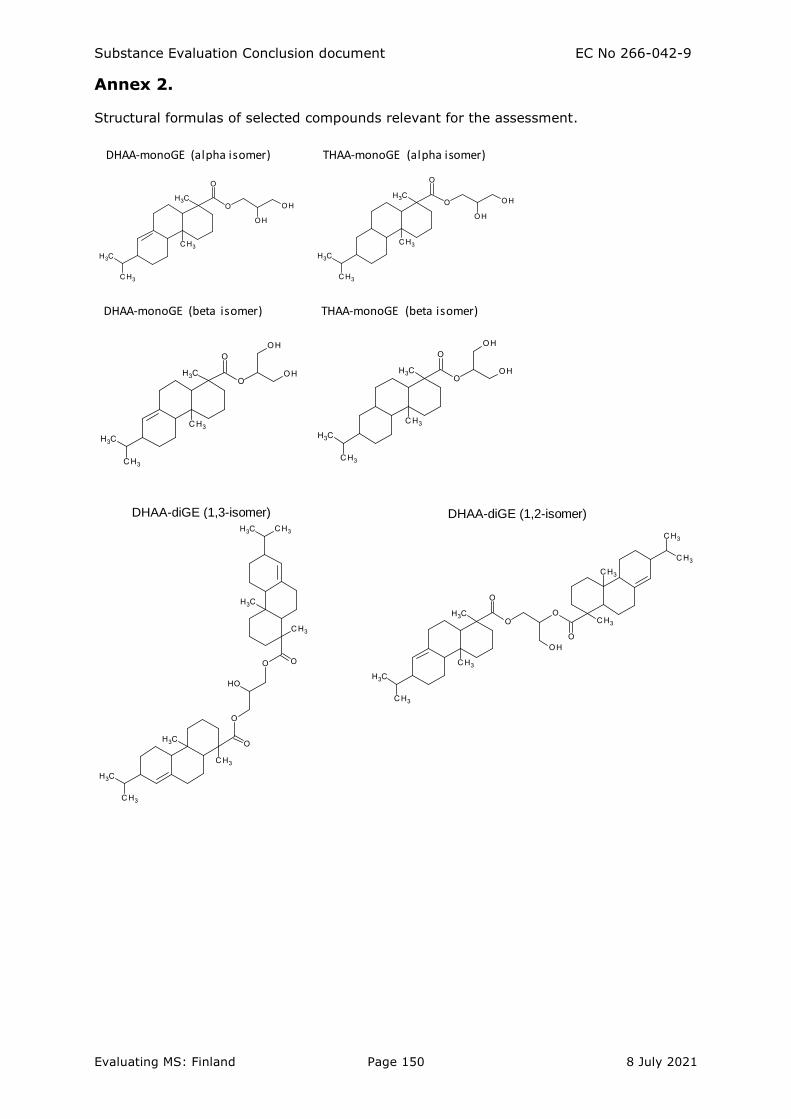
Substance Evaluation Conclusion document EC No 266-042-9
Evaluating MS: Finland Page 150 8 July 2021
Annex 2.
Structural formulas of selected compounds relevant for the assessment.
DHAA-monoGE (alpha isomer)
DHAA-monoGE (beta isomer)
THAA-monoGE (alpha isomer)
THAA-monoGE (beta isomer)
DHAA-diGE (1,2-isomer)DHAA-diGE (1,3-isomer)
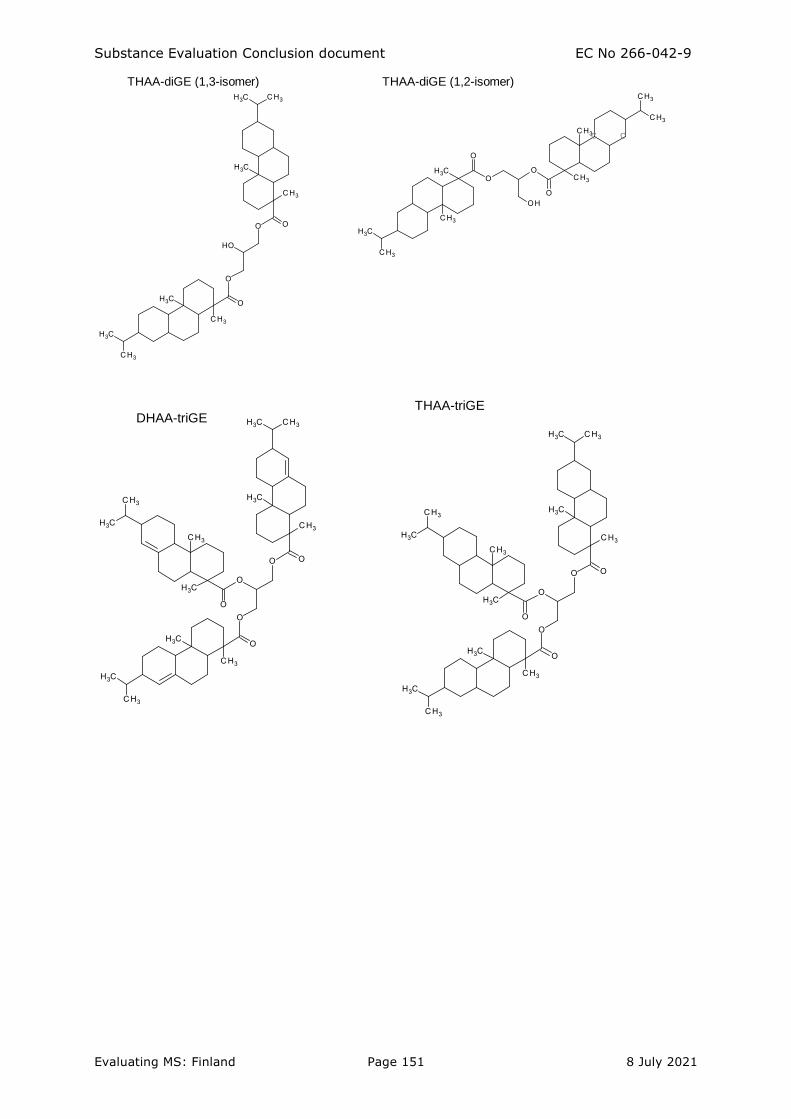
Substance Evaluation Conclusion document EC No 266-042-9
Evaluating MS: Finland Page 151 8 July 2021
THAA-diGE (1,3-isomer) THAA-diGE (1,2-isomer)
DHAA-triGETHAA-triGE