Application of Waste Glycerol as a Draw Solution for Forward ...
14
Citation: Bernacka, E.; Jaroszek, H.; Turek, M.; Dydo, P.; Czechowicz, D.; Mitko, K. Application of Waste Glycerol as a Draw Solution for Forward Osmosis. Membranes 2022, 12, 44. https://doi.org/10.3390/ membranes12010044 Academic Editor: Boguslaw Kruczek Received: 2 November 2021 Accepted: 21 December 2021 Published: 29 December 2021 Publisher’s Note: MDPI stays neutral with regard to jurisdictional claims in published maps and institutional affil- iations. Copyright: © 2021 by the authors. Licensee MDPI, Basel, Switzerland. This article is an open access article distributed under the terms and conditions of the Creative Commons Attribution (CC BY) license (https:// creativecommons.org/licenses/by/ 4.0/). membranes Article Application of Waste Glycerol as a Draw Solution for Forward Osmosis Ewa Bernacka 1, * , Hanna Jaroszek 1 , Marian Turek 2 , Piotr Dydo 2 , Dymitr Czechowicz 2 and Krzysztof Mitko 2 1 PolymemTech Sp. z o.o., Ul. Wolodyjowskiego 46, 02-724 Warsaw, Poland; [email protected] 2 Faculty of Chemistry, Silesian University of Technology, Ul. B. Krzywoustego 6, 44-100 Gliwice, Poland; [email protected] (M.T.); [email protected] (P.D.); [email protected] (D.C.); [email protected] (K.M.) * Correspondence: [email protected] Abstract: Waste glycerol generated during biofuel production accounts for ~10% of total biodiesel volume. Increasing the use of renewable energy sources, including so-called biodiesel, will signifi- cantly increase the amount of waste glycerol for disposal. One possible route for waste glycerol reuse is to use it as a draw solution in forward osmosis (FO). Glycerol solutions are particularly suited as FO draw solutions due to their high osmotic pressures. In this work, the effects of waste glycerol composition on FO draw solution osmotic pressures, as well as the effects of membrane type and linear flow velocities on FO water and reverse flux, were investigated. Those results indicated the feasibility of using waste glycerol as a draw solution in FO, allowing the reuse of significant amounts of this by-product. Keywords: forward osmosis; waste glycerol; draw solution 1. Introduction Usage of biofuels—fuels produced from biomass—is increasing worldwide; however, their production often generates many unwanted by-products. Several methods to produce biofuels from vegetable oil have been developed: thermal and catalytic cracking, pyrolysis, microemulgation, and, the most common method, transesterification [1]. Transesterification produces esters (biodiesel) and glycerol, the waste by-product. Glycerol accounts for approximately 10% of the total biodiesel production volume [2,3] and usually contains 50–85% glycerol, inorganic salts (NaCl, KCl, or K 2 SO 4 , depending on the production technology), and methanol [4]. The actual product composition depends on the quality of the compounds used, the molar ratio of oil to methanol, the type and quantity of catalyst, the process temperature, stirring speed, separation time, and pressure. Increasing demand and production of biofuels requires utilizing a large amount of waste glycerol, and there are several methods for doing so. Unpurified waste glycerol may be used as a supplemental energy source for cattle, broiler, and pig food, or to dilute liquid fertilizers [5]. Due to its high energy content, crude glycerol is used directly as boiler fuel or for the co- generation of electricity and thermal energy. The largest glycerol consumers are, however, the pharmaceutical, chemical, and cosmetic industries, which require purification and concentration of waste glycerol prior to use. Proper treatment technologies are selected based on customer needs [1]. Industrial purification of crude glycerol usually requires the removal of organic pollutants, desalination (which usually requires dilution of the dense crude solution), and dehydration. As its thermal instability makes simple distillation ineffective, ion exchange and vacuum distillation are two commonly used methods. This has led to the rising need for inexpensive methods of purification and concentration of waste glycerol. Membranes 2022, 12, 44. https://doi.org/10.3390/membranes12010044 https://www.mdpi.com/journal/membranes
-
Upload
khangminh22 -
Category
Documents
-
view
1 -
download
0
Transcript of Application of Waste Glycerol as a Draw Solution for Forward ...
Citation: Bernacka, E.; Jaroszek, H.;
Turek, M.; Dydo, P.; Czechowicz, D.;
Mitko, K. Application of Waste
Glycerol as a Draw Solution for
Forward Osmosis. Membranes 2022,
12, 44. https://doi.org/10.3390/
membranes12010044
Academic Editor: Boguslaw Kruczek
Received: 2 November 2021
Accepted: 21 December 2021
Published: 29 December 2021
Publisher’s Note: MDPI stays neutral
with regard to jurisdictional claims in
published maps and institutional affil-
iations.
Copyright: © 2021 by the authors.
Licensee MDPI, Basel, Switzerland.
This article is an open access article
distributed under the terms and
conditions of the Creative Commons
Attribution (CC BY) license (https://
creativecommons.org/licenses/by/
4.0/).
membranes
Article
Application of Waste Glycerol as a Draw Solution forForward OsmosisEwa Bernacka 1,* , Hanna Jaroszek 1 , Marian Turek 2, Piotr Dydo 2, Dymitr Czechowicz 2
and Krzysztof Mitko 2
1 PolymemTech Sp. z o.o., Ul. Wołodyjowskiego 46, 02-724 Warsaw, Poland; [email protected] Faculty of Chemistry, Silesian University of Technology, Ul. B. Krzywoustego 6, 44-100 Gliwice, Poland;
[email protected] (M.T.); [email protected] (P.D.); [email protected] (D.C.);[email protected] (K.M.)
* Correspondence: [email protected]
Abstract: Waste glycerol generated during biofuel production accounts for ~10% of total biodieselvolume. Increasing the use of renewable energy sources, including so-called biodiesel, will signifi-cantly increase the amount of waste glycerol for disposal. One possible route for waste glycerol reuseis to use it as a draw solution in forward osmosis (FO). Glycerol solutions are particularly suited asFO draw solutions due to their high osmotic pressures. In this work, the effects of waste glycerolcomposition on FO draw solution osmotic pressures, as well as the effects of membrane type andlinear flow velocities on FO water and reverse flux, were investigated. Those results indicated thefeasibility of using waste glycerol as a draw solution in FO, allowing the reuse of significant amountsof this by-product.
Keywords: forward osmosis; waste glycerol; draw solution
1. Introduction
Usage of biofuels—fuels produced from biomass—is increasing worldwide; however,their production often generates many unwanted by-products. Several methods to producebiofuels from vegetable oil have been developed: thermal and catalytic cracking, pyrolysis,microemulgation, and, the most common method, transesterification [1]. Transesterificationproduces esters (biodiesel) and glycerol, the waste by-product. Glycerol accounts forapproximately 10% of the total biodiesel production volume [2,3] and usually contains50–85% glycerol, inorganic salts (NaCl, KCl, or K2SO4, depending on the productiontechnology), and methanol [4]. The actual product composition depends on the qualityof the compounds used, the molar ratio of oil to methanol, the type and quantity ofcatalyst, the process temperature, stirring speed, separation time, and pressure. Increasingdemand and production of biofuels requires utilizing a large amount of waste glycerol,and there are several methods for doing so. Unpurified waste glycerol may be used as asupplemental energy source for cattle, broiler, and pig food, or to dilute liquid fertilizers [5].Due to its high energy content, crude glycerol is used directly as boiler fuel or for the co-generation of electricity and thermal energy. The largest glycerol consumers are, however,the pharmaceutical, chemical, and cosmetic industries, which require purification andconcentration of waste glycerol prior to use. Proper treatment technologies are selectedbased on customer needs [1]. Industrial purification of crude glycerol usually requiresthe removal of organic pollutants, desalination (which usually requires dilution of thedense crude solution), and dehydration. As its thermal instability makes simple distillationineffective, ion exchange and vacuum distillation are two commonly used methods. Thishas led to the rising need for inexpensive methods of purification and concentration ofwaste glycerol.
Membranes 2022, 12, 44. https://doi.org/10.3390/membranes12010044 https://www.mdpi.com/journal/membranes
Membranes 2022, 12, 44 2 of 14
Forward osmosis (FO) is a relatively new membrane process and requires less energythan other dehydration methods [6,7]. It is based on the transport of water through adense semi-permeable membrane, similar to reverse osmosis (RO); however, unlike RO,FO does not require high pressures. The driving force of forward osmosis is the osmoticpressure difference across the membrane. Water is transported from the feed solution—asolution of low osmotic pressure (e.g., freshwater, river water) into the so-called drawsolution—a solution of high osmotic pressure (e.g., sea water, waste glycerol)—via osmosis.Solutes influencing the osmotic pressure of the solution (e.g., salt, ionic liquids, organiccompounds) are transported into the feed solution (low concentration) due to the differenceof chemical potential on both sides of the membrane [8]. Forward osmosis operates at lowerhydraulic pressures than common pressure-driven methods: for instance, the pressurerange for reverse osmosis is 5–70 bar; for nanofiltration, the pressure ranges from 5–40 bar.However, for forward osmosis, the required pressure ranges from 0–5 bar. Forward osmosisis environmentally friendly and follows green chemistry principles. Forward osmosishas applications in water desalination, brine concentration, water softening, wastewaterpurification, and production of drinking water from seawater [9–11]. Various aspects offorward osmosis, such as the draw solution [12,13], the membranes used [14–18], foulingand scaling [19,20], flux [21], and energy consumption [7], have been reported previously.The most commonly used draw solutions are inorganic salts, such as MgCl2, NH4HCO3,and Al2(SO4)3, or organic compounds, such as glucose, fructose, and methanol, or organicsalts [13,22].
High osmotic pressure makes glycerol solutions suitable draw solutions for forwardosmosis [21,23]. For example, waste glycerol was applied in laboratory experiments ina crude glycerol fermentation biorefinery as a draw solution for dehydration of butanolobtained during crude glycerol fermentation [24,25]. In addition, FO can be used as anenergy-saving alternative for glycerol dehydration, as compared to more commonly usedvacuum evaporation. This study aims to prove that crude glycerol can serve as an FO drawsolution for partial dewatering of purified glycerol from biodiesel production to obtain a>95% glycerol solution, pure enough for pharmaceutical/cosmetological applications. Theproposal is to effect the simultaneous concentration of purified glycerol while using thewater removed to dilute the crude glycerol.
The water flux in FO, thus the dehydration rate and achievable concentration, de-pends on its driving force—osmotic pressure difference—while so-called reverse fluxes ofcompounds contained in the draw solution (impurities transported from draw solutionto feed solution) are diffusion-driven and affected by concentration differences and flowconditions. To maximize FO efficiency, the highest possible osmotic pressure gradient andthe lowest possible reverse flux of impurities should be maintained during the process.To achieve this: (a) the effects of processing parameters, such as the membrane and linearflow velocity, should be determined; (b) a draw solution with the highest possible osmoticpressure should be selected; and (c) the water flux dependence on the driving force shouldbe determined. This work addresses these aspects and formulates criteria to assess wasteglycerol as a forward osmosis draw solution with the potential for additional applicationsin designing crude glycerol purification processes that produce high purity glycerol.
2. Materials and Methods2.1. Model Solutions of Waste Glycerol
Model solutions of waste glycerol were prepared by mixing pharmaceutical-gradeglycerol (Bio-Chem Sp. z o.o.) and model impurities: inorganic salts: NaCl, purity (99.5%,POCH); organic impurities: methanol, pure (99.8%, POCH). Ultrapure water with a resis-tivity of 15 MΩ·cm was produced with an Elix Essential Water Purification System (MerckMillipore, Burlington, MA, USA) throughout the experiments. Waste glycerol often containsash but was not considered in this study because it does not transport through membranes.

Membranes 2022, 12, 44 3 of 14
2.2. Analysis of Impurity Levels
Concentrations of ionic impurities were determined by ion chromatography (Ion Chro-matograph Dionex ICS-5000+ Reagent-Free HPIC System). Methanol and glycerol concen-trations were determined by gas chromatography (Shimadzu GC-2010, equipped with anFID detector, autosampler, stove with programmable temperature ranging from 40–450 C).
2.3. Osmotic Pressure Determination
As the difference of osmotic pressure between feed and draw solution drives the FOprocess, the osmotic pressure of each solution was the most important parameter to achievethe high water flux. Osmotic pressure, as well as freezing point depression, is a colligativeproperty and derives from Raoult’s law. Osmotic pressure was calculated based on freezingpoint by a combination of equations for osmotic pressure and freezing point [26]. Freezingpoints of the glycerol solutions were determined using an osmometer 800CLG (Trident Med,Warszawa, Poland) with an additional Peltier cell, which allows the cooling temperature tolie in a range from −7 to −38 C (thus allowing measurement of osmotic pressure from0–400 bar with a measurement uncertainty of ±15%). Values exceeding the measurementrange were extrapolated using Statistica 13.1 software.
2.4. Diffusion Experiments
Water flux and reverse flux of solutes are the two most important parameters char-acterizing transport through a membrane, and thus FO efficiency. They depend on thedriving force and the membrane properties.
The first part of the FO experiments measured water and reverse fluxes through themembrane to select the best FO membrane. These measurements were conducted in abatch mode in a self-constructed laboratory module consisting of two chambers with amagnetic stirrer (1200 rpm) in each chamber to minimalize the concentration polarizationeffect (the effect of stirring rate was not verified on concentration polarization), separatedby the semi-permeable flat-sheet membrane under investigation. The effective membranearea was 60 cm2. The feed was 500 mL of ultrapure water, whereas the draw solutionwas 350 mL of either 40% pure glycerol, or 40% glycerol with contaminants (3% NaCl and5% methanol). All experiments were conducted at 21 C. Aliquots (0.5 mL) were takenevery 15, 30, or 60 min depending on the water flux.
Three types of membranes were examined (see Table 1). RO and NF membraneswere investigated to determine whether it was possible to restrain the reverse flux ofimpurities relative to the FO membrane. RO and NF membranes are characterized by a thicksupport layer (unlike FO membranes) to withstand high pressure, which could becomea severe limitation when used as an FO membrane because the internal concentrationpolarization (ICP) diminishes the water flux. Membranes were rinsed and soaked in cleanultrapure water for at least 24 h for conditioning and removal of the preservatives beforethe experiments were conducted.
After membrane selection with the highest water flux and relatively low reverse flux,the diffusion of methanol, salt, and glycerol from draw solutions (comprising 20–80%glycerol, 5% methanol, 1–5% NaCl—the data range of variability in the composition ofwaste glycerol in the literature [2]) through the selected membranes was investigated.All experiments were conducted in batch mode under the same conditions as duringmembrane selection.
Membranes 2022, 12, 44 4 of 14
Table 1. Characteristics of the membranes tested.
Type ofMembrane
MembranePurpose
****Pore
Size/MWCO Rejection Polymer pH Range AppliedPressure Flux
SW30 * (DowFilmtec) RO ~100 Da 99.6% NaCl Polyamide TFC 2–11 55 bar 30.6–40.8 l/m2h;
TW30 ** (DowFilmtec) RO ~100 Da 99.5% NaCl Polyamide TFC 2–11 15 bar 51.0–54.4 l/m2h;
NF270 ***(Dow Filmtec) NF ~200–400 Da 99.2% MgSO4 Polyamide TFC 2–11 9 bar 51.3–52l/m2h;
Aquaporininside forward
osmosismembrane
(Aquaporin)
FO No data
NaCl reverse flux<2.5 g/m2/hr
(H2O vs. 1 M NaCl;FO mode)
Protein-embeddedpolyamide
AquaporinTFC2–11 >7 (H2O vs. 1 M
NaCl; FO mode)
Process parameters determined by manufacturers in the following test conditions: * 32,000 ppm NaCl feed stream(5 ppm boron, SW30HRLE), 25 C and 2–8% recovery; ** 2000 ppm NaCl feed stream XLE & LP, 500 ppm NaClfeed stream, 25 C and 5–15% recovery; *** 2000 ppm MgSO4, and 25 C and 15% recovery. **** According to themanufacturer.
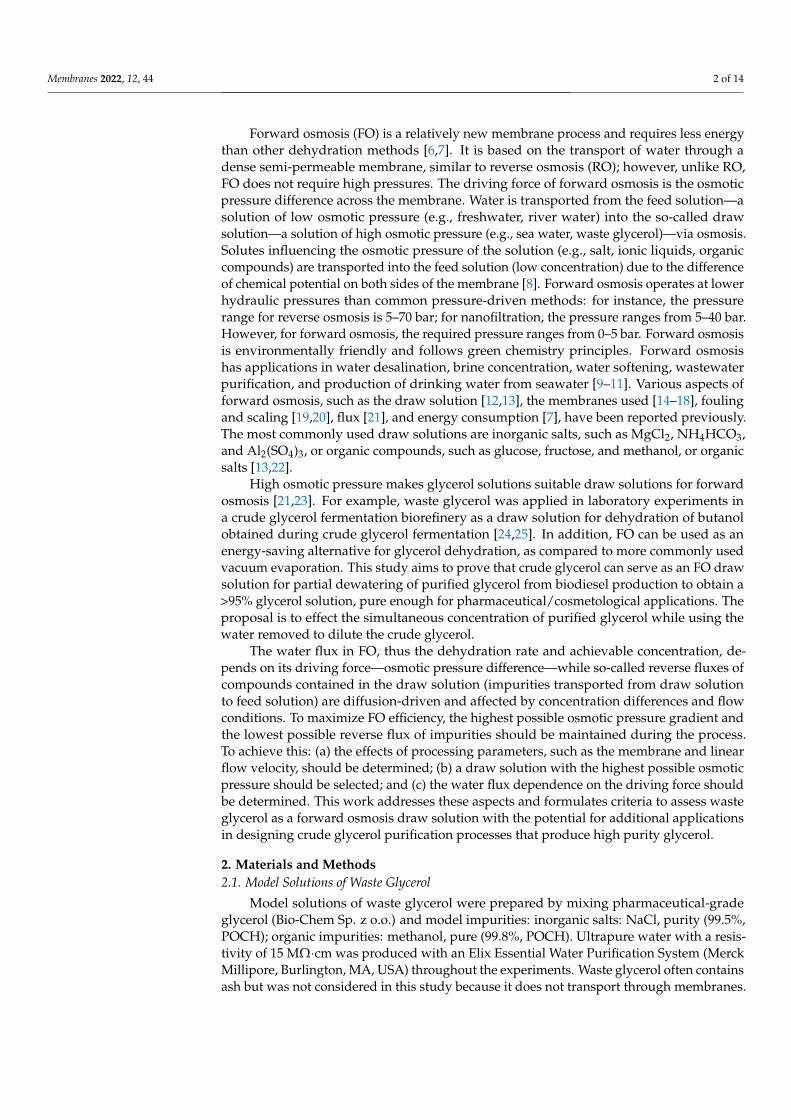
As flow conditions affected mass transfer conditions, further FO experiments wereconducted to investigate the effect of linear flow velocity on fluxes across the membrane.These were conducted in the single pass CF042D-FO Sterlitech laboratory module (Figure 1)equipped with a flat-sheet Aquaporin membrane with an effective surface of 42 cm2 (activemembrane length 9.2 cm), and a 0.7 mm thick spacer. The following draw solutions wereused in experiments:
• 40% glycerol, 3% NaCl;• 40% glycerol, 5% NaCl;• 40% glycerol, 3% NaCl, 5% methanol;• 40% glycerol, 3% NaCl, 10% methanol;• 60% glycerol, 5% methanol;• 70% glycerol, 3% NaCl, 8% methanol;• 80% glycerol, 3% NaCl;• 80% glycerol, 5% NaCl;• 80% glycerol, 3% NaCl, 5% methanol;• 80% glycerol, 3% NaCl, 10% methanol.
Membranes 2022, 12, x FOR PEER REVIEW 5 of 14
Figure 1. CF042D-FO Sterlitech laboratory module.
Fluxes of water, salt, and glycerol were determined based on volume change, density, and measured compositions (analyzed by ion and gas chromatography) of the obtained solutions. Aliquots (0.5 mL, for RO and NF every 60 min, for FO every 15 min) were col-lected during these experiments. In all experiments, the membranes faced draw solutions with an active layer and DI water at the support layer side; the main role of the membrane in FO was to allow water transport and hinder transport of any other compounds.
3. Results 3.1. Osmotic Pressure of Glycerol Solutions upon Composition
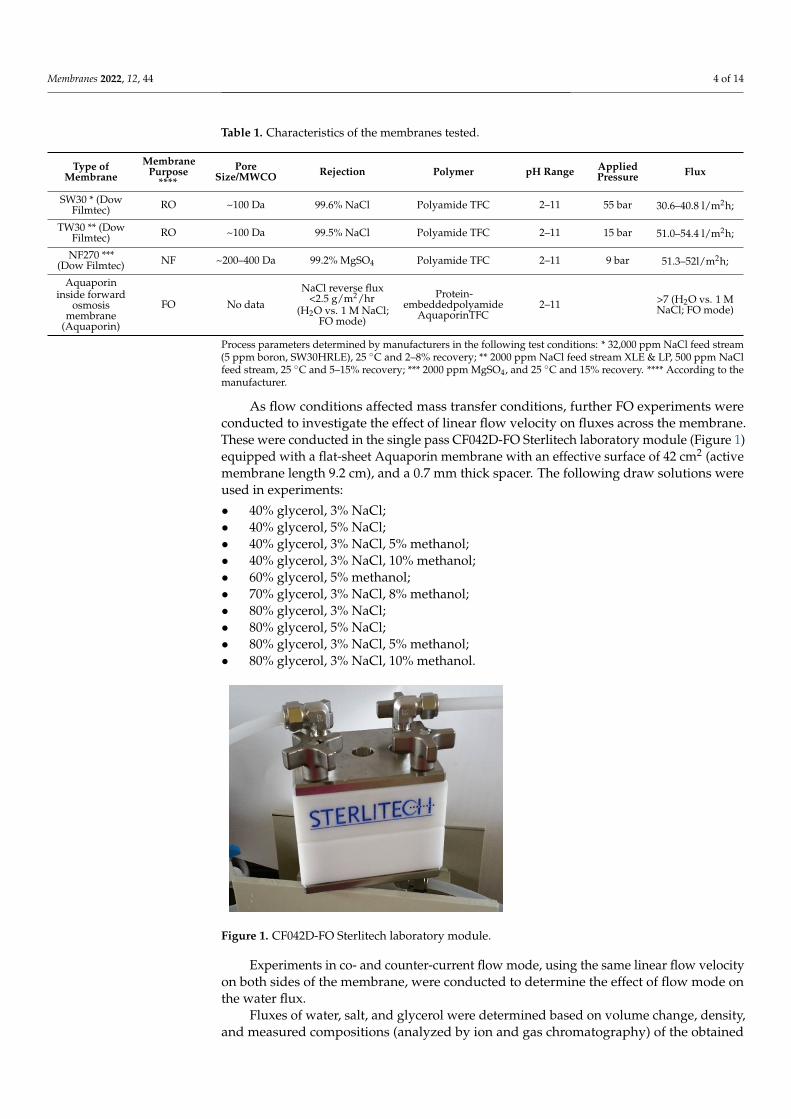
The osmotic pressures of the solutions were calculated based on freezing point de-pression measurements in water–glycerol, water–glycerol–salt, water–glycerol–salt–methanol systems. Raw measurement data are shown in Supplementary Materials. Figure 2 shows the effect of the addition of common waste glycerol impurities on osmotic pres-sure.
Figure 2. The effect of salt and methanol on osmotic pressure, calculated based on freezing point depression measurements in water–glycerol–NaCl–methanol systems.
Figure 1. CF042D-FO Sterlitech laboratory module.
Experiments in co- and counter-current flow mode, using the same linear flow velocityon both sides of the membrane, were conducted to determine the effect of flow mode onthe water flux.
Fluxes of water, salt, and glycerol were determined based on volume change, density,and measured compositions (analyzed by ion and gas chromatography) of the obtained
Membranes 2022, 12, 44 5 of 14
solutions. Aliquots (0.5 mL, for RO and NF every 60 min, for FO every 15 min) werecollected during these experiments. In all experiments, the membranes faced draw solutionswith an active layer and DI water at the support layer side; the main role of the membranein FO was to allow water transport and hinder transport of any other compounds.
3. Results3.1. Osmotic Pressure of Glycerol Solutions upon Composition
The osmotic pressures of the solutions were calculated based on freezing point depres-sion measurements in water–glycerol, water–glycerol–salt, water–glycerol–salt–methanolsystems. Raw measurement data are shown in Supplementary Materials. Figure 2 showsthe effect of the addition of common waste glycerol impurities on osmotic pressure.
Membranes 2022, 12, x FOR PEER REVIEW 5 of 14
Figure 1. CF042D-FO Sterlitech laboratory module.
Fluxes of water, salt, and glycerol were determined based on volume change, density, and measured compositions (analyzed by ion and gas chromatography) of the obtained solutions. Aliquots (0.5 mL, for RO and NF every 60 min, for FO every 15 min) were col-lected during these experiments. In all experiments, the membranes faced draw solutions with an active layer and DI water at the support layer side; the main role of the membrane in FO was to allow water transport and hinder transport of any other compounds.
3. Results 3.1. Osmotic Pressure of Glycerol Solutions upon Composition
The osmotic pressures of the solutions were calculated based on freezing point de-pression measurements in water–glycerol, water–glycerol–salt, water–glycerol–salt–methanol systems. Raw measurement data are shown in Supplementary Materials. Figure 2 shows the effect of the addition of common waste glycerol impurities on osmotic pres-sure.
Figure 2. The effect of salt and methanol on osmotic pressure, calculated based on freezing point depression measurements in water–glycerol–NaCl–methanol systems.
Figure 2. The effect of salt and methanol on osmotic pressure, calculated based on freezing pointdepression measurements in water–glycerol–NaCl–methanol systems.
Two empirical models describing the osmotic pressure dependency upon composi-tion for systems in this study were determined by multiple regression using Statistica13.1 software.
For water–glycerol solutions (Figure 2):
π = 0.1768 × Cg2 − 2.5998 × Cg + 46.401;
R = 0.99685142; R2 = 0.99371276; p < 0.00005; Se = 12.670.
The fitting curve is shown on Figure 2.For water–glycerol–salt and water–glycerol–salt–methanol solutions (Supplementary
Materials Figures S1–S3, Figure 2):
π = −1521.15 + 2964.42 × Wg + 3867.96 × Wmet + 1548.12 × WH2O2 + 3629.31 × WNaCl;
R = 0.99561; R2 = 0.99123619; p < 0.00005; Se = 10.289,
where π = osmotic pressure, bar; W = mass fraction; C = percentage concentration,%; subscripts g, H2O, NaCl denote glycerol, water, and sodium chloride, respectively;Se = standard error of estimate.
Membranes 2022, 12, 44 6 of 14
Extrapolation of the above equations was used to determine the osmotic pressure ofglycerol in solutions when concentrations exceeded the measurement range.
3.2. Selection of Membranes for FO of Glycerol Solutions
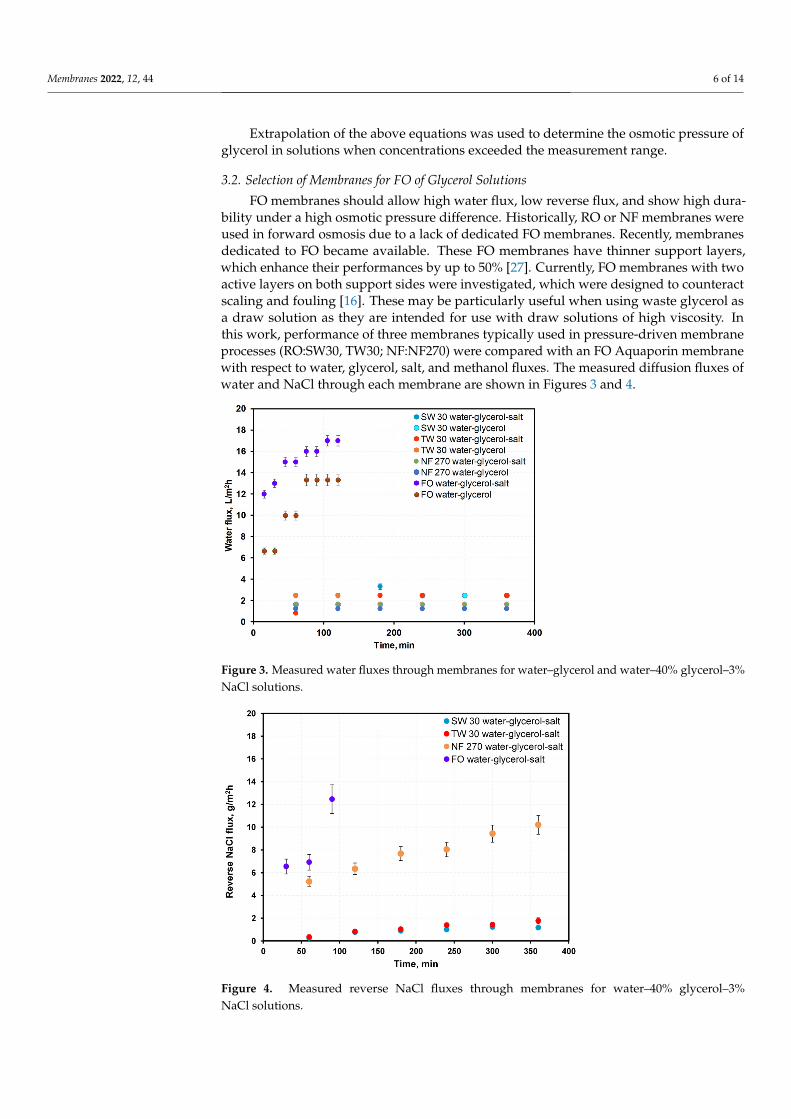
FO membranes should allow high water flux, low reverse flux, and show high dura-bility under a high osmotic pressure difference. Historically, RO or NF membranes wereused in forward osmosis due to a lack of dedicated FO membranes. Recently, membranesdedicated to FO became available. These FO membranes have thinner support layers,which enhance their performances by up to 50% [27]. Currently, FO membranes with twoactive layers on both support sides were investigated, which were designed to counteractscaling and fouling [16]. These may be particularly useful when using waste glycerol asa draw solution as they are intended for use with draw solutions of high viscosity. Inthis work, performance of three membranes typically used in pressure-driven membraneprocesses (RO:SW30, TW30; NF:NF270) were compared with an FO Aquaporin membranewith respect to water, glycerol, salt, and methanol fluxes. The measured diffusion fluxes ofwater and NaCl through each membrane are shown in Figures 3 and 4.
Membranes 2022, 12, x FOR PEER REVIEW 6 of 14
Two empirical models describing the osmotic pressure dependency upon composi-tion for systems in this study were determined by multiple regression using Statistica 13.1 software.
For water–glycerol solutions (Figure 2): π = 0.1768 * Cg2 − 2.5998 * Cg + 46.401;
R = 0.99685142; R2 = 0.99371276; p < 0.00005; Se = 12.670.
The fitting curve is shown on Figure 2. For water–glycerol–salt and water–glycerol–salt–methanol solutions (Supplemen-
tary Materials Figures S1–S3, Figure 2): π = –1521.15 + 2964.42 * Wg + 3867.96 * Wmet + 1548.12 * WH2O2 + 3629.31* WNaCl;
R = 0.99561; R2 = 0. 99123619; p < 0.00005; Se = 10.289,
where π = osmotic pressure, bar; W = mass fraction; C = percentage concentration, %; sub-scripts g, H2O, NaCl denote glycerol, water, and sodium chloride, respectively; Se = stand-ard error of estimate.
Extrapolation of the above equations was used to determine the osmotic pressure of glycerol in solutions when concentrations exceeded the measurement range.
3.2. Selection of Membranes for FO of Glycerol Solutions FO membranes should allow high water flux, low reverse flux, and show high dura-
bility under a high osmotic pressure difference. Historically, RO or NF membranes were used in forward osmosis due to a lack of dedicated FO membranes. Recently, membranes dedicated to FO became available. These FO membranes have thinner support layers, which enhance their performances by up to 50% [27]. Currently, FO membranes with two active layers on both support sides were investigated, which were designed to counteract scaling and fouling [16]. These may be particularly useful when using waste glycerol as a draw solution as they are intended for use with draw solutions of high viscosity. In this work, performance of three membranes typically used in pressure-driven membrane pro-cesses (RO:SW30, TW30; NF:NF270) were compared with an FO Aquaporin membrane with respect to water, glycerol, salt, and methanol fluxes. The measured diffusion fluxes of water and NaCl through each membrane are shown in Figures 3 and 4.
Figure 3. Measured water fluxes through membranes for water–glycerol and water–40% glycerol–3% NaCl solutions. Figure 3. Measured water fluxes through membranes for water–glycerol and water–40% glycerol–3%NaCl solutions.
Membranes 2022, 12, x FOR PEER REVIEW 7 of 14
Figure 4. Measured reverse NaCl fluxes through membranes for water–40% glycerol–3% NaCl so-lutions.
Among the membranes, FO membranes showed the highest water fluxes, and the RO membranes showed the lowest, though for the NaCl flux, the opposite was the case. The NF membranes showed water fluxes higher than RO membranes, and NaCl flux lower than the FO membranes (Figures 3 and 4). High water fluxes across the FO membranes were credited to their porous nature, hydrophilic properties, and small thicknesses. RO and NF processes are normally driven by hydraulic pressure differences, and, according to the widely used solution–diffusion transport model, water flux through a membrane is proportional to the sum of the hydraulic and osmotic pressure differences. In so-called pressure-assisted FO, additional hydraulic pressure is applied to improve water flux. However, the main reason for testing RO and NF membranes was to hinder reverse fluxes of impurities. RO and NF membranes have low bulk porosity, no surface pores, a hydro-phobic support layer, and thick dense support that results in a lower water flux than FO membranes. The RO and NF membranes had high mass transport resistance, which led to severe concentration polarization that decreased the water flux.
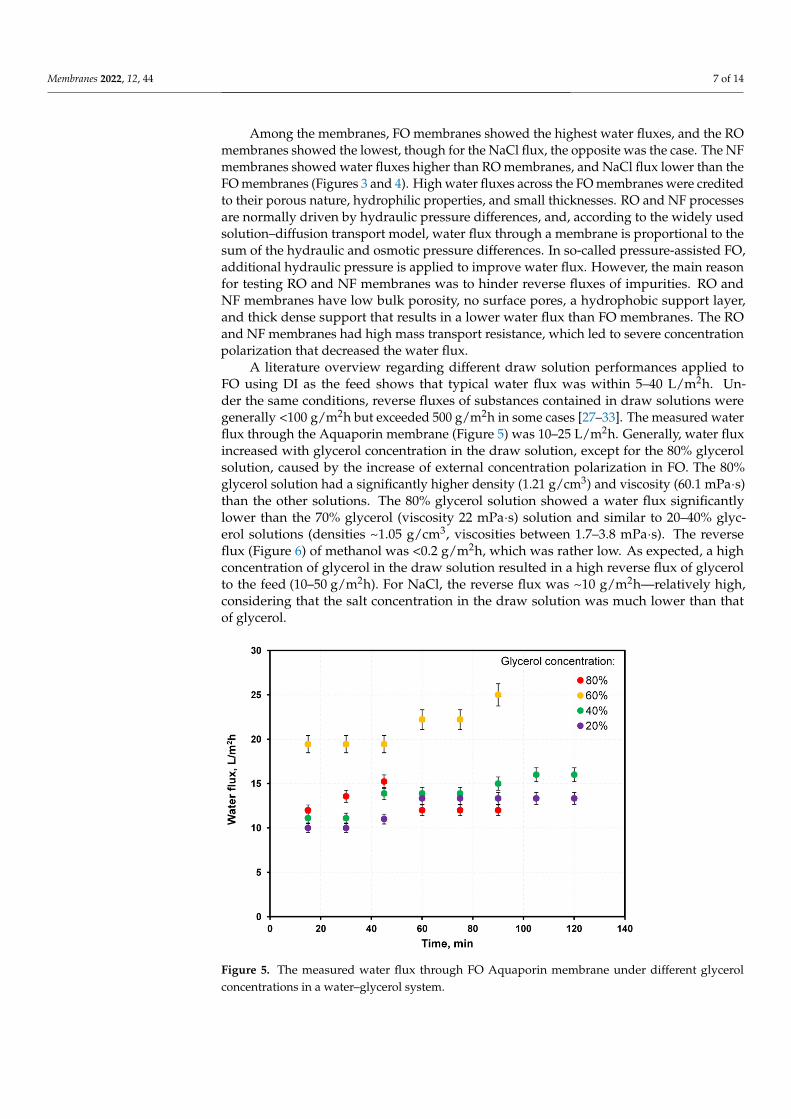
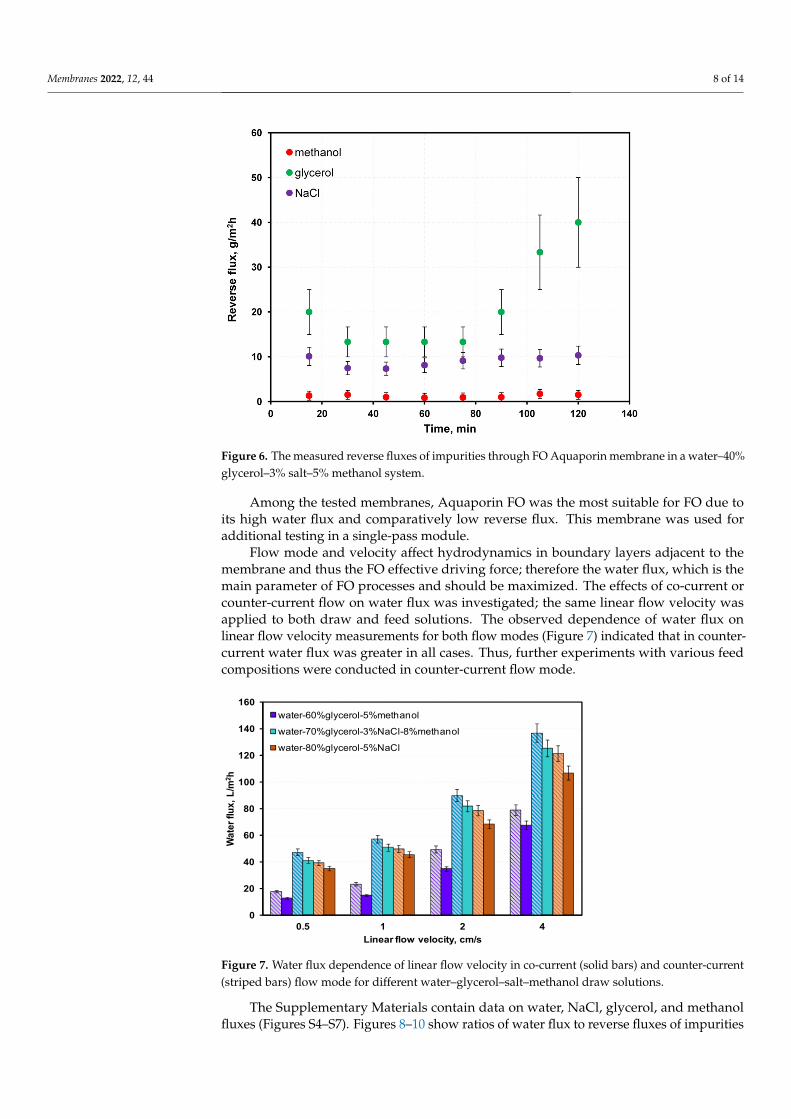
A literature overview regarding different draw solution performances applied to FO using DI as the feed shows that typical water flux was within 5–40 L/m2h. Under the same conditions, reverse fluxes of substances contained in draw solutions were generally <100 g/m2h but exceeded 500 g/m2h in some cases [27–33]. The measured water flux through the Aquaporin membrane (Figure 5) was 10–25 L/m2h. Generally, water flux increased with glycerol concentration in the draw solution, except for the 80% glycerol solution, caused by the increase of external concentration polarization in FO. The 80% glycerol so-lution had a significantly higher density (1.21 g/cm3) and viscosity (60.1 mPa·s) than the other solutions. The 80% glycerol solution showed a water flux significantly lower than the 70% glycerol (viscosity 22 mPa·s) solution and similar to 20–40% glycerol solutions (densities ~1.05 g/cm3, viscosities between 1.7–3.8 mPa·s). The reverse flux (Figure 6) of methanol was <0.2 g/m2h, which was rather low. As expected, a high concentration of glycerol in the draw solution resulted in a high reverse flux of glycerol to the feed (10–50 g/m2h). For NaCl, the reverse flux was ~10 g/m2h—relatively high, considering that the salt concentration in the draw solution was much lower than that of glycerol.
Figure 4. Measured reverse NaCl fluxes through membranes for water–40% glycerol–3%NaCl solutions.
Membranes 2022, 12, 44 7 of 14
Among the membranes, FO membranes showed the highest water fluxes, and the ROmembranes showed the lowest, though for the NaCl flux, the opposite was the case. The NFmembranes showed water fluxes higher than RO membranes, and NaCl flux lower than theFO membranes (Figures 3 and 4). High water fluxes across the FO membranes were creditedto their porous nature, hydrophilic properties, and small thicknesses. RO and NF processesare normally driven by hydraulic pressure differences, and, according to the widely usedsolution–diffusion transport model, water flux through a membrane is proportional to thesum of the hydraulic and osmotic pressure differences. In so-called pressure-assisted FO,additional hydraulic pressure is applied to improve water flux. However, the main reasonfor testing RO and NF membranes was to hinder reverse fluxes of impurities. RO andNF membranes have low bulk porosity, no surface pores, a hydrophobic support layer,and thick dense support that results in a lower water flux than FO membranes. The ROand NF membranes had high mass transport resistance, which led to severe concentrationpolarization that decreased the water flux.
A literature overview regarding different draw solution performances applied toFO using DI as the feed shows that typical water flux was within 5–40 L/m2h. Un-der the same conditions, reverse fluxes of substances contained in draw solutions weregenerally <100 g/m2h but exceeded 500 g/m2h in some cases [27–33]. The measured waterflux through the Aquaporin membrane (Figure 5) was 10–25 L/m2h. Generally, water fluxincreased with glycerol concentration in the draw solution, except for the 80% glycerolsolution, caused by the increase of external concentration polarization in FO. The 80%glycerol solution had a significantly higher density (1.21 g/cm3) and viscosity (60.1 mPa·s)than the other solutions. The 80% glycerol solution showed a water flux significantlylower than the 70% glycerol (viscosity 22 mPa·s) solution and similar to 20–40% glyc-erol solutions (densities ~1.05 g/cm3, viscosities between 1.7–3.8 mPa·s). The reverseflux (Figure 6) of methanol was <0.2 g/m2h, which was rather low. As expected, a highconcentration of glycerol in the draw solution resulted in a high reverse flux of glycerolto the feed (10–50 g/m2h). For NaCl, the reverse flux was ~10 g/m2h—relatively high,considering that the salt concentration in the draw solution was much lower than thatof glycerol.
Membranes 2022, 12, x FOR PEER REVIEW 8 of 14
Among the tested membranes, Aquaporin FO was the most suitable for FO due to its high water flux and comparatively low reverse flux. This membrane was used for addi-tional testing in a single-pass module.
Figure 5. The measured water flux through FO Aquaporin membrane under different glycerol con-centrations in a water–glycerol system.
Figure 6. The measured reverse fluxes of impurities through FO Aquaporin membrane in a water–40% glycerol–3% salt–5% methanol system.
Flow mode and velocity affect hydrodynamics in boundary layers adjacent to the membrane and thus the FO effective driving force; therefore the water flux, which is the main parameter of FO processes and should be maximized. The effects of co-current or counter-current flow on water flux was investigated; the same linear flow velocity was applied to both draw and feed solutions. The observed dependence of water flux on linear flow velocity measurements for both flow modes (Figure 7) indicated that in counter-cur-rent water flux was greater in all cases. Thus, further experiments with various feed com-positions were conducted in counter-current flow mode.
Figure 5. The measured water flux through FO Aquaporin membrane under different glycerolconcentrations in a water–glycerol system.
Membranes 2022, 12, 44 8 of 14
Membranes 2022, 12, x FOR PEER REVIEW 8 of 14
Among the tested membranes, Aquaporin FO was the most suitable for FO due to its high water flux and comparatively low reverse flux. This membrane was used for addi-tional testing in a single-pass module.
Figure 5. The measured water flux through FO Aquaporin membrane under different glycerol con-centrations in a water–glycerol system.
Figure 6. The measured reverse fluxes of impurities through FO Aquaporin membrane in a water–40% glycerol–3% salt–5% methanol system.
Flow mode and velocity affect hydrodynamics in boundary layers adjacent to the membrane and thus the FO effective driving force; therefore the water flux, which is the main parameter of FO processes and should be maximized. The effects of co-current or counter-current flow on water flux was investigated; the same linear flow velocity was applied to both draw and feed solutions. The observed dependence of water flux on linear flow velocity measurements for both flow modes (Figure 7) indicated that in counter-cur-rent water flux was greater in all cases. Thus, further experiments with various feed com-positions were conducted in counter-current flow mode.
Figure 6. The measured reverse fluxes of impurities through FO Aquaporin membrane in a water–40%glycerol–3% salt–5% methanol system.
Among the tested membranes, Aquaporin FO was the most suitable for FO due toits high water flux and comparatively low reverse flux. This membrane was used foradditional testing in a single-pass module.
Flow mode and velocity affect hydrodynamics in boundary layers adjacent to themembrane and thus the FO effective driving force; therefore the water flux, which is themain parameter of FO processes and should be maximized. The effects of co-current orcounter-current flow on water flux was investigated; the same linear flow velocity wasapplied to both draw and feed solutions. The observed dependence of water flux onlinear flow velocity measurements for both flow modes (Figure 7) indicated that in counter-current water flux was greater in all cases. Thus, further experiments with various feedcompositions were conducted in counter-current flow mode.
Membranes 2022, 12, x FOR PEER REVIEW 9 of 14
Figure 7. Water flux dependence of linear flow velocity in co-current (solid bars) and counter-cur-rent (striped bars) flow mode for different water–glycerol–salt–methanol draw solutions.
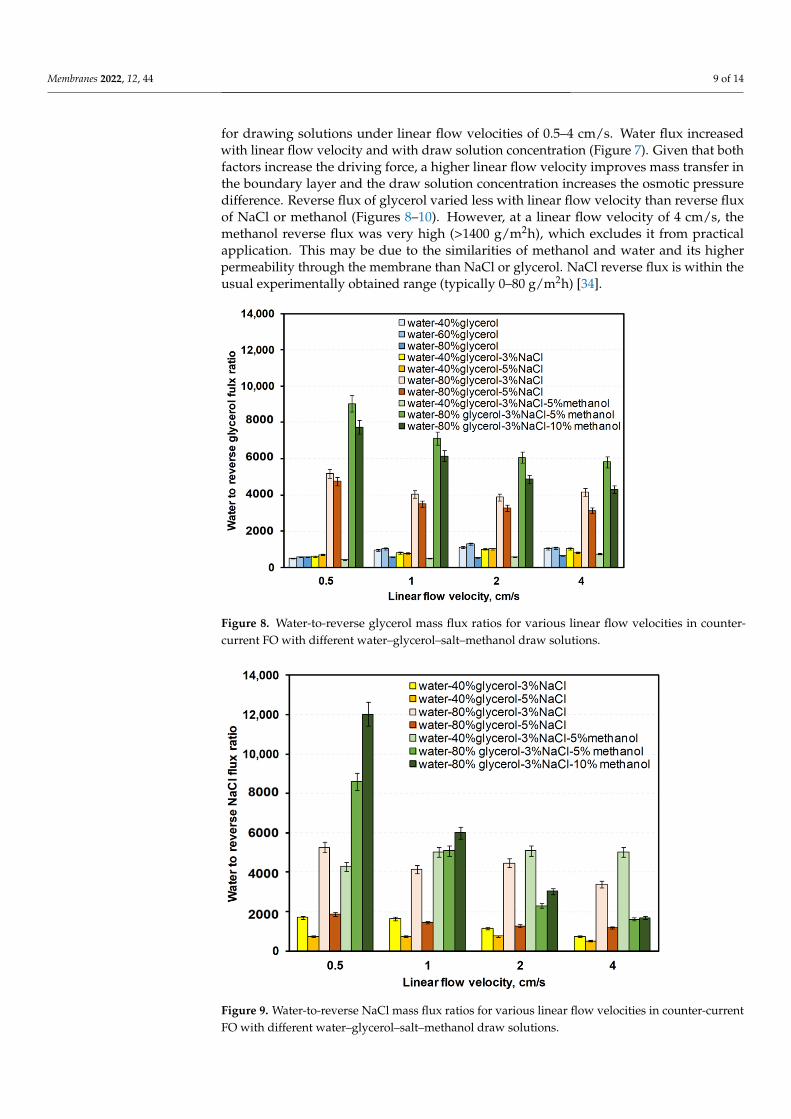
The Supplementary Materials contain data on water, NaCl, glycerol, and methanol fluxes (Figures S4–S7). Figures 8–10 show ratios of water flux to reverse fluxes of impuri-ties for drawing solutions under linear flow velocities of 0.5–4 cm/s. Water flux increased with linear flow velocity and with draw solution concentration (Figure 7). Given that both factors increase the driving force, a higher linear flow velocity improves mass transfer in the boundary layer and the draw solution concentration increases the osmotic pressure difference. Reverse flux of glycerol varied less with linear flow velocity than reverse flux of NaCl or methanol (Figures 8–10). However, at a linear flow velocity of 4 cm/s, the meth-anol reverse flux was very high (>1400 g/m2h), which excludes it from practical applica-tion. This may be due to the similarities of methanol and water and its higher permeability through the membrane than NaCl or glycerol. NaCl reverse flux is within the usual ex-perimentally obtained range (typically 0–80 g/m2h) [34].
Figure 8. Water-to-reverse glycerol mass flux ratios for various linear flow velocities in counter-current FO with different water–glycerol–salt–methanol draw solutions.
0
20
40
60
80
100
120
140
160
0.5 1 2 4
Wat
er fl
ux, L
/m2 h
Linear flow velocity, cm/s
water-60%glycerol-5%methanol
water-70%glycerol-3%NaCl-8%methanol
water-80%glycerol-5%NaCl
Figure 7. Water flux dependence of linear flow velocity in co-current (solid bars) and counter-current(striped bars) flow mode for different water–glycerol–salt–methanol draw solutions.
The Supplementary Materials contain data on water, NaCl, glycerol, and methanolfluxes (Figures S4–S7). Figures 8–10 show ratios of water flux to reverse fluxes of impurities
Membranes 2022, 12, 44 9 of 14
for drawing solutions under linear flow velocities of 0.5–4 cm/s. Water flux increasedwith linear flow velocity and with draw solution concentration (Figure 7). Given that bothfactors increase the driving force, a higher linear flow velocity improves mass transfer inthe boundary layer and the draw solution concentration increases the osmotic pressuredifference. Reverse flux of glycerol varied less with linear flow velocity than reverse fluxof NaCl or methanol (Figures 8–10). However, at a linear flow velocity of 4 cm/s, themethanol reverse flux was very high (>1400 g/m2h), which excludes it from practicalapplication. This may be due to the similarities of methanol and water and its higherpermeability through the membrane than NaCl or glycerol. NaCl reverse flux is within theusual experimentally obtained range (typically 0–80 g/m2h) [34].
Membranes 2022, 12, x FOR PEER REVIEW 9 of 14
Figure 7. Water flux dependence of linear flow velocity in co-current (solid bars) and counter-cur-rent (striped bars) flow mode for different water–glycerol–salt–methanol draw solutions.
The Supplementary Materials contain data on water, NaCl, glycerol, and methanol fluxes (Figures S4–S7). Figures 8–10 show ratios of water flux to reverse fluxes of impuri-ties for drawing solutions under linear flow velocities of 0.5–4 cm/s. Water flux increased with linear flow velocity and with draw solution concentration (Figure 7). Given that both factors increase the driving force, a higher linear flow velocity improves mass transfer in the boundary layer and the draw solution concentration increases the osmotic pressure difference. Reverse flux of glycerol varied less with linear flow velocity than reverse flux of NaCl or methanol (Figures 8–10). However, at a linear flow velocity of 4 cm/s, the meth-anol reverse flux was very high (>1400 g/m2h), which excludes it from practical applica-tion. This may be due to the similarities of methanol and water and its higher permeability through the membrane than NaCl or glycerol. NaCl reverse flux is within the usual ex-perimentally obtained range (typically 0–80 g/m2h) [34].
Figure 8. Water-to-reverse glycerol mass flux ratios for various linear flow velocities in counter-current FO with different water–glycerol–salt–methanol draw solutions.
0
20
40
60
80
100
120
140
160
0.5 1 2 4
Wat
er fl
ux, L
/m2 h
Linear flow velocity, cm/s
water-60%glycerol-5%methanol
water-70%glycerol-3%NaCl-8%methanol
water-80%glycerol-5%NaCl
Figure 8. Water-to-reverse glycerol mass flux ratios for various linear flow velocities in counter-current FO with different water–glycerol–salt–methanol draw solutions.
Membranes 2022, 12, x FOR PEER REVIEW 10 of 14
Figure 9. Water-to-reverse NaCl mass flux ratios for various linear flow velocities in counter-current FO with different water–glycerol–salt–methanol draw solutions.
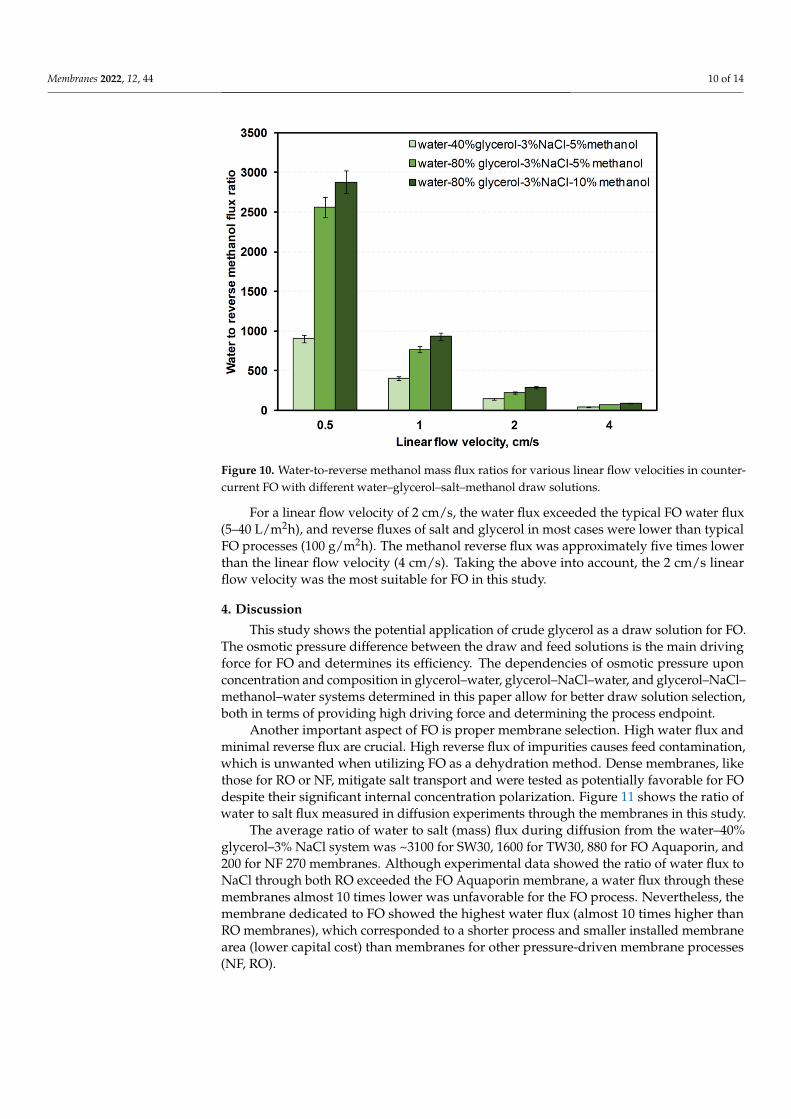
Figure 10. Water-to-reverse methanol mass flux ratios for various linear flow velocities in counter-current FO with different water–glycerol–salt–methanol draw solutions.
For a linear flow velocity of 2 cm/s, the water flux exceeded the typical FO water flux (5–40 L/m2h), and reverse fluxes of salt and glycerol in most cases were lower than typical FO processes (100 g/m2h). The methanol reverse flux was approximately five times lower than the linear flow velocity (4 cm/s). Taking the above into account, the 2 cm/s linear flow velocity was the most suitable for FO in this study.
Figure 9. Water-to-reverse NaCl mass flux ratios for various linear flow velocities in counter-currentFO with different water–glycerol–salt–methanol draw solutions.
Membranes 2022, 12, 44 10 of 14
Membranes 2022, 12, x FOR PEER REVIEW 10 of 14
Figure 9. Water-to-reverse NaCl mass flux ratios for various linear flow velocities in counter-current FO with different water–glycerol–salt–methanol draw solutions.
Figure 10. Water-to-reverse methanol mass flux ratios for various linear flow velocities in counter-current FO with different water–glycerol–salt–methanol draw solutions.
For a linear flow velocity of 2 cm/s, the water flux exceeded the typical FO water flux (5–40 L/m2h), and reverse fluxes of salt and glycerol in most cases were lower than typical FO processes (100 g/m2h). The methanol reverse flux was approximately five times lower than the linear flow velocity (4 cm/s). Taking the above into account, the 2 cm/s linear flow velocity was the most suitable for FO in this study.
Figure 10. Water-to-reverse methanol mass flux ratios for various linear flow velocities in counter-current FO with different water–glycerol–salt–methanol draw solutions.
For a linear flow velocity of 2 cm/s, the water flux exceeded the typical FO water flux(5–40 L/m2h), and reverse fluxes of salt and glycerol in most cases were lower than typicalFO processes (100 g/m2h). The methanol reverse flux was approximately five times lowerthan the linear flow velocity (4 cm/s). Taking the above into account, the 2 cm/s linearflow velocity was the most suitable for FO in this study.
4. Discussion
This study shows the potential application of crude glycerol as a draw solution for FO.The osmotic pressure difference between the draw and feed solutions is the main drivingforce for FO and determines its efficiency. The dependencies of osmotic pressure uponconcentration and composition in glycerol–water, glycerol–NaCl–water, and glycerol–NaCl–methanol–water systems determined in this paper allow for better draw solution selection,both in terms of providing high driving force and determining the process endpoint.
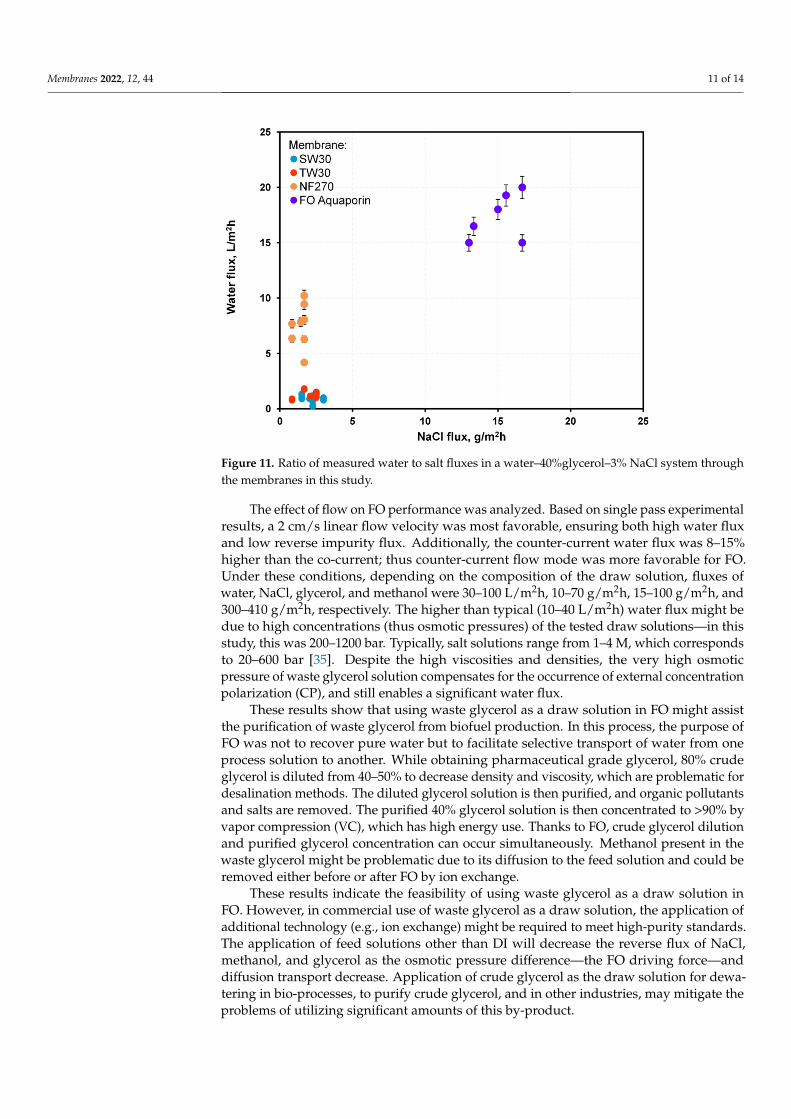
Another important aspect of FO is proper membrane selection. High water flux andminimal reverse flux are crucial. High reverse flux of impurities causes feed contamination,which is unwanted when utilizing FO as a dehydration method. Dense membranes, likethose for RO or NF, mitigate salt transport and were tested as potentially favorable for FOdespite their significant internal concentration polarization. Figure 11 shows the ratio ofwater to salt flux measured in diffusion experiments through the membranes in this study.
The average ratio of water to salt (mass) flux during diffusion from the water–40%glycerol–3% NaCl system was ~3100 for SW30, 1600 for TW30, 880 for FO Aquaporin, and200 for NF 270 membranes. Although experimental data showed the ratio of water flux toNaCl through both RO exceeded the FO Aquaporin membrane, a water flux through thesemembranes almost 10 times lower was unfavorable for the FO process. Nevertheless, themembrane dedicated to FO showed the highest water flux (almost 10 times higher thanRO membranes), which corresponded to a shorter process and smaller installed membranearea (lower capital cost) than membranes for other pressure-driven membrane processes(NF, RO).
Membranes 2022, 12, 44 11 of 14
Membranes 2022, 12, x FOR PEER REVIEW 11 of 14
4. Discussion This study shows the potential application of crude glycerol as a draw solution for
FO. The osmotic pressure difference between the draw and feed solutions is the main driving force for FO and determines its efficiency. The dependencies of osmotic pressure upon concentration and composition in glycerol–water, glycerol–NaCl–water, and glyc-erol–NaCl–methanol–water systems determined in this paper allow for better draw solu-tion selection, both in terms of providing high driving force and determining the process endpoint.
Another important aspect of FO is proper membrane selection. High water flux and minimal reverse flux are crucial. High reverse flux of impurities causes feed contamina-tion, which is unwanted when utilizing FO as a dehydration method. Dense membranes, like those for RO or NF, mitigate salt transport and were tested as potentially favorable for FO despite their significant internal concentration polarization. Figure 11 shows the ratio of water to salt flux measured in diffusion experiments through the membranes in this study.
Figure 11. Ratio of measured water to salt fluxes in a water–40%glycerol–3% NaCl system through the membranes in this study.
The average ratio of water to salt (mass) flux during diffusion from the water–40% glycerol–3% NaCl system was ~3100 for SW30, 1600 for TW30, 880 for FO Aquaporin, and 200 for NF 270 membranes. Although experimental data showed the ratio of water flux to NaCl through both RO exceeded the FO Aquaporin membrane, a water flux through these membranes almost 10 times lower was unfavorable for the FO process. Nevertheless, the membrane dedicated to FO showed the highest water flux (almost 10 times higher than RO membranes), which corresponded to a shorter process and smaller installed mem-brane area (lower capital cost) than membranes for other pressure-driven membrane pro-cesses (NF, RO).
The effect of flow on FO performance was analyzed. Based on single pass experi-mental results, a 2 cm/s linear flow velocity was most favorable, ensuring both high water flux and low reverse impurity flux. Additionally, the counter-current water flux was 8–15% higher than the co-current; thus counter-current flow mode was more favorable for FO. Under these conditions, depending on the composition of the draw solution, fluxes of water, NaCl, glycerol, and methanol were 30–100 L/m2h, 10–70 g/m2h, 15–100 g/m2h, and
Figure 11. Ratio of measured water to salt fluxes in a water–40%glycerol–3% NaCl system throughthe membranes in this study.
The effect of flow on FO performance was analyzed. Based on single pass experimentalresults, a 2 cm/s linear flow velocity was most favorable, ensuring both high water fluxand low reverse impurity flux. Additionally, the counter-current water flux was 8–15%higher than the co-current; thus counter-current flow mode was more favorable for FO.Under these conditions, depending on the composition of the draw solution, fluxes ofwater, NaCl, glycerol, and methanol were 30–100 L/m2h, 10–70 g/m2h, 15–100 g/m2h, and300–410 g/m2h, respectively. The higher than typical (10–40 L/m2h) water flux might bedue to high concentrations (thus osmotic pressures) of the tested draw solutions—in thisstudy, this was 200–1200 bar. Typically, salt solutions range from 1–4 M, which correspondsto 20–600 bar [35]. Despite the high viscosities and densities, the very high osmoticpressure of waste glycerol solution compensates for the occurrence of external concentrationpolarization (CP), and still enables a significant water flux.
These results show that using waste glycerol as a draw solution in FO might assistthe purification of waste glycerol from biofuel production. In this process, the purpose ofFO was not to recover pure water but to facilitate selective transport of water from oneprocess solution to another. While obtaining pharmaceutical grade glycerol, 80% crudeglycerol is diluted from 40–50% to decrease density and viscosity, which are problematic fordesalination methods. The diluted glycerol solution is then purified, and organic pollutantsand salts are removed. The purified 40% glycerol solution is then concentrated to >90% byvapor compression (VC), which has high energy use. Thanks to FO, crude glycerol dilutionand purified glycerol concentration can occur simultaneously. Methanol present in thewaste glycerol might be problematic due to its diffusion to the feed solution and could beremoved either before or after FO by ion exchange.
These results indicate the feasibility of using waste glycerol as a draw solution inFO. However, in commercial use of waste glycerol as a draw solution, the application ofadditional technology (e.g., ion exchange) might be required to meet high-purity standards.The application of feed solutions other than DI will decrease the reverse flux of NaCl,methanol, and glycerol as the osmotic pressure difference—the FO driving force—anddiffusion transport decrease. Application of crude glycerol as the draw solution for dewa-tering in bio-processes, to purify crude glycerol, and in other industries, may mitigate theproblems of utilizing significant amounts of this by-product.

Membranes 2022, 12, 44 12 of 14
5. Conclusions
Waste glycerol is a feasible draw solution due to its high osmotic pressure, whichensures a high driving force for FO. However, pure glycerol might not be an ideal drawsolution due to its high density and viscosity, though in some cases it might be applied inforward osmosis. As expected, osmotic pressure increased with glycerol concentration—and exceeded 600 bar for 80% glycerol, making it one of highest among substances usedas draw solutions in FO. The impurities present in waste glycerol (composed of 20–80%glycerol, 5% methanol, 1–5% NaCl) increase its osmotic pressure; however, they (especiallymethanol) tend to transport through the membrane to the feed solution (reverse flux),which is a serious drawback, as it contaminates the feed solution during FO. Use of otherdense membranes (designed for RO or NF) was tested to limit this; however, the water fluxwas unsatisfactory and therefore they were not applicable. The concentrations/dilutionsof glycerol solutions with FO were optimized with flow condition selection to minimizeconcentration polarization: a counter-current flow mode and a sufficiently high linearflow velocity.
Noticeably, a reverse flux of impurities did not exclude using waste glycerol as a drawsolution in FO. Methanol and salts were removed before FO to prevent its transport to feedsolutions or were removed from feed solutions in other FO processes.
Our results should serve as a guide in the design of FO processes using waste glycerol.
6. Patents
PL 236277 B1 Sposób zatezania oczyszczonych roztworów gliceryny.
Supplementary Materials: The following supporting information can be downloaded at: https://www.mdpi.com/article/10.3390/membranes12010044/s1, Figure S1: The effect of salt and glycerolconcentration on osmotic pressure, calculated based on freezing point measurements, for water–glycerol–NaCl systems.; Figure S2: The effect of salt and glycerol concentration on osmotic pressure,calculated based on freezing point measurements, for water–glycerol–NaCl–5% methanol solutions.;Figure S3: The effect of salt and glycerol concentration on osmotic pressure, calculated based on freez-ing point measurements, for water–glycerol–NaCl–10% methanol solutions.; Figure S4: Measuredwater fluxes under various linear flow velocities during FO experiments in water–glycerol–NaCl–methanol systems.; Figure S5: Measured reverse glycerol fluxes under various linear flow velocitiesduring FO experiments in water–glycerol–NaCl–methanol systems.; Figure S6: Measured reverseNaCl fluxes under various linear flow velocities during FO experiments in wa-ter–glycerol–NaCl–methanol systems.; Figure S7: Measured reverse methanol fluxes under various linear flow velocitiesduring FO experiments in water–glycerol–NaCl–methanol systems.
Author Contributions: Conceptualization, E.B.; methodology, P.D., D.C., H.J. and K.M.; investigation,E.B.; resources, M.T.; data curation, H.J.; writing—original draft preparation, E.B.; writing—reviewand editing, P.D., H.J. and K.M.; supervision, M.T.; funding acquisition, E.B. and M.T. All authorshave read and agreed to the published version of the manuscript.
Funding: The Polish National Science Center funded this research (Decision No. UMO-2015/19/N/ST8/02375).
Institutional Review Board Statement: Not applicable.
Informed Consent Statement: Not applicable.
Data Availability Statement: The data presented in this study are available in supplementary material.
Conflicts of Interest: The authors declare no conflict of interest.
References1. Sulewski, M.; Urbaniak, W. Zagospodarowanie ubocznych produktów syntezy biodiesla. Czysta Energ. 2011, 6, 27–28.2. Santibáñez, C.; Varnero, M.T.; Bustamante, M. Residual glycerol from biodiesel manufacturing, waste or potential source of
bioenergy: A review. Chil. J. Agric. Res. 2011, 71, 469–475. [CrossRef]3. Haas, M.J.; McAloon, A.J.; Yee, W.C.; Foglia, T.A. A process model to estimate biodiesel production costs. Bioresour. Technol. 2006,
97, 671–678. [CrossRef] [PubMed]
Membranes 2022, 12, 44 13 of 14
4. Dabrowski, W.; Bednarski, W. Ekologiczne aspekty produkcji oraz stosowania biodiesla. Nauk. Inzynierskie Technol. 2013, 3, 18–34.5. Chozhavendhan, S.; Devi, G.K.; Bharathiraja, B.; Kumar, R.P.; Elavazhagan, S. 9-Assessment of crude glycerol utilization for
sustainable development of biorefineries. In Refining Biomass Residues for Sustainable Energy and Bioproducts; Academic Press:Cambridge, MA, USA, 2020; pp. 195–212.
6. Kimura, S. Analysis of reverse osmosis membrane behaviors in a long-term verification test. Desalination 1995, 100,77–84. [CrossRef]
7. McGovern, R.K.; Lienhard, J.H. On the potential of forward osmosis to energetically outperform reverse osmosis desalination. J.Membr. Sci. 2014, 469, 245–250. [CrossRef]
8. Wei, R.; Zhang, S.; Cui, Y.; Ong, R.C.; Chung, T.-S.; Helmer, B.J.; de Wit, J.S. Highly permeable forward osmosis (FO) membranesfor High osmotic pressure but viscous draw solutes. J. Membr. Sci. 2015, 496, 132–141. [CrossRef]
9. Zhao, S.; Zou, L.; Tang, C.Y.; Mulcahy, D. Recent developments in forward osmosis: Opportunities and challenges. J. Membr. Sci.2012, 396, 1–21. [CrossRef]
10. Linares, R.V.; Li, Z.; Sarp, S.; Bucs, S.S.; Amy, G.; Vrouwenvelder, J.S. Forward osmosis niches in seawater desalination andwastewater reuse. Water Res. 2014, 66, 122–139. [CrossRef]
11. Lutchmiah, K.; Verliefde, A.R.D.; Roest, K.; Rietveld, L.C.; Cornelissen, E.R. Forward osmosis for application in wastewatertreatment: Are view. Water Res. 2014, 58, 179–197. [CrossRef]
12. Ge, Q.; Ling, M.; Chung, T.S. Draw solutions for forward osmosis processes: Developments, challenges, and prospects for thefuture. J. Membr. Sci. 2013, 442, 225–237. [CrossRef]
13. McCutcheon, J.R.; McGinnis, R.L.; Elimelech, M. Desalination by ammonia–carbon dioxide forward osmosis: Influence of drawand feed solution concentrations on process performance. J. Membr. Sci. 2006, 278, 114–123. [CrossRef]
14. Ren, J.; McCutcheon, J.R. A new commercial thin film composite membrane for forward osmosis. Desalination 2014, 343,187–193. [CrossRef]
15. Zhang, S.; Wang, K.Y.; Chung, T.S.; Chen, H.; Jean, Y.C.; Amy, G. Well-constructed cellulose acetate membranes for forward osmo-sis: Minimized internal concentration polarization with an ultrathin selective layer. J. Membr. Sci. 2010, 360, 522–535. [CrossRef]
16. Wang, K.Y.; Ong, R.C.; Chung, T.S. Double-skinned forward osmosis membranes for reducing internal concentration polarizationwithin the porous sublayer. Ind. Eng. Chem. Res. 2010, 49, 4824–4831. [CrossRef]
17. Gray, G.T.; McCutcheon, J.R.; Elimelech, M. Internal concentration polarization in forward osmosis: Role of membrane orientation.Desalination 2006, 197, 1–8. [CrossRef]
18. Loeb, S.; Titelman, L.; Korngold, E.; Freiman, J. Effect of porous support fabric on osmosis through a Loeb-Sourirajan typeasymmetric membrane. J. Membr. Sci. 1997, 129, 243–249. [CrossRef]
19. Motsa, M.M.; Mamba, B.B.; Verliefde, A.R.D. Combined colloidal and organic fouling of FO membranes: The influence offoulant-foulant interactions and ionic strength. J. Membr. Sci. 2015, 493, 539–548. [CrossRef]
20. She, Q.; Wang, R.; Fane, A.G.; Tang, C.Y. Membrane fouling in osmotically driven membrane processes: A review. J. Membr. Sci.2016, 499, 201–233. [CrossRef]
21. Field, R.W.; Wu, J.J. Mass transfer limitations in forward osmosis: Are some potential applications overhyped? Desalination 2013,318, 118–124. [CrossRef]
22. Sobczuk, T.M.; González, M.J.I.; Grima, E.M.; Chisti, Y. Forward osmosis with waste glycerol for concentrating microalgae slurries.Algal Res. 2015, 8, 168–173. [CrossRef]
23. Lim, S.W.; Mah, S.K.; Lee, Z.H.; Chai, S.P. A study of water permeation using glycerol as the draw solution with thin filmcomposite membranes in forward osmosis and pressure retarded osmosis configurations. In AIP Conference Proceedings; AIP:Melville, NY, USA, 2018.
24. Kalafatakis, S.; Braekevelt, S.; Carlsen, V.; Lange, L.; Skiadas, I.V.; Gavala, H.N. On a novel strategy for water recovery andrecirculation in biorefineries through application of forward osmosis membranes. Chem. Eng. J. 2017, 311, 209–216. [CrossRef]
25. Kalafatakis, S.; Braekevelt, S.; Lymperatou, A.; Zarebska, A.; Hélix-Nielsen, C.; Lange, L.; Skiadas, I.V.; Gavala, H.N. Applicationof forward osmosis technology in crude glycerol fermentation biorefinery-potential and challenges. Bioprocess Biosyst. Eng. 2018,41, 1089–1101. [CrossRef]
26. Mirau, P.A.; Jelinski, L.W.; Bovey, F.A. Encyclopedia of Physical Science and Technology, 3rd ed.; Elsevier Science Ltd.: Amsterdam,The Netherlands, 2003; pp. 857–901.
27. Manickam, S.S.; Ramon, G.Z.; McCutcheon, J.R. Modeling the effect of film-pore coupled transport on composite forward osmosismembrane performance. J. Memb. Sci. 2017, 523, 533–541. [CrossRef]
28. Blandin, G.; Myat, D.T.; Verliefde, A.R.D.; Le-Clech, P. Pressure assisted osmosis using nanofiltration membranes (PAO-NF):Towards higher efficiency osmotic processes. J. Memb. Sci. 2017, 533, 250–260. [CrossRef]
29. Setiawan, L.; Wang, R.; Li, K.; Fane, A.G. Fabrication of novel poly(amide-imide) forward osmosis hollow fiber membranes witha positively charged nanofiltration- like selective layer. J. Memb. Sci. 2011, 369, 196–205. [CrossRef]
30. Wang, K.Y.; Yang, Q.; Chung, T.S.; Rajagopalan, R. Enhanced forward osmosis from chemically modified polybenzimidazole (PBI)nanofiltration hollow fiber membranes with a thin wall. Chem. Eng. Sci. 2009, 64, 1577–1584. [CrossRef]
31. Singh, N.; Dhiman, S.; Basu, S.; Balakrishnan, M.; Petrinic, I.; Helix-Nielsen, C. Dewatering of sewage for nutrients and waterrecovery by forward osmosis (FO) using divalent draw solution. J. Water Process Eng. 2019, 31, 100853. [CrossRef]

Membranes 2022, 12, 44 14 of 14
32. Qiu, C.; Setiawan, L.; Wang, R.; Tang, C.Y.; Fane, A.G. High performance flat sheet forward osmosis membrane with an NF-likeselective layer on a woven fabric embedded substrate. Desalination 2012, 287, 266–270. [CrossRef]
33. Saren, Q.; Qiu, C.Q.; Tang, C.Y. Synthesis and characterization of novel forward osmosis membranes based on layer-by-Layerassembly. Environ. Sci. Technol. 2011, 45, 5201–5208. [CrossRef]
34. Duttaa, S.; Daveb, P.; Nath, K. Performance of low pressure nanofiltration membrane in forward osmosis using magnesiumchloride as draw solute. J. Water Process Eng. 2020, 33, 101092. [CrossRef]
35. Darwish, M.; Abdulrahim, H.; Ashraf, H.; Nasser, M.A.; Sharif, A. The forward osmosis and desalination. Desalination Water Treat.2016, 57, 4269–4295. [CrossRef]