Tunneling spectroscopy for ferromagnet/superconductor junctions
Upload
independentCategory
view
0download
0
2
3
4
5
6
78
9
1011121314151617181920
2122
23
24
25
26
27
SUSC 15015 No. of Pages 16, DTD = 4.3.1
11 June 2004 Disk usedARTICLE IN PRESS
Surface Science xxx (2004) xxx–xxx
www.elsevier.com/locate/susc
ROOFX-ray photoelectron spectroscopy and scanningtunneling microscopy investigations of the solid
solutions TixTa1�xS2 (06 x6 1)
Y. Tison, H. Martinez *, I. Baraille *,1, M. Loudet, D. Gonbeau
LCTPCM/CNRS UMR 5624, Helioparc Pau-Pyr�en�ees, 2 Avenue du Pr�esident Angot 64053 Pau Cedex 9, France
Received 21 January 2004; accepted for publication 27 May 2004
ECTEDP
Abstract
The surface of mixed transition metal sulfur TixTa1�xS2 has been studied both by X-ray photoelectron spectroscopy
and scanning tunneling microscopy over the entire range of stoichiometry 06 x6 1. For compositions close to thenative materials, we highlight according to x an evolution between the existence of a charge density wave (TaS2) and theexistence of structural defects (TiS2), interpreted as metal atoms vacancies or migration within the vacant sites of the
structure. The results obtained by XPS and scanning probe microscopy for intermediate compositions (0:46 x6 0:6)lead us to propose a model in ordered domains, separated by frontier zones where the metal distribution is random.
These various interpretations, supported by our experimental results, find their origin from the different electronic
characteristics of native materials and their evolution according to the composition. On the basis of model systems, we
have undertaken band structure calculations (FP-LAPW method) in order to highlight specific interactions occurred in
TixTa1�xS2 when x varies between 0.4 and 0.6. Those make it possible to rationalize some of our experimental data.� 2004 Published by Elsevier B.V.
Keywords: Solid solutions; Substitution; X-ray photoelectron spectroscopy; Core peaks; Valence bands; STM; Band structure
calculations
R28
29
30
31
32
33
OR1. Introduction
The purpose of this article is to study spectro-
scopic and structural properties on solid solutions
of TiS2 and TaS2 (1T phase), both layered com-
pounds with different electronic characteristics.
UNC 34
35
36
37
38
39
*Corresponding authors. Tel.: +33-5-59407599; fax: +33-5-
59407588 (H. Martinez), Tel.: +33-5-59407853; fax: +33-5-
59407862 (I. Baraille).
E-mail address: [email protected] (I. Baraille).1 UMR5624, IFR, rue Jules Ferry, 64000 Pau, France.
0039-6028/$ - see front matter � 2004 Published by Elsevier B.V.
doi:10.1016/j.susc.2004.05.134
Numerous works were devoted to the substituted
compounds (i.e. TixTa1�xS2, 0 < x < 1) concerningtheir diagram phases [1], their magnetic [2] elec-
trical and transport properties [3] because of the
different conductive character of the mother com-
pounds [4]. 1T-TiS2 exhibits a high conductivityeven though numerous studies conclude with a
small gap semi-conductor behavior. This can be
explained either by the presence of excess titanium
atoms in the van der Waals gap [5] or by an elec-
tron–hole coupling [6]. On the other hand,
according to resistivity measurements, 1T-TaS2

40
41
42
43
44
4546
47
48
49
50
51
52
5354
55
56
57
58
59
60
6162
63
64
65
66
67
68
6970
71
72
73
74
75
76
77
78
79
80
81
8283
84
85
86
87
88
89
9091
92
93
94
95
96
97
9899
100
101
102
103
104
105
106107
108
109
110
111
112
113
114115
116
117
118
119
120
121
122
2 Y. Tison et al. / Surface Science xxx (2004) xxx–xxx
SUSC 15015 No. of Pages 16, DTD = 4.3.1
11 June 2004 Disk usedARTICLE IN PRESS
RREC
behaves as a metal above 350 K and as a semi-
conductor below this temperature [2]. This
behavior can be explained by the formation of a
charge density wave, observed by low energy
electron diffraction (LEED) [7] or scanning tun-
neling microscopy (STM) [8].Because of the different electronic features of
the mother compounds, the evolution of the
structural properties according to the substitution
rate deserves to be investigated. To our knowl-
edge, most of the studies on substituted TaS2 (with
titanium [9], hafnium [10] or iron [11] for example)
only concerned systems MxTa1�xS2 with low sub-
stitution rates (x comprises between 0 and 0.1).The purpose of these works was to elucidate how
‘‘impurities’’ affect the local properties of the
charge density wave phase using scanning tunnel-
ing microscopy, transport properties measure-
ments or optical reflectivity [3]. In this paper, we
report a systematic study of the substituted com-
pounds TixTa1�xS2 in the entire range 06 x6 1.Our approach of the structural and electronicproperties of these systems is based on X-ray
photoelectron spectroscopy (XPS) and ultra high
vacuum scanning tunneling microscopy experi-
mental techniques, which appeared well suited for
the study of the inserted compounds MxTiS2(M¼Fe, Co, Ni, Ag; x ¼ 1=3, 1/4) [12]. The resultscorresponding to intermediate substitution rate
(0:46 x6 0:6) have been the subject of specialattention due to their specificity. A better under-
standing of the results obtained has required the
implementation of theoretical calculations. A FP–
LAPW–DFT (full potential-linearized augmented
plane wave-density functional theory) approach
on model systems is proposed to elucidate the
specific interactions induced by the simultaneous
presence of the two cations.
O 123124
125
126
127
128
129
130131
132
UNC2. Experimental and computational details
The elements Ta, Ti and S were mixed in
appropriate proportion and placed inside a quartz
tube which was sealed under vacuum. The mixture
was then heated to 950 �C (gradient 50 �C) during3 weeks and afterwards slowly cooled down to
room temperature. The slow cooling and anneal-
TEDPROOF
ing should ensure that only the stable phase at
room temperature is produced. An intermediate
crushing of the product was necessary to obtain
homogeneity. A small amount of iodine was then
added to favor crystallization [13]. The obtained
single crystals were in platelet shape and could beeasily cleaved. Chemical composition and phase
purity were carried out with an electron micro-
probe mounted on a scanning electron microscope.
X-ray diffraction (XRD) patterns were recorded
on an INEL diffractometer using a curved posi-
tion-sensitive detector (INEL CPS 120) calibrated
with Na2Ca3Al2F14 as standard. The monochro-
matized radiation applied was CuKa (1.5406 �A)from a long fine focus Cu tube operating at 40 kV
and 35 mA. Scans were performed over the 2hrange from 5� to 115�. Accurate unit cell param-eters were determined by a least-squares refine-
ment from data collected by the diffractometer.
For the matrix systems (TiS2 and TaS2) and mixed
samples, we found in every case the 1T polymorph
structure and the cell parameters of TiS2 and TaS2are in agreement with results previously reported
in the literature [14,15]. Note that the substitution
replacement of Ta for Ti in TixTa1�xS2 seems to
stabilize the octahedral 1T phase for 0 < x < 1, asobserved by Thompson [13] and DiSalvo [7]. Sys-
tematic powder XRD studies revealed that the
lattice parameters vary quasi linearly with com-
position (Fig. 1), from 3.35 to 3.41 �A for aparameter and from 5.89 to 5.70 �A for c, when xincreases from 0 to 1. This feature confirms that
the classical Vegard’s law is being followed for the
entire composition range in TixTa1�xS2 (06 x6 1)compounds. Such behavior of lattice parameters aand c was previously reported for TixNb1�xS2(06 x6 1) [1] and MoxW1�xS2 (06 x6 1) solidsolutions [16]. No evidence of structural disorderor superlattice ordering was detected in any dif-
fractogram. However, a widening of the diffraction
peaks (for example, the full width at half maxi-
mum (FWHM) of the (1 0 1) diffraction peak is
0.240� for TaS2 and 0.286� for Ti0:4Ta0:6S2) isobserved for the intermediate compositions
Ti0:4Ta0:6S2, Ti0:5Ta0:5S2 and Ti0:6Ta0:4S2, which
may indicate a loss of crystallinity.The XPS analyses were performed with a Sur-
face Science Instruments Spectrometer (model

133
134
135
136
137138
139
140
141
142
143
144
145146
147
148
149
150
151
152
153
154
155
156157
158
159
160
161
162
163
164165
166
167
168
169
170
171
172173
174
175
176
177
178
179
180181
182
183
184
185
186
187
188189
190
191
192
193
194
195
196197
0.0 0.2 0.4 0.6 0.8 1.0x
5.70
5.90
5.85
5.80
5.75
c(Å)
x0.0 0.2 0.4 0.6 0.8 1.0
a(Å)
3.32
3.44
3.42
3.40
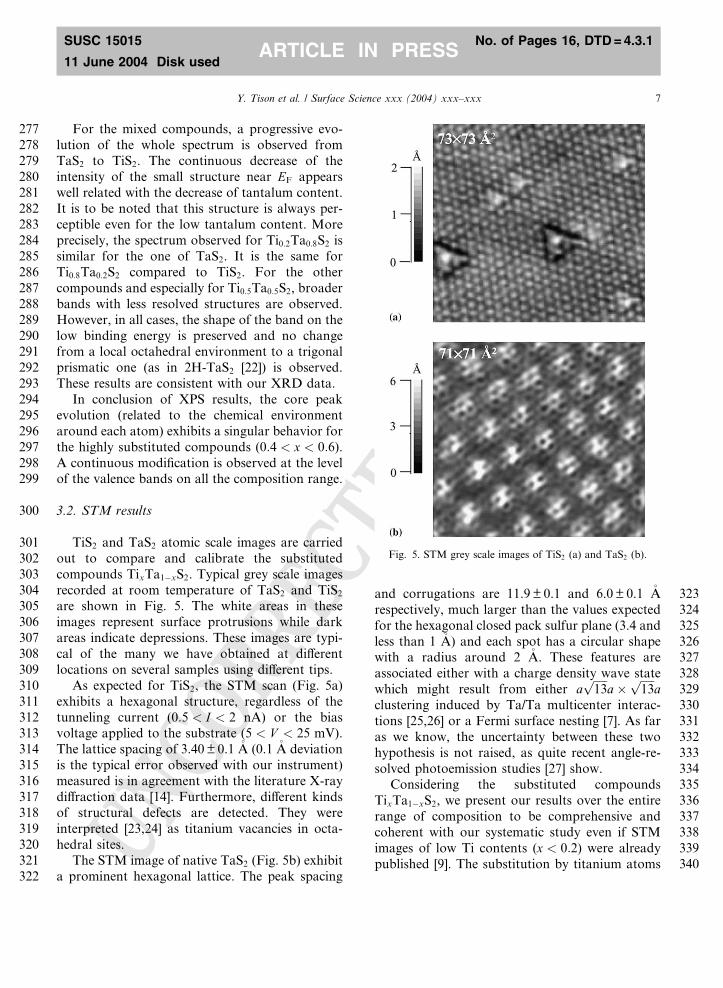
3.38
3.36
3.34
Fig. 1. Variation of the lattice parameters a and c for theTixTa1�xS2 (06 x6 1) solid solutions determined by X-ray
diffraction.
Y. Tison et al. / Surface Science xxx (2004) xxx–xxx 3
SUSC 15015 No. of Pages 16, DTD = 4.3.1
11 June 2004 Disk usedARTICLE IN PRESS
UNCORREC301� using a focused (diameter of the irradiatedarea¼ 300 lm) monochromatized AlKa radiation(1486.6 eV) and interfaced to Hewlett Packard
9000 microcomputer. The residual pressure inside
the analysis chamber was in the 5 · 10�8 Pa range.The spectrometer was calibrated using the photo-
emission lines of gold (Au 4f7=2¼ 83.9 eV, withreference to the Fermi level) and copper (Cu
2p3=2¼ 932.5 eV). For the Au 4f7=2 lines, the
FWHM was 0.86 eV. All the compounds were
cleaved in a glove box directly fixed into the
introduction chamber of the spectrometer. The
compounds were sufficiently good conductors topreclude charging effects and the binding energies
were obtained directly.
The fitting peaks of the experimental curves are
defined by a combination of gaussian (80%) and
lorentzian (20%) distribution. For the whole set of
198TEDPROOF
compounds the curve fits have been obtained using
fixed spin–orbit splits and fixed amplitude
(FWHM) ratios. It is to be noted that a minimum
number of doublets has always been used in order
to fit the experimental curve.
We imaged the samples in UHV using com-mercial (VP from Park Scientific Instrument)
scanning tunneling head, controlled by feedback
electronics and software of conventional design.
The residual pressure inside the analysis chamber
was in the 5 · 10�9 Pa range. Mechanically-sharp-ened Pt/Ir tips were used. Atomic scale images
were recorded in the constant current mode. STM
observed images were filtered by using the fastFourier transform (FFT) procedure to emphasize
the periodic features of the pattern. In this proce-
dure, the pronounced frequency patterns in the
FFT power spectra were saved to construct an
idealized image in the reverse transform. Graphite
used as calibration sample, always gave the correct
periodicity. In order to obtain fresh surfaces, the
samples were cleaved immediately before intro-ducing them in the analysis chamber. The images
were recorded with similar bias voltage and tun-
neling current (typically: )10 mV< V < 10 mVand I ¼ 1:5 nA). Note that the sign of the biasvoltage has no influence on the image features.
We have performed band-structure calculations
using the full linear potential augmented plane
wave (FLAPW) method [17], as implemented inthe WIEN97 code developed by Blaha et al. [18].
Our calculations are based on density functional
theory (DFT) within the generalized gradient
approximation (GGA) [19] which is, in most cases,
an improvement over LSDA (local spin density
approximation). All calculations are well con-
verged in terms of the size of the plane wave basis
set and the k-point sampling within the irreduciblepart of the Brillouin zone. In these studies, we used
52 irreducible Brillouin zone k points, angularmoment lmax ¼ 10, and muffin–tin radius for theatomic species: Ti, Ta¼ 2.2 a.u. and S¼ 2.0 a.u.The unit cell (space group: P�3m1) parameters usedto perform the calculations are those obtained by
X-ray diffraction determined by a least-squares
refinement. In this type of calculations, a moreprecise investigation of inter atomic interactions
needs the analysis of both the projected band

199
200
201
202
203
204
205
206
207208
209
210
211
4 Y. Tison et al. / Surface Science xxx (2004) xxx–xxx
SUSC 15015 No. of Pages 16, DTD = 4.3.1
11 June 2004 Disk usedARTICLE IN PRESS
structures (‘‘fat bands’’) and the charge density
maps [20].
212
213
214
215216
217
218
219
220
221
222
223224
225
3. Experimental results
3.1. XPS results
The XPS analyses were conducted both at the
level of core peaks (local probe) and valence bands
(occupied density of electronic states).
3.1.1. Core peaks
As the crystals have been freshly cleaved beforeanalysis, a very low oxygen percentage (about 2%)
has been observed. For all the TixTa1�xS2
UNCORRECTable 1
Binding energies (eV) and FWHM (full width at half maximum) in b
Ti 2p3=2�1=2 Ta 4f7=2�5=2
TaS2 23.9–25.8
[1.1]–[1.8]
Ti0:05Ta0:95S2 456.2 24.1–26.0
[2.2] [1.1]–[1.8]
Ti0:1Ta0:9S2 456.2 24.1–26.0
[2.2] [1.1]–[1.8]
Ti0:2Ta0:8S2 456.3 24.1–26.0
[2.3] [1.2]–[1.9]
Ti0:4Ta0:6S2 456.3 24.1–26.1, 72%
[2.4] [1.1]–[1.8]
25.1–27.2, 28%
[1.3]–[2.1]
Ti0:5Ta0:5S2 456.3 24.1–26.0, 74%
[2.4] [1.1]–[1.8]
25.1–27.20, 26%
[1.3]–[2.1]
Ti0:6Ta0:4S2 456.2 24.1–26.0, 73%
[2.3] [1.1]–[1.8]
25.1–27.2, 27%
[1.2]–[1.9]
Ti0:8Ta0:2S2 456.1 24.1–26.0
[2.2] [1.2]–[2.0]
Ti0:9Ta0:1S2 456.0 24.1–26.0
[1.9] [1.1]–[1.8]
TiS2 456.0
[1.6]
OOF
(06 x6 1) compounds, the main core peaks: Ti 2p,Ta 4f and S 2p have been characterized (Table 1).
Figs. 2 and 3 exhibit the Ta 4f and S 2p core
spectra. Note that only the Ti 2p3=2 component is
reported in the Table 1, as the Ti 2p1=2 and Ta
4p1=2 components appear around the same bindingenergy.
For the references TiS2 and TaS2, the binding
energies of the core peaks are in good agreement
with those previously published [21]. The Ta 4f
peaks obtained for TaS2 and the main TixTa1�xS2crystals are presented in Fig. 2. We note for TaS2the characteristic strong asymmetry of this doublet
also evidenced in tantalum metal. For the low xvalues (x6 0:2), some changes in the shape of theTa 4f doublet is observed with a slight enhance-
TEDPR
rackets for the main core peaks of TixTa1�xS2
S 2p3=2�1=2
162.0–163.2
[0.9]–[0.9]
162.0–163.2
[1.0]–[1.0]
162.0–163.2
[1.0]–[1.0]
161.9–163.1
[1.0]–[1.0]
161.6–162.9, 71%
[0.9]–[0.9]
162.2–163.4, 29%
[0.9]–[0.9]
161.4–162.6, 69%
[0.9]–[0.9]
162.0–163.2, 31%
[0.9]–[0.9]
161.3–162.5, 72%
[0.9]–[0.9]
161.8–163.1, 28%
[0.9]–[0.9]
160.9–162.1
[1.0]–[1.0]
160.7–161.9
[0.9]–[0.9]
160.8–162.0
[0.8]–[0.9]

CORRECTEDPROOF
226
227
228
229
Fig. 2. Ta 4f7=2�5=2 peaks of TixTa1�xS2 (x ¼ 0, 0.2, 0.4, 0.5, 0.6,0.8).
Fig. 3. S 2p3=2�1=2 peaks of TixTa1�xS2 (x ¼ 0, 0.2, 0.4, 0.5, 0.6,0.8, 1).
Y. Tison et al. / Surface Science xxx (2004) xxx–xxx 5
SUSC 15015 No. of Pages 16, DTD = 4.3.1
11 June 2004 Disk usedARTICLE IN PRESS
UNment of the FWHM of each component. A more
important evolution is observed for Ti0:4Ta0:6S2,
Ti0:5Ta0:5S2 and Ti0:6Ta0:4S2 compounds; in order
to fit the experimental curves, it was necessary to

TEDPROOF
230
231
232
233
234
235236
237
238
239
240
241
242
243244
245
246
247
248
249
250
251252
253
254
255
256
257
258259
260
261
262
263
264
265
266267
268
269
270
271
272
273
274275
276
Fig. 4. XPS valence bands of TaS2 (a), Ti0:2Ta0:8S2 (b),
Ti0:4Ta0:6S2 (c), Ti0:5Ta0:5S2 (d), Ti0:6Ta0:4S2 (e), Ti0:8Ta0:2S2 (f)
and TiS2 (g).
6 Y. Tison et al. / Surface Science xxx (2004) xxx–xxx
SUSC 15015 No. of Pages 16, DTD = 4.3.1
11 June 2004 Disk usedARTICLE IN PRESS
UNCORREC
introduce a second doublet on the high binding
energy side. No significant change occurred for the
binding energy of the main Ta 4f doublet all along
the series. Compared to TiS2, the Ti 2p peak of
each compound is broadened (especially in the
case of Ti0:4Ta0:6S2, Ti0:5Ta0:5S2 and Ti0:6Ta0:4S2)and shows an asymmetric shape.
The analysis of the S 2p peak for TiS2 and TaS2(Fig. 3) has revealed a perfectly resolved doublet,
with a splitting between the two components equal
to 1.1–1.2 eV and a clear difference between their
BE (binding energy) values (TiS2: 160.8/162.0 eV
TaS2: 162.0/163.2 eV). For the TixTa1�xS2 com-
pounds, a progressive and continuous evolution ofthe binding energies of the S 2p peaks is observed
from the values of TaS2 to the ones of TiS2, as the
concentration of titanium atoms increases.
Considering the shape of the S 2p for the mixed
compounds, an evolution is observed with a pro-
gressive widening of the peak and a less resolved
global structure. This is especially evident for the
Ti0:4Ta0:6S2, Ti0:5Ta0:5S2 and Ti0:6Ta0:4S2 com-pounds. For these, in order to fit the experimental
curves, it was necessary to introduce another
doublet on the high binding energy side. It is to be
noted that the relative proportions (�30%–70%) ofthe two S 2p doublets are similar to those of the Ta
4f core peaks.
3.1.2. Valence bands
Fig. 4 shows the valence bands for the main
compositions TixTa1�xS2.
Previous experimental and theoretical studies
[21] on TiS2 and TaS2 allow the following attri-
butions. For both compounds, the bands on the
high binding energy side mainly correspond to the
ionization of S(3s) orbitals. The band on the low
binding energy side exhibit a triplet structure dueto r interactions between S(3p) and M(d) atomicorbitals for a local octahedral environment of
metal atoms is observed for both compounds; this
last phenomenon is clearly evidenced for TiS2(maximum at 3.3 eV), as for TaS2 (maximum at
4.5 eV). Note that TaS2 is also characterized by a
formal ‘‘d1’’ electronic configuration; the identifi-
cation of the associated band is deduced from awell resolved structure just below the Fermi level
(0.9 eV).
TEDPROOF
277
278
279
280
281
282283
284
285
286
287
288
289
290291
292
293
294
295
296
297
298299
300
301
302
303
304305
306
307
308
309
310
311
312313
314
315
316
317
318
319
320321
322
323
324
325
326327
328
329
330
331
332
333
334335
336
337
338
339
340
Fig. 5. STM grey scale images of TiS2 (a) and TaS2 (b).
Y. Tison et al. / Surface Science xxx (2004) xxx–xxx 7
SUSC 15015 No. of Pages 16, DTD = 4.3.1
11 June 2004 Disk usedARTICLE IN PRESS
UNCORREC
For the mixed compounds, a progressive evo-
lution of the whole spectrum is observed from
TaS2 to TiS2. The continuous decrease of the
intensity of the small structure near EF appearswell related with the decrease of tantalum content.
It is to be noted that this structure is always per-ceptible even for the low tantalum content. More
precisely, the spectrum observed for Ti0:2Ta0:8S2 is
similar for the one of TaS2. It is the same for
Ti0:8Ta0:2S2 compared to TiS2. For the other
compounds and especially for Ti0:5Ta0:5S2, broader
bands with less resolved structures are observed.
However, in all cases, the shape of the band on the
low binding energy is preserved and no changefrom a local octahedral environment to a trigonal
prismatic one (as in 2H-TaS2 [22]) is observed.
These results are consistent with our XRD data.
In conclusion of XPS results, the core peak
evolution (related to the chemical environment
around each atom) exhibits a singular behavior for
the highly substituted compounds (0:4 < x < 0:6).A continuous modification is observed at the levelof the valence bands on all the composition range.
3.2. STM results
TiS2 and TaS2 atomic scale images are carried
out to compare and calibrate the substituted
compounds TixTa1�xS2. Typical grey scale images
recorded at room temperature of TaS2 and TiS2are shown in Fig. 5. The white areas in these
images represent surface protrusions while dark
areas indicate depressions. These images are typi-
cal of the many we have obtained at different
locations on several samples using different tips.
As expected for TiS2, the STM scan (Fig. 5a)
exhibits a hexagonal structure, regardless of the
tunneling current (0:5 < I < 2 nA) or the biasvoltage applied to the substrate (5 < V < 25 mV).The lattice spacing of 3.40 ± 0.1 �A (0.1 �A deviationis the typical error observed with our instrument)
measured is in agreement with the literature X-ray
diffraction data [14]. Furthermore, different kinds
of structural defects are detected. They were
interpreted [23,24] as titanium vacancies in octa-
hedral sites.The STM image of native TaS2 (Fig. 5b) exhibit
a prominent hexagonal lattice. The peak spacing
and corrugations are 11.9 ± 0.1 and 6.0 ± 0.1 �Arespectively, much larger than the values expected
for the hexagonal closed pack sulfur plane (3.4 and
less than 1 �A) and each spot has a circular shapewith a radius around 2 �A. These features areassociated either with a charge density wave state
which might result from either affiffiffiffiffi
13p
a�ffiffiffiffiffi
13p
aclustering induced by Ta/Ta multicenter interac-
tions [25,26] or a Fermi surface nesting [7]. As far
as we know, the uncertainty between these two
hypothesis is not raised, as quite recent angle-re-
solved photoemission studies [27] show.Considering the substituted compounds
TixTa1�xS2, we present our results over the entire
range of composition to be comprehensive and
coherent with our systematic study even if STM
images of low Ti contents (x < 0:2) were alreadypublished [9]. The substitution by titanium atoms

CORREC
341342
343
344
345
346
347
348
349350
351
352
353
354
355
356
357358
359
360
361
362
363
364
365366
367
368
369
370
371
372
373374
375
376
377
378
379
380
381382
383
384
385
386
387
388
389390
Fig. 6. STM grey scale images of Ti0:05Ta0:95S2 (a), Ti0:1Ta0:9S2(b) and Ta0:2Ti0:8S2 (c).
8 Y. Tison et al. / Surface Science xxx (2004) xxx–xxx
SUSC 15015 No. of Pages 16, DTD = 4.3.1
11 June 2004 Disk usedARTICLE IN PRESS
UN
at levels x ¼ 0:05 and x ¼ 0:1 (Fig. 6a and b)perturbs the CDW sufficiently so that the atomic
lattice and CDW can be ‘seen’ clearly. However,
391TEDPROOF
for x ¼ 0:05, the CDW is still prominent as large
peaks (12.8 �A peak to peak, ±0.2 �A separation and5 �A corrugation) even if smaller bright spots (as-signed to the close-packed hexagonal top sulfur
plane) with separation 3.4 ± 0.1 �A are present. Theunderlying atomic lattice remains regular. Forx ¼ 0:1 sample, the atomic lattice (with peak topeak separation 3.4 ± 0.1 �A) is present in the sametime as large peaks from the CDW. The lower
corrugation values (2 �A) indicate that the CDWamplitude decreases with increasing dopant con-
centration. Furthermore, the CDW is distorted
(separation peak to peak: 13.2 �A±0.5 �A) andprovides confirmation of the suggestion that sub-stitution of Ti(3d0) for Ta(5d1) perturbs signifi-
cantly the size of the Fermi surface. The irregular
CDW structure is the result of distortions in direct
response to the random lattice potential associated
with the Ti doping sites. For x ¼ 0:2 (Fig. 6c), theunderlying atomic lattice is now clearly defined
and dominates the STM image. A few incom-
mensurable peaks from CDW state are still presentand exhibit large variations. The CDW is ran-
domly distorted in the wavelength and amplitude
(13.4 ± 2.0 �A peak to peak separation and 0.9 ±
0.2 �A corrugation). Note that the accuracy de-
creases with larger values of x(Ti).These results, where the CDW wavelength
clearly shows large variations with ‘‘doping’’ con-
centration, are consistent with those of C. Lieberet al. [9,11]. The authors discussed the influence of
metal (titanium, iron) ‘‘impurities’’ (x comprisesbetween 0 and 0.2) in the CDW state of TaS2. For
TixTa1�xS2 (x < 0:2) mixed compounds, they
compare their results with those obtained by
LEED measurements [7]. They show that the in-
crease of the CDW wavelength may be associated
with a shrinking of the Fermi surface (and so adecrease of the nesting vector) induced by the
replacement of 5d1 Ta4þ ions by 3d0 Ti4þ ions.
The results for intermediate compositions
(x ¼ 0:4, 0.5, 0.6) are close to each other. Twotypical images (presented in 3D form to emphasize
the features of the pattern) are systematically
present, depending on the location of the analysis.
The first one (Fig. 7a) presents a 3.4 �A · 3.4 �A(±0.1 �A) close-packed hexagonal lattice and thecorrugation amplitude (0.5 �A) is similar to what it

CTEDPROOF
392
393
394
395
396397
398
399
400
401
402
403
404405
406
407
408
409
410
411
412413
414
415
416
417
418
419
420421
422
423
Fig. 7. Typical STM grey scale images of TixTa1�xS2 (0:46 x6 0:6) showing close-packed hexagonal lattice similar to what it wasobserved for TiS2 (a), protrusions with no specific periodicity (b, c) and intermediate case between the two previous ones (d). The
reported intensity profiles correspond to the image (b).
Y. Tison et al. / Surface Science xxx (2004) xxx–xxx 9
SUSC 15015 No. of Pages 16, DTD = 4.3.1
11 June 2004 Disk usedARTICLE IN PRESS
UNCORREwas observed for TiS2. The second ones (Fig. 7b
and c) exhibit protrusions with no specific peri-
odicity. These could not be attributed to CDW
because as we note previously, and in agreement
with many authors [9], the amplitude of CDWdecreases with increasing x(Ti) and the corrugationamplitude measured (2.5 ± 0.6 �A) is higher thanthe expected values for TiS2 or TaS2 (in the ab-
sence of CDW), similar to what it was observed for
lower x(Ti) concentration. Then, the large contrastdifferences and the features of this image should
come from another phenomenon. The lattice
parameters measured (illustrated by the plot ofheight profiles) vary between 2.8 and 3.6 �A.Fig. 7d is presented as an example of an inter-
mediate case where ‘‘bumps’’ and regular atomic
resolution are both present in the image. The
atomic lattice (of TiS2 or TaS2) could be distin-
guished with separation of 3.4 �A±0.4 �A. Thesevariations (±0.4 �A) could be assigned to the per-turbations observed, which reveal that all theheights (and/or the electronic densities around the
Fermi energy) of sulfur atoms are not equal all
over the surface scanned.
For higher concentrations of titanium (x ¼ 0:8,0.9), most of the images are very similar to the
native TiS2 and exhibit a uniform 3.4�A · 3.4 �Ahexagonal lattice (Fig. 8a). However, different
images (Fig. 8b) were recorded from time to time(typically one of ten over a series of fifty analyses);
a modulating intensity is observed which could be
due to different levels from the top sulfur atoms.

424
425
426
427
428
429
430
431
432
433
434435
436
437
438
439
440
441
442
443
444445
446
447
448
449
450
451
452453
454
455
456
457
458
459
460461
462
463
464
465
466
467
468469
Fig. 8. Two kinds of STM images observed for Ti0:8Ta0:2S2 and
Ta0:9Ti0:1S2.
10 Y. Tison et al. / Surface Science xxx (2004) xxx–xxx
SUSC 15015 No. of Pages 16, DTD = 4.3.1
11 June 2004 Disk usedARTICLE IN PRESS
CAnother interesting feature is that we never
observed structural defects (at the levels of the size
and shape) such as TiS2, even for low tantalum
substitution like Ti0:95Ta0:05S2.
E 470471
472
473
474
475
476477
478
479
480
481
482
483
484485
NCORR4. Discussion
It seems convenient to share the discussion
concerning the effect of substitution over electronic
and structural surface properties into two parts,
according to the composition: low substitution
rate of titanium or tantalum (Ti0:05Ta0:95S2,
Ti0:1Ta0:9S2, Ti0:2Ta0:8S2, Ti0:8Ta0:1S2, Ti0:9Ta0:1S2)and intermediate composition (Ti0:4Ta0:6S2,
Ti0:5Ta0:5S2, Ti0:6Ta0:4S2). For the latter, after
having considered several assumptions, the exper-
imental results lead us to propose a model of
structural arrangement. Specific interactions are
identified for these compositions by the means of a
UTEDPROOF
theoretical modeling, making it possible to support
some of our XPS and STM results.
4.1. Solid solutions with low substitution rate
In the case of the low substituted solid solu-tions, the results obtained are in agreement with a
random dispersion of the minority metal species
(titanium for x ¼ 0; 05; 0,1; 0,2 or tantalum for
x ¼ 0:8, 0.9) in a compound made up of majoritymetal.
In the composition range 100% TaS2 to 80%
TaS2, the titanium centers cause randomness in the
lattice potential and lead the Fermi surface toshrink. These effects perturb the charge density
wave in different ways. The average CDW wave-
lengths measured (consistent with previous dif-
fraction studies [7]) increase with increasing
titanium concentration, as expected in response to
a decrease in the size of the Fermi surface. For
Ti0:05Ta0:95S2, the charge density-wave is nearly
commensurate at room temperature and the STMimages are closed to TaS2 even if we note a small
difference in wavelength and amplitude of the
CDW state. When the concentration of titanium is
higher (x ¼ 0:1, 0.2) the CDW is incommensurate
with the atomic lattice and the corrugation values
decrease. It appears that the random substitution
of the Ta sites by titanium atoms produces disor-
der in the lattice potential. The increasing disorderas x gets close to 0.2 may be in relation with theslight broadening of the XPS core peaks (espe-
cially for the Ti 2p and Ta 4f) observed for
Ti0:2Ta0:8S2.
Concerning Ti0:8Ta0:2S2 and Ti0:9Ta0:1S2, STM
images and XPS core peaks (binding energy) are
very similar to the matrix TiS2. When the con-
centration of titanium gets close to x ¼ 1, thedisorder decreases: the FWHM of the XPS core
peaks decreases and the STM images, similar to
TiS2, exhibit a 3.4 �A · 3.4 �A hexagonal lattice. Theapproach of a randomly substitution of metal
centers with other metal is consistent with the re-
sults presented above. Furthermore, we note the
absence of defects even for a very weak rate of
substitution. This result is discussed at the end ofthis section.

486
487
488
489490
491
492
493
494
495
496
497498
499
500
501
502
503
504
505506
507
508
509
510
511
512
513514
515
516
517
518
519
520
521522
523
524
525
526
527
528
529530
531
532
533
534
535536
537538
539
540
541
542
543
544
545546
547
548
549
550
551
552
553554
555
556
557
558
559
560
561562
563
564
565
566
567
568
569570
571
572
573
574
575
576
577578
579
580
Y. Tison et al. / Surface Science xxx (2004) xxx–xxx 11
SUSC 15015 No. of Pages 16, DTD = 4.3.1
11 June 2004 Disk usedARTICLE IN PRESS
UNCORREC
4.2. Solid solutions with intermediate composition
(0:46 x6 0:6)
4.2.1. Hypothesis of structural arrangements
The most striking results (both in STM andXPS experiments) of this paper have been ob-
tained for intermediate compositions (Ti0:4Ta0:6S2,
Ti0:5Ta0:5S2, Ti0:6Ta0:4S2). Several structural
arrangements can be invoked starting from a
confrontation with our experimental results.
• Firstly, it was necessary to examine if an inser-tion phenomenon has to be considered. So, we
have synthesized several inserted compoundsTaxTiS2 in order to identify the possible signa-
ture differences between the phenomena of sub-
stitution and insertion. It appears interesting to
compare results for Ta0:4TiS2 (as an example)
with intermediate composition of substituted
samples; it is to be noted that this selected stoi-
chiometry allows having a statistical occupation
of the van der Waals gap. The results obtainedboth from XPS (an unique doublet for the Ta
4f7=2�5=2 and S 2p3=2�1=2 peaks) and STM exper-
iments (no significant feature on the images of
Ta0:4TiS2 with a uniform lattice of sulfur atoms
with a 3.4 �A parameter) are clearly different
from the ones obtained for intermediate solid
solutions. Thus, we can exclude that a large pro-
portion of atoms have migrated in octahedralvacancies in the studied compounds.
• Another possibility is to consider a perfectlyperiodic arrangement of the metal atoms be-
tween two planes of sulfur atoms. In this case,
STM images would be identical and would pres-
ent an ordered succession of intensity maxima
related to sulfur atoms in bimetallic environ-
ment; the results obtained show that thishypothesis is not valid.
• Considering a simple juxtaposition of stackedlayers from TiS2 and TaS2 along the c crystallo-graphic axis is also incompatible with our re-
sults; STM images would reveal in that case
the close-packed hexagonal top sulfur plane
for TiS2 or a regular CDW state for TaS2 as
function of the nature of the top layers. Further-more, the shape of the Ta 4f and S 2p peaks with
two different doublets and the FWHM of Ti 2p
peaks implies the presence of several environ-
TEDPROOF
ments for these atoms. Then, a perfect order
for Ti0:5Ta0:5S2 compound is obviously unlikely.
• Another possible hypothesis for the intermedi-ate compositions may be described as an assem-
bly of ordered domains, separated bydiscontinuities, both with non-equivalent size.
Any disordered array of atoms distributed on
the sites of a regular lattice, whether random
or having a definable degree of short range or-
der, may be divided into regions of ordered lat-
tice, the boundaries between the regions being
usually identifiable as a simultaneous presence
of the two cations (Ti and Ta). In this hypothe-sis, the main doublets (�70%) of Ti0:4Ta0:6S2,Ti0:5Ta0:5S2, and Ti0:6Ta0:4S2 observed for S 2p
and Ta 4f core peaks are associated to the or-
dered lattices TiS2 or TaS2. In the case of the
S 2p core peaks, the binding energy evolution
of the main doublet is characteristic of an aver-
age effect from the ionicity of the Ti–S and Ta–S
bonds. The binding energy of the more intenseTa 4f doublet corresponds to tantalum atoms
in an octahedral sulfur environment. These re-
sults have to be linked to the close-packed hex-
agonal top sulfur plane (from TaS2 or TiS2,
where both have a close a lattice parameter) re-vealed by STM analysis (Fig. 7c), with no influ-
ence from the CDW state. The ordered lattice of
TaS2 (TiS2) may form a small domain surround-ing by TiS2 (TaS2) regions. The statistical distri-
bution of sizes and shapes of these ordered
domains seems to be unordered and are obvi-
ously not uniform. In these conditions, the influ-
ence of the CDW state over corrugation from
the top layers plane would be very low and no
detectable by STM.
The second doublets (whose relative intensitiesare about 30%), located for both S 2p and Ta 4f at
higher binding energy than the previous ones are
more ambiguous. Their binding energies are
characteristic of a loss of electronic charge com-
pared to the atoms associated with the most in-
tense doublet belonging to tantalum or titanium
disulphide domains. As a re-distribution of the
total electronic population has to be considered onthe level of the frontier zones, we propose that they
could be associated to boundaries between the
regions of TiS2 and TaS2.
581
582
583
584
585
586587
588
589
590
591
592
593
594595
596
597
598
599
600
601
602
603
604
605
606
607
608
609
610
611
612
613
614
615616
617
618
619
620
621
622
623624
625
626
627
628
629
630631632
633634
635
636
637
638
639
12 Y. Tison et al. / Surface Science xxx (2004) xxx–xxx
SUSC 15015 No. of Pages 16, DTD = 4.3.1
11 June 2004 Disk usedARTICLE IN PRESS
C
Let us notice as the STM images suggest, that a
bringing together between some sulfur atoms
(2.8 �A instead of 3.4 �A) takes place in these dis-ordered areas. Such a result which supports sulfur-
sulfur interactions, is consistent with the charac-
terization of a second doublet for S 2p peak whosebinding energy is close to the one determined for
S2�2 sulfur pairs in the TiS3 compound [28].
Thus, the images which present a more dis-
turbed profile (Fig. 7) would be associated to the
frontier zones for which the presence of two metals
in the subjacent plane would involve variations of
heights or electronic charge at the level of the
sulfur atoms from the top layer. These results arecoherent with what is observed on the level of the
amorphous compounds [29]: unusual coordinances
and bond length distributions.
The electronic reorganization considered pre-
viously on the level of the frontier zones should
benefit to the titanium atoms in mixed zone via
metal/metal interactions.
4.2.2. Description of specific interactions
As previously mentioned, the hypothesis of
frontier zones between the TiS2 and TaS2 domains
implies the presence of sulfur atoms in bimetallic
environment. As a consequence, the metal/sulfur
but also metal/metal interactions in these bound-
aries regions might be modified. In order to
investigate more deeply these electronic reorgani-
UNCORRE
Fig. 9. Model unit cell used for Ti0:5Ta0:5S2 in the theoretical calculatio
present, either coordinated to two titanium and one tantalum atoms
titanium atoms (S(2Ta, 1Ti). In this case, the second neighbors of the t
reverse proportion should be considered if we look at the second nei
TEDPROOF
zations, we have undertaken a simulation of the
different local environments of sulfur, titanium
and tantalum atoms by performing periodic cal-
culations on three model unit cells (Ti0:25Ta0:75S2,
Ti0:5Ta0:5S2 and Ti0:75Ta0:25S2). The Fig. 9 repre-
sents the unit cell of Ti0:5Ta0:5S2, as an example.These model structures allow simulating different
environments for the titanium or the tantalum
atoms in the metal atom plane.
To characterize more deeply the possible metal/
metal interactions, we report the projected band
structures (‘‘fat bands’’) for the 3d and 5d atomic
orbitals of the metal atoms. In a first step, we find
it necessary to present the results (Fig. 10) ob-tained, in the same computational conditions, on
the TaS2 and TiS2 disulfides taken as reference for
the Ta/Ta and Ti/Ti interactions. The band struc-
tures reported in Fig. 10 show very similar shape
for the first group of two bands (between )15.2and )12.7 eV for TaS2 and between )13.2 and)11.8 eV for TiS2) mainly developed on S(3s)
orbitals. The main contribution to the valenceband located just below the Fermi level (between
)7.2 and )0.8 eV for TaS2 and between )5.1 and0.0 eV for TiS2) comes from S(3p) orbitals with a
non-negligible admixture of M(d) orbitals. Be-
cause of the different electronic configuration of
the metal atoms in their sulfur environment (Ti(d0)
and Ta(d1)), the conduction band is empty for TiS2and partially filled for TaS2. However, in both
ns. In this structure, sulfur atoms in bimetallic environment are
(noted S(2Ti, 1Ta)) or surrounded by two tantalum and one
itanium atoms are constituted by four Ta and two Ti atoms. The
ghbors of the tantalum atoms.

RRECTEDPROOF
640
641642
643
644
645
646
647
648
649650
651
652
653
654
655
656
657658
659
660661
662
663
664
Fig. 10. ‘‘Fat’’ electronic band structures of TiS2 (a) and TaS2(b). The M(d) contributions are set proportional to the thick-
ness of the band. The Fermi level is set at the origin of the
energy.
Fig. 11. ‘‘Fat’’ electronic band structures of Ti0:5Ta0:5S2. The
Ta(5d) (a) and the Ti(3d) (b) contributions are set proportional
to the thickness of the band. The Fermi level is set at the origin
of the energy.
Y. Tison et al. / Surface Science xxx (2004) xxx–xxx 13
SUSC 15015 No. of Pages 16, DTD = 4.3.1
11 June 2004 Disk usedARTICLE IN PRESS
UNCOcases, its shape formed by three t2g plus two egbands clearly reflects the CdI2-type crystal struc-ture based on interacting MS6 octahedra. Note
that the energetic dispersion of the t2g levels is
definitely higher for TaS2 (4.1 eV) than for TiS2(2.1 eV), in agreement with the literature [30]. This
band dispersion can directly be correlated to the
binding metal–metal interactions which take part
in a non-negligible way in cohesion of tantalum
disulphide while such metallic bonds do not existin titanium disulphide.
For the three model structures, the conduction
band energetic levels are progressively occupied as
the tantalum concentration increases. As an
example, the Fig. 11 reports the ‘‘fat bands’’ of
Ti0:5Ta0:5S2 showing the contributions of both
Ti(3d) and Ta(5d). The 12 bands (three bands per
metal atom) which correspond to electronic stateswith a major t2g character, belonging both to
Ti(3d) and Ta(5d) orbitals are localized between
)0.7 and +2.3 eV (energetic dispersion equal to 3eV). The same behavior is observed for the ‘‘fat
bands’’ of the two other model structures. Only the
energetic dispersion differs (2.5 and 3.5 eV
respectively for Ti0:75Ta0:25S2 and Ti0:25Ta0:75S2).

RECTEDPROOF
665
666667
668
669
670
671
672
673
674675
676
677
678679
680
681
682
683
684
685
686687
688
Fig. 12. Charge density map plotted in the (1 0 0) plane in the energetic window corresponding to the occupied t2g bands for TiS2 (a),
Ti0:75Ta0:25S2 (b), Ti0:25Ta0:75S2 (c) and TaS2 (e).
14 Y. Tison et al. / Surface Science xxx (2004) xxx–xxx
SUSC 15015 No. of Pages 16, DTD = 4.3.1
11 June 2004 Disk usedARTICLE IN PRESS
UNCORCompared to the results obtained for the mother
compounds, these results indicative of metallicbinding, highlight Ti/Ta interactions.
The charge density maps plotted in the (1 0 0)
plane (including the metal atoms) in the energetic
window associated to the filled levels of the con-
duction band confirm our results (Fig. 12). The
overlap between the atomic orbitals of the metal
atoms increases from Ti0:75Ta0:25S2 to TaS2-1T
when the titanium atoms are gradually replaced bytantalum ones. As a consequence, the binding
character of the metal/metal interaction increases
in the TixTa1�xS2 series when tantalum concen-
tration increases. Naturally, no effective interac-tion between titanium atoms is observed in the
case of TiS2.
The atomic populations of the Ti(3d) and
Ta(5d) (calculated by integrating the correspond-
ing densities of states, Table 2) in the energy
window corresponding to the occupied t2g levels
show the metallic interaction as a consequence of
the re-distribution of the tantalum electronic den-sity towards the titanium one. The electronic
charge of the titanium atoms increases with the

F
689
690
691
692
693
694695
696
697
698
699
700
701
702703
704
705
706
707
708
709
710711
712
713
714
715
716
717
718719
720
721
722
723
724
725
726
727
728729
730
731732
733
734735
736
737
738
739
740
741
742743
744
745
746
747
748
749
750751
Table 2
Electronic populations (e�) of the Ti(3d) and Ta(5d) atomic orbitals for Ti0:75Ta0:25S2, Ti0:5Ta0:5S2, Ti0:25Ta0:75S2 and TaS2 in the
energetic window corresponding to the occupied t2g bands
Ti0:75Ta0:25S2[)0.4 eV, 0 eV]
Ti0:5Ta0:5S2[)0.7 eV, 0 eV]
Ti0:25Ta0:75S2[)1.0 eV, 0 eV]
TaS2-1T
[)1.3 eV, 0 eV]
Ti(3d) 0.253 0.433 0.716 –
(2Ta, 4Ti) (4Ta, 2Ti) (6Ta)
Ta(5d) 0.210 0.379 0.591 0.756
(6Ti) (2Ta, 4Ti) (4Ta, 2Ti) (6Ta)
The environment of each titanium or tantalum atom in the metallic plane is reported in parenthesis.
Y. Tison et al. / Surface Science xxx (2004) xxx–xxx 15
SUSC 15015 No. of Pages 16, DTD = 4.3.1
11 June 2004 Disk usedARTICLE IN PRESS
CORRECnumber of tantalum atoms located in their second
sphere of coordination. On the other hand, the
tantalum atoms are less and less charged when the
number of titanium atoms increases in their second
sphere of coordination. This phenomenon explains
the observation of the second doublet for the Ta 4fcore peaks of Ti0:4Ta0:6S2, Ti0:5Ta0:5S2 and
Ti0:6Ta0:4S2 toward higher binding energies.
The presence of bimetallic interactions in the
boundaries zones should explain why some defects
were revealed for TiS2 by STM analyses, and why
they were never observed in the case of substituted
compounds. First, TiS2 presents (in the metallic
plane) a very weak metal/metal bonding energywhich can lead to a significant mobility of the
metal atoms and thus to the presence of defects. As
shown in the previous paragraph, the progressive
occupation of the t2g crystalline orbitals in the
TixTa1�xS2 materials reinforces the bonding tita-
nium/tantalum interaction compared to titanium/
titanium one. When x ¼ 1, the tantalum/tantaluminteractions lead to the formation of clusters. Thedemonstration of this phenomenon is a shortening
of the Ta/Ta bond [31] and the creation of a charge
density wave (even if the origin of the phenomenon
is more complex [25–27]). Then, when x increases,the charge transfer of the tantalum atoms towards
the titanium ones makes it possible to fix the metal
atoms, by stabilizing interactions. The existence of
structural defects related to a metal mobility isthus not effective.
752
753
754
755
756
UN5. ConclusionThe study of the solid solutions TixTa1�xS2 was
undertaken with the aim of identifying the struc-
TEDPROOtural and electronic modifications induced by the
simultaneous presence of two cations.
The results obtained by scanning tunneling
microscopy led us to propose two types of struc-
tural arrangements according to the composition:
• a random dispersion of the minority metal cat-
ion in a matrix of the majority species for the
slightly substituted compounds,
• an organization in ordered domains of TiS2 andTaS2 separated by frontier zones for the inter-
mediate compositions.
These two types of structures are in accordancewith the analysis of the experimental results by
XPS, obtained for the slightly substituted com-
pounds and intermediate compositions, respec-
tively. In particular, for the last ones, the images of
the frontier zones highlight a bringing together
between some sulfur atoms, supporting S–S
interaction. This phenomenon would be at the
origin of the presence of the second appearingdoublet with higher binding energy than the main
one and associated to sulfur atoms located in or-
dered domains of disulfides. More, the presence of
two doublets for the Ta 4f core peaks of the
intermediate compositions consolidates the
assumption of ordered domains separated by dis-
ordered frontier zones: the first doublet is associ-
ated with the atoms located in the TiS2 and TaS2domains while the second one should correspond
to those which belong to the frontier zones.
The theoretical study of model structures en-
abled us to highlight metal-metal interactions. On
the basis of these interactions, it is possible to ex-
plain some of our experimental results, as the lack
757
758
759
760761762763764765766767768769770771772773774775776777778779780781782783784785786787788789790791792793794795
796797
16 Y. Tison et al. / Surface Science xxx (2004) xxx–xxx
SUSC 15015 No. of Pages 16, DTD = 4.3.1
11 June 2004 Disk usedARTICLE IN PRESS
of defects characteristic of TiS2 for the solid
solutions, whatever the composition.
798799800801802803804805806807808809810811812813814815816817818819820821822823824825826827828829830831832833834835836837REC
References
[1] (a) M. Shimikawa, H. Maki, H. Nishihara, K. Hayashi,
Mater. Res. Bull. 32 (1997) 689;
(b) S.J. Furuseth, Alloys Comp. 178 (1992) 211.
[2] P. Fazekas, E. Tosatti, Philos. Mag. B 39 (3) (1979) 229.
[3] J.A. Benda, Phys. Rev. B 10 (4) (1974) 1409.
[4] (a) J.A. Wilson, A.D. Yoffe, Adv. Phys. 18 (1969) 193;
(b) R.H. Friend, A.D. Yoffe, Adv. Phys. 36 (1987) 1;
(c) G.L. Frey, K.J. Reynolds, R.H. Friend, Adv. Mater. 14
(4) (2002) 265.
[5] (a) C.H. Chen, W.A. Fabian, F.C. Brown, K.C. Woo,
B. Davies, B. De Long, A.H. Thompson, Phys. Rev. B 21
(1980) 615;
(b) M. Sch€arli, J. Brunner, H.P. Vaterlaus, F. L�evy,
J. Phys. C 16 (1983) 1527.
[6] F.J. DiSalvo, D.E. Moncton, J.V. Wazczak, Phys. Rev.
B 14 (1976) 4321.
[7] F.J. Di Salvo, J.A. Wilson, B.G. Bagley, J.V. Waszcak,
Phys. Rev. B 12 (6) (1975) 2220.
[8] (a) R.V. Coleman, B. Drake, P.K. Hansma, C.G. Slough,
Phys. Rev. Lett. 55 (4) (1985) 394;
(b) C.G. Slough, W.W. McNairy, R.V. Coleman,
B. Drake, P.K. Hansma, Phys. Rev. B 34 (2) (1975) 994;
(c) X.L. Wu, C.M. Lieber, Science 243 (1989) 1703.
[9] (a) X.L. Wu, P. Zhou, C.M. Lieber, Phys. Rev. Lett. 61
(22) (1988) 2604;
(b0) X.L. Wu, P. Zhou, C.M. Lieber, Nature 335 (1988) 55.
[10] (a) H. Bando, Y. Miyahara, H. Enomoto, H. Ozaki, Surf.
Sci. 381 (1997) L609;
(b) H. Bando, K. Koizumi, Y. Miyahara, H. Ozaki, J.
Phys.: Condens. Matter 12 (2000) 4353.
[11] H. Chen, X.L. Wu, C.M. Lieber, J. Am. Chem. Soc. 112
(1990) 3326.
[12] (a) H. Martinez, S.F. Matar, C. Auriel, M. Loudet,
G. Pfister-Guillouzo, J. Alloys Compd. 245 (1996) 30;
(b) H. Martinez, Y. Tison, I. Baraille, M. Loudet,
D. Gonbeau, J. Electron Spectr. Phenom. 125 (2002) 181;
UNCOR
TEDPROOF
(c) I. Baraille, H. Martinez, Y. Tison, M. Loudet,
D. Gonbeau, Surf. Sci. 517 (2002) 43.
[13] A.H. Thompson, K.R. Pisharody, R.F. Koelher, Phys.
Rev. Lett. 29 (3) (1972) 163.
[14] J.B. Goodenough, in: H. Reiss (Ed.), Progress in Solid
State Chemistry, vol. 5, Pergamon, Oxford, 1971.
[15] G. Haegg, N. Schoenberg, Ark. Kemi. 7 (1954) 371.
[16] S.K. Srivastava, T.K. Mandal, B.K. Samantaray, Synth.
Met. 90 (1997) 135.
[17] D. Singh, in: Planewaves Pseudopotentials and the LAPW
Method, Kluwer Academic Publishers, Boston, 1994.
[18] P. Blaha, K. Schwarz, J. Luitz, WIEN97, Vienna Univer-
sity of Technology 1997. (Improved version of the original
copyrighted WIEN-code, which was published by P. Blaha,
K. Schwarz, P. Sorantin and S.B. Trickey, in Comput.
Phys. Commun. 59 (1990) 399).
[19] J.P. Perdew, S. Burke, M. Ernzherhof, Phys. Rev. Lett. 77
(1996) 3865.
[20] P. Blaha, J. Phys.: Condens. Matter 3 (1991) 9381.
[21] K. Dartigeas, L. Benoist, D. Gonbeau, G. Pfister-Guillo-
uzo, G. Ouvrard, A. Levasseur, Electron Spectrosc. Relat.
Phenom. 83 (1997) 45.
[22] R. Eppinga, G.A. Sawatzky, C. Haas, C.F. Van Bruggen,
J. Phys. C: Solid State Phys. 9 (1976) 3371.
[23] H. Martinez, P. Azavant, M. Loudet, Surf. Sci. 400 (1998)
247.
[24] G.P.E.M. Van Backel, J.T.M. De Hosson, T. Hibma,
Appl. Phys. Lett. 56 (1990) 2402.
[25] M.H. Whangbo, E.J. Canadell, Am. Chem. Soc. 114 (1992)
9587.
[26] M.H. Whangbo, J. Ren, E.J. Canadell, D. Louder,
B.A. Parkinson, H. Bengel, S.N. Magonov, J. Am. Chem.
Soc. 115 (1993) 3760.
[27] P. Aebi, T. Pillo, H. Berger, F. Levy, J. Electron Spectrosc.
Relat. Phenom. 117–118 (2001) 433.
[28] A. Levasseur, P. Vinatier, D. Gonbeau, Bull. Mater. Sci. 22
(1999) 607.
[29] J. Zarzycki (Ed.), Glasses and Amorphous Materials,
Material Science and Technology, vol. 9, 1991.
[30] M.L. Doublet, S. Remy, F.J. Lemoigno, Chem. Phys. 113
(2000) 5879.
[31] R. Brouwer, F. Jellinek, Physica 99B (1980) 51.
Copyright © 2022 FDOKUMEN