Dissipative particle dynamics simulations of weak polyelectrolyte adsorption on charged and neutral...
12
Dissipative particle dynamics simulations of weak polyelectrolyte adsorption on charged and neutral surfaces as a function of the degree of ionization F. Alarc´ on, ab E. P´ erez ac and A. Gama Goicochea * d The influence of the chain degree of ionization on the adsorption of weak polyelectrolytes on neutral and on oppositely and likely charged surfaces is investigated, by means of Monte Carlo simulations with a mesoscopic interaction model known as dissipative particle dynamics. The electrostatic interactions are calculated using the three-dimensional Ewald sum method, with an appropriate modification for confined systems. Effective wall forces confine the linear polyelectrolytes, and electric charges on the surfaces are included. The solvent, which is included explicitly, has a fluctuating particle number. The results show that the polyelectrolytes adsorb onto both neutral and charged surfaces, with the adsorption regulated by the chain degree of ionization, being larger at lower ionization degrees, where polyelectrolytes are less charged. Furthermore, polyelectrolyte adsorption is strongly modulated by the counterions screening of surface charges. These findings are supported by predictions of adsorption isotherms with varying ionization degrees. We obtain also the surface force mediated by adsorbed polyelectrolytes, which is calculated for the first time as a function of ionization degree. The adsorption and surface force isotherms obtained for weak polyelectrolytes are found to reproduce main trends in experiments, whenever those results are available, and provide additional insight into the role played by the competitive adsorption of the counterions and polyelectrolytes on the surfaces. I Introduction The adsorption of polyelectrolytes at surfaces is the basis of many water-based manufactured products and mineral recovery processes; also the behavior of many biological polyelectrolytes (such as proteins or DNA) is inuenced by the presence of charged membranes. The interest for polyelectrolyte adsorption on colloidal particles is especially relevant in the paint and coatings industry, where pigments have to be well dispersed to obtain optimal results in properties like gloss, opacity, and color distribution. These pigments are usually stabilized by polyelectrolytes, and the effectiveness of their adsorption is of capital importance when optimizing those properties. 1 From the point of view of fundamental research, several topics still remain poorly understood, such as the inuence of surface charge distribution on the adsorption, the competition among the counterions and polyelectrolytes for the adsorption sites, the dependence of these factors on the surface force, etc. (see for example ref. 2). Many stimuli-responsive polymer brushes are polyelectrolytes; 3 hence the adsorption of polyelectrolytes at surfaces continues to be a subject of much experimental, theoretical and computer simulation research. Polyelectrolytes are classied by their ability to be ionized in water as strong or weak polyelectrolytes. Strong polyelectrolytes are easily ionized, and electrostatic charge is not too sensitive to pH in solution. By contrast, weak polyelectrolytes are very sensitive to pH changes because ionic equilibrium determines the ionization of their anionic/cationic groups. 4 The pH value essentially controls the degree of ionization (a) of weak poly- electrolytes, which is directly related to the dissociation constant of the anionic group and the polyelectrolyte confor- mation. 5 In addition, the properties of colloidal metallic parti- cles in aqueous suspensions are usually pH dependent, because metallic oxides are present on their surface. Weak poly- electrolyte adsorption onto pigment surfaces (say, TiO 2 ), to name an example, is thus pH dependent, and colloidal stability is frequently associated with a limiting pH value in these dispersions. 6 The adsorption of weak polyelectrolytes onto colloidal pigments, as a function of pH and ionic strength, has been investigated experimentally for different metals whose surfaces are usually oxidized, such as polyacrylic acid, polyacrylamide, and modied polyacrylamides onto titania; 7 polyacrylic acid a Centro de Investigaci´ on en Pol´ ımeros (Grupo COMEX), Marcos Achar Lobat´ on no. 2, Tepexpan, 55885 Acolman, Estado de M´ exico, Mexico b Departament de Fisica Fonamental, Facultat de Fisica, Universitat de Barcelona, Marti i Franques, 1 08028 Barcelona, Spain c Instituto de F´ ısica, Universidad Aut´ onoma de San Luis Potos´ ı, ´ Alvaro Obreg´ on 64, 78000 San Luis Potos´ ı, Mexico d Departamento de Ciencias Naturales, DCNI, Universidad Aut´ onoma Metropolitana, Unidad Cuajimalpa, Av. Pedro Antonio de los Santos 84, M´ exico, D. F. 11850, Mexico. E-mail: [email protected] Cite this: Soft Matter, 2013, 9, 3777 Received 9th October 2012 Accepted 20th December 2012 DOI: 10.1039/c2sm27332b www.rsc.org/softmatter This journal is ª The Royal Society of Chemistry 2013 Soft Matter, 2013, 9, 3777–3788 | 3777 Soft Matter PAPER
-
Upload
independent -
Category
Documents
-
view
1 -
download
0
Transcript of Dissipative particle dynamics simulations of weak polyelectrolyte adsorption on charged and neutral...

Soft Matter
PAPER
aCentro de Investigacion en Polımeros (Grup
Tepexpan, 55885 Acolman, Estado de MexicbDepartament de Fisica Fonamental, Facu
Marti i Franques, 1 08028 Barcelona, SpaincInstituto de Fısica, Universidad Autonoma
78000 San Luis Potosı, MexicodDepartamento de Ciencias Naturales, DCN
Unidad Cuajimalpa, Av. Pedro Antonio d
Mexico. E-mail: [email protected]
Cite this: Soft Matter, 2013, 9, 3777
Received 9th October 2012Accepted 20th December 2012
DOI: 10.1039/c2sm27332b
www.rsc.org/softmatter
This journal is ª The Royal Society of
Dissipative particle dynamics simulations of weakpolyelectrolyte adsorption on charged and neutralsurfaces as a function of the degree of ionization
F. Alarcon,ab E. Perezac and A. Gama Goicochea*d
The influence of the chain degree of ionization on the adsorption of weak polyelectrolytes on neutral and
on oppositely and likely charged surfaces is investigated, by means of Monte Carlo simulations with a
mesoscopic interaction model known as dissipative particle dynamics. The electrostatic interactions are
calculated using the three-dimensional Ewald sum method, with an appropriate modification for
confined systems. Effective wall forces confine the linear polyelectrolytes, and electric charges on the
surfaces are included. The solvent, which is included explicitly, has a fluctuating particle number. The
results show that the polyelectrolytes adsorb onto both neutral and charged surfaces, with the
adsorption regulated by the chain degree of ionization, being larger at lower ionization degrees, where
polyelectrolytes are less charged. Furthermore, polyelectrolyte adsorption is strongly modulated by the
counterions screening of surface charges. These findings are supported by predictions of adsorption
isotherms with varying ionization degrees. We obtain also the surface force mediated by adsorbed
polyelectrolytes, which is calculated for the first time as a function of ionization degree. The adsorption
and surface force isotherms obtained for weak polyelectrolytes are found to reproduce main trends in
experiments, whenever those results are available, and provide additional insight into the role played by
the competitive adsorption of the counterions and polyelectrolytes on the surfaces.
I Introduction
The adsorption of polyelectrolytes at surfaces is the basis ofmany water-basedmanufactured products andmineral recoveryprocesses; also the behavior of many biological polyelectrolytes(such as proteins or DNA) is inuenced by the presence ofcharged membranes. The interest for polyelectrolyte adsorptionon colloidal particles is especially relevant in the paint andcoatings industry, where pigments have to be well dispersed toobtain optimal results in properties like gloss, opacity, andcolor distribution. These pigments are usually stabilized bypolyelectrolytes, and the effectiveness of their adsorption is ofcapital importance when optimizing those properties.1 Fromthe point of view of fundamental research, several topics stillremain poorly understood, such as the inuence of surfacecharge distribution on the adsorption, the competition amongthe counterions and polyelectrolytes for the adsorption sites,
o COMEX), Marcos Achar Lobaton no. 2,
o, Mexico
ltat de Fisica, Universitat de Barcelona,
de San Luis Potosı, Alvaro Obregon 64,
I, Universidad Autonoma Metropolitana,
e los Santos 84, Mexico, D. F. 11850,
Chemistry 2013
the dependence of these factors on the surface force, etc. (see forexample ref. 2). Many stimuli-responsive polymer brushes arepolyelectrolytes;3 hence the adsorption of polyelectrolytes atsurfaces continues to be a subject of much experimental,theoretical and computer simulation research.
Polyelectrolytes are classied by their ability to be ionized inwater as strong or weak polyelectrolytes. Strong polyelectrolytesare easily ionized, and electrostatic charge is not too sensitive topH in solution. By contrast, weak polyelectrolytes are verysensitive to pH changes because ionic equilibrium determinesthe ionization of their anionic/cationic groups.4 The pH valueessentially controls the degree of ionization (a) of weak poly-electrolytes, which is directly related to the dissociationconstant of the anionic group and the polyelectrolyte confor-mation.5 In addition, the properties of colloidal metallic parti-cles in aqueous suspensions are usually pH dependent, becausemetallic oxides are present on their surface. Weak poly-electrolyte adsorption onto pigment surfaces (say, TiO2), toname an example, is thus pH dependent, and colloidal stabilityis frequently associated with a limiting pH value in thesedispersions.6
The adsorption of weak polyelectrolytes onto colloidalpigments, as a function of pH and ionic strength, has beeninvestigated experimentally for different metals whose surfacesare usually oxidized, such as polyacrylic acid, polyacrylamide,and modied polyacrylamides onto titania;7 polyacrylic acid
Soft Matter, 2013, 9, 3777–3788 | 3777

Soft Matter Paper
onto alumina;8 and carboxymethyl cellulose, polyacrylamide,and modied polyacrylamides onto talc.9 Pigments are usuallycharacterized by their isoelectric point, which is the point ofzero charge in a titration experiment: at low pH (acid solutions)the oxide surface is positively charged, while at high pH (basicsolutions) it is negatively charged. These works have shown thatat low pH values, the adsorption of anionic polyelectrolytes onpositively charged surfaces is high, while at higher pH valuesthe adsorption on negatively charged surfaces decreases. Poly-electrolyte adsorption onto surfaces with charges of signopposite to those on the polyelectrolyte at low pH is expected,but polyelectrolyte adsorption on surfaces with the same chargeat high pH is not, simply because of Coulomb repulsion, at leastif no other mechanism is at work. However, such same-chargeadsorption has been observed and it has been explained by thepresence of counterions that decrease the electrostatic interac-tion between the polyelectrolyte and pigment,10 or even by thepossible presence of H-bonds between polyelectrolyte groupsand pigment surfaces.7,11 Moreover, the role of ions in theadsorption of polyelectrolytes has also been recognized. Theseions may produce a salt-exclusion effect that limits the polymeradsorption at high surface charge,10 and dene low or high-saltregimes, where the electrostatic interactions are long or shortranged, and satisfy different scaling laws.12
These trends have been observed in the adsorption of poly-acrylic acid on strong, positively charged polystyrene latex byquaternary ammonium groups, whose ionization is indepen-dent of pH.10 In this system, upon pH changes, the degree ofionization of the polyelectrolyte is varied, but the sign of thecharge is conserved. In such case, the polyelectrolyte adsorptionalso increases as the pH decreases, arriving at a high adsorptionwhen the pH of the solution is close to the pK0 of the poly-electrolyte, which can be explained using an extension of theself-consistent-eld theory of Scheutjens and Fleer.11 There arenow a number of theoretical works that have advanced signi-cantly the eld of polyelectrolyte adsorption. Dobrynin and co-workers13 developed a scaling theory for the adsorption ofpolyelectrolytes at oppositely charged surfaces, and found thatthe adsorbed polyelectrolyte layer thickness was the result of thebalance between electrostatic attraction and chain entropy, forweakly charged surfaces. However, they did not address theissue of the polyelectrolyte adsorption when the pH iscontrolled, nor did they study the effect of the interaction of thepolymer backbone and the surface. On the computer modelingside, Monte Carlo (MC) simulations have been used to study theconformational changes of one polyelectrolyte in the presenceof one oppositely charged particle and to predict adsorptionisotherms of ionic surfactants on neutral particles as a functionof the surfactant–particle non-electrostatic interaction, ndingsimilar trends to those described above.14 Using constantdensity MC simulations, Messina15 found that the effect ofimage forces can reduce polyelectrolyte adsorption and conse-quently, may inhibit charge inversion on the surfaces due to thepolyelectrolytes. The inuence of pH, or that of the connement(at xed chemical potential), on polyelectrolyte adsorption wasnot discussed in that work. Carnal and Stoll16 performedimplicit solvent Grand Canonical MC simulations of
3778 | Soft Matter, 2013, 9, 3777–3788
polyelectrolytes, nanoparticles, counterions and salt particles,and found that at large values of the degree of ionization andnanoparticle charge density, the polyelectrolytes were wrappedon the nanoparticles. On the other hand, Velichko and Olverade la Cruz17 found that polyelectrolytes can form patterns oncharged surfaces, while Chang and Yethiraj18 used moleculardynamics simulations to model polyelectrolyte association, andfound that the inclusion of the solvent explicitly was importantto allow or inhibit the formation of certain structures. However,we are not aware of any simulation work on the prediction ofadsorption and surface force isotherms of polyelectrolytes as afunction of pH or ionization degree on charged and neutralsurfaces.
In the present work, we study the adsorption of weak posi-tively charged polyelectrolytes onto neutral and negativelycharged surfaces, and of weak negatively charged poly-electrolytes onto a negatively charged surface, as a function ofthe degree of ionization, by means of MC simulations in thesemi-Grand Canonical (GC) ensemble (hereaer referred to forsimplicity as GCMC), namely, at xed solvent chemical poten-tial (m), volume (V), and temperature (T). The surface force thatthe colloidal particles experience is also calculated as a functionof the degree of ionization. The interaction model used is thecoarse-grained, mesoscopic method known as dissipativeparticle dynamics (DPD),19 which is complemented with theexplicit inclusion of electrostatic interactions by means of theEwald sums, appropriately adapted for conned systems.20
The short-range interactions among the uid particles and thecolloids are modeled by exact, effective DPD walls.21 Addition-ally, a coarse-grained model for the charges distributed on thecolloidal particle surface is proposed. The solvent and coun-terions are included explicitly.
This work is organized as follows. In Section II we show verybriey the DPD interaction model; Section III is devoted to areview of the GCMC–DPD hybrid algorithm for conned uids.In Section IV one can nd the details about how the electro-statics is included in a conned DPD uid, with surface chargesas detailed in Section V. The computational details of oursimulations as well as the description of all systems studied areto be found in Section VI, while the results and discussion arepresented in Section VII. Finally, conclusions are drawn inSection VIII.
II DPD force model
In DPD, the uid is coarse-grained into so, momentumcarrying beads, with their dynamics governed by the followingstochastic differential equation:19
_vi ¼Xjsi
ðF Cij þ FD
ij þ FRij Þ (1)
_ri ¼ ni, (2)
where all masses are set equal to 1. The pairwise additive forcesin eqn (1) are identied as the conservative FC
ij, dissipative FDij ,
and random FRij contributions, and are given by:
This journal is ª The Royal Society of Chemistry 2013

Paper Soft Matter
FCij ¼ aij
�1� rij
.Rc
�eij (3)
FDij ¼ �g
�1� rij
.Rc
�2heij$vij
ieij (4)
FRij ¼ s
�1� rij
.Rc
�eijxij (5)
where rij ¼ ri � rj is the relative position vector, eij is the unitvector in the direction of rij, and vij ¼ vi � vj is the relativevelocity, with ri, vi the position and velocity of particle i,respectively. The random variable xij is generated between 0 and1 with Gaussian distribution of unit variance; aij, g and s are thestrength of the conservative, dissipative and random forces,respectively; Rc is a cut-off distance. All these forces are zero forrij > Rc. All beads are of the same size, with radius Rc, which is setequal to 1. The constants in eqn (4) and (5) must satisfy:
s2
2g¼ kBT (6)
as a consequence of the uctuation–dissipation theorem,22
where kB is Boltzmann's constant. The short-range nature ofthese forces and their simple spatial dependence allow the useof relatively large time steps when integrating the equation ofmotion. As the DPD particles are representations of groups ofatoms or molecules, the DPD method becomes an attractivealternative to study systems at the mesoscopic level. Note alsothat the forces in eqn (3)–(5) obey Newton's third law, whichmeans momentum is conserved locally, and globally, which inturn preserves any hydrodynamic modes present in the uid.Another appealing feature of DPD is the natural thermostat thatarises from the compensation between the dissipative andrandom forces, as stated in eqn (6). This interaction model hasbeen used successfully to predict equilibrium properties ofpolymer melts,23 surfactants in solution,24 and colloidalstability,25 to name a few. For further reading, see ref. 26.
III GCMC–DPD for confined systems
We use the GC (or mVT) ensemble to ensure the uid modeled isin chemical, mechanical and thermal equilibrium. The algo-rithm, which we call GCMC–DPD,25 is a hybrid between MC anddynamics, because for each MC cycle one performs 10 DPDsteps, integrating eqn (1) and (2) to create new positions andvelocities for the uid particles. EachMC step starts out with thecalculation of the total energy of the conguration, which iscalled the initial energy of such conguration. Then, a 10-stepmolecular dynamics of the DPD type is used to obtain newpositions and momenta for all particles in the system, therebycreating a new conguration using a deterministic integrationof the equation of motion, instead of using the traditional MCprocedure, which creates the new conguration randomly. TheDPD part of the algorithm is used only to generate newcongurations, and we have found that a 10-step dynamics issufficient, since using longer simulations increases thecomputational cost while adding no improvement to the results
This journal is ª The Royal Society of Chemistry 2013
obtained. Aer the tenth step of the dynamics, the total energyof the system is compared with the initial energy, and thedynamics is nished for that particular MC step. Then, the newstate is accepted or rejected using the Metropolis algorithm.27
When this process has been completed, the NVT part of that MCstep is nished and the exchange of monomeric solvent beadswith the bulk is attempted, inserting or deleting beads to keepthe chemical potential xed, with probability (here, min[a,b] indicates that the minimum between a and b is to bechosen):
Pinsertion ¼ min
�1;hZðzÞiVN þ 1
exp
�� DU test
kBT
��(7)
Pdeletion ¼ min
�1;
N
hZðzÞiV exp
�� DU test
kBT
��(8)
where DUtest is the conservative interaction energy differencebetween the added or removed bead, and the N or N � 1remaining beads, including the conservative interaction withthe surfaces. hZ(z)i is the so-called activity, dened for inho-mogeneous systems as:28
hZðzÞi ¼ hrðzÞiNVT�exp
�� DU test
.kBT
��NVT
¼ ehmðzÞi
.kBT (9)
where hm(z)i is the chemical potential for an inhomogeneoussystem in the z-direction, and the angular brackets representaverages in the NVT (canonical) ensemble. The total average z-dependent density is r(z). To keep the chemical potential of thesolvent constant, the addition or removal of solvent beads isperformed a number of times approximately equal to theaverage number of DPD beads. Once this interchange iscompleted, a new constant density MC cycle begins (passingagain through the 10-step dynamics, choosing a congurationwith the Metropolis algorithm, and proceeding then to theexchange of particles) until equilibrium has been attained, andstable acceptance rates have been reached. Aerwards, aver-ages of the equilibrium thermodynamic properties areobtained and analyzed. The constant chemical potential ischosen so that the averaged uid density was hr*i � 3.29 Thisensemble is sometimes called semi-Grand Canonical. Ourmodel is based on the assumption that when equilibrium isreached, the chemical potentials of the ions and polymers areequal to the solvent's chemical potential. This is an appro-priate model because the polymer adsorption process has beencompleted when the system reaches equilibrium and the ionsremain close to them due to Coulomb attraction. A schematicdiagram of the full simulation algorithm is shown in Fig. 1.Full details of this hybrid GCMC–DPD algorithm can be foundin ref. 25.
An exact expression for the effective force exerted by auniform and homogeneous surface made up of DPD beads incontact with a DPD uid is used here, to model colloidalparticles on which polyelectrolytes can be adsorbed. It wasderived21 by calculating the interaction between an innitesurface, made up of a uniform distribution of DPD beads, andfree uid DPD particles in the semi-innite space in the
Soft Matter, 2013, 9, 3777–3788 | 3779

Fig. 1 Sketch of the full hybrid GCMC–DPD algorithm used for all our simula-tions. See text for details.
Soft Matter Paper
z-direction. The effective force that the DPD wall exerts on theuid particle (i) is exactly given by:
Fwi ðzÞ ¼ aw
"1� 6
�z
Rc
�2
þ 8
�z
Rc
�3
�3
�z
Rc
�4#: (10)
In the equation above, aw ¼ 112
aijprwRc3, with aij being the
strength of the DPD conservative interaction between a particlein the uid and a surface particle (see eqn (3)), rw being thedensity of the wall, and the force vanishes for distances z > Rc.Additionally, polymers are modeled as linear chains formed byDPD beads joined by freely rotating, harmonic springs witha spring constant K0 ¼ 100.0 and an equilibrium positionr0 ¼ 0.7,30 as shown in the following equation:
F springij ¼ �K0(rij � r0)eij. (11)
The interaction potential from which the wall force in eqn(10) above derives, and the harmonic spring energy for poly-mers, must be included when calculating energy differencesbetween MC congurations, be it under NVT or mVT conditions.The electrostatic contribution to the energy must also beincluded, which is introduced as follows.
IV Electrostatics for confined DPD fluids
Electrostatic interactions have been introduced into the DPDmodel using two different approaches. One consists of distrib-uting charges on a lattice and then solving the Poisson–Boltz-mann equation;31 the other,32 which we use here, is by means ofthe standard Ewald method,33 adapted for DPD using chargedistributions with spherical symmetry and a Slater-type, radial
3780 | Soft Matter, 2013, 9, 3777–3788
exponential decay with decay length l, instead of point charges.This charge distribution is adopted because the so-coreinteraction of the DPD beads allows the collapse of pointcharges and the subsequent formation of articial ionic pairs.Following ref. 34 and 35, the charge distribution used here isgiven by:
rðrÞ ¼ q
pl3e�
2rl : (12)
The dimensionless force between two charge distributions isgiven by two contributions,35 one in real space (F E,R
ij ), plus one inFourier space (F E,K
i ):
FE;Rij ¼ L
4pZiZj
�2p
Vexp
�� a2rij
2þ erfc
arij
��
� �1� exp
�brij� 1þ 2brij
1þ brij
��� rijrij3
;(13)
FE;Ki ¼ L
4pZi
(2p
V
XNks0
QðkÞk� Im½expð�ik$riÞSðkÞ�); (14)
where L ¼ e2/(kBT303rRc), with e being the electron charge, 30 isthe permittivity of vacuum, 3r ¼ 78.3 is the water relativedielectric permittivity at room temperature; b ¼ Rc/l, and Zi isthe valence of the charge distribution; k h 2p(kx/Lx, ky/Ly, kz/Lz)is the reciprocal vector of magnitude k, such that kx, ky, and kz
are integers. QðkÞ ¼ exp�� k2
4a2
��k2 , and S(k) is the so-called
structure factor.33 The term erfc(x) is the complementary errorfunction; a is the parameter that modulates the contributionof the sum in real space (not to be confused with the ioni-zation degree). V ¼ LxLyLz is the volume of the simulation box.Here, Im denotes the imaginary part of the complexnumber.
The forces given by eqn (13) and (14) are appropriate for thecalculation of the long-range electrostatic interactions of ahomogeneous, unconned system (which we shall call Ewald-3D), but as they stand, they cannot be used for connedsystems, which are the subject of this work. The reason for thisrelies on the fact that the Fourier transformation involved ineqn (14) cannot be performed straightforwardly if the systemlacks 3D periodicity. However, Yeh and Berkowitz36 haveproposed a computationally inexpensive modication so thatthey can be applied to inhomogeneous systems (called hereaerEwald-3D_C). In this method, a z-component force is added toeach charged bead:
F i;Z ¼ �Lqi
VMZ; (15)
whereMZ is the net dipole moment of the simulation cell, whichis given by
MZ ¼XNi¼1
qizi ; (16)
such dipole moment must be removed out of the simulation cellfor each charge qi.
The importance of including the force shown in eqn (15) canbe ascertained from Fig. 2, where the z-component of the force
This journal is ª The Royal Society of Chemistry 2013

Fig. 2 Schematic view of the basic simulation cell (in red), where a charge qwasplaced at z ¼ 0 (filled blue circle) while an opposite charge �q (filled green circle)was placed at z, with z ranging from 0 up to Lz/2. There are periodic boundaryconditions on the xy-plane, which means there are image cells (dashed blacklines) on the z ¼ 0 and z ¼ z planes, each with a periodic image charge (emptyblue and green circles). These charges form planar charged sheets. A forceappears between these sheets, F(z), which is the parallel plate capacitor force, F(z)¼ �q2/(230LxLy), and does not depend on z. See text for details.
Paper Soft Matter
acting on a charged DPD bead located at (0,0,0) by anotheroppositely charged bead xed at (0,0,z), is shown. As Yeh andBerkowitz have argued,36 because of the periodicity in the xy-plane, the electric eld that acts on the particle with charge q (atthe z¼ 0 plane) in Fig. 2 due to the other (�q, at the z¼ z plane)can be considered as due to the eld produced by a uniformlycharged sheet, i.e., E ¼ q/(230LxLy). Therefore the force hascomponents Fx ¼ 0, Fy ¼ 0, and Fz ¼ F(z) ¼ �q2/(230LxLy), justlike a parallel plate capacitor; notice in particular that F(z) doesnot change when z increases, in contrast to the force betweentwo point charges in systems with 3-dimensional symmetry.
Fig. 3 Comparison of the z component of the electrostatic force acting on 2 DPDbeads with opposite charge distributions, with one located at (0, 0, z) and theother at (0, 0, 0) in a system periodic in the xy-plane, calculated using 2 differentEwald methods, and for 2 different box sizes (see Fig. 2). The sides of the simu-lation box on the xy-plane are equal, i.e., Lx ¼ Ly, with Lz given as indicated in thelegend. The position z ¼ z*Rc, with Rc ¼ 6.46 A, see text for details. The solidsquares (when Lz ¼ 3Lx) and solid triangles (for Lz ¼ 5Lx) correspond to the use ofthe Ewald sums for systems with 3-dimensional symmetry (“no confined corr.”),and lead to incorrect values of the force as z / N. Solid diamonds (for Lz ¼ 3Lx)and solid stars (for Lz ¼ 5Lx) represent the force calculated using the 3-dimen-sional Ewald sums with the addition of eqn (15) to account for the confinement(“with confined corr.”). The lines are only guides to the eye.
This journal is ª The Royal Society of Chemistry 2013
We have calculated the electrostatic force between the twocharge distributions shown in Fig. 2, using both Ewald-3D andEwald-3D_C methods, and the results are shown in Fig. 3 fortwo simulation box sizes, for both methods. When we per-formed the calculation of the force for the 2 charges shown ina basic simulation cell in Fig. 2 using the Ewald sums for asystem with 3-dimensional symmetry, we obtained a force thatdecayed with increasing z. This is the incorrect limitingbehavior and it arises from the addition of an articial dipolemoment (see eqn (16)) that appears from the periodicboundary conditions in the z-axis. When one applies periodicboundary conditions in the x and y directions only, to accountfor the walls placed in the z-axis, and the contribution of thedipole moment given by eqn (15) is removed from the force, weobtain the correct limiting behavior of the force for increasingz, as seen in Fig. 3.
One can easily notice that when the full Ewald-3D sumsare used without the proper correction to account for theconnement (solid squares and triangles in Fig. 3), anincorrect limiting behavior for the force as the distance zgrows is obtained, since the force tends to 0. By contrast,when the correction for connement (eqn (15)) is included, asshown for the (small) solid diamond and (larger) solid starsimulation boxes in Fig. 3, the force between the chargesheets has the correct limiting behavior as the distanceseparating the sheets, z, grows. Another feature, which isintrinsic to the charge distribution model used here, is the“hump” that appears in the forces shown in Fig. 3 atdistances less than 20 A. It arises from the spatial depen-dence of the electrostatic force between 2 charge distributionsof the type shown in eqn (12), see ref. 32. It has been shown36
that the Ewald-3D_C method, which we adopt here, leads toresults that are almost identical to the exact 2-dimensional,and computationally much more expensive, version of theEwald sums.37 We have shown, for the rst time, that thesame result is obtained for interactions between chargedistributions, rather than point charges. Only the 3-dimen-sional method with correction for conned systems (Ewald-3D_C) shall be used in the rest of this work.
V Surface charge distribution model
Many colloidal particles as well as biological membranes havesurface charges that need to be taken into account explicitly,because this is an additional variable that can be used experi-mentally to tune up properties. In keeping with the mesoscopicDPD approach we introduce here a surface charge distribution,taking as a starting point the effective electrostatic force arisingfrom point charges on a uniform, planar TiO2 surface inter-acting with point charges in the uid.38 The effective electro-static force between the TiO2 wall and the uid's particle i isgiven by
FEWi ðzÞ ¼ qi
30
rOXaz2
z(17)
where qi is the electric charge of uid particle i, rOX is the chargedensity of the oxygen atoms on the wall, and az is the
Soft Matter, 2013, 9, 3777–3788 | 3781

Soft Matter Paper
z-component of the ~a vector (~a is the bond vector from the Tiatom to each O atom in the TiO2 molecule). Eqn (17) is the forcefor point particles, not distributions of charge. Now, if onemodels the charge density of the oxygen atoms by a chargedistribution of the Slater type, which is similar to eqn (12), onethen writes:
rOXðzÞ ¼qOX
pl3e�
2zl ; (18)
where qOX is the charge of the oxygen atom. The surface chargedensity is obtained from eqn (18) and it is given by sOX ¼ (qOX/2pl2)[1 � exp(�2Rc/l)]. The electrostatic interaction potentialbetween a uid particle and the bead on the wall, in dimen-sionless units, is:
UEWi (z) ¼ �LkZie
�2bzln(z), (19)
therefore, for a charge distribution on the surface and a chargedDPD uid particle, the electrostatic force is
FEWi ðzÞ ¼ LkZie
� 2zl
�1
z� 2blnðzÞ
�; (20)
where L and b were dened before (see text following eqn (14))and
k ¼ az2Zox
pl3(21)
Here, Zi is the valence of the uid particle i, Zox¼�1.15 (valenceof the two oxygen atoms in the TiO2 molecule), and az ¼ 1.27A ¼ 0.197Rc.
The total force Fi acting on bead i is the sum of the DPDforces (eqn (3)–(5)), the force due to the DPD surface (eqn (10)),the spring force between beads in a polyelectrolyte (eqn (10)),the forces related to the electrostatic interactions (eqn (13)–(15)) and the force that takes into account the charge distri-bution on the surface (eqn (20)). Therefore, eqn (1) can berewritten as:
_vi ¼ Fi ¼Xjsi
F Cij þ FD
ij þ FRij þ F spring
ij þ FE;Rij
þ Fwi ðzÞ þ FE;K
i þ FEWi þ F i;Z:
(22)
This is the equation that is integrated to obtain the particles'positions and velocities at every time step in the dynamics partof the GCMC–DPD algorithm. Additionally, every time theMetropolis algorithm is applied (in the NVT and mVT ensem-bles), the full conservative energy is used, that is, the one thatincludes the DPD potential energy, the harmonic potential, theelectrostatic potential energy with its connement correction,and the surface charge potential.
VI Systems studied and simulation details
We carried out 3 types of simulation studies: adsorption ofcationic polyelectrolytes on neutral and negatively chargedsurfaces, and adsorption of anionic polyelectrolytes on nega-tively charged surfaces, as a function of the degree of ionization(which is related to the pH value). Full surface force isothermsof the cationic polyelectrolytes conned by two negatively
3782 | Soft Matter, 2013, 9, 3777–3788
charged surfaces are also obtained as a function of ionizationdegree. Dimensionless units are used throughout this work,except where indicated otherwise. When calculating adsorptionisotherms, the volume of the simulation box was xed with Lx ¼5, Ly ¼ 5, Lz ¼ 10, and periodic boundary conditions were used,except in the z-direction since this is the direction of theconnement.
For the calculation of the surface force isotherms we xedthe polyelectrolyte saturation concentration obtained from theadsorption isotherms, and performed simulations at varyingseparation between the surfaces, in the z-direction (keeping thetransversal area equal to that used in the calculation ofadsorption isotherms). Under these conditions, all poly-electrolyte molecules are adsorbed, and the counterions remainclose to them at equilibrium. Therefore, only the solvent'schemical potential was set, and calculated also as a check onself-consistency, using the Widom insertion method.33 Thechemical potential was xed at m* ¼ 37.7, which gives a totalaverage density of hr*i z 3. The simulation results wereobtained aer at least 100 blocks, of 104 MC congurationseach, with the rst 30 blocks used to equilibrate the system. Ineach given block made up of 104 MC congurations, thepercentage of successful MC moves was around (35 � 2)%. Thetime step was dt* ¼ 0.03 for the DPD part, where the DPD beadswere moved using the velocity Verlet algorithm.39 The parame-ters that dene the dissipative and random force intensities areg ¼ 4.5 and s ¼ 3.0, so that kBT* ¼ 1. The conservative forceintensities were chosen as aij ¼ 78.0, when i ¼ j, and aij ¼ 79.3,when i s j, where i and j represent types of uid molecules(solvent, polymer or counterion). With this choice of parame-ters, the polyelectrolytes are in a nearly athermal solvent.Additionally, aw ¼ 120.0 for the solvent–wall non-electrostaticinteraction, and aw ¼ 100.0 for all the other molecular species–wall interactions. If the parameter aw were to be chosen equalfor solvent particles, as well as for polyelectrolytes and ions, allof these particles would be equally likely to adsorb. Our choicesof wall–particle interactions necessarily lead to adsorption ofpolyelectrolytes and ions on the surfaces, since one does notneed attractive interactions for adsorption to occur, only lessrepulsive interactions with respect to the interaction of the wallwith the particles that do not adsorb, in our case, the solvent.25
The solvent and the counterions are modeled as simplemonomeric particles. All polyelectrolytes are linear moleculesmade up of 7 DPD beads freely joined by harmonic springs.Only up to four of those seven beads were allowed to haveelectrical charge (chosen in alternating order) and the remain-ing ones were maintained neutral in the simulations; this ishow the ionization degree was xed. The center of mass of thecharged distribution was xed at the center of mass of thepolyelectrolyte bead. These conditions limit the electricalcharge as occurs for weak polyelectrolytes. The parameters forthe Ewald sums were a ¼ 0.11 A�1 and the maximum vectorkmax ¼ (6,6,6). The values of b ¼ 0.929, l¼ 6.95 A and L ¼ 13.87were used, as in ref. 32. We take |qOX| ¼ 1.15e, and with theabove choice of parameters, the surface charge density when thewalls are charged is sOX z 60 mC m�2. Lengths were normal-ized with Rc ¼ 6.46 A, which is the value that corresponds to the
This journal is ª The Royal Society of Chemistry 2013

Paper Soft Matter
coarse graining degree of 3 water molecules in one DPD bead.29
This length is also the maximum range of the interparticleforces (see eqn (3)–(5)) and the non-electrostatic wall force (seeeqn (10)).
Fig. 4 Segment density profiles of 24 anionic polyelectrolytes on negativelycharged surfaces for a1 (D), a2 (,) and a3 (B). For this type of polyelectrolyte, wehave a1 < a2 < a3 and pH1 < pH2 < pH3. Due to symmetry, only the density profilesclose to the left wall are shown, and the solvent and counterions density profilesare omitted, for clarity. The inset shows the counterions density profiles for thesame ionization degrees, using the same symbols as in the main figure.
VII Results and discussion
The purpose of these simulations is to predict adsorptionisotherms of weak polyelectrolytes onto neutral surfaces andonto oppositely and likely charged surfaces upon change in thedegree of ionization. We also want to obtain surface forceisotherms of polyelectrolytes adsorbed on oppositely chargedsurfaces as a function of the ionization degree of the solution.The inuence of the interparticle conservative interaction (aij,see eqn (3)) and that of the model used for the effectiveconning walls (see eqn (10)) on the characteristics of theadsorption and disjoining pressure isotherms (the latter relatedto surface force isotherms) have been studied in detail in aprevious work.25
The polyelectrolyte concentration (G) at the surface as afunction of the polymer concentration in the bulk (not adsor-bed) in equilibrium was calculated from the density prole r(z)through eqn (23):
G ¼ð½rðzÞ � rb�dz; (23)
where rb is the polyelectrolyte density in the bulk and theintegral is performed over all the coordinate z (Lz ¼ 10 in all thecases). The polyelectrolyte bulk density, rb, was obtained foreach polyelectrolyte concentration simulated from the corre-sponding density prole obtained at the particular poly-electrolyte concentration, r(z), taking rb as the average valuereached when the perturbations of the walls on the poly-electrolyte prole were negligible,25 i.e., at the center of thesimulation box, see Fig. 4. Then, eqn (23) is applied. This is alsothe procedure followed experimentally to obtain adsorptionisotherms. These isotherms were t to the Langmuir model,given by:
G ¼ GmaxKCb
1þ KCb
; (24)
where Cb is the concentration of polymer in the bulk (notadsorbed), Gmax is the maximum polyelectrolyte adsorption,and K is the equilibrium constant of the Langmuir model.40 InFig. 4 we show the density proles obtained for one of thesystems we study in this work, namely the adsorption of anionicpolyelectrolytes on negatively charged surfaces, at 3 differentdegrees of ionization. Only the density proles near the lesurface are shown for simplicity, since they are symmetricalwith respect to the right surface. The adsorbed polyelectrolytesform layers that appear as maxima in Fig. 4, while the nonadsorbed polyelectrolytes constitute a featureless bulk (rb),represented by the constant region of the density prole (for z*larger than about 3 in Fig. 4). Comparison of the polyelectrolytedensity proles with those of the counterions (see the inset ofFig. 4) shows that when the polyelectrolyte adsorption ismaximum (for example, rst peak for a1, open triangles in main
This journal is ª The Royal Society of Chemistry 2013
Fig. 4), the counterions adsorption is minimum (open trianglesin the inset). This indicates there is competition between themfor the adsorption sites.
In these simulations, we have modeled positively chargedpolyelectrolytes onto neutral and negatively charged surfaces,and negatively charged polyelectrolytes onto a negativelycharged surface. Clearly, the relationship between the chaindegree of ionization (a) and the pH value is opposite for anionicand cationic polyelectrolytes: a decreases (increases) with pHfor cationic (anionic) polyelectrolytes. To compare our predic-tions with experiments, we relate the degree of ionization of thepolyelectrolytes with their pH using an extension of Henderson–Hasselbalch equation for polyelectrolytes.41 In this approach,the pH of the solution is related to the chain degree of ioniza-tion (a) by:
pH ¼ pKaHlog10
� a
1� a
(25)
where the negative sign is used for cationic polyelectrolytes, andthe positive sign for anionic ones, and pKa is the apparent ionicconstant, with pH ¼ pKa when a ¼ 0.5. Once the charge on eachbead of the polyelectrolyte is chosen, the pH variation is eval-uated using eqn (25).
Eqn (25) is commonly used to calculate the dissociation ofweak anionic polyelectrolytes in solution.41 In the present work,we use eqn (25) to obtain themain functional dependence of thedegree of ionization with the pH value for both cationic andanionic polyelectrolytes; but it must be stressed that the degreeof ionization is equal to the degree of dissociation only for theanionic polyelectrolytes. For polyelectrolytes near a surface, eqn(25) should be improved so that it takes into account at least twoeffects: the pKa dependence on both a and the polyelectrolytemolecular weight N,41 and the variation of a near a charged
Soft Matter, 2013, 9, 3777–3788 | 3783

Soft Matter Paper
surface.11 For negative polyelectrolytes, the pKa value is shiedto high pH values as a function of a; scaling arguments give anapproximation for this contribution, which is DpK ¼ pKa � pK0
� a1/3(ln N)2/3, with pK0 the intrinsic pKa of a monomer.42 Theshi is not signicant at low degree of ionization and smallmolecular weight, which are the conditions of the presentsimulations. Additionally, the variation of a for the poly-electrolyte near a charged surface has been calculated in ref. 11.This effect is more important for the polyelectrolyte segmentsadsorbed on the surface, and a is greater (smaller) for adsorbedpolyelectrolyte segments than for polyelectrolytes in solution atlow (high) pH values, indicating a prolongation in the titrationcurve that extends the dependence of the negative poly-electrolytes, adsorbed on the charged surface, at low and highpH values. Neutral surfaces only produce a pKa shi to high pHvalues. Therefore, in regard to the simulations presented here,these effects do not modify the main trends obtained from eqn(25) when applied to polyelectrolytes adsorbed on a surface.Similar trends are expected for cationic polyelectrolytes but withthe opposite pH dependence.
The results are then presented in terms of 3 pH values,namely pH1, pH2, and pH3, which correspond to degrees ofionization of a1 ¼ 0.14, a2 ¼ 0.29, and a3 ¼ 0.57, respectively.According to eqn (25), as the degree of ionization (a) increases,the pH decreases for cationic polyelectrolytes, and it increasesfor anionic polyelectrolytes. Thus, pH1 > pH2 > pH3 for cationicpolyelectrolytes and pH1 < pH2 < pH3 for anionic ones. Note thatthe pKa value is between pH2 and pH3 for both types ofpolyelectrolytes.
The adsorption isotherms of the cationic polyelectrolytesand negative counterions on a neutral surface are shown inFig. 5. The only interaction between the surfaces and the poly-mers is through Fwi (z), given by eqn (10), but the adsorption iseffectively inuenced by the degree of ionization. The greater
Fig. 5 Adsorption isotherms of cationic polyelectrolytes on neutral surfaces fora1 (:), a2 (-), and a3 (C). As described in the text, a1 < a2 < a3, which corre-spond to pH1 > pH2 > pH3 in this case. The adsorption isotherms of the coun-terions are shown in the inset. The bars represent the statistical uncertainty. Thecontinuous lines represent the data fitting to the Langmuir model, eqn (24).
3784 | Soft Matter, 2013, 9, 3777–3788
the ionization, the lower the polyelectrolyte adsorption, orequivalently: the cationic polyelectrolyte adsorption increasesas the pH is increased (recall that pH1 > pH2 > pH3, in this case).Indeed, it is not inuenced by the fact that the pKa is betweenpH2 and pH3. As observed in the inset of Fig. 5, the counterionsadsorption follows a behavior just opposite to the poly-electrolyte adsorption; it increases with decreasing pH.Evidently, both phenomena are related. As the polyelectrolyte isdissociated the counterions are preferentially adsorbed onto theneutral surface, thereby preventing the polyelectrolyte adsorp-tion. Good agreement is found between our simulations andLangmuir's model, as indicated in Fig. 5 by the lines. The sametrends are observed experimentally in the adsorption of poly-ethylenimine (PEI), a positively charged polyelectrolyte, on aneutral surface (graphite) at different pH values (3, 6, and 11)characterized with atomic force microscopy (AFM).43 At pH ¼ 3,PEI is highly charged and shows a low adsorption, which thenincreases at pH¼ 6, and even more at pH ¼ 11, thus adsorptionis increased with pH. Therefore, there is agreement betweenthese experimental results and our predictions in Fig. 5.
The adsorption isotherms of cationic polyelectrolytes (andthose of the negative counterions), when the surfaces arenegatively charged, are shown in Fig. 6. In this case, the elec-trostatic attraction between the wall and the polyelectrolytes isgiven by eqn (20), and the repulsive DPD interaction betweenthe walls and the uid particles, including the polyelectrolytes,is given by eqn (10). The competition between these forces givesrise to the isotherms in Fig. 6, which follow the same trendswith pH as those of the neutral wall, namely the cationic poly-electrolyte adsorption increases when the pH increases and thedegree of ionization decreases, although the adsorption on thecharged surfaces is slightly higher than in the neutral wallscase, at pH2 and pH3. As expected, the adsorption of
Fig. 6 Adsorption isotherms of cationic polyelectrolytes on negatively chargedsurfaces for a1 (:), a2 (-) and a3 (C). As in the previous figure, a1 < a2 < a3 withpH1 > pH2 > pH3. The adsorption isotherms of the counterions are shown in theinset. The bars represent the statistical uncertainty. The continuous lines representthe data fitting to the Langmuir model, eqn (24).
This journal is ª The Royal Society of Chemistry 2013

Paper Soft Matter
counterions on the negatively charged wall increases with theirconcentration. As in Fig. 5, the polyelectrolytes and the coun-terions are evidently in competition with each other for theadsorption sites on the surfaces. A comparison with experi-mental results is difficult because most works report experi-ments performed under conditions different from those of thesimulations. However, our simulations can be compared withthe adsorption of negative polyelectrolytes on a positivelycharged surface, i.e., with polyelectrolytes adsorbed ontooppositely charged surfaces, as in Fig. 6. One can compare theisotherms in Fig. 6 with the adsorption of weak anionic poly-electrolytes on a positively charged surface whose charge isindependent of pH,10 as is the case in our present work. In ref.10 the experimental adsorption was found to decrease while thedegree of ionization of anionic polyelectrolytes increased. Thoseadsorption isotherms follow the same trends as the resultspresented in Fig. 6, since the predicted polyelectrolyte adsorp-tion decreases also with the increase in the degree of ionization.Thus, the adsorption isotherms shown in Fig. 6 reproduce verywell the experimental results.10
Let us now consider the case when walls and polyelectrolyteshave the same kind of electrostatic charge. The adsorptionisotherms of the negative polyelectrolytes (and the positivecounterions) on negatively charged surfaces are shown in Fig. 7,and these isotherms follow the same trends as those of the 2preceding gures when they are interpreted in terms of thedegree of ionization. That is because the relationship betweenthe degree of ionization and pH is given by the positive sign ineqn (25), namely, pH1 < pH2 < pH3 when a1 < a2 < a3. Therefore,as Fig. 7 shows, anionic polyelectrolyte adsorption decreases asthe pH is increased, while the counterions adsorption increaseswith the pH. Hence, the adsorption isotherms in Fig. 7 repre-sent the same behavior as that seen in Fig. 5 and 6, when thedegree of ionization of polyelectrolytes is considered, namely
Fig. 7 Adsorption isotherms of anionic polyelectrolytes on negatively chargedsurfaces for a1 (D), a2 (,) and a3 (B). In this case pH1 < pH2 < pH3, and as before,a1 < a2 < a3. The adsorption isotherms of the positive counterions are shown inthe inset. The statistical uncertainty is smaller than the symbols size. The contin-uous lines represent the data fitting to Langmuir's model, eqn (24).
This journal is ª The Royal Society of Chemistry 2013
the greater the ionization, the lower the polyelectrolyteadsorption, independent of the nature of the polyelectrolyte.
As the pH is increased the degree of ionization of the nega-tive polyelectrolyte is greater, and the presence of positivecounterions rises as well. Thus, the adsorption of the negativepolyelectrolyte on the negative wall is reduced as the pH isincreased, while the adsorption of the positive ions is favored.However, the latter is not enough to induce a surface chargeinversion that may favor the adsorption of the likely chargedpolyelectrolyte. The results shown in Fig. 7 are then what wouldbe expected for these systems. Others have pointed out also therelevance of the counterions in the adsorption phenomenon.For example, the role of the ions and counterions has beenevidenced in the adsorption of spherical macro-ions on chargedwalls.44 These authors have shown that the combination ofsteric and electrostatic effects of ions, counterions and macro-ions may produce adsorption on neutral, or on oppositely andlikely charged surfaces, as seen in our simulations. The densityproles of the monomers that make up the polyelectrolytes forthe systems studied in Fig. 5–7 conrm the arguments givenabove, as seen in Fig. 8.
The density proles in Fig. 8 show that although theadsorption on the surfaces is quite similar for the systemsstudied in Fig. 5–7, some differences remain. The mostimportant feature is the height of the rst maximum in Fig. 8,which corresponds to the density of the rst layer of adsorbedpolyelectrolytes. The largest adsorption occurs when the systemis composed of positively charged (cationic) polyelectrolytesconned by negatively charged surfaces (solid circles, dottedline in Fig. 8). It is followed by the adsorption of cationicpolyelectrolytes on neutral walls (solid squares, solid line), andthe smallest adsorption maximum corresponds to the
Fig. 8 Segment density profiles for cationic polyelectrolytes on neutral walls(solid line, squares), cationic polyelectrolytes on negatively charged walls (dashedline, solid circles), and anionic polyelectrolytes on negatively charged walls(dotted line, solid triangles), all at pH3. There are 16 polyelectrolyte molecules ineach case, which is equivalent to a concentration of 1.4 monomers per nm3. Onlythe structure of the density profiles close to the left wall is shown, and the solventand counterions density profiles are omitted, for clarity. The density profiles onthe right wall are completely symmetric with respect to those of the left onetherefore they are omitted also. The error bars are smaller than the symbols size.
Soft Matter, 2013, 9, 3777–3788 | 3785
Soft Matter Paper
negatively charged polyelectrolytes on negatively chargedsurfaces (dashed line in Fig. 8). The trend shown by the heightof the rst maximum in the density proles shown in Fig. 8indicates that there are a few more monomers of the cationicpolyelectrolyte on the negatively charged wall because of theirelectrostatic attraction, while there are less of the anionic oneprecisely because of their Coulomb repulsion for the wall.However, it appears that electrostatic interactions cannot besolely responsible for the adsorption isotherms shown in theprevious gures, since even when the surfaces are electricallyneutral one sees a considerable adsorption of (cationic) poly-electrolytes in Fig. 8. We stress here that even in the absence ofelectrostatic interactions, if the neutral wall–polymer param-eter, aw (see eqn (10)), is less repulsive than it is between thewall and the solvent, then polymer adsorption will be favored.
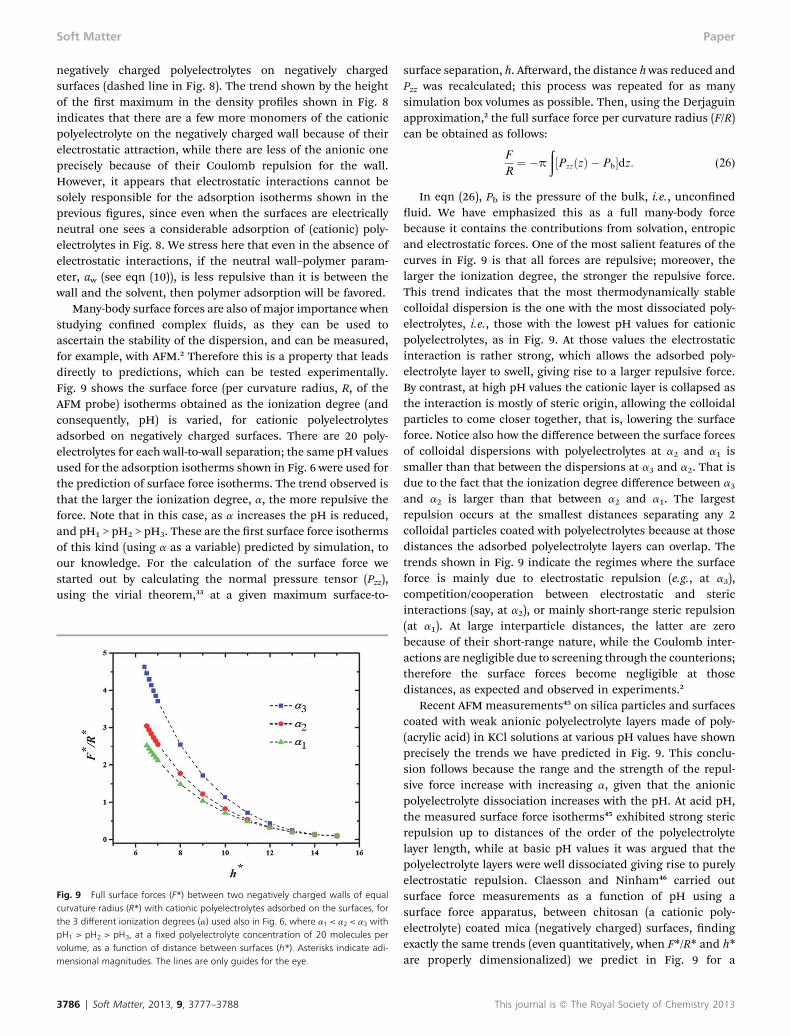
Many-body surface forces are also of major importance whenstudying conned complex uids, as they can be used toascertain the stability of the dispersion, and can be measured,for example, with AFM.2 Therefore this is a property that leadsdirectly to predictions, which can be tested experimentally.Fig. 9 shows the surface force (per curvature radius, R, of theAFM probe) isotherms obtained as the ionization degree (andconsequently, pH) is varied, for cationic polyelectrolytesadsorbed on negatively charged surfaces. There are 20 poly-electrolytes for each wall-to-wall separation; the same pH valuesused for the adsorption isotherms shown in Fig. 6 were used forthe prediction of surface force isotherms. The trend observed isthat the larger the ionization degree, a, the more repulsive theforce. Note that in this case, as a increases the pH is reduced,and pH1 > pH2 > pH3. These are the rst surface force isothermsof this kind (using a as a variable) predicted by simulation, toour knowledge. For the calculation of the surface force westarted out by calculating the normal pressure tensor (Pzz),using the virial theorem,33 at a given maximum surface-to-
Fig. 9 Full surface forces (F*) between two negatively charged walls of equalcurvature radius (R*) with cationic polyelectrolytes adsorbed on the surfaces, forthe 3 different ionization degrees (a) used also in Fig. 6, where a1 < a2 < a3 withpH1 > pH2 > pH3, at a fixed polyelectrolyte concentration of 20 molecules pervolume, as a function of distance between surfaces (h*). Asterisks indicate adi-mensional magnitudes. The lines are only guides for the eye.
3786 | Soft Matter, 2013, 9, 3777–3788
surface separation, h. Aerward, the distance hwas reduced andPzz was recalculated; this process was repeated for as manysimulation box volumes as possible. Then, using the Derjaguinapproximation,2 the full surface force per curvature radius (F/R)can be obtained as follows:
F
R¼ �p
ð½PzzðzÞ � Pb�dz: (26)
In eqn (26), Pb is the pressure of the bulk, i.e., unconneduid. We have emphasized this as a full many-body forcebecause it contains the contributions from solvation, entropicand electrostatic forces. One of the most salient features of thecurves in Fig. 9 is that all forces are repulsive; moreover, thelarger the ionization degree, the stronger the repulsive force.This trend indicates that the most thermodynamically stablecolloidal dispersion is the one with the most dissociated poly-electrolytes, i.e., those with the lowest pH values for cationicpolyelectrolytes, as in Fig. 9. At those values the electrostaticinteraction is rather strong, which allows the adsorbed poly-electrolyte layer to swell, giving rise to a larger repulsive force.By contrast, at high pH values the cationic layer is collapsed asthe interaction is mostly of steric origin, allowing the colloidalparticles to come closer together, that is, lowering the surfaceforce. Notice also how the difference between the surface forcesof colloidal dispersions with polyelectrolytes at a2 and a1 issmaller than that between the dispersions at a3 and a2. That isdue to the fact that the ionization degree difference between a3
and a2 is larger than that between a2 and a1. The largestrepulsion occurs at the smallest distances separating any 2colloidal particles coated with polyelectrolytes because at thosedistances the adsorbed polyelectrolyte layers can overlap. Thetrends shown in Fig. 9 indicate the regimes where the surfaceforce is mainly due to electrostatic repulsion (e.g., at a3),competition/cooperation between electrostatic and stericinteractions (say, at a2), or mainly short-range steric repulsion(at a1). At large interparticle distances, the latter are zerobecause of their short-range nature, while the Coulomb inter-actions are negligible due to screening through the counterions;therefore the surface forces become negligible at thosedistances, as expected and observed in experiments.2
Recent AFM measurements45 on silica particles and surfacescoated with weak anionic polyelectrolyte layers made of poly-(acrylic acid) in KCl solutions at various pH values have shownprecisely the trends we have predicted in Fig. 9. This conclu-sion follows because the range and the strength of the repul-sive force increase with increasing a, given that the anionicpolyelectrolyte dissociation increases with the pH. At acid pH,the measured surface force isotherms45 exhibited strong stericrepulsion up to distances of the order of the polyelectrolytelayer length, while at basic pH values it was argued that thepolyelectrolyte layers were well dissociated giving rise to purelyelectrostatic repulsion. Claesson and Ninham46 carried outsurface force measurements as a function of pH using asurface force apparatus, between chitosan (a cationic poly-electrolyte) coated mica (negatively charged) surfaces, ndingexactly the same trends (even quantitatively, when F*/R* and h*are properly dimensionalized) we predict in Fig. 9 for a
This journal is ª The Royal Society of Chemistry 2013

Paper Soft Matter
qualitatively similar system. These authors46 found that theirresults could be explained assuming the chitosan layers adopta at conformation on the mica surfaces, which is preciselyhow our model polyelectrolytes adsorb. In this sense it shouldbe stressed that our polyelectrolytes are “surface modifying”polyelectrolytes, rather than brushes, but the interplay of thesegment–segment and segment–surface interactions is thesame for both types.47,48
At this point it is instructive to recall that polyelectrolytelayers are usually added to colloidal particles to impart themwith appropriate characteristics so that the particle dispersionwill remain stable. It is then of notice that although the largestadsorption was obtained for polyelectrolytes at the smallestionization degree (or largest pH, which is pH1, solid triangles inFig. 6), such adsorption does not necessarily translate into themost stable dispersion, as observed in Fig. 9, where the lowestsurface force curve is obtained for the largest pH (a1). It may bepossible to obtain larger surface forces, i.e., better colloidalstability, with thinner polyelectrolyte layers adsorbed on thecolloidal particles because the repulsive interactions (be they ofsteric or of electrostatic origin) act more effectively if theappropriate electrochemical environment (namely, the pH) isprovided.
VIII Conclusions
Adsorption and surface force isotherms of polyelectrolytesadsorbed on charged and neutral surfaces were obtained usinga mesoscopic, short-range interaction model in MC simulationsat xed chemical potential, volume and temperature. Theresults showed that the ionization degree of the polyelectrolyte,and therefore its pH, is a key factor when it comes to deter-mining its adsorption characteristics. We predict the sametrends in the adsorption isotherms for anionic and for cationicpolyelectrolytes in athermal solvents, when adsorbed on nega-tively charged surfaces as a function of their degree of ioniza-tion. The main trend is that the lower the polyelectrolyteionization degree, the greater the adsorption, independently ofthe nature of the polyelectrolyte (positive or negative). Ourresults indicate that a general trend in the adsorption of poly-electrolytes on charged or neutral surfaces exists, which issupported by experimental trends taken from the recent liter-ature. The role of the counterions in the process of adsorption isalso evident and follows an opposite behavior to that of thepolyelectrolytes, namely that at high (low) polyelectrolyteadsorption, the counterion adsorption is low (high). This indi-cates there is competition for the adsorption sites, a phenom-enon that has scarcely been considered. Additionally, we haveshown that the largest adsorption of a polyelectrolyte does notnecessarily translate into the best stability of a colloidalsuspension as obtained from surface force proles, and arguethat this is due to the range of the interactions. Electrostaticinteractions do not appear to be the sole driving force in theprocess of adsorption, but rather there exists a complexcompetition of screening and steric effects. On the other hand,electrostatics plays a major role in increasing the surface force,when the ionization degree is increased. DPD has proved to be
This journal is ª The Royal Society of Chemistry 2013
useful when complemented with appropriately adaptedCoulomb interactions not only among polymers, but on theconning surfaces also. This work should be of interest tospecialists in stimuli-responsive materials and workers in theso matter community, among others.
Acknowledgements
This work was sponsored partly by the Centro de Investigacionen Polımeros (Grupo COMEX). AGG acknowledges support ofPROMEP through Project 47310286-912025. The authors aregrateful to M. A. Balderas Altamirano and F. Zaldo for usefuldiscussions, to IPICyT for granting us use of the computationalfacilities, and to Red Tematica Materia Condensada Blanda –
CONACyT.
References
1 S. Farrokhpay, J. Colloid Interface Sci., 2009, 151, 24.2 J. N. Israelachvili, Intermolecular and Surfaces Forces,Academic Press, New York, 2nd edn, 1992.
3 M. A. Cohen Stuart, et al., Nat. Mater., 2010, 9, 101.4 M. Madel, Polyelectrolytes, in Encyclopedia of Polymer Scienceand Engineering, Wiley-Interscience, 1986.
5 E. Raphael and J.-F. Joanny, Europhys. Lett., 1990, 13, 623.6 J. Leimbach and H. Rupprecht, Colloid Polym. Sci., 1993, 271,307.
7 S. Farrokhpay, G. E. Morris, D. Fornasiero and P. Self, J.Colloid Interface Sci., 2004, 274, 33.
8 Y. Hirata, J. Kamikakimoto, A. Nishimoto and Y. Ishihara, J.Ceram. Soc. Jpn., 1992, 100, 7.
9 G. E. Morris, D. Fornasiero and J. Ralston, Int. J. Miner.Process., 2002, 67, 211.
10 J. Blaakmeer, M. R. Bohmer, M. A. Cohen Stuart andG. J. Fleer, Macromolecules, 1990, 23, 2301.
11 M. R. Bohmer, O. A. Evers and J. M. H. M. Scheutjens,Macromolecules, 1990, 23, 2288.
12 I. Borukhov, D. Andelman and H. Orland, Macromolecules,1998, 31, 1665.
13 A. V. Dobrynin, A. Deshkovski and M. Rubinstein,Macromolecules, 2001, 34, 3421.
14 A. Laguecir and S. Stoll, Polymer, 2005, 46, 1359.15 R. Messina, Phys. Rev. E: Stat., Nonlinear, So Matter Phys.,
2004, 70, 051802.16 F. Carnal and S. Stoll, J. Phys. Chem. B, 2011, 115, 12007.17 Y. S. Velichko and M. Olvera de la Cruz, Phys. Rev. E: Stat.,
Nonlinear, So Matter Phys., 2005, 72, 041920.18 R. Chang and A. Yethiraj, Macromolecules, 2006, 39, 821.19 P. J. Hoogerbrugge and J. M. V. A. Koelman, Europhys. Lett.,
1992, 19, 155.20 D. M. Heyes, M. Barber and J. H. R. Clarke, J. Chem. Soc.,
Faraday Trans. 2, 1977, 73, 1485.21 A. Gama Goicochea and F. Alarcon, J. Chem. Phys., 2011, 134,
014703.22 P. Espa~nol and P. Warren, Europhys. Lett., 1995, 30, 191.23 S. Roy, D. Markova, A. Kumar, M. Klapper and F. Muller-
Plathe, Macromolecules, 2009, 42, 841.
Soft Matter, 2013, 9, 3777–3788 | 3787

Soft Matter Paper
24 P. Prinsen, P. B. Warren and M. A. J. Michels, Phys. Rev. Lett.,2002, 89, 148302.
25 A. Gama Goicochea, Langmuir, 2007, 23, 11656.26 J. K. Brennan and M. Lisal, Mol. Simul., 2009, 35, 766.27 D. Frenkel and B. Smit, Understanding Molecular Simulation,
Academic, New York, 2002.28 F. Goujon, P. Malfreyt and D. J. Tildesley, ChemPhysChem,
2004, 5, 457.29 R. D. Groot and P. B. Warren, J. Chem. Phys., 1997, 107, 4423.30 A. Gama Goicochea, M. Romero-Bastida and R. Lopez-
Rendon, Mol. Phys., 2007, 105, 2375.31 R. D. Groot, J. Chem. Phys., 2003, 118, 11265.32 M. Gonzalez-Melchor, E. Mayoral, M. E. Velazquez and
J. Alejandre, J. Chem. Phys., 2006, 125, 224107.33 M. P. Allen and D. J. Tildesley, Computer Simulation of
Liquids, Oxford University, New York, 1987.34 M. Carrillo-Tripp, H. Saint-Martin and I. Ortega-Blake, J.
Chem. Phys., 2003, 118, 7062.35 C. Ibergay, P. Malfreyt and D. J. Tildesley, J. Chem. Theory
Comput., 2009, 5, 3245.36 I. C. Yeh andM. L. Berkowitz, J. Chem. Phys., 1999, 111, 3155.
3788 | Soft Matter, 2013, 9, 3777–3788
37 E. Spohr, J. Chem. Phys., 1997, 107, 6342.38 H. Dominguez, A. Gama Goicochea, N. Mendoza and
J. Alejandre, J. Colloid Interface Sci., 2006, 297, 370.39 I. Vattulainen, M. Karttunen, G. Besold and J. M. Polson, J.
Chem. Phys., 2002, 116, 3967.40 D. J. Shaw, Introduction to Colloid and Surface Chemistry,
Butterworth Heinemann Ltd, Oxford, UK, 4th edn, 1992.41 A. Laguecir, S. Ulrich, J. Labille, N. Fatin-Rouge, S. Stoll and
J. Buffle, Eur. Polym. J., 2006, 42, 1135.42 M. Ullner, B. Jonsson and P.-O. Widmark, J. Chem. Phys.,
1994, 100, 3365.43 M. Schneider, M. Brinkmann and H. Molhwald,
Macromolecules, 2003, 36, 9510.44 F. Jimenez and M. Lozada-Cassou, J. Phys. Chem. B, 2004,
108, 7286.45 A. Dreschsler, A. Synytska, P. Uhlmann, M. M. Elmahdy,
M. Stamm and F. Kremer, Langmuir, 2010, 26, 6400.46 P. M. Claesson and B. W. Ninham, Langmuir, 1992, 8,
1406.47 P. Pincus, Macromolecules, 1991, 24, 2912.48 C. Seidel, Macromolecules, 2003, 36, 2536.
This journal is ª The Royal Society of Chemistry 2013