Polyelectrolyte−Surfactant Layers: Adsorption of Preformed Aggregates versus Adsorption of...
10
Polyelectrolyte-Surfactant Layers: Adsorption of Preformed Aggregates versus Adsorption of Surfactant to Preadsorbed Polyelectrolyte Andra Dedinaite, Per M. Claesson,* and Magnus Bergstro ¨m Department of Chemistry, Surface Chemistry, Royal Institute of Technology, SE-100 44 Stockholm, Sweden, and Institute for Surface Chemistry, P. O. Box 5607, SE-114 86 Stockholm, Sweden Received August 26, 1999. In Final Form: February 4, 2000 The character of adsorbed layers containing both polyelectrolyte and surfactant depends on the type of polyelectrolyte used and the surfactant concentrations, as demonstrated by several recent studies. However, the layer properties also depend on the experimental pathway. This shows that the adsorbed layers can be trapped in quasi-equilibrium states and that the true equilibrium is reached only after experimentally inaccessible time scales. This has to be kept in mind when comparing different results reported in the literature. The present article highlights these effects using a system consisting of a highly charged cationic polyelectrolyte, poly{(propionyloxy)ethyl}trimethylammonium chloride (PCMA), and an anionic surfactant, sodium dodecyl sulfate (SDS). The adsorbed layer properties were determined using mainly surface force measurements and atomic force microscope (AFM) imaging. We also present some small-angle neutron scattering data for bulk PCMA-SDS complexes formed between the polyelectrolyte and the surfactant. They demonstrate the presence of a characteristic correlation length of about 37-39 Å. A similar characteristic length scale is also observed in some of the adsorbed layers, both employing the AFM and the surface force apparatus. It may be interpreted as the distance between surfactant loaded polyelectrolyte chains. Introduction Polyelectrolyte-surfactant aggregates adsorbed at solid-liquid interfaces are often trapped in nonequilib- rium states. This is an important issue in many processes utilizing combinations of surfactant and polyelectrolyte. One example of a common application is the use of polyelectrolyte and surfactant mixtures in hair-care products, including shampoos. 1 It is straightforward that, in such applications, the relevant time scale is in the range from seconds to minutes and during this short time no equilibrium state is reached. Several experimental studies have been devoted to polyelectrolyte-surfactant interactions at interfaces. For example, Shubin et al. 2,3 investigated how the structure of cationic hydrophobically modified cellulose adsorbed on negatively charged surfaces, mica and silica, was affected by anionic, cationic, and nonionic surfactants. Later, Claesson et al., 4 Fielden et al., 5 and Kjellin et al. 6 studied interactions between acrylamide based cationic polyelectrolytes of various charge densities (100, 30, and 10%, respectively) adsorbed on negatively charged mica surfaces and how the layer properties changed when an anionic surfactant, sodium dodecyl sulfate (SDS), was added to the solution. Anthony et al. 7 explored the interactions between mica surfaces coated with cationic guar in water and SDS solutions. The systems in these investigations were at equilibrium, or at least aimed to be so. The research on adsorption from polyelectrolyte- surfactant mixtures is a comparatively recent effort, 8 and many aspects, particularly nonequilibrium phenomena, are not very well understood. Pagac et al. studied adsorption and coadsorption of cationic surfactant with cationic polyelectrolytes and found that the effect of the surfactant on the polyelectrolyte adsorption was very sensitive to the order in which the surfactant and the polyelectrolyte were exposed to the surface. Different pathways to the same final bulk solution composition produced significantly different adsorption results. 9 Simi- lar conclusions were reached by Neivandt et al. 10 who studied coadsorption of cethyltrimethylammonium bro- mide and poly(styrenesulfonate) on silica. Recently, Dedinaite et al. 11 studied how the interactions between negatively charged mica surfaces were affected by adsorption of polyelectrolyte-surfactant aggregates formed in bulk solution. They used a cationic polyelec- trolyte and an anionic surfactant. The charge of the aggregates could be varied from being highly positive to highly negative by changing the surfactant concentration. Some nonequilibrium aspects in these systems were noted. For instance, the slow spreading of positively charged polyelectrolyte-surfactant aggregates on negatively charged surfaces was briefly discussed. It was also noticed that the order of adding polyelectrolytes and surfactants affects the properties of the adsorbed layers. In this article, we present a more detailed investigation of these non- equilibrium phenomena. We compare the properties of (1) Reich, C. In Hair Cleansers, 2nd ed.; Reich, C., Ed.; Dekker: New York, Basel, Hong Kong, 1997; Vol. 68. (2) Shubin, V. Langmuir 1994, 10, 1093. (3) Shubin, V.; Petrov, P.; Lindman, B. Colloid Polym. Sci. 1994, 272, 1590. (4) Claesson, P. M.; Dedinaite, A.; Blomberg, E.; Sergeyev, V. G. Ber. Bunsen-Ges. Phys. Chem. 1996, 100, 1008. (5) Fielden, M. L.; Claesson, P. M.; Schillen, K. Langmuir 1998, 14, 5366. (6) Kjellin, U. R. M.; Claesson, P. M.; Audebert, R. J. Colloid Interface Sci. 1997, 190, 476. (7) Anthony, O.; Marques, C. M.; Richetti, P. Langmuir 1998, 14, 6086. (8) Furst, E. M.; Pagac, E. S.; Tilton, R. D. Ind. Eng. Chem. Res. 1996, 35, 1566. (9) Pagac, E. S.; Prieve, D. C.; Tilton, R. D. Langmuir 1998, 14, 2333. (10) Neivandt, D. J.; Gee, M. L.; Tripp, C. P.; Hair, M. L. Langmuir 1997, 13, 2519. (11) Dedinaite, A.; Claesson, P. M. Langmuir 2000, 16, 1951. 5257 Langmuir 2000, 16, 5257-5266 10.1021/la9911537 CCC: $19.00 © 2000 American Chemical Society Published on Web 05/10/2000
-
Upload
independent -
Category
Documents
-
view
1 -
download
0
Transcript of Polyelectrolyte−Surfactant Layers: Adsorption of Preformed Aggregates versus Adsorption of...
Polyelectrolyte-Surfactant Layers: Adsorption ofPreformed Aggregates versus Adsorption of Surfactant to
Preadsorbed Polyelectrolyte
Andra Dedinaite, Per M. Claesson,* and Magnus Bergstrom
Department of Chemistry, Surface Chemistry, Royal Institute of Technology,SE-100 44 Stockholm, Sweden, and Institute for Surface Chemistry, P. O. Box 5607,
SE-114 86 Stockholm, Sweden
Received August 26, 1999. In Final Form: February 4, 2000
The character of adsorbed layers containing both polyelectrolyte and surfactant depends on the typeof polyelectrolyte used and the surfactant concentrations, as demonstrated by several recent studies.However, the layer properties also depend on the experimental pathway. This shows that the adsorbedlayers can be trapped in quasi-equilibrium states and that the true equilibrium is reached only afterexperimentally inaccessible time scales. This has to be kept in mind when comparing different resultsreported in the literature. The present article highlights these effects using a system consisting of a highlycharged cationic polyelectrolyte, poly{(propionyloxy)ethyl}trimethylammonium chloride (PCMA), and ananionic surfactant, sodium dodecyl sulfate (SDS). The adsorbed layer properties were determined usingmainly surface force measurements and atomic force microscope (AFM) imaging. We also present somesmall-angle neutron scattering data for bulk PCMA-SDS complexes formed between the polyelectrolyteand the surfactant. They demonstrate the presence of a characteristic correlation length of about 37-39Å. A similar characteristic length scale is also observed in some of the adsorbed layers, both employingthe AFM and the surface force apparatus. It may be interpreted as the distance between surfactant loadedpolyelectrolyte chains.
Introduction
Polyelectrolyte-surfactant aggregates adsorbed atsolid-liquid interfaces are often trapped in nonequilib-rium states. This is an important issue in many processesutilizing combinations of surfactant and polyelectrolyte.One example of a common application is the use ofpolyelectrolyte and surfactant mixtures in hair-careproducts, including shampoos.1 It is straightforward that,in such applications, the relevant time scale is in the rangefrom seconds to minutes and during this short time noequilibrium state is reached.
Several experimental studies have been devoted topolyelectrolyte-surfactant interactions at interfaces. Forexample, Shubin et al.2,3 investigated how the structureof cationic hydrophobically modified cellulose adsorbedon negatively charged surfaces, mica and silica, wasaffected by anionic, cationic, and nonionic surfactants.Later, Claesson et al.,4 Fielden et al.,5 and Kjellin et al.6studied interactions between acrylamide based cationicpolyelectrolytes of various charge densities (100, 30, and10%, respectively) adsorbed on negatively charged micasurfaces and how the layer properties changed when ananionic surfactant, sodium dodecyl sulfate (SDS), wasadded to the solution. Anthony et al.7 explored theinteractions between mica surfaces coated with cationic
guar in water and SDS solutions. The systems in theseinvestigations were at equilibrium, or at least aimed tobe so. The research on adsorption from polyelectrolyte-surfactant mixtures is a comparatively recent effort,8 andmany aspects, particularly nonequilibrium phenomena,are not very well understood. Pagac et al. studiedadsorption and coadsorption of cationic surfactant withcationic polyelectrolytes and found that the effect of thesurfactant on the polyelectrolyte adsorption was verysensitive to the order in which the surfactant and thepolyelectrolyte were exposed to the surface. Differentpathways to the same final bulk solution compositionproduced significantly different adsorption results.9 Simi-lar conclusions were reached by Neivandt et al.10 whostudied coadsorption of cethyltrimethylammonium bro-mide and poly(styrenesulfonate) on silica.
Recently, Dedinaite et al.11 studied how the interactionsbetween negatively charged mica surfaces were affectedby adsorption of polyelectrolyte-surfactant aggregatesformed in bulk solution. They used a cationic polyelec-trolyte and an anionic surfactant. The charge of theaggregates could be varied from being highly positive tohighly negative by changing the surfactant concentration.Some nonequilibrium aspects in these systems were noted.For instance, the slow spreading of positively chargedpolyelectrolyte-surfactant aggregates on negativelycharged surfaces was briefly discussed. It was also noticedthat the order of adding polyelectrolytes and surfactantsaffects the properties of the adsorbed layers. In this article,we present a more detailed investigation of these non-equilibrium phenomena. We compare the properties of
(1) Reich, C. In Hair Cleansers, 2nd ed.; Reich, C., Ed.; Dekker: NewYork, Basel, Hong Kong, 1997; Vol. 68.
(2) Shubin, V. Langmuir 1994, 10, 1093.(3) Shubin, V.; Petrov, P.; Lindman, B. Colloid Polym. Sci. 1994,
272, 1590.(4) Claesson, P. M.; Dedinaite, A.; Blomberg, E.; Sergeyev, V. G. Ber.
Bunsen-Ges. Phys. Chem. 1996, 100, 1008.(5) Fielden, M. L.; Claesson, P. M.; Schillen, K. Langmuir 1998, 14,
5366.(6) Kjellin, U. R. M.; Claesson, P. M.; Audebert, R. J. Colloid Interface
Sci. 1997, 190, 476.(7) Anthony, O.; Marques, C. M.; Richetti, P. Langmuir 1998, 14,
6086.
(8) Furst, E. M.; Pagac, E. S.; Tilton, R. D. Ind. Eng. Chem. Res.1996, 35, 1566.
(9) Pagac, E. S.; Prieve, D. C.; Tilton, R. D. Langmuir 1998, 14, 2333.(10) Neivandt, D. J.; Gee, M. L.; Tripp, C. P.; Hair, M. L. Langmuir
1997, 13, 2519.(11) Dedinaite, A.; Claesson, P. M. Langmuir 2000, 16, 1951.
5257Langmuir 2000, 16, 5257-5266
10.1021/la9911537 CCC: $19.00 © 2000 American Chemical SocietyPublished on Web 05/10/2000

adsorbed polyelectrolyte-surfactant aggregates at identi-cal bulk solution compositions, but we vary the experi-mental paths leading to the given bulk concentration. Theresults obtained are strikingly different, which highlightsthe fact that equilibrium is reached extremely slowly inpolyelectrolyte-surfactant systems. This has to be keptin mind when comparing scientific results reported in theliterature as well as when aiming at improving techno-logical processes.
Experimental SectionMaterials. The polyelectrolyte used in this study was poly-
{(propionyloxy)ethyl}trimethylammonium chloride, PCMA, witha molecular weight of 1.6 × 10⁶ g/mol. Each monomeric segmentof the polyelectrolyte carries one positive charge as shown inFigure 1. The polyelectrolyte was synthesized and kindly providedfor us by the Laboratoire de Physico-Chimie Macromoleculaire,Universite Pierre et Marie Curie, Paris. The surfactant, sodiumdodecyl sulfate (SDS), especially pure grade for biochemical work(>99%), was purchased from BDH and used as received.Potassium bromide, KBr (Merck, pro analysi) was roasted at500 °C overnight before use. The water was purified using aMillipore Milli-RO plus system followed by a Milli-Q 185 system.In addition, before being used in the surface force apparatus(SFA), it was deaerated for at least 1 h using a water jet pump.Freshly cleaved muscovite mica (Reliance, New York) was usedas a substrate. Potassium ions located at the muscovite micasurface can easily be exchanged by other cations present in thesolution. This feature of the mica surface is of importance whenconsidering adsorption of cationic PCMA or PCMA-SDS ag-gregates.
Surface Forces. The forces acting between muscovite micasurfaces coated with polyelectrolyte or polyelectrolyte-surfactantaggregates were studied with a surface force apparatus, SFA,using Mark II12 and Mark IV13 models. The technique is describedin detail in ref 12. In brief, the forces are measured between twomacroscopic surfaces positioned in crossed cylinder geometry.One of the surfaces is attached to a double cantilever spring. Aforce acting between the two surfaces causes the spring to deflect.From the deflection, knowing the spring constant, the actingforce can be calculated. The surface separation is determinedinterferometrically. The interacting surfaces are transparent andsilvered on their backsides. White light is shone through thesurfaces and multiply reflected between the silver layers. As aconsequence of a constructive interference for certain wave-lengths, fringes of equal chromatic order (FECO) are createdand their wavelength can be measured in a spectrometer. Thedistance is determined by comparing the wavelengths of theFECO when the two surfaces are in contact and apart. The resultsof the surface force measurements are plotted as force normalizedby mean undeformed geometric radius, F/R, as a function ofsurface separation, D. The distance resolution is 2 Å. The F/Rdetection limit for our droplet experiments was about 5 × 10⁻⁵
N/m and for filled box experiments about 1 × 10⁻⁵ N/m. We notethat the force normalized by radius for the crossed cylindergeometry used in the experiments is related to the free energyof interaction per unit area (Gf) between flat surfaces (F/R )2πGf). This relation is valid when the radius of the surfaces (≈2cm) is much larger than the range of the measured forces andwhen the surfaces do not deform due to the action of the surface
forces. The pressure between flat surfaces can thus be calculatedfrom the slope of the measured force curve.
In this study we aimed at elucidating nonequilibrium aspectsof polyelectrolyte-surfactant aggregate adsorption. With thisin mind we used two experimental schemes (Figure 2), which ledto the same bulk solution composition but through different paths.The surface interactions were measured after each single step.Procedure I was as follows: First, the polyelectrolyte wasadsorbed on the mica surface from a 60 µL droplet containing 20ppm PCMA. Next, to remove the PCMA from the bulk solution,the measuring chamber was filled with ≈340 mL of a 1 × 10⁻⁴
M KBr solution, which means that PCMA was diluted ap-proximately 6000 times (PCMA bulk concentration ≈ 3 ppb). Inthe following step, SDS was injected to a bulk concentration of1 critical micelle concentration (cmc, 8.3 × 10⁻³ M). And finally,the SDS solution was drained out from the measuring chamber,and instead the chamber was again filled with a 1 × 10⁻⁴ M KBrsolution. To ascertain that SDS was removed from the bulksolution, the process of filling and draining pure 1 × 10⁻⁴ M KBrwas repeated several times. Procedure II included the followingsteps: First, the PCMA-SDS aggregates formed in bulk solutionwere adsorbed on the mica surface from a 60 µL droplet containinga mixture of 20 ppm PCMA and 1 cmc SDS. Next, PCMA wasdiluted 6000 times by filling the measuring chamber with a 1cmc SDS solution. And finally, the SDS solution was exchangedwith a 1 × 10⁻⁴ M KBr solution. We note that 1 × 10⁻⁴ M KBrwas present in all solutions used.
Atomic Force Microscope Imaging. The principals ofatomic force microscopy (AFM) has been described in detail byBinnig et al.14 In our study we used a Nanoscope III, DigitalInstruments, Santa Barbara, CA. In brief, a very sharp tip,
(12) Israelachvili, J. N.; Adams, G. E. J. Chem. Soc., Faraday Trans.1 1978, 74, 975.
(13) Parker, J. L.; Christenson, H. K.; Ninham, B. W. Rev. Sci.Instrum. 1989, 60, 3135.
Figure 1. Chemical structure of poly{2-(propionyloxy)ethyl}-trimethylammonium chloride, PCMA.
Figure 2. Schematic representation of the two experimentalprocedures used. Procedure I: Step 1, polyelectrolyte is adsorbedon the mica surface from a 60 µL droplet containing 20 ppmPCMA and 1 × 10⁻⁴ M KBr. Step 2, the droplet is dilutedapproximately 6000 times with a pure 1 × 10⁻⁴ M KBr solution.Step 3, SDS is added to a concentration of 8 × 10⁻³ M ) 1 cmcSDS. Step 4, the added SDS is exchanged with a pure 1 × 10⁻⁴
M KBr solution again. Procedure II: Step 1, polyelectrolyte (20ppm) and surfactant (1 cmc) are first mixed in 1 × 10⁻⁴ M KBrbulk solution, and then the mixture is allowed to adsorb on themica surface from a 60 µL droplet. Step 2, the droplet is dilutedapproximately 6000 times with a 1 cmc SDS and 1 × 10⁻⁴ MKBr solution. Step 3, this solution is exchanged with pure 1 ×10⁻⁴ M KBr.
5258 Langmuir, Vol. 16, No. 12, 2000 Dedinaite et al.
attached on a weak cantilever spring, is scanned across a surface.When no force is acting between the tip and the surface, thecantilever remains undeflected. When the tip and the surfaceare in close proximity to each other, a force acts on the tip, thusforcing the cantilever to deflect. A laser beam is shone on thebackside of the cantilever and reflected to a split photodiode thatis employed to detect the bending of the spring. The AFM imagesof polyelectrolytes or polyelectrolyte-surfactant aggregatesadsorbed on a mica surface were obtained in contact mode in theliquid using silicone ultralevers (Park Scientific, CA), which priorto use were exposed to ultraviolet light (about 9 mW cm-2 at253.7 nm) for 1-2 h. We used cantilevers with spring constantsof 0.12 ( 0.02 N/m. In the contact mode the tip is moved acrossthe surface in a raster pattern. At the same time the sampleheight is regulated in response to the force acting between thesample and the tip. With perfectly selected gains, the deflectionof the tip is kept constant and a true topographical height imageis obtained (ignoring tip broadening effects). We used a dualscreen mode and captured both height and deflection datasimultaneously. A height image maps the sample verticalposition, and a deflection image maps the tip deflection. Bothimages contain information about the surface features. Theadsorbed layers were imaged using a very weak force. The forceacting between the sample and the tip during imaging was dueto an electrostatic double-layer repulsion. Hence, there was nodirect contact between the tip and the sample, which minimizesthe risk of damaging the adsorbed layers while dragging the tipover the surface. The same imaging method has been used before.See, for example, ref 15. The images were obtained at a scanningspeed of 10 Hz. The fluid cell is made of glass and constructedso that it can be sealed with the help of a rubber ring positionedin a grove. Thus, a small liquid volume (0.1 mL) can be injectedinto the cell, and, if needed, the liquid can be easily exchanged.The adsorption of the PCMA or PCMA-SDS aggregates wasaccomplished simply by introducing an aqueous solution ofdesired composition into the fluid cell and allowing the tip andthe freshly cleaved substrate, mica, to equilibrate with thissolution for 30 min before imaging. AFM images were takenafter each step of procedure I, Figure 2.
Small-Angle Neutron Scattering. The SANS data wereobtained with the D11 instrument at Institut Max von Laue-Paul Langevin, ILL, Grenoble, France. The scattering curveswere obtained using three different settings, sample-to-detectordistances 1.25, 5.5, and 12 m, and a neutron wavelength of 8 Å,covering the Q range 7 × 10⁻⁴ to 0.22 Å-1. The samples contained1000 ppm PCMA and various amounts of deuterated SDS. Thesolvent used was either D2O, emphasizing the scattering fromPCMA, or a mixture of 80% H2O and 20% D2O, in which thepolyelectrolyte is contrast matched.
ResultsSurfactant Association with Preadsorbed Poly-
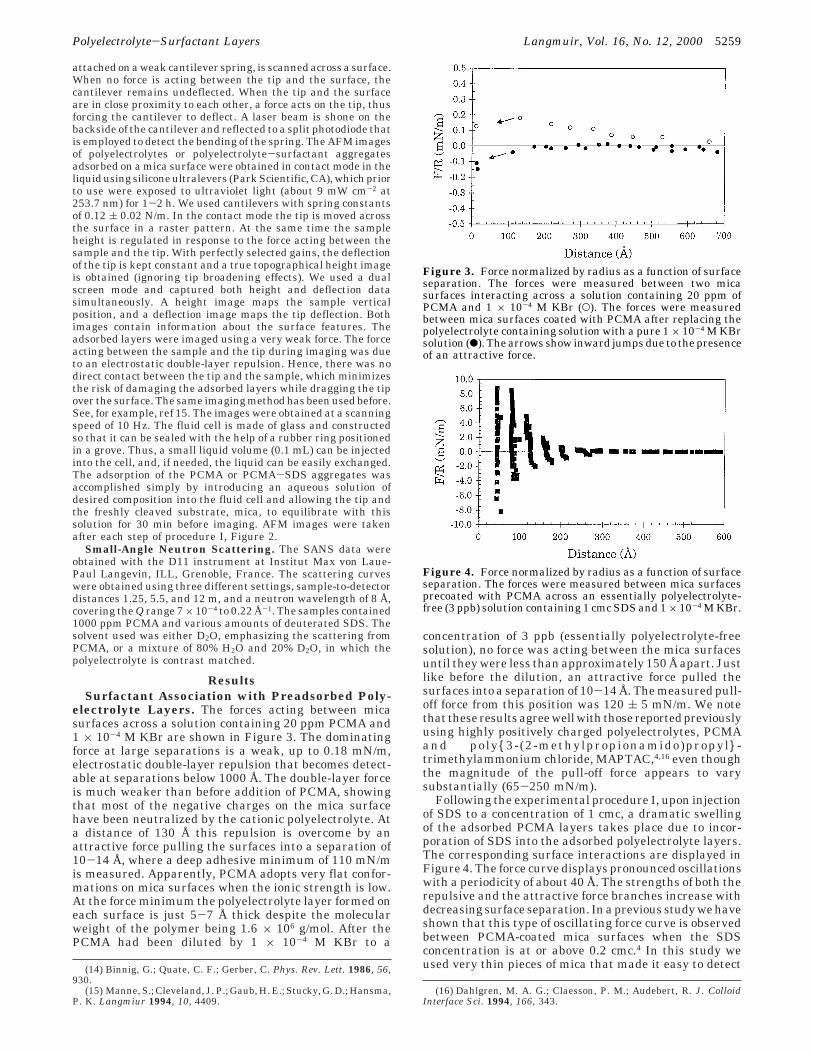
electrolyte Layers. The forces acting between micasurfaces across a solution containing 20 ppm PCMA and1 × 10-4 M KBr are shown in Figure 3. The dominatingforce at large separations is a weak, up to 0.18 mN/m,electrostatic double-layer repulsion that becomes detect-able at separations below 1000 Å. The double-layer forceis much weaker than before addition of PCMA, showingthat most of the negative charges on the mica surfacehave been neutralized by the cationic polyelectrolyte. Ata distance of 130 Å this repulsion is overcome by anattractive force pulling the surfaces into a separation of10-14 Å, where a deep adhesive minimum of 110 mN/mis measured. Apparently, PCMA adopts very flat confor-mations on mica surfaces when the ionic strength is low.At the force minimum the polyelectrolyte layer formed oneach surface is just 5-7 Å thick despite the molecularweight of the polymer being 1.6 × 10⁶ g/mol. After thePCMA had been diluted by 1 × 10⁻⁴ M KBr to a
concentration of 3 ppb (essentially polyelectrolyte-freesolution), no force was acting between the mica surfacesuntil they were less than approximately 150 Å apart. Justlike before the dilution, an attractive force pulled thesurfaces into a separation of 10-14 Å. The measured pull-off force from this position was 120 ( 5 mN/m. We notethat theseresultsagreewellwith thosereportedpreviouslyusing highly positively charged polyelectrolytes, PCMAand poly{3-(2-methylpropionamido)propyl} -trimethylammonium chloride, MAPTAC,4,16 even thoughthe magnitude of the pull-off force appears to varysubstantially (65-250 mN/m).
Following the experimental procedure I, upon injectionof SDS to a concentration of 1 cmc, a dramatic swellingof the adsorbed PCMA layers takes place due to incor-poration of SDS into the adsorbed polyelectrolyte layers.The corresponding surface interactions are displayed inFigure 4. The force curve displays pronounced oscillationswith a periodicity of about 40 Å. The strengths of both therepulsive and the attractive force branches increase withdecreasing surface separation. In a previous study we haveshown that this type of oscillating force curve is observedbetween PCMA-coated mica surfaces when the SDSconcentration is at or above 0.2 cmc.4 In this study weused very thin pieces of mica that made it easy to detect(14) Binnig, G.; Quate, C. F.; Gerber, C. Phys. Rev. Lett. 1986, 56,
930.(15) Manne, S.; Cleveland, J. P.; Gaub, H. E.; Stucky, G. D.; Hansma,
P. K. Langmiur 1994, 10, 4409.(16) Dahlgren, M. A. G.; Claesson, P. M.; Audebert, R. J. Colloid
Interface Sci. 1994, 166, 343.
Figure 3. Force normalized by radius as a function of surfaceseparation. The forces were measured between two micasurfaces interacting across a solution containing 20 ppm ofPCMA and 1 × 10⁻⁴ M KBr (O). The forces were measuredbetween mica surfaces coated with PCMA after replacing thepolyelectrolyte containing solution with a pure 1 × 10⁻⁴ M KBrsolution (b). The arrows show inward jumps due to the presenceof an attractive force.
Figure 4. Force normalized by radius as a function of surfaceseparation. The forces were measured between mica surfacesprecoated with PCMA across an essentially polyelectrolyte-free (3 ppb) solution containing 1 cmc SDS and 1 × 10⁻⁴ M KBr.
Polyelectrolyte-Surfactant Layers Langmuir, Vol. 16, No. 12, 2000 5259

even weak oscillations. This is most likely the reason weobserve more oscillations in the present study comparedto in the previous one (6 compared to 5).
The forces measured between a PCMA-coated micasurface and a silicon AFM tip across a 1 cmc SDS solutionare shown in Figure 5. The long-range force is dominatedby an electrostatic double-layer force that was put to usewhen imaging the layer (see below). Two distinct oscil-lations are observed in the force curve (Figure 5). Similarly,as observed using the SFA (Figure 4), the periodicity ofthese oscillations is about 40 Å. Hence, both techniquesmonitor essentially the same internal structure of theadsorbed layer.
Replacing the 1 cmc SDS solution by a 1 × 10⁻⁴ M KBrsolution results in a total disappearance of the oscillatingforce profile (Figure 6). Instead, the measured interactionsresemble those observed between the mica surfaces coatedwith PCMA across a 1 × 10⁻⁴ M KBr solution before SDSwas added. Hence, the effect of swelling the polyelectrolytelayer with SDS is to some extent reversible. However,some significant differences are observed. The finalseparation into which the surfaces are brought by thebridging attraction is 40 Å, i.e., 3-4 times larger thanbefore swelling the polyelectrolyte layer by SDS. Further,the pull-off force has decreased from 120 mN/m before
SDS addition to 14.5 ( 5 mN/m. It also appears that thelong-range surface interaction (at distances g 200 Å) nowis weakly repulsive.
Adsorption of Polyelectrolyte-Surfactant Ag-gregates Formed in Bulk Solution. We now considerthe case when polyelectrolyte and surfactant are mixedoutside the SFA to obtain a solution containing 20 ppmPCMA (1.03 × 10⁻⁴ M charged segments) and 1 cmc SDS(8.3 × 10⁻³ M). Thus there is a large excess of surfactantover polyelectrolyte segments. Such a solution is turbidbecause of the formation of large and negatively chargedpolyelectrolyte-surfactant aggregates.11 This solution wasplaced between the mica surfaces (procedure II, step 1),and the surface force curve was determined (Figure 7).The slope of the force measured at large distances (70-170 Å) is consistent with that of an electrical double-layerforce at the known ionic strength and equal to about 33Å. In the theoretical calculation of the Debye length wehave ignored the contribution of the polyelectrolyte to theionic strength. The reason is that the negatively chargedpolyelectrolyte-surfactant complexes will be depletedfrom the region between the surfaces and they do notcontribute to the screening of the double-layer force. Thisresult is consistent with previous observations of double-layer forces in systems containing highly charged spe-cies.17,18 At distances smaller than 70 Å, the slope of themeasured force is steeper than expected from double-layertheory and we conclude that a steric force contributionbecomes predominant (Figure 7). The same forces wereobserved on approach and on separation. It is clear thatsome polyelectrolyte-surfactant aggregates are adsorbedon the surface. We have argued previously that adsorptionof the negatively charged aggregates on the negativelycharged surface is accompanied by expulsion of some SDSfrom the aggregates.11
Next, the dilution of PCMA to a bulk concentration of3 ppb by filling the measuring chamber with a 1 cmc SDSsolution increases the range of measured force (Figure 8,unfilled symbols, and Figure 9). Now, the decay length ofthe long-range force (about 65 Å) is no longer consistentwith that of an electrical-double-layer force at the givenionic strength (33 Å). At shorter separations, 50 Å andless, the slope of the force becomes significantly steeper.Thus, it is not possible to desorb PCMA-SDS aggregatesattached to the mica surface by merely diluting the bulk
(17) Marra, J.; Hair, M. L. J. Colloid Interface Science 1989, 128,511.
(18) Claesson, P. M.; Ninham, B. Langmuir 1992, 8, 1406.
Figure 5. Force as a function of separation between an AFMsilicon tip and a mica surface precoated with PCMA (adsorbedfrom a 20 ppm solution) measured across a polyelectrolyte-free1 cmc SDS solution. The distance is measured relative to the“hard wall” defined by the constant compliance region reachedunder a high force. The thick line represents the force measuredon approach and the thin one the force measured on separation.The arrow indicates the force used when imaging the poly-electrolyte-surfactant layer.
Figure 6. Force normalized by radius as a function of surfaceseparation. Here we compare the forces measured acrossidentical bulk solutions (1 × 10⁻⁴ M KBr), but with differentsurface history. The forces acting between mica surfacesprecoated with PCMA before swelling the layer with SDS areshown (b) together with those measured after first swellingthe layer with a 1 cmc SDS solution and when exchanging theSDS solution with a pure 1 × 10⁻⁴ M KBr solution (O).
Figure 7. Force normalized by radius as a function of surfaceseparation. The forces measured between mica surfaces acrossa solution containing 20 ppm PCMA, 1 cmc SDS, and 1 × 10⁻⁴
M KBr. The line has a slope identical to that of an electrical-double-layer force at the present ionic strength.
5260 Langmuir, Vol. 16, No. 12, 2000 Dedinaite et al.
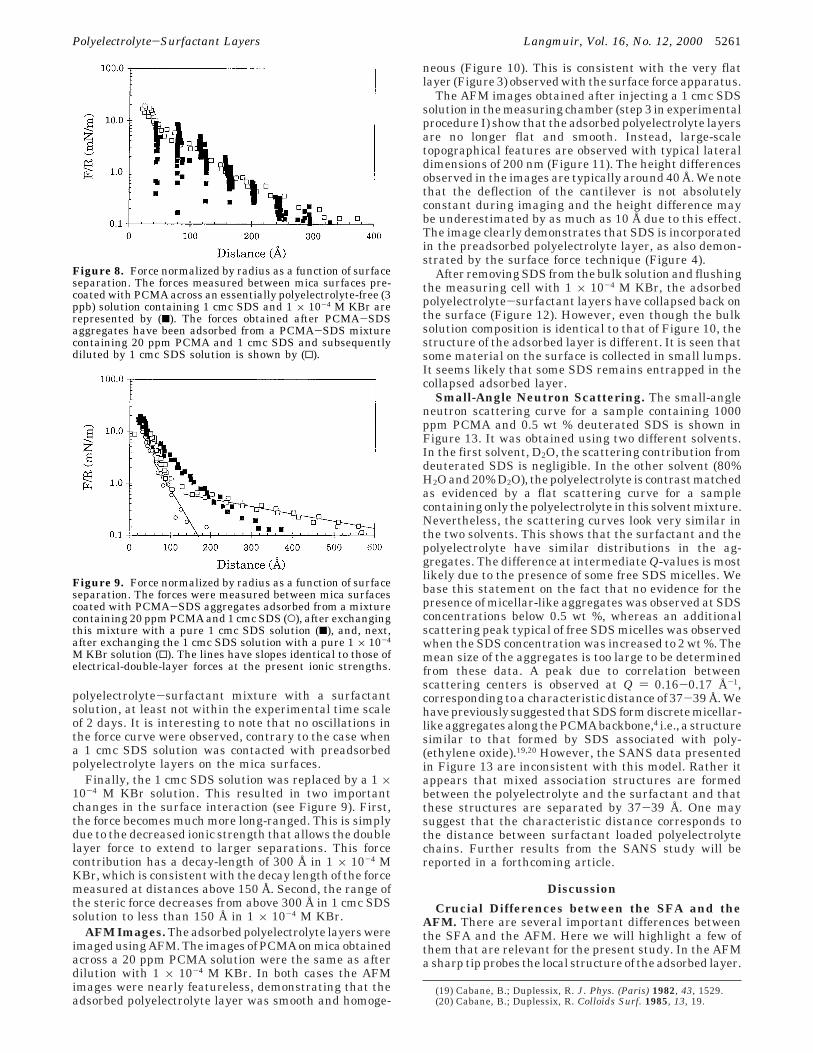
polyelectrolyte-surfactant mixture with a surfactantsolution, at least not within the experimental time scaleof 2 days. It is interesting to note that no oscillations inthe force curve were observed, contrary to the case whena 1 cmc SDS solution was contacted with preadsorbedpolyelectrolyte layers on the mica surfaces.
Finally, the 1 cmc SDS solution was replaced by a 1 ×10⁻⁴ M KBr solution. This resulted in two importantchanges in the surface interaction (see Figure 9). First,the force becomes much more long-ranged. This is simplydue to the decreased ionic strength that allows the doublelayer force to extend to larger separations. This forcecontribution has a decay-length of 300 Å in 1 × 10⁻⁴ MKBr, which is consistent with the decay length of the forcemeasured at distances above 150 Å. Second, the range ofthe steric force decreases from above 300 Å in 1 cmc SDSsolution to less than 150 Å in 1 × 10⁻⁴ M KBr.
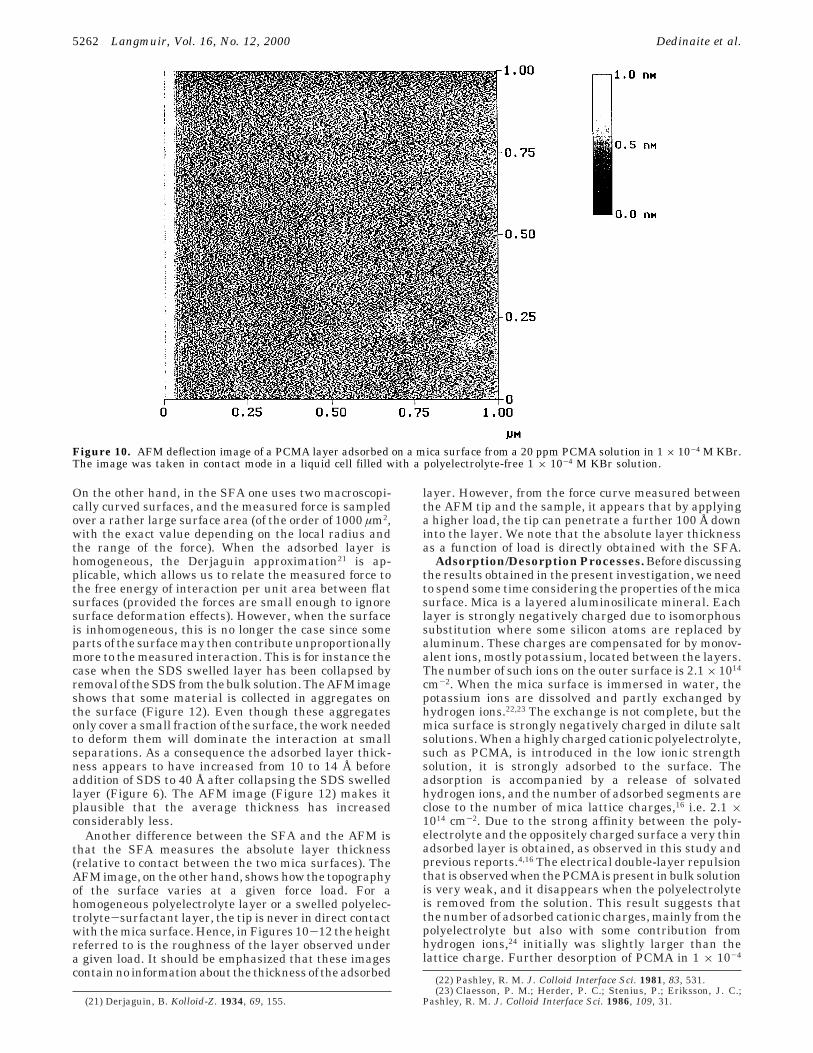
AFM Images. The adsorbed polyelectrolyte layers wereimaged using AFM. The images of PCMA on mica obtainedacross a 20 ppm PCMA solution were the same as afterdilution with 1 × 10⁻⁴ M KBr. In both cases the AFMimages were nearly featureless, demonstrating that theadsorbed polyelectrolyte layer was smooth and homoge-
neous (Figure 10). This is consistent with the very flatlayer (Figure 3) observed with the surface force apparatus.
The AFM images obtained after injecting a 1 cmc SDSsolution in the measuring chamber (step 3 in experimentalprocedure I) show that the adsorbed polyelectrolyte layersare no longer flat and smooth. Instead, large-scaletopographical features are observed with typical lateraldimensions of 200 nm (Figure 11). The height differencesobserved in the images are typically around 40 Å. We notethat the deflection of the cantilever is not absolutelyconstant during imaging and the height difference maybe underestimated by as much as 10 Å due to this effect.The image clearly demonstrates that SDS is incorporatedin the preadsorbed polyelectrolyte layer, as also demon-strated by the surface force technique (Figure 4).
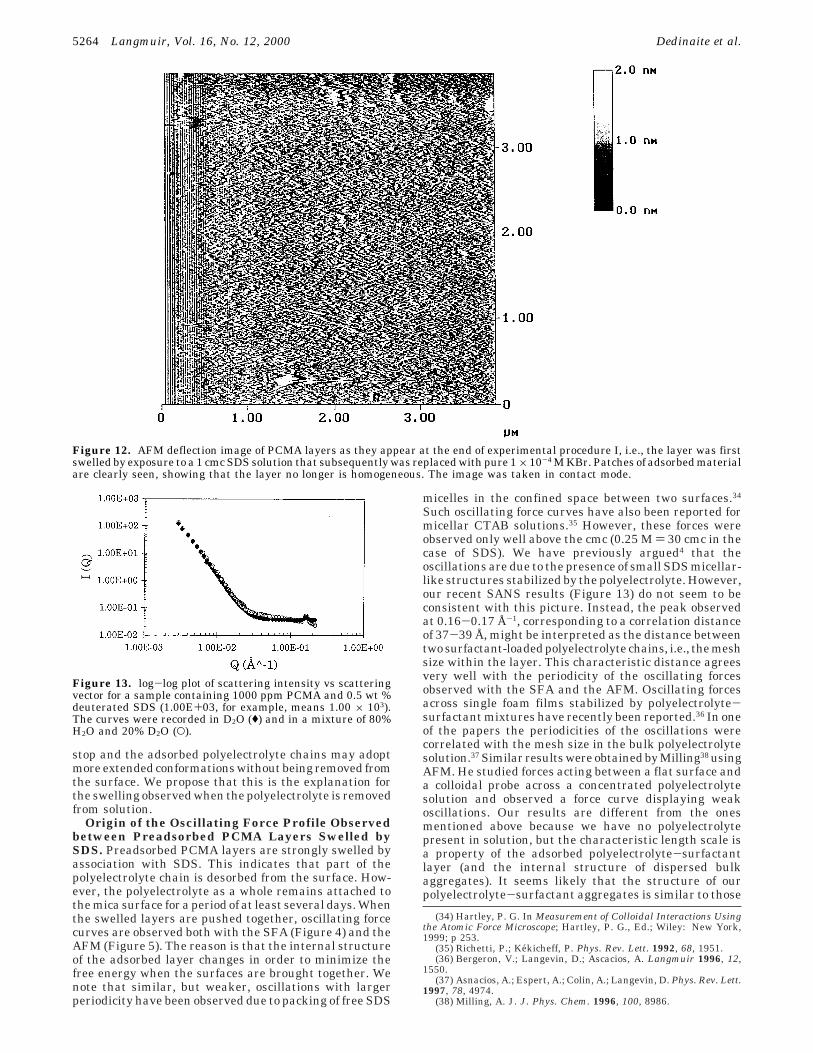
After removing SDS from the bulk solution and flushingthe measuring cell with 1 × 10⁻⁴ M KBr, the adsorbedpolyelectrolyte-surfactant layers have collapsed back onthe surface (Figure 12). However, even though the bulksolution composition is identical to that of Figure 10, thestructure of the adsorbed layer is different. It is seen thatsome material on the surface is collected in small lumps.It seems likely that some SDS remains entrapped in thecollapsed adsorbed layer.
Small-Angle Neutron Scattering. The small-angleneutron scattering curve for a sample containing 1000ppm PCMA and 0.5 wt % deuterated SDS is shown inFigure 13. It was obtained using two different solvents.In the first solvent, D2O, the scattering contribution fromdeuterated SDS is negligible. In the other solvent (80%H2O and 20% D2O), the polyelectrolyte is contrast matchedas evidenced by a flat scattering curve for a samplecontaining only the polyelectrolyte in this solvent mixture.Nevertheless, the scattering curves look very similar inthe two solvents. This shows that the surfactant and thepolyelectrolyte have similar distributions in the ag-gregates. The difference at intermediate Q-values is mostlikely due to the presence of some free SDS micelles. Webase this statement on the fact that no evidence for thepresence of micellar-like aggregates was observed at SDSconcentrations below 0.5 wt %, whereas an additionalscattering peak typical of free SDS micelles was observedwhen the SDS concentration was increased to 2 wt %. Themean size of the aggregates is too large to be determinedfrom these data. A peak due to correlation betweenscattering centers is observed at Q ) 0.16-0.17 Å-1,corresponding to a characteristic distance of 37-39 Å. Wehavepreviouslysuggested thatSDSformdiscretemicellar-like aggregates along the PCMA backbone,4 i.e., a structuresimilar to that formed by SDS associated with poly-(ethylene oxide).19,20 However, the SANS data presentedin Figure 13 are inconsistent with this model. Rather itappears that mixed association structures are formedbetween the polyelectrolyte and the surfactant and thatthese structures are separated by 37-39 Å. One maysuggest that the characteristic distance corresponds tothe distance between surfactant loaded polyelectrolytechains. Further results from the SANS study will bereported in a forthcoming article.
Discussion
Crucial Differences between the SFA and theAFM. There are several important differences betweenthe SFA and the AFM. Here we will highlight a few ofthem that are relevant for the present study. In the AFMa sharp tip probes the local structure of the adsorbed layer.
(19) Cabane, B.; Duplessix, R. J. Phys. (Paris) 1982, 43, 1529.(20) Cabane, B.; Duplessix, R. Colloids Surf. 1985, 13, 19.
Figure 8. Force normalized by radius as a function of surfaceseparation. The forces measured between mica surfaces pre-coated with PCMA across an essentially polyelectrolyte-free (3ppb) solution containing 1 cmc SDS and 1 × 10⁻⁴ M KBr arerepresented by (9). The forces obtained after PCMA-SDSaggregates have been adsorbed from a PCMA-SDS mixturecontaining 20 ppm PCMA and 1 cmc SDS and subsequentlydiluted by 1 cmc SDS solution is shown by (0).
Figure 9. Force normalized by radius as a function of surfaceseparation. The forces were measured between mica surfacescoated with PCMA-SDS aggregates adsorbed from a mixturecontaining 20 ppm PCMA and 1 cmc SDS (O), after exchangingthis mixture with a pure 1 cmc SDS solution (9), and, next,after exchanging the 1 cmc SDS solution with a pure 1 × 10⁻⁴
M KBr solution (0). The lines have slopes identical to those ofelectrical-double-layer forces at the present ionic strengths.
Polyelectrolyte-Surfactant Layers Langmuir, Vol. 16, No. 12, 2000 5261
On the other hand, in the SFA one uses two macroscopi-cally curved surfaces, and the measured force is sampledover a rather large surface area (of the order of 1000 µm2,with the exact value depending on the local radius andthe range of the force). When the adsorbed layer ishomogeneous, the Derjaguin approximation21 is ap-plicable, which allows us to relate the measured force tothe free energy of interaction per unit area between flatsurfaces (provided the forces are small enough to ignoresurface deformation effects). However, when the surfaceis inhomogeneous, this is no longer the case since someparts of the surface may then contribute unproportionallymore to the measured interaction. This is for instance thecase when the SDS swelled layer has been collapsed byremoval of the SDS from the bulk solution. The AFM imageshows that some material is collected in aggregates onthe surface (Figure 12). Even though these aggregatesonly cover a small fraction of the surface, the work neededto deform them will dominate the interaction at smallseparations. As a consequence the adsorbed layer thick-ness appears to have increased from 10 to 14 Å beforeaddition of SDS to 40 Å after collapsing the SDS swelledlayer (Figure 6). The AFM image (Figure 12) makes itplausible that the average thickness has increasedconsiderably less.
Another difference between the SFA and the AFM isthat the SFA measures the absolute layer thickness(relative to contact between the two mica surfaces). TheAFM image, on the other hand, shows how the topographyof the surface varies at a given force load. For ahomogeneous polyelectrolyte layer or a swelled polyelec-trolyte-surfactant layer, the tip is never in direct contactwith the mica surface. Hence, in Figures 10-12 the heightreferred to is the roughness of the layer observed undera given load. It should be emphasized that these imagescontain no information about the thickness of the adsorbed
layer. However, from the force curve measured betweenthe AFM tip and the sample, it appears that by applyinga higher load, the tip can penetrate a further 100 Å downinto the layer. We note that the absolute layer thicknessas a function of load is directly obtained with the SFA.
Adsorption/DesorptionProcesses. Beforediscussingthe results obtained in the present investigation, we needto spend some time considering the properties of the micasurface. Mica is a layered aluminosilicate mineral. Eachlayer is strongly negatively charged due to isomorphoussubstitution where some silicon atoms are replaced byaluminum. These charges are compensated for by monov-alent ions, mostly potassium, located between the layers.The number of such ions on the outer surface is 2.1 × 10¹⁴
cm-2. When the mica surface is immersed in water, thepotassium ions are dissolved and partly exchanged byhydrogen ions.22,23 The exchange is not complete, but themica surface is strongly negatively charged in dilute saltsolutions. When a highly charged cationic polyelectrolyte,such as PCMA, is introduced in the low ionic strengthsolution, it is strongly adsorbed to the surface. Theadsorption is accompanied by a release of solvatedhydrogen ions, and the number of adsorbed segments areclose to the number of mica lattice charges,16 i.e. 2.1 ×1014 cm-2. Due to the strong affinity between the poly-electrolyte and the oppositely charged surface a very thinadsorbed layer is obtained, as observed in this study andprevious reports.4,16 The electrical double-layer repulsionthat is observed when the PCMA is present in bulk solutionis very weak, and it disappears when the polyelectrolyteis removed from the solution. This result suggests thatthe number of adsorbed cationic charges, mainly from thepolyelectrolyte but also with some contribution fromhydrogen ions,24 initially was slightly larger than thelattice charge. Further desorption of PCMA in 1 × 10⁻⁴
(21) Derjaguin, B. Kolloid-Z. 1934, 69, 155.
(22) Pashley, R. M. J. Colloid Interface Sci. 1981, 83, 531.(23) Claesson, P. M.; Herder, P. C.; Stenius, P.; Eriksson, J. C.;
Pashley, R. M. J. Colloid Interface Sci. 1986, 109, 31.
Figure 10. AFM deflection image of a PCMA layer adsorbed on a mica surface from a 20 ppm PCMA solution in 1 × 10⁻⁴ M KBr.The image was taken in contact mode in a liquid cell filled with a polyelectrolyte-free 1 × 10⁻⁴ M KBr solution.
5262 Langmuir, Vol. 16, No. 12, 2000 Dedinaite et al.

M KBr solution is negligible, which is well-understoodtheoretically.25 It has also been shown experimentallyusing a similar highly charged polyelectrolyte, MAPTAC,by the method of X-ray photoelectron spectroscopy (XPS)26
that about 20% of the polymer was desorbed when thesalt concentration (NaCl) was increased to 0.1 M.
The situation is more complex when instead of a 1:1inorganic electrolyte a charged surfactant is present inthe solution in contact with the polyelectrolyte-coatedsurface. The anionic surfactant ion will, just like aninorganic anion, be attracted to positive charges on thepolyelectrolyte molecule and repelled by negative chargeson the mica surface. The electrostatic interactions are thesame for the two types of anions. However, when the anionis a surfactant, there is a strong hydrophobic interactionthat drives the surfactant to self-assemble. In a poly-electrolyte-free bulk solution this occurs at the cmc. Withpolyelectrolytes present in the bulk solution, the self-assembly occurs at a much lower concentration, the critical
association concentration, cac. When the polyelectrolytehas a hydrophilic backbone, the main reason is that thepolyelectrolyte is a very efficient counterion to the micelle,which is well-understood theoretically.27-30 In such a casethe polyelectrolyte chain is located outside the micelle.On the other hand, mixed association structures contain-ing polyelectrolyte segments and surfactants may formwhen the polyelectrolyte has a (slightly) hydrophobicbackbone and/or hydrophobic side chains.31 In this casethe polyelectrolyte is partly mixed in with the surfactanthydrocarbon region. The critical association concentrationbetween polyelectrolytes adsorbed to a surface and sur-factants, cacs, is expected to depend on the nature of thepolyelectrolyte, the surfactant, and the surface. For thePCMA-mica-SDS system we have previously shown thatcac < cacs < cmc, with the cacs ) 0.1-0.2 cmc. Hence, atthis concentration the chemical potential of the surfactanthas become sufficiently high to allow it to competeefficiently with negative surface sites for association withcationic polyelectrolyte segments. Despite the incorpora-tion of SDS in the adsorbed layer, only a limited desorptionof polyelectrolytes occurs. For instance, it has been shownthat exposing a mica surface precoated with MAPTAC,which is similar in structure to PCMA, to a 1 cmc SDSsolution for 24 h led to a reduction of the adsorbed amountof the polyelectrolyte by just about 20%.26 The molecularmass of the MAPTAC polymer used was 4.8 × 10⁵ g/mol,which is less than one-third of the molecular weight of thePCMA used in this study. Thus, we expect that an evensmaller fraction of the initial PCMA layer is desorbed bythe surfactant in the present case. We note that bothincorporation of SDS to the adsorbed layer and partialdesorption of PCMA due to the presence of SDS will resultin the buildup of a negative surface charge on the initiallyuncharged PCMA-coated mica surface.
Finally, we note that even though an adsorbed polymercannot easily be removed by dilution, it can as a rule easilybe exchanged with another polymer with marginallyhigher adsorption affinity.32 From studies of proteinadsorption, using labeled proteins, it is also well-knownthat a protein in solution can exchange with a similaradsorbed protein,33 and the same ought to be true for anyother polymer. This may be the explanation why the rangeof the repulsive force increases when the solution con-taining 20 ppm PCMA and 1 cmc SDS is replaced by apolyelectrolyte-free 1 cmc SDS solution (i.e. going fromstep 1 to step 2, procedure II in Figure 2). The effect isillustrated in Figure 9. It cannot be due to the marginallydecreased ionic strength. Instead it is evident that whenthe bulk polyelectrolyte is removed by dilution with SDSsolution, the previously established equilibrium betweenthe bulk and the surface is disturbed. As long as PCMAis present in solution, there will be an exchange betweenadsorbed and bulk polyelectrolytes. Naturally, the ad-sorbed chains that extend out into solution are more easilyexchanged than those residing close to the surface withmost of their segments. This mechanism favors formationof a compact layer. However, as soon as the polyelectrolytesare removed from solution, the exchange mechanism will
(24) Blomberg, E.; Claesson, P. M.; Froberg, J. C. Biomaterials 1998,19, 371.
(25) Cohen Stuart, M. A.; J., F. G. Annu. Rev. Mater. Sci. 1996, 26,463.
(26) Rojas, O.; Ernstsson, M.; Neuman, R. D.; and Claesson, P. M.,submitted.
(27) Wallin, T.; Linse, P. Langmuir 1996, 12, 305.(28) Wallin, T.; Linse, P. J. Phys. Chem. 1996, 100, 17873.(29) Wallin, T.; Linse, P. J. Phys. Chem. B 1997, 101, 5506.(30) Wallin, T.; Linse, P. Langmuir 1998, 14, 2940.(31) Linse, P.; Piculell, L.; Hansson, P. In Modelsofpolymer-surfactant
complexation; Linse, P., Piculell, L., Hansson, P., Eds.; Dekker: NewYork, 1998; Vol. 77.
(32) Fleer, G. J.; Cohen Stuart, M. A.; Scheutjens, J. M. H. M.;Cosgrove, T.; Vincent, B. Polymers at Interfaces; Chapman & Hall:London, 1993.
(33) Norde, W. Adv. Colloid Interface Sci. 1986, 25, 267.
Figure 11. AFM image of preadsorbed PCMA layers taken incontact mode in a liquid cell containing a 1 cmc SDS solution.The force used when imaging is illustrated by the arrow inFigure 5. Part a is a 3D representation of the height image, andpart b shows the height variation along a line across the image.
Polyelectrolyte-Surfactant Layers Langmuir, Vol. 16, No. 12, 2000 5263
stop and the adsorbed polyelectrolyte chains may adoptmore extended conformations without being removed fromthe surface. We propose that this is the explanation forthe swelling observed when the polyelectrolyte is removedfrom solution.
Origin of the Oscillating Force Profile Observedbetween Preadsorbed PCMA Layers Swelled bySDS. Preadsorbed PCMA layers are strongly swelled byassociation with SDS. This indicates that part of thepolyelectrolyte chain is desorbed from the surface. How-ever, the polyelectrolyte as a whole remains attached tothe mica surface for a period of at least several days. Whenthe swelled layers are pushed together, oscillating forcecurves are observed both with the SFA (Figure 4) and theAFM (Figure 5). The reason is that the internal structureof the adsorbed layer changes in order to minimize thefree energy when the surfaces are brought together. Wenote that similar, but weaker, oscillations with largerperiodicity have been observed due to packing of free SDS
micelles in the confined space between two surfaces.34
Such oscillating force curves have also been reported formicellar CTAB solutions.35 However, these forces wereobserved only well above the cmc (0.25 M ) 30 cmc in thecase of SDS). We have previously argued4 that theoscillations are due to the presence of small SDS micellar-like structures stabilized by the polyelectrolyte. However,our recent SANS results (Figure 13) do not seem to beconsistent with this picture. Instead, the peak observedat 0.16-0.17 Å-1, corresponding to a correlation distanceof 37-39 Å, might be interpreted as the distance betweentwo surfactant-loaded polyelectrolyte chains, i.e., the meshsize within the layer. This characteristic distance agreesvery well with the periodicity of the oscillating forcesobserved with the SFA and the AFM. Oscillating forcesacross single foam films stabilized by polyelectrolyte-surfactant mixtures have recently been reported.36 In oneof the papers the periodicities of the oscillations werecorrelated with the mesh size in the bulk polyelectrolytesolution.37 Similar results were obtained by Milling38 usingAFM. He studied forces acting between a flat surface anda colloidal probe across a concentrated polyelectrolytesolution and observed a force curve displaying weakoscillations. Our results are different from the onesmentioned above because we have no polyelectrolytepresent in solution, but the characteristic length scale isa property of the adsorbed polyelectrolyte-surfactantlayer (and the internal structure of dispersed bulkaggregates). It seems likely that the structure of ourpolyelectrolyte-surfactant aggregates is similar to those
(34) Hartley, P. G. In Measurement of Colloidal Interactions Usingthe Atomic Force Microscope; Hartley, P. G., Ed.; Wiley: New York,1999; p 253.
(35) Richetti, P.; Kekicheff, P. Phys. Rev. Lett. 1992, 68, 1951.(36) Bergeron, V.; Langevin, D.; Ascacios, A. Langmuir 1996, 12,
1550.(37) Asnacios, A.; Espert, A.; Colin, A.; Langevin, D. Phys. Rev. Lett.
1997, 78, 4974.(38) Milling, A. J. J. Phys. Chem. 1996, 100, 8986.
Figure 12. AFM deflection image of PCMA layers as they appear at the end of experimental procedure I, i.e., the layer was firstswelled by exposure to a 1 cmc SDS solution that subsequently was replaced with pure 1 × 10⁻⁴ M KBr. Patches of adsorbed materialare clearly seen, showing that the layer no longer is homogeneous. The image was taken in contact mode.
Figure 13. log-log plot of scattering intensity vs scatteringvector for a sample containing 1000 ppm PCMA and 0.5 wt %deuterated SDS (1.00E+03, for example, means 1.00 × 10³).The curves were recorded in D2O (() and in a mixture of 80%H2O and 20% D2O (O).
5264 Langmuir, Vol. 16, No. 12, 2000 Dedinaite et al.

of the mesomorphous polyelectrolyte-surfactant phasesdescribed by Antonietti et al.39-42
There are several reasons why more oscillations areobserved with the SFA than with the AFM. First, in theSFA experiment both surfaces are coated with a surfac-tant-swelled polyelectrolyte layer, whereas in the AFMthis is the case only for the substrate surface but not forthe tip. Second, the SFA measures the average force overa much larger surface area than that probed by the AFMtip, which means that the resolution in force divided bylocal radius (F/R) is better for the SFA than for the AFM.Hence, weak oscillations can easily be missed by the AFM.Third, SFA measurements are carried out at a much slowerrate than the AFM measurements. The force curvedisplayed in Figure 4 took about 6 h to measure, whereasthe AFM force curve in Figure 5 took fractions of a secondto record. This means that oscillations due to slowrearrangements (seconds to minutes) within the poly-electrolyte-surfactant layer are easily detected with theSFA, but not with the AFM.
Interactions between Preadsorbed Polyelectro-lyte Layers across 1 × 10⁻⁴ M KBr Before and AfterSwelling the Layer with SDS. Even though the bulkcomposition at step 2 and step 4 (procedure I in Figure2) is the same, the state of the adsorbed layer is clearlydifferent, as illustrated by the force curves displayed inFigure 6 and the AFM images in Figures 10 and 12. Thisis true even after more than 48 h equilibration, demon-strating the slow approach toward the “true” equilibriumstate. These changes indicate that not all of the surfactantis desorbed, but some remains entrapped in the poly-electrolyte layer. Evidently, the polyelectrolyte is not ashomogeneously distributed on the surface in distinctionto the case of adsorption from the surfactant-free solution.The layer thickness is larger and the adhesion is reducedat step 4 compared to step 2. We propose that the weakeradhesion is a consequence of the larger layer thicknessthat makes bridging less favorable.43 Further, the incor-poration of SDS in the layer means that less polyelectrolytesegments are available for bridge formation.
Effects due to the Order of Adding Polyelectrolyteand Surfactant. In a previous study Dahlgren et al.showed that the order in which polyelectrolytes and simplesalt were added to the solution had a strong effect on theresulting adsorbed layer structure and the range of thesteric force.44 This difference persisted for several days(the duration of the experiment), showing that theapproach toward a true equilibrium state was very slow.In light of this it is only natural that the order in whichpolyelectrolytes and surfactants are added also affectsthe properties of the adsorbed layer. This is for instancethe case for the adsorbed amount of polyelectrolyte. Theamount of PCMA adsorbed onto mica from a mixturecontaining 20 ppm PCMA and 1 cmc SDS has been foundto be 0.084 mg/m2.11 On the other hand, when PCMA isadsorbed from an SDS-free 20 ppm polyelectrolyte solu-tion, the adsorbed amount is 0.7 mg/m2, i.e., 8 timeslarger.16 We argued above that less than 20% of thepolyelectrolyte will desorb when exposed to a 1 cmc SDS
solution. With the large difference in adsorbed amount ofPCMA at step 3, procedure 1, and step 2, procedure 2(Figure 2), it is obvious that the surface interaction mustbe different even though the composition of the bulksolution is the same. We note that oscillating forces areobserved when the adsorbed amount of PCMA is relativelyhigh, but not when it is small (Figure 8). This seemsnatural since the oscillations arise due to changes in theinternal structure of the polyelectrolyte-surfactant layerunder confinement. Another reason for the lack of oscil-lations in the force curve between surfaces coated withadsorbed aggregates may be that the structural units,giving rise to the characteristic length scale observed withSANS, have a random orientation relative to the surface.
Replacing the 1 cmc SDS solution with a 1 × 10⁻⁴ MKBr solution does not result in a complete desorption ofSDS but rather causes a deswelling of the PCMA-SDSaggregates (step 4, procedure I, and step 3, procedure II).The removal of SDS from the bulk solution reduces thenet negative charge of the adsorbed layer, which explainsthe collapse. However, it is at first glance surprising thatnot all SDS is desorbed by dilution, but this can berationalized as suggested Ilekti et al.,45 who investigatedaqueous systems containing sodium polyacrylate andcethyltrimethylammonium bromide. The authors showedthat the phase separation in these systems and thedeswelling of the concentrated phase can be induced byaddition of water. This phenomenon is accounted for bythe fact that the gain in entropy for the small counterionsthat are released into the dilute phase is larger at lowionic strength.
The forces measured after deswelling the polyelectro-lyte-surfactant layer by removal of the SDS from thesolution is different depending on which of the twoprocedures has been followed. This is not surprising sincethe adsorbed amount is different. The fact that a distinctdouble-layer force is observed when the adsorbed amountis low (Figure 9), but only a weak long-range repulsionwhen the adsorbed amount is large (Figure 6), is also asexpected. More surprisingly, the range of the steric forceis larger when the adsorbed amount is smaller. This mightindicate formation of a more heterogeneous adsorbed layercontaining largeraggregateswhenprocedure II is followed;i.e., the adsorption of polyelectrolyte-surfactant ag-gregates leads to a more uneven distribution of materialon the surface than first adsorbing the polyelectrolyte andthen adding the surfactant. Attempts to test this sug-gestion by imaging the surfaces after adsorption of thePCMA-SDS aggregates failed. No reproducible imagescould be obtained, which may indicate that the aggregatesare too weakly attached to the surface.
Conclusions
We have shown that adsorbed layers on mica consistingof a highly charged cationic polyelectrolyte, PCMA, andan anionic surfactant, SDS, are readily trapped inmetastable states and that “true” equilibrium is notestablished over a period of several days. In fact, our studydoes not tell us the nature of the “true” equilibrium. Onemain reason equilibrium is reached so slowly is that thepolyelectrolyte is bound to the surface by many segments,each of which has a high affinity for the surface. Hence,the mobility of the chain on the surface will be low andlikewise the desorption will be slow. Another importantreason is that stoichiometric PCMA-SDS aggregates arewater-insoluble and very stable toward dilution with
(39) Antonietti, M.; Kaul, A.; Thunemann, A. Langmuir 1995, 11,2633.
(40) Antonietti, M.; Burger, C.; Effing, J. Adv. Mater. 1995, 7, 751.(41) Antonietti, M.; Maskos, M. Macromolecules 1996, 29, 4199.(42) Antonietti, M.; Wenzel, A.; Thunemann, A. Langmuir 1996, 12,
2111.(43) Dahlgren, M. A. G.; Waltermo, Å.; Blomberg, E.; Claesson, P.
M.; Sjostrom, L.; Åkesson, T.; Jonsson, B. J. Phys. Chem. 1993, 97,11769.
(44) Dahlgren, M. A. G.; Hollenberg, H. C. M.; Claesson, P. M.Langmuir 1995, 11, 4480.
(45) Ilekti, P.; Piculell, L.; Tournilhac, F.; Cabane, B. J. Phys. Chem.B 1998, 102, 344.
Polyelectrolyte-Surfactant Layers Langmuir, Vol. 16, No. 12, 2000 5265
water. Hence, once they are formed on the surface theyare difficult to remove. We have also shown that when apreadsorbed polyelectrolyte layer is exposed to a 1 cmcSDS solution, an oscillating force curve with a periodicityof about 40 Å is obtained. Similar results are obtainedboth with the SFA and the AFM. Small-angle neutronscattering experiments show that about the same char-acteristic length scale is present within polyelectrolyte-surfactant aggregates dispersed in aqueous solution. TheSANS data are, however, not consistent with micellar-like aggregates of SDS in a bead-and-necklace structurealong the polyelectrolyte and rather suggest that mixedaggregates containing both polyelectrolyte segments and
surfactant are formed. Hence, it seems likely that theinternal structure is reminiscent of those described byAntonietti et al. for other polyelectrolyte-surfactantsystems.
Acknowledgment. We acknowledge the assistanceof Dr. Isabelle Grillo at ILL. M.B. acknowledges financialsupport from the Centre for Surfactants Based on NaturalProducts (SNAP). We thank Lachlan Grant for introducingus to the AFM imaging technique. Professor SrinivasManne is thanked for constructive discussions.
LA9911537
5266 Langmuir, Vol. 16, No. 12, 2000 Dedinaite et al.