Polyelectrolyte coating of iron oxide nanoparticles for MRI-based cell tracking
10
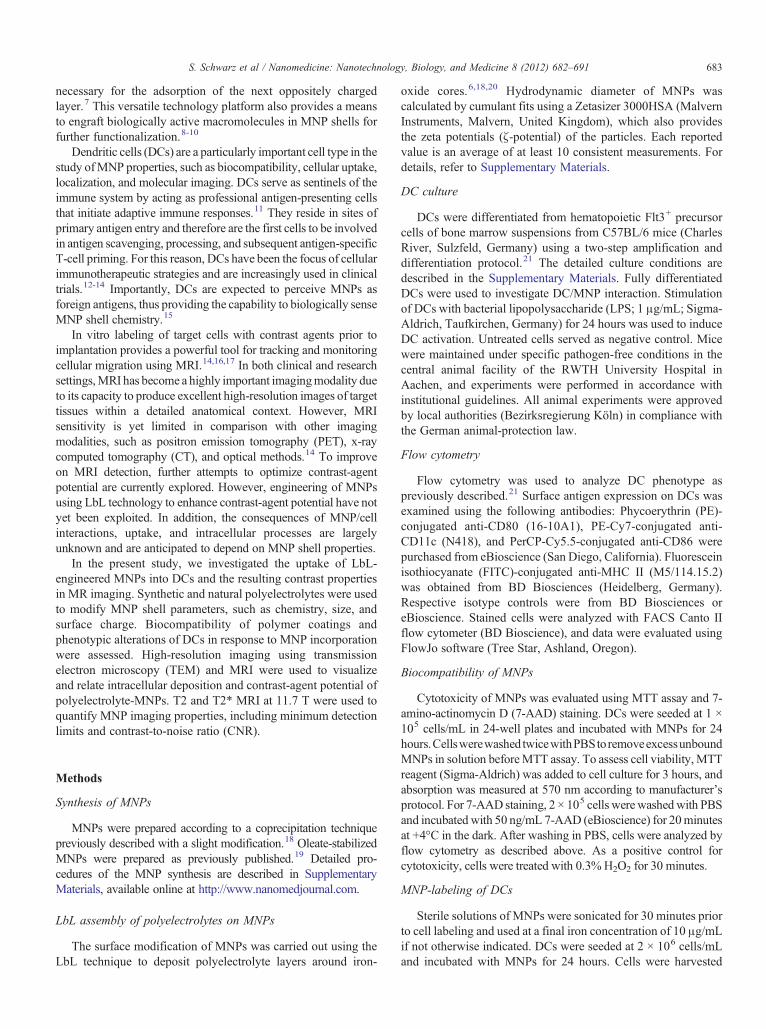
Research Article Polyelectrolyte coating of iron oxide nanoparticles for MRI-based cell tracking Sebastian Schwarz, MSc a,b , John E. Wong, PhD c , Joerg Bornemann, PhD d , Michael Hodenius, PhD e,f , Uwe Himmelreich, PhD e , Walter Richtering, PhD c , Mathias Hoehn, PhD g , Martin Zenke, PhD a , Thomas Hieronymus, PhD a,b, ⁎ a Institute for Biomedical Engineering, Department of Cell Biology, University Hospital RWTH Aachen University, Aachen, Germany b Helmholtz Institute for Biomedical Engineering, Department of Cell Biology, RWTH Aachen University, Aachen, Germany c Institute of Physical Chemistry, RWTH Aachen University, Aachen, Germany d Institute of Pathology, Electron Microscopy Facility (EME), University Hospital RWTH Aachen University, Aachen, Germany e Biomedical NMR Unit/MoSAIC, Faculty of Biomedical Sciences, KULeuven, Leuven, Belgium f Laboratory of BioNanoColloids, Interdisciplinary Research Centre, KULeuven, Kortrijk, Belgium g In Vivo NMR Research Group, Max Planck Institute for Neurological Research, Cologne, Germany Received 1 June 2011; accepted 12 August 2011 Abstract Iron oxide-based magnetic nanoparticles (MNPs) offer unique properties for cell tracking by magnetic resonance imaging (MRI) in cellular immunotherapy. In this study, we investigated the uptake of chemically engineered NPs into antigen-presenting dendritic cells (DCs). DCs are expected to perceive MNPs as foreign antigens, thus exhibiting the capability to immunologically sense MNP surface chemistry. To systematically evaluate cellular uptake and T2/T2 ⁎ MR imaging properties of MNPs, we synthesized polymer-based MNPs by employing layer-by-layer (LbL) technology. Thereby, we achieved modification of particle shell parameters, such as size, surface charge, and chemistry. We found that subcellular packaging of MNPs rather than MNP content in DCs influences MR imaging quality. Increased local intracellular electron density as inferred from transmission electron microscopy (TEM) strongly correlated with enhanced contrast in MRI. Thus, LbL-tailoring of MNP shells using polyelectrolytes that impact on uptake and subcellular localization can be used for modulating MR imaging properties. From the Clinical Editor: In this study, layer-by-layer tailoring of magnetic NP shells was performed using polyelectrolytes to improve uptake by dendritic cells for cell-specific MR imaging. The authors conclude that polyelectrolyte modified NP-s can be used for modulating improving MR imaging quality by increasing subcellular localization. © 2012 Elsevier Inc. All rights reserved. Key words: Nanoparticle; Polyelectrolytes; Layer-by-Layer technology; Magnetic resonance imaging; Dendritic cell labeling Iron oxide-based magnetic nanoparticles (MNPs) represent promising tools for medical applications, such as drug-delivery systems and contrast agents for magnetic resonance imaging (MRI). 1-4 Frequently, MNPs are endowed with functionalized surface coatings and/or specific ligand domains for (i) cell- specific targeting in vivo following systemic application of MNPs or (ii) in vitro cell labeling prior to cell implantation. This allows long-term, noninvasive MRI tracking of MNP-labeled cells. Various natural and synthetic macromolecules chemically bound to particle core structures are being used to enhance biocompatibility and particle stability and facilitate directed uptake of MNPs into target cells. 2,4,5 Layer-by-layer (LbL) adsorption of polyelectrolytes around a MNP core represents a particularly versatile technique that allows the engineering of surface attributes, such as charge, particle size, and shell chemistry. 6 The LbL technology consists of the alternate adsorption of polyanions and polycations on a charged surface. Each adsorption layer leads to a charge reversal Conflict of interest statement: The authors declare no competing interests. This work was supported by the Excellence Initiative of the German federal and state governments and the Interdisciplinary Center for Clinical Research within the Faculty of Medicine at the RWTH Aachen University to T. H. (TV M2) and M. Z. (TV M7). U. H. and M. H. received financial support by the European Commission for EC-FP7 network ENCITE (2008- 201842). ⁎ Corresponding author: Department of Cell Biology, Institute for Biomedical Engineering, University Hospital RWTH Aachen, Pauwels- strasse 30, 52074 Aachen, Germany. E-mail address: [email protected] (T. Hieronymus). BASIC SCIENCE Nanomedicine: Nanotechnology, Biology, and Medicine 8 (2012) 682 – 691 nanomedjournal.com 1549-9634/$ – see front matter © 2012 Elsevier Inc. All rights reserved. doi:10.1016/j.nano.2011.08.010 Please cite this article as: S., Schwarz, et al, Polyelectrolyte coating of iron oxide nanoparticles for MRI-based cell tracking. Nanomedicine: NBM 2012;8:682-691, doi:10.1016/j.nano.2011.08.010
-
Upload
independent -
Category
Documents
-
view
1 -
download
0
Transcript of Polyelectrolyte coating of iron oxide nanoparticles for MRI-based cell tracking

BASIC SCIENCE
Nanomedicine: Nanotechnology, Biology, and Medicine8 (2012) 682–691
Research Article
Polyelectrolyte coating of iron oxide nanoparticles for MRI-basedcell tracking
Sebastian Schwarz, MSca,b, John E. Wong, PhDc, Joerg Bornemann, PhDd,Michael Hodenius, PhDe, f, Uwe Himmelreich, PhDe, Walter Richtering, PhDc,Mathias Hoehn, PhDg, Martin Zenke, PhDa, Thomas Hieronymus, PhDa,b,⁎
aInstitute for Biomedical Engineering, Department of Cell Biology, University Hospital RWTH Aachen University, Aachen, GermanybHelmholtz Institute for Biomedical Engineering, Department of Cell Biology, RWTH Aachen University, Aachen, Germany
cInstitute of Physical Chemistry, RWTH Aachen University, Aachen, GermanydInstitute of Pathology, Electron Microscopy Facility (EME), University Hospital RWTH Aachen University, Aachen, Germany
eBiomedical NMR Unit/MoSAIC, Faculty of Biomedical Sciences, KULeuven, Leuven, BelgiumfLaboratory of BioNanoColloids, Interdisciplinary Research Centre, KULeuven, Kortrijk, Belgium
gIn Vivo NMR Research Group, Max Planck Institute for Neurological Research, Cologne, Germany
Received 1 June 2011; accepted 12 August 2011
nanomedjournal.com
Abstract
Iron oxide-based magnetic nanoparticles (MNPs) offer unique properties for cell tracking by magnetic resonance imaging (MRI) in cellularimmunotherapy. In this study, we investigated the uptake of chemically engineered NPs into antigen-presenting dendritic cells (DCs). DCs areexpected to perceiveMNPs as foreign antigens, thus exhibiting the capability to immunologically senseMNP surface chemistry. To systematicallyevaluate cellular uptake and T2/T2⁎MR imaging properties of MNPs, we synthesized polymer-based MNPs by employing layer-by-layer (LbL)technology. Thereby, we achievedmodification of particle shell parameters, such as size, surface charge, and chemistry. We found that subcellularpackaging ofMNPs rather thanMNP content in DCs influencesMR imaging quality. Increased local intracellular electron density as inferred fromtransmission electron microscopy (TEM) strongly correlated with enhanced contrast in MRI. Thus, LbL-tailoring of MNP shells usingpolyelectrolytes that impact on uptake and subcellular localization can be used for modulating MR imaging properties.
From the Clinical Editor: In this study, layer-by-layer tailoring of magnetic NP shells was performed using polyelectrolytes to improveuptake by dendritic cells for cell-specific MR imaging. The authors conclude that polyelectrolyte modified NP-s can be used for modulatingimproving MR imaging quality by increasing subcellular localization.© 2012 Elsevier Inc. All rights reserved.
Key words: Nanoparticle; Polyelectrolytes; Layer-by-Layer technology; Magnetic resonance imaging; Dendritic cell labeling
Iron oxide-based magnetic nanoparticles (MNPs) representpromising tools for medical applications, such as drug-deliverysystems and contrast agents for magnetic resonance imaging
Conflict of interest statement: The authors declare no competinginterests.
This work was supported by the Excellence Initiative of the Germanfederal and state governments and the Interdisciplinary Center for ClinicalResearch within the Faculty of Medicine at the RWTH Aachen University toT. H. (TV M2) and M. Z. (TV M7). U. H. and M. H. received financialsupport by the European Commission for EC-FP7 network ENCITE (2008-201842).
⁎Corresponding author: Department of Cell Biology, Institute forBiomedical Engineering, University Hospital RWTH Aachen, Pauwels-strasse 30, 52074 Aachen, Germany.
E-mail address: [email protected] (T. Hieronymus).
1549-9634/$ – see front matter © 2012 Elsevier Inc. All rights reserved.doi:10.1016/j.nano.2011.08.010
Please cite this article as: S., Schwarz, et al, Polyelectrolyte coating of iron2012;8:682-691, doi:10.1016/j.nano.2011.08.010
(MRI).1-4 Frequently, MNPs are endowed with functionalizedsurface coatings and/or specific ligand domains for (i) cell-specific targeting in vivo following systemic application ofMNPs or (ii) in vitro cell labeling prior to cell implantation. Thisallows long-term, noninvasive MRI tracking of MNP-labeledcells. Various natural and synthetic macromolecules chemicallybound to particle core structures are being used to enhancebiocompatibility and particle stability and facilitate directeduptake of MNPs into target cells.2,4,5
Layer-by-layer (LbL) adsorption of polyelectrolytes around aMNP core represents a particularly versatile technique thatallows the engineering of surface attributes, such as charge,particle size, and shell chemistry.6 The LbL technology consistsof the alternate adsorption of polyanions and polycations on acharged surface. Each adsorption layer leads to a charge reversal
oxide nanoparticles for MRI-based cell tracking. Nanomedicine: NBM
683S. Schwarz et al / Nanomedicine: Nanotechnology, Biology, and Medicine 8 (2012) 682–691
necessary for the adsorption of the next oppositely chargedlayer.7 This versatile technology platform also provides a meansto engraft biologically active macromolecules in MNP shells forfurther functionalization.8-10
Dendritic cells (DCs) are a particularly important cell type in thestudy ofMNP properties, such as biocompatibility, cellular uptake,localization, and molecular imaging. DCs serve as sentinels of theimmune system by acting as professional antigen-presenting cellsthat initiate adaptive immune responses.11 They reside in sites ofprimary antigen entry and therefore are the first cells to be involvedin antigen scavenging, processing, and subsequent antigen-specificT-cell priming. For this reason, DCs have been the focus of cellularimmunotherapeutic strategies and are increasingly used in clinicaltrials.12-14 Importantly, DCs are expected to perceive MNPs asforeign antigens, thus providing the capability to biologically senseMNP shell chemistry.15
In vitro labeling of target cells with contrast agents prior toimplantation provides a powerful tool for tracking and monitoringcellular migration using MRI.14,16,17 In both clinical and researchsettings,MRI has become a highly important imagingmodality dueto its capacity to produce excellent high-resolution images of targettissues within a detailed anatomical context. However, MRIsensitivity is yet limited in comparison with other imagingmodalities, such as positron emission tomography (PET), x-raycomputed tomography (CT), and optical methods.14 To improveon MRI detection, further attempts to optimize contrast-agentpotential are currently explored. However, engineering of MNPsusing LbL technology to enhance contrast-agent potential have notyet been exploited. In addition, the consequences of MNP/cellinteractions, uptake, and intracellular processes are largelyunknown and are anticipated to depend on MNP shell properties.
In the present study, we investigated the uptake of LbL-engineered MNPs into DCs and the resulting contrast propertiesin MR imaging. Synthetic and natural polyelectrolytes were usedto modify MNP shell parameters, such as chemistry, size, andsurface charge. Biocompatibility of polymer coatings andphenotypic alterations of DCs in response to MNP incorporationwere assessed. High-resolution imaging using transmissionelectron microscopy (TEM) and MRI were used to visualizeand relate intracellular deposition and contrast-agent potential ofpolyelectrolyte-MNPs. T2 and T2⁎ MRI at 11.7 T were used toquantify MNP imaging properties, including minimum detectionlimits and contrast-to-noise ratio (CNR).
Methods
Synthesis of MNPs
MNPs were prepared according to a coprecipitation techniquepreviously described with a slight modification.18 Oleate-stabilizedMNPs were prepared as previously published.19 Detailed pro-cedures of the MNP synthesis are described in SupplementaryMaterials, available online at http://www.nanomedjournal.com.
LbL assembly of polyelectrolytes on MNPs
The surface modification of MNPs was carried out using theLbL technique to deposit polyelectrolyte layers around iron-
oxide cores.6,18,20 Hydrodynamic diameter of MNPs wascalculated by cumulant fits using a Zetasizer 3000HSA (MalvernInstruments, Malvern, United Kingdom), which also providesthe zeta potentials (ζ-potential) of the particles. Each reportedvalue is an average of at least 10 consistent measurements. Fordetails, refer to Supplementary Materials.
DC culture
DCs were differentiated from hematopoietic Flt3+ precursorcells of bone marrow suspensions from C57BL/6 mice (CharlesRiver, Sulzfeld, Germany) using a two-step amplification anddifferentiation protocol.21 The detailed culture conditions aredescribed in the Supplementary Materials. Fully differentiatedDCs were used to investigate DC/MNP interaction. Stimulationof DCs with bacterial lipopolysaccharide (LPS; 1 μg/mL; Sigma-Aldrich, Taufkirchen, Germany) for 24 hours was used to induceDC activation. Untreated cells served as negative control. Micewere maintained under specific pathogen-free conditions in thecentral animal facility of the RWTH University Hospital inAachen, and experiments were performed in accordance withinstitutional guidelines. All animal experiments were approvedby local authorities (Bezirksregierung Köln) in compliance withthe German animal-protection law.
Flow cytometry
Flow cytometry was used to analyze DC phenotype aspreviously described.21 Surface antigen expression on DCs wasexamined using the following antibodies: Phycoerythrin (PE)-conjugated anti-CD80 (16-10A1), PE-Cy7-conjugated anti-CD11c (N418), and PerCP-Cy5.5-conjugated anti-CD86 werepurchased from eBioscience (San Diego, California). Fluoresceinisothiocyanate (FITC)-conjugated anti-MHC II (M5/114.15.2)was obtained from BD Biosciences (Heidelberg, Germany).Respective isotype controls were from BD Biosciences oreBioscience. Stained cells were analyzed with FACS Canto IIflow cytometer (BD Bioscience), and data were evaluated usingFlowJo software (Tree Star, Ashland, Oregon).
Biocompatibility of MNPs
Cytotoxicity of MNPs was evaluated using MTT assay and 7-amino-actinomycin D (7-AAD) staining. DCs were seeded at 1 ×10⁵ cells/mL in 24-well plates and incubated with MNPs for 24hours.Cellswerewashed twicewithPBStoremoveexcessunboundMNPs in solution beforeMTT assay. To assess cell viability,MTTreagent (Sigma-Aldrich) was added to cell culture for 3 hours, andabsorption was measured at 570 nm according to manufacturer'sprotocol. For 7-AAD staining, 2 × 10⁵ cells werewashedwith PBSand incubated with 50 ng/mL 7-AAD (eBioscience) for 20minutesat +4°C in the dark. After washing in PBS, cells were analyzed byflow cytometry as described above. As a positive control forcytotoxicity, cells were treated with 0.3% H2O2 for 30 minutes.
MNP-labeling of DCs
Sterile solutions of MNPs were sonicated for 30 minutes priorto cell labeling and used at a final iron concentration of 10 μg/mLif not otherwise indicated. DCs were seeded at 2 × 10⁶ cells/mLand incubated with MNPs for 24 hours. Cells were harvested

Table 1Physicochemical properties of LbL-modified and oleate-stabilized iron oxide NPs
MNP name Shell structures Mean core diameter [nm] Hydrodynamic diameter [nm] Zeta potential [mV]
PEI-MNP polyethyleneimine 5 117 + 51PDAD-MNP polydiallyldimethylammoniumchloride 5 230 + 50PSS-MNP polystyrenesulphonate 10 165 - 53Chit-MNP chitosan; polyaminosaccharide 5 p.d.⁎ n.d.†
Dex-MNP dextran; polysaccharide 10 p.d. - 9OLS-MNP oleate-stabilized lipid shell 10 313 - 8
⁎ p.d.; polydispers.† n.d.: not determinable.
684 S. Schwarz et al / Nanomedicine: Nanotechnology, Biology, and Medicine 8 (2012) 682–691
and washed in PBS containing 2% FCS before being subjected tomagnetic separation (MACS, Miltenyi Biotech, BergischGladbach, Germany) as previously reported.15
Intracellular iron content
Intracellular iron concentration was determined using color-imetric ferrozine iron assay as previously described.15 Briefly,1 × 106 DCs were lysed in 100 μl 50 mM NaOH, and ascorbicacid was used to reduce Fe3+ to Fe2+ ions that form a chelatewith ferrozine (3-(2-pyridyl)-5,6-bis(phenyl sulfonic acid)-1,2,4-triazine; Sigma-Aldrich). Absorbance of Fe2+-ferrozine wasmeasured at 550 nm and compared with the absorbance of FeCl3standards where Fe3+ ions were reduced with ascorbic acid toFe2+ions accordingly. The minimum detection limit for Fe2+
ions was 250 μmol/l, corresponding to 5 pg of iron per cell.
Histological staining of iron after uptake
To visualize total iron uptake of cells, 1 × 10⁵ cells labeledwith MNPs were centrifuged (4 minutes at 1500 rpm) onto aglass slide using a cytospin centrifuge (Thermo Fisher Scientific,Waltham, Massachusetts). After washing in double-distilled (dd)H2O, glass slides were subjected to Prussian blue staining using a1:1 solution (v/v) of 10% K4[Fe(CN)6] (Sigma-Aldrich) and20% HCl for 20 minutes. After washing in ddH2O, glass slideswere counter-stained with Neutral Red dye (Roth, Karlsruhe,Germany) and mounted with coverslips using mounting medium(Dako, Glostrup, Denmark). Sample images were obtained usinga Leica DM6000B microscope (Leica, Wetzlar, Germany) andDiskus acquisition software (Hilgers, Koenigswinter, Germany).Images were processed using Adobe Photoshop.
TEM
TEM was performed on 1 × 10⁶ magnetically sorted DCs.Cells were fixed with 3% (w/v) glutaraldehyde and embedded in2% agarose. Samples were stained with OsO4, embedded inEpon and cut into 70-nm-thick slices. Samples were analyzedwithout further contrast enhancement using a Philips EM 400 Telectron microscope at 60 kV equipped with a CCD camera(MORADA, Olympus, Hamburg, Germany). TEM images wereanalyzed using NIH ImageJ software. Electron densities ofMNP-containing subcellular compartments were calculated frompixel intensities within defined regions of interest (ROIs)obtained in ImageJ. Normalized values were calculated as(signalMNP – signalBackground) × areaROI [nm
-2]. A total of 30
different MNP-containing areas within compartmental structureswere evaluated.
MRI
MNP-labeled cells were suspended in a total volume of 40 μllow-melting agarose (Lonza, Basel, Switzerland) and filled withoutair inclusions in 3.5-mm-diameter drill holes in 2% agarosephantoms. MR images of agarose phantoms were acquired using aBruker Biospec 11.7 T experimental, horizontal bore MRI scanner(Bruker Biospin, Ettlingen, Germany) equipped with activelyshielded gradient coils (16 cm in diameter, 750 mT/m). A purpose-built transmit-receive coil (4 cm diameter) was used for imageacquisition. T2 relaxation times were determined using two-dimensionalmultislicemultiecho sequences (echo spacing = 11ms,TE = 11-176 ms, TR = 5000 ms). Relative signal intensitieswere also determined using T2⁎-weighted three-dimensionalgradient echo FLASH sequences (TE = 15 ms; TR = 200 ms;flip angle 30 degrees; field-of-view 3.8 × 3.8 × 0.65 cm;isotropic resolution 74 μm). MR images were processed usingthe Bruker software ParaVision 4.0. Additional image analysesfor CNR calculations were performed using NIH ImageJ.
Results
Particle synthesis and characterization
The MNP surface has a major impact on cellular responses,including uptake, intracellular localization, and processing ofMNPs, and MNP surface is frequently modified to improve celltargeting. Therefore, we selectively tailored MNP surface usingLbL technology to delineate particle shell chemistry, size, andsurface charge. Coatings included synthetic polymers, such aspositively charged poly(ethyleneimine) (PEI) and poly(diallyldi-methylammonium-chloride) (PDAD), and negatively chargedpoly(styrene-sulphonate) (PSS)6,18,20 and the natural polysac-charides chitosan (Chit) and dextran (Dex; Table 1). All syntheticpolymers are strong polyelectrolytes over a wide range of pH,whereas chitosan and dextran represent weak polyelectrolyteswhose degree of charge can be varied according to the pH.
MNPs were synthesized and characterized for a panel ofphysicochemical parameters (Table 1).6,20,22 Due to the nature ofthe polymers, polyelectrolyte coating of MNPs resulted in a broadrange of different sizes (hydrodynamic diameters from 117 nm to230 nm as determined by dynamic light scattering [DLS]) andsurface potentials (from −53 mV to +51 mV) for each individual

Figure 1. Biocompatibility assays of DCs labeled with MNPs. MNP-labeling concentrations are shown as total iron concentration. (A) Cell viability wasdetermined using MTT assay. Values obtained for unlabeled DCs were set to 100%. Results shown are mean values ± SD (n = 3); ∗ P b 0.05. (B) and (C)Quantification of dead cells 24 h after MNP incorporation was performed using 7-AAD staining and analysis by flow cytometry. Increased 7-AAD fluorescenceintensities indicate dead cells. (B) Representative results of unlabeled DCs and DCs after labeling with various concentrations of OLS-MNP as indicated (grayhistograms). Open red histograms show positive control staining of dead cells. (C) Bar diagram shows percent of dead cells above controls. Mean values ± SD(n = 3) are plotted.
685S. Schwarz et al / Nanomedicine: Nanotechnology, Biology, and Medicine 8 (2012) 682–691
MNP. The DLS measurements revealed a confined size distribu-tion for allMNPs coated with synthetic polyelectrolytes, indicatingmonodispersity and absence of agglomeration.6,18 However, LbL-coating of MNPs with chitosan or dextran resulted in multiplespecies in aqueous solution with a broad size distribution in DLSmeasurements that varied in diameter ranging from 150 nm to 450nm. Chit-MNPs and – to a lesser extent – Dex-MNPs showedconsiderable agglomeration in aqueous solution and thus a precisedetermination of both the size and ζ-potential of Chit-MNPs wasnot possible. However, due to the approved biocompatibility ofdextran and chitosan, Dex-MNPs and Chit-MNPswere included infurther studies. Oleate-stabilizedMNPs (OLS-MNPs) that revealedan excellent performance in previous cellularMRI studies was alsoincluded as a reference.15 OLS-MNPs displayed a largemonodisperse particle size (Dh = 313 nm) and a low negative ζ-potential (Table 1).
LbL-coated MNPs are biocompatible
Surface-engineered MNPs were first analyzed for potentialcytotoxic effects on DCs. DCs were incubated with increasing
concentrations of MNPs up to 10-fold higher (200 μg/mL) thanroutinely used for DC labeling.15 Cell viability was assessed24 hours after MNP labeling using both standard MTT assay(Figure 1, A) and flow cytometry analysis with 7-AADstaining (Figure 1, B and C). MTT assays were performed onbulk cultures and revealed a minor decrease in cell viabilitywith increasing concentrations of MNPs (Figure 1, A). Chit-MNPs impaired cell viability most strongly and showedsignificantly reduced biocompatibility at 200 μg/mL ironconcentration in comparison with PDAD-MNPs and OLS-MNPs (Figure 1, A).
To evaluate whether MNPs affect cell viability of DCs onlyafter MNP uptake, MNP-loaded DCs were separated fromunlabeled DCs using magnetic sorting. MNP-labeled andunlabeled DCs were then subjected to 7-AAD staining fordetection of dead cells (Figure 1, B and C). No adverse apoptoticeffects were observed in unlabeled DCs even at highest MNPconcentrations. MNP-loaded DCs showed an increase in 7-AADfluorescence signals with increasing concentrations of MNPssimilar to the results obtained with MTT assay on bulk cellcultures (Figure 1, C).

Figure 2. Uptake of MNPs into DCs. DCs were incubated with the respective MNPs for 24 h and subjected to magnetic separation of MNP-loaded cells fromunlabeled cells. (A) Number of retained and nonretained DCs after magnetic separation was determined. (B) Average intracellular iron concentration (pg/cell)of retained DC fractions after magnetic separation. Results in (A) and (B) are shown as mean values ± SD (n = 3). (C) Prussian blue staining for iron deposits ofretained and nonretained DCs. Neutral Red used as counterstain. Scale bars, 15 μm.
686 S. Schwarz et al / Nanomedicine: Nanotechnology, Biology, and Medicine 8 (2012) 682–691
Chit-MNPs displayed the lowest biocompatibility in bothcytotoxicity assays, but ∼ 82% of DCs remained viable afterincubation with 200 μg/mL for 24 hours (Figure 1, A and C).Oleate-stabilized MNPs and PDAD-MNPs showed best perfor-mance in cytotoxicity assays in comparison with other MNPformulations over a wide range of labeling concentrations(Figure 1, C).
Polyelectrolyte-MNPs are efficiently taken up by DCs
DCs acquire magnetic properties after MNP uptake and areretained in magnetic fields, whereas unlabeled cells are not.15,23
Efficiency of MNP uptake into DCs was analyzed by applyingMNP-labeled DCs to magnetic fields and determining numbersof retained and nonretained cells.
Labeling efficiency of DCs ranged from ∼40% (Chit-MNPs)to 85% (PEI-MNPs) (Figure 2, A), with positively chargedMNPs (PEI-MNPs, PDAD-MNPs) showing highest labelingefficiency of DCs. MNPs modified with dextran and chitosanresulted in limited internalization (40 – 50% of treated DCs),which might be due to agglomeration of Chit-MNPs and Dex-MNPs in aqueous solution (see DLS analysis above).
Next, we determined the average iron load per MNP-labeledDC by employing a ferrozine-based colorimetric assay as ameasure for MNP amount (Figure 2, B).15,17,24 MNP-labeled andunlabeled DCs were magnetically separated as described above.Untreated DCs were used as a control and to determine basal iron
load. Iron concentrations in untreated and unlabeled DCs werebelow the detection limit of∼ 5 pg of iron per cell. This finding isin line with results obtained by Prussian blue staining that showedno staining with Prussian blue in nonretained DCs, confirmingthe absence of MNPs in these cells (Figure 2, C). Average ironload per MNP-labeled DC ranged from 40 pg to 85 pg per cell(Figure 2, B). The highest iron load was found in DCs labeledwith Chit-MNPs (83.3 ± 20.5 pg/cell; n = 3) and comparableamounts were detected for DCs labeled with PSS-MNPs (83.7 ±10.7 pg/cell; n = 3) and PDAD-MNPs (65.0 ± 18.7 pg/cell; n = 3).The average iron loads in DCs labeled with PEI-MNPs,Dex-MNPs and OLS-MNPs were slightly lower, with meaniron concentrations of about 40 – 50 pg/cell (Figure 2, C).
Prussian blue staining of internalized iron deposits readilydetected MNPs in retained DCs and indicated variable allocationand/or clustering of different MNPs within DCs (Figure 2, C).Chit-MNPs showed unequal distribution of cluster deposits,which additionally varied in size and staining intensity. Incontrast, PDAD-MNPs exhibited an almost homogenousdistribution, suggesting that an average iron load is indeedachieved per cell.
Uptake of polyelectrolyte-MNPs leaves DC phenotype unaffected
Interaction with and uptake of particles, such as that of virusesand bacteria and their components, lead to DC activation, whichresults in the expression and/or up-regulation of specific cell
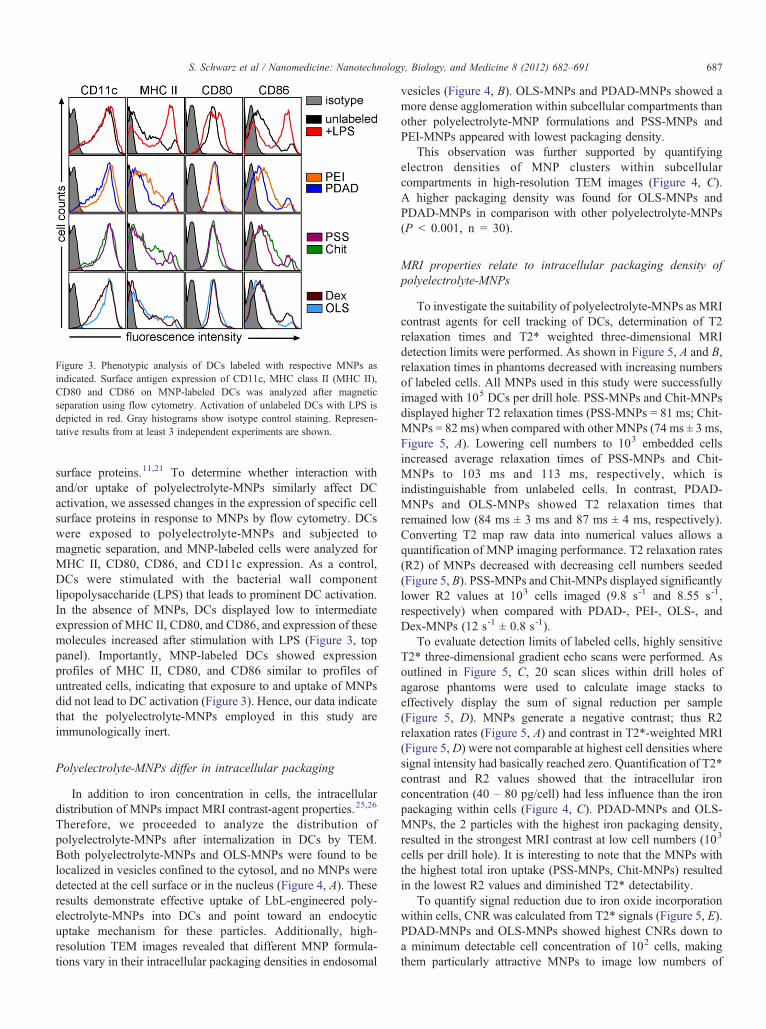
Figure 3. Phenotypic analysis of DCs labeled with respective MNPs asindicated. Surface antigen expression of CD11c, MHC class II (MHC II),CD80 and CD86 on MNP-labeled DCs was analyzed after magneticseparation using flow cytometry. Activation of unlabeled DCs with LPS isdepicted in red. Gray histograms show isotype control staining. Represen-tative results from at least 3 independent experiments are shown.
687S. Schwarz et al / Nanomedicine: Nanotechnology, Biology, and Medicine 8 (2012) 682–691
surface proteins.11,21 To determine whether interaction withand/or uptake of polyelectrolyte-MNPs similarly affect DCactivation, we assessed changes in the expression of specific cellsurface proteins in response to MNPs by flow cytometry. DCswere exposed to polyelectrolyte-MNPs and subjected tomagnetic separation, and MNP-labeled cells were analyzed forMHC II, CD80, CD86, and CD11c expression. As a control,DCs were stimulated with the bacterial wall componentlipopolysaccharide (LPS) that leads to prominent DC activation.In the absence of MNPs, DCs displayed low to intermediateexpression of MHC II, CD80, and CD86, and expression of thesemolecules increased after stimulation with LPS (Figure 3, toppanel). Importantly, MNP-labeled DCs showed expressionprofiles of MHC II, CD80, and CD86 similar to profiles ofuntreated cells, indicating that exposure to and uptake of MNPsdid not lead to DC activation (Figure 3). Hence, our data indicatethat the polyelectrolyte-MNPs employed in this study areimmunologically inert.
Polyelectrolyte-MNPs differ in intracellular packaging
In addition to iron concentration in cells, the intracellulardistribution of MNPs impact MRI contrast-agent properties.25,26
Therefore, we proceeded to analyze the distribution ofpolyelectrolyte-MNPs after internalization in DCs by TEM.Both polyelectrolyte-MNPs and OLS-MNPs were found to belocalized in vesicles confined to the cytosol, and no MNPs weredetected at the cell surface or in the nucleus (Figure 4, A). Theseresults demonstrate effective uptake of LbL-engineered poly-electrolyte-MNPs into DCs and point toward an endocyticuptake mechanism for these particles. Additionally, high-resolution TEM images revealed that different MNP formula-tions vary in their intracellular packaging densities in endosomal
vesicles (Figure 4, B). OLS-MNPs and PDAD-MNPs showed amore dense agglomeration within subcellular compartments thanother polyelectrolyte-MNP formulations and PSS-MNPs andPEI-MNPs appeared with lowest packaging density.
This observation was further supported by quantifyingelectron densities of MNP clusters within subcellularcompartments in high-resolution TEM images (Figure 4, C).A higher packaging density was found for OLS-MNPs andPDAD-MNPs in comparison with other polyelectrolyte-MNPs(P b 0.001, n = 30).
MRI properties relate to intracellular packaging density ofpolyelectrolyte-MNPs
To investigate the suitability of polyelectrolyte-MNPs as MRIcontrast agents for cell tracking of DCs, determination of T2relaxation times and T2⁎ weighted three-dimensional MRIdetection limits were performed. As shown in Figure 5, A and B,relaxation times in phantoms decreased with increasing numbersof labeled cells. All MNPs used in this study were successfullyimaged with 105 DCs per drill hole. PSS-MNPs and Chit-MNPsdisplayed higher T2 relaxation times (PSS-MNPs = 81 ms; Chit-MNPs = 82 ms) when compared with other MNPs (74 ms ± 3 ms,Figure 5, A). Lowering cell numbers to 103 embedded cellsincreased average relaxation times of PSS-MNPs and Chit-MNPs to 103 ms and 113 ms, respectively, which isindistinguishable from unlabeled cells. In contrast, PDAD-MNPs and OLS-MNPs showed T2 relaxation times thatremained low (84 ms ± 3 ms and 87 ms ± 4 ms, respectively).Converting T2 map raw data into numerical values allows aquantification of MNP imaging performance. T2 relaxation rates(R2) of MNPs decreased with decreasing cell numbers seeded(Figure 5, B). PSS-MNPs and Chit-MNPs displayed significantlylower R2 values at 103 cells imaged (9.8 s-1 and 8.55 s-1,respectively) when compared with PDAD-, PEI-, OLS-, andDex-MNPs (12 s-1 ± 0.8 s-1).
To evaluate detection limits of labeled cells, highly sensitiveT2⁎ three-dimensional gradient echo scans were performed. Asoutlined in Figure 5, C, 20 scan slices within drill holes ofagarose phantoms were used to calculate image stacks toeffectively display the sum of signal reduction per sample(Figure 5, D). MNPs generate a negative contrast; thus R2relaxation rates (Figure 5, A) and contrast in T2⁎-weighted MRI(Figure 5, D) were not comparable at highest cell densities wheresignal intensity had basically reached zero. Quantification of T2⁎
contrast and R2 values showed that the intracellular ironconcentration (40 – 80 pg/cell) had less influence than the ironpackaging within cells (Figure 4, C). PDAD-MNPs and OLS-MNPs, the 2 particles with the highest iron packaging density,resulted in the strongest MRI contrast at low cell numbers (103
cells per drill hole). It is interesting to note that the MNPs withthe highest total iron uptake (PSS-MNPs, Chit-MNPs) resultedin the lowest R2 values and diminished T2⁎ detectability.
To quantify signal reduction due to iron oxide incorporationwithin cells, CNR was calculated from T2⁎ signals (Figure 5, E).PDAD-MNPs and OLS-MNPs showed highest CNRs down toa minimum detectable cell concentration of 102 cells, makingthem particularly attractive MNPs to image low numbers of
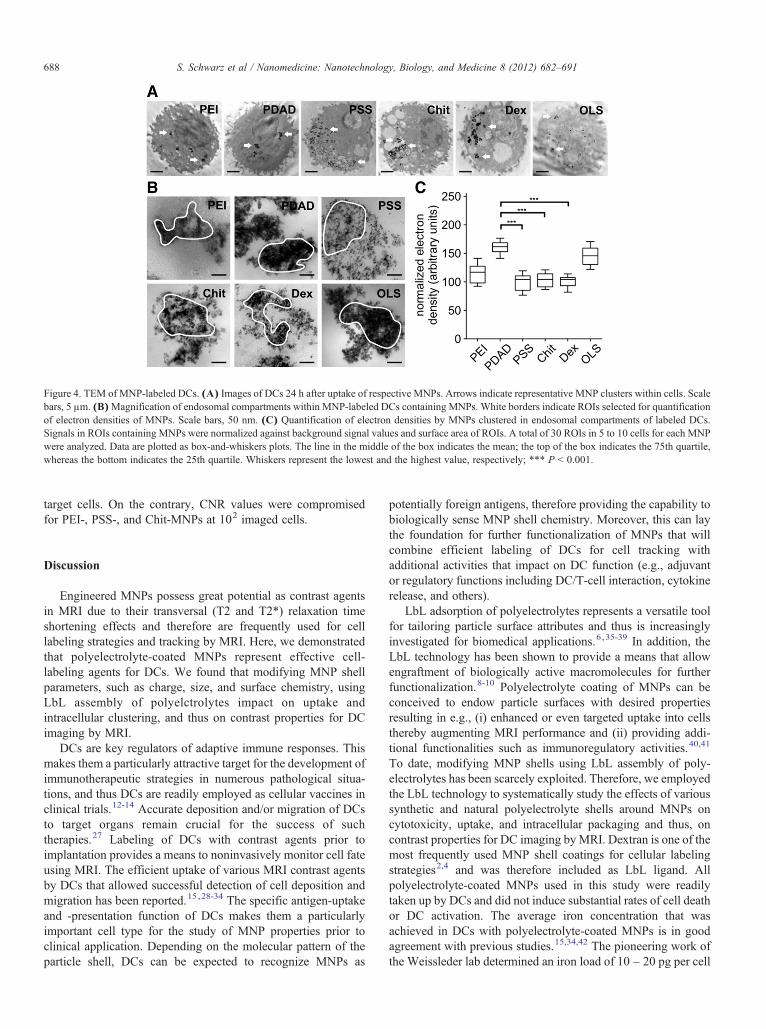
Figure 4. TEM of MNP-labeled DCs. (A) Images of DCs 24 h after uptake of respective MNPs. Arrows indicate representative MNP clusters within cells. Scalebars, 5 μm. (B)Magnification of endosomal compartments within MNP-labeled DCs containing MNPs. White borders indicate ROIs selected for quantificationof electron densities of MNPs. Scale bars, 50 nm. (C) Quantification of electron densities by MNPs clustered in endosomal compartments of labeled DCs.Signals in ROIs containing MNPs were normalized against background signal values and surface area of ROIs. A total of 30 ROIs in 5 to 10 cells for each MNPwere analyzed. Data are plotted as box-and-whiskers plots. The line in the middle of the box indicates the mean; the top of the box indicates the 75th quartile,whereas the bottom indicates the 25th quartile. Whiskers represent the lowest and the highest value, respectively; ∗∗∗ P b 0.001.
688 S. Schwarz et al / Nanomedicine: Nanotechnology, Biology, and Medicine 8 (2012) 682–691
target cells. On the contrary, CNR values were compromisedfor PEI-, PSS-, and Chit-MNPs at 102 imaged cells.
Discussion
Engineered MNPs possess great potential as contrast agentsin MRI due to their transversal (T2 and T2⁎) relaxation timeshortening effects and therefore are frequently used for celllabeling strategies and tracking by MRI. Here, we demonstratedthat polyelectrolyte-coated MNPs represent effective cell-labeling agents for DCs. We found that modifying MNP shellparameters, such as charge, size, and surface chemistry, usingLbL assembly of polyelctrolytes impact on uptake andintracellular clustering, and thus on contrast properties for DCimaging by MRI.
DCs are key regulators of adaptive immune responses. Thismakes them a particularly attractive target for the development ofimmunotherapeutic strategies in numerous pathological situa-tions, and thus DCs are readily employed as cellular vaccines inclinical trials.12-14 Accurate deposition and/or migration of DCsto target organs remain crucial for the success of suchtherapies.27 Labeling of DCs with contrast agents prior toimplantation provides a means to noninvasively monitor cell fateusing MRI. The efficient uptake of various MRI contrast agentsby DCs that allowed successful detection of cell deposition andmigration has been reported.15,28-34 The specific antigen-uptakeand -presentation function of DCs makes them a particularlyimportant cell type for the study of MNP properties prior toclinical application. Depending on the molecular pattern of theparticle shell, DCs can be expected to recognize MNPs as
potentially foreign antigens, therefore providing the capability tobiologically sense MNP shell chemistry. Moreover, this can laythe foundation for further functionalization of MNPs that willcombine efficient labeling of DCs for cell tracking withadditional activities that impact on DC function (e.g., adjuvantor regulatory functions including DC/T-cell interaction, cytokinerelease, and others).
LbL adsorption of polyelectrolytes represents a versatile toolfor tailoring particle surface attributes and thus is increasinglyinvestigated for biomedical applications.6,35-39 In addition, theLbL technology has been shown to provide a means that allowengraftment of biologically active macromolecules for furtherfunctionalization.8-10 Polyelectrolyte coating of MNPs can beconceived to endow particle surfaces with desired propertiesresulting in e.g., (i) enhanced or even targeted uptake into cellsthereby augmenting MRI performance and (ii) providing addi-tional functionalities such as immunoregulatory activities.40,41
To date, modifying MNP shells using LbL assembly of poly-electrolytes has been scarcely exploited. Therefore, we employedthe LbL technology to systematically study the effects of varioussynthetic and natural polyelectrolyte shells around MNPs oncytotoxicity, uptake, and intracellular packaging and thus, oncontrast properties for DC imaging byMRI. Dextran is one of themost frequently used MNP shell coatings for cellular labelingstrategies2,4 and was therefore included as LbL ligand. Allpolyelectrolyte-coated MNPs used in this study were readilytaken up by DCs and did not induce substantial rates of cell deathor DC activation. The average iron concentration that wasachieved in DCs with polyelectrolyte-coated MNPs is in goodagreement with previous studies.15,34,42 The pioneering work ofthe Weissleder lab determined an iron load of 10 – 20 pg per cell

Figure 5. MRI contrast potential of polyelectrolyte-MNPs. Indicated numbers of MNP-labeled DCs were filled in drill holes of agarose phantoms and MRimages were acquired at 11.7 T. (A) Pseudocolor depiction of T2 relaxation times from quantitative T2 map scans. Corresponding color-code displayed at thebottom; T2 time in ms. (B) Transversal relaxation rates (R2) determined from T2 maps as a function of cell density. (C) and (D) T2⁎-weighted three-dimensional gradient echo MRI. Hypointense pixels represent signal reduction by MNP-labeled cells. Representative images from 1 out of 3 independentexperiments are shown. (C) Lateral view of a phantom showing samples of OLS-MNP-labeled DCs. In addition, 20MR slices (indicated by white lines) of the z-plane that comprise the cell-loaded area were used to calculate signal intensities. (D) Image stacks of 20 MR slices as in (C) from drill holes filled with MNP-labeled DCs as indicated. (E) CNR of signal intensities obtained from T2⁎-weighted three-dimensional MR images as shown in (C) and (D). Plotted data aremean values ± SD (n = 3).
689S. Schwarz et al / Nanomedicine: Nanotechnology, Biology, and Medicine 8 (2012) 682–691
after labeling hematopoietic cells with MNPs to be sufficient fordetection by MRI after magnetic separation.43 As shown here,MNP-labeled DCs exceed this threshold by far and indepen-dently of the net charge of the polyelectrolytes, which isattributed to the potent uptake mechanisms of DCs.44 The uptakecapacity of DCs is comparable with that of other professionalphagocytes of the immune system such as monocytes andmacrophages. Heyn et al found around 60 pg Fe/cell using amouse macrophage cell line.45 In human monocytes freshlyisolated from peripheral blood, up to 50 pg Fe/cell wereachieved.46 Comparing various MNPs, the study by Metz et alrevealed that the highly variable iron load found in monocyteswas influenced by size and surface charge of the MNPs.46
Interestingly, such a MNP-dependent high variability in the ironload has also been described in other cellular systems, such asmouse embryonic stem cells and neural progenitor cells.42,47
The amount of cellular iron load is a critical parameter thatinfluences MRI contrast potential. However, the observeddifferences in MRI contrast-agent properties of polyelectrolyte-coated MNPs were not related to the total amount of irontaken up by DCs. For example, Chit-MNPs yielded highestiron concentration in DCs but showed inferior performance inMRI. Cellular distribution of MNPs has been recognized asanother important aspect that impacts on MRI contrast due tomagnetic susceptibility changes within labeled cells.25,26 Ironoxide-based particles influence MRI contrast due to changes inlocal magnetic field homogeneity (T2⁎ relaxation time) thatdepends on the magnetic moment and/or the size of the singleparticle. Thus, agglomeration of nano-sized particles withinlabeled cells can potentially contribute to magnetic suscepti-bility changes that influences T2⁎ relaxation time. Indeed, wefound that R2 values and T2⁎ signals relate to intracellular

690 S. Schwarz et al / Nanomedicine: Nanotechnology, Biology, and Medicine 8 (2012) 682–691
iron deposition within endosomal compartments of DCs.PDAD-MNPs and OLS-MNPs were densely packed withinendosomal structures as shown using TEM, resulting in alarger magnetic susceptibility effect (T2⁎) when comparedwith loosely packed MNPs such as PSS-, Chit-, and Dex-MNPs. Accordingly, the CNR of DCs labeled with Chit-MNPsor PSS-MNPs was compromised, illustrating elevated cell-detection limits. Dextran-coated MNPs revealed a solidperformance as contrast agent for MRI as expected fromprevious studies.29,30,33,34,42 However, superior MRI contrastproperties were achieved using PDAD for polylectrolytecoating of MNPs. The underlying mechanism that accountsfor the different intracellular distribution remains to beelucidated. DCs act as sentinels of the immune system andare therefore highly equipped for efficient uptake andprocessing of foreign antigens.44 Uptake pathways includephagocytosis, macropinocytosis, and receptor-mediated endo-cytosis that could be differentially encountered by MNPs,depending on the molecular pattern of the particle shell.Hence, MNPs that differ in size, charge, and surface chemistrycould be differentially directed towards distinct antigen-processing pathways. Furthermore, it is conceivable thatMNP resistance to such cell metabolic processes is determinedby the MNP-shell stability. Less stable MNP shells could, forexample, facilitate agglomeration of the iron oxide coreswithin endosomal compartments of DCs resulting in moredense clusters.
In summary, we show that surface characteristics of MNPformulations that impact on uptake and sub-cellular localizationcan be used for modulating MR imaging properties. LbLmodification of MNP shells represents a particularly attractivetool for tailoring particle surface chemistry. Shell coatings, suchas PDAD and OLS, allow efficient uptake into target cells andprovide high intracellular packaging densities that translate intoexcellent MR imaging characteristics. Understanding how cellsperceive, take up, and “store” MNPs within confined endosomalvesicles will aid in optimizing contrast agents for molecularimaging in the future.
Acknowledgments
The authors would like to thank Y. Yoshioka (BiofunctionalImaging Laboratory, Immunology Frontier Research Center(IFReC), Osaka, Japan) and E. Reimhult (Institute of Nanobio-technology, University of Natural Resources and Life Sciences,Vienna, Austria) for critical reading of the manuscript. Theauthors thank S. Mitzka, H. Koenigs and M. Tappe (UniversityClinic, RWTH Aachen, Germany) for technical assistance andM. Aswendt and P. Boehm-Sturm (Max Planck Institute forNeurological Research, Cologne, Germany) for their experi-mental support.
Appendix A. Supplementary data
Supplementary data associated with this article can be found,in the online version, at doi:10.1016/j.nano.2011.08.010.
References
1. Pankhurst QA, Connolly J, Jones SK, Dobson J. Applications of magneticnanoparticles in biomedicine. J Phys D Appl Phys 2003;36:R167-81.
2. Gupta AK, Gupta M. Synthesis and surface engineering of iron oxidenanoparticles for biomedical applications. Biomaterials 2005;26:3995-4021.
3. Sosnovik DE, Weissleder R. Emerging concepts in molecular MRI. CurrOpin Biotechnol 2007;18:4-10.
4. Sun C, Lee JSH, Zhang M. Magnetic nanoparticles in MR imaging anddrug delivery. Adv Drug Deliv Rev 2008;60:1252-65.
5. McBain SC, Yiu HH, Dobson J. Magnetic nanoparticles for gene anddrug delivery. Int J Nanomedicine 2008;3:169-80.
6. Wong JE, Gaharwar AK, Muller-Schulte D, Bahadur D, Richtering W.Magnetic nanoparticle-polyelectrolyte interaction: a layered approachfor biomedical applications. J Nanosci Nanotechnol 2008;8:4033-40.
7. Decher G. Fuzzy nanoassemblies: toward layered polymeric multi-composites. Science 1997;277:1232-7.
8. Derveaux S, Stubbe BG, Roelant C, Leblans M, De Geest BG,Demeester J, et al. Layer-by-layer coated digitally encoded microcarriersfor quantification of proteins in serum and plasma. Anal Chem2008;80:85-94.
9. Del Mercato LL, Abbasi AZ, Parak WJ. Synthesis and characterizationof ratiometric ion-sensitive polyelectrolyte capsules. Small 2011;7:351-63.
10. Macdonald ML, Samuel RE, Shah NJ, Padera RF, Beben YM,Hammond PT. Tissue integration of growth factor-eluting layer-by-layer polyelectrolyte multilayer coated implants. Biomaterials2011;32:1446-53.
11. Steinman RM, Banchereau J. Taking dendritic cells into medicine.Nature 2007;449:419-26.
12. Figdor CG, de Vries IJ, Lesterhuis WJ, Melief CJ. Dendritic cellimmunotherapy: mapping the way. Nat Med 2004;10:475-80.
13. Palucka K, Banchereau J, Mellman I. Designing vaccines based onbiology of human dendritic cell subsets. Immunity 2010;33:464-78.
14. Srinivas M, Aarntzen E, Bulte JWM, Oyen WJ, Heerschap A, de VriesIJM, et al. Imaging of cellular therapies. Adv Drug Deliv Rev2010;62:1080-93.
15. Schwarz S, Fernandes F, Sanroman L, Hodenius M, Lang C,Himmelreich U, et al. Synthetic and biogenic magnetite nanoparticlesfor tracking of stem cells and dendritic cells. J Magn Magn Mater2009;321:1533-8.
16. Hoehn M, Himmelreich U, Kruttwig K, Wiedermann D. Molecular andcellular MR imaging: potentials and challenges for neurologicalapplications. J Magn Reson Imaging 2008;27:941-54.
17. Ai H, Liu G, Wang ZY, Lu J, Xia CC, Gao FB, et al. Low molecularweight alkyl-polycation wrapped magnetite nanoparticle clusters as MRIprobes for stem cell labeling and in vivo imaging. Biomaterials2011;32:528-37.
18. Wong JE, Gaharwar AK, Muller-Schulte D, Bahadur D, Richtering W.Layer-by-layer assembly of a magnetic nanoparticle shell on athermoresponsive microgel core. J Magn Magn Mater 2007;311:219-23.
19. Hodenius MAJ, Niendorf T, Krombach GA, Richtering W, Eckert T,Lueken H, et al. Synthesis, physicochemical characterization and MRrelaxometry of aqueous ferrofluids. J Nanosci Nanotechnol 2008;8:2399-409.
20. Wong JE, Gaharwar AK, Muller-Schulte D, Bahadur D, Richtering W.Dual-stimuli responsive PNiPAM microgel achieved via layer-by-layerassembly: magnetic and thermoresponsive. J Colloid Interface Sci2008;324:47-54.
21. Hieronymus T, Gust TC, Kirsch RD, Jorgas T, Blendinger G,Goncharenko M, et al. Progressive and controlled development ofmouse dendritic cells from Flt3+CD11b+ progenitors in vitro. JImmunol 2005;174:2552-62.
22. Wong JE, Muller CB, Diez-Pascual AM, Richtering W. Study of layer-by-layer films on thermoresponsive nanogels using temperature-

691S. Schwarz et al / Nanomedicine: Nanotechnology, Biology, and Medicine 8 (2012) 682–691
controlled dual-focus fluorescence correlation spectroscopy. J PhysChem B 2009;113:15907-13.
23. Becker C, Hodenius M, Blendinger G, Sechi A, Hieronymus T. M¸ller-Schulte D, et al. Uptake of magnetic nanoparticles into cells for celltracking. J Magn Magn Mater 2007;311:234-7.
24. Riemer J, Hoepken HH, Czerwinska H, Robinson SR, Dringen R.Colorimetric ferrozine-based assay for the quantitation of iron in culturedcells. Anal Biochem 2004;331:370-5.
25. Walter GA, Santra S, Thattaliyath B. Grant SC. (Super)paramagneticnanoparticles: applications in noninvasive mr imaging of stem celltransfer. In: Bulte JW, Modo M, editors. Nanoparticles in BiomedicalImaging. Heidelberg: Springer; 2008. p. 91-140.
26. Himmelreich U, Dresselaers T. Cell labeling and tracking for experimentalmodels using magnetic resonance imaging. Methods 2009;48:112-24.
27. Adema GJ, de Vries IJ, Punt CJ, Figdor CG. Migration of dendritic cellbased cancer vaccines: in vivo veritas? Curr Opin Immunol 2005;17:170-4.
28. Ahrens ET, Feili-HaririM,XuH,GenoveG,Morel PA.Receptor-mediatedendocytosis of iron-oxide particles provides efficient labeling of dendriticcells for in vivo MR imaging. Magn Reson Med 2003;49:1006-13.
29. de Vries IJ, Lesterhuis WJ, Barentsz JO, Verdijk P, van Krieken JH,Boerman OC, et al. Magnetic resonance tracking of dendritic cells inmelanoma patients for monitoring of cellular therapy. Nat Biotechnol2005;23:1407-13.
30. Baumjohann D, Hess A, Budinsky L, Brune K, Schuler G, Lutz MB. Invivo magnetic resonance imaging of dendritic cell migration into thedraining lymph nodes of mice. Eur J Immunol 2006;36:2544-55.
31. Himmelreich U, Aime S, Hieronymus T, Justicia C, Uggeri F, Zenke M,et al. A responsive MRI contrast agent to monitor functional cell status.Neuroimage 2006;32:1142-9.
32. LimYT,NohYW,Han JH, Cai QY, YoonKH, Chung BH. Biocompatiblepolymer-nanoparticle-based bimodal imaging contrast agents for thelabeling and tracking of dendritic cells. Small 2008;4:1640-5.
33. Briley-Saebo KC, Leboeuf M, Dickson S, Mani V, Fayad ZA, PaluckaAK, et al. Longitudinal tracking of human dendritic cells in murinemodels using magnetic resonance imaging. Magn Reson Med2010;64:1510-9.
34. Kobukai S, Baheza R, Cobb JG, Virostko J, Xie JP, Gillman A, et al.Magnetic nanoparticles for imaging dendritic cells. Magn Reson Med2010;63:1383-90.
35. De Geest BG, Sanders NN, Sukhorukov GB, Demeester J, De Smedt SC.Release mechanisms for polyelectrolyte capsules. Chem Soc Rev2007;36:636-49.
36. del Mercato LL, Rivera-Gil P, Abbasi AZ, Ochs M, Ganas C, Zins I,et al. LbL multilayer capsules: recent progress and future outlook fortheir use in life sciences. Nanoscale 2010;2:458-67.
37. Such GK, Johnston AP, Caruso F. Engineered hydrogen-bondedpolymer multilayers: from assembly to biomedical applications. ChemSoc Rev 2011;40:19-29.
38. Ai H, Liu G, Tian J, Liu C, Gu ZW, Gou JL, et al. Cell labelingefficiency of layer-by-layer self-assembly modified silica nanoparticles.J Mater Res 2009;24:1317-21.
39. Ai H, Liu GL, Xia CC, Wang ZY, Lv F, Gao FB, et al. Magneticresonance imaging probes for labeling of chondrocyte cells. J Mater SciMater M 2011;22:601-6.
40. De Rose R, Zelikin AN, Johnston APR, Sexton A, Chong SF, Cortez C,et al. Binding, internalization, and antigen presentation of vaccine-loaded nanoengineered capsules in blood. Adv Mater 2008;20:4698-703.
41. Sexton A, Whitney PG, Chong SF, Zelikin AN, Johnston APR, De RoseR, et al. A protective vaccine delivery system for in vivo t cellstimulation using nanoengineered polymer hydrogel capsules. ACSNano 2009;3:3391-400.
42. Kustermann E, Himmelreich U, Kandal K, Geelen T, Ketkar A,Wiedermann D, et al. Efficient stem cell labeling for MRI studies.Contrast Media Mol Imaging 2008;3:27-37.
43. Lewin M, Carlesso N, Tung CH, Tang XW, Cory D, Scadden DT, et al.Tat peptide-derivatized magnetic nanoparticles allow in vivo trackingand recovery of progenitor cells. Nat Biotechnol 2000;18:410-4.
44. Trombetta ES, Mellman I. Cell biology of antigen processing in vitro andin vivo. Annu Rev Immunol 2005;23:975-1028.
45. Heyn C, Ronald JA, Mackenzie LT, MacDonald IC, Chambers AF, RuttBK, et al. In vivo magnetic resonance imaging of single cells in mousebrain with optical validation. Magn Reson Med 2006;55:23-9.
46. Metz S, Bonaterra G, Rudelius M, Settles M, Rummeny EJ, Daldrup-Link HE. Capacity of human monocytes to phagocytose approved ironoxide MR contrast agents in vitro. Eur Radiol 2004;14:1851-8.
47. Soenen SJH, Himmelreich U, Nuytten N, De Cuyper M. Cytotoxiceffects of iron oxide nanoparticles and implications for safety in celllabelling. Biomaterials 2011;32:195-205.