Titrimetric determination of anionic surfactant content in ...
11
Turk J Chem 36 (2012) , 545 – 555. c T ¨ UB ˙ ITAK doi:10.3906/kim-1109-42 Titrimetric determination of anionic surfactant content in anionic/nonionic surfactant mixture solution by anionic surfactant selective electrode Junwei WANG, Zhiping DU, Wanxu WANG ∗ , Wei XUE China Research Institute of Daily Chemical Industry, Taiyuan, 030001, Shanxi Province, P. R.-CHINA e-mail: [email protected] Received: 26.09.2011 A new polyvinyl chloride (PVC) membrane electrode for determining the concentration of sodium dodecylsulfate (SDS) based on a neutral ion pair complex of dodecyltrimethylammonium-dodecylsulfate (DTA + DS − ) as ionophore is described in this paper. The construction and characteristic performance of the PVC membrane electrode displays a Nernstian slope of –56.9 ± 0.3 mV/decade in the concentration range of 2.0 × 10 −6 to 3.2 × 10 −3 mol L −1 and a detection limit of 1.6 × 10 −6 mol L −1 . The lifetime of the electrode is more than 3 months without showing significant change in the values of slope or linear concentration range. The electrode has wide pH range of application and short response time. The electrode shows selective response to DS − and poor response to common anions except DBS − . The electrode was used as an end point indicator electrode for the determination of SDS content in sodium dodecylsulfate/nonylphenol ethoxylates (SDS/NP-10) mixture solution by potentiometric titration using Hyamine standard solution as titrant. The maximum mol ratio (n (NP −10) :n (SDS) ) when SDS cannot be determined in SDS/NP-10 mixture solution can be obtained. Key Words: Anionic surfactant selective electrode, anionic surfactant, mixture solution, potentiometric titration Introduction Anionic surfactants are essential for our daily life, and they are widely used in washing agents, household detergents, and personal care products. Due to their extensive use, it is quite usual to find those anions in ∗ Corresponding author 545
-
Upload
khangminh22 -
Category
Documents
-
view
3 -
download
0
Transcript of Titrimetric determination of anionic surfactant content in ...

Turk J Chem
36 (2012) , 545 – 555.
c© TUBITAK
doi:10.3906/kim-1109-42
Titrimetric determination of anionic surfactant content
in anionic/nonionic surfactant mixture solution by
anionic surfactant selective electrode
Junwei WANG, Zhiping DU, Wanxu WANG∗, Wei XUE
China Research Institute of Daily Chemical Industry, Taiyuan, 030001,Shanxi Province, P. R.-CHINAe-mail: [email protected]
Received: 26.09.2011
A new polyvinyl chloride (PVC) membrane electrode for determining the concentration of sodium
dodecylsulfate (SDS) based on a neutral ion pair complex of dodecyltrimethylammonium-dodecylsulfate
(DTA+DS−) as ionophore is described in this paper. The construction and characteristic performance of
the PVC membrane electrode displays a Nernstian slope of –56.9 ± 0.3 mV/decade in the concentration
range of 2.0 × 10⁻⁶ to 3.2 × 10⁻³ mol L−1 and a detection limit of 1.6 × 10⁻⁶ mol L−1 . The
lifetime of the electrode is more than 3 months without showing significant change in the values of slope
or linear concentration range. The electrode has wide pH range of application and short response time.
The electrode shows selective response to DS− and poor response to common anions except DBS− . The
electrode was used as an end point indicator electrode for the determination of SDS content in sodium
dodecylsulfate/nonylphenol ethoxylates (SDS/NP-10) mixture solution by potentiometric titration using
Hyamine standard solution as titrant. The maximum mol ratio (n (NP−10) : n (SDS)) when SDS cannot be
determined in SDS/NP-10 mixture solution can be obtained.
Key Words: Anionic surfactant selective electrode, anionic surfactant, mixture solution, potentiometric
titration
Introduction
Anionic surfactants are essential for our daily life, and they are widely used in washing agents, householddetergents, and personal care products. Due to their extensive use, it is quite usual to find those anions in
∗Corresponding author
545

Titrimetric determination of anionic surfactant content in..., J. WANG, et al.
the environment. Therefore, it is important to determine the concentration of these surfactants accurately invarious samples. Traditional analysis methods of anionic surfactant concentration require tedious proceduresor the use of large amounts of undesired solvents.1−4 An alternative to these methods is the use of electrodes(such as ion-selective electrodes5−10 or ion-selective field-effect transistors).11−15 Potentiometric methods us-ing ion-selective electrodes provide many advantages such as low cost, sensitive, reliability, reproducibility,and non-destructive analysis.16−18 Moreover, ion-selective electrodes are simple analytical devices for deter-mining monomer concentrations of surfactants in solution by direct potentiometry according to a Nernstianequation19,20 or potentiometric titration. Surfactant titrations are based on an antagonist reaction, where anionic surfactant reacts with an oppositely charged ion, forming a water insoluble salt (ion pair),21−24 when theoppositely charged ion surfactants react with each other at equal mol, the potential of the electrode has greatchange, and the end-point can be detected by the electrode.
The use of surfactant selective electrodes for the potentiometric determination of anionic surfactantsconcentration has been described in several papers. The surfactant selective electrode based on single walledcarbon nanotubes constructed by Najafi et al.25 was used to determine the concentration of CTA+ and DS− .Juan Soto and co-workers1,26 constructed an ion-selective electrode for anionic surfactants using a new aza-oxa-cycloalkane and cyclam derivative as active ionophore in PVC membrane.
The present work investigates the preparation of stable, long life, and fast response of an anionic surfactantselective electrode. The PVC membrane electrode is based on DTA+DS− ion pair as the ionophore and DOPas plasticizer. The accurate concentration of anionic surfactants can be determined by direct potentiometry,and also the content of anionic surfactants in anionic/nonionic surfactant mixture solution can be detected bypotentiometric titration.
Experimental
Sodium dodecylsulfate (SDS), dodecyl trimethyl ammonium bromide (DTAB), Hyamine, sodium dodecylben-zenesulfonate (SDBS), and high molecular weight PVC were from Aldrich (analytical grade). Bis-(2-ethylhexyl)phthalate (DOP) and tetrahydrofuran (THF) were both from Tianjin Kermel Chemical Reagent Company. Allother reagents used for the preparation of the electrode were analytical grade. Distilled water was used for thepreparation of the solutions and for the cleaning of all glassware and apparatus in the experiments.
The potentiometric measurements were performed with a pHs 3C pH/mV meter, and a saturatedcalomel electrode (SCE) was used as external reference electrode. The pHs 3C pH/mV meter and saturatedcalomel electrode were purchased from Shanghai Precision and Scientific Instrument Co., Ltd. The indicatorelectrode used for potentiometric titrations was a self-made anionic surfactant selective electrode. Potentiometrictitrations were conducted with the help of an automatic burette and a titriprocessor (Beijing XianquweifengTechnology Development Company) using a 25.0 ± 0.1 ◦C water-thermostated vessel and an automatic burette.
The surfactant ion-selective electrode was made according to the classical method described as theliterature27 and the preparation can be formulated as follows.
The DTA+DS− ion pair was prepared by pouring together equimolar amounts of SDS and DTAB in hotaqueous solution. The ion pair DTA+DS− was formed as a white precipitate, which was filtered off, washedwith distilled water, and recrystallized twice from hot acetone.
546
Titrimetric determination of anionic surfactant content in..., J. WANG, et al.
The membranes with PVC:DOP 2:3 contained 1.0 × 10⁻³ mol DTA+DS− ion pair/kg (PVC+DOP).PVC, DOP, and DTA+DS− ion pair were dissolved in tetrahydrofuran, and then poured into a flat-bottomedglass dish. Tetrahydrofuran evaporated from the solution at room temperature for 48 h, and then the requiredmembrane was obtained.
A disk of 0.5 cm in radius was cut from the obtained membrane and attached to the end of a PVC tubeusing the solution of PVC dissolved in THF as adhesive. The Ag/AgCl electrode was used as inner reference
electrode. As inner solution 1.0 × 10⁻³ mol L−1 SDS and 1.0 × 10⁻³ mol L−1 KCl mixture solution wasused. Before the first use the electrode was preconditioned in 1.0 × 10⁻³ mol L−1 SDS solution for 24 h.
The external reference electrode was a saturated calomel electrode (SCE), and the self-made electrode wasused for all emf measurements. Potentiometric measurements were carried out by the following cell assembly:SCE | Saturated KCl solution | sample solution | PVC membrane | inner solution | Ag/AgCl. All potentialmeasurements were carried out on a pHs 3C pH/mV meter.
The response to SDS was measured in the concentration range of 1.7 × 10⁻⁷ to 1.9 × 10⁻² mol L−1
SDS solutions, and also 1.0 × 10⁻⁶ to 1.0 × 10⁻³ mol L−1 NP-10 solutions were measured using the electrode.The indicator electrode was stored in air without drawing out the inner solution during the life time studies.Potentiometric selectivity coefficients were determined according to the fixed interference method using 2.5 ×10⁻² mol L−1 solution of interfering ion. Calibration curves were constructed by plotting the potential (E)versus the logarithm of the SDS concentration. The volume of tested solution used for titration was 25.0 mL.The titrant dosage rate was 0.1 mL s−1 . The titrants were 4.12 × 10⁻³ and 4.88 × 10⁻² mol L−1 Hyaminestandard solutions. They were used for the titrations of 5.0 × 10⁻⁴ and 5.0 × 10⁻³ mol L−1 SDS mixturesolution, respectively. All the measurements and titration were performed at 25.0 ± 0.1 ◦C.
Results and discussion
Response behavior of the electrode
The potentiometric analysis method with an anionic surfactant selective electrode was developed for the deter-mination of anionic surfactants. Surfactant concentration and potential comply with the following Nernstianequation:
E = E◦ + 2.303RT
zFlog aDS− (1)
where E stands for the equilibrium electrode potential, E◦ is the standard electrode formal potential, R isthe gas constant, T is the temperature, z is the ion charge number, F is the Faraday’s constant, and aDS - isthe activity of SDS solution. Therefore, the surfactant concentration can be obtained from the potentiometrymeasured using a surfactant ion-selective electrode.
The response characteristics of the anionic surfactant electrode in SDS and NP-10 solutions are shownin Figure 1. It can be seen that the electrode had good Nernstian response to different concentration of SDS.The potential response to various concentration of NP-10, however, was constant, which did not comply withthe Nernstian equation. The results indicated that the electrode had good selectivity to SDS.
547

Titrimetric determination of anionic surfactant content in..., J. WANG, et al.
1E-7 1E-6 1E-5 1E-4 1E-3 0.01 0.1150
200
250
300
350
400
c ( mol L-1
)
E (
mV
)
SDS NP-10
Figure 1. Potential response of anionic surfactant selective electrode to SDS solutions (�) and NP-10 solutions (•).
Statistical evaluation of the electrode characteristics for SDS is given in Table 1.
Table 1. Response parameters of anionic surfactant selective electrode for SDS solution.
Parameters Values
Slope (mV/decade) –56.9 ± 0.3
Correlation coefficient (r) 0.9996
Detection limit (mol L−1) 1.6 × 10⁻⁶
Linear concentration range (mol L−1) 2.0 × 10⁻⁶ ∼3.2 × 10⁻³
The slope value and correlation coefficients were calculated from the linear region of the calibration graphof the measurements using linear regression analysis. Detection limit was defined as the concentration of SDScorresponding to the intersection of the extrapolated linear segments of the calibration graph,28 which was 1.6× 10⁻⁶ mol L−1 . The electrode showed linear Nernstian response with the slope of –56.9 ± 0.3 mV/decade
in the concentration range of 2.0 × 10⁻⁶ to 3.2 × 10⁻³ mol L−1 for SDS.
Response time
The response time of the electrode was measured after successive immersion of the electrode in a series ofdifferent concentration SDS solutions from 1.0 × 10⁻⁶ to 1.0 × 10⁻³ mol L−1 . The response time of theelectrode was evaluated by measuring the time required to achieve a steady-state potential.29,30
As shown in Figure 2, a response time about 30 s was found as the time required for the electrode toreach a potential within ±1 mV of the final equilibrium. The standard deviation of the response time calculatedfrom 4 measurements was ±3 s, and so the response time of the electrode was 30 ± 3 s.
Effect of pH
The influence of pH on the potential response of the electrode was studied at a fixed concentration of SDS of 1× 10⁻⁴ mol L−1 over the pH range of 2.0-12.3.
548

Titrimetric determination of anionic surfactant content in..., J. WANG, et al.
0 1 2 3 4 5 6 7 8200
240
280
320
360
400
5E-4mol L-1
1E-3mol L-1
1E-4mol L-1
1E-5mol L-1
1E-6mol L-1
E (
mV
)
Time (min)
2 4 6 8 10 12240
280
320
360
E (
mV
)
pH
Figure 2. Response time of anionic surfactant selective
electrode for step changes in different concentration SDS
solutions.
Figure 3. Effect of pH on the potentials of anionic sur-
factant selective electrode in 1 × 10⁻⁴ mol L−1 SDS so-
lution.
At low pH, DS− combined with H+ and then HDS formed. The concentration of DS− was decreasedin the solution, which is probably related to the increasing of HDS concentration. When the pH values werehigher than 9.6, the potential of the electrode was also affected. Potential increased most likely due to the factthat the membrane had a response to the OH− , because of OH− ions competing with DS− ions in such amedium. Therefore, potentials remained constant between pH 4.4-9.6 as illustrated in Figure 3, and pH 7 waschosen as optimum pH for the studies.1
Life time of the electrode
The electrode characteristics obtained at various time intervals are illustrated in Table 2 and Figure 4. Theelectrode exhibited good reproducibility in slope, linear concentration range, and detection limit for 14 weeks,
0 10 20 30 40 50 60 70 80 90 100 110 1200
-20
-40
-60
slop
e (m
V/d
ecad
e)
days
Figure 4. Plot of the slope of anionic surfactant selective electrode in the presence of DS− vs. time (days).
549
Titrimetric determination of anionic surfactant content in..., J. WANG, et al.
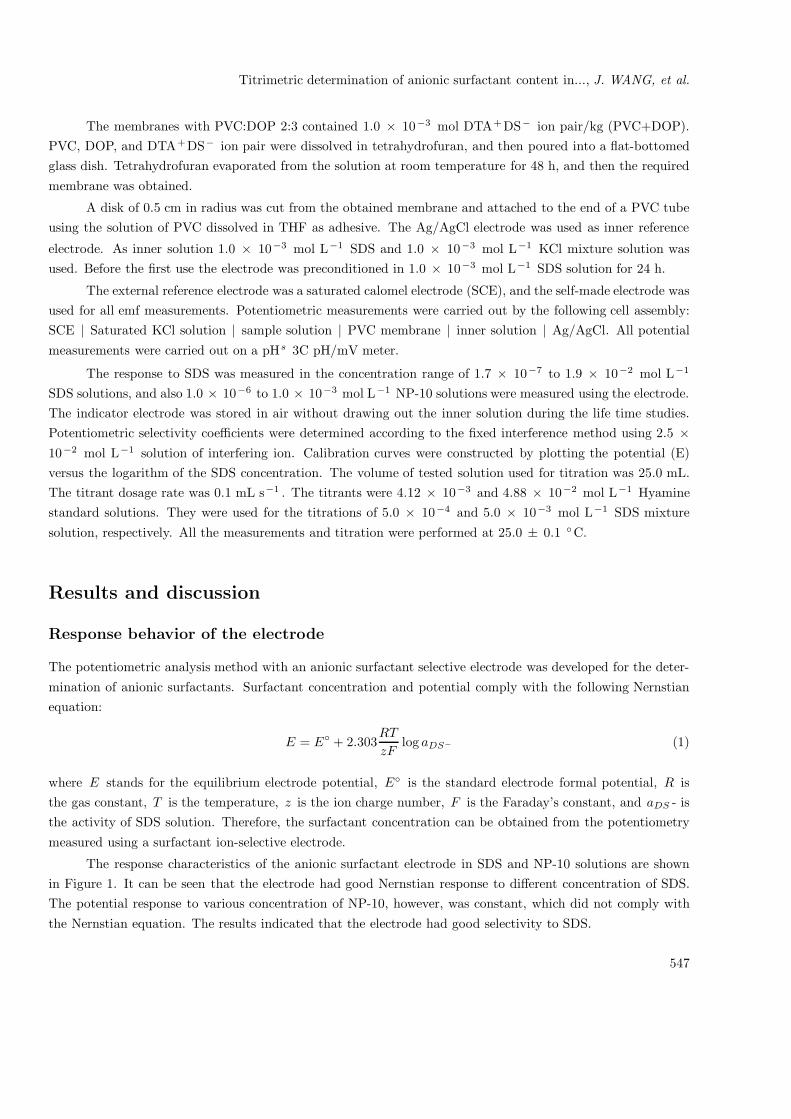
but drifts of the slope and detection limit were observed after 15 weeks. The life time of the electrode was morethan 3 months.1
Table 2. The life time study of anionic surfactant selective electrode.
Period Slope Linear range Detection limit(weeks) (mV/decade) (mol L−1) (mol L−1)
1 –56.9 2.0 × 10⁻⁶ to 3.2 × 10⁻³ 1.6 × 10⁻⁶
2 –55.8 1.9 × 10⁻⁶ to 3.1 × 10⁻³ 1.4 × 10⁻⁶
3 –56.2 2.1 × 10⁻⁶ to 3.0 × 10⁻³ 1.5 × 10⁻⁶
4 –55.4 2.2 × 10⁻⁶ to 3.3 × 10⁻³ 1.7 × 10⁻⁶
5 –55.9 1.9 × 10⁻⁶ to 3.4 × 10⁻³ 1.6 × 10⁻⁶
6 –55.1 2.1 × 10⁻⁶ to 3.3 × 10⁻³ 1.5 × 10⁻⁶
7 –54.9 2.2 × 10⁻⁶ to 3.5 × 10⁻³ 1.4 × 10⁻⁶
8 –55.7 2.2 × 10⁻⁶ to 3.3 × 10⁻³ 1.6 × 10⁻⁶
9 –56.1 2.0 × 10⁻⁶ to 3.4 × 10⁻³ 1.8 × 10⁻⁶
10 –54.8 1.9 × 10⁻⁶ to 3.2 × 10⁻³ 1.5 × 10⁻⁶
11 –55.3 2.2 × 10⁻⁶ to 3.4 × 10⁻³ 1.7 × 10⁻⁶
12 –54.7 2.1 × 10⁻⁶ to 3.2 × 10⁻³ 1.8 × 10⁻⁶
13 –54.2 2.4 × 10⁻⁶ to 3.4 × 10⁻³ 1.6 × 10⁻⁶
14 –53.5 2.9 × 10⁻⁶ to 3.5 × 10⁻³ 2.1 × 10⁻⁶
15 –48.5 4.1 × 10⁻⁶ to 3.2 × 10⁻³ 2.9 × 10⁻⁶
16 –42.1 6.6 × 10⁻⁶ to 3.5 × 10⁻³ 4.8 × 10⁻⁶
17 –35.4 9.4 × 10⁻⁶ to 4.0 × 10⁻³ 8.1 × 10⁻⁶
Determination of potentiometric selectivity coefficients
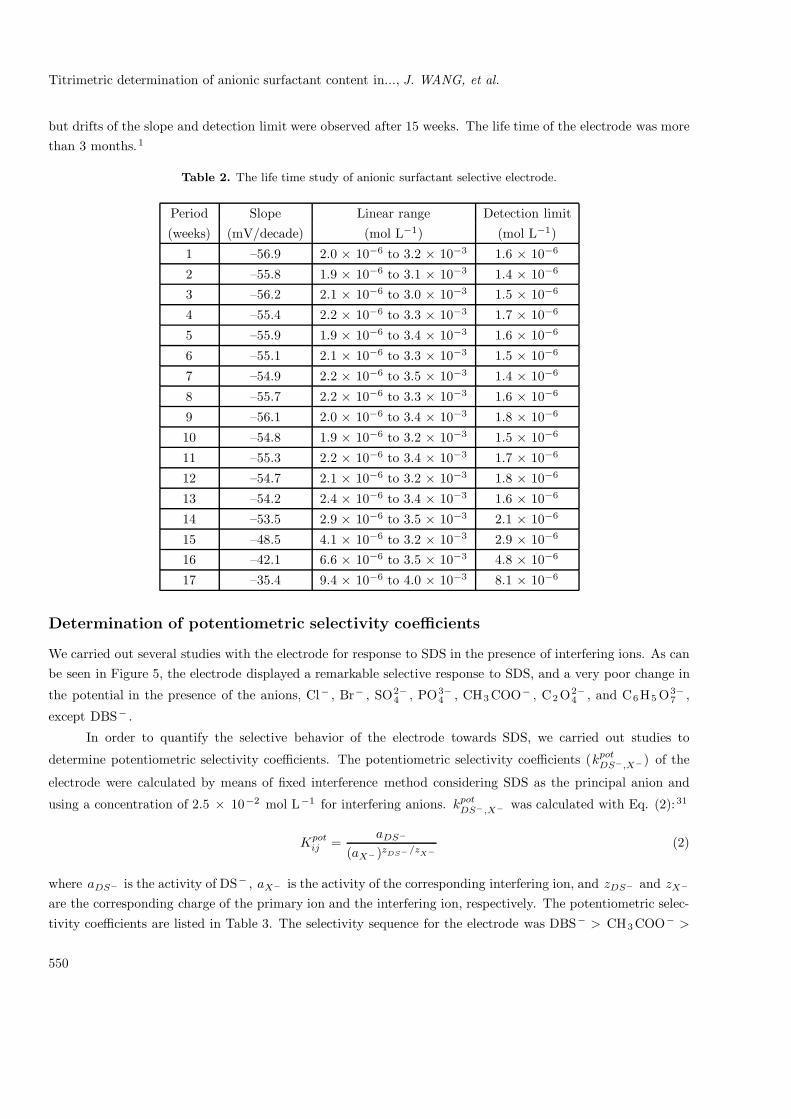
We carried out several studies with the electrode for response to SDS in the presence of interfering ions. As canbe seen in Figure 5, the electrode displayed a remarkable selective response to SDS, and a very poor change in
the potential in the presence of the anions, Cl− , Br− , SO2−4 , PO3−
4 , CH3 COO− , C2 O2−4 , and C6H5 O3−
7 ,
except DBS− .
In order to quantify the selective behavior of the electrode towards SDS, we carried out studies to
determine potentiometric selectivity coefficients. The potentiometric selectivity coefficients (kpotDS−,X−) of the
electrode were calculated by means of fixed interference method considering SDS as the principal anion and
using a concentration of 2.5 × 10⁻² mol L−1 for interfering anions. kpotDS−,X− was calculated with Eq. (2):31
Kpotij =
aDS−
(aX−)zDS−/zX−(2)
where aDS− is the activity of DS− , aX− is the activity of the corresponding interfering ion, and zDS− and zX−
are the corresponding charge of the primary ion and the interfering ion, respectively. The potentiometric selec-tivity coefficients are listed in Table 3. The selectivity sequence for the electrode was DBS− > CH3 COO− >
550
Titrimetric determination of anionic surfactant content in..., J. WANG, et al.
Cl− > Br− > C6 H5 O3−7 > C2 O2−
4 > SO2−4 > PO3−
4 . The logarithm of the potentiometric selectivity coef-
ficients lower than –3.0 except DBS− indicated that most of the anions would not disturb the determinationof SDS in real samples.
-7.5 -7.0 -6.5 -6.0 -5.5 -5.0 -4.5 -4.0 -3.5 -3.0200
240
280
320
360
400E
(m
V)
logc
Figure 5. Response of anionic surfactant selective electrode in the presence of certain anions: (�) SDS; (◦) SDBS;
(×) Cl− ; ( |) Br− ; (�) SO2−4 ; (-) PO3−
4 ; (�) CH3 COO− ; (�) C2 O2−4 ; (+) C6H5 O3−
7 .
Table 3. Potentiometric selective coefficients for anionic surfactant selective electrode.
Interfering ion kpotDS−,X−(log) Interfering ion kpot
DS−,X−(log)
Cl− –3.89 CH3COO− –3.55
Br− –4.24 C2O2−4 –4.72
SO2−4 –4.91 (C6H5O3−
7 )a –4.47
PO3−4 –5.06 DBS− 4.21
acitrate
Analytical application
Our investigations showed that the electrode cannot only be used for direct determination of SDS, but alsocan be used as an end-point indicator electrode in titration of SDS with Hyamine standard solution. As anexample, it was applied in the titration of SDS in SDS/NP-10 mixture solutions with Hyamine. The content ofSDS in the mixture solutions can be accurately determined by the electrode, and also the maximum mol ratio(n (NP−10) : n (SDS)) when SDS cannot be determined in SDS/NP-10 mixture solution can be obtained.
In order to determine the concentration of SDS and obtain the result of maximum mol ratio (n(NP−10) :
n (SDS)) when SDS cannot be determined in SDS/NP-10 mixture solutions. We fabricated 2 teams of SDS/NP-
10 mixture solutions (team 1 (samples 1-8) and team 2 (samples 9-16), the concentration of SDS was fixed as 5.0
× 10−4 mol L−1 and 5.0 × 10⁻³ mol L−1 respectively, and then the concentration of NP-10 in the mixturesolution increased in turn).
551

Titrimetric determination of anionic surfactant content in..., J. WANG, et al.
The electrode was used for the determination of SDS content in various mol ratio (n(NP−10) : n (SDS))
SDS/NP-10 mixture solutions by potentiometric titration in conjunction with SCE as reference electrode. Aseries of typical sigmoid shape titration curves obtained from the titration of SDS are shown in Figures 6and 7.
0 1 2 3 4 5
250
300
350
400
450
E (
mV
)
V (mL)
1 2 3 4 5 6 7 8
0 1 2 3 4150
200
250
300
350
E (
mV
)
V (mL)
9 10 11 12 13 14 15 16
Figure 6. Titration curves of SDS with Hyamine in
SDS/NP-10 mixture solutions. The concentration of SDS
was fixed as 5.0 × 10⁻⁴ mol L−1 in the mixture solutions.
The mole ratio (n (NPEO) : n (SDS)) of curve 1-8: 0; 1:100;
1:10; 1:1; 2:1; 3:1; 4:1; 10:1.
Figure 7. Titration curves of SDS with Hyamine in
SDS/NP-10 mixture solutions. The concentration of SDS
was fixed as 5.0 × 10⁻³ mol L−1 in the mixture solu-
tions. The mole ratio (n (NPEO) : n (SDS)) of curve 9-16:
0; 1:100; 1:10; 1:1; 2:1; 3:1; 4:1; 10:1.
Each titration volume estimated at the inflection point of the titration curve is shown in Tables 4 and 5.From Figures 6 and 7, it can be observed that with the increase in mol ratio (n(NP−10) : n (SDS)) the height of
the potential jump (ΔE/ΔV) in the titration curves decreased, and the titration curves became nearly planarwithout potential jump at last.
From Tables 4 and 5, it can be seen that the same results for the potential jump at the end-point oftitration of SDS can be detected, when the mol ratio (n(NP−10) : n (SDS)) was not more than 4:1 in both
teams of SDS/NP-10 mixture solutions. The main cause was probably the increase in NP-10, which baffled thediffusion of DS− to the electrode surface. The adsorption capacity of active DS− reduced and double electricitylayer of the electrode surface was disturbed, and so the potential jump decreased.
For the determination of SDS in commercial detergent, a 15-30 mg sample was dissolved in 2 mL ofmethanol and diluted to 100 mL with water and a 20 mL portion applied to the determination of SDS insamples by the electrode. The results of the potentiometric titration using the electrode were compared withthose obtained using 2-phase titration. As shown in Table 6, the results recorded by the potentiometric titrationare in good accordance with those given by 2-phase titration.
552

Titrimetric determination of anionic surfactant content in..., J. WANG, et al.
Table 4. Evaluation of the titration results of SDS/NP-10 mixed solution carried out with anionic surfactant selective
electrode.
Equivalent point RelativeNo c(SDS) /mol L0−1 c(NP−10)/mol L−1 n(NP−10): n(SDS) error of Vep /% ΔE /ΔV
Hyaminea /mL volume of
1 5.0 × 10⁻⁴ 3.01 141.62 5.0 × 10⁻⁴ 5.0 × 10⁻⁶ 1:100 3.03 0.66 138.5
3 5.0 × 10⁻⁴ 5.0 × 10⁻⁵ 1:10 3.04 1.00 121.5
4 5.0 × 10⁻⁴ 5.0 × 10⁻⁴ 1:1 3.05 1.32 118.5
5 5.0 × 10⁻⁴ 1.0 × 10⁻³ 2:1 3.03 0.66 105.4
6 5.0 × 10⁻⁴ 1.5 × 10⁻³ 3:1 2.99 –0.66 96.8
7 5.0 × 10⁻⁴ 2.0 × 10⁻³ 4:1 Without equivalent point
8 5.0 × 10⁻⁴ 5.0 × 10⁻³ 10:1 Without equivalent pointa The concentration of Hyamine is 4.12 × 10⁻³ mol L−1
Table 5. Evaluation of the titration results of SDS/NP-10 mixed solution carried out with anionic surfactant selective
electrode.
Equivalent point RelativeNo c(SDS) /mol L0−1 c(NP−10)/mol L−1 n(NP−10): n(SDS) error of Vep /% ΔE /ΔV
Hyaminea /mL volume of
9 5.0 × 10⁻³ 2.55 328.1
10 5.0 × 10⁻³ 5.0 × 10⁻⁵ 1:100 2.56 0.39 317.6
11 5.0 × 10⁻³ 5.0 × 10⁻⁴ 1:10 2.53 –0.78 302.4
12 5.0 × 10⁻³ 5.0 × 10⁻³ 1:1 2.57 0.78 262.5
13 5.0 × 10⁻³ 1.0 × 10⁻² 2:1 2.58 1.17 184.214 5.0 × 10⁻³ 1.5 × 10⁻² 3:1 2.53 –1.17 86.6
15 5.0 × 10⁻³ 2.0 × 10⁻² 4:1 Without equivalent point
16 5.0 × 10⁻³ 5.0 × 10⁻² 10:1 Without equivalent pointa The concentration of Hyamine is 4.88 × 10⁻² mol L−1
Table 6. Comparison of the results obtained by potentiometric and 2-phase titration of commercial detergent.
Sample SDS (wt%)
Potentiometric titration Two-phase titration
1a 16.31 16.23
2a 16.34 16.26
3a 16.30 16.21
RSD (%)b 1.68 2.05
aNumber 1, 2, 3: washing liquid (SDS, Np-10, glycerin, NaCl, diethanolamide, additives).bRelative standard deviation of potentiometric titration and 2-phase titration for triplicate measurements.
553

Titrimetric determination of anionic surfactant content in..., J. WANG, et al.
Conclusions
A comparison with similar previously reported works is shown in Table 7. The response slopes to SDS of thoseelectrodes were similar. The membrane containing new cyclic aza-oxa-cycloalkane as ionophore had the widestlinear range. The membrane containing DTA+DS− ion pair as ionophore had the widest pH usage rangeand the lowest detection limit. The electrode based on DTA+DS− ion pair as ionophore in PVC membranedisplayed a Nernstian slope of –56.9 ± 0.3 mV/decade in a 2.0 × 10⁻⁶ to 3.2 × 10⁻³ mol L−1 concentration
range and a limit of detection of 1.6 × 10⁻⁶ mol L−1 . The electrode had a short response time and widepH range for use, and it can be used for 3 months without significant change in the value of slope and linearconcentration range. The electrode was suitable for detecting the endpoint of anionic surfactant titrations. Thebehavior of the electrode was assessed with regard to its usefulness in routine analysis. The relative error of theendpoint volume was not more than 1.5% in SDS/NP-10 mixture solutions. Our investigations showed that theelectrodes specially designed for anionic surfactant titrations did not need conditioning before use except thefirst time.
Table 7. Comparison with similar previously reported works.
Detection
Ionophore Slope Linear range Detection limit pH range
(mV/decade) (mol L−1) (mol L−1)
New cyclic aza-oxa-cycloalkanea –57.7 ± 0.2 3.3 × 10⁻⁶ to 6.7 × 10⁻³ 2.9 × 10⁻⁶ 4.5-8.0
Cyclam derivativeb –60.0 ± 0.9 7.9 × 10⁻⁶ to 2.0 × 10⁻³ 4.0 × 10⁻⁶ 5.0-8.5
Single walled carbon nanotubesc –59.5 9.0 × 10⁻⁵ to 5.0 × 10⁻³ 5.2 × 10⁻⁶ Not mentioned
DTA+DS− ion paird –56.9 ± 0.3 2.0 × 10⁻⁶ to 3.2 × 10⁻³ 1.6 × 10⁻⁶ 4.4-9.6aReference [26], bReference [1], cReference [25], dTextual content
Acknowledgements
This work was supported by the Natural Fund of Shanxi Province (2010011017), Natural Science Fund of China(21073234, 21103228) and Shanxi Province Science Fund for Youths (2011021010-2).
References
1. Josefa, L. S.; Ramon, M. M.; Sancenon, F.; Soto, J. Talanta 2008, 75, 317-325.
2. Mahajan, R. K.; Shaheen, A. J. Colloid. Interface. Sci. 2008, 326, 191-195.
3. Vytras, K.; Kalous, J.; Jezkova, J. Egypt. J. Anal. Chem. 1997, 6, 107-123.
4. Vogt, C.; Heinig, K. Fresenius J. Anal. Chem. 1999, 363, 612-618.
5. He, Q.; Chen, H. Fresenius J. Anal. Chem. 2000, 367, 270-274.
6. Fujinaga, T.; Okazaki, S.; Freiser, H. Anal. Chem. 1974, 46, 1842-1844.
7. Gerlache, M.; Senturk, Z.; Vire, J. C.; Kauffmann, J. M. Anal. Chim. Acta. 1997, 349, 59-65.
554

Titrimetric determination of anionic surfactant content in..., J. WANG, et al.
8. Kovacs, B.; Csoka, B.; Nagy, G.; Ivaska, A. Anal. Chim. Acta. 2001, 437, 67-76.
9. Alizadeh, N.; Tazekendi, H. K. Sens. Actuators B. 2001, 75, 5-10.
10. Sanchez, J.; del Valle, M. Electroanal. 2001, 13, 471-476.
11. Hugo, B.; Koen, V.; Roy, D.; Paul, M.; Bert, V.; Nagels, L. J. Anal. Chim. Acta. 2007, 581, 181-191.
12. Campanella, L.; Battilotti, M.; Borraccino, A.; Colapicchioni, C.; Tomassetti, M.; Visco, G. Sens. Actuators B.
1994, 18-19, 321-328.
13. Sanchez, J.; Beltran, A.; Alonso, J.; Jimenez, C.; del Valle, M. Anal. Chim. Acta. 1999, 382, 157-164.
14. Sanchez, J.; del Valle, M. Talanta 2001, 54, 893-902.
15. Chan, W.; Lu, J. Z. Anal. Chim. Acta. 1998, 361, 55-61.
16. Singh, A. K.; Saxena, P.; Panwar, A. Sens. Actuators B. 2005, 110, 377-318.
17. Choi, Y. W.; Minoura, N.; Moon, S. H. Talanta 2005, 66, 1254-1263.
18. Singh, A. K.; Saxena, P. Talanta 2005, 66, 993-998.
19. Ruzica, M. P.; Milan, S. B.; Mate, B.; Bozidar, S. G. Sens. Actuators B. 2005, 106, 221-228.
20. Mahajan, R. K.; Kaur, I.; Bakshi, M. S. J. Surfact. Deterg. 2004, 7, 131-134.
21. Hassanien, M.; Sherbini, M. A.; Mostafa, G. A. E. Talanta 2003, 59, 383-392.
22. Cattral, R. W.; Freiser, H. Anal. Chem. 1971, 43, 1905-1906.
23. James, H.; Carmack, G.; Freiser, H. Anal. Chem. 1972, 44, 856-857.
24. Fujinaga, T.; Okazaki, S.; Freiser, H. Anal. Chem. 1974, 46, 1842-1844.
25. Najafia, M.; Maleki, L.; Rafati, A. A. J. Mol. Liq. 2011, 159, 226-229.
26. Seguı, M. J.; Sabater, J. L.; Manez, R. M.; Pardo, T.; Sancenon, F.; Soto, J. Aanl. Chim. Acta. 2004, 525, 83-90.
27. Hummel, D. O. Handbook of Surfactant Analysis, Wiley, New York, 1999.
28. Ma, J. S.; Josefa, L. S.; Ramon, A. B.; Sancenon, F.; Soto, J. Talanta 2007, 71, 333-338.
29. Buck, R. P.; Lindner, E. Pure. Appl. Chem. 1994, 66, 2527-2536.
30. Macca, C. Anal. Chim. Acta. 2004, 512, 183-190.
31. IUPAC, Pure. Appl. Chem. 1976, 48, 127-132.
555