Focal Depth Determination
16
1 Focal Depth Determination for Underground Nuclear and Calibration/Mine Explosions to Improve Nuclear Test Monitoring By Omar Mayyas Natural Resources Authority- Jordan Seismological Observatory, P. O. Box # 7, Telefax: 00 962 6 550 4410, Mobile: 00 962 6 416 264 Amman- Jordan, 2007 E-mail: [email protected] Abstract Conducting nuclear tests is one of the most important elements in the technology of creating and improving nuclear weapons. Due to the serious environmental consequence of nuclear testing the Comprehensive Test Ban Treaty prohibits all nuclear testing. A verification regime of this organization must be capable for detecting nuclear explosions in all environment-underground, in water and in the atmosphere. We propose new mathematical correlation method to investigate the applicability of calibrated S-P arrival time information for use as constraints in hypocenter location process for underground-shaft and calibration/mine explosions and to investigate seismic discrimininat behavior between normal production mining explosions and fully contained nuclear tests. Large mine blasts can produce ground motion similar to those of underground nuclear tests, therefore scientists must be able to differentiate between the two and the separation of nuclear explosions from mining explosions and explosion signals from natural signals such as earthquakes is a very complicated situation. Several approaches to improve focal depth determination have been investigated including: regional and teleseismic data have been collected to each country, a list of nuclear tests, including detailed information: date, time, coordinate, magnitude, location and waveforms from records of Swiss Seismological Service. Local data of calibration explosions obtained from records of Jordan Seismological Observatory. Travel time and epicenter distance were used to determine focal depth of nuclear and calibration/mine explosions from the source (Swiss and Jordan Databases). PDF Editor
-
Upload
independent -
Category
Documents
-
view
1 -
download
0
Transcript of Focal Depth Determination

1
Focal Depth Determination for Underground Nuclear and Calibration/Mine Explosions to Improve Nuclear Test
Monitoring
By
Omar Mayyas
Natural Resources Authority- Jordan Seismological Observatory, P. O. Box # 7, Telefax: 00 962 6 550 4410, Mobile: 00 962 6 416 264
Amman- Jordan, 2007 E-mail: [email protected]
Abstract
Conducting nuclear tests is one of the most important elements in the technology of creating and improving nuclear weapons. Due to the serious environmental consequence of nuclear testing the Comprehensive Test Ban Treaty prohibits all nuclear testing. A verification regime of this organization must be capable for detecting nuclear explosions in all environment-underground, in water and in the atmosphere. We propose new mathematical correlation method to investigate the applicability of calibrated S-P arrival time information for use as constraints in hypocenter location process for underground-shaft and calibration/mine explosions and to investigate seismic discrimininat behavior between normal production mining explosions and fully contained nuclear tests. Large mine blasts can produce ground motion similar to those of underground nuclear tests, therefore scientists must be able to differentiate between the two and the separation of nuclear explosions from mining explosions and explosion signals from natural signals such as earthquakes is a very complicated situation. Several approaches to improve focal depth determination have been investigated including: regional and teleseismic data have been collected to each country, a list of nuclear tests, including detailed information: date, time, coordinate, magnitude, location and waveforms from records of Swiss Seismological Service. Local data of calibration explosions obtained from records of Jordan Seismological Observatory. Travel time and epicenter distance were used to determine focal depth of nuclear and calibration/mine explosions from the source (Swiss and Jordan Databases). PDF Editor

2
Introduction
Accurate estimates of source depth are important for a number of reasons, in particular for monitoring the Comprehensive Nuclear Test Ban Treaty (CTBT). Accurate depth estimates can provide an important discriminant between man-made events and earthquakes. If the depth can be accurately determined to lie outside the range of current drilling techniques, then the event is unlikely to be man-made. However, if the source depth is very shallow, further investigation may be required to determine whether it is an earthquake or a nuclear explosion (Marson-Pidgeon, 2000). Under the terms of the CTBT, a global verification regime to monitor compliance with the Treaty must be operational at entry into force. Such a verification regime must be capable of detecting nuclear explosions in all environments- underground, in water and in the atmosphere. The International Monitoring System (IMS) is a network of monitoring sensors which search for, detect and provide evidence of possible nuclear explosions to States Parties for verification of Treaty compliance. It consists of 321 monitoring stations and 16 radionuclide laboratories that monitor the Earth for evidence of a nuclear explosion (figure 1) (Preparatory Commission for the CTBTO, 2001).
Figure 1: Map showing the location of the IMS network.
Regional distance seismic recordings of underground nuclear tests are rare and are limited mainly to the former test (Figure 2). This poses a significant challenge to calibrating seismic discriminants of the new International Monitoring System stations, or any new seismic stations.
PDF Editor

3
Many stations are either located beyond regional distances from past nuclear tests, or started operating after nuclear testing in the region ceased. Consequently, most of the existing and planned IMS stations, and any future stations, will need to be calibrated without any regional distance seismic recordings of underground nuclear tests (Walter, et al., 2000).
USA (818 Events)
Soviet Union (503 Events)
France (153 Events)
China (24 Events)
Great Britain (24 Events)
India(3 Events)
Pakistan (2 Events)
Figure 2. Map showing the location of nuclear tests since 1980, when digital data is more likely to be available. Note that nuclear tests are limited to the former Soviet Union and the test sites of the US, China, France, India and Pakistan, so regional digital recordings of nuclear tests are only possible in these regions. In addition many IMS stations were not in place when the testing occurred. Therefore most IMS stations will have to be calibrated without any regional distance recordings of nuclear tests.
While it is possible to develop models for transporting seismic discriminant from the nuclear test sites to analogous regions without nuclear tests, we also want to validate these discriminants with empirical data whenever possible. The largest potential source of empirical explosion data is from commercial mining operations. These production explosions are geographically widely distributed and often recorded at
PDF Editor

4
near regional distances. They also are another source of background seismicity that needs to be correctly identified for nuclear test monitoring such as for the CTBT. If the relationship between normal production mining explosions and fully contained underground nuclear tests were clearly understood, these mining explosions could be used to help calibrate seismic stations, and "false alarms" from mining activity could be reduced (Walter, et al., 2000).
Objective
The use calibration explosions for seismic monitoring provides valuable empirical data and opportunities to test monitoring strategies (Rodgers, et al., 1999). Records of exist nuclear and calibration explosions offer a unique set of travel time and explosion source data of the highest quality of ground truth because the source location, depth and origin time are precisely known (Table 1). For this reason calibration explosions are widely viewed to be the most desirable type of source for empirical calibration.
Table 1: Calibration explosions made by GII in Dead Sea region ( Israel Database).
Date Quarry
Origin time (o.t.),GMT Magnitude
ML
Coordi- Nates
Total Charge,
Tons
No. Of
Rows
No. Of
holes
Hole Depth
M
1 30.07 1998
Arad,Israel Consolidated
Clays
08:18:51.911* 2.6
31.10439n*
35.18801E*
8 6 70 8.5
2 09.09 1998
Arad, Consolidsted
Clsys
10:00:03.221* 2.7
31.10416n*
35.18880E*
10.5 9 75 8.5-9
3 26.01 1999
Arad,mart (chalk+clay,
consolid.)
11:46:02.410* 2.9
31.10968N
35.18914E
14.34 11 120 8.5
4 27.01 1999
Arad,mart (chalk+clay,
consolid.)
10:01:00.641* 2.7
31.10894N
35.18936E
12.0 10 76 8.5
We analyzed seismic data from the 1984-1989 nuclear explosions records by Swiss Seismological stations, calibration shots (made by Jordan and Israel) and many mining explosions in Jordan and Israel records by JSO to investigate focal depth. Travel time and epicenter distance were used to determine focal depth of nuclear and calibration/mine explosions from the source (Swiss and Jordan databases) (Table 2). This study makes use PDF Editor

5
of the unique data set that the calibration explosions provided and demonstrates the importance and potential value of future calibration explosions.
Table 2: The results of analyzing calibration explosion made by GII, dated 26/1/1999 by using the program SEISAN, which is used in JSO.
Print Screen
Research Accomplished
Seismic event location remains as one of the most important discrimination for separating natural tectonic and explosive events. Thus, for example, it has been estimated that approximately 80% of known global earthquakes have focal depths greater than 50 km or are located more than 25 km at sea. Since underwater nuclear explosions can be confidently identified to very low yields using hydroacoustic data, it follows that the vast majority of earthquakes can potentially be identified on the basis of location alone. More specifically, high confidence estimation of focal depths remains as an outstanding seismic monitoring problem. If accurate focal depths could be determined for the majority of earthquakes deeper than 5, or even 10 km, the event discrimination problem would be much easier. However, despite intensive efforts by well-trained and experienced analysts, more than two-thirds of the GSETT-3 REB events were assigned artificially constrained depths. Moreover, the cited accuracies of even those relatively few focal depth estimates is open to serious question, particularly in light of the evidence that the corresponding epicentral uncertainties appear to be significantly underestimated by the current hypocentral location algorithm. Thus, for example, Fisk et al (2000) found a number of cases in the GSETT-3 database where the cited uncertainties in the focal depths of earthquakes in particular areas had PDF Editor
6
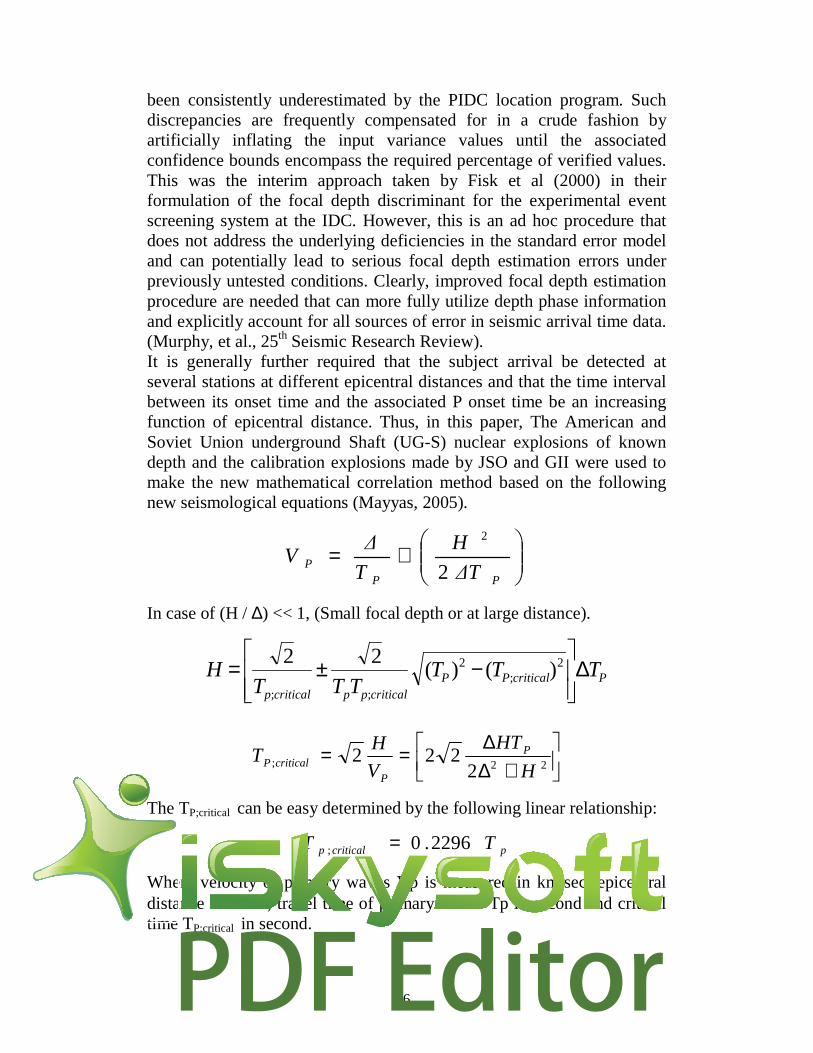
been consistently underestimated by the PIDC location program. Such discrepancies are frequently compensated for in a crude fashion by artificially inflating the input variance values until the associated confidence bounds encompass the required percentage of verified values. This was the interim approach taken by Fisk et al (2000) in their formulation of the focal depth discriminant for the experimental event screening system at the IDC. However, this is an ad hoc procedure that does not address the underlying deficiencies in the standard error model and can potentially lead to serious focal depth estimation errors under previously untested conditions. Clearly, improved focal depth estimation procedure are needed that can more fully utilize depth phase information and explicitly account for all sources of error in seismic arrival time data. (Murphy, et al., 25th Seismic Research Review). It is generally further required that the subject arrival be detected at several stations at different epicentral distances and that the time interval between its onset time and the associated P onset time be an increasing function of epicentral distance. Thus, in this paper, The American and Soviet Union underground Shaft (UG-S) nuclear explosions of known depth and the calibration explosions made by JSO and GII were used to make the new mathematical correlation method based on the following new seismological equations (Mayyas, 2005).
+=
PPP
∆T
H
T
∆V
2
2
In case of (H / ∆) << 1, (Small focal depth or at large distance).
PcriticalPPcriticalppcriticalp
TTTTTT
H ∆
−±= 2
;2
;;
)()(22
+∆∆
==22; 2
222H
HT
V
HT P
PcriticalP
The TP;critical can be easy determined by the following linear relationship:
pcriticalp TT 2296.0; =
Where velocity of primary waves Vp is measured in km/sec, epicentral distance ∆ in km, travel time of primary waves Tp in second and critical time TP;critical in second.
PDF Editor

7
Velocity Variation for nuclear explosions and calibration shots
The fact that the transit times in general do not depend on path, but only on distance, shows that velocities within the earth depend primarily on depth alone. With one chief exception and some minor ones still under investigation, velocity is found to increase regularly with depth (Richter, 1958). We estimated a velocity from the picked P-wave data and the following figure shows the estimation of velocity variations with the depth by applying the first equation (Figure 4).
Velocity Variations for Nuclear Explosions and Calibration Shots
y = -1E-06x2 + 0.0065x + 6.0019
R2 = 0.9984
0
2
4
6
8
10
12
14
0 200 400 600 800 1000 1200 1400 1600
Depth (km)
Vel
oci
ty (
km/s
ec)
Figure 4: Velocity variations for nuclear explosions and calibration shots by using the average recorded stations for each explosion.
Determination of coefficient Mcalc and depth Hcalc. To determinate calculated depth, The following empirical equation was applied:
∆=calc
calc MHH
2
where Hcalc. is the calculated depth in meters, H is the apparent depth in km, Mcalc. is the calculated coefficient and ∆ is the epicentral distance in km. The Mcalc estimates obtained using given depth by source Hreal (American, Soviet Union, Jordan and Israel databases) for 24 USA, 13 USSR nuclear explosions of known depth and 5 calibration explosions. Thus, after the data analysis, a good depth correlation was found between all underground-shaft nuclear explosions of known depth and calibration explosions (Figure 5), except the Soviet Union explosion dated PDF Editor
8
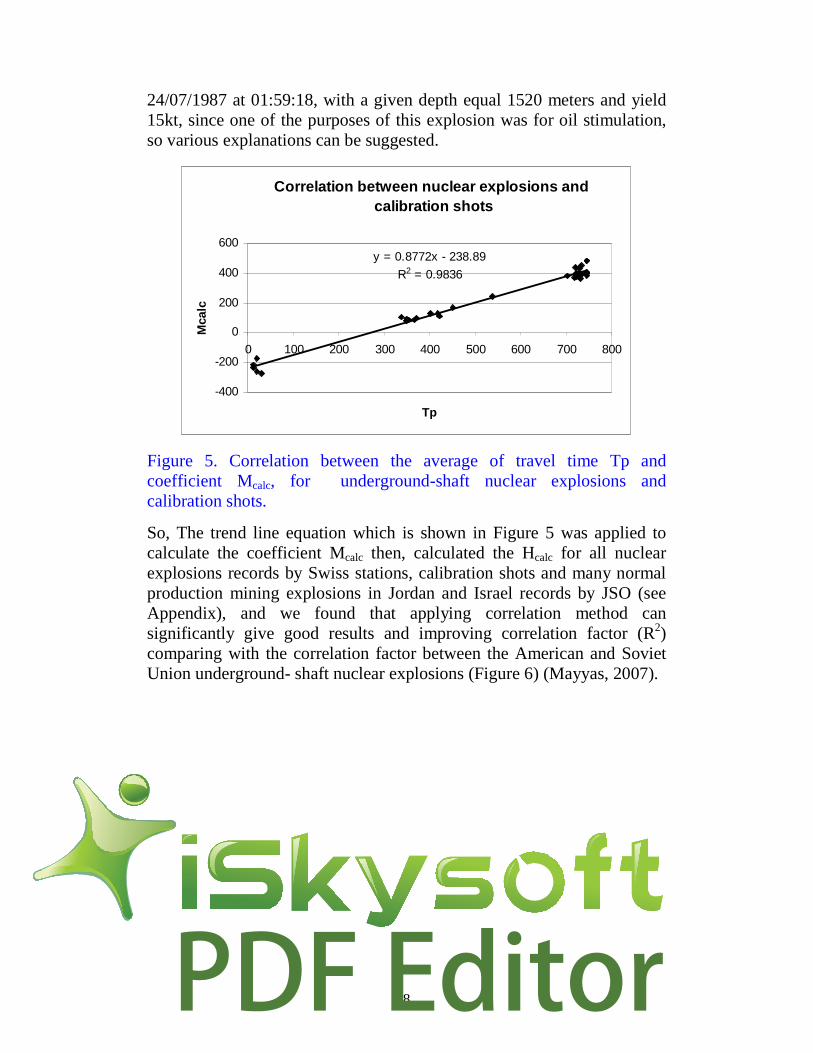
24/07/1987 at 01:59:18, with a given depth equal 1520 meters and yield 15kt, since one of the purposes of this explosion was for oil stimulation, so various explanations can be suggested.
Correlation between nuclear explosions and calibration shots
y = 0.8772x - 238.89
R2 = 0.9836
-400
-200
0
200
400
600
0 100 200 300 400 500 600 700 800
Tp
Mca
lc
Figure 5. Correlation between the average of travel time Tp and coefficient Mcalc, for underground-shaft nuclear explosions and calibration shots. So, The trend line equation which is shown in Figure 5 was applied to calculate the coefficient Mcalc then, calculated the Hcalc for all nuclear explosions records by Swiss stations, calibration shots and many normal production mining explosions in Jordan and Israel records by JSO (see Appendix), and we found that applying correlation method can significantly give good results and improving correlation factor (R2) comparing with the correlation factor between the American and Soviet Union underground- shaft nuclear explosions (Figure 6) (Mayyas, 2007).
PDF Editor

9
Am erican and Soviet Union underground-shaft nuclear explosions
y = 0.8417x - 215.27
R2 = 0.9673
0
100
200
300
400
500
600
0 100 200 300 400 500 600 700 800
Tp (sec)
Mca
lc
Figure 6. Relationship between the average of travel time Tp and coefficient Mcalc, for each USA and USSR underground-shaft nuclear explosions.
Conclusion
An important component of this study is the development of detailed information for all events recorded by Swiss Seismological Service and Jordanian network. In this case, detailed data on the location, yield of explosive and depth for many nuclear explosions and calibration shots were provided and used in the modeling and analysis of these unique events. We hope to develop similar information for additional events. The main advantages of this method to determinate velocity, apparent depth, coefficient Mcalc and calculated depth are that it is fast, and not sensitive to location errors or travel time anomalies. Since this method works best when observations are distributes at a range of azimuths and distances, the only limitation on where this method can be applied come from the Soviet Union underground-shaft nuclear explosion, dated 24/7/1987 in southeastern Siberia. In order to further develop this method for events screening purpose, it will be necessary to study extensive historical recordings of nuclear explosions and calibration explosions in various tectonic regions. Unfortunately, the majority of International Monitoring System (IMS) stations were not established at the time when most of the historic nuclear explosions were conducted. The event screening criteria must therefore be developed based to a large extent on non-IMS data, including available high-quality stations with a long history of analog recording. This study ensures a good depth correlation between all underground-shaft nuclear explosions of known depth and calibration/mine explosions, this poses a significant challenge to calibrating seismic discriminants of PDF Editor

10
the new International Monitoring System stations, or any new seismic stations.
PDF Editor

11
References
1- A. Rodgers, A. M. Al-Amri, A. Ar-Rajehi, T. Al-Khalifah, M. S. Al-Amri, M. S. Al-Haddad, N. Al-Arifi, [April 19, 2000],“Analysis of Regional Travel Time Data from the November 1999 Dead Sea Explosions Observed in Saudi Arabia”. Lawrence Livermore National Laboratory, 3-7.
2- Arthur Rodgers, Stephen Myers, Kevin Mayeda and William Walter, [1999], "Analysis of the November 1999 Dead Sea Calibration Shots", Contract N0. W-7405-ENG-48.
3- Charles F. Richter, [1958], “Elementary Seismology”, California Institute of Technology, San Francisco and London, 314-316, 667-669.
4- Frode Ringdal, Elena Kremenetskaya and Vladmir Asming,
[2002],“ Observed Characteristics of Regional seismic Phases and Implications for P/S Discrimination in the European Arctic”, Pure and Applied Geophysics, 703-706.
5- Peter M. Shearer, [2001], "Improving Global Seismic Event Locations Using Source-Receiver Reciprocity", Bulletin of the Seismological Society of America, 91,3, 594-603.
6- John R. Murphy, Brian W. Barker, and William L. Rodi, “Improved Focal Depth Determination for use in Nuclear Explosion Monitoring”, Air Force Research Laboratory, Contract No. DTRA01-01-C-0056, 428-436.
7- K. Marson-Pidgeon, B. L. N. Kennett, and M. Sambridge, [2000] " Source Depth and Mechanism Inversion at Teleseismic Distances Using a Neighborhood Algorithm", Bulletin of the Seismological Society of America, 13691373.
8- La Andryushin, N. P. Voloshin, R. I. Ilkaev, A. M. Matushchenko, L. D. Ryabev, V. G. Strukov, A. K. Chernyshev, and Yu. A. Yudin “ Catalog of Worldwide Nuclear Testing”.
9- Marie D. Arrowsith, Stephen J. Arrowsmith, Brian Stump, and Michael Hedlin, “Disrimination of small Events Using Regional Waveforms: Application to Seismic Events in the US and Russia”, 27th Seismic Research Review: Ground-Based Nuclear Explosion Monitoring Technologies, 498-500.
PDF Editor

12
10- Mayyas O, [2005], “Study of Seismic Behavior with the Depths along the Dead Sea Transform”, MERC TA-MOU-99-M18-035 Project, Workshop – Seismic Calibration Using Mining Explosions in the Middle East, Cyprus, Nicosia, 11-16 December, 9-18.
11- Mayyas O, [2007], "S-P Correlation to Improve Focal Depth Determination for American and Soviet Union Underground-shaft Nuclear Explosions", Under Estimating in Journal of Earthquake Engineering.
12- Ota Kulhanek, [1990], “Anatomy of the Seismograms”, Amsterdam-Oxford-New York-Tokyo, Seismological Section, University of Uppsala, Upsala, Sweden, 11-14.
13- Peter Marshal, [1999],“Residual Signature of Nuclear Explosions and their Role in On-Site Inspection”, OSI Introductory Course, Vienna, 2-6 August 1999, 3-35.
14- Preparatory Commission for the Comprehensive Nuclear-Test-Ban Treaty Organization, [2001], "The Global Verification Regime and the International Monitoring System", Basic Facts: Booklet 3, 1-5.
15- S.K. Sikka, G. J. Nair, Falguni Roy, Anil Kakodkar and R. Chidambaram, [2000], “The Recent Indian Nuclear Tests”, special section: seismology, 1359-1361.
16- Swiss Seismological Service, [Last update 17 Feb 2003].
17- U. S. Congress, [October, 1989], “The Containment of Underground Nuclear Explosions”, Office of Technology Assessment, OTA-ISC-414 (Washington, DC: U. S. Government Printing Office, 1-55.
18- W. R. Walter, M. Denny, C. Pearson, S. C. Myers, [2000], "A Mining/Contained Explosion Source Phenomenology Experiment to Improve Nuclear Test Monitoring", U. S. Department of Energy, Lawrence Livermore National Laboratory, UCRL-ID-137162.
19- Vitaly V. Adushkin, [September 2001],“The containment of Soviet Underground Nuclear Explosions”, 27-28.
20- William C. Haneberg, [2006], “Seismology for monitoring explosions forum”.
PDF Editor

13
21- Wm. Robert Johnston, [last modified 22 Jun 2005], “Database of Nuclear Tests”, United States: overview,
22- Wm. Robert Johnston, [last modified 15 June 2005], “Database of Nuclear Tests”, USSR,
23- Linda M, Warren and Peter M. Shearer, “Using the Effect of Depths on P-wave Spectra to Determine Earthquake Depths”, Bulletin of the Seismological Society of America, Vol. 95, No. 1., February 2005, 173-184.
PDF Editor

14
Appendix
Calculation process to 72 nuclear explosions, 5 calibration explosions and 56 mining explosions.
N0 Date Time GMT
∆ km
Tp sec
H km
Vp km/sec
Mcalc
Hcalc km
H*real
km Country
1 01/03/1984 17:45 8714.333 719.785 1433.941 12.271 392.510 0.601 0.6386 USA = 2 31/05/1984 13:04 8797.552 723.900 1447.634 12.317 396.115 0.601 0.59985 USA = 3 23/03/1985 18:30 9185.329 745.857 1511.443 12.482 415.376 0.599 0.515 USA = 4 02/05/1985 15:20 9183.724 745.719 1511.179 12.482 415.255 0.599 0.660 USA = 5 22/04/1986 14:30 8862.888 728.558 1458.385 12.329 400.201 0.600 0.609 USA = 6 05/06/1986 15:04 9190.641 746.207 1512.317 12.483 415.683 0.599 0.5182 USA = 7 30/09/1986 22:30 9183.030 745.824 1511.065 12.479 415.347 0.599 0.616 USA = 8 16/10/1986 19:25 8823.974 726.716 1451.982 12.307 398.585 0.599 0.60503 USA = 9 14/11/1986 16:00 8747.478 722.911 1439.395 12.264 395.248 0.599 0.59314 USA = 10 30/04/1987 13:30 9200.398 746.600 1513.923 12.490 416.027 0.599 0.625 USA = 11 13/08/1987 14:00 9187.412 745.684 1511.786 12.487 415.224 0.599 0.63856 USA = 12 24/09/1987 15:00 9190.800 746.060 1512.343 12.486 415.554 0.599 0.61417 USA = 13 15/02/1988 18:10 8727.375 722.017 1436.087 12.251 394.463 0.599 0.5416 USA = 14 02/06/1988 13:00 8783.626 724.806 1445.343 12.282 396.910 0.599 0.6203 USA = 15 07/07/1988 15:05 9013.200 736.000 1483.119 12.412 406.729 0.600 0.6221 USA = 16 17/08/1988 17:00 8782.135 724.656 1445.098 12.283 396.778 0.599 0.6157 USA = 17 13/10/1998 14:00 8766.348 723.861 1442.500 12.274 396.081 0.599 0.63978 USA = 18 22/06/1989 21:15 8967.531 733.807 1475.604 12.386 404.806 0.600 0.5441 USA = 19 31/10/1989 15:30 8897.042 730.300 1464.005 12.348 401.729 0.600 0.5629 USA = 20 13/06/1990 16:00 8946.249 731.132 1472.103 12.402 402.459 0.602 0.6739 USA = 21 12/10/1990 17:30 8406.356 704.082 1383.263 12.101 378.731 0.601 0.600 USA = 22 04/04/1991 19:00 8789.604 723.525 1446.327 12.313 395.786 0.601 0.6294 USA = 23 14/09/1991 19:00 8873.797 727.547 1460.181 12.362 399.314 0.602 0.6416 USA = 24 16/04/1991 15:30 8826.208 726.962 1452.350 12.305 398.801 0.599 USA = 25 26/03/1992 16:30 8964.360 732.042 1475.083 12.411 403.257 0.602 0.622 USA = 26 24/09/1983 04:59 3155.036 355.050 0519.160 09.005 072.560 1.177 1.050 USSR = 27 24/09/1983 05:04 3091.227 349.861 0508.660 08.954 068.008 1.231 1.050 USSR = 28 24/09/1983 05:09 3108.351 351.368 0511.478 08.965 069.330 1.214 0.920 USSR = 29 24/09/1983 05:14 3084.865 349.416 0507.614 08.947 067.618 1.235 1.100 USSR = 30 24/09/1983 05:19 3343.443 370.111 0550.163 09.155 085.771 1.055 0.950 USSR = 31 24/09/1983 05:24 3293.253 366.200 0541.904 09.114 082.341 1.083 1.070 USSR = 32 26/10/1983 01:54 5600.796 536.033 0921.609 10.590 231.318 0.656 USSR = 33 19/02/1984 03:57 5042.819 500.296 0829.794 10.216 199.970 0.683 USSR = 34 07/03/1984 02:38 5699.684 544.405 0937.881 10.611 238.662 0.647 USSR = 35 26/05/1984 03:13 5047.963 500.757 0830.641 10.217 200.374 0.682 USSR = 36 14/07/1984 01:08 5594.770 537.357 0920.618 10.552 232.450 0.652 USSR = 37 21/07/1984 02:59 3970.840 419.228 0653.401 09.560 128.857 0.834 0.850 USSR = 38 25/08/1984 18:59 4429.096 452.429 0728.806 09.922 157.981 0.759 0.725 USSR = 39 28/12/1984 03:49 5638.157 540.216 0927.757 10.578 234.987 0.650 USSR = 40 10/02/1985 03:27 5042.841 498.830 0829.798 10.247 198.684 0.687 USSR = 41 30/06/1985 02:38 5582.721 534.944 0918.635 10.577 230.362 0.656 USSR = 42 18/07/1985 21:14 2968.396 338.508 0488.449 08.887 58.050 1.385 0.770 USSR = 43 17/04/1987 01:02 5468.019 528.710 0899.761 10.482 224.894 0.658 USSR = 44 24/07/1987 01:59 6937.197 622.955 1141.514 11.286 307.566 0.611 1.520 USSR = 45 03/10/1987 15:14 4020.551 423.377 0661.580 09.624 132.496 0.822 1.000 USSR = 46 15/11/1987 03:30 5609.015 538.311 0922.962 10.560 233.317 0.651 USSR = 47 13/12/1987 03:20 5662.344 540.321 0931.737 10.621 235.080 0.652 USSR = 48 27/12/1987 03:04 5549.383 913.149 0913.149 10.527 229.793 0.654 USSR = 49 13/02/1988 03:04 5603.806 537.832 0922.105 10.560 232.896 0.652 USSR =
PDF Editor

15
50 03/04/1988 01:32 5604.741 537.926 0922.258 10.560 232.979 0.651 USSR = 51 14/06/1988 02:26 537.217 920.481 0920.481 10.553 232.357 0.652 USSR = 52 06/09/1988 16:18 3780.660 402.959 0622.106 09.509 114.586 0.893 0.800 USSR = 53 14/09/1988 04:00 5058.714 499.976 0832.410 10.254 199.689 0.686 USSR = 54 12/11/1988 03:29 5772.123 548.328 0949.801 10.669 242.103 0.646 USSR = 55 17/12/1988 04:17 5682.812 541.750 0935.105 10.631 236.333 0.651 USSR = 56 12/02/1989 04:14 5608.046 538.212 0922.802 10.560 233.229 0.651 USSR = 57 08/07/1989 03:46 5036.378 499.894 0828.734 10.211 199.617 0.683 USSR = 58 19/10/1983 09:49 5603.891 537.920 0922.118 10.558 232.973 0.651 0.628 USSR = 59 06/10/1983 09:59 6311.591 583.112 1038.570 10.970 272.616 0.627 CHINA = 60 03/10/1984 06:00 6066.705 567.282 0998.274 10.839 258.730 0.635 CHINA = 61 05/06/1987 05:00 6190.645 575.390 1018.669 10.904 265.842 0.631 CHINA = 62 26/05/1990 07:59 6421.993 590.268 1056.737 11.027 278.894 0.623 CHINA = 63 16/08/1990 04:59 6322.209 585.458 1040.318 10.945 274.674 0.623 CHINA = 64 21/05/1992 04:59 6266.593 580.258 1031.166 10.946 270.112 0.628 CHINA = 65 05/10/1993 02:00 6108.419 569.988 1005.138 10.861 261.103 0.633 CHINA = 66 10/06/1994 06:26 6177.890 576.054 1016.570 10.869 266.425 0.628 CHINA = 67 07/10/1994 03:25 6240.584 578.600 1026.886 10.931 268.658 0.629 CHINA = 68 08/06/1996 02:55 6209.553 578.069 1021.780 10.887 268.192 0.627 CHINA = 69 29/07/1996 01:49 6107.903 570.192 1005.054 10.857 261.283 0.633 CHINA = 70 14/11/1990 19:17 9031.025 736.976 1486.052 12.420 407.586 0.600 ENGLAND = 71 11/05/1998 10:13 5905.755 560.250 0971.790 10.684 252.561 0.633 INDIA = 72 30/05/1998 06:54 5119.426 506.024 0842.400 10.253 204.994 0.676 PAKISTAN = 73 04/12/2004 15:00 0203.725 030.788 0033.523 06.516 -211.883 0.026 0.0225 JORDAN " 74 17/01/2005 13:00 0108.906 018.619 0017.920 05.855 -222.557 0.013 0.0175 JORDAN " 75 09/09/1998 10:00 0078.600 013.060 0012.934 06.114 -227.434 0.009 0.009 ISRAEL " 76 26/01/1999 14:00 0069.000 011.800 0011.354 05.862 -228.539 0.008 0.0085 ISRAEL " 77 21/05/2002 12:58 0126.000 020.344 0020.733 06.166 -221.044 0.015 0.0130 ISRAEL " 78 05/04/2004 15:59 0056.667 010.150 0009.324 05.545 -229.986 0.007 JORDAN + 79 06/04/2004 07:29 0085.286 014.586 0014.034 05.886 -226.095 0.010 JORDAN + 80 08/04/2004 11:26 0095.667 016.600 0015.742 05.716 -224.328 0.012 JORDAN + 81 03/04/2004 06:56 0088.700 015.040 0014.596 05.912 -225.697 0.011 JORDAN + 82 05/04/2004 11:24 0093.400 016.280 0015.369 05.764 -224.609 0.011 JORDAN + 83 05/04/2004 11:55 0075.000 012.900 0012.341 05.851 -227.574 0.009 JORDAN + 84 09/04/2004 06:27 0090.111 015.278 0014.828 05.945 -225.488 0.011 JORDAN + 85 19/04/2004 11:10 0103.364 017.773 0017.008 05.841 -223.300 0.013 JORDAN + 86 27/04/2004 11:28 0099.750 016.300 0016.414 05.993 -224.592 0.012 JORDAN + 87 27/04/2004 11:53 0090.667 015.722 0014.919 05.766 -225.098 0.011 JORDAN + 88 02/05/2004 11:01 0076.400 013.100 0012.572 05.842 -227.399 0.009 JORDAN + 89 02/05/2004 11:12 0089.889 015.622 0014.791 05.760 -225.186 0.011 JORDAN + 90 02/05/2004 12:20 0106.625 018.150 0017.545 05.812 -222.969 0.013 JORDAN + 91 06/05/2004 09:18 0107.833 018.533 0017.744 05.814 -222.633 0.013 JORDAN + 92 06/05/2004 08:47 0084.400 014.780 0013.888 05.719 -225.925 0.010 JORDAN + 93 06/05/2004 09:56 0153.833 022.700 0025.313 06.819 -218.978 0.019 ISRAEL + 94 06/05/2004 11:12 0099.455 017.282 0016.365 05.816 -223.730 0.012 JORDAN + 95 06/05/2004 11:34 0101.250 017.217 0016.661 05.874 -223.788 0.012 JORDAN + 96 12/05/2004 08:11 0057.250 010.250 0009.420 05.299 -229.899 0.007 JORDAN + 97 12/05/2004 11:14 0086.000 014.586 0014.151 05.932 -226.095 0.010 JORDAN + 98 12/05/2004 11:55 0080.667 014.083 0013.274 05.759 -226.536 0.010 JORDAN + 99 19/05/2004 09:09 0115.111 018.872 0018.942 06.088 -222.335 0.014 ISRAEL + 100 19/05/2004 11:08 0097.833 016.883 0016.098 05.825 -224.080 0.012 JORDAN + 101 19/05/2004 11:19 0112.857 019.100 0018.571 05.902 -222.135 0.014 JORDAN + 102 19/05/2004 11:41 0104.000 017.808 0017.113 05.835 -223.269 0.013 JORDAN + 103 22/05/2004 10:18 0071.200 012.390 0011.716 05.772 -228.021 0.008 JORDAN + 104 22/05/2004 10:59 0092.583 015.558 0015.235 05.913 -225.242 0.011 JORDAN + 105 22/05/2004 11:19 0116.533 019.380 0019.176 05.984 -221.890 0.014 JORDAN + 106 24/05/2004 11:30 0090.429 015.329 0014.880 05.928 -225.444 0.011 JORDAN + 107 24/05/2004 17:13 0078.125 012.925 0012.855 05.671 -227.552 0.009 JORDAN + PDF Editor

16
108 31/05/2004 10:07 0069.200 012.080 0011.387 05.695 -228.293 0.008 JORDAN + 109 31/05/2004 10:52 0031.000 005.875 0005.101 05.319 -233.736 0.004 ISRAEL + 110 31/05/2004 11:04 0093.400 016.130 0015.369 05.785 -224.741 0.011 JORDAN + 111 31/05/2004 11:15 0103.300 017.620 0016.998 05.821 -223.434 0.013 JORDAN + 112 06/06/2004 07:06 0073.667 012.750 0012.122 05.813 -227.706 0.009 JORDAN + 113 06/06/2004 15:05 0075.400 013.040 0012.407 05.807 -227.451 0.009 JORDAN + 114 12/06/2004 12:37 0067.222 011.889 0011.061 05.603 -228.461 0.008 JORDAN + 115 15/06/2004 13:00 0082.714 014.300 0013.611 05.696 -226.346 0.010 JORDAN + 116 18/06/2004 11:23 0103.857 016.800 0017.090 06.045 -224.153 0.013 JORDAN + 117 21/06/2004 08:59 0084.875 014.388 0013.966 05.819 -226.269 0.010 JORDAN + 118 21/06/2004 11:11 0092.700 016.120 0015.254 05.770 -224.679 0.011 JORDAN + 119 21/06/2004 11:39 0099.700 017.010 0016.406 05.832 -223.969 0.012 JORDAN + 120 22/06/2004 06:35 0097.545 016.836 0016.051 05.802 -224.121 0.012 JORDAN + 121 22/06/2004 11:10 0094.556 016.389 0015.559 05.786 -224.514 0.011 JORDAN + 122 24/06/2004 11:03 0086.000 015.114 0014.151 05.708 -225.632 0.010 JORDAN + 123 24/06/2004 11:08 0082.000 013.971 0013.971 05.881 -226.634 0.010 JORDAN + 124 24/06/2004 11:14 0101.083 017.483 0016.633 05.813 -223.554 0.012 JORDAN + 125 25/06/2004 08:49 0101.400 017.330 0016.685 05.819 -223.688 0.012 JORDAN + 126 25/06/2004 11:00 0100.545 017.382 0016.545 05.822 -223.643 0.012 JORDAN + 127 25/06/2004 11:18 0111.200 018.840 0018.298 05.889 -222.364 0.014 JORDAN + 128 25/06/2004 12:30 0109.000 018.500 0017.936 05.891 -222.662 0.013 JORDAN + 129 28/06/2004 07:31 0094.000 015.650 0015.468 06.015 -225.162 0.011 JORDAN + 130 24/01/2007 11:51 0100.500 017.320 0016.537 05.841 -223.697 0.012 JORDAN + 131 24/01/2007 12:20 0117.308 019.731 0019.303 05.956 -221.582 0.014 ISRAEL + 132 29/01/2007 10:08 0062.667 010.967 0010.312 05.718 -229.270 0.007 JORDAN + 133 29/01/2007 10:39 0051.000 009.575 0008.392 04.821 -230.491 0.006 JORDAN +
* The given depth in meters from the source (American, Soviet Union, Israel and Jordan Databases). = Nuclear explosions (Swiss database).
" Calibration explosions (Jordan and Israel Databases). + Mining explosions (Jordan Database).
PDF Editor