Micro-stamped surfaces for the patterned growth of neural stem cells

www.elsevier.com/locate/msec
Materials Science and Engineering C 23 (2003) 779–786
Ion beam induced nanometric structure and oligopeptide adsorption on
patterned polymer surfaces
C. Satrianoa,*, N. Spinellaa, M. Mansob, A. Licciardelloa, F. Rossib, G. Marlettaa
aLaboratory for Molecular Surfaces and Nanotechnologies (LAMSUN), Department of Chemical Sciences, University of Catania,
V. le Andrea Doria, 6, 95125 Catania, ItalybEuropean Commission, Joint Research Centre, 21020 Ispra VA, Italy
Abstract
The adsorption process of the H–Arg–Gly–Asp–OH oligopeptide (RGD sequence) onto surfaces of poly(ethyleneterephtalate) and
poly(caprolactone) patterned by 50 keVAr+ ion beams is discussed. The irradiation through masks patterned with micrometric features was
employed to create grooves and/or pits of nanometric depth. Both XPS and Imaging time-of-flight secondary-ion mass spectrometry (ToF-
SIMS) measurements showed that incubation of the polymer samples with RGD solutions produces a preferential adsorption on the ion-
irradiated areas of the PCL surfaces, while only a negligible adsorption is obtained onto PET. The adsorption behaviour of the RGD is found
to correlate with the surface nanostructuring induced by the ion irradiation.
D 2003 Elsevier B.V. All rights reserved.
PACS: 82.65.Dp; 85.40.Ux; 85.40.Hp; 82.80.Ms; 61.80.�x
Keywords: Surface nanostructuring; RGD adsorption; Ion beam modification; Imaging TOF-SIMS
1. Introduction
Polymers are most frequently used in biomaterial field
as substrates for cell adhesion and growing. In general,
many cellular properties, such as viability, shape, move-
ment (‘‘cell guidance’’), cell signaling and gene expression,
have been discussed in terms of chemistry-related proper-
ties and/or topography of the polymer substrate at the
micro- and nanoscale [1–6]. On the other hand, a very
promising approach to achieve the cytocompatibility of a
given material is to prompt the tissue formation by means
of the controlled immobilization of specific adhesion
sequences of the extracellular proteins [7]. Among these,
one of the most common adhesive sequences is formed by
Arg–Gly–Asp (RGD). This peptide is found in cell-
binding domains of many extracellular matrix proteins,
including fibronectin, vitronectin, and type I collagen [8]
and it has been shown to be the preferred site where
integrins on the surface of cells may bind through specific
0928-4931/$ - see front matter D 2003 Elsevier B.V. All rights reserved.
doi:10.1016/j.msec.2003.09.095
* Corresponding author. Tel.: +39-095-7385075; fax: +39-095-336422.
E-mail address: [email protected] (C. Satriano).
ligand–receptor interactions, eliciting different cellular
responses, including adhesion, spreading and focal contact
adhesion [9].
In this paper, we report a bioengineering methodology
to promote selective cell response to patterned surfaces,
based on the preferential adsorption of the RGD tripeptide
on poly(ethyleneterephtalate) and poly(caprolactone) surfa-
ces irradiated by 50 keV Ar+ to obtain groove or pit arrays
of nanometer depth distributed in lateral micrometric
patterns.
2. Materials and methods
2.1. Preparation, surface modification and characterization
of the polymer films
Poly(q-caprolactone) (PCL) and poly(ethyleneterephta-
late) (PET) films (from Aldrich) were deposited on p-doped
silicon (100) wafers by spin coating (3000 rpm, 60 s, room
temperature) of a chloroform (PCL) or a 20/80 mixture of
chloroform/1,1,1,3,3,3-Hexafluoro-2-propanol (PET) solu-
tion of the dissolved powders. The thicknesses of the
deposited films were, respectively, 100(F 20) nm for PCL
C. Satriano et al. / Materials Science and Engineering C 23 (2003) 779–786780
and 600(F 50) nm for PET, as measured from an alpha-step
profilometer. The surface patterning was performed by
irradiation through nickel masks with 50 keV Ar+ at a
fluence of 1�1015 ions/cm2 (RT, chamber pressure better
than 10� 5 Pa, current density of 1.5 AA/cm2). Typical
examples of the standard patterns are reported in Fig. 1.
The diameters of the dots and the width of the stripes were
20, 60, 80, 160 and 360 Am, the pitch between the dots or
stripes ranged between 120 and 500 Am. Optical microsco-
py showed that a good control of the lateral dimension of
the features at the micrometer scale is obtained by Ar+
irradiation. After irradiation, the samples were aged in the
laboratory atmosphere for 1 week before both surface
physico-chemical characterization and peptide adsorption
experiments.
2.1.1. X-ray photoelectron spectroscopy (XPS)
XPS analysis was carried out with a PHI 5600 Multi
Technique Spectrometer equipped with a dual Al/Mg
anode, a hemispherical analyzer and an electrostatic lens
system (Omni Focus III). The electron take-off angle was
45j and the analyzer was operated in FAT mode by using
the Al Ka1,2 radiation with pass energies of 187.85 and
11.75 eV for survey and detailed scans, respectively.
Fig. 1. OM micrographs of PCL pattern
According to the attenuation length value of 2.8 nm for
N1s photoelectrons [10] in organic materials, the estimated
vertical sampling depth is about 6.0 nm. The spectra were
analyzed by using an iterative least squares fitting routine
based on Gaussian peaks and the Shirley background
subtraction. Binding energies (BEs) of all the spectra were
referenced to the intrinsic hydrocarbon-like C1s peak at
285 eV.
2.1.2. Optical microscopy (OM) and atomic force micro-
scopy (AFM)
Optical Microscopy was performed by means of a
Leika DM-RME microscope with 50 to 1000� magnifi-
cation equipped with a Polaroid digital camera. The
surface micro- and nano-topography as well as the rough-
ness were measured with a Multimode/Nanoscope IIIA
Atomic Force Microscope (Digital Instruments) in tapping
mode in air with a standard silicon tip. The relative room
humidity was 30% and the room temperature was 25 jC.Data were acquired on square frames having edges of 10
Am, 1 Am and 350 nm. Images were recorded using
height, phase-shift and amplitude channels with 512� 512
measurement points (pixels). Measurements were made
twice or three times on different zones of each sample.
ed surfaces with grooves and pits.
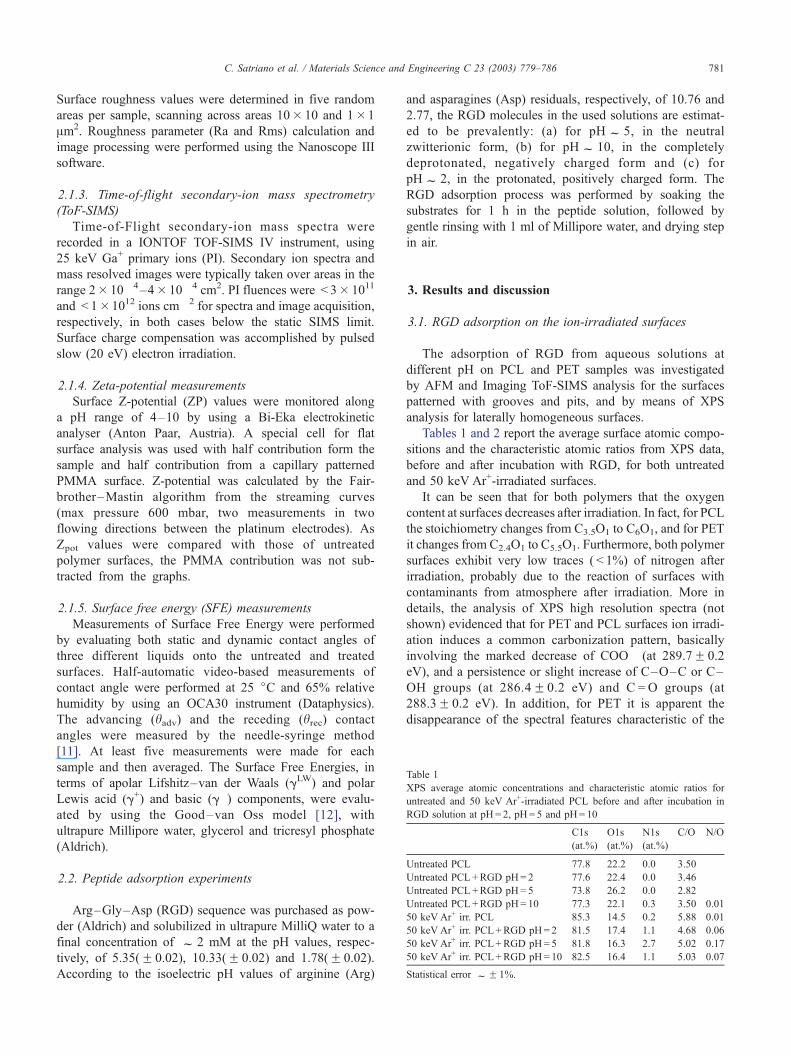
Table 1
XPS average atomic concentrations and characteristic atomic ratios for
untreated and 50 keV Ar+-irradiated PCL before and after incubation in
RGD solution at pH= 2, pH= 5 and pH= 10
C1s
(at.%)
O1s
(at.%)
N1s
(at.%)
C/O N/O
Untreated PCL 77.8 22.2 0.0 3.50
Untreated PCL+RGD pH= 2 77.6 22.4 0.0 3.46
Untreated PCL+RGD pH= 5 73.8 26.2 0.0 2.82
Untreated PCL+RGD pH= 10 77.3 22.1 0.3 3.50 0.01
50 keV Ar+ irr. PCL 85.3 14.5 0.2 5.88 0.01
50 keV Ar+ irr. PCL+RGD pH=2 81.5 17.4 1.1 4.68 0.06
50 keV Ar+ irr. PCL+RGD pH=5 81.8 16.3 2.7 5.02 0.17
50 keV Ar+ irr. PCL+RGD pH=10 82.5 16.4 1.1 5.03 0.07
Statistical error fF 1%.
C. Satriano et al. / Materials Science and Engineering C 23 (2003) 779–786 781
Surface roughness values were determined in five random
areas per sample, scanning across areas 10� 10 and 1�1
Am2. Roughness parameter (Ra and Rms) calculation and
image processing were performed using the Nanoscope III
software.
2.1.3. Time-of-flight secondary-ion mass spectrometry
(ToF-SIMS)
Time-of-Flight secondary-ion mass spectra were
recorded in a IONTOF TOF-SIMS IV instrument, using
25 keV Ga+ primary ions (PI). Secondary ion spectra and
mass resolved images were typically taken over areas in the
range 2� 10� 4–4� 10� 4 cm2. PI fluences were < 3� 1011
and < 1�1012 ions cm� 2 for spectra and image acquisition,
respectively, in both cases below the static SIMS limit.
Surface charge compensation was accomplished by pulsed
slow (20 eV) electron irradiation.
2.1.4. Zeta-potential measurements
Surface Z-potential (ZP) values were monitored along
a pH range of 4–10 by using a Bi-Eka electrokinetic
analyser (Anton Paar, Austria). A special cell for flat
surface analysis was used with half contribution form the
sample and half contribution from a capillary patterned
PMMA surface. Z-potential was calculated by the Fair-
brother–Mastin algorithm from the streaming curves
(max pressure 600 mbar, two measurements in two
flowing directions between the platinum electrodes). As
Zpot values were compared with those of untreated
polymer surfaces, the PMMA contribution was not sub-
tracted from the graphs.
2.1.5. Surface free energy (SFE) measurements
Measurements of Surface Free Energy were performed
by evaluating both static and dynamic contact angles of
three different liquids onto the untreated and treated
surfaces. Half-automatic video-based measurements of
contact angle were performed at 25 jC and 65% relative
humidity by using an OCA30 instrument (Dataphysics).
The advancing (hadv) and the receding (hrec) contact
angles were measured by the needle-syringe method
[11]. At least five measurements were made for each
sample and then averaged. The Surface Free Energies, in
terms of apolar Lifshitz–van der Waals (gLW) and polar
Lewis acid (g+) and basic (g�) components, were evalu-
ated by using the Good–van Oss model [12], with
ultrapure Millipore water, glycerol and tricresyl phosphate
(Aldrich).
2.2. Peptide adsorption experiments
Arg–Gly–Asp (RGD) sequence was purchased as pow-
der (Aldrich) and solubilized in ultrapure MilliQ water to a
final concentration of f 2 mM at the pH values, respec-
tively, of 5.35(F 0.02), 10.33(F 0.02) and 1.78(F 0.02).
According to the isoelectric pH values of arginine (Arg)
and asparagines (Asp) residuals, respectively, of 10.76 and
2.77, the RGD molecules in the used solutions are estimat-
ed to be prevalently: (a) for pHf 5, in the neutral
zwitterionic form, (b) for pHf 10, in the completely
deprotonated, negatively charged form and (c) for
pHf 2, in the protonated, positively charged form. The
RGD adsorption process was performed by soaking the
substrates for 1 h in the peptide solution, followed by
gentle rinsing with 1 ml of Millipore water, and drying step
in air.
3. Results and discussion
3.1. RGD adsorption on the ion-irradiated surfaces
The adsorption of RGD from aqueous solutions at
different pH on PCL and PET samples was investigated
by AFM and Imaging ToF-SIMS analysis for the surfaces
patterned with grooves and pits, and by means of XPS
analysis for laterally homogeneous surfaces.
Tables 1 and 2 report the average surface atomic compo-
sitions and the characteristic atomic ratios from XPS data,
before and after incubation with RGD, for both untreated
and 50 keV Ar+-irradiated surfaces.
It can be seen that for both polymers that the oxygen
content at surfaces decreases after irradiation. In fact, for PCL
the stoichiometry changes from C3.5O1 to C6O1, and for PET
it changes from C2.4O1 to C5.5O1. Furthermore, both polymer
surfaces exhibit very low traces ( < 1%) of nitrogen after
irradiation, probably due to the reaction of surfaces with
contaminants from atmosphere after irradiation. More in
details, the analysis of XPS high resolution spectra (not
shown) evidenced that for PET and PCL surfaces ion irradi-
ation induces a common carbonization pattern, basically
involving the marked decrease of COO� (at 289.7F 0.2
eV), and a persistence or slight increase of C–O–C or C–
OH groups (at 286.4F 0.2 eV) and C = O groups (at
288.3F 0.2 eV). In addition, for PET it is apparent the
disappearance of the spectral features characteristic of the

Table 2
XPS average atomic concentrations and characteristic atomic ratios for
untreated and 50 keV Ar+-irradiated PET before and after incubation in
RGD solution at pH= 2, pH= 5 and pH= 10
C1s
(at.%)
O1s
(at.%)
N1s
(at.%)
C/O N/O
Untreated PET 70.3 29.7 0.0 2.37 0.00
Untreated PET+RGD pH= 2 76.0 23.2 0.9 3.28 0.04
Untreated PET+RGD pH= 5 76.0 23.2 0.8 3.28 0.03
Untreated PET+RGD pH= 10 74.3 25.0 0.7 2.97 0.03
50 keV Ar+ irr. PET 85.6 14.0 0.4 6.11 0.03
50 keV Ar+ irr. PET+RGD pH= 2 82.4 16.1 1.5 5.12 0.09
50 keV Ar+ irr. PET+RGD pH= 5 84.6 14.4 1.0 5.88 0.07
50 keV Ar+ irr. PET+RGD pH= 10 84.0 15.6 0.4 5.38 0.03
Statistical error =F 1%.
C. Satriano et al. / Materials Science and Engineering C 23 (2003) 779–786782
aromatic structure (i.e., the shake-up bands at about 6–7 eV
from the main O1s and C1s peaks).
The analysis of nitrogen concentration in Tables 1 and 2
clearly shows that after incubation in RGD solution, only
irradiated PCL surfaces exhibit a preferential adsorption of
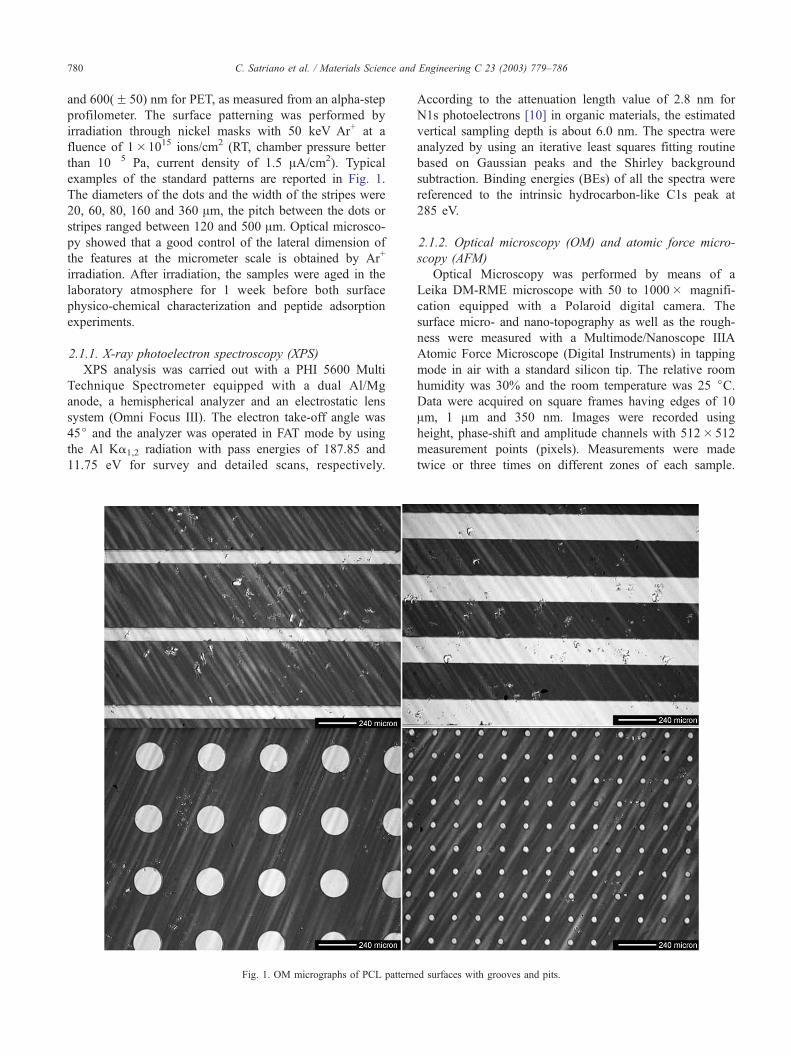
Fig. 2. Tapping mode AFM height images of: (a) a pit region on PCL; a region ou
before (d) and after (e) RGD incubation.
peptide onto irradiated surfaces, with a major effect at
pH = 5. For PET surfaces, the adsorption experiments show
no selectivity and very low adsorption (f 1% of N
content) going from the unirradiated samples to the irradi-
ated ones.
Fig. 2 shows the AFM height images of a pit patterned
by irradiation in a PCL surface (Fig. 2a), with the zoom
areas taken outside (Fig. 2b–c) and the ones taken inside
the pit (Fig. 2d–e), before and after RGD incubation. The
area outside the pit exhibits a very rough topography both
before and after incubation with RGD, the height of the
features being about 20 nm, with Rms values, respectively,
of f 4 nm before and f 3 nm after incubation. At
variance of this, the irradiated area inside the pit exhibits
much lower features, with a typical height of f 8 nm and
Rms f 1 nm. This surface becomes even smoother after
incubation, with features high f 5 nm and Rms values
of f 0.8 nm.
A confirmation of the occurrence of RGD preferential
adsorption in the irradiated grooves and pits was obtained
tside the pit before (b) and after (c) RGD incubation; a region inside the pit

C. Satriano et al. / Materials Science and Engineering C 23 (2003) 779–786 783
from Tof-SIMS imaging. Fig. 3 displays the ToF-SIMS
negative mass-resolved ion images of a pit-patterned PCL
and a groove-patterned PET sample. The images were
obtained by selecting characteristic fragments for RGD-
incubated samples, as well as those based on the lack of
the substrate-characteristic peaks. In particular, for both
PCL and PET irradiated surfaces the prevalence in the
irradiated areas of the peaks due to NH� (m/z= 15), CN�
(m/z = 26), C2H2� (m/z = 26) and CNO� (m/z = 42) was
clearly observed. On the other hand, in the maps of
fragments related to the polymer matrix, while a good
contrast was observed in the case of PET (images based
on C6H4� and C7H5O2
� at m/z 76 and 121, respectively), in
the case of PCL (images based on fragments at m/z 113
and 115, assigned to C6H9O2� and C6H11O2
�), contrast was
not very good. It is to note that, the ion images of the bare
samples before the incubation with RGD were qualitative-
Fig. 3. ToF-SIMS mass resolved images of RGD-incubated surfaces of PCL with
ion images (TIC) are shown as well.
ly similar to those of incubated samples, due to the
interference of nitrogen-containing species due to the
post-irradiation reaction in atmosphere of the surfaces
(see above).
In any case, significant differences between irradiated and
non-irradiated areas are evidenced from the high mass
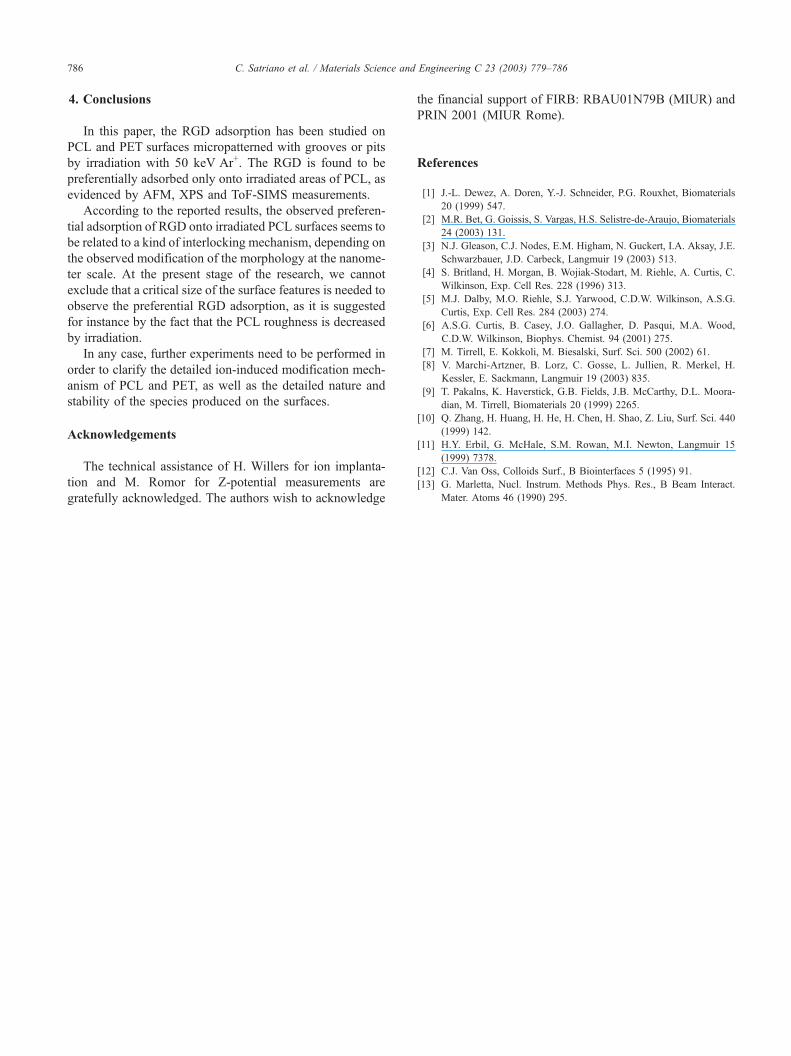
resolution spectra. Fig. 4, for example, reports the regions
around nominal m/z 42 and 43, where CNO� and C2H3O�
fragments are observed. The CNO� to C2H3O� intensity
ratio is about 0.12 for both untreated PET (Fig. 4a–b) and
PCL (Fig. 4c–d) irrespectively of the fact that the sample
were or not incubated with RGD. The ratio increases to f 1
for both bare irradiated PET (Fig. 4e) and PCL (Fig. 4g), due
to the post-irradiation uptake of N-containing species at
surfaces. After the RGD incubation, a further increase of
CNO� intensity (relative to that of the C2H3O�) is observed,
leading to a ratio of f 4 for PCL (Fig. 4h) and f 2.5 for
a pit (upper panels) and PET with a groove (lower panels). Total secondary

Fig. 5. Zeta-potential curves for unirradiated and 50 keVAr+-irradiated PCL
(a) and PET (b) samples.
Fig. 4. Portion of high resolution spectra showing the intensity behaviour of
CNO� (m/z = 42) and C2H3O� (m/z 43) for: (a) PET untreated, (b) PET
untreated +RGD, (c) PCL untreated, (d) PCL untreated +RGD, (e) 50 keV
Ar+-irr. PET, (f) 50 keV Ar+-irr. PET+RGD, (g) 50 keV Ar+-irr. PCL, (h)
50 keV Ar+-irr. PCL+RGD.
C. Satriano et al. / Materials Science and Engineering C 23 (2003) 779–786784
PET (Fig. 4f). These findings indicate that actually, in the
limit of the ToF-SIMS sensitivity, ion irradiation prompts the
RGD adsorption on both kinds of polymers and that, in
agreement with the XPS data, the uptake of RGD is more
efficient for PCL than for PET.
3.2. Surface properties of the patterned areas
The very important issues concerning the properties of
the interface with an aqueous solution were studied by
means of zeta-potential measurements (ZP), providing the
surface charge in various pH conditions. Furthermore, also
the total surface free energy and the related polar and
dispersive components were investigated by using the
contact angle technique.
Fig. 5 reports the ZP curves for PCL and PET unirradi-
ated and irradiated surfaces, investigated both immediately
after the modification (fresh surfaces) and after 1 week of
aging in atmosphere (aged surfaces). One can see that the
behavior of the Ar+-irradiated PCL surfaces does not suffer
any drastic modifications of the surface charge with respect
to the untreated PCL film (Fig. 5a). At variance of this, PET
samples after Ar+ irradiation (Fig. 5b) showed clear eviden-
ces of a remarkable increase of the absolute surface charge
for pH higher than 6 with respect to the unirradiated one.
After the aging, the surface charge recovers the originary
value.
As to the surface free energy properties, the wettability
measurements did not show meaningful changes of both
static and dynamic water contact angle values. In fact both
polymers, having static water contact angles on the unirra-
diated surfaces, respectively, of 69.6F 0.7j for PCL and of
73.1F 0.1j for PET, still remain quite hydrophobic also
after Ar+ irradiation, exhibiting just a restricted change of
contact angle values in the range of 10j. However, the
thorough investigation of the surface free energies in terms
of the Lifshitz–van der Waals and Lewis acid–base com-
ponents indicated that for PCL the polar acid–base param-
eter increases from almost 0 for the untreated surface to f 3
mJ/m2 after irradiation, which is quite the same as the ones
measured for PET before and after irradiations. According-
ly, the preferential RGD adsorption onto PCL cannot be
justified in terms of the SFE effects.
The other important surface parameter possibly affect-
ing the adsorption behaviour is the nanometer-scale
morphology. This has been measured by AFM technique.
Fig. 6 reports the AFM height-images and the cor-

Fig. 8. AFM height images at 10 and 1 Am scale for PCL untreated (a) and
50 keV Ar+-irradiated (b).
Fig. 6. AFM height images and section analysis of a pit area for PCL (a)
and PET (b) surfaces.
C. Satriano et al. / Materials Science and Engineering C 23 (2003) 779–786 785
responding section analysis of the area around a pit
obtained by 50 keV Ar+-irradiation, respectively, for
PCL (a) and PET (b). It appears clearly that very
different depths are obtained for the two polymers, being
f 40 nm for PCL and f 70 nm for PET, respectively. It
is to recall that the huge decrease in thickness observed
for the irradiated areas is due to the densification pro-
cesses, related to the complex chemical reactions induced
by ion irradiation [13].
Fig. 6 shows also clearly that the surface roughness
changes drastically only for PCL surfaces, the PET samples
keeping a very similar smooth morphology before and after
irradiation. Accordingly, both untreated (Fig. 7a) and 50
keVAr+-irradiated PET (Fig. 7b) surfaces do not exhibit any
significant structuring on the nanometer scale. At variance
Fig. 7. AFM height images at 10 and 1 Am scale for PET untreated (a) and
50 keV Ar+-irradiated (b).
of this, for PCL (Fig. 8) characteristic features of nanometric
dimensions, of average height and diameter, respectively, of
3.8F 0.8 and 106F 18, are developed under irradiation
(compare Fig. 8a, for unirradiated surfaces, and Fig. 8b
for the irradiated ones). The measured values for Rms and
Ra are listed in Table 3. Accordingly, the RGD adsorption
behaviour could be phenomenologically related to the much
stronger morphology modification induced by ion irradia-
tion on PCL at the nanometer scale with respect to the
unchanging smoothness of PET surfaces.
Table 3
Roughness parameters Rms, Ra and Rmax values (F standard deviations)
for PCL and PET surfaces, untreated and 50 keV Ar+-irradiated
Rms (nm) Ra (nm) Rmax (nm)
Unirradiated PCL 4.43F 0.76 3.64F 0.71 24.68F 2.04
50 keV Ar+-irradiated PCL 0.94F 0.31 0.75F 0.26 6.05F 1.82
Unirradiated PET 0.27F 0.11 0.19F 0.06 1.35F 0.11
50 keV Ar+-irradiated PET 0.22F 0.05 0.16F 0.03 1.97F 0.85
C. Satriano et al. / Materials Science and Engineering C 23 (2003) 779–786786
4. Conclusions
In this paper, the RGD adsorption has been studied on
PCL and PET surfaces micropatterned with grooves or pits
by irradiation with 50 keV Ar+. The RGD is found to be
preferentially adsorbed only onto irradiated areas of PCL, as
evidenced by AFM, XPS and ToF-SIMS measurements.
According to the reported results, the observed preferen-
tial adsorption of RGD onto irradiated PCL surfaces seems to
be related to a kind of interlocking mechanism, depending on
the observed modification of the morphology at the nanome-
ter scale. At the present stage of the research, we cannot
exclude that a critical size of the surface features is needed to
observe the preferential RGD adsorption, as it is suggested
for instance by the fact that the PCL roughness is decreased
by irradiation.
In any case, further experiments need to be performed in
order to clarify the detailed ion-induced modification mech-
anism of PCL and PET, as well as the detailed nature and
stability of the species produced on the surfaces.
Acknowledgements
The technical assistance of H. Willers for ion implanta-
tion and M. Romor for Z-potential measurements are
gratefully acknowledged. The authors wish to acknowledge
the financial support of FIRB: RBAU01N79B (MIUR) and
PRIN 2001 (MIUR Rome).
References
[1] J.-L. Dewez, A. Doren, Y.-J. Schneider, P.G. Rouxhet, Biomaterials
20 (1999) 547.
[2] M.R. Bet, G. Goissis, S. Vargas, H.S. Selistre-de-Araujo, Biomaterials
24 (2003) 131.
[3] N.J. Gleason, C.J. Nodes, E.M. Higham, N. Guckert, I.A. Aksay, J.E.
Schwarzbauer, J.D. Carbeck, Langmuir 19 (2003) 513.
[4] S. Britland, H. Morgan, B. Wojiak-Stodart, M. Riehle, A. Curtis, C.
Wilkinson, Exp. Cell Res. 228 (1996) 313.
[5] M.J. Dalby, M.O. Riehle, S.J. Yarwood, C.D.W. Wilkinson, A.S.G.
Curtis, Exp. Cell Res. 284 (2003) 274.
[6] A.S.G. Curtis, B. Casey, J.O. Gallagher, D. Pasqui, M.A. Wood,
C.D.W. Wilkinson, Biophys. Chemist. 94 (2001) 275.
[7] M. Tirrell, E. Kokkoli, M. Biesalski, Surf. Sci. 500 (2002) 61.
[8] V. Marchi-Artzner, B. Lorz, C. Gosse, L. Jullien, R. Merkel, H.
Kessler, E. Sackmann, Langmuir 19 (2003) 835.
[9] T. Pakalns, K. Haverstick, G.B. Fields, J.B. McCarthy, D.L. Moora-
dian, M. Tirrell, Biomaterials 20 (1999) 2265.
[10] Q. Zhang, H. Huang, H. He, H. Chen, H. Shao, Z. Liu, Surf. Sci. 440
(1999) 142.
[11] H.Y. Erbil, G. McHale, S.M. Rowan, M.I. Newton, Langmuir 15
(1999) 7378.
[12] C.J. Van Oss, Colloids Surf., B Biointerfaces 5 (1995) 91.
[13] G. Marletta, Nucl. Instrum. Methods Phys. Res., B Beam Interact.
Mater. Atoms 46 (1990) 295.
Copyright © 2022 FDOKUMEN