Local RNA Target Structure Influences siRNA Efficacy: A Systematic Global Analysis
Upload
independentCategory
view
2download
0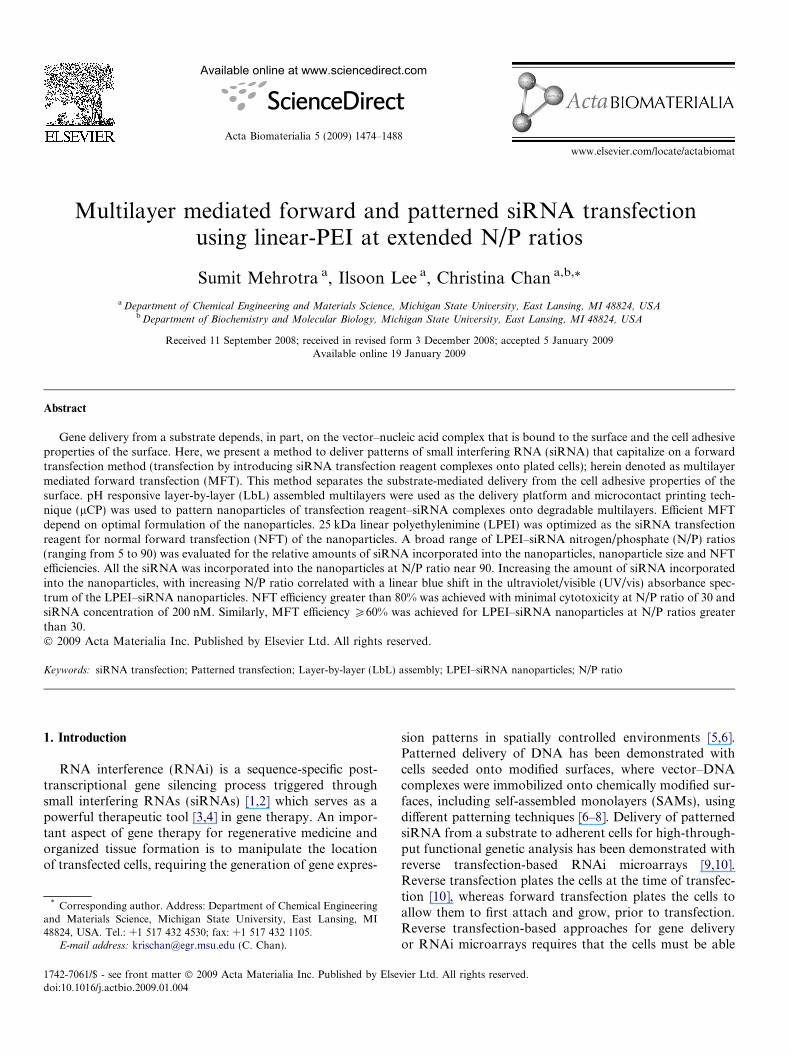
Available online at www.sciencedirect.com
Acta Biomaterialia 5 (2009) 1474–1488
www.elsevier.com/locate/actabiomat
Multilayer mediated forward and patterned siRNA transfectionusing linear-PEI at extended N/P ratios
Sumit Mehrotra a, Ilsoon Lee a, Christina Chan a,b,*
a Department of Chemical Engineering and Materials Science, Michigan State University, East Lansing, MI 48824, USAb Department of Biochemistry and Molecular Biology, Michigan State University, East Lansing, MI 48824, USA
Received 11 September 2008; received in revised form 3 December 2008; accepted 5 January 2009Available online 19 January 2009
Abstract
Gene delivery from a substrate depends, in part, on the vector–nucleic acid complex that is bound to the surface and the cell adhesiveproperties of the surface. Here, we present a method to deliver patterns of small interfering RNA (siRNA) that capitalize on a forwardtransfection method (transfection by introducing siRNA transfection reagent complexes onto plated cells); herein denoted as multilayermediated forward transfection (MFT). This method separates the substrate-mediated delivery from the cell adhesive properties of thesurface. pH responsive layer-by-layer (LbL) assembled multilayers were used as the delivery platform and microcontact printing tech-nique (lCP) was used to pattern nanoparticles of transfection reagent–siRNA complexes onto degradable multilayers. Efficient MFTdepend on optimal formulation of the nanoparticles. 25 kDa linear polyethylenimine (LPEI) was optimized as the siRNA transfectionreagent for normal forward transfection (NFT) of the nanoparticles. A broad range of LPEI–siRNA nitrogen/phosphate (N/P) ratios(ranging from 5 to 90) was evaluated for the relative amounts of siRNA incorporated into the nanoparticles, nanoparticle size and NFTefficiencies. All the siRNA was incorporated into the nanoparticles at N/P ratio near 90. Increasing the amount of siRNA incorporatedinto the nanoparticles, with increasing N/P ratio correlated with a linear blue shift in the ultraviolet/visible (UV/vis) absorbance spec-trum of the LPEI–siRNA nanoparticles. NFT efficiency greater than 80% was achieved with minimal cytotoxicity at N/P ratio of 30 andsiRNA concentration of 200 nM. Similarly, MFT efficiency P60% was achieved for LPEI–siRNA nanoparticles at N/P ratios greaterthan 30.� 2009 Acta Materialia Inc. Published by Elsevier Ltd. All rights reserved.
Keywords: siRNA transfection; Patterned transfection; Layer-by-layer (LbL) assembly; LPEI–siRNA nanoparticles; N/P ratio
1. Introduction
RNA interference (RNAi) is a sequence-specific post-transcriptional gene silencing process triggered throughsmall interfering RNAs (siRNAs) [1,2] which serves as apowerful therapeutic tool [3,4] in gene therapy. An impor-tant aspect of gene therapy for regenerative medicine andorganized tissue formation is to manipulate the locationof transfected cells, requiring the generation of gene expres-
1742-7061/$ - see front matter � 2009 Acta Materialia Inc. Published by Else
doi:10.1016/j.actbio.2009.01.004
* Corresponding author. Address: Department of Chemical Engineeringand Materials Science, Michigan State University, East Lansing, MI48824, USA. Tel.: +1 517 432 4530; fax: +1 517 432 1105.
E-mail address: [email protected] (C. Chan).
sion patterns in spatially controlled environments [5,6].Patterned delivery of DNA has been demonstrated withcells seeded onto modified surfaces, where vector–DNAcomplexes were immobilized onto chemically modified sur-faces, including self-assembled monolayers (SAMs), usingdifferent patterning techniques [6–8]. Delivery of patternedsiRNA from a substrate to adherent cells for high-through-put functional genetic analysis has been demonstrated withreverse transfection-based RNAi microarrays [9,10].Reverse transfection plates the cells at the time of transfec-tion [10], whereas forward transfection plates the cells toallow them to first attach and grow, prior to transfection.Reverse transfection-based approaches for gene deliveryor RNAi microarrays requires that the cells must be able
vier Ltd. All rights reserved.
S. Mehrotra et al. / Acta Biomaterialia 5 (2009) 1474–1488 1475
to adhere to the surface containing the expression vector,or the substrates must be chemically modified to immobi-lize the non-adherent cell lines [11]. Gene delivery from asubstrate depends, in part, on the vector–nucleic acid com-plex that is bound to the surface [6]. Various parameterssuch as surface charge, hydrophobicity/hydrophilicity [8],rigidity of the cell adhesion substrates [12] all contributeto the molecular interactions between the vector and thepolymer on the surface. Any chemical modification of thesubstrates that may enhance cell adhesion could adverselyaffect the release of the vector–nucleic acid complexes fromthe surface and thus interfere with cellular internalizationof the polymer–nucleic acid complexes [6], and efficientgene delivery. The present study describes a method forforward transfection of siRNA, yielding micron-sized pat-terns of transfected mammalian cells. With this method,the cells are cultured separately from a degradable LbLassembled multilayer arrayed with the siRNA, thereby sep-arating the two issues, the complex release from, and thecell adhesion on the substrate.
The layer-by-layer (LbL) assembly method introducedby Decher and co-workers [13,14] for multilayer thin filmformation is an attractive approach for controlled releaseof biomolecules from surfaces [15,16]. LbL thin films pro-vide flexibility in terms of their choice of substrate and con-stituent components, surface patterning techniques,fabrication conditions, and tunable structural properties[16]. Other advantages include their ease of preparationand cost-effectiveness. Different patterning techniques can
Fig. 1. Diagram illustrating the multilayer mediated forward transfection
be employed to conjugate biomolecules, such as nucleicacids, to multilayer structures. Soft-lithographic microcon-tact printing (lCP) [17,18] is one such technique, which hasemerged as a platform of choice for biochips and drugdelivery applications [19]. Various ‘‘inks”, including, pro-teins, DNA, RNA, and polyelectrolytes have been usedin lCP to pattern surfaces without the need for dust-freeenvironments and harsh chemical treatments [20].
A previous method of in vitro localized transfection ofcultured cells from multilayer thin films did not involvepatterned delivery of DNA from these films [21]. None-theless, LbL thin film application of reverse transfectionof DNA to form cell microarrays have been previouslydemonstrated [22], but the method is not easily appliedto siRNA due to the enhanced susceptibility of siRNAsto degradation as compared to DNAs [3,23]. Approachesto embed the polymer and nucleic acid alternatively toform LbL films [24] or embed the polymer–nucleic acidcomplexes within the multilayers [25] have not involvedpatterned delivery. Thus, spatially controlled delivery ofsiRNA based on thin film chemistries has yet to berealized.
Here, we describe the application of a LbL assembleddegradable multilayer film for patterned delivery of siRNAusing a forward transfection approach. The transfectionprocess involved the following steps (Fig. 1). (1) pH con-trolled, biocompatible, and degradable multilayers werefabricated using LbL assembly under acidic conditions[26]. (2) Nanoparticles of vector–siRNA complexes pre-
(MFT) of cationic vector complexed siRNA for patterned delivery.
1476 S. Mehrotra et al. / Acta Biomaterialia 5 (2009) 1474–1488
pared at physiological pH conditions were used as ‘‘ink” inlCP to form patterns on multilayer substrates. (3) Multi-layer substrate containing patterned nanoparticles laid ontop of cells at physiological pH conditions degraded themultilayer and formed patterns of transfected cells. Thismethod is a variation of the forward transfection tech-nique; herein denoted as the multilayer mediated forwardtransfection (MFT) method. Quantification of MFT effi-ciencies with linear polyethylenimine (LPEI)-siRNA nano-particles found nitrogen/phosphate (N/P) ratios P30 gavesignificant transfection (P60%). MFT of patterned siRNAprovides an efficient and simple approach to spatially con-trolled siRNA delivery for tissue engineering applications.This method also provides a proof-of-concept studytowards the eventual development of a forward transfec-tion-based cell microarray.
Efficient MFT is contingent on the formulation of thevector–siRNA nanoparticles. Normal forward transfec-tion (NFT) was evaluated for a suitable range of nano-particle formulations for MFT, using 25 kDa LPEI asthe non-viral gene delivery vector. Among the polymericvectors, PEI is the gold standard for gene delivery, butits high transfection efficiency is often associated withhigh cytotoxicity [27,28]. In addition, despite the superfi-cial similarities of siRNAs and DNAs, their distinct char-acteristics, such as molecular weight and topography[3,23,29], results in significant differences in their optimaldelivery formulation with transfection reagents [29].Therefore, delivery vehicles and transfection conditionsmust be designed and optimized to cater to their individ-ual requirements for efficient delivery. The use of PEI[23,27,28,30–38] as a polymeric DNA transfection reagenthas been studied extensively, with PEI–DNA complexesanalyzed for a broad range of N/P ratios [30–32,35–37],up to a N/P ratio of 135 [31]. However, to our knowl-edge, reported studies with siRNA transfection has beenlimited to narrow ranges of PEI–siRNA compositions(mostly limited to N/P ratio of 10) [23,33,34,37,38], untilrecently [39]. A recent study characterized ketal modifiedand unmodified branched PEI (BPEI)–siRNA complexesup to a N/P ratio of 100 [39], but a similar N/P ratioanalysis has not been performed with LPEI. 22 kDa LPEIwas reported unable to provide in vitro siRNA transfec-tion, while 25 kDa BPEI successfully mediated siRNAtransfection (with 200 nM siRNA) at N/P ratios up to 8[33]. However, BPEI is more cytotoxic than LPEI[27,33]. Thus, there is a need for a less toxic form ofPEI that can provide siRNA silencing (preferably, bettersilencing), at similar or lower siRNA concentrations thanused previously with BPEI.
Therefore, in this study we evaluated a broad range ofLPEI–siRNA N/P ratios (ranging from 5 to 90) using25 kDa LPEI as the transfection reagent. For comparison,25 kDa BPEI was also evaluated as a transfection reagent.Our results indicated LPEI to be a better siRNA transfec-tion reagent than BPEI using siRNA concentration of200 nM. We characterized the LPEI–siRNA nanoparticles
for this range of N/P ratios. We found that: (1) completeincorporation of the siRNA was achieved at N/P ratio near90, which produced transfection efficiency greater than90% and nanoparticles �50 nm in size, (2) partial incorpo-ration of the siRNA was observed at N/P ratios between 30and 75, which produced transfection efficiencies greaterthan 80%. The nanoparticle size was �150 nm for N/Pratios between 30 and 60 and less than 100 nm for N/Pratio of 75, and (3) further reduction in the incorporationof siRNA was observed at N/P ratios of 5 and 15, no trans-fection was observed at N/P ratio of 5 and �40% transfec-tion was observed at N/P ratio of 15. The nanoparticlessize was greater than 200 nm for N/P ratio of 5 and�150 nm for N/P ratio of 15. Finally, N/P ratio of 30 forLPEI–siRNA nanoparticles was optimal for achieving highNFT (�85%) transfection efficiency with minimumcytotoxicity.
2. Materials and methods
2.1. Materials
Poly(acrylic acid, sodium salt) solution (PAA, MW
15,000; catalog No. 416037), poly(ethylene glycol) (PEG,MW 10,000; catalog No. P6667), and branched polyethy-lenimine (BPEI, MW 25,000; catalog No. 408727) were pur-chased from Sigma–Aldrich (USA). The linearpolyethylenimine (LPEI, MW 25,000; catalog No. 23966)was obtained from Polysciences, Inc. (Warrington, PA).Poly(dimethylsiloxane) (PDMS) from the Sylgard 184 sili-cone elastomer kit (Dow Corning, Midland, MI) was usedto prepare stamps. Barnstead Nanopure Diamond (Barn-stead International, Dubuque, IA) purification systemwas used as a source for deionized (DI) water with a resis-tivity of 18.2 MX cm. Solution pH was adjusted using HClor NaOH. Layer-by-layer (LbL) assembled multilayer filmswere made on quartz slides (Technical Glass Products, OH)that were cut to fit 12-well tissue culture polystyrene(TCPS) plates (Costar, Corning, NY). Lipofectamine2000 (LF2k) transfection reagent (1 mg ml�1), OptiMEMreduced serum medium (catalog No. 31985), Dulbecco’sModified Eagle Medium (DMEM), penicillin, streptomy-cin, were purchased from Invitrogen (Carlsbad, CA). Fetalbovine serum (FBS) was purchased from Biomedia Corp(Foster City, CA). HeLa cells were purchased from Amer-ican Type Culture Collection (Rockville, MD). Customsynthesized siRNA with sense sequence 50-GGUGAAGGUAGAUCAAAGAdTdT-30 and anti-sensesequence 50-UCUUUGAUCUACCUUCACCdTdT-30,targeting human double-stranded RNA-dependent proteinkinase (PKR) mRNA was purchased from Dharmacon(Chicago, IL), and diluted to a concentration of 80 lM.Fluorescein and Alexa Fluor-555 conjugated double-stranded RNA (dsRNA) oligomers (Block-iT Fluorescentand Block-iT Alexa Fluor Red Fluorescent Oligos) (Invit-rogen, Carlsbad, CA) were used to demonstrate patterneddelivery in MFT.
S. Mehrotra et al. / Acta Biomaterialia 5 (2009) 1474–1488 1477
2.2. Cell culture
HeLa cells were maintained in DMEM with 10% FBSand 100 U ml�1 penicillin plus 100 lg ml�1 streptomycin(P/S) at 37 �C and 10% CO2. For transfection and cytotox-icity studies, HeLa cells were cultured and grown to com-plete confluency in 12-well plates in 1.2 ml of P/S freeDMEM supplemented with 10% FBS.
2.3. Degradable layer-by-layer (LbL) multilayer fabrication
Hydrogen (H)-bonded (PAA/PEG)n.5 multilayers werefabricated at a deposition pH of 2.0. PAA and PEGpolymer solutions used to fabricate multilayer assemblieswere prepared in DI water to final concentrations of1 mg ml�1. The pH of both solutions was adjusted to2.0 and filtered with a 0.22 lm cellulose acetate filter(Corning, NY). DI water adjusted to pH 2.0 was usedas the wash solution. PAA (pKa�5) [40] consists ofCOO� terminal groups, which due to their acidificationforms H-bond with PEG molecules at low pH conditions[26]. These H-bonded multilayers degrade upon immers-ing into physiological pH conditions [26]. Quartz slideswere cleaned in piranha solution (7:3; concentrated sulfu-ric acid: 30% hydrogen peroxide), dried under N2 gasand further cleaned using a plasma cleaner (Harrick Sci-entific Corporation, NY) for 10 min at 0.15 torr and50 sccm flow of O2. A Carl Zeiss slide stainer was usedto deposit multilayers on quartz substrates. Quartz sub-strates were immersed in 100 mM LPEI solution for30 min to provide an initial positive charge and thenrinsed in DI water for 3 min with agitation. Subse-quently, the substrates were dipped into PAA solutionfor 15 min followed by 3 min in wash solution with agi-tation. The substrates were then dipped into PEG solu-tion for 15 min followed by 3 min in wash solutionwith agitation to create one bilayer. The dipping cyclewas repeated to form multilayer films. Different numbersof bilayers of PAA and PEG were prepared with PAA asthe terminating layer in each case. Multilayer films areabbreviated as (PAA/PEG)n.5, where n is the numberof PAA and PEG bilayers and the ‘‘.5” indicates anadditional, single terminating layer of PAA.
2.4. PDMS preparation
Patterned PDMS stamps were created by curingdegassed prepolymer and initiator (10:1) mixture againsta microfabricated silicon master in an oven overnight at60 �C, as described elsewhere [17]. The masters consistedof features: parallel lines from 200 to 250 lm and squaresfrom 200 to 700 lm. Non-patterned PDMS stamps wereprepared against a plane silicon wafer as the master.PDMS stamps were cut to the size of multilayer substratein order to obtain uniform transfer of nanoparticles withminimum loss during the stamping process.
2.5. PEI–siRNA nanoparticle formation
LPEI (100 mM) and BPEI (1 mM) stock solutions(molarities with respect to repeat units of the polymer)were prepared in DI water and adjusted to pH 7.2. Solu-tions were filtered with a 0.22 lm filter, particularly LPEIfor UV/vis characterizations, and stored at 4 �C. Volumesof LPEI or BPEI mixed with siRNA were calculated for thedifferent nitrogen/phosphate (N/P) ratios (the ratio of prot-onable amine groups on PEI to phosphates on siRNA).OptiMEM was used as a buffer to prepare nanoparticlesin all cases, except for the zeta (f)-potential analysis. N/Pratios of 5, 15, 30, 45, 60, 75, and 90 were used forLPEI–siRNA and N/P ratios of 5, 10, and 15 were usedfor BPEI–siRNA formulations. Solutions of PEI and siR-NA were prepared separately in OptiMEM buffer (at phys-iological pH) at the calculated concentrations (at roomtemperature), and mixed within 5 min after their prepara-tion. For agarose gel electrophoresis assay, UV/vis, f-potential, DLS, NFT and cytotoxicity studies; PEI andsiRNA solutions were prepared in separate volumes of100 ll, giving 200 ll of mixed volume. For MFT, f-poten-tial analysis of the nanoparticles released from the multi-layers, SEM and AFM; PEI and siRNA solutions wereprepared in separate volumes of 12.5 ll and mixed to give25 ll of nanoparticles. PEI–siRNA mixture was kept atroom temperature for 30 min prior to use in transfectionor characterization studies, unless specified otherwise.
2.6. Nanoparticle stamping (microcontact printing) ontomultilayers
After multilayer and nanoparticle formation, the nextstep of MFT was stamping of the nanoparticles onto themultilayer using PDMS as the stamping elastomer. PDMSstamps were plasma treated for 2 min and drop-coatedwith nanoparticles. The plasma treatment facilitatedspreading of the nanoparticle ink, enabling temporary elec-trostatic interactions between the nanoparticles and theSiO� groups on the PDMS. To minimize loss of the nano-particles, the stamps were air-dried for 45 min rather thandried with N2 assistance. As the nanoparticle ink dried, thePDMS recovered partial hydrophobicity causing the driednanoparticles on the surface to have weaker interactiveforces with the PDMS. Nanoparticles were transferred to(PAA/PEG)n.5 multilayers through lCP. During stamping,the weak binding of the nanoparticles to the PDMS facili-tated their transfer to the PAA terminated multilayer.Non-patterned stamps were used for quantifying the trans-fection efficiency.
2.7. Normal forward transfection (NFT) and multilayer
mediated forward transfection (MFT)
HeLa cells were transfected with different nanoparticleformulations for 48 h and the cell culture medium (P/S
1478 S. Mehrotra et al. / Acta Biomaterialia 5 (2009) 1474–1488
free, 10% FBS supplemented DMEM) was not changedpost-transfection.
2.7.1. NFT
LPEI–siRNA nanoparticle solution (200 ll) was addedto the cultured cells in 1 ml of fresh cell culture medium.For NFT, the final concentration of siRNA was 200 nM,unless specified otherwise. For comparison, LF2k (2 lg)and BPEI were also used as transfection reagents, with40 pmol (�33 nM) and 240 pmol (�200 nM) final concen-tration of siRNA, respectively.
2.7.2. MFT
Multilayer quartz substrates containing the LPEI–siR-NA nanoparticles were sterilized under UV light for atleast 15 min. Prior to transfection the cell culture mediumwas removed, and the quartz substrate was placed top-down onto the cultured cells. 1.2 ml of fresh culture med-ium was added. For MFT, 240 pmol of siRNA(�200 nM final concentration in NFT) was used, unlessspecified otherwise. For comparison, LF2k (2 lg) with40 pmol of siRNA (�33 nM final concentration in NFT)was also evaluated.
2.8. Characterization
2.8.1. Agarose gel electrophoresis assay
Relative amount of free siRNA in the LPEI–siRNAnanoparticle preparation at each N/P ratio was evaluatedby a gel retardation assay. Nanoparticles were preparedas described above at a constant siRNA concentration of200 nM at each N/P ratio. A 15 ll aliquot of the sampleswith 3 ll of loading buffer (Bio-Rad, CA) was loaded on a0.8% agarose gel prepared in 1� Tris–boric acid–EDTA(TBE) buffer (Bio-Rad, CA). Electrophoresis of theLPEI–siRNA nanoparticles was run in 1� TBE buffer at110 V for 30 min. siRNA bands were visualized usingSYBR gold nucleic acid gel stain (Invitrogen) and a UVtransilluminator.
2.8.2. Ultraviolet/visible (UV/vis) absorbance
LPEI–siRNA nanoparticle solutions prepared from750 nM final concentration of siRNA at the different N/Pratios were diluted to 1.2 ml of OptiMEM buffer (at phys-iological pH). Higher siRNA concentration was used toobtain measurable absorbance values which did not alterthe calculation of the amount of siRNA incorporated intothe nanoparticles. UV/vis peaks were measured in a 10 mmpath length quartz cuvette at 25 �C and with a wavelengthinterval of 1 nm using SPECTRAmax Plus 384 (MolecularDevices, CA). Variations in absorbance values wereobserved between different LPEI polymer lots purchasedfrom Polysciences Inc.
2.8.3. Scanning electron microscopy (SEM)
Constant siRNA amount of 240 pmol (�200 nM finalconcentration in NFT) was used with varying concentra-
tions of LPEI. SEM images of air-dried nanoparticles werecollected with a field emission JEOL 6300F electronmicroscope.
2.8.4. Dynamic light scattering (DLS)
LPEI–siRNA nanoparticle solutions prepared from750 nM final concentration of siRNA at the different N/Pratios were diluted to 3.0 ml of total volume in OptiMEMbuffer (at physiological pH). Hydrodynamic particle size ofLPEI–siRNA nanoparticles was determined by DLS at25 �C with a 90Plus/BI-MAS multi-angle particle size ana-lyzer (Brookhaven Instruments Corp., NY). The wave-length of the 15 mW solid laser used was 660 nm, and thescattering angle used was 90�. A dust filter value of 30was used. Refractive index for particles in each samplewas taken as 1.50 + 0i. Refractive index and viscosity ofthe aqueous suspension used was 1.33 and 0.89 cP, respec-tively. Measurements were performed within 30 min ofmixing the LPEI and siRNA for nanoparticle preparation.Each measurement was performed for 10 runs per sample,each run of 2 min. Intensity-weighted size distribution inthe multimodal size distribution (MSD) analysis mode(based on non-negatively constrained least squares(NNLS) algorithm in MAS OPTION software fromBrookhaven) showed bimodal distribution of particles,with a primary population in a size range less than500 nm and a second population in a range greater than5 lm. PEI–nucleic acid complexes tend to form aggregatesover time in the buffer solutions [36,41]. These aggregateswere detected in the second population of particles. SincePEI–siRNA complexes greater than 150 nm, which is thesize limit for non-specific cellular uptake through clath-rin-coated pits [42], have been reported unable to mediategene silencing [33], only the primary population size ofthe particles are reported. Mean and standard deviationwere plotted by the number-weighted size distribution inMSD analysis mode. Particle sizes were corroborated byscanning electron and atomic force microscopy.
2.8.5. Zeta (f)-potential
LPEI–siRNA nanoparticles were prepared in nuclease-free DI water, as explained above. siRNA concentrationwas kept constant at, or equivalent to 750 nM. A higheramount of siRNA was used to obtain detectable countrates [33]. f-Potential values of ‘‘direct complexes” (i.e.,nanoparticle complexes immediately after their formationand diluted to final volume of 1.5 ml of nuclease-free DIwater) and ‘‘multilayer released complexes” (i.e., nanopar-ticle complexes released from multilayers in a volume of1.5 ml nuclease-free DI water) were measured in polysty-rene cuvettes at 25 �C using ZetaPALS, zeta potential ana-lyzer (Smoluchowski model) (Brookhaven InstrumentsCorp., NY).
2.8.6. Fluorescence analysis of patterned delivery
Confocal laser scanning microscopy (CLSM) imageswere obtained using Olympus Fluoview 1000 laser scan-
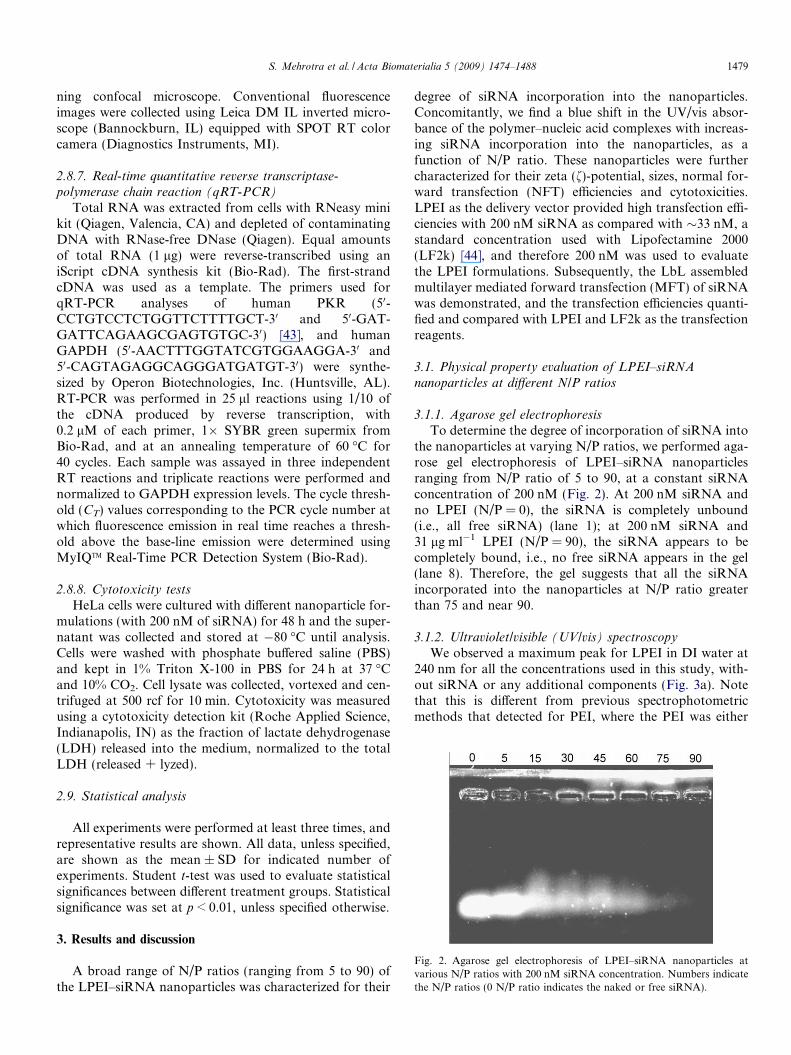
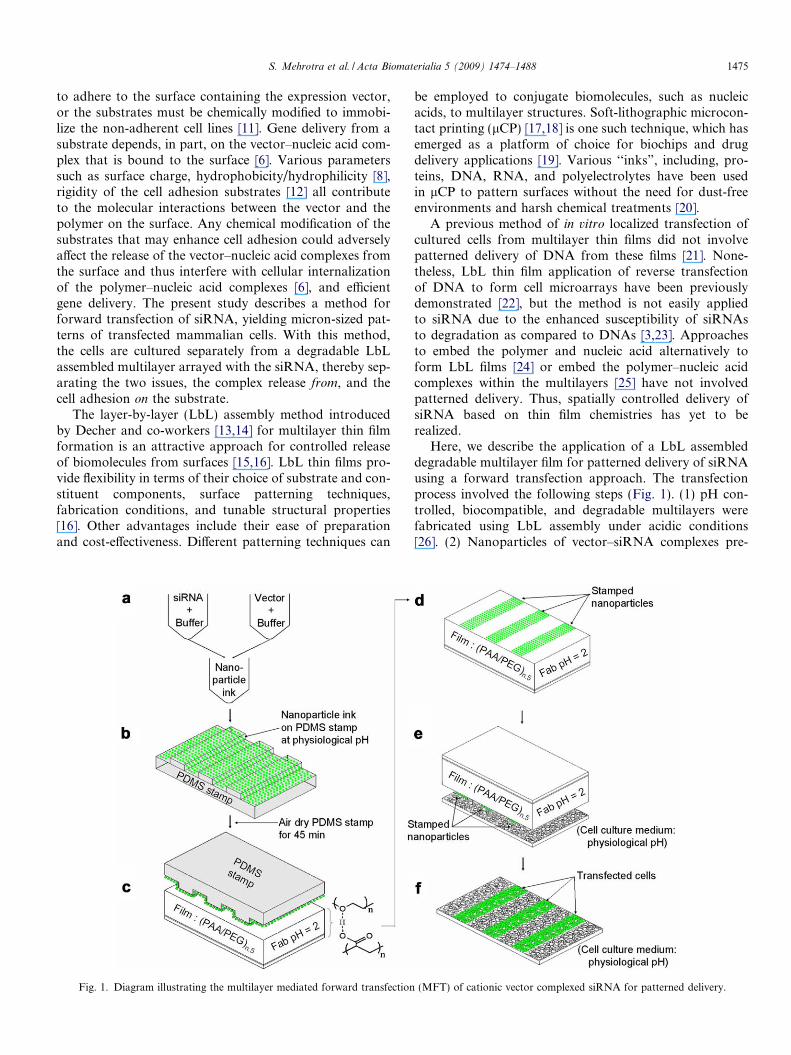
Fig. 2. Agarose gel electrophoresis of LPEI–siRNA nanoparticles atvarious N/P ratios with 200 nM siRNA concentration. Numbers indicatethe N/P ratios (0 N/P ratio indicates the naked or free siRNA).
S. Mehrotra et al. / Acta Biomaterialia 5 (2009) 1474–1488 1479
ning confocal microscope. Conventional fluorescenceimages were collected using Leica DM IL inverted micro-scope (Bannockburn, IL) equipped with SPOT RT colorcamera (Diagnostics Instruments, MI).
2.8.7. Real-time quantitative reverse transcriptase-polymerase chain reaction (qRT-PCR)
Total RNA was extracted from cells with RNeasy minikit (Qiagen, Valencia, CA) and depleted of contaminatingDNA with RNase-free DNase (Qiagen). Equal amountsof total RNA (1 lg) were reverse-transcribed using aniScript cDNA synthesis kit (Bio-Rad). The first-strandcDNA was used as a template. The primers used forqRT-PCR analyses of human PKR (50-CCTGTCCTCTGGTTCTTTTGCT-30 and 50-GAT-GATTCAGAAGCGAGTGTGC-30) [43], and humanGAPDH (50-AACTTTGGTATCGTGGAAGGA-30 and50-CAGTAGAGGCAGGGATGATGT-30) were synthe-sized by Operon Biotechnologies, Inc. (Huntsville, AL).RT-PCR was performed in 25 ll reactions using 1/10 ofthe cDNA produced by reverse transcription, with0.2 lM of each primer, 1� SYBR green supermix fromBio-Rad, and at an annealing temperature of 60 �C for40 cycles. Each sample was assayed in three independentRT reactions and triplicate reactions were performed andnormalized to GAPDH expression levels. The cycle thresh-old (CT) values corresponding to the PCR cycle number atwhich fluorescence emission in real time reaches a thresh-old above the base-line emission were determined usingMyIQTM Real-Time PCR Detection System (Bio-Rad).
2.8.8. Cytotoxicity tests
HeLa cells were cultured with different nanoparticle for-mulations (with 200 nM of siRNA) for 48 h and the super-natant was collected and stored at �80 �C until analysis.Cells were washed with phosphate buffered saline (PBS)and kept in 1% Triton X-100 in PBS for 24 h at 37 �Cand 10% CO2. Cell lysate was collected, vortexed and cen-trifuged at 500 rcf for 10 min. Cytotoxicity was measuredusing a cytotoxicity detection kit (Roche Applied Science,Indianapolis, IN) as the fraction of lactate dehydrogenase(LDH) released into the medium, normalized to the totalLDH (released + lyzed).
2.9. Statistical analysis
All experiments were performed at least three times, andrepresentative results are shown. All data, unless specified,are shown as the mean ± SD for indicated number ofexperiments. Student t-test was used to evaluate statisticalsignificances between different treatment groups. Statisticalsignificance was set at p < 0.01, unless specified otherwise.
3. Results and discussion
A broad range of N/P ratios (ranging from 5 to 90) ofthe LPEI–siRNA nanoparticles was characterized for their
degree of siRNA incorporation into the nanoparticles.Concomitantly, we find a blue shift in the UV/vis absor-bance of the polymer–nucleic acid complexes with increas-ing siRNA incorporation into the nanoparticles, as afunction of N/P ratio. These nanoparticles were furthercharacterized for their zeta (f)-potential, sizes, normal for-ward transfection (NFT) efficiencies and cytotoxicities.LPEI as the delivery vector provided high transfection effi-ciencies with 200 nM siRNA as compared with �33 nM, astandard concentration used with Lipofectamine 2000(LF2k) [44], and therefore 200 nM was used to evaluatethe LPEI formulations. Subsequently, the LbL assembledmultilayer mediated forward transfection (MFT) of siRNAwas demonstrated, and the transfection efficiencies quanti-fied and compared with LPEI and LF2k as the transfectionreagents.
3.1. Physical property evaluation of LPEI–siRNA
nanoparticles at different N/P ratios
3.1.1. Agarose gel electrophoresis
To determine the degree of incorporation of siRNA intothe nanoparticles at varying N/P ratios, we performed aga-rose gel electrophoresis of LPEI–siRNA nanoparticlesranging from N/P ratio of 5 to 90, at a constant siRNAconcentration of 200 nM (Fig. 2). At 200 nM siRNA andno LPEI (N/P = 0), the siRNA is completely unbound(i.e., all free siRNA) (lane 1); at 200 nM siRNA and31 lg ml�1 LPEI (N/P = 90), the siRNA appears to becompletely bound, i.e., no free siRNA appears in the gel(lane 8). Therefore, the gel suggests that all the siRNAincorporated into the nanoparticles at N/P ratio greaterthan 75 and near 90.
3.1.2. Ultraviolet/visible (UV/vis) spectroscopy
We observed a maximum peak for LPEI in DI water at240 nm for all the concentrations used in this study, with-out siRNA or any additional components (Fig. 3a). Notethat this is different from previous spectrophotometricmethods that detected for PEI, where the PEI was either
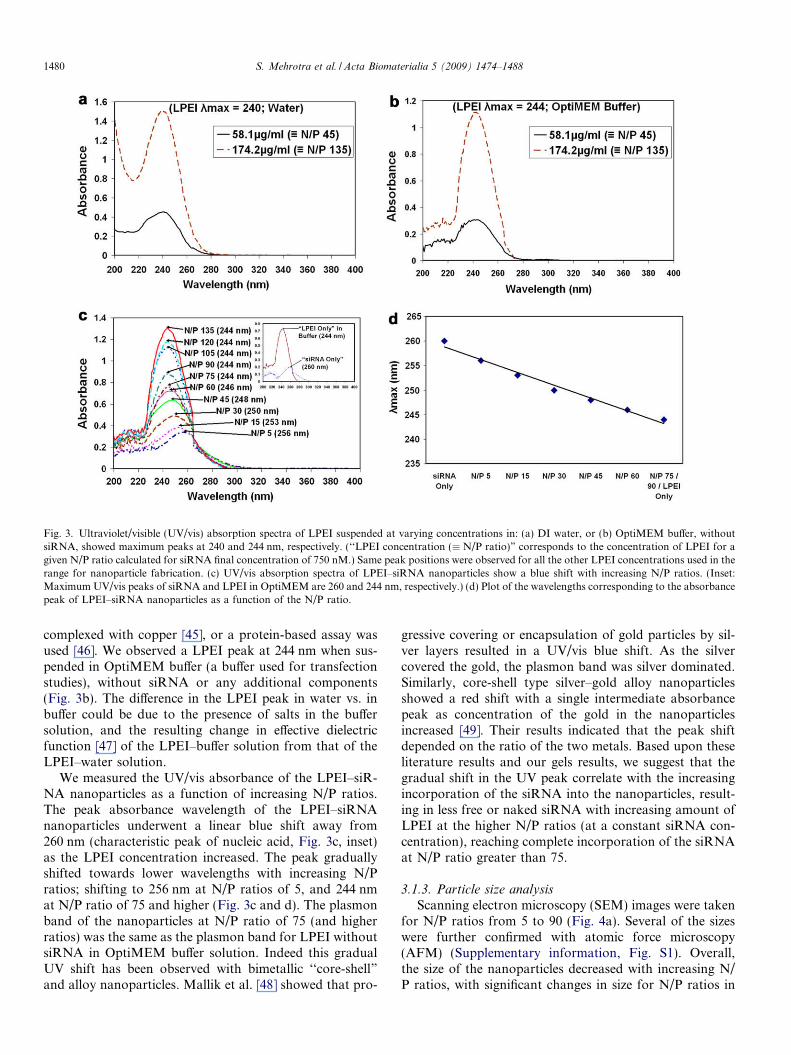
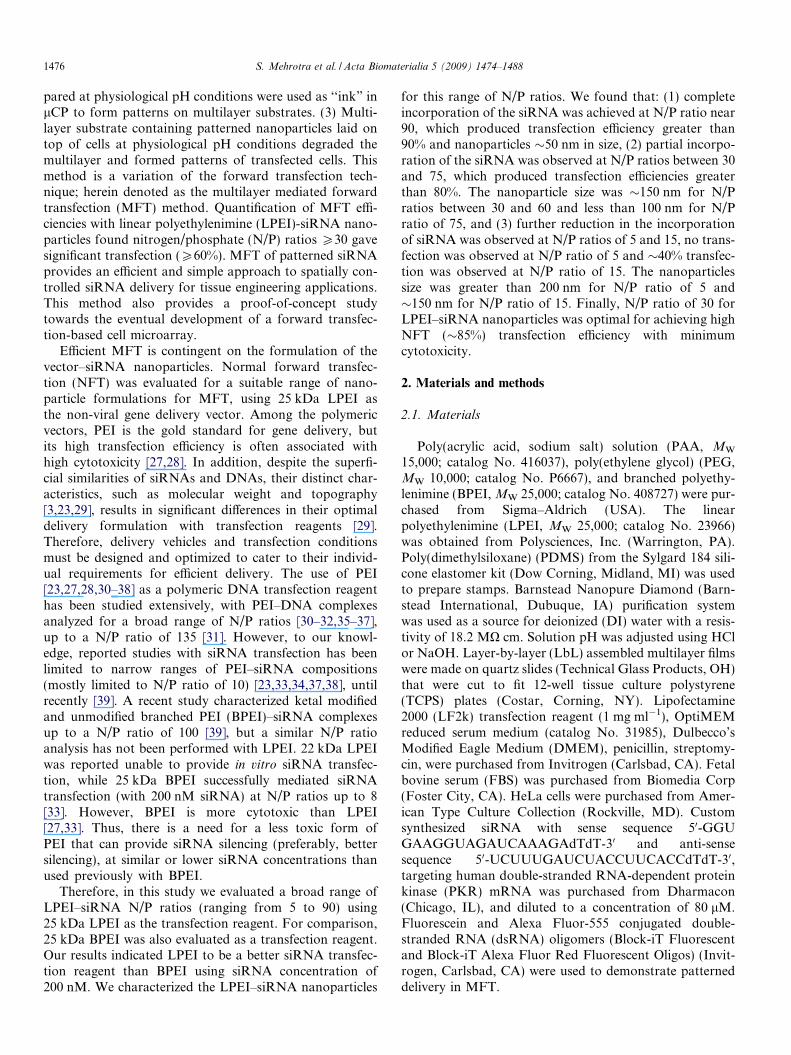
Fig. 3. Ultraviolet/visible (UV/vis) absorption spectra of LPEI suspended at varying concentrations in: (a) DI water, or (b) OptiMEM buffer, withoutsiRNA, showed maximum peaks at 240 and 244 nm, respectively. (‘‘LPEI concentration (� N/P ratio)” corresponds to the concentration of LPEI for agiven N/P ratio calculated for siRNA final concentration of 750 nM.) Same peak positions were observed for all the other LPEI concentrations used in therange for nanoparticle fabrication. (c) UV/vis absorption spectra of LPEI–siRNA nanoparticles show a blue shift with increasing N/P ratios. (Inset:Maximum UV/vis peaks of siRNA and LPEI in OptiMEM are 260 and 244 nm, respectively.) (d) Plot of the wavelengths corresponding to the absorbancepeak of LPEI–siRNA nanoparticles as a function of the N/P ratio.
1480 S. Mehrotra et al. / Acta Biomaterialia 5 (2009) 1474–1488
complexed with copper [45], or a protein-based assay wasused [46]. We observed a LPEI peak at 244 nm when sus-pended in OptiMEM buffer (a buffer used for transfectionstudies), without siRNA or any additional components(Fig. 3b). The difference in the LPEI peak in water vs. inbuffer could be due to the presence of salts in the buffersolution, and the resulting change in effective dielectricfunction [47] of the LPEI–buffer solution from that of theLPEI–water solution.
We measured the UV/vis absorbance of the LPEI–siR-NA nanoparticles as a function of increasing N/P ratios.The peak absorbance wavelength of the LPEI–siRNAnanoparticles underwent a linear blue shift away from260 nm (characteristic peak of nucleic acid, Fig. 3c, inset)as the LPEI concentration increased. The peak graduallyshifted towards lower wavelengths with increasing N/Pratios; shifting to 256 nm at N/P ratios of 5, and 244 nmat N/P ratio of 75 and higher (Fig. 3c and d). The plasmonband of the nanoparticles at N/P ratio of 75 (and higherratios) was the same as the plasmon band for LPEI withoutsiRNA in OptiMEM buffer solution. Indeed this gradualUV shift has been observed with bimetallic ‘‘core-shell”and alloy nanoparticles. Mallik et al. [48] showed that pro-
gressive covering or encapsulation of gold particles by sil-ver layers resulted in a UV/vis blue shift. As the silvercovered the gold, the plasmon band was silver dominated.Similarly, core-shell type silver–gold alloy nanoparticlesshowed a red shift with a single intermediate absorbancepeak as concentration of the gold in the nanoparticlesincreased [49]. Their results indicated that the peak shiftdepended on the ratio of the two metals. Based upon theseliterature results and our gels results, we suggest that thegradual shift in the UV peak correlate with the increasingincorporation of the siRNA into the nanoparticles, result-ing in less free or naked siRNA with increasing amount ofLPEI at the higher N/P ratios (at a constant siRNA con-centration), reaching complete incorporation of the siRNAat N/P ratio greater than 75.
3.1.3. Particle size analysis
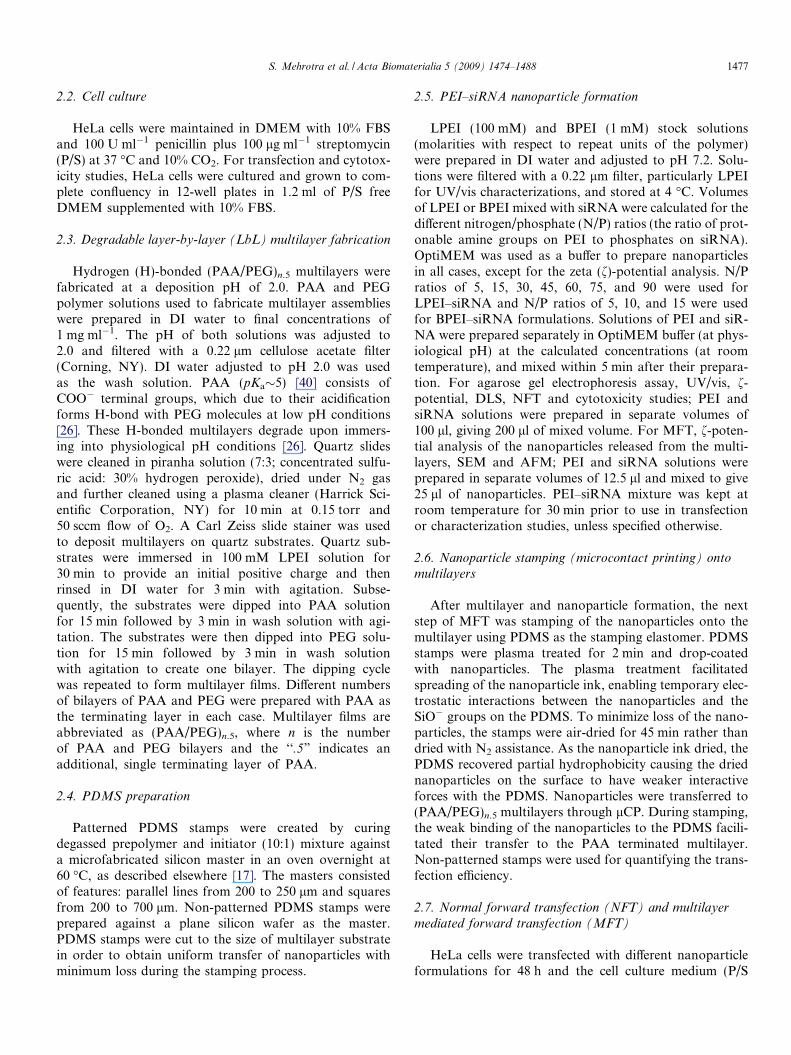
Scanning electron microscopy (SEM) images were takenfor N/P ratios from 5 to 90 (Fig. 4a). Several of the sizeswere further confirmed with atomic force microscopy(AFM) (Supplementary information, Fig. S1). Overall,the size of the nanoparticles decreased with increasing N/P ratios, with significant changes in size for N/P ratios in
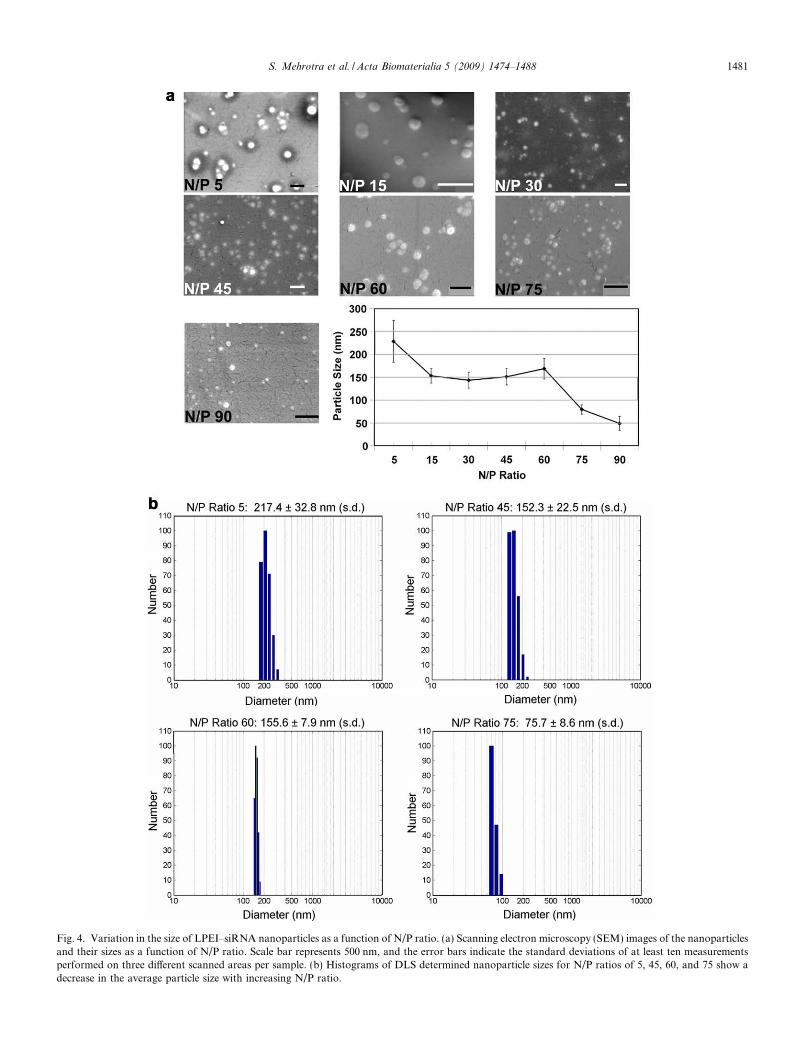
Fig. 4. Variation in the size of LPEI–siRNA nanoparticles as a function of N/P ratio. (a) Scanning electron microscopy (SEM) images of the nanoparticlesand their sizes as a function of N/P ratio. Scale bar represents 500 nm, and the error bars indicate the standard deviations of at least ten measurementsperformed on three different scanned areas per sample. (b) Histograms of DLS determined nanoparticle sizes for N/P ratios of 5, 45, 60, and 75 show adecrease in the average particle size with increasing N/P ratio.
S. Mehrotra et al. / Acta Biomaterialia 5 (2009) 1474–1488 1481
1482 S. Mehrotra et al. / Acta Biomaterialia 5 (2009) 1474–1488
the range of 5–15 and 60–75. The size of the nanoparticleswas greater than 200 nm at N/P ratio of 5, decreased to�150 nm at N/P ratios between 15 and 60, decreased fur-ther to less than 100 nm at N/P ratio of 75, and �50 nmat N/P ratio of 90. The hydrodynamic sizes of these nano-particles were measured using dynamic light scattering(DLS) (Fig. 4b), and found to be similar to the sizesobtained with SEM and AFM.
3.1.4. Zeta (f)-potential analysis
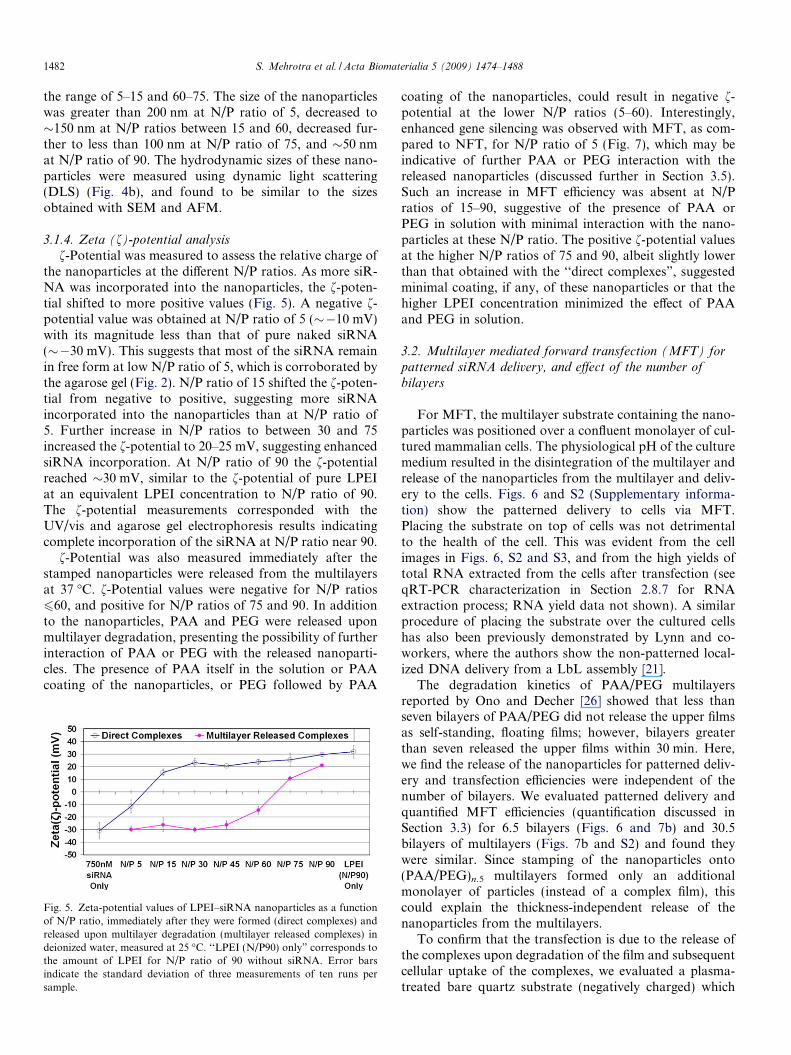
f-Potential was measured to assess the relative charge ofthe nanoparticles at the different N/P ratios. As more siR-NA was incorporated into the nanoparticles, the f-poten-tial shifted to more positive values (Fig. 5). A negative f-potential value was obtained at N/P ratio of 5 (��10 mV)with its magnitude less than that of pure naked siRNA(��30 mV). This suggests that most of the siRNA remainin free form at low N/P ratio of 5, which is corroborated bythe agarose gel (Fig. 2). N/P ratio of 15 shifted the f-poten-tial from negative to positive, suggesting more siRNAincorporated into the nanoparticles than at N/P ratio of5. Further increase in N/P ratios to between 30 and 75increased the f-potential to 20–25 mV, suggesting enhancedsiRNA incorporation. At N/P ratio of 90 the f-potentialreached �30 mV, similar to the f-potential of pure LPEIat an equivalent LPEI concentration to N/P ratio of 90.The f-potential measurements corresponded with theUV/vis and agarose gel electrophoresis results indicatingcomplete incorporation of the siRNA at N/P ratio near 90.
f-Potential was also measured immediately after thestamped nanoparticles were released from the multilayersat 37 �C. f-Potential values were negative for N/P ratios660, and positive for N/P ratios of 75 and 90. In additionto the nanoparticles, PAA and PEG were released uponmultilayer degradation, presenting the possibility of furtherinteraction of PAA or PEG with the released nanoparti-cles. The presence of PAA itself in the solution or PAAcoating of the nanoparticles, or PEG followed by PAA
Fig. 5. Zeta-potential values of LPEI–siRNA nanoparticles as a functionof N/P ratio, immediately after they were formed (direct complexes) andreleased upon multilayer degradation (multilayer released complexes) indeionized water, measured at 25 �C. ‘‘LPEI (N/P90) only” corresponds tothe amount of LPEI for N/P ratio of 90 without siRNA. Error barsindicate the standard deviation of three measurements of ten runs persample.
coating of the nanoparticles, could result in negative f-potential at the lower N/P ratios (5–60). Interestingly,enhanced gene silencing was observed with MFT, as com-pared to NFT, for N/P ratio of 5 (Fig. 7), which may beindicative of further PAA or PEG interaction with thereleased nanoparticles (discussed further in Section 3.5).Such an increase in MFT efficiency was absent at N/Pratios of 15–90, suggestive of the presence of PAA orPEG in solution with minimal interaction with the nano-particles at these N/P ratio. The positive f-potential valuesat the higher N/P ratios of 75 and 90, albeit slightly lowerthan that obtained with the ‘‘direct complexes”, suggestedminimal coating, if any, of these nanoparticles or that thehigher LPEI concentration minimized the effect of PAAand PEG in solution.
3.2. Multilayer mediated forward transfection (MFT) for
patterned siRNA delivery, and effect of the number of
bilayers
For MFT, the multilayer substrate containing the nano-particles was positioned over a confluent monolayer of cul-tured mammalian cells. The physiological pH of the culturemedium resulted in the disintegration of the multilayer andrelease of the nanoparticles from the multilayer and deliv-ery to the cells. Figs. 6 and S2 (Supplementary informa-tion) show the patterned delivery to cells via MFT.Placing the substrate on top of cells was not detrimentalto the health of the cell. This was evident from the cellimages in Figs. 6, S2 and S3, and from the high yields oftotal RNA extracted from the cells after transfection (seeqRT-PCR characterization in Section 2.8.7 for RNAextraction process; RNA yield data not shown). A similarprocedure of placing the substrate over the cultured cellshas also been previously demonstrated by Lynn and co-workers, where the authors show the non-patterned local-ized DNA delivery from a LbL assembly [21].
The degradation kinetics of PAA/PEG multilayersreported by Ono and Decher [26] showed that less thanseven bilayers of PAA/PEG did not release the upper filmsas self-standing, floating films; however, bilayers greaterthan seven released the upper films within 30 min. Here,we find the release of the nanoparticles for patterned deliv-ery and transfection efficiencies were independent of thenumber of bilayers. We evaluated patterned delivery andquantified MFT efficiencies (quantification discussed inSection 3.3) for 6.5 bilayers (Figs. 6 and 7b) and 30.5bilayers of multilayers (Figs. 7b and S2) and found theywere similar. Since stamping of the nanoparticles onto(PAA/PEG)n.5 multilayers formed only an additionalmonolayer of particles (instead of a complex film), thiscould explain the thickness-independent release of thenanoparticles from the multilayers.
To confirm that the transfection is due to the release ofthe complexes upon degradation of the film and subsequentcellular uptake of the complexes, we evaluated a plasma-treated bare quartz substrate (negatively charged) which
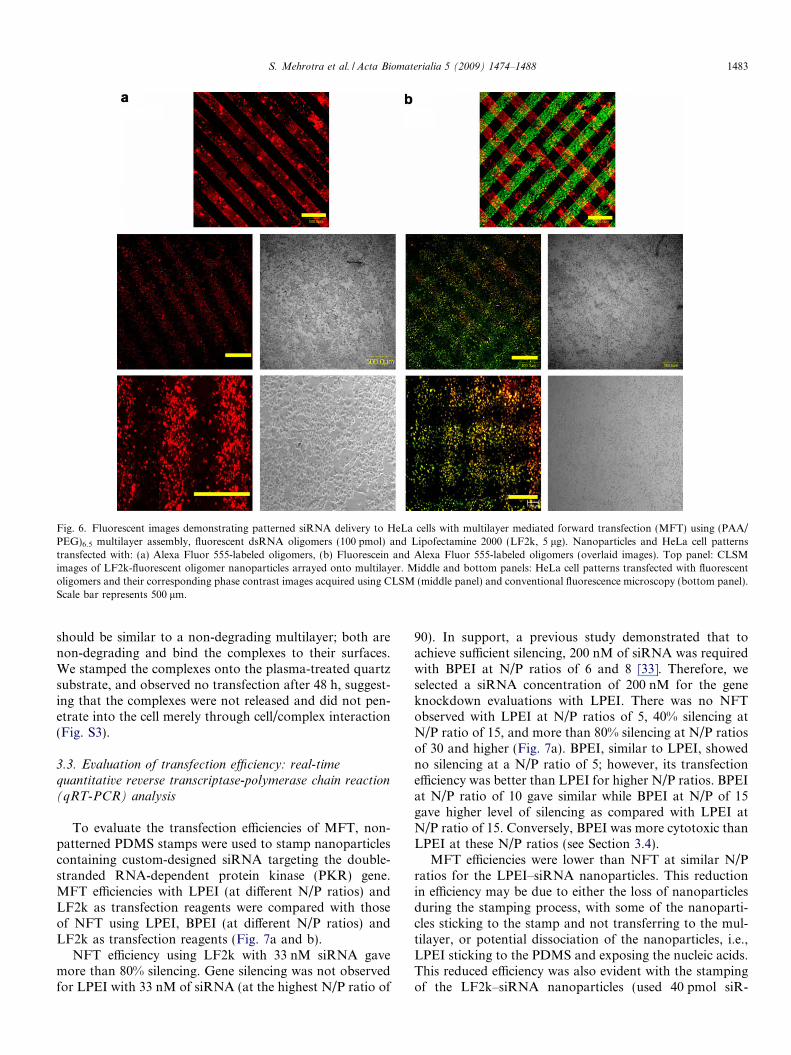
Fig. 6. Fluorescent images demonstrating patterned siRNA delivery to HeLa cells with multilayer mediated forward transfection (MFT) using (PAA/PEG)6.5 multilayer assembly, fluorescent dsRNA oligomers (100 pmol) and Lipofectamine 2000 (LF2k, 5 lg). Nanoparticles and HeLa cell patternstransfected with: (a) Alexa Fluor 555-labeled oligomers, (b) Fluorescein and Alexa Fluor 555-labeled oligomers (overlaid images). Top panel: CLSMimages of LF2k-fluorescent oligomer nanoparticles arrayed onto multilayer. Middle and bottom panels: HeLa cell patterns transfected with fluorescentoligomers and their corresponding phase contrast images acquired using CLSM (middle panel) and conventional fluorescence microscopy (bottom panel).Scale bar represents 500 lm.
S. Mehrotra et al. / Acta Biomaterialia 5 (2009) 1474–1488 1483
should be similar to a non-degrading multilayer; both arenon-degrading and bind the complexes to their surfaces.We stamped the complexes onto the plasma-treated quartzsubstrate, and observed no transfection after 48 h, suggest-ing that the complexes were not released and did not pen-etrate into the cell merely through cell/complex interaction(Fig. S3).
3.3. Evaluation of transfection efficiency: real-time
quantitative reverse transcriptase-polymerase chain reaction
(qRT-PCR) analysis
To evaluate the transfection efficiencies of MFT, non-patterned PDMS stamps were used to stamp nanoparticlescontaining custom-designed siRNA targeting the double-stranded RNA-dependent protein kinase (PKR) gene.MFT efficiencies with LPEI (at different N/P ratios) andLF2k as transfection reagents were compared with thoseof NFT using LPEI, BPEI (at different N/P ratios) andLF2k as transfection reagents (Fig. 7a and b).
NFT efficiency using LF2k with 33 nM siRNA gavemore than 80% silencing. Gene silencing was not observedfor LPEI with 33 nM of siRNA (at the highest N/P ratio of
90). In support, a previous study demonstrated that toachieve sufficient silencing, 200 nM of siRNA was requiredwith BPEI at N/P ratios of 6 and 8 [33]. Therefore, weselected a siRNA concentration of 200 nM for the geneknockdown evaluations with LPEI. There was no NFTobserved with LPEI at N/P ratios of 5, 40% silencing atN/P ratio of 15, and more than 80% silencing at N/P ratiosof 30 and higher (Fig. 7a). BPEI, similar to LPEI, showedno silencing at a N/P ratio of 5; however, its transfectionefficiency was better than LPEI for higher N/P ratios. BPEIat N/P ratio of 10 gave similar while BPEI at N/P of 15gave higher level of silencing as compared with LPEI atN/P ratio of 15. Conversely, BPEI was more cytotoxic thanLPEI at these N/P ratios (see Section 3.4).
MFT efficiencies were lower than NFT at similar N/Pratios for the LPEI–siRNA nanoparticles. This reductionin efficiency may be due to either the loss of nanoparticlesduring the stamping process, with some of the nanoparti-cles sticking to the stamp and not transferring to the mul-tilayer, or potential dissociation of the nanoparticles, i.e.,LPEI sticking to the PDMS and exposing the nucleic acids.This reduced efficiency was also evident with the stampingof the LF2k–siRNA nanoparticles (used 40 pmol siR-

Fig. 7. qRT-PCR quantified expression levels of PKR gene knockdown in HeLa cells 48 h post-transfection of siRNA delivery using 25 kDa LPEI or25 kDa BPEI at different N/P ratios, or Lipofectamine 2000 (LF2k, 2 lg) with: (a) normal forward transfection (NFT) and (b) multilayer mediatedforward transfection (MFT). Amount of siRNA was 240 pmol (� 200 nM final concentration in NFT) and transfection reagent was LPEI, unless specifiedotherwise. Parantheses indicate the amount of LPEI corresponding to the noted N/P ratio of 45, but without siRNA. BLs denote the number of bilayers.Error bars indicate the standard deviations of RT-PCRs on three independent samples. #,##p < 0.01 as compared with ‘‘cells only” (i.e., cells without anytransfection reagent or siRNA). ###p < 0.05 as compared with ‘‘cells only”. *p<0.05 compared with ‘‘N/P 5 in (a)”.
1484 S. Mehrotra et al. / Acta Biomaterialia 5 (2009) 1474–1488
NA � 33 nM in NFT, a standard concentration used withLF2k [44]) in the MFT process (Fig. 7a and b). To assesswhether the preparation time was a factor, the NFT effi-ciency of LF2k–siRNA complexes (typical NFT) was eval-uated after 20 min (standard preparation time of LF2k–siRNA complexes [44]) and 2.5 h (average process time ofMFT), and found to be similar. The large standard devia-tions associated with MFT may be attributed to the exper-imental variation introduced through the manual (non-automated) transfer of the nanoparticle particles by thelCP process. MFT of siRNA can be performed with anytransfection reagent, as long as the nanoparticles remainedstable and functional throughout the stamping process.
MFT can be performed on any cell type, in addition tothe ones described here.
MFT efficiencies were P60% for LPEI–siRNA nano-particles at N/P ratios P30. When compared to NFT effi-ciencies, there was an unexpected increase observed inMFT efficiency for nanoparticles at N/P ratio of 5. Thismay be attributed to interaction of the larger nanoparticles(greater than 200 nm) with the PEG and PAA upon multi-layer degradation in the culture medium, enhancing trans-fection at N/P ratio of 5 (discussed further in Section 3.5).The small amount of silencing observed with ‘‘LPEI (N/P45) Only” mock sample in Fig. 7a and b is essentially noisein the qRT-PCR characterization.
S. Mehrotra et al. / Acta Biomaterialia 5 (2009) 1474–1488 1485
3.4. Cytotoxicity evaluation: transfection reagent and N/P
ratio optimization
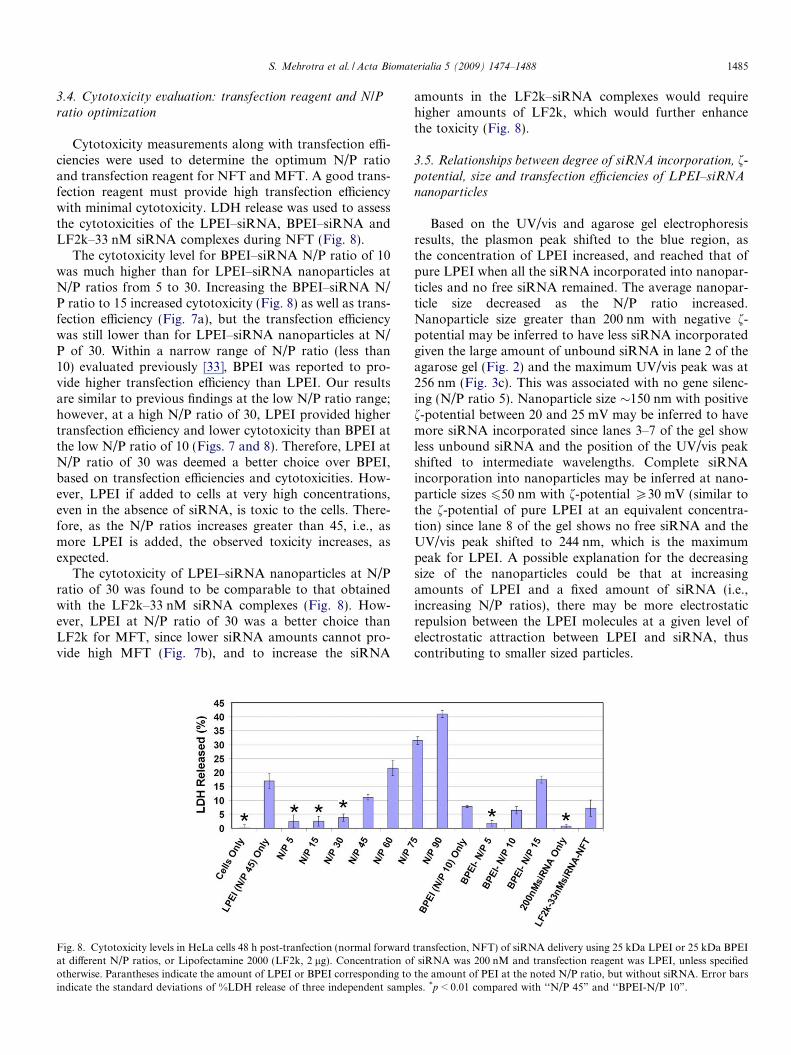
Cytotoxicity measurements along with transfection effi-ciencies were used to determine the optimum N/P ratioand transfection reagent for NFT and MFT. A good trans-fection reagent must provide high transfection efficiencywith minimal cytotoxicity. LDH release was used to assessthe cytotoxicities of the LPEI–siRNA, BPEI–siRNA andLF2k–33 nM siRNA complexes during NFT (Fig. 8).
The cytotoxicity level for BPEI–siRNA N/P ratio of 10was much higher than for LPEI–siRNA nanoparticles atN/P ratios from 5 to 30. Increasing the BPEI–siRNA N/P ratio to 15 increased cytotoxicity (Fig. 8) as well as trans-fection efficiency (Fig. 7a), but the transfection efficiencywas still lower than for LPEI–siRNA nanoparticles at N/P of 30. Within a narrow range of N/P ratio (less than10) evaluated previously [33], BPEI was reported to pro-vide higher transfection efficiency than LPEI. Our resultsare similar to previous findings at the low N/P ratio range;however, at a high N/P ratio of 30, LPEI provided highertransfection efficiency and lower cytotoxicity than BPEI atthe low N/P ratio of 10 (Figs. 7 and 8). Therefore, LPEI atN/P ratio of 30 was deemed a better choice over BPEI,based on transfection efficiencies and cytotoxicities. How-ever, LPEI if added to cells at very high concentrations,even in the absence of siRNA, is toxic to the cells. There-fore, as the N/P ratios increases greater than 45, i.e., asmore LPEI is added, the observed toxicity increases, asexpected.
The cytotoxicity of LPEI–siRNA nanoparticles at N/Pratio of 30 was found to be comparable to that obtainedwith the LF2k–33 nM siRNA complexes (Fig. 8). How-ever, LPEI at N/P ratio of 30 was a better choice thanLF2k for MFT, since lower siRNA amounts cannot pro-vide high MFT (Fig. 7b), and to increase the siRNA
Fig. 8. Cytotoxicity levels in HeLa cells 48 h post-tranfection (normal forwardat different N/P ratios, or Lipofectamine 2000 (LF2k, 2 lg). Concentration ofotherwise. Parantheses indicate the amount of LPEI or BPEI corresponding toindicate the standard deviations of %LDH release of three independent sampl
amounts in the LF2k–siRNA complexes would requirehigher amounts of LF2k, which would further enhancethe toxicity (Fig. 8).
3.5. Relationships between degree of siRNA incorporation, f-
potential, size and transfection efficiencies of LPEI–siRNAnanoparticles
Based on the UV/vis and agarose gel electrophoresisresults, the plasmon peak shifted to the blue region, asthe concentration of LPEI increased, and reached that ofpure LPEI when all the siRNA incorporated into nanopar-ticles and no free siRNA remained. The average nanopar-ticle size decreased as the N/P ratio increased.Nanoparticle size greater than 200 nm with negative f-potential may be inferred to have less siRNA incorporatedgiven the large amount of unbound siRNA in lane 2 of theagarose gel (Fig. 2) and the maximum UV/vis peak was at256 nm (Fig. 3c). This was associated with no gene silenc-ing (N/P ratio 5). Nanoparticle size �150 nm with positivef-potential between 20 and 25 mV may be inferred to havemore siRNA incorporated since lanes 3–7 of the gel showless unbound siRNA and the position of the UV/vis peakshifted to intermediate wavelengths. Complete siRNAincorporation into nanoparticles may be inferred at nano-particle sizes 650 nm with f-potential P30 mV (similar tothe f-potential of pure LPEI at an equivalent concentra-tion) since lane 8 of the gel shows no free siRNA and theUV/vis peak shifted to 244 nm, which is the maximumpeak for LPEI. A possible explanation for the decreasingsize of the nanoparticles could be that at increasingamounts of LPEI and a fixed amount of siRNA (i.e.,increasing N/P ratios), there may be more electrostaticrepulsion between the LPEI molecules at a given level ofelectrostatic attraction between LPEI and siRNA, thuscontributing to smaller sized particles.
transfection, NFT) of siRNA delivery using 25 kDa LPEI or 25 kDa BPEIsiRNA was 200 nM and transfection reagent was LPEI, unless specified
the amount of PEI at the noted N/P ratio, but without siRNA. Error barses. *p < 0.01 compared with ‘‘N/P 45” and ‘‘BPEI-N/P 10”.
1486 S. Mehrotra et al. / Acta Biomaterialia 5 (2009) 1474–1488
Correspondingly, minimal silencing was observed at N/P ratio of 15 and greater than 80% gene silencing wasobserved for N/P ratios ranging from 30 to 75. Transfec-tion efficiency was increased further at N/P ratio 90. There-fore, the smaller size nanoparticles, with 25 kDa LPEI,provided more efficient NFT efficiencies. Particle size of�150 was observed to be the cut-off size for efficient cellu-lar uptake, which agreed with previously reported size limitof 150 nm for non-specific cellular uptake through clathrin-coated pits [42]. N/P ratio of 15 was an exception: despitetheir particle size of 150 nm, they gave lower transfectionas compared with the higher N/P ratios from 30 to 60(Fig. 7a). However, the smaller blue shift and low f-poten-tial at N/P ratio of 15 could explain, in part, the reducedtransfection efficiency.
A possibility exists that some of the small nanoparticlesobserved at the high N/P ratios are aggregates of LPEIalone in solution. However, since we observed high levelof silencing at these N/P ratios, this coupled with the factthat nanoparticles larger than 150 nm are reported unableto provide siRNA silencing [33], we believe the small sizeLPEI nanoparticles contain siRNA molecules and are notlikely aggregation of LPEI.
The lower f-potential values for the nanoparticlesreleased from the multilayers suggest that the releasedPAA or PEG from the film may also interact with LPEI–siRNA nanoparticles. Increase in transfection efficienciesat N/P ratio of 5 is observed for MFT as compared toNFT. Amino and carboxylic acid pendant PEG chain coat-ing on PEI/DNA complexes have been shown to increasetheir transfection efficiencies, even at negative f-potentials[50]. Also, PEG is known to reduce nanoparticle aggrega-tion [41,51], modulating the complex properties (i.e., sur-face charge, size, and complex–cell interactions) leadingto improved transfection efficiencies in some cases [51,52].These previous studies support the possibility that PAAor PEG could alter the properties of larger nanoparticles(greater than 200 nm) in solution to enhance the MFT effi-ciency at N/P ratio of 5.
4. Conclusions
The MFT method provided a forward transfectionapproach that used degradable multilayers for patternedsiRNA delivery to cultured cells. Forward transfection pro-vides an advantage over reverse transfection in terms oftuning the substrate chemistry, such as the multilayers forpolymer–siRNA immobilization, separately from the sub-strate modification that may be required for cell adhesion.Lower siRNA amounts (�40 pmol � 33 nM siRNA inNFT) did not provide sufficient MFT efficiencies, whereashigher siRNA amounts (�240 pmol � 200 nM siRNA inNFT) provided P60% transfection efficiencies of LPEI–siRNA nanoparticles at N/P ratios greater than 30. There-fore, based on the cytotoxicities and transfection efficien-cies, LPEI at N/P ratio of 30 was a better choice thanLF2k for MFT, even though they both gave comparable
NFTs. We selected and characterized N/P ratios rangingfrom 5 to 90 for their UV/vis spectra, relative amounts ofsiRNA incorporated into the nanoparticles, f-potentialsand nanoparticle sizes. UV/vis shift to 244 nm, f-potentialof 30 mV, and complete siRNA incorporation wasachieved at N/P ratio near 90. NFT efficiencies increasedwith decreasing nanoparticle size and increasing N/P ratio.25 kDa LPEI was found to be a highly efficient transfectionreagent at N/P ratio of 30, providing greater than 80%transfection efficiencies at siRNA concentration of200 nM, better than BPEI. Finally, MFT provides amethod for forward transfection of siRNA, yieldingmicron-sized patterns of transfected mammalian cells,and may be a potential approach for developing cell micro-arrays based on forward transfection.
Acknowledgments
We thank the members of Cellular and BiomolecularLaboratory at Michigan State University for their support,particularly Xuerui Yang and Hemant Kini for their guid-ance on qRT–PCR and electrophoresis characterizations,respectively. We also thank Dr. Devesh Srivastava for gen-eral useful discussions. The work was supported in part byNational Institute of Health (R01GM079688-01,R21CA126136, R21RR024439, R21GM075838), NationalScience Foundation (BES 0425821, CTS 0609164), andthe MSU Foundation.
Appendix A. Supplementary data
Supplementary data associated with this article can befound, in the online version, at doi:10.1016/j.act-bio.2009.01.004. AFM images; and multilayer mediatedforward transfection (MFT) images.
References
[1] Fire A, Xu SQ, Montgomery MK, Kostas SA, Driver SE, Mello CC.Potent and specific genetic interference by double-stranded RNA inCaenorhabditis elegans. Nature 1998;391:806–11.
[2] Elbashir SM, Harborth J, Lendeckel W, Yalcin A, Weber K, TuschlT. Duplexes of 21-nucleotide RNAs mediate RNA interference incultured mammalian cells. Nature 2001;411:494–8.
[3] Cheema SK, Chen E, Shea LD, Mathur AB. Regulation and guidanceof cell behavior for tissue regeneration via the siRNA mechanism.Wound Repair Regen 2007;15:286–95.
[4] Ryther RCC, Flynt AS, Phillips JA, Patton JG. SiRNA therapeutics:big potential from small RNAs. Gene Ther 2005;12:5–11.
[5] Bonadio J, Smiley E, Patil P, Goldstein S. Localized, direct plasmidgene delivery in vivo: prolonged therapy results in reproducible tissueregeneration. Nat Med 1999;5:753–9.
[6] De Laporte L, Shea LD. Matrices and scaffolds for DNA delivery intissue engineering. Adv Drug Deliv Rev 2007;59:292–307.
[7] Houchin-Ray T, Whittlesey KJ, Shea LD. Spatially patterned genedelivery for localized neuron survival and neurite extension. Mol Ther2007;15:705–12.
[8] Pannier AK, Anderson BC, Shea LD. Substrate-mediated deliveryfrom self-assembled monolayers: effect of surface ionization, hydro-philicity, and patterning. Acta Biomater 2005;1:511–22.
S. Mehrotra et al. / Acta Biomaterialia 5 (2009) 1474–1488 1487
[9] Wheeler DB, Carpenter AE, Sabatini DM. Cell microarrays andRNA interference chip away at gene function. Nat Genet2005;37:S25–30.
[10] Ziauddin J, Sabatini DM. Microarrays of cells expressing definedcDNAs. Nature 2001;411:107–10.
[11] Diaz-Mochon JJ, Tourniaire G, Bradley M. Microarray platforms forenzymatic and cell-based assays. Chem Soc Rev 2007;36:449–57.
[12] Kong HJ, Liu JD, Riddle K, Matsumoto T, Leach K, Mooney DJ.Non-viral gene delivery regulated by stiffness of cell adhesionsubstrates. Nat Mater 2005;4:460–4.
[13] Decher G. Fuzzy nanoassemblies: toward layered polymeric multi-composites. Science 1997;277:1232–7.
[14] Decher G, Hong JD, Schmitt J. Buildup of ultrathin multilayer filmsby a self-assembly process. 3. Consecutively alternating adsorption ofanionic and cationic polyelectrolytes on charged surfaces. Thin SolidFilms 1992;210:831–5.
[15] Lynn DM. Peeling back the layers: Controlled erosion and triggereddisassembly of multilayered polyelectrolyte thin films. Adv Mater2007;19:4118–30.
[16] Tang ZY, Wang Y, Podsiadlo P, Kotov NA. Biomedical applicationsof layer-by-layer assembly: from biomimetics to tissue engineering.Adv Mater 2006;18:3203–24.
[17] Kumar A, Whitesides GM. Features of gold having micrometer tocentimeter dimensions can be formed through a combination ofstamping with an elastomeric stamp and an alkanethiol ink followedby chemical etching. Appl Phys Lett 1993;63:2002–4.
[18] Xia YN, Whitesides GM. Soft lithography. Angew Chem Int Ed1998;37:551–75.
[19] Xia Y. Soft lithography and the art of patterning – a tribute toProfessor George M. Whitesides. Adv Mater 2004;16:1245–6.
[20] Ruiz SA, Chen CS. Microcontact printing: a tool to pattern. SoftMatter 2007;3:168–77.
[21] Jewell CM, Zhang JT, Fredin NJ, Lynn DM. Multilayered polyelec-trolyte films promote the direct and localized delivery of DNA tocells. J Control Release 2005;106:214–23.
[22] Yamauchi F, Kato K, Iwata H. Layer-by-layer assembly ofpoly(ethyleneimine) and plasmid DNA onto transparent indium–tinoxide electrodes for temporally and spatially specific gene transfer.Langmuir 2005;21:8360–7.
[23] Gary DJ, Puri N, Won YY. Polymer-based siRNA delivery:perspectives on the fundamental and phenomenological distinctionsfrom polymer-based DNA delivery. J Control Release2007;121:64–73.
[24] Jessel N, Oulad-Abdeighani M, Meyer F, Lavalle P, Haikel Y, SchaafP, et al. Multiple and time-scheduled in situ DNA delivery mediatedby beta-cyclodextrin embedded in a polyelectrolyte multilayer. ProcNatl Acad Sci USA 2006;103:8618–21.
[25] Meyer F, Ball V, Schaaf P, Voegel JC, Ogier J. Polyplex-embeddingin polyelectrolyte multilayers for gene delivery. Biochim Biophys ActaBiomembr 2006;1758:419–22.
[26] Ono SS, Decher G. Preparation of ultrathin self-standing polyelec-trolyte multilayer membranes at physiological conditions using pH-responsive film segments as sacrificial layers. Nano Lett 2006;6:592–8.
[27] Neu M, Fischer D, Kissel T. Recent advances in rational genetransfer vector design based on poly(ethylene imine) and its deriva-tives. J Gene Med 2005;7:992–1009.
[28] Merdan T, Kopecek J, Kissel T. Prospects for cationic polymers ingene and oligonucleotide therapy against cancer. Adv Drug Deliv Rev2002;54:715–58.
[29] Spagnou S, Miller AD, Keller M. Lipidic carriers of siRNA:differences in the formulation, cellular uptake, and delivery withplasmid DNA. Biochemistry 2004;43:13348–56.
[30] Abdallah B, Hassan A, Benoist C, Goula D, Behr JP, Demeneix BA.A powerful nonviral vector for in vivo gene transfer into the adultmammalian brain: polyethylenimine. Hum Gene Ther1996;7:1947–54.
[31] Boussif O, Lezoualch F, Zanta MA, Mergny MD, Scherman D,Demeneix B, et al. A versatile vector for gene and oligonucleotide
transfer into cells in culture and in-vivo – polyethylenimine. Proc NatlAcad Sci USA 1995;92:7297–301.
[32] Choosakoonkriang S, Lobo BA, Koe GS, Koe JG, Middaugh CR.Biophysical characterization of PEI/DNA complexes. J Pharm Sci2003;92:1710–22.
[33] Grayson ACR, Doody AM, Putnam D. Biophysical and structuralcharacterization of polyethylenimine-mediated siRNA deliveryin vitro. Pharm Res 2006;23:1868–76.
[34] Grzelinski M, Urban-Klein B, Martens T, Lamszus K, Bakowsky U,Hobel S, et al. RNA interference-mediated gene silencing of pleio-trophin through polyethylenimine-complexed small interfering RNAsin vivo exerts antitumoral effects in glioblastoma xenografts. HumGene Ther 2006;17:751–66.
[35] Kunath K, von Harpe A, Fischer D, Peterson H, Bickel U, VoigtK, et al. Low-molecular-weight polyethylenimine as a non-viralvector for DNA delivery: comparison of physicochemical proper-ties, transfection efficiency and in vivo distribution with high-molecular-weight polyethylenimine. J Control Release2003;89:113–25.
[36] Ogris M, Steinlein P, Kursa M, Mechtler K, Kircheis R, WagnerE. The size of DNA/transferrin–PEI complexes is an importantfactor for gene expression in cultured cells. Gene Ther1998;5:1425–33.
[37] Thomas M, Lu JJ, Ge Q, Zhang CC, Chen JZ, Klibanov AM. Fulldeacylation of polyethylenimine dramatically boosts its gene deliveryefficiency and specificity to mouse lung. Proc Natl Acad Sci USA2005;102:5679–84.
[38] Urban-Klein B, Werth S, Abuharbeid S, Czubayko F, Aigner A.RNAi-mediated gene-targeting through systemic application ofpolyethylenimine (PEI)-complexed siRNA in vivo. Gene Ther2005;12:461–6.
[39] Shim MS, Kwon YJ. Controlled delivery of plasmid DNA andsiRNA to intracellular targets using ketalized polyethylenimine.Biomacromolecules 2008;9:444–55.
[40] Mendelsohn JD, Yang SY, Hiller J, Hochbaum AI, Rubner MF.Rational design of cytophilic and cytophobic polyelectrolyte multi-layer thin films. Biomacromolecules 2003;4:96–106.
[41] Ogris M, Brunner S, Schuller S, Kircheis R, Wagner E. PEGylatedDNA/transferrin–PEI complexes: reduced interaction with bloodcomponents, extended circulation in blood and potential for systemicgene delivery. Gene Ther 1999;6:595–605.
[42] Bishop NE. An update on non-clathrin-coated endocytosis. Rev MedVirol 1997;7:199–209.
[43] Pataer A, Vorburger SA, Chada S, Balachandran S, Barber GN,Roth JA, et al. Melanoma differentiation-associated gene-7 proteinphysically associates with the double-stranded RNA-activated proteinkinase PKR. Mol Ther 2005;11:717–23.
[44] Dalby B, Cates S, Harris A, Ohki EC, Tilkins ML, Price PJ, et al.Advanced transfection with Lipofectamine 2000 reagent: primaryneurons, siRNA, and high-throughput applications. Methods2004;33:95–103.
[45] Perrine TD, Landis WR. Analysis of polyethylenimine by spectro-photometry of its copper chelate. J Polym Sci Part A Polym Chem1967;5:1993–2003.
[46] Bertschinger M, Chaboche S, Jordan M, Wurm FM. A spectropho-tometric assay for the quantification of polyethylenimine in DNAnanoparticles. Anal Biochem 2004;334:196–8.
[47] Link S, Wang ZL, El-Sayed MA. Alloy formation of gold–silvernanoparticles and the dependence of the plasmon absorption on theircomposition. J Phys Chem B 1999;103:3529–33.
[48] Mallik K, Mandal M, Pradhan N, Pal T. Seed mediated formation ofbimetallic nanoparticles by UV irradiation: a photochemicalapproach for the preparation of ‘‘core-shell” type structures. NanoLett 2001;1:319–22.
[49] Chen HM, Liu RS, Jang LY, Lee JF, Hu SF. Characterization ofcore-shell type and alloy Ag/Au bimetallic clusters by using extendedX-ray absorption fine structure spectroscopy. Chem Phys Lett2006;421:118–23.

1488 S. Mehrotra et al. / Acta Biomaterialia 5 (2009) 1474–1488
[50] Koyama Y, Yamashita M, Iida-Tanaka N, Ito T. Enhancement oftranscriptional activity of DNA complexes by amphoteric PEGderivative. Biomacromolecules 2006;7:1274–9.
[51] Pannier AK, Wieland JA, Shea LD. Surface polyethylene glycolenhances substrate-mediated gene delivery by nonspecifically immo-bilized complexes. Acta Biomater 2008;4:26–39.
[52] Mao SR, Neu M, Germershaus O, Merkel O, Sitterberg J, BakowskyU, et al. Influence of polyethylene glycol chain length on thephysicochemical and biological properties of poly(ethylene imine)-graft-poly(ethylene glycol) block copolymer/SiRNA polyplexes. Bio-conjug Chem 2006;17:1209–18.
Copyright © 2022 FDOKUMEN