High Resolution Interference Microscopy: A Tool for Probing Optical Waves in the Far-Field on a...
14
High Resolution Interference Microscopy: A Tool for Probing Optical Waves in the Far-Field on a Nanometric Length Scale Carsten Rockstuhl*, Iwan Märki, Toralf Scharf, Martin Salt, Hans Peter Herzig and René Dändliker # University of Neuchâtel, Institute of Microtechnology, Rue A.-L. Breguet 2, CH-2000 Neuchâtel, Switzerland Abstract: High Resolution Interference Microscopy (HRIM) is a technique that allows the characterization of amplitude and phase of electromagnetic wave-fields in the far-field with a spatial accuracy that corresponds to a few nanometers in the object plane. Emphasis is put on the precise determination of topological features in the wave-field, called phase singularities or vortices, which are spatial points within the electromagnetic wave at which the amplitude is zero and the phase is hence not determined. An experimental tool working in transmission with a resolution of 20 nm in the object plane is presented and its application to the optical characterization of various single and periodic nanostructures such as trenches, gratings, microlenses and computer generated holograms is discussed. The conditions for the appearance of phase singularities are theoretically and experimentally outlined and it is shown how dislocation pairs can be used to determine unknown parameters from an object. Their corresponding applications to metrology or in optical data storage systems are analyzed. In addition, rigorous diffraction theory is used in all cases to simulate the interaction of light with the nano-optical structures to provide theoretical confirmation of the experimental results. Keywords: Interferometry, Nano-optic, Super resolution, Diffraction. 1. INTRODUCTION To obtain structural information about objects by using light, various parameters that characterize the optical wave- field can be used as the carrier of information. The underlying idea is generally that upon illuminating the object with a well defined wave-field, the parameters that characterize the wave-field are measured after interaction with the sample and a change of those parameters permits the reconstruction of either geometrical or optical information about the object. Widely used as an information carrier is obviously the amplitude or intensity distribution of a wave-field [1]. But also the state of polarization of the reflected light [2], the particular wavelength of light scattered e.g. resonantly on small metallic nano particles [3], or the spatially localized generation of light with higher frequencies employing nonlinear effects [4] can be used to obtain information about the structure under investigation. All those methods rely on the detection of field components scattered by the objects into the far-field. Hence, information contained in evanescent field components that do not carry energy is lost and the corresponding reconstruction of object information is subject to an incertitude for object sizes smaller than approximately half the wavelength. Overcoming this limit, known as the Abbe-criteria, is currently the subject of investigations with various approaches. The most direct way to collect information in addition to the far-field (herein defined as the *Address correspondence to this author at the Institute for Solid State Theory and Optics, Friedrich-Schiller University Jena, Max-Wien Platz1, D- 07743 Jena, Germany; Tel: 0049 (0) 3641 947 174; Fax: 0049 (0) 3641 947 177; E-mail: [email protected] # At the time the work presented in this review was carried out, all the authors were with the University of Neuchâtel, Switzerland. C. Rockstuhl is now with the Friedrich Schiller University in Jena, Germany and Martin Salt is with Heptagon Oy., Switzerland. spatial domain far away from the sample, as compared to the wavelength, where the amplitude of evanescent waves is negligible) is to obtain information about the near-field (defined as the spatial domain close to the sample, as compared to the wavelength, where the evanescent waves have finite amplitudes). It is possible by employing techniques that detect the field-distribution close to the sample. This can be done by e.g. scanning the field directly above the sample with a small aperture (Scanning Near-field Optical Microscope (SNOM), where the resolution is given to a first approximation by the diameter of the opening aperture) [5], or using a small probe that scatters light into the far-field and transfers evanescent into propagating wave- components (scattering-SNOM), where the resolution is given to a first approximation by the size of the scattering object [6]. However, the drawback of those methods is their scanning character, which prevents the collection of informa- tion about the entire sample in parallel. In addition, the distance between sample and probe has to be kept constant with a high precision in the nm range, a limitation that puts lower bounds on the overall information acquisition time. The phase of an optical wave-field is an additional parameter that can be used to obtain structural information about phase objects. Phase objects are characterized by a phase only transmittance function, hence the absorption of light and the corresponding direct modulation of the transmitted amplitude is excluded. If the phase variation ratio of the scattered to the directly transmitted light (zero diffraction order) is small compared to unity, the phase modulation can be directly transferred into an intensity modulation by phase shifting the light diffracted into the zero order by a quarter wavelength [7]. This is called Zernicke phase contrast method. If the phase modulation gets larger this method can no longer be used directly. In such a strong interaction domain, Published in Current Nanoscience 2, issue 4, 337-350, 2006 which should be used for any reference to this work 1
Transcript of High Resolution Interference Microscopy: A Tool for Probing Optical Waves in the Far-Field on a...
High Resolution Interference Microscopy: A Tool for Probing OpticalWaves in the Far-Field on a Nanometric Length Scale
Carsten Rockstuhl*, Iwan Märki, Toralf Scharf, Martin Salt, Hans Peter Herzig and René Dändliker#
University of Neuchâtel, Institute of Microtechnology, Rue A.-L. Breguet 2, CH-2000 Neuchâtel, Switzerland
Abstract: High Resolution Interference Microscopy (HRIM) is a technique that allows the characterization of amplitudeand phase of electromagnetic wave-fields in the far-field with a spatial accuracy that corresponds to a few nanometers inthe object plane. Emphasis is put on the precise determination of topological features in the wave-field, called phasesingularities or vortices, which are spatial points within the electromagnetic wave at which the amplitude is zero and thephase is hence not determined. An experimental tool working in transmission with a resolution of 20 nm in the objectplane is presented and its application to the optical characterization of various single and periodic nanostructures such astrenches, gratings, microlenses and computer generated holograms is discussed. The conditions for the appearance ofphase singularities are theoretically and experimentally outlined and it is shown how dislocation pairs can be used todetermine unknown parameters from an object. Their corresponding applications to metrology or in optical data storagesystems are analyzed. In addition, rigorous diffraction theory is used in all cases to simulate the interaction of light withthe nano-optical structures to provide theoretical confirmation of the experimental results.
Keywords: Interferometry, Nano-optic, Super resolution, Diffraction.
1. INTRODUCTION
To obtain structural information about objects by usinglight, various parameters that characterize the optical wave-field can be used as the carrier of information. Theunderlying idea is generally that upon illuminating the objectwith a well defined wave-field, the parameters thatcharacterize the wave-field are measured after interactionwith the sample and a change of those parameters permitsthe reconstruction of either geometrical or optical informationabout the object.
Widely used as an information carrier is obviously theamplitude or intensity distribution of a wave-field [1]. Butalso the state of polarization of the reflected light [2], theparticular wavelength of light scattered e.g. resonantly onsmall metallic nano particles [3], or the spatially localizedgeneration of light with higher frequencies employingnonlinear effects [4] can be used to obtain information aboutthe structure under investigation. All those methods rely onthe detection of field components scattered by the objectsinto the far-field. Hence, information contained in evanescentfield components that do not carry energy is lost and thecorresponding reconstruction of object information is subjectto an incertitude for object sizes smaller than approximatelyhalf the wavelength. Overcoming this limit, known as theAbbe-criteria, is currently the subject of investigations withvarious approaches. The most direct way to collectinformation in addition to the far-field (herein defined as the
*Address correspondence to this author at the Institute for Solid StateTheory and Optics, Friedrich-Schiller University Jena, Max-Wien Platz1, D-07743 Jena, Germany; Tel: 0049 (0) 3641 947 174; Fax: 0049 (0) 3641 947177; E-mail: [email protected]#At the time the work presented in this review was carried out, all theauthors were with the University of Neuchâtel, Switzerland. C. Rockstuhl isnow with the Friedrich Schiller University in Jena, Germany and Martin Saltis with Heptagon Oy., Switzerland.
spatial domain far away from the sample, as compared to thewavelength, where the amplitude of evanescent waves isnegligible) is to obtain information about the near-field(defined as the spatial domain close to the sample, ascompared to the wavelength, where the evanescent waveshave finite amplitudes). It is possible by employingtechniques that detect the field-distribution close to thesample. This can be done by e.g. scanning the field directlyabove the sample with a small aperture (Scanning Near-fieldOptical Microscope (SNOM), where the resolution is givento a first approximation by the diameter of the openingaperture) [5], or using a small probe that scatters light intothe far-field and transfers evanescent into propagating wave-components (scattering-SNOM), where the resolution isgiven to a first approximation by the size of the scatteringobject [6]. However, the drawback of those methods is theirscanning character, which prevents the collection of informa-tion about the entire sample in parallel. In addition, thedistance between sample and probe has to be kept constantwith a high precision in the nm range, a limitation that putslower bounds on the overall information acquisition time.
The phase of an optical wave-field is an additionalparameter that can be used to obtain structural informationabout phase objects. Phase objects are characterized by aphase only transmittance function, hence the absorption oflight and the corresponding direct modulation of thetransmitted amplitude is excluded. If the phase variationratio of the scattered to the directly transmitted light (zerodiffraction order) is small compared to unity, the phasemodulation can be directly transferred into an intensitymodulation by phase shifting the light diffracted into thezero order by a quarter wavelength [7]. This is calledZernicke phase contrast method.
If the phase modulation gets larger this method can nolonger be used directly. In such a strong interaction domain,
Published in Current Nanoscience 2, issue 4, 337-350, 2006which should be used for any reference to this work
1
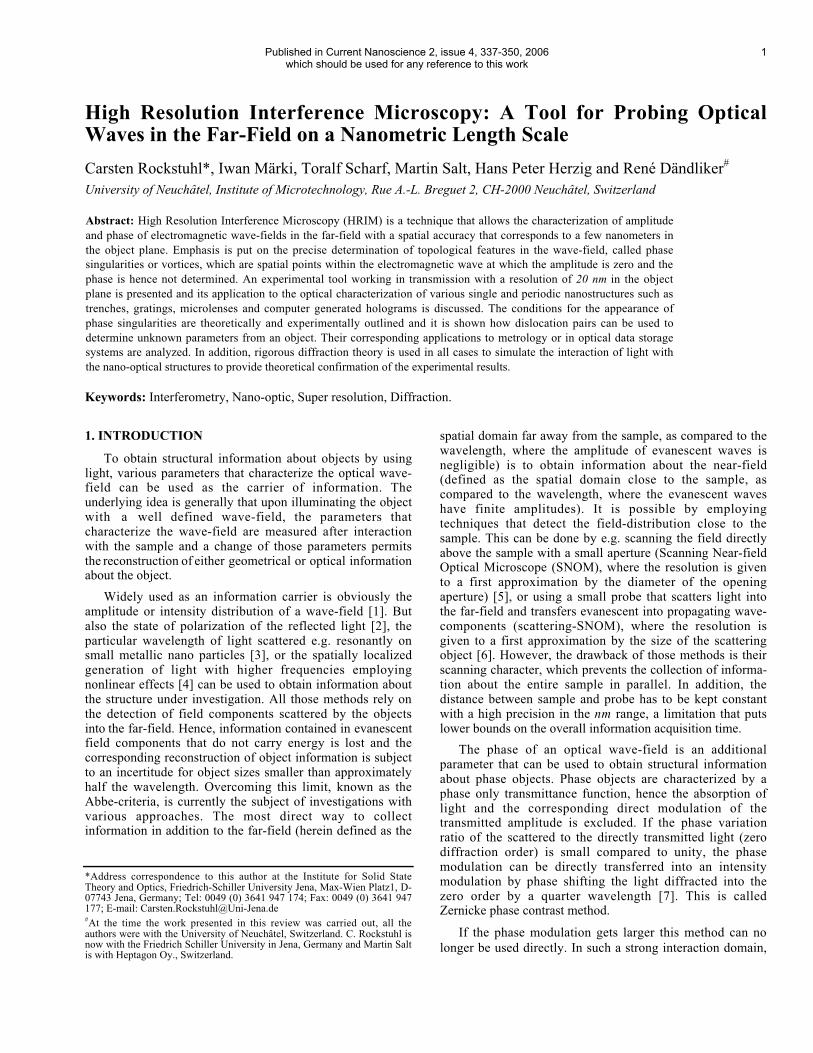
the scattered wave-field no longer behaves smoothly andturbulence in the phase field will appear. If the strength ofthe scattered field is sufficient to interfere completelydestructively with the zero-order, spatial points in the wave-field exist, where the amplitude is zero. Associated with thiszero amplitude is a phase singularity, a spatial point at whichthe phase φ is not determined, as it is defined as
tanImag
Real( )
(E)
(E)φ = with E being a scalar wave-field
component. Phase singularities were first observed in aseminal work by Nye and Berry [8]. As a generalclassification of phase singularities, one distinguishes betweenscrew and edge singularities (also called dislocations oroptical vortices). The simulated phase distribution of anidealized screw singularity, as shown in Fig. 1(a) , ischaracterized by a point in which the amplitude is zero andthe phase varies along a circle in the close vicinity of thesingularity by a multiple m of 2π, with m being thetopological charge or strength of the singularity [9, 10]. Apositive sign of the charge denotes a right-handed screw ofthe phase front in the propagation direction; a negative signdenotes a left-handed screw. The phase in Fig. 1(a) is shownin a plane perpendicular to the propagation direction. Alongthe propagation direction of the laser beam, such asingularity produces a line with an intensity equal to zero.The simulated phase distribution of an ideal edgedislocation, as shown in Fig. 1(b), corresponds to a line ofzero intensity transverse to the propagation direction. Thephase has a phase jump of exactly π across this line. In a cuttrough any one of the two transversal coordinates and thelongitudinal coordinate, the phase distribution resembles thedistribution of a screw singularity: it appears as a point in
which the amplitude is zero and a phase varies along a closedcircle around the singularity by 2π.
These phase singularities appear manifold in nature, withlaser beams of Gauss- Hermite type (edge singularities) andGauss-Laguerre type (screw singularities) being the mostprominent examples [11]. Screw dislocations have also beenobserved in random speckle wave-fields [12, 13]. They canbe generated in a controlled manner by employing laserresonators [14], appropriately designed phase plates [15, 16],mode converters [17] or computer generated holograms [18,19], and they can be used in a range of applications, e.g. forthe trapping of particles [20] or atoms [21].
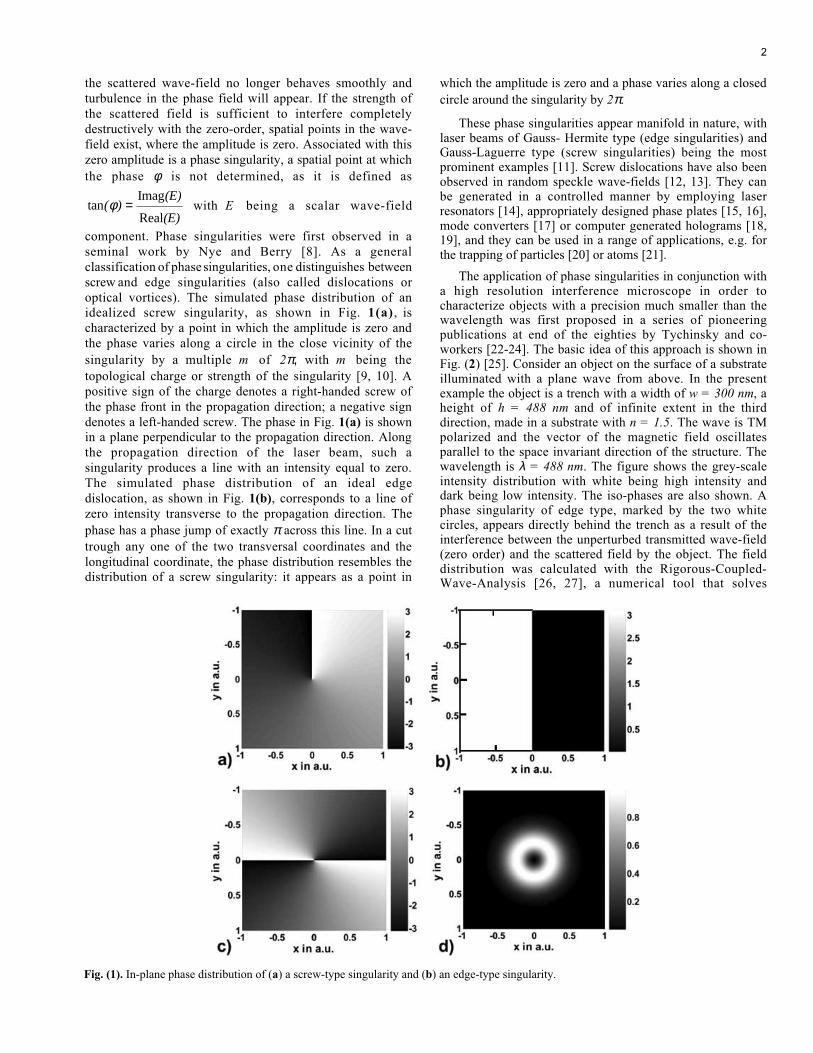
The application of phase singularities in conjunction witha high resolution interference microscope in order tocharacterize objects with a precision much smaller than thewavelength was first proposed in a series of pioneeringpublications at end of the eighties by Tychinsky and co-workers [22-24]. The basic idea of this approach is shown inFig. (2) [25]. Consider an object on the surface of a substrateilluminated with a plane wave from above. In the presentexample the object is a trench with a width of w = 300 nm, aheight of h = 488 nm and of infinite extent in the thirddirection, made in a substrate with n = 1.5. The wave is TMpolarized and the vector of the magnetic field oscillatesparallel to the space invariant direction of the structure. Thewavelength is λ = 488 nm. The figure shows the grey-scaleintensity distribution with white being high intensity anddark being low intensity. The iso-phases are also shown. Aphase singularity of edge type, marked by the two whitecircles, appears directly behind the trench as a result of theinterference between the unperturbed transmitted wave-field(zero order) and the scattered field by the object. The fielddistribution was calculated with the Rigorous-Coupled-Wave-Analysis [26, 27], a numerical tool that solves
Fig. (1). In-plane phase distribution of (a) a screw-type singularity and (b) an edge-type singularity.
2
Maxwell’s equations rigorously, employing periodic boundaryconditions. Nevertheless, this approach can be appliedlikewise to aperiodic objects under certain constraints for theperiodicity (the period in the simulation has to be muchlarger than the transverse extension of the object and theperiod should not be an integer multiple of the illuminatingwavelength [25, 28]). The field distribution shown is filteredsuch that waves with spatial frequencies of |kx| > k0 (e.g.evanescent waves) are not shown and the amplitude andphase distribution is hence accessible by means of interfero-metric equipment in the far-field. It can be seen that directlybehind the structure a pair of phase singularities appearswhose separation can be related to the width of the structure.Because the singularities are mathematically exact points,measuring their distance is only subject to technicallimitations and super-resolution is generally possible.However, this super-resolution does not refer to a physicalobject but only to the particular topological feature in thewave-field. As the size of the objects are also comparable tothe wavelength, scalar theory can no longer be used todescribe the interaction of light with those objects properly,and rigorous numerical tools have to be used for the exactsimulation of the light interaction. It turns out, that a directrelation between object properties and the singularities doesnot exist and only the use of a priori knowledge about thestructure (like height, profile parameters, refractive index)allows to reconstruct the unknown object parameters [29, 30,31-33]. The question whether true super-resolution of objectssmaller than half the wavelength is obtainable remains anopen issue.
In this mini-review, we will report on our latest results inthe field of High-Resolution Interference Microscopy(HRIM) using an instrument that works in transmission. Thisarticle is written with the intention to give an overview of thepotential of HRIM to a broader audience. The paper isstructured as follows. In section 2 we will present the
experimental set-up of the instrument. Results of the analysisof screw dislocation generated by Computer GeneratedHolograms (CGH) are presented in section 3. In section 4edge singularities generated by periodic elements and insection 5 by single elements are analyzed. In both sectionsthe conditions for the appearance of singularities are outlinedand it is shown that super-resolution of objects is notpossible. To obtain singularities in the far-field, the objecthas to have a certain width (at an optimum phase depth) thatis comparable with the Abbe-resolution limit. However, oncephase singularities appear, their position can be determinedwith a theoretically unlimited resolution. This propertyfavors their use in applications such as metrology or opticaldata storage systems.
2. Experiemental Set-Up
The experimental set-up of the interferometer is shown inFig. 3(a). A photograph of the actual instrument is shown inFig. 3(b). The light source in the experiments is either anArgon laser (λ = 488 nm) or a HeNe laser (λ = 632.8 nm)coupled to a monomode fiber. A fiber coupler splits thewave-field into a reference and an object arm with anadjustable energy ratio. This permits to optimize the contrastof the interference fringes for an easier determination of thephase. In the object arm, the light that exits the fiberilluminates the sample mounted on a high precision piezostage, which allows positioning in the x and y direction withan accuracy of 10 nm and in the z-direction with an accuracyof 1 nm. The light from the exit of the fiber is collimatedonto the object such that the illuminating wave sufficientlyresembles a plane wave (its Gaussian waist is much largerthan the transversal extension of the object). The transmittedlight enters a standard microscope, which consists of atelescopic system with the first lens being a variableobjective and the second lens having a fixed focal length of250 mm. The first objective basically limits the angular
Fig. (2). Basic geometry of a non-periodic scattering object that causes the generation of an edge dislocation in the transmitted wave-field dueto complete destructive interference of the scattered field with the incident field. The simulated intensity and isophases of the wave field areshown, the circles denote the position of the singularities and the details of the structure are outlined in the text.
3
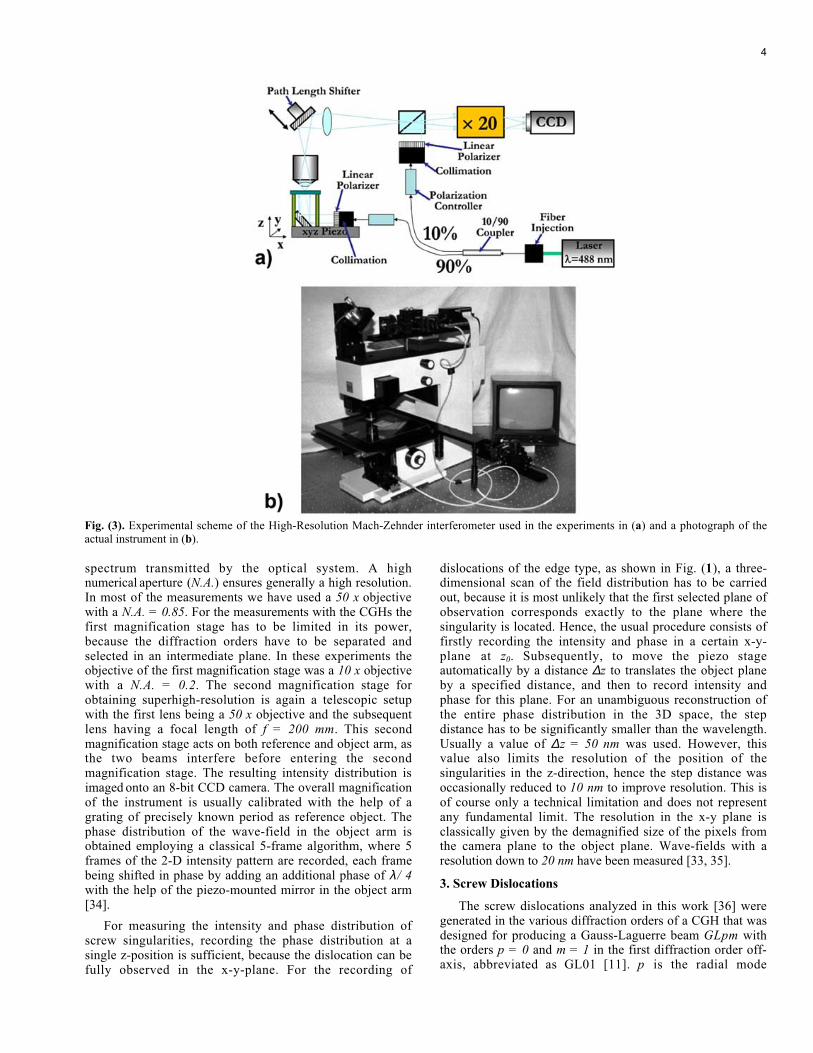
spectrum transmitted by the optical system. A highnumerical aperture (N.A.) ensures generally a high resolution.In most of the measurements we have used a 50 x objectivewith a N.A. = 0.85. For the measurements with the CGHs thefirst magnification stage has to be limited in its power,because the diffraction orders have to be separated andselected in an intermediate plane. In these experiments theobjective of the first magnification stage was a 10 x objectivewith a N.A. = 0.2. The second magnification stage forobtaining superhigh-resolution is again a telescopic setupwith the first lens being a 50 x objective and the subsequentlens having a focal length of f = 200 mm. This secondmagnification stage acts on both reference and object arm, asthe two beams interfere before entering the secondmagnification stage. The resulting intensity distribution isimaged onto an 8-bit CCD camera. The overall magnificationof the instrument is usually calibrated with the help of agrating of precisely known period as reference object. Thephase distribution of the wave-field in the object arm isobtained employing a classical 5-frame algorithm, where 5frames of the 2-D intensity pattern are recorded, each framebeing shifted in phase by adding an additional phase of λ / 4with the help of the piezo-mounted mirror in the object arm[34].
For measuring the intensity and phase distribution ofscrew singularities, recording the phase distribution at asingle z-position is sufficient, because the dislocation can befully observed in the x-y-plane. For the recording of
dislocations of the edge type, as shown in Fig. (1), a three-dimensional scan of the field distribution has to be carriedout, because it is most unlikely that the first selected plane ofobservation corresponds exactly to the plane where thesingularity is located. Hence, the usual procedure consists offirstly recording the intensity and phase in a certain x-y-plane at z0. Subsequently, to move the piezo stageautomatically by a distance ∆z to translates the object planeby a specified distance, and then to record intensity andphase for this plane. For an unambiguous reconstruction ofthe entire phase distribution in the 3D space, the stepdistance has to be significantly smaller than the wavelength.Usually a value of ∆z = 50 nm was used. However, thisvalue also limits the resolution of the position of thesingularities in the z-direction, hence the step distance wasoccasionally reduced to 10 nm to improve resolution. This isof course only a technical limitation and does not representany fundamental limit. The resolution in the x-y plane isclassically given by the demagnified size of the pixels fromthe camera plane to the object plane. Wave-fields with aresolution down to 20 nm have been measured [33, 35].
3. Screw Dislocations
The screw dislocations analyzed in this work [36] weregenerated in the various diffraction orders of a CGH that wasdesigned for producing a Gauss-Laguerre beam GLpm withthe orders p = 0 and m = 1 in the first diffraction order off-axis, abbreviated as GL01 [11]. p is the radial mode
Fig. (3). Experimental scheme of the High-Resolution Mach-Zehnder interferometer used in the experiments in (a) and a photograph of theactual instrument in (b).
4
parameter of the GL beam and m the azimuthal modeparameter. Following the standard procedure for the design[37] the pattern of the CGH was obtained by computer as theresult of the interference of a GL beam of the desired orderand waist with a plane reference wave that propagates undera certain angle with respect to the GL beam. After anappropriate clipping procedure, the CGH becomes a binarygrating with a period Λ that posses the proper phasetransmittance function for generating a singularity of charge1. The sinus of the angle θ under which the variousdiffraction orders propagate in space is given by an integermultiple of λ /Λ . The holograms were printed using aphotocomposer and subsequently reduced in aphotolithographic process by a factor of 10 and then imagedon a substrate covered with photoresist [38]. Afterdevelopment, the sample is used as a phase-only object thatworks in transmission. We have chosen for the underlyingbinary grating a period of 10 µm and the depth of thegratings was evaluated by means of an atomic forcemicroscope to be 600 nm.
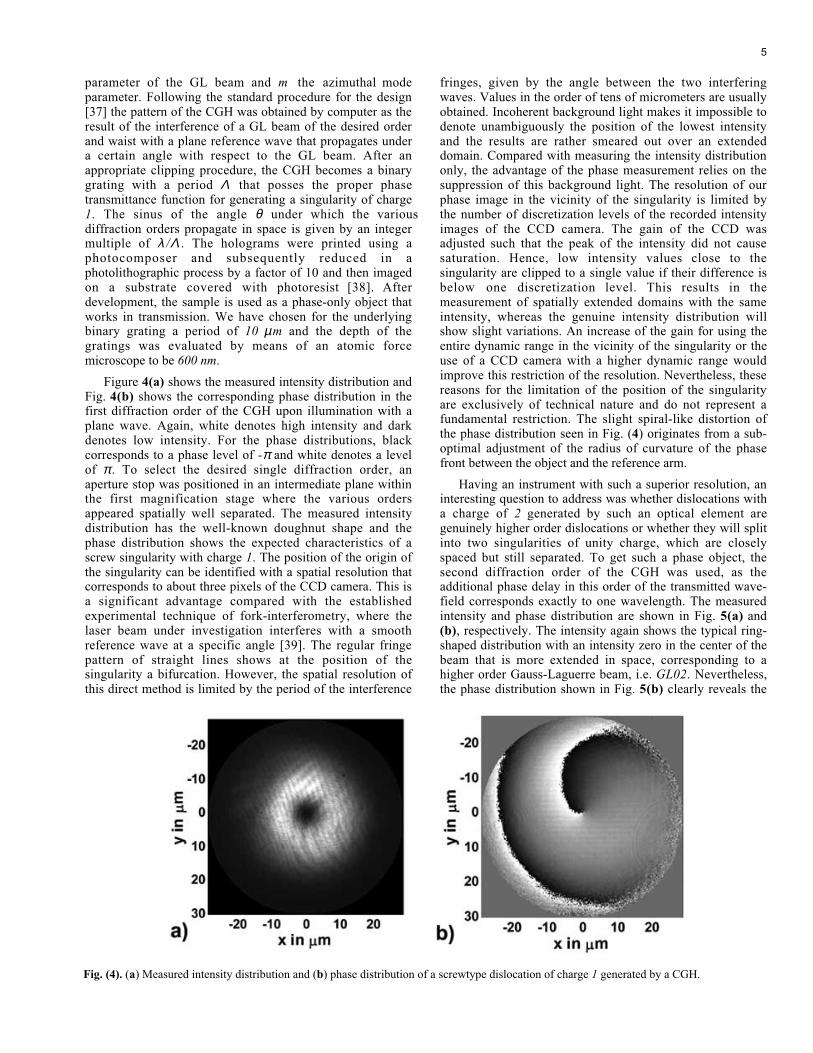
Figure 4(a) shows the measured intensity distribution andFig. 4(b) shows the corresponding phase distribution in thefirst diffraction order of the CGH upon illumination with aplane wave. Again, white denotes high intensity and darkdenotes low intensity. For the phase distributions, blackcorresponds to a phase level of -π and white denotes a levelof π. To select the desired single diffraction order, anaperture stop was positioned in an intermediate plane withinthe first magnification stage where the various ordersappeared spatially well separated. The measured intensitydistribution has the well-known doughnut shape and thephase distribution shows the expected characteristics of ascrew singularity with charge 1. The position of the origin ofthe singularity can be identified with a spatial resolution thatcorresponds to about three pixels of the CCD camera. This isa significant advantage compared with the establishedexperimental technique of fork-interferometry, where thelaser beam under investigation interferes with a smoothreference wave at a specific angle [39]. The regular fringepattern of straight lines shows at the position of thesingularity a bifurcation. However, the spatial resolution ofthis direct method is limited by the period of the interference
fringes, given by the angle between the two interferingwaves. Values in the order of tens of micrometers are usuallyobtained. Incoherent background light makes it impossible todenote unambiguously the position of the lowest intensityand the results are rather smeared out over an extendeddomain. Compared with measuring the intensity distributiononly, the advantage of the phase measurement relies on thesuppression of this background light. The resolution of ourphase image in the vicinity of the singularity is limited bythe number of discretization levels of the recorded intensityimages of the CCD camera. The gain of the CCD wasadjusted such that the peak of the intensity did not causesaturation. Hence, low intensity values close to thesingularity are clipped to a single value if their difference isbelow one discretization level. This results in themeasurement of spatially extended domains with the sameintensity, whereas the genuine intensity distribution willshow slight variations. An increase of the gain for using theentire dynamic range in the vicinity of the singularity or theuse of a CCD camera with a higher dynamic range wouldimprove this restriction of the resolution. Nevertheless, thesereasons for the limitation of the position of the singularityare exclusively of technical nature and do not represent afundamental restriction. The slight spiral-like distortion ofthe phase distribution seen in Fig. (4) originates from a sub-optimal adjustment of the radius of curvature of the phasefront between the object and the reference arm.
Having an instrument with such a superior resolution, aninteresting question to address was whether dislocations witha charge of 2 generated by such an optical element aregenuinely higher order dislocations or whether they will splitinto two singularities of unity charge, which are closelyspaced but still separated. To get such a phase object, thesecond diffraction order of the CGH was used, as theadditional phase delay in this order of the transmitted wave-field corresponds exactly to one wavelength. The measuredintensity and phase distribution are shown in Fig. 5(a) and(b), respectively. The intensity again shows the typical ring-shaped distribution with an intensity zero in the center of thebeam that is more extended in space, corresponding to ahigher order Gauss-Laguerre beam, i.e. GL02. Nevertheless,the phase distribution shown in Fig. 5(b) clearly reveals the
Fig. (4). (a) Measured intensity distribution and (b) phase distribution of a screwtype dislocation of charge 1 generated by a CGH.
5
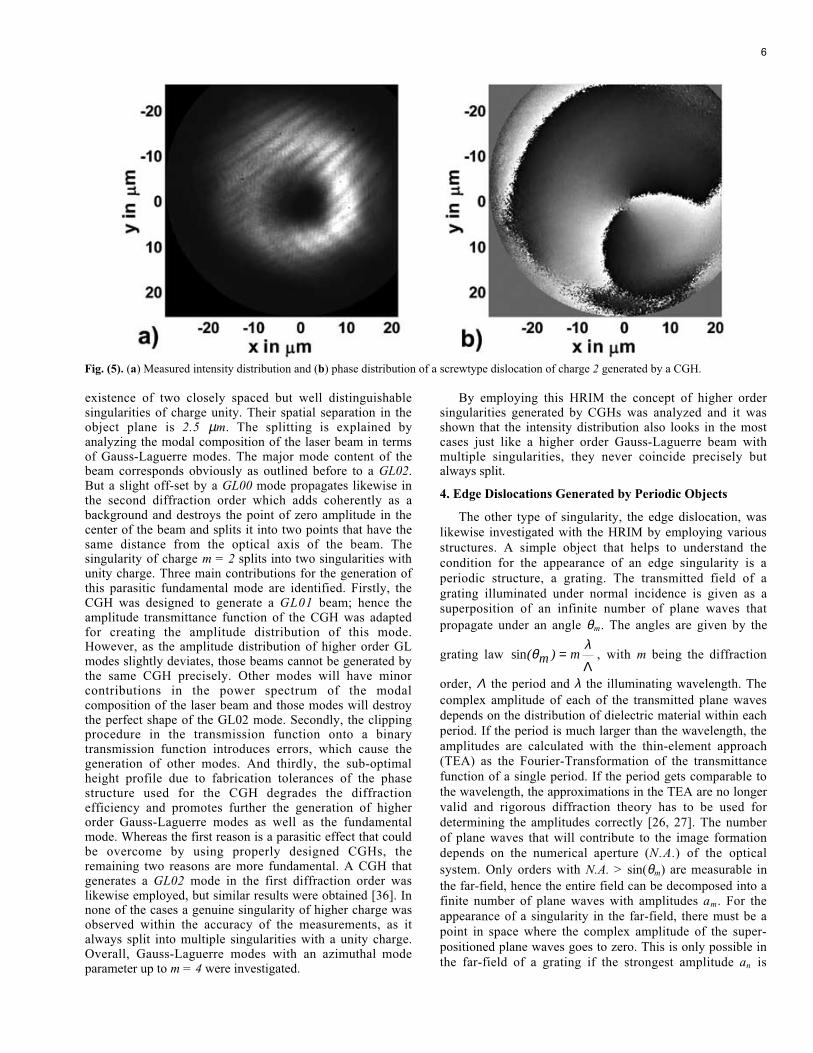
existence of two closely spaced but well distinguishablesingularities of charge unity. Their spatial separation in theobject plane is 2.5 µm. The splitting is explained byanalyzing the modal composition of the laser beam in termsof Gauss-Laguerre modes. The major mode content of thebeam corresponds obviously as outlined before to a GL02.But a slight off-set by a GL00 mode propagates likewise inthe second diffraction order which adds coherently as abackground and destroys the point of zero amplitude in thecenter of the beam and splits it into two points that have thesame distance from the optical axis of the beam. Thesingularity of charge m = 2 splits into two singularities withunity charge. Three main contributions for the generation ofthis parasitic fundamental mode are identified. Firstly, theCGH was designed to generate a GL01 beam; hence theamplitude transmittance function of the CGH was adaptedfor creating the amplitude distribution of this mode.However, as the amplitude distribution of higher order GLmodes slightly deviates, those beams cannot be generated bythe same CGH precisely. Other modes will have minorcontributions in the power spectrum of the modalcomposition of the laser beam and those modes will destroythe perfect shape of the GL02 mode. Secondly, the clippingprocedure in the transmission function onto a binarytransmission function introduces errors, which cause thegeneration of other modes. And thirdly, the sub-optimalheight profile due to fabrication tolerances of the phasestructure used for the CGH degrades the diffractionefficiency and promotes further the generation of higherorder Gauss-Laguerre modes as well as the fundamentalmode. Whereas the first reason is a parasitic effect that couldbe overcome by using properly designed CGHs, theremaining two reasons are more fundamental. A CGH thatgenerates a GL02 mode in the first diffraction order waslikewise employed, but similar results were obtained [36]. Innone of the cases a genuine singularity of higher charge wasobserved within the accuracy of the measurements, as italways split into multiple singularities with a unity charge.Overall, Gauss-Laguerre modes with an azimuthal modeparameter up to m = 4 were investigated.
By employing this HRIM the concept of higher ordersingularities generated by CGHs was analyzed and it wasshown that the intensity distribution also looks in the mostcases just like a higher order Gauss-Laguerre beam withmultiple singularities, they never coincide precisely butalways split.
4. Edge Dislocations Generated by Periodic Objects
The other type of singularity, the edge dislocation, waslikewise investigated with the HRIM by employing variousstructures. A simple object that helps to understand thecondition for the appearance of an edge singularity is aperiodic structure, a grating. The transmitted field of agrating illuminated under normal incidence is given as asuperposition of an infinite number of plane waves thatpropagate under an angle θm. The angles are given by the
grating law sin( m ) mθλ
=Λ
, with m being the diffraction
order, Λ the period and λ the illuminating wavelength. Thecomplex amplitude of each of the transmitted plane wavesdepends on the distribution of dielectric material within eachperiod. If the period is much larger than the wavelength, theamplitudes are calculated with the thin-element approach(TEA) as the Fourier-Transformation of the transmittancefunction of a single period. If the period gets comparable tothe wavelength, the approximations in the TEA are no longervalid and rigorous diffraction theory has to be used fordetermining the amplitudes correctly [26, 27]. The numberof plane waves that will contribute to the image formationdepends on the numerical aperture (N.A.) of the opticalsystem. Only orders with N.A. > sin(θm) are measurable inthe far-field, hence the entire field can be decomposed into afinite number of plane waves with amplitudes am. For theappearance of a singularity in the far-field, there must be apoint in space where the complex amplitude of the super-positioned plane waves goes to zero. This is only possible inthe far-field of a grating if the strongest amplitude an is
Fig. (5). (a) Measured intensity distribution and (b) phase distribution of a screwtype dislocation of charge 2 generated by a CGH.
6
smaller than the sum of all the other amplitudes [40]. Hencethe condition reads as
amm n an n≥≠∑ ∀ . . (1)
For measuring singularities with the HRIM at least thezero and first diffraction orders have to propagate throughthe optical system, which corresponds to the resolutioncriteria as formulated by Ernst Abbe.
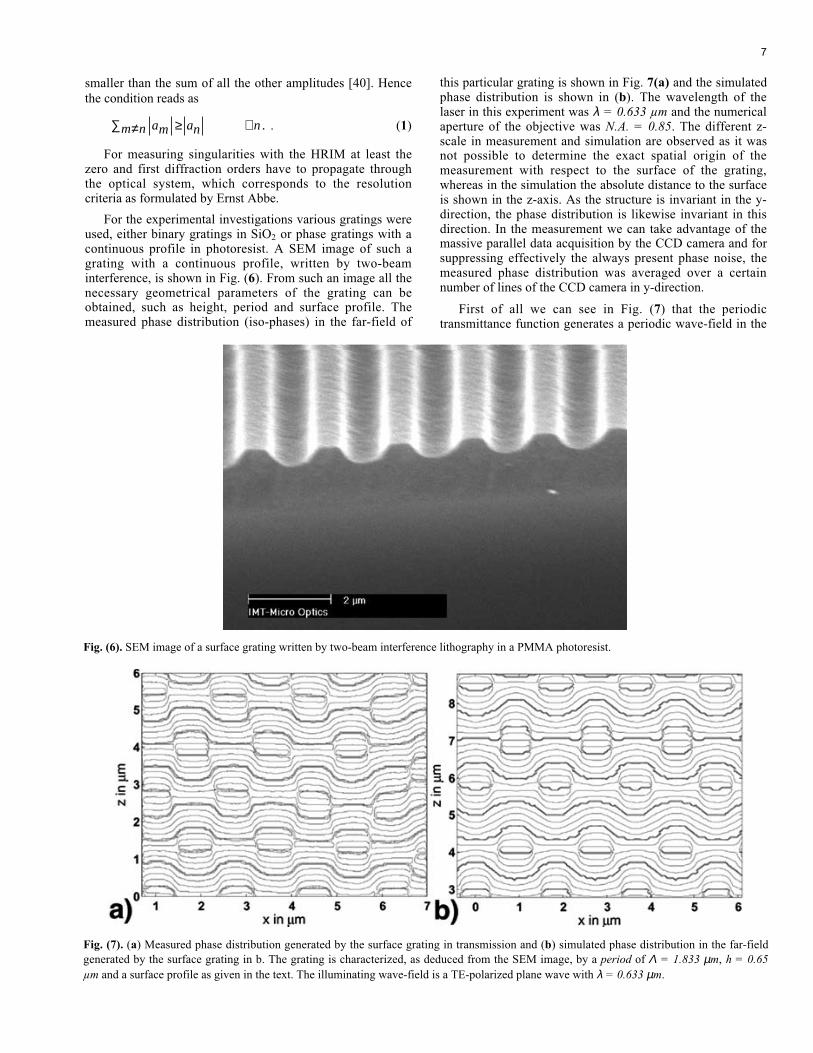
For the experimental investigations various gratings wereused, either binary gratings in SiO2 or phase gratings with acontinuous profile in photoresist. A SEM image of such agrating with a continuous profile, written by two-beaminterference, is shown in Fig. (6). From such an image all thenecessary geometrical parameters of the grating can beobtained, such as height, period and surface profile. Themeasured phase distribution (iso-phases) in the far-field of
this particular grating is shown in Fig. 7(a) and the simulatedphase distribution is shown in (b). The wavelength of thelaser in this experiment was λ = 0.633 µm and the numericalaperture of the objective was N.A. = 0.85. The different z-scale in measurement and simulation are observed as it wasnot possible to determine the exact spatial origin of themeasurement with respect to the surface of the grating,whereas in the simulation the absolute distance to the surfaceis shown in the z-axis. As the structure is invariant in the y-direction, the phase distribution is likewise invariant in thisdirection. In the measurement we can take advantage of themassive parallel data acquisition by the CCD camera and forsuppressing effectively the always present phase noise, themeasured phase distribution was averaged over a certainnumber of lines of the CCD camera in y-direction.
First of all we can see in Fig. (7) that the periodictransmittance function generates a periodic wave-field in the
Fig. (6). SEM image of a surface grating written by two-beam interference lithography in a PMMA photoresist.
Fig. (7). (a) Measured phase distribution generated by the surface grating in transmission and (b) simulated phase distribution in the far-fieldgenerated by the surface grating in b. The grating is characterized, as deduced from the SEM image, by a period of Λ = 1.833 µm, h = 0.65µm and a surface profile as given in the text. The illuminating wave-field is a TE-polarized plane wave with λ = 0.633 µm.
7
transverse x-direction with phase singularities being an idealindication for determining exactly the period. As the periodcan be likewise obtained with high accuracy from themeasurement of the propagation direction of the variousdiffraction orders, the field distribution of such a grating canbe applied for calibrating exactly the object size that a singlepixel of the CCD camera represents. The dislocations can beseen in the points where all isophases unite or emerge,respectively. They are of edge-type. At a certain propagationdistance z0 where the dislocation is situated a line plot in x-direction of the phase distribution would correspond to aperiodic alternation of sharp phase jumps by π. Themeasured and the simulated phase distribution showexcellent agreement. The slight deviation of the measuredphase distribution reveals the signature of a localperturbation of the grating, probably due to a dust particle onthe surface that acts as an additional scatterer. Themeasurement of this feature is not reproducible, as therelocalization of exactly the same point of the grating is notpossible, whereas the general field distribution can berepetitively measured. A richer variety of topologicalfeatures can be obtained by measuring gratings with a largerperiod, as more diffraction orders will contribute to thewave-field. The measurement of the phase distributionpermits principally the reconstruction of the surface profile.This can be done first of all by optimizing the complexamplitudes of a discrete number of plane waves, the numberof which corresponds to the number of diffraction ordersgenerated by a specific period and transmitted by the opticalsystem, such that the generated singularities correspond tothe spatially coordinates of the measured singularities.Subsequently the surface profile has to be determined thatgenerates exactly this set of amplitudes. Unfortunately, to thebest of the author’s knowledge no inverse rigorousdiffraction theory exist, which would permit such a directreconstruction. Additionally, the problem most likely doesnot have a unique solution and various gratings exist thatgenerate the same set of diffraction amplitudes. This makesit necessary to use a priori knowledge about the structure todetermine the proper profile. Nevertheless, as we will showbelow for non-periodic objects, if such additional informationis available, parameters of the structure can be revealed withhigh accuracy based on the measured positions ofsingularities.
5. EDGE DISLOCATIONS GENERATED BYAPERIODIC OBJECTS
Edge dislocations can also be generated by single / non-periodic objects if the interference of the scattered with theincident field is completely destructive at a specific spatialpoint. The angular spectrum of the scattered field is notdiscrete as in the case of periodic objects, but continuous.Hence, for a mathematical derivation of the condition for theappearance of dislocations in the far-field we extend thecondition given in the last section to the limit of an infiniteperiod, which reads as [25]
a dN A
a dN A
( ) ( ( )). .
( ) ( ). .
ν δ ν ν νν ν δ ν ν νν1 0 0− − ≥∫ −∫ (2)
with a(ν) being the Fourier-coefficient of the transmittancefunction at the spatial frequency ν, ν0 the spatial frequency
of the zero order direct transmitted light and with theamplitude spectrum integrated over all spatial frequenciesthat will be transmitted by the optical system. In the thin-element approach and employing scalar diffraction theory,the transmittance function T(x) relates the incident fieldFInc(x) and the transmitted field FTrans(x) linearly via FTrans(x)= T(x)FInc(x).
5.1 Phase Singularities Produced by Phase Bars
The condition is general and can be used to determinewhether an arbitrary object is capable of generating a phasesingularity in the far-field. With respect to an experimentalsituation we have investigated in detail the conditions for theappearance of a singularity for a phase bar surrounded by air.Its transmittance function is given by
T xei h n
xw
xw
( )
( )
=
−≤
>
2 1
2
12
πλ
(3)
The phase bar is characterized by a width w, a height hand a refractive index n and the induced phase delay of the
wave-field inside the bar is given by ∆φπ
λ= −
21
hn( ) .
Inserting this transmittance function into Eq. 2 will give theparticular condition of
0 14
2 0= − + ∫
π
φ λπsin
sin∆
t
t
wdt (4)
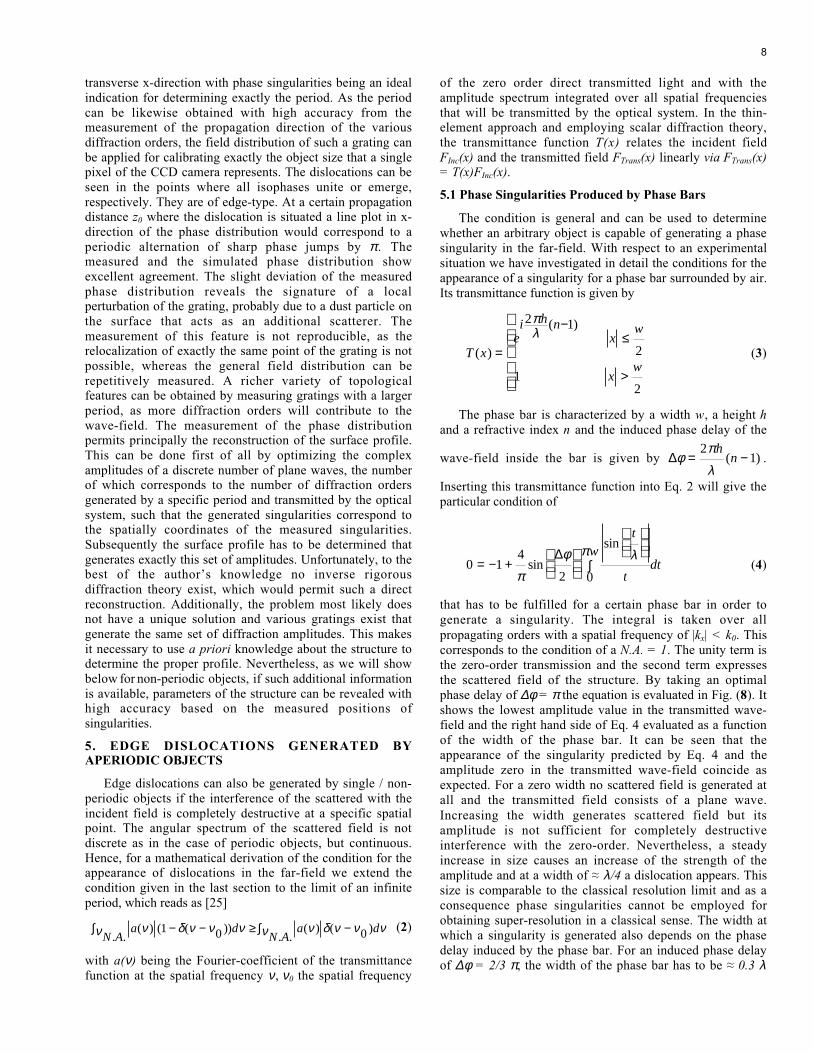
that has to be fulfilled for a certain phase bar in order togenerate a singularity. The integral is taken over allpropagating orders with a spatial frequency of |kx| < k0. Thiscorresponds to the condition of a N.A. = 1. The unity term isthe zero-order transmission and the second term expressesthe scattered field of the structure. By taking an optimalphase delay of ∆φ = π the equation is evaluated in Fig. (8). Itshows the lowest amplitude value in the transmitted wave-field and the right hand side of Eq. 4 evaluated as a functionof the width of the phase bar. It can be seen that theappearance of the singularity predicted by Eq. 4 and theamplitude zero in the transmitted wave-field coincide asexpected. For a zero width no scattered field is generated atall and the transmitted field consists of a plane wave.Increasing the width generates scattered field but itsamplitude is not sufficient for completely destructiveinterference with the zero-order. Nevertheless, a steadyincrease in size causes an increase of the strength of theamplitude and at a width of ≈ λ/4 a dislocation appears. Thissize is comparable to the classical resolution limit and as aconsequence phase singularities cannot be employed forobtaining super-resolution in a classical sense. The width atwhich a singularity is generated also depends on the phasedelay induced by the phase bar. For an induced phase delayof ∆φ = 2/3 π, the width of the phase bar has to be ≈ 0.3 λ
8
and a width of ≈ 0.6 λ is necessary at a phase delay of ∆φ =1/3 π.
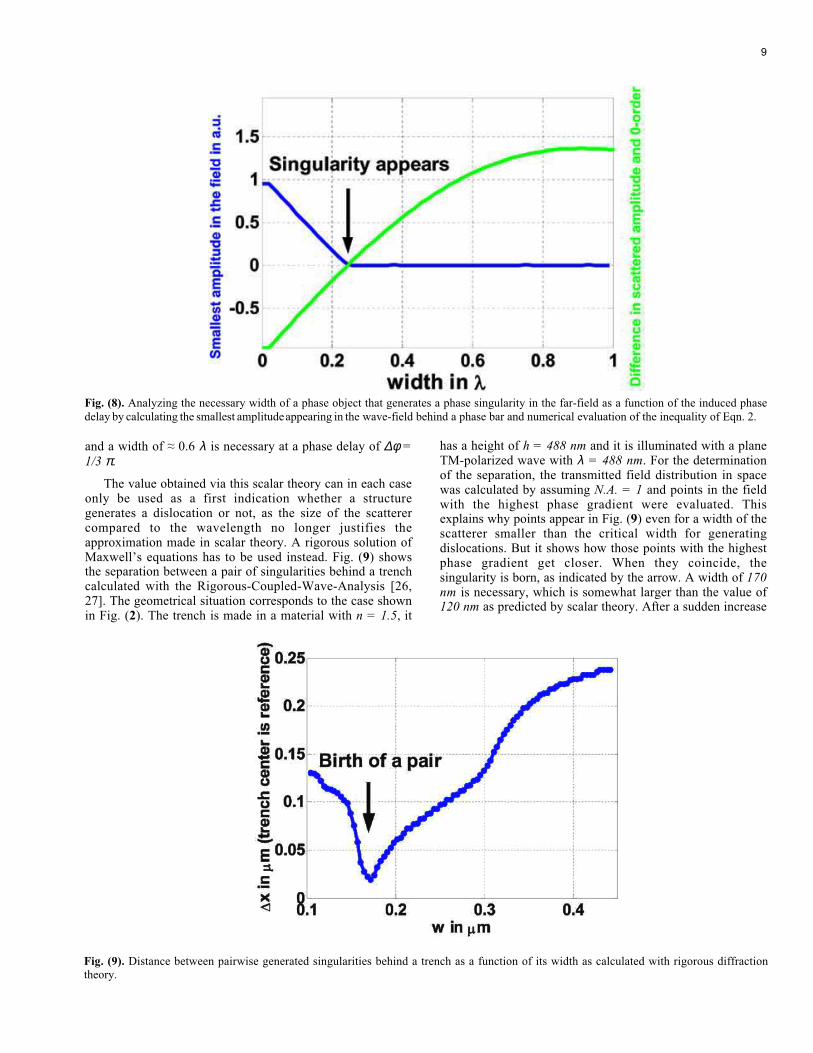
The value obtained via this scalar theory can in each caseonly be used as a first indication whether a structuregenerates a dislocation or not, as the size of the scatterercompared to the wavelength no longer justifies theapproximation made in scalar theory. A rigorous solution ofMaxwell’s equations has to be used instead. Fig. (9) showsthe separation between a pair of singularities behind a trenchcalculated with the Rigorous-Coupled-Wave-Analysis [26,27]. The geometrical situation corresponds to the case shownin Fig. (2). The trench is made in a material with n = 1.5, it
has a height of h = 488 nm and it is illuminated with a planeTM-polarized wave with λ = 488 nm. For the determinationof the separation, the transmitted field distribution in spacewas calculated by assuming N.A. = 1 and points in the fieldwith the highest phase gradient were evaluated. Thisexplains why points appear in Fig. (9) even for a width of thescatterer smaller than the critical width for generatingdislocations. But it shows how those points with the highestphase gradient get closer. When they coincide, thesingularity is born, as indicated by the arrow. A width of 170nm is necessary, which is somewhat larger than the value of120 nm as predicted by scalar theory. After a sudden increase
Fig. (8). Analyzing the necessary width of a phase object that generates a phase singularity in the far-field as a function of the induced phasedelay by calculating the smallest amplitude appearing in the wave-field behind a phase bar and numerical evaluation of the inequality of Eqn. 2.
Fig. (9). Distance between pairwise generated singularities behind a trench as a function of its width as calculated with rigorous diffractiontheory.
9
of the separation for widths slightly larger than the criticalone, the distance grows fairly linearly with the width of thestructure. Since the spatial position of the singularities can beevaluated with high resolution, this response allows also todetermine the width of the scatterer with high accuracy if theother parameters are known.
A remark must be made on the choice of the TMpolarization, which was selected specifically for thisgeometry of a trench. Singularities are generated at smallerfeature sizes for TM polarization compared with theorthogonal TE polarization. This can be explained byconsidering the trench as an air wave guide surrounded by ahigh index material [41]. If the material would be a perfectconductor, a cut-off width would exist for TE polarizationunder which no mode can propagate within the structure.The same holds principally for high-index dielectricmaterials. The structure illuminated with this polarizationwill not generate sufficient scattered light to suppress theincident field in a specific spatial point. Such a limitationdoes not hold for TM polarization, where at least one modealways propagates in the structure. If a mode is excitedwithin the structure, it propagates with a different propagationconstant than the field in the surrounding medium. Itaccumulates a phase delay and once the field exists thestructure, it interferes destructively if the phase delay issufficient that will cause ultimately the generation of thesingularity. For the opposite geometrical case, a phase bar ontop of a substrate, TE polarized light generates a singularityat smaller object sizes, since the propagation constant of theTE polarized mode is always larger than that for the TMmode. A larger phase delay is accumulated by the lightpropagating in the dielectric wave guide and destructiveinterference is more pronounced.
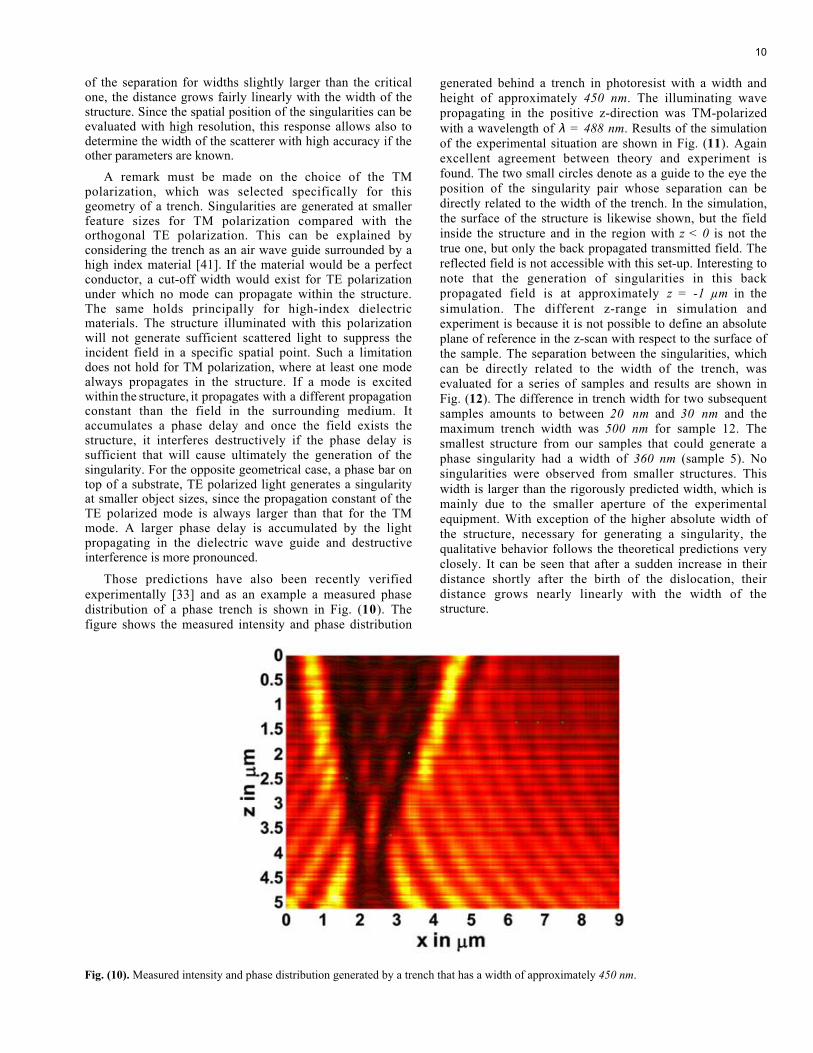
Those predictions have also been recently verifiedexperimentally [33] and as an example a measured phasedistribution of a phase trench is shown in Fig. (10). Thefigure shows the measured intensity and phase distribution
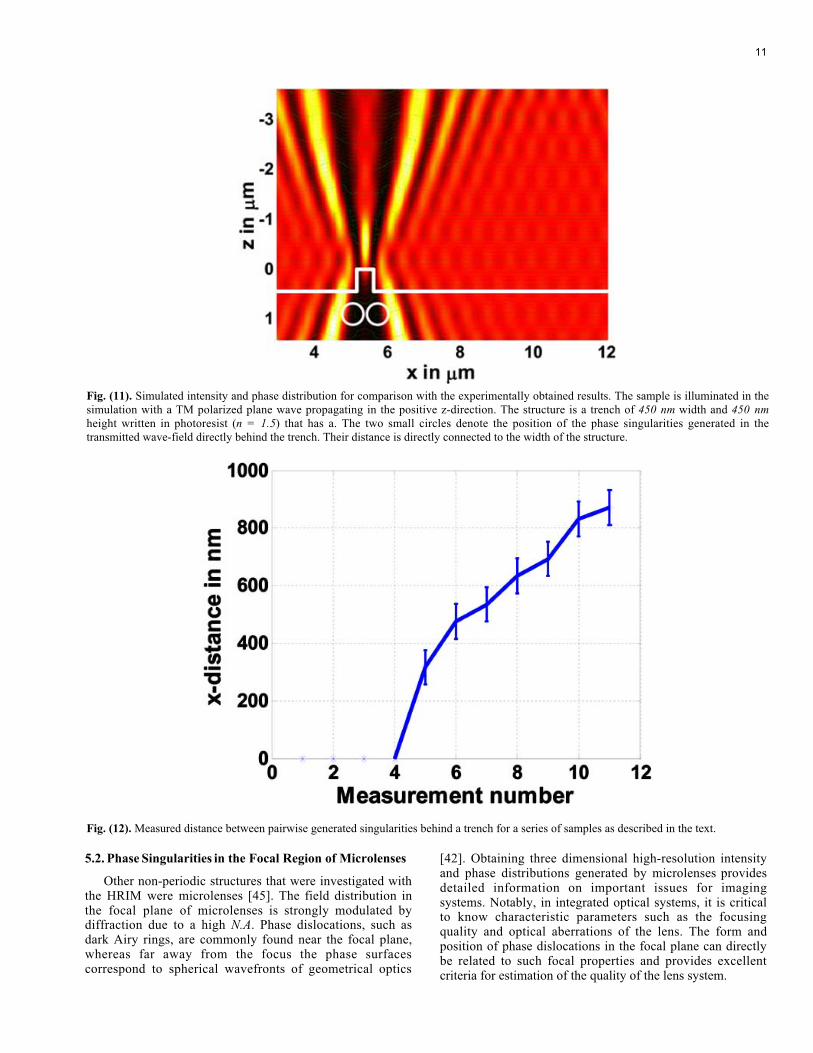
generated behind a trench in photoresist with a width andheight of approximately 450 nm. The illuminating wavepropagating in the positive z-direction was TM-polarizedwith a wavelength of λ = 488 nm. Results of the simulationof the experimental situation are shown in Fig. (11). Againexcellent agreement between theory and experiment isfound. The two small circles denote as a guide to the eye theposition of the singularity pair whose separation can bedirectly related to the width of the trench. In the simulation,the surface of the structure is likewise shown, but the fieldinside the structure and in the region with z < 0 is not thetrue one, but only the back propagated transmitted field. Thereflected field is not accessible with this set-up. Interesting tonote that the generation of singularities in this backpropagated field is at approximately z = -1 µm in thesimulation. The different z-range in simulation andexperiment is because it is not possible to define an absoluteplane of reference in the z-scan with respect to the surface ofthe sample. The separation between the singularities, whichcan be directly related to the width of the trench, wasevaluated for a series of samples and results are shown inFig. (12). The difference in trench width for two subsequentsamples amounts to between 20 nm and 30 nm and themaximum trench width was 500 nm for sample 12. Thesmallest structure from our samples that could generate aphase singularity had a width of 360 nm (sample 5). Nosingularities were observed from smaller structures. Thiswidth is larger than the rigorously predicted width, which ismainly due to the smaller aperture of the experimentalequipment. With exception of the higher absolute width ofthe structure, necessary for generating a singularity, thequalitative behavior follows the theoretical predictions veryclosely. It can be seen that after a sudden increase in theirdistance shortly after the birth of the dislocation, theirdistance grows nearly linearly with the width of thestructure.
Fig. (10). Measured intensity and phase distribution generated by a trench that has a width of approximately 450 nm.
10
5.2. Phase Singularities in the Focal Region of Microlenses
Other non-periodic structures that were investigated withthe HRIM were microlenses [45]. The field distribution inthe focal plane of microlenses is strongly modulated bydiffraction due to a high N.A. Phase dislocations, such asdark Airy rings, are commonly found near the focal plane,whereas far away from the focus the phase surfacescorrespond to spherical wavefronts of geometrical optics
[42]. Obtaining three dimensional high-resolution intensityand phase distributions generated by microlenses providesdetailed information on important issues for imagingsystems. Notably, in integrated optical systems, it is criticalto know characteristic parameters such as the focusingquality and optical aberrations of the lens. The form andposition of phase dislocations in the focal plane can directlybe related to such focal properties and provides excellentcriteria for estimation of the quality of the lens system.
Fig. (11). Simulated intensity and phase distribution for comparison with the experimentally obtained results. The sample is illuminated in thesimulation with a TM polarized plane wave propagating in the positive z-direction. The structure is a trench of 450 nm width and 450 nmheight written in photoresist (n = 1.5) that has a. The two small circles denote the position of the phase singularities generated in thetransmitted wave-field directly behind the trench. Their distance is directly connected to the width of the structure.
Fig. (12). Measured distance between pairwise generated singularities behind a trench for a series of samples as described in the text.
11
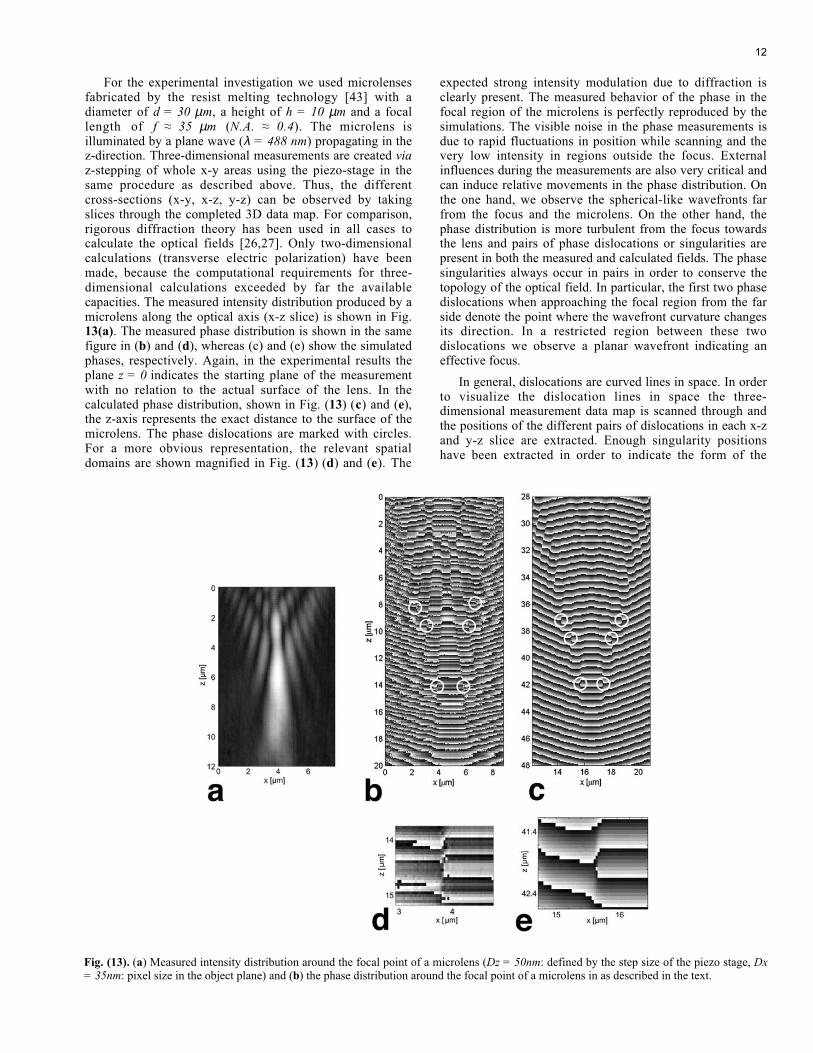
For the experimental investigation we used microlensesfabricated by the resist melting technology [43] with adiameter of d = 30 µm, a height of h = 10 µm and a focallength of f ≈ 35 µm (N.A. ≈ 0.4). The microlens isilluminated by a plane wave (λ = 488 nm) propagating in thez-direction. Three-dimensional measurements are created viaz-stepping of whole x-y areas using the piezo-stage in thesame procedure as described above. Thus, the differentcross-sections (x-y, x-z, y-z) can be observed by takingslices through the completed 3D data map. For comparison,rigorous diffraction theory has been used in all cases tocalculate the optical fields [26,27]. Only two-dimensionalcalculations (transverse electric polarization) have beenmade, because the computational requirements for three-dimensional calculations exceeded by far the availablecapacities. The measured intensity distribution produced by amicrolens along the optical axis (x-z slice) is shown in Fig.13(a). The measured phase distribution is shown in the samefigure in (b) and (d), whereas (c) and (e) show the simulatedphases, respectively. Again, in the experimental results theplane z = 0 indicates the starting plane of the measurementwith no relation to the actual surface of the lens. In thecalculated phase distribution, shown in Fig. (13) (c) and (e),the z-axis represents the exact distance to the surface of themicrolens. The phase dislocations are marked with circles.For a more obvious representation, the relevant spatialdomains are shown magnified in Fig. (13) (d) and (e). The
expected strong intensity modulation due to diffraction isclearly present. The measured behavior of the phase in thefocal region of the microlens is perfectly reproduced by thesimulations. The visible noise in the phase measurements isdue to rapid fluctuations in position while scanning and thevery low intensity in regions outside the focus. Externalinfluences during the measurements are also very critical andcan induce relative movements in the phase distribution. Onthe one hand, we observe the spherical-like wavefronts farfrom the focus and the microlens. On the other hand, thephase distribution is more turbulent from the focus towardsthe lens and pairs of phase dislocations or singularities arepresent in both the measured and calculated fields. The phasesingularities always occur in pairs in order to conserve thetopology of the optical field. In particular, the first two phasedislocations when approaching the focal region from the farside denote the point where the wavefront curvature changesits direction. In a restricted region between these twodislocations we observe a planar wavefront indicating aneffective focus.
In general, dislocations are curved lines in space. In orderto visualize the dislocation lines in space the three-dimensional measurement data map is scanned through andthe positions of the different pairs of dislocations in each x-zand y-z slice are extracted. Enough singularity positionshave been extracted in order to indicate the form of the
Fig. (13). (a) Measured intensity distribution around the focal point of a microlens (Dz = 50nm: defined by the step size of the piezo stage, Dx= 35nm: pixel size in the object plane) and (b) the phase distribution around the focal point of a microlens in as described in the text.
12
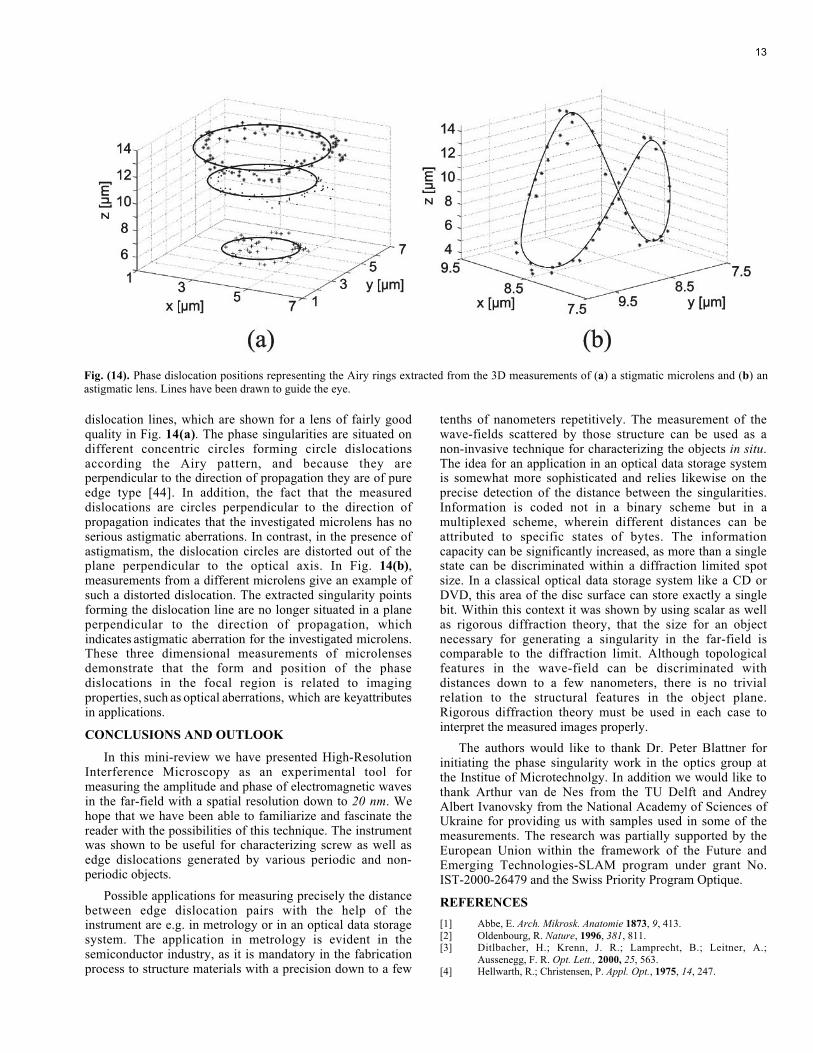
dislocation lines, which are shown for a lens of fairly goodquality in Fig. 14(a). The phase singularities are situated ondifferent concentric circles forming circle dislocationsaccording the Airy pattern, and because they areperpendicular to the direction of propagation they are of pureedge type [44]. In addition, the fact that the measureddislocations are circles perpendicular to the direction ofpropagation indicates that the investigated microlens has noserious astigmatic aberrations. In contrast, in the presence ofastigmatism, the dislocation circles are distorted out of theplane perpendicular to the optical axis. In Fig. 14(b),measurements from a different microlens give an example ofsuch a distorted dislocation. The extracted singularity pointsforming the dislocation line are no longer situated in a planeperpendicular to the direction of propagation, whichindicates astigmatic aberration for the investigated microlens.These three dimensional measurements of microlensesdemonstrate that the form and position of the phasedislocations in the focal region is related to imagingproperties, such as optical aberrations, which are keyattributesin applications.
CONCLUSIONS AND OUTLOOK
In this mini-review we have presented High-ResolutionInterference Microscopy as an experimental tool formeasuring the amplitude and phase of electromagnetic wavesin the far-field with a spatial resolution down to 20 nm. Wehope that we have been able to familiarize and fascinate thereader with the possibilities of this technique. The instrumentwas shown to be useful for characterizing screw as well asedge dislocations generated by various periodic and non-periodic objects.
Possible applications for measuring precisely the distancebetween edge dislocation pairs with the help of theinstrument are e.g. in metrology or in an optical data storagesystem. The application in metrology is evident in thesemiconductor industry, as it is mandatory in the fabricationprocess to structure materials with a precision down to a few
tenths of nanometers repetitively. The measurement of thewave-fields scattered by those structure can be used as anon-invasive technique for characterizing the objects in situ.The idea for an application in an optical data storage systemis somewhat more sophisticated and relies likewise on theprecise detection of the distance between the singularities.Information is coded not in a binary scheme but in amultiplexed scheme, wherein different distances can beattributed to specific states of bytes. The informationcapacity can be significantly increased, as more than a singlestate can be discriminated within a diffraction limited spotsize. In a classical optical data storage system like a CD orDVD, this area of the disc surface can store exactly a singlebit. Within this context it was shown by using scalar as wellas rigorous diffraction theory, that the size for an objectnecessary for generating a singularity in the far-field iscomparable to the diffraction limit. Although topologicalfeatures in the wave-field can be discriminated withdistances down to a few nanometers, there is no trivialrelation to the structural features in the object plane.Rigorous diffraction theory must be used in each case tointerpret the measured images properly.
The authors would like to thank Dr. Peter Blattner forinitiating the phase singularity work in the optics group atthe Institue of Microtechnolgy. In addition we would like tothank Arthur van de Nes from the TU Delft and AndreyAlbert Ivanovsky from the National Academy of Sciences ofUkraine for providing us with samples used in some of themeasurements. The research was partially supported by theEuropean Union within the framework of the Future andEmerging Technologies-SLAM program under grant No.IST-2000-26479 and the Swiss Priority Program Optique.
REFERENCES
[1] Abbe, E. Arch. Mikrosk. Anatomie 1873, 9, 413.[2] Oldenbourg, R. Nature, 1996, 381, 811.[3] Ditlbacher, H.; Krenn, J. R.; Lamprecht, B.; Leitner, A.;
Aussenegg, F. R. Opt. Lett., 2000, 25, 563.[4] Hellwarth, R.; Christensen, P. Appl. Opt., 1975, 14, 247.
Fig. (14). Phase dislocation positions representing the Airy rings extracted from the 3D measurements of (a) a stigmatic microlens and (b) anastigmatic lens. Lines have been drawn to guide the eye.
13
[5] Pohl, D. W.; Courjon, D. Near Field Optics, Kluwer: Dordrecht,1993.
[6] Kawata, S.; Inouye, Y.; Sugiura, T. Jpn. J. Appl. Phys., 1994, 33,L1725.
[7] Zernicke, F. Science, 1995, 121, 345.[8] Nye, J. F.; Berry, M. V. Proc. Roy. Soc. Lond. A, 1979, 336, 165.[9] Basisty, I.V.; Bazhenov, V.Yu.; Soskin, M.S.; Vasnetsov, M.V.
Opt. Commun., 1996, 103, 422.[10] Nye, J. F. J. Opt. Soc. Am. A,, 1998, 15, 1132.[11] Siegman, A. E. Lasers, University Science Books, Mill Valey,
California, 1986.[12] Baranova, N. B.; Mamaev, A. V.; Polopetsky, N. F.; Shkunov, V.
V.; Zel’dovich, B. Y. JETP Lett., 1981, 33, 195.[13] Freund, I.; Shvartsman, N.; Freilikher, V. Opt. Commun., 1993,
101, 247.[14] Harris, M.; Hill, C. A.; Vaughan, J. M. Opt. Commun., 1994, 106,
161.[15] Beijersbergen, M. W.; Coerwinkel, R. P. C. ; Kristensen, M.;
Woerdman, J. P. Opt. Commun., 1992, 112, 321.[16] Machavariani, G.; Davidson, N. ; Hasman, E.; Blit, S.; Ishaaya, A.
A.; Friesem, A. A. Opt. Commun., 2002, 209, 265.[17] Petrov, D. V.; Canal, F.; Torner, L. Opt. Commun., 1997, 143, 265.[18] Rozas, D.; Sacks, Z. S.; Swartzlander, Jr., G. A. Phys. Rev. Lett.,
1997, 79, 3399.[19] Heckenberg, N. R.; McDuff, R. ; Smith, C. P.; White, A. G. Opt.
Lett., 1992, 17, 221.[20] Grier, D. G. Nature, 2003, 424, 810.[21] Kuga, T. ; Torii, Y.; Shiokawa, N.; Hirano. T. Phys. Rev. Lett.,
1997, 78, 4713.[22] Tychinsky, V.P. Opt. Commun., 1989, 74, 41 .[23] Tychinsky, V. P. ; Masalov, I. N.; Pankov, V. P.; Ublinsky, D. V.
Opt. Commun., 1989, 74, 37 .[24] Tychinsky V. P.; Velzel, C. H. F. In Current Trends in Optics,
Dainty, J. C., Ed.; Academic Press London, 1994, pp. 255–268.[25] Rockstuhl, C.; Salt, M.; Herzig, H. P. Opt. Commun., 2004, 235,
11.[26] Turunen, J. in Micro-Optics: Elements, Systems and Applications,
Herzig, H. P., Ed.; Taylor & Francis, 1997.
[27] Moharam, M.G.; Gaylord, T.K. J. Opt. Soc. Am., 1981, 72, 1385.[28] Blattner, P.; Herzig, H.P. J. Mod. Opt., 1998, 45, 1395 .[29] Totzeck, M.; Krumbügel, M.A. Opt. Commun., 1994, 112, 189.[30] Krumbügel, M.A.; Totzeck, M. Opt. Commun., 1993, 98, 47.[31] Eberler, M.; Dorn, R.; Münzer, B.; Quabis, S.; Leuchs, G. In
Proceedings of the World Conference on Systematics, Cyberneticsand Informatics, Orlando, 2000.
[32] Schouten, H.F.; Gbur, G.; Visser, T.D.; Lenstra, D.; Blok, H. Opt.Express, 2003, 11, 371.
[33] Rockstuhl, C.; Salt, M.; Herzig, H. P. J. Opt. A: Pure Appl. Opt.,2004, 6, S271.
[34] Schwider, J.; Burow, R.; Elssner, K. E.; Grzanna, J.; Spolaczyk, R.;Merkel, K. Appl. Opt., 1983, 22, 3421.
[35] Dändliker, R.; Blattner, P.; Rockstuhl, C.; Herzig, H. P. In Singularoptics (optical vortices): fundamentals and applications, SPIEProc., 2000, 4403, pp. 257–261.
[36] Rockstuhl, C.; Ivanovskyy, A. A.; Soskin, M. S.; Salt, M.; Herzig,H. P.; Dändliker, R. Opt. Commun., 2004, 242, 163.
[37] Basistiy, I.V.; Soskin, M.S.; Vasnetsov, M.V. Opt. Commun., 1996,119, 604.
[38] Ivanovskyy, A. A.; Basistiy, I. V.; Soskin, M. S. Semiconduct Phys.Quantum Electron. J., 2003, 6, 249.
[39] Angelsky, O. V.; Mokhun, I. I.; Mokhun, A. I.; Soskin, M. S. Phys.Rev. B, 2002, 65, 036602.
[40] Blattner, P. Light fields emerging from periodic opticalmicrostructures, PhD dissertation, University Neuchâtel,Switzerland 1998.
[41] Totzeck, M.; Jacobsen, H.; Tiziani, H. J. SPIE Proc., 1999, 3897,pp. 424–435.
[42] Born, M. and Wolf E., Principles of Optics, Cambridge UniversityPress, Cambridge, UK, 1999.
[43] Hutley M. C. In Micro-Optics: Elements, Systems andApplications, Herzig, H. P., Ed.; Taylor & Francis, 1997.
[44] Nye, J. F. Natural Focusing and Fine Structure of Light, Causticsand Wave Dislocations, Bristol: Institute of Physics Publishing,1999.
[45] Dändliker, R., Märki, I., Salt, M., Nsci, A., J. Opt. A.: Pure Appl.Opt., 2004, 6, pp. 5189-5196.
14