Atomic and molecular adsorption on transition-metal carbide (111) surfaces from density-functional...
19
arXiv:1005.0593v1 [cond-mat.mtrl-sci] 4 May 2010 Atomic and molecular adsorption on transition-metal carbide (111) surfaces from density-functional theory: A trend study of surface electronic factors A. Vojvodic, 1 C. Ruberto, 1 and B. I. Lundqvist 1, 2 1 Materials and Surface Theory Group, Department of Applied Physics, Chalmers University of Technology, SE-412 96 G¨oteborg, Sweden * 2 Center for Atomic-scale Materials Design, Department of Physics, Technical University of Denmark, DK-2800 Kongens Lyngby, Denmark This study explores atomic and molecular adsorption on a number of early transition-metal car- bides (TMC’s) by means of density-functional theory calculations. The investigated substrates are the TM-terminated TMC(111) surfaces, of interest because of the presence of different types of sur- face resonances (SR’s) on them and because of their technological importance in growth processes. Also, TM compounds have shown potential in catalysis applications. Trend studies are conducted with respect to both period and group in the periodic table, choosing the substrates ScC, TiC, VC, ZrC, NbC, δ-MoC, TaC, and WC (in NaCl structure) and the adsorbates H, B, C, N, O, F, NH, NH2, and NH3. Trends in adsorption strength are explained in terms of surface electronic factors, by correlating the calculated adsorption energy values with the calculated surface electronic structures. The results are rationalized with use of a concerted-coupling model (CCM), which has previously been applied succesfully to the description of adsorption on TiC(111) and TiN(111) sur- faces [Solid State Commun. 141, 48 (2007)]. First, the clean TMC(111) surfaces are characterized by calculating surface energies, surface relaxations, Bader charges, and surface-localized densities of states (DOS’s). Detailed comparisons between surface and bulk DOS’s reveal the existence of transition-metal localized SR’s (TMSR’s) in the pseudogap and of several C-localized SR’s (CSR’s) in the upper valence band on all considered TMC(111) surfaces. The spatial extent and the dangling bond nature of these SR’s are supported by real-space analyses of the calculated Kohn-Sham wave functions. Then, atomic and molecular adsorption energies, geometries, and charge transfers are presented. An analysis of the adsorbate-induced changes in surface DOS’s reveals a presence of both adsorbate–TMSR and adsorbate–CSR’s interactions, of varying strengths depending on the surface and the adsorbate. These variations are correlated to the variations in adsorption energies. The results are used to generalize the content and applications of the previously proposed CCM to this larger class of substrates and adsorbates. Implications for other classes of materials, for catalysis, and for other surface processes are discussed. PACS numbers: 68.43.Bc, 73.20.At, 73.20.-r I. INTRODUCTION Many studies of TMX’s (TM = transition metal and X = C or N) are motivated by a curiosity on the properties of TMX’s, such as their mixture of covalency, ionicity, and metallicity, and by a suggested importance for het- erogeneous catalysis. The attention to TMX’s as poten- tial catalysts started with an observation by Levy and Boudart that the TMC’s show a Pt-like behavior in sev- eral catalytic reactions. 1 According to more recent inves- tigations, “early TMC’s and TMN’s often demonstrate catalytic advantages over their parent metals in activ- ity, selectivity and resistance to poisoning” and “for sev- eral reactions, such as hydrogenation reactions, catalytic activities of TMC’s and TMN’s are approaching or sur- passing those of group VIII noble metals”. 2 The TMX surfaces are also technologically important as substrate materials in growth processes, e.g., in wear-resistant mul- tilayer coatings on industrial cutting tools 3,4 and for growth of carbidic nanostructures. 5,6 For catalytic applications, the stable or ideal surfaces are not necessarily the most suitable ones. Often the best site for a reaction is found on a stepped or in some way non-perfect surface, e.g., at kinks or around de- fects, where less stable faces of the material are exposed. Such sites often host surface states or surface resonances (SR’s). This calls for studies on surfaces that present such surface states or resonances. In previous studies, the reactivities of the TiC(111) and TiN(111) surfaces are attributed to the presence of SR’s of both Ti and C/N character. 7–10 Calculated trends in atomic adsorption strength are explained with a concerted-coupling model (CCM), in which the atomic frontier orbitals interact with both types of SR’s. More recently, we have indentified a descriptor, defined as the mean energy of the TM-derived SR (TMSR), for atomic and molecular adsorption and for activation- energy barriers. 11 Hence, the existence of several linear relations between the atomic and molecular adsorption energies, “scaling relation”, have been shown. 11 Such re- lations are of importance in the design of novel types of catalysts. 12–15 This paper is devoted to a deeper and more generalized understanding of the chemisorption on the TMC(111) surfaces, thus also laying the ground for the above men- tioned descriptor. We extend the work done in our pre- vious study of the atomic adsorption on TiC(111) and TiN(111) and use density-functional theory (DFT) to in-
-
Upload
independent -
Category
Documents
-
view
1 -
download
0
Transcript of Atomic and molecular adsorption on transition-metal carbide (111) surfaces from density-functional...
arX
iv:1
005.
0593
v1 [
cond
-mat
.mtr
l-sc
i] 4
May
201
0
Atomic and molecular adsorption on transition-metal carbide (111) surfaces fromdensity-functional theory: A trend study of surface electronic factors
A. Vojvodic,1 C. Ruberto,1 and B. I. Lundqvist1, 2
1Materials and Surface Theory Group, Department of Applied Physics,
Chalmers University of Technology, SE-412 96 Goteborg, Sweden∗
2Center for Atomic-scale Materials Design, Department of Physics,
Technical University of Denmark, DK-2800 Kongens Lyngby, Denmark
This study explores atomic and molecular adsorption on a number of early transition-metal car-bides (TMC’s) by means of density-functional theory calculations. The investigated substrates arethe TM-terminated TMC(111) surfaces, of interest because of the presence of different types of sur-face resonances (SR’s) on them and because of their technological importance in growth processes.Also, TM compounds have shown potential in catalysis applications. Trend studies are conductedwith respect to both period and group in the periodic table, choosing the substrates ScC, TiC,VC, ZrC, NbC, δ-MoC, TaC, and WC (in NaCl structure) and the adsorbates H, B, C, N, O, F,NH, NH2, and NH3. Trends in adsorption strength are explained in terms of surface electronicfactors, by correlating the calculated adsorption energy values with the calculated surface electronicstructures. The results are rationalized with use of a concerted-coupling model (CCM), which haspreviously been applied succesfully to the description of adsorption on TiC(111) and TiN(111) sur-faces [Solid State Commun. 141, 48 (2007)]. First, the clean TMC(111) surfaces are characterizedby calculating surface energies, surface relaxations, Bader charges, and surface-localized densitiesof states (DOS’s). Detailed comparisons between surface and bulk DOS’s reveal the existence oftransition-metal localized SR’s (TMSR’s) in the pseudogap and of several C-localized SR’s (CSR’s)in the upper valence band on all considered TMC(111) surfaces. The spatial extent and the danglingbond nature of these SR’s are supported by real-space analyses of the calculated Kohn-Sham wavefunctions. Then, atomic and molecular adsorption energies, geometries, and charge transfers arepresented. An analysis of the adsorbate-induced changes in surface DOS’s reveals a presence of bothadsorbate–TMSR and adsorbate–CSR’s interactions, of varying strengths depending on the surfaceand the adsorbate. These variations are correlated to the variations in adsorption energies. Theresults are used to generalize the content and applications of the previously proposed CCM to thislarger class of substrates and adsorbates. Implications for other classes of materials, for catalysis,and for other surface processes are discussed.
PACS numbers: 68.43.Bc, 73.20.At, 73.20.-r
I. INTRODUCTION
Many studies of TMX’s (TM = transition metal and X= C or N) are motivated by a curiosity on the propertiesof TMX’s, such as their mixture of covalency, ionicity,and metallicity, and by a suggested importance for het-erogeneous catalysis. The attention to TMX’s as poten-tial catalysts started with an observation by Levy andBoudart that the TMC’s show a Pt-like behavior in sev-eral catalytic reactions.1 According to more recent inves-tigations, “early TMC’s and TMN’s often demonstratecatalytic advantages over their parent metals in activ-ity, selectivity and resistance to poisoning” and “for sev-eral reactions, such as hydrogenation reactions, catalyticactivities of TMC’s and TMN’s are approaching or sur-passing those of group VIII noble metals”.2 The TMXsurfaces are also technologically important as substratematerials in growth processes, e.g., in wear-resistant mul-tilayer coatings on industrial cutting tools3,4 and forgrowth of carbidic nanostructures.5,6
For catalytic applications, the stable or ideal surfacesare not necessarily the most suitable ones. Often thebest site for a reaction is found on a stepped or in someway non-perfect surface, e.g., at kinks or around de-
fects, where less stable faces of the material are exposed.Such sites often host surface states or surface resonances(SR’s). This calls for studies on surfaces that presentsuch surface states or resonances.
In previous studies, the reactivities of the TiC(111)and TiN(111) surfaces are attributed to the presenceof SR’s of both Ti and C/N character.7–10 Calculatedtrends in atomic adsorption strength are explained witha concerted-coupling model (CCM), in which the atomicfrontier orbitals interact with both types of SR’s. Morerecently, we have indentified a descriptor, defined asthe mean energy of the TM-derived SR (TMSR), foratomic and molecular adsorption and for activation-energy barriers.11 Hence, the existence of several linearrelations between the atomic and molecular adsorptionenergies, “scaling relation”, have been shown.11 Such re-lations are of importance in the design of novel types ofcatalysts.12–15
This paper is devoted to a deeper and more generalizedunderstanding of the chemisorption on the TMC(111)surfaces, thus also laying the ground for the above men-tioned descriptor. We extend the work done in our pre-vious study of the atomic adsorption on TiC(111) andTiN(111) and use density-functional theory (DFT) to in-

2
vestigate whether the CCM is applicable to other TMC’s.Our method consists of a detailed study of the trends inreactivity along periods and groups of the substrate par-ent metal and of the adsorbate, correlated with a carefulmapping and analysis of the underlying details of thechanges in surface electronic structure upon adsorption.
The substrates chosen in our study are the TMC’sformed with the parent metals Sc, Ti, V, Zr, Nb, Mo,Ta, and W in NaCl structure (see Fig. 1). As adsorbateswe choose atomic H, B, C, N, O, and F as well as themolecules NH, NH2 and NH3. These particular choicesof TMC’s and adsorbates allow us to capture changesin adsorption properties along both periods and groupsin the periodic table. All studied TMC’s adopt a NaClstructure either in stable or in metastable phase.
4d
3d
IIIb IVb Vbgrp
per
5d5d5d5d
VIb
ScC VC
ZrC NbC
TaC
MoC
WC
TiC
FIG. 1: The early transition-metal carbides under investiga-tion.
Experiments show that after heating and ion or elec-tron bombardment under low-temperature and low-pressure conditions the (111) surfaces of TiC,16 VC,17
ZrC,18 NbC,19,20 and TaC21,22 are unreconstructed andTM terminated. Therefore, our study deals with un-reconstructed and TM-terminated (111) TMC surfaces.Surface electronic structure characterizations with angle-resolved photoemission studies (ARPES) show the pres-ence of surface states on the (111) surfaces of TiC,23–25
ZrC,26 NbC,27 and TaC.28 Also, experiments showthat both H2 and O2 dissociate on TiC(111),24,29–32
ZrC(111),33–35 and NbC(111).36–39 Despite this largenumber of experimental studies, theoretical investiga-tions on TMC(111) surfaces are scarce.40–43
This paper presents our results in the following or-der. First, a trend study of the clean TM-terminatedTMC(111) surfaces is presented in Section II. In par-ticular we address the properties of the surface elec-tronic structures that are relevant for the adsorptionmechanisms. Then, in Section III the adsorption-energytrends are presented together with the trends in theadorption-induced changes in surface electronic struc-ture. The different trends in adsorption-energy andelectronic-structure changes are analyzed and discussedin Section V, thus connecting our results to the previ-ously proposed CCM. The paper is concluded by Sec-tion VI, which summarizes the main conclusions of ourinvestigation and makes some outlooks to possible rami-fications and further investigations.
II. TRENDS IN SURFACE PROPERTIES
In this Section the computational details and resultsfrom our DFT calculations on the clean TM-terminatedTMC(111) surfaces are presented. First, the stability ofthe (111) surfaces is considered by comparing the cleav-age energies of these surfaces with the corresponding re-sults for the (100) surfaces. Then, the relaxed surfacestructures are presented and compared with existing re-sults. This is followed by a charge transfer analysis and adetailed analysis of both the energy- and space-resolvedsurface densities of states (DOS’s). Particular empha-sis is put on the presence and character of SR’s on theTMC(111) surfaces. Throughout the presentation, anal-yses of the trends with respect to the TM component ofthe studied TMC’s are made.
A. Computational details
The surface calculations presented in this paperare performed within the DFT formalism using theplane-wave pseudopotential code Dacapo.44 The ion-electron interaction is treated with Vanderbilt ultra-soft pseudopotentials.45 The exchange-correlation energyis included by the generalized gradient approximation(GGA) using the PW91 functional.46 We utilize a slabgeometry, with slabs of 4 to 8 bilayers (a bilayer being aunit of one TM layer and one C layer), a vacuum regionthickness corresponding to 5 bilayers, that is, at least10.8 A, and periodic boundary conditions. Each atomiclayer is composed of one atom in a (1×1) geometry. Theatoms in the three (four) outermost atomic layers on theTM-terminated side of a 4 (5 − 8) bilayer thick slab areallowed to relax until the sum of the remaining forces onall relaxed atoms is less than 0.05 eV/A, while the re-maining atomic layers are fixed at the bulk geometry. AMonkhorst-Pack sampling47 of 8× 8× 1 special k-pointsand a plane-wave energy cutoff of 400 eV are used. Theslab used to model the (111) surface is asymmetric, whichgives rise to a discontinuity in the electrostatic potentialat the cell boundary. This is corrected for by using thescheme in Ref. 48.
To characterize the surfaces we utilize several elec-tronic structure tools. A Bader analysis is used to calcu-late the charge localization around individual atoms.49,50
Total and local, that is, atom-projected, DOS’s for thesurface bilayer are obtained by projecting the Kohn-Sham wave functions onto individual atomic orbitals andplotted as a function of energy (relative to the Fermi levelEF ). To identify the surface specific properties that ariseupon creation of the surface, the surface DOS’s are com-pared to the bulk DOS’s by studying the differences be-tween the two quantities. Information about the spatiallocalization of the surface-localized states is provided byanalyzing the space-resolved surface DOS, that is, theKohn-Sham wave functions.
3
B. Cleavage energies
The cleavage energy Ecleav, that is, the energy neededto create two surfaces upon cleavage of a bulk structurealong a specific crystallographic plane, is calculated as
Ecleav = Eslab(n)− nEbulk, (1)
where Eslab(n) is the total energy of a slab with n TMCbilayers that exposes the two surfaces under investigationand
Ebulk = Eslab(n)− Eslab(n− 1) (2)
is the bulk energy of one TMC bilayer, if n is sufficientlylarge. Thus, the cleavage energy corresponds to the sumof the surface energies of the two surfaces obtained uponcleavage. In the case of calculations on stoichiometricTMC(111) slabs, the cleavage energy is equal to the sumof the surface energies of the TM-terminated surface andof the C-terminated surface.Our calculated Ecleav values for the TMC(111) sur-
faces, after relaxation of only the TM-terminated side ofthe slabs, are given in Table I. Along a period Ecleav
shows a maximum for group IV, thus showing the samevariations as the ones found for the bulk cohesive energiesin our previous study.51 Down a group, the variations inEcleav are small but discernible and do not show any ap-parent correspondence to the bulk cohesive energies ofRef. 51.According to the calculated Ecleav values, TiC(111) is
the surface that requires the most energy to create amongthe considered TMC surfaces. Nevertheless, this surfaceis routinely grown by chemical-vapor deposition (CVD)under high temperatures as wear-resistant coating on in-dustrial cutting tools.3,4 The calculated Ecleav value forthe TiC(111) surface agrees well with those of previousDFT calculations.7,52
Compared to the TMC(100) surfaces, the TMC(111)surfaces are found to have a higher Ecleav value (see Ta-ble I) and are thus less stable. Also, the variations inEcleav are larger for TMC(111) than for TMC(100) sur-faces. Both these properties can be attributed to thepolar nature of the (111) surface.54
C. Surface geometry
The calculated relaxations of the four topmost layersof the TMC(111) surfaces are given in Table I. A pro-nounced contraction (10–30%) of the first interlayer spac-ing is found on all the surfaces. At the same time, thesecond interlayer spacing increases compared to the bulkseparation. Further down into the slab the relaxationsbecome smaller and the structure converges to the bulkstructure after three bilayers.Most of the TMC(111) surfaces exhibit an alter-
nating positive-negative relaxation similar to the one
found in metals.55 Compared to the close-packed par-ent metal surfaces, where the outer-layer relaxations areonly a few percents of the corresponding bulk interlayerspacings,55,56 the relaxations of the TMC(111) surfacesare larger and comparable to other ionic polar surfaces.57
This indicates that the bonding character in TMC’s hasa significant ionic contribution, as discussed in Ref. 51.The relaxation of the (111) surfaces is hence quite dif-ferent from the smaller rumpled relaxation found on thenon-polar (100) surfaces.The percentual relaxations of the (111) surfaces, rela-
tive to the bulk interlayer spacings, decrease down eachgroup. Along the periods, the smallest percentual relax-ation is found for group IV in period 3d and group V inperiod 4d. The larger percentual relaxations of δ-MoCand WC can be attributed to the NaCl structure beinga metastable phase for these compounds. The largeststructural changes are found on the ScC surface. Thevariations in percentual relaxations are directly corre-lated to the cohesive energies:51 a small cohesive energygives a large relaxation.For the contraction of the first interlayer distance there
are some experimental data, which agree qualitativelywith our calculated values and in most cases even quan-titatively, as shown in Table I. For TiC(111), tight-binding40 and DFT42 calculations agree well with ourvalues. Several of our results are also in qualitative agree-ment with the theoretical ones in Ref. 43. A deviationis found, however, for the NbC(111) surface, where ex-perimental studies show a contraction of both the firstand the second interlayer distance, by 15.5% and 4%,respectively.20 The first observation agrees with our cal-culated value but the second one differs qualitativelyfrom the contraction seen in our and other first-principlesstudies.41,42
D. Bader charge transfer
In the bulk TMC systems there is a charge trans-fer from the TM to the C atoms.51 Table II shows ourcalculated Bader charge values for the TM-terminatedTMC(111) surfaces. Both the values relative to the freeatoms (in units of electronic charge |e|) and the valuesrelative to the bulk values (in percentages) are given.Compared to the bulk, an accumulation of charge oc-
curs on the first surface bilayer, mainly on the first TMatomic layer but also in several cases on the topmostC atomic layer. An exception is ScC(111), where theC layer gains more electrons than the Sc layer. For allthe investigated TMC’s there is a total of 40–50% re-duction in the surface bilayer ionicity compared to thecorresponding bulk ionicity.51 For the NbC(111) surfaceour ionicity value for the surface Nb atoms (+0.86e) isin good agreement with the calculated one of +0.90e byZhang et al.41
To the right along each period (except for δ-MoC),the charge accumulation on the first TM layer atoms in-

4
TABLE I: Relaxed surface energetics and geometry of the considered TMC’s: Calculated cleavage energies Ecleav, in J/m2, forthe TM-terminated (111) and for the (100) surfaces; Perpendicular equilibrium distances dij , in absolute values (A) and relativeto the bulk values (in parentheses), between atomic layers at the TM-terminated (111) surfaces (index 1: topmost surface layer;index 2: second surface layer, etc.). The bulk interlayer distances ∆ and the available experimental surface interlayer distancesdexp12 are also given. The calculated results are extracted from the 8-bilayer slabs and differ by less than 1% from the ones from
the 4-bilayer slabs.
Period Group Surface E111cleav E100
cleav d12 d23 d34 d45 ∆ dexp12
III ScC 6.06 − 0.967 (−28.5%) 1.558 (15.2%) 1.303 (−3.6%) 1.375 (1.7%) 1.352 −
3d IV TiC 11.29 3.29a 1.019 (−18.5%) 1.394 (11.5%) 1.196 (−4.4%) 1.278 (2.3%) 1.251 0.87 (−30%)b
V VC 9.14 3.21a 0.961 (−19.8%) 1.293 (7.8%) 1.176 (−2.0%) 1.204 (0.3%) 1.202 1.09 (−10%)c
IV ZrC 10.09 3.10a 1.117 (−17.8%) 1.513 (11.5%) 1.299 (−4.3%) 1.378 (1.5%) 1.357 −
4d V NbC 8.92 2.96a 1.094 (−15.6%) 1.355 (4.5%) 1.305 (0.6%) 1.323 (2.0%) 1.297 1.09 (−15.5%)d
VI δ-MoC 5.87 1.86a 0.998 (−22.4%) 1.378 (7.2)% 1.256 (−2.2%) 1.376 (7.1%) 1.285 −
V TaC 9.24 3.06a 1.137 (−12.1%) 1.319 (2.0%) 1.318 (1.9%) 1.321 (2.2%) 1.293 1.14 (−12%)e
5d VI WC 6.14 − 1.030 (−19.6%) 1.319 (4.1%) 1.254 (−1.1%) 1.354 (6.8%) 1.268 −
aThe cleavage energies for the (100) surfaces are adapted fromRef. 53 as Ecleav = 2Esurf, since a stoichiometric (100) surface slabhas two equivalent sides.bRef. 16.cRef. 17.dRef. 20.eRef. 22.
TABLE II: The ionicity, that is, the amount of charge inunits of |e| relative to the neutral atoms, of the atoms in thefirst (TM) and the second (C) surface layers (positive val-ues = donated electrons, negative values = gained electrons)obtained from a Bader analysis. The percentual changes inionicity compared to the bulk51 are also given (positive values= more electrons).
Period Group Surface TM C
rel. atom rel. bulk rel. atom rel. bulk
III ScC +1.27 +18% −1.95 +27%
3d IV TiC +1.08 +28% −1.77 +19%
V VC +0.86 +39% −1.47 +4%
IV ZrC +1.15 +32% −1.93 +14%
4d V NbC +0.86 +48% −1.58 −4%
VI δ-MoC +1.39 +29% −2.29 +16%
V TaC +1.07 +45% −1.93 −1%
5d VI WC +0.86 +46% −1.53 −4%
creases, while it decreases on the C layer atoms. Thesame trends are found down each group.
The calculated charge accumulation at the TMC(111)surfaces has its origin in the polar nature of these sur-face. As mentioned above, the TMC’s are partially ionicmaterials. Therefore there is a macroscopic electric fieldcaused by the non-zero perpendicular dipole moment ofthe TMC bilayer, which makes the (111) surface po-
lar and unstable.54 To counteract this, a surface chargecan be induced, creating a neutralizing electric field. InRef. 58, it is shown that for the (111) surface of a crys-tal with the NaCl structure, this surface charge shouldbe equal to 50% of the bulk ionicity, which is what weobserve.The extra charge in the surface bilayer will affect its
electronic structure and be of importance for its adsorp-tion characteristics, as described below in Sections II Eand III, respectively.
E. Electronic structure
In this Section, we investigate in detail the electronicstructure of the clean TMC(111) surfaces to gain anunderstanding of which characteristics that are surfaceunique and potentially important for the adsorption.
1. Bulk characteristics
For convenience and to facilitate the discussion of theTMC(111) surfaces, we here provide a very short sum-mary, based on Ref. 51, of some bulk characteristics ofthe TMC’s.The bonding in bulk TMC’s has contributions from
iono-covalent TM–C bonds, from TM–TM bonds, andfrom C–C bonds. For all considered TMC’s, the bulkDOS’s and band structures consist of a low-lying valenceband (LVB), dominated by C(2s) states, an upper va-lence band (UVB), with contributions from C(2p) and
5
TM(d) states, and a conduction band (CB) of mainlyTM(d) character. The covalent TM(d)–C(2p) bondingstates are found in the UVB. The main contribution tothe UVB (CB) comes from C(2p) [TM(d)] states, thusindicating the partially ionic character of the bond. TheUVB and the CB, positioned on each side of EF , areconnected by a non vanishing continuum of TM–TMand TM–C states (for ScC also C–C states) states. TheC(2p)–C(2p) bonds are found in the lower part of theUVB.Towards the right along each period, both the UVB
and the CB are shifted down in energy relative to EF andthe UVB becomes less C localized. Down each group, thebands are shifted towards lower energies and the UVBbecomes more C localized.
2. Common surface characteristics
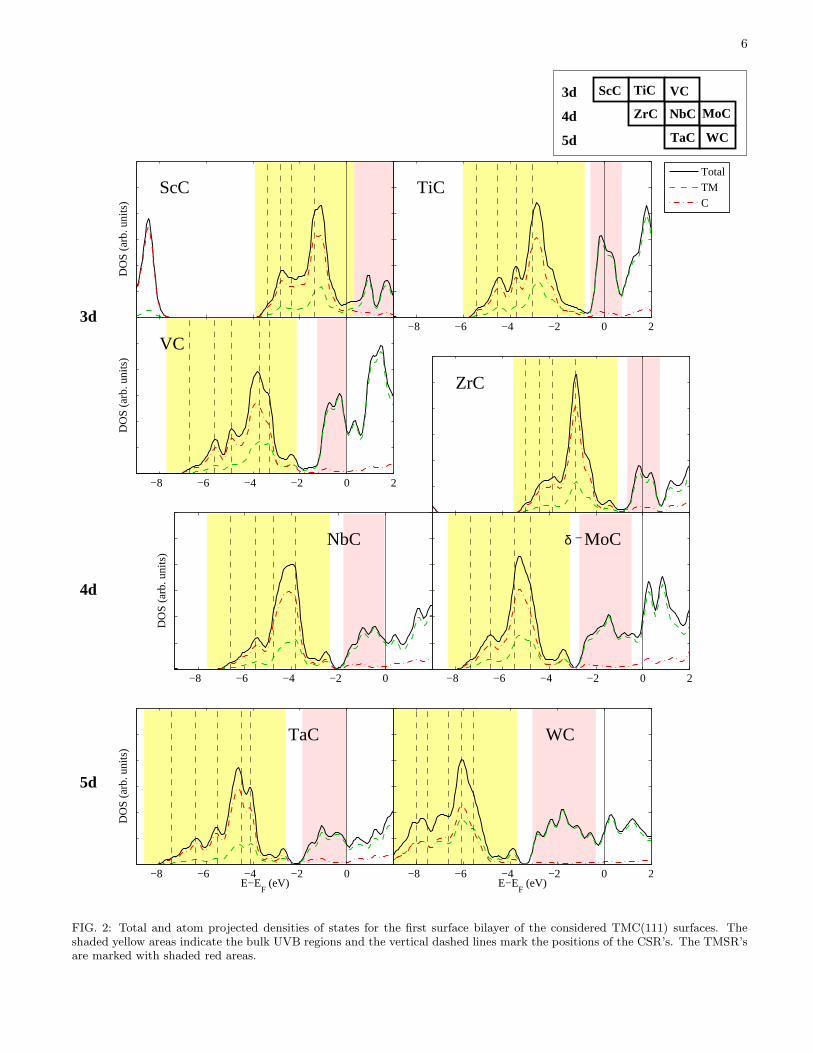
The total and atom projected DOS’s of the first TMCsurface bilayer are presented in Fig. 2. A common fea-ture of the bulk and surface DOS’s is that both have anLVB, a UVB, and a CB. The bulk DOS is recovered inthe third surface bilayer. Despite these similarities, allsurface DOS’s differ sharply from their respective bulkDOS’s. To easier identify the surface properties we studythe difference between the surface DOS (Fig. 2) and thebulk DOS (adapted from our bulk study51), as illustratedfor VC in Fig. 3.For all considered TMC (111) surfaces, surface specific
features similar to those found on TiX(111)7,9,10 can beidentified, in particular: (i) a TM-localized surface reso-nance (TMSR), positioned in the bulk pseudogap at or inthe vicinity of EF (shaded red area in Figs. 2 and 3) and(ii) a more strongly C-localized UVB than in the bulk,with several C-localized surface resonances (CSR’s) inthe lower part of the UVB (shaded yellow area in Figs. 2and 3). The energetical extent of the surface UVB is,however, largely similar to that of the bulk UVB.Both kinds of surface resonances consist of states local-
ized at the surface that overlap energetically with bulkstates, hence the term surface resonance. They can beidentified as positive peaks in the DOS-difference plotsand from real-space analyses of the Kohn-Sham wavefunctions (Fig. 3). These show that the TMSR’s cor-respond to unsaturated TM bonds that extend into thevacuum [see Fig. 3(c)] and point towards the fcc sites[see Fig. 3(d)] where the C atoms would be present if thebulk stacking in the (111) direction had been continued.Hence the TMSR are dangling bonds with a three-foldsymmetry. The C-localized states in the surface bilayerrearrange to form new bonds; however, they do not be-come fully saturated, which results in C dangling bondsstriving in between the first-layer TM atoms towards thevacuum [see Fig. 3(a-b)]. Coupling of these states to thesecond bilayer bulk states gives them the status of surfaceresonances.In addition, several negative peaks can be identified in
the DOS-difference plots (Fig. 3): (i) one region of mixedTM and C character, positioned in the upper part ofthe UVB and just below the TMSR (between the shadedyellow and red regions in Fig. 3); (ii) several peaks ofmixed TM and C character, positioned in between theCSR peaks in the lower part of the UVB; and (iii) oneregion of mainly TM character, positioned in the lowerpart of the CB. These regions of negative peaks corre-spond to strong quenchings of the bulk UVB and CBpeaks, respectively.
3. Trends in surface characteristics
The analysis of the difference between surface and bulkDOS’s shows that as the group number of the surface TMconstituent increases along each period, the position ofthe TMSR is shifted to lower energies relative to EF , asexpected from the filling of the TM d states. The TMSRfilling increases, varying from a non-filled TMSR aboveEF for group III, to a partly filled TMSR at EF for groupIV, to a filled TMSR just below EF for group V, and afilled low lying TMSR for group VI. At the same time, theTMSR amplitude decreases, while the width is constantor increases slightly.
A shift to lower energies and a decreasing amplitudeare observed also for the CSR’s, starting from ScC(111),whose CSR’s lie just below EF . In addition, the ampli-tudes of the negative DOS-difference peaks in the upperpart of the UVB and in the lower part of the CB decrease.For ScC, both the DOS-difference plots and the Kohn-Sham wave functions show more pronounced CSR’s thanon the other TMC’s.
The DOS-difference plots show that as the period num-ber of the surface TM constituent increases down eachgroup, the positions of the TMSR and of the CSR’s aremore or less unaffected, while the TMSR amplitude de-creases and the width increases slightly.
4. Connection with experiments
Several of the TMC(111) surfaces have been studiedby means of angle resolved photoemission spectroscopy(ARPES), revealing surface-localized states, there de-noted “surface states”.23–25,29 We associate these withour TMSR’s, termed “resonances” because of their loca-tion in the pseudogap where the bulk DOS is non vanish-ing. The ARPES study, with an experimental resolutionof 0.2 eV, places the position of these TMSR’s in the Γ-point at −0.2 eV for TiC,23–25,29 at −0.2 eV for ZrC,26 at−0.7 eV for NbC,27 and at −0.7 eV for TaC,28 in perfectagreement with our results.
6
DO
S (a
rb. u
nits
)
ScC
TiC
−8 −6 −4 −2 0 2
TotalTMC
DO
S (
arb.
uni
ts) VC
−8 −6 −4 −2 0 2
ZrC
DO
S (
arb.
uni
ts) NbC
−8 −6 −4 −2 0
MoCδ −
−8 −6 −4 −2 0 2
E−EF (eV)
DO
S (
arb.
uni
ts) TaC
−8 −6 −4 −2 0E−E
F (eV)
WC
−8 −6 −4 −2 0 2
4d
5d
3d
4d
3d
5d
ScC VC
ZrC NbC
TaC
MoC
WC
TiC
FIG. 2: Total and atom projected densities of states for the first surface bilayer of the considered TMC(111) surfaces. Theshaded yellow areas indicate the bulk UVB regions and the vertical dashed lines mark the positions of the CSR’s. The TMSR’sare marked with shaded red areas.
7
E−EF (eV)
DO
S [s
tate
s/(e
V a
tom
)]
−8 −6 −4 −2 0 2−1.5
−1
−0.5
0
0.5
1
1.5TotalVC
a) b) c) d)
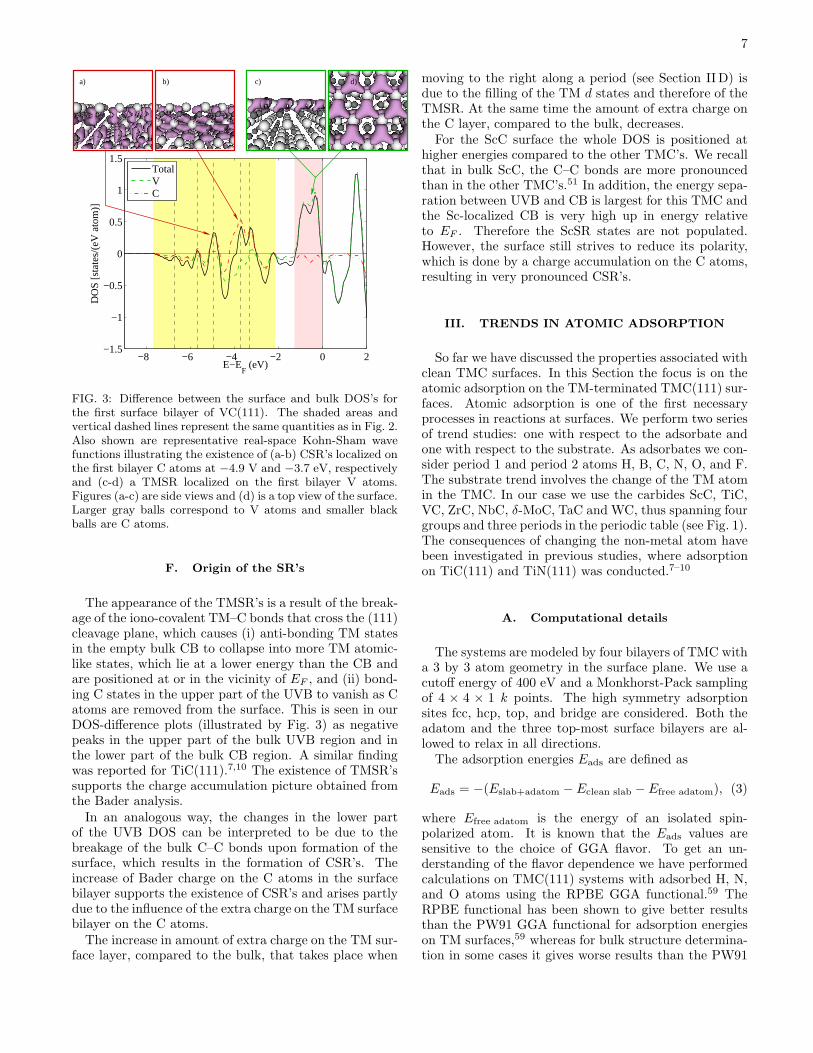
FIG. 3: Difference between the surface and bulk DOS’s forthe first surface bilayer of VC(111). The shaded areas andvertical dashed lines represent the same quantities as in Fig. 2.Also shown are representative real-space Kohn-Sham wavefunctions illustrating the existence of (a-b) CSR’s localized onthe first bilayer C atoms at −4.9 V and −3.7 eV, respectivelyand (c-d) a TMSR localized on the first bilayer V atoms.Figures (a-c) are side views and (d) is a top view of the surface.Larger gray balls correspond to V atoms and smaller blackballs are C atoms.
F. Origin of the SR’s
The appearance of the TMSR’s is a result of the break-age of the iono-covalent TM–C bonds that cross the (111)cleavage plane, which causes (i) anti-bonding TM statesin the empty bulk CB to collapse into more TM atomic-like states, which lie at a lower energy than the CB andare positioned at or in the vicinity of EF , and (ii) bond-ing C states in the upper part of the UVB to vanish as Catoms are removed from the surface. This is seen in ourDOS-difference plots (illustrated by Fig. 3) as negativepeaks in the upper part of the bulk UVB region and inthe lower part of the bulk CB region. A similar findingwas reported for TiC(111).7,10 The existence of TMSR’ssupports the charge accumulation picture obtained fromthe Bader analysis.In an analogous way, the changes in the lower part
of the UVB DOS can be interpreted to be due to thebreakage of the bulk C–C bonds upon formation of thesurface, which results in the formation of CSR’s. Theincrease of Bader charge on the C atoms in the surfacebilayer supports the existence of CSR’s and arises partlydue to the influence of the extra charge on the TM surfacebilayer on the C atoms.The increase in amount of extra charge on the TM sur-
face layer, compared to the bulk, that takes place when
moving to the right along a period (see Section IID) isdue to the filling of the TM d states and therefore of theTMSR. At the same time the amount of extra charge onthe C layer, compared to the bulk, decreases.For the ScC surface the whole DOS is positioned at
higher energies compared to the other TMC’s. We recallthat in bulk ScC, the C–C bonds are more pronouncedthan in the other TMC’s.51 In addition, the energy sepa-ration between UVB and CB is largest for this TMC andthe Sc-localized CB is very high up in energy relativeto EF . Therefore the ScSR states are not populated.However, the surface still strives to reduce its polarity,which is done by a charge accumulation on the C atoms,resulting in very pronounced CSR’s.
III. TRENDS IN ATOMIC ADSORPTION
So far we have discussed the properties associated withclean TMC surfaces. In this Section the focus is on theatomic adsorption on the TM-terminated TMC(111) sur-faces. Atomic adsorption is one of the first necessaryprocesses in reactions at surfaces. We perform two seriesof trend studies: one with respect to the adsorbate andone with respect to the substrate. As adsorbates we con-sider period 1 and period 2 atoms H, B, C, N, O, and F.The substrate trend involves the change of the TM atomin the TMC. In our case we use the carbides ScC, TiC,VC, ZrC, NbC, δ-MoC, TaC and WC, thus spanning fourgroups and three periods in the periodic table (see Fig. 1).The consequences of changing the non-metal atom havebeen investigated in previous studies, where adsorptionon TiC(111) and TiN(111) was conducted.7–10
A. Computational details
The systems are modeled by four bilayers of TMC witha 3 by 3 atom geometry in the surface plane. We use acutoff energy of 400 eV and a Monkhorst-Pack samplingof 4 × 4 × 1 k points. The high symmetry adsorptionsites fcc, hcp, top, and bridge are considered. Both theadatom and the three top-most surface bilayers are al-lowed to relax in all directions.The adsorption energies Eads are defined as
Eads = −(Eslab+adatom − Eclean slab − Efree adatom), (3)
where Efree adatom is the energy of an isolated spin-polarized atom. It is known that the Eads values aresensitive to the choice of GGA flavor. To get an un-derstanding of the flavor dependence we have performedcalculations on TMC(111) systems with adsorbed H, N,and O atoms using the RPBE GGA functional.59 TheRPBE functional has been shown to give better resultsthan the PW91 GGA functional for adsorption energieson TM surfaces,59 whereas for bulk structure determina-tion in some cases it gives worse results than the PW91
8
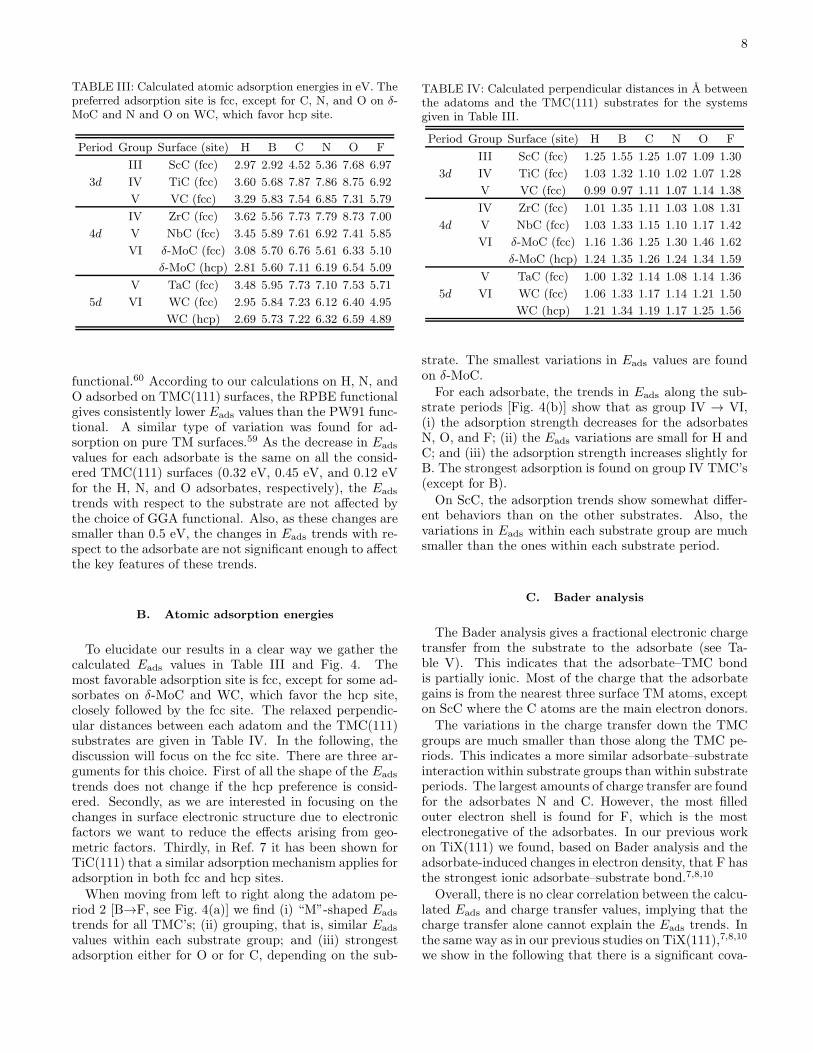
TABLE III: Calculated atomic adsorption energies in eV. Thepreferred adsorption site is fcc, except for C, N, and O on δ-MoC and N and O on WC, which favor hcp site.
Period Group Surface (site) H B C N O F
III ScC (fcc) 2.97 2.92 4.52 5.36 7.68 6.97
3d IV TiC (fcc) 3.60 5.68 7.87 7.86 8.75 6.92
V VC (fcc) 3.29 5.83 7.54 6.85 7.31 5.79
IV ZrC (fcc) 3.62 5.56 7.73 7.79 8.73 7.00
4d V NbC (fcc) 3.45 5.89 7.61 6.92 7.41 5.85
VI δ-MoC (fcc) 3.08 5.70 6.76 5.61 6.33 5.10
δ-MoC (hcp) 2.81 5.60 7.11 6.19 6.54 5.09
V TaC (fcc) 3.48 5.95 7.73 7.10 7.53 5.71
5d VI WC (fcc) 2.95 5.84 7.23 6.12 6.40 4.95
WC (hcp) 2.69 5.73 7.22 6.32 6.59 4.89
functional.60 According to our calculations on H, N, andO adsorbed on TMC(111) surfaces, the RPBE functionalgives consistently lower Eads values than the PW91 func-tional. A similar type of variation was found for ad-sorption on pure TM surfaces.59 As the decrease in Eads
values for each adsorbate is the same on all the consid-ered TMC(111) surfaces (0.32 eV, 0.45 eV, and 0.12 eVfor the H, N, and O adsorbates, respectively), the Eads
trends with respect to the substrate are not affected bythe choice of GGA functional. Also, as these changes aresmaller than 0.5 eV, the changes in Eads trends with re-spect to the adsorbate are not significant enough to affectthe key features of these trends.
B. Atomic adsorption energies
To elucidate our results in a clear way we gather thecalculated Eads values in Table III and Fig. 4. Themost favorable adsorption site is fcc, except for some ad-sorbates on δ-MoC and WC, which favor the hcp site,closely followed by the fcc site. The relaxed perpendic-ular distances between each adatom and the TMC(111)substrates are given in Table IV. In the following, thediscussion will focus on the fcc site. There are three ar-guments for this choice. First of all the shape of the Eads
trends does not change if the hcp preference is consid-ered. Secondly, as we are interested in focusing on thechanges in surface electronic structure due to electronicfactors we want to reduce the effects arising from geo-metric factors. Thirdly, in Ref. 7 it has been shown forTiC(111) that a similar adsorption mechanism applies foradsorption in both fcc and hcp sites.When moving from left to right along the adatom pe-
riod 2 [B→F, see Fig. 4(a)] we find (i) “M”-shaped Eads
trends for all TMC’s; (ii) grouping, that is, similar Eads
values within each substrate group; and (iii) strongestadsorption either for O or for C, depending on the sub-
TABLE IV: Calculated perpendicular distances in A betweenthe adatoms and the TMC(111) substrates for the systemsgiven in Table III.
Period Group Surface (site) H B C N O F
III ScC (fcc) 1.25 1.55 1.25 1.07 1.09 1.30
3d IV TiC (fcc) 1.03 1.32 1.10 1.02 1.07 1.28
V VC (fcc) 0.99 0.97 1.11 1.07 1.14 1.38
IV ZrC (fcc) 1.01 1.35 1.11 1.03 1.08 1.31
4d V NbC (fcc) 1.03 1.33 1.15 1.10 1.17 1.42
VI δ-MoC (fcc) 1.16 1.36 1.25 1.30 1.46 1.62
δ-MoC (hcp) 1.24 1.35 1.26 1.24 1.34 1.59
V TaC (fcc) 1.00 1.32 1.14 1.08 1.14 1.36
5d VI WC (fcc) 1.06 1.33 1.17 1.14 1.21 1.50
WC (hcp) 1.21 1.34 1.19 1.17 1.25 1.56
strate. The smallest variations in Eads values are foundon δ-MoC.
For each adsorbate, the trends in Eads along the sub-strate periods [Fig. 4(b)] show that as group IV → VI,(i) the adsorption strength decreases for the adsorbatesN, O, and F; (ii) the Eads variations are small for H andC; and (iii) the adsorption strength increases slightly forB. The strongest adsorption is found on group IV TMC’s(except for B).
On ScC, the adsorption trends show somewhat differ-ent behaviors than on the other substrates. Also, thevariations in Eads within each substrate group are muchsmaller than the ones within each substrate period.
C. Bader analysis
The Bader analysis gives a fractional electronic chargetransfer from the substrate to the adsorbate (see Ta-ble V). This indicates that the adsorbate–TMC bondis partially ionic. Most of the charge that the adsorbategains is from the nearest three surface TM atoms, excepton ScC where the C atoms are the main electron donors.
The variations in the charge transfer down the TMCgroups are much smaller than those along the TMC pe-riods. This indicates a more similar adsorbate–substrateinteraction within substrate groups than within substrateperiods. The largest amounts of charge transfer are foundfor the adsorbates N and C. However, the most filledouter electron shell is found for F, which is the mostelectronegative of the adsorbates. In our previous workon TiX(111) we found, based on Bader analysis and theadsorbate-induced changes in electron density, that F hasthe strongest ionic adsorbate–substrate bond.7,8,10
Overall, there is no clear correlation between the calcu-lated Eads and charge transfer values, implying that thecharge transfer alone cannot explain the Eads trends. Inthe same way as in our previous studies on TiX(111),7,8,10
we show in the following that there is a significant cova-

9
H B C N O F3
4
5
6
7
8
9
Adsorbate
Ead
s (eV
)
Group III
Group IV
Group V
Group VI
(a)
ScCTiCVCZrCNbCMoCTaCWC
III IV V VI
3
4
5
6
7
8
9
H
B
C
N
O
F
Ead
s (eV
)
Substrate group
(b)
3d4d5d
FIG. 4: Calculated adsorption energies Eads for period 1 and period 2 adatoms in fcc site on the considered TMC(111) surfacesas a function of (a) the adsorbate atom and (b) the group number of the substrate TM constituent.
TABLE V: Calculated Bader charge transfers, in units ofelectron charge |e|, from the TMC(111) surface to the atomicadsorbate for the systems given in Table III.
Period Group Surface (site) H B C N O F
III ScC (fcc) 0.74 1.05 1.45 1.58 1.33 0.84
3d IV TiC (fcc) 0.64 1.09 1.35 1.35 1.17 0.80
V VC (fcc) 0.58 0.76 1.16 1.21 1.09 0.76
IV ZrC (fcc) 0.67 1.19 1.49 1.50 1.25 0.82
4d V NbC (fcc) 0.59 0.92 1.29 1.33 1.18 0.80
VI δ-MoC (fcc) 0.65 1.16 1.55 1.54 1.26 0.82
δ-MoC (hcp) 0.58 1.10 1.51 1.55 1.27 0.82
V TaC (fcc) 0.63 1.04 1.44 1.45 1.25 0.81
5d VI WC (fcc) 0.70 1.58 2.14 1.96 1.50 0.88
WC (hcp) 0.61 1.42 2.10 1.97 1.48 0.85
lent contribution to the adsorbate–TMC(111) bond.
D. Density of states
To learn about, in particular, the covalent parts of theadsorption bond, this Section is devoted to the trends inthe adsorption-induced electronic structure. More pre-cisely, the difference in the surface DOS before and af-ter adsorption (∆DOS), that is, the adsorbate-inducedchanges in DOS are investigated. With this very usefultool we monitor trends with respect to both substrateand adsorbate.
1. Common characteristics in ∆DOS for atomic adsorbates
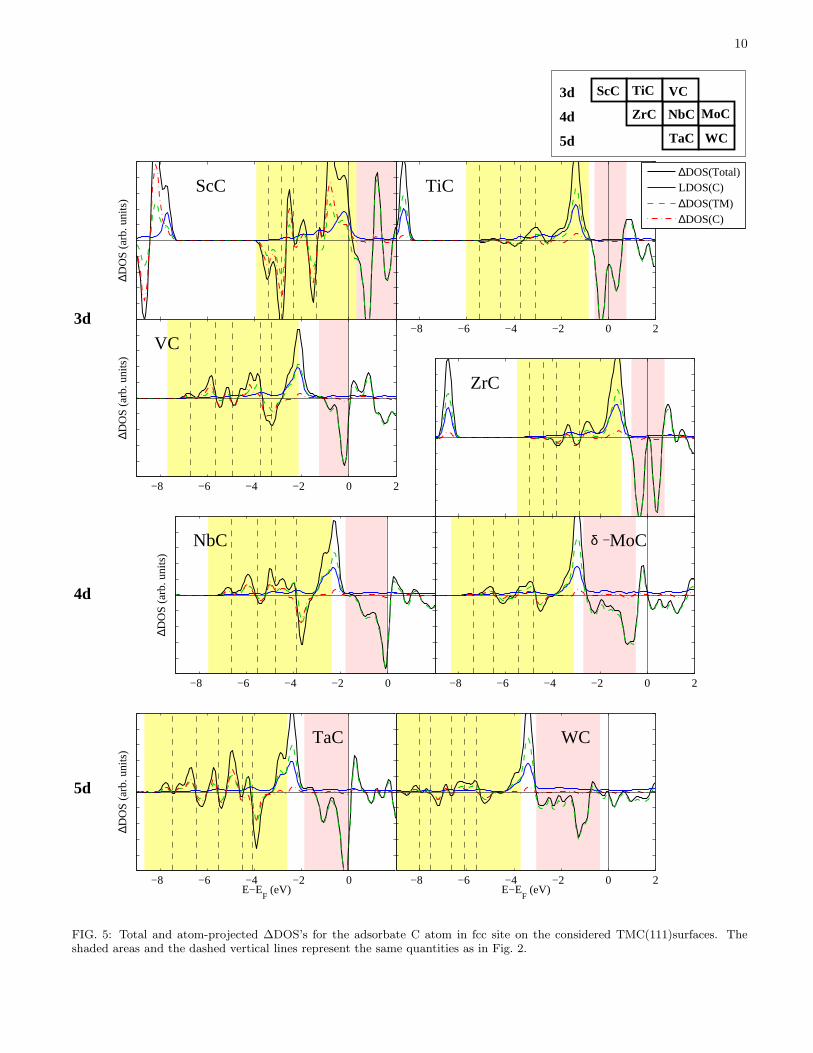
Figures 5 and 6 show the ∆DOS’s for C and O, re-spectively, adsorbed on the considered TMC(111) sur-
faces. Figure 7 shows the ∆DOS’s for the different ad-sorbates on the VC(111) surface. The general form of allthe ∆DOS’s consists of negative peaks of exclusively TMd character at the location of the clean-surface TMSR’s(the shaded red regions) and negative peaks (or minima)of C character at the location of the clean-surface CSR’s(vertical lines in the shaded yellow regions). Positive∆DOS peaks are observed below, in between, and abovethe various negative peaks. A more detailed analysis ofthe atom-projected ∆DOS’s shows that all the TMSRstates associated with the three TM atoms close to thefcc site, where the adatom is adsorbed, are depleted.
2. Trends in ∆DOS with respect to the substrate
The variations in ∆DOS between the different sub-strates are illustrated by addressing the differences be-tween two representative example: C and O atoms, re-spectively.The ∆DOS for adsorbed C, Fig. 5, shows the pres-
ence on all substrates of a pronounced positive adsorbate-projected DOS (represented by the blue line) peak thatis pinned just below the depleted TMSR region and thatextends with a low-amplitude tail throughout the up-per part of the UVB. This peak overlaps with substrate-TM states and can therefore be identified as a bondingadsorbate–TMSR level. The corresponding antibondinglevel, of mainly TM character, is found above the de-pleted TMSR region. The ∆DOS in the UVB consistsof a number of subpeaks, of mixed adatom-C, substrate-TM, and substrate-C character, that are located in be-tween the depleted CSR levels. Such a structure indicatesthat the bonding adsorbate–TMSR level has interactedwith the CSR’s in the UVB.The ScC substrate forms an exception to the above
pattern. Here, the interaction with the CSR’s in theUVB appears to be much stronger. Also, the overlap of
10
∆DO
S (
arb.
uni
ts) ScC
TiC
−8 −6 −4 −2 0 2
∆DOS(Total)LDOS(C)
∆DOS(TM)∆DOS(C)
∆DO
S (
arb.
uni
ts) VC
−8 −6 −4 −2 0 2
ZrC
∆DO
S (
arb.
uni
ts) NbC
−8 −6 −4 −2 0
MoCδ −
−8 −6 −4 −2 0 2
E−EF (eV)
∆DO
S (
arb.
uni
ts) TaC
−8 −6 −4 −2 0E−E
F (eV)
WC
−8 −6 −4 −2 0 2
4d
5d
3d
4d
3d
5d
ScC VC
ZrC NbC
TaC
MoC
WC
TiC
FIG. 5: Total and atom-projected ∆DOS’s for the adsorbate C atom in fcc site on the considered TMC(111)surfaces. Theshaded areas and the dashed vertical lines represent the same quantities as in Fig. 2.

11
∆DO
S (
arb.
uni
ts) ScC
TiC
−8 −6 −4 −2 0 2
∆DOS(Total)LDOS(O)
∆DOS(TM)∆DOS(C)
∆D
OS
(ar
b. u
nits
) VC
−8 −6 −4 −2 0 2
ZrC
∆DO
S (
arb.
uni
ts) NbC
−8 −6 −4 −2 0
MoCδ −
−8 −6 −4 −2 0 2
E−EF (eV)
∆DO
S (
arb.
uni
ts) TaC
−8 −6 −4 −2 0E−E
F (eV)
WC
−8 −6 −4 −2 0 2
4d
5d
3d
4d
3d
5d
ScC VC
ZrC NbC
TaC
MoC
WC
TiC
FIG. 6: Total and atom-projected ∆DOS’s for the adsorbate O atom in fcc site on the considered TMC(111) surfaces. Theshaded areas and the dashed vertical lines represent the same quantities as in Fig. 2.

12
the adsorbate-projected DOS peak with the substrate-TM states is not as pronounced as on the other TMCsubstrates.The ∆DOS for adsorbed O, Fig. 6, shows a much more
varied structure. On several substrates, the adsorbate-projected DOS is now located inside the UVB region andshows a stronger substrate-C character than in the caseof adsorbed C. When moving from left to right along eachTMC period, this peak shifts to higher energies relativeto the substrate UVB region: for group IV TMC’s (TiCand ZrC) it lies at the lower edge of the UVB, whereas forgroup VI TMC’s (δ-MoC and WC) it lies at the upperedge of the UVB. At the same time, its form changes:quite localized with a tail towards higher energies forTiC and ZrC; broad for VC, NbC, and TaC; and local-ized with a tail towards lower energies for δ-MoC andWC. These observations indicate a stronger and muchmore varied interaction between the bonding adsorbate–TMSR level and the substrate CSR’s than in the case ofadsorbed C.Again, ScC stands out from the above pattern, be-
ing characterized by a much stronger participation of thesubstrate CSR’s in the bonding.It can also be noted that for both adsorbed C and
adsorbed O, the key features of the ∆DOS’s are the samewithin each substrate TM group.These results show the presence of significant covalent
bondings between the adsorbate and the substrate SR’s.In particular, both types of SR’s (TMSR’s and CSR’s)appear to participate in the chemisorption. This indi-cates that the previously reported picture for adsorptionon TiC(111) and TiN(111), that is, a concerted-couplingmodel (CCM) should be valid on these TMC(111) sur-faces as well. Such a picture is further pursued in Sec-tion V, where the differences and variations in electronicstructure are related to the trends in calculated Eads val-ues described in Section III B.
3. Trends in ∆DOS with respect to the adsorbate
To illustrate the variations in ∆DOS upon change ofadsorbate, Fig. 7 shows the calculated ∆DOS’s for theperiod 2 adatoms on the VC(111) surface. This trendhas previously been studied on the TiC and TiN (111)surfaces and described with the CCM.7–10
For all the adsorbates there are quenchings of boththe TMSR and the CSR’s, but to different degrees fordifferent adsorbates. As we go from left to right alongthe adatom period (B→F), the energy of the adatom-projected DOS decreases. At the same time, its widthchanges: localized for B and C, delocalized for N andO, and again localized for F. Also, the depletion of theTMSR decreases gradually. The degree of depletion ofthe substrate CSR’s varies also between the different ad-sorbates. An analysis of the Kohn-Sham wave functionsshows that adatom-projected DOS peaks that lie in thelower part of the UVB consist of strong adatom–C bond-
E−EF (eV)
∆DO
S (
arb.
uni
ts)
BC
NO
F
−8 −6 −4 −2 0 2
FIG. 7: Total ∆DOS for the adsorbates B, C, N, O, and Fon the VC(111) surface. The shaded areas and the dashedvertical lines represent the same quantities as in Fig. 2.
TABLE VI: Results from the calculations on the moleculesNHx (x = 1, 2, 3) adsorbed on the VC(111) surface: adsorp-tion energies Eads, perpendicular distances d between themolecule and the surface, and charge transfers from the sur-face to the molecule obtained by a Bader analysis.
Eads (eV) d (A) Bader (units of |e|)
NH 5.93 1.23 0.96
NH2 4.63 1.48 0.64
NH3 0.84 1.83 0.14
ing states, while peaks in the upper part of the UVBcontain strong adatom–TM bonding states.Again, these variations indicate strongly varying de-
grees of interaction between adsorbate, TMSR, and CSRlevels. They resemble the trends previously found on theTiC and TiN (111) surfaces and should therefore be pos-sible to explain in a similar way within the CCM. This isdone in Section V, where the DOS variations are relatedto the calculated Eads trends.
IV. MOLECULAR ADSORPTION
In this Section we present results for molecular ad-sorption on the VC(111) surface, which is here chosen asa prototype for molecular adsorption on the TMC(111)surface. The molecular adsorbates are the NHx molecules(x = 1, 2, 3), which are a part of our study in Ref. 11.The same supercell size and computational parametersas those used for the atomic adsorption are employed forthese calculations (see Section IIA). The molecules areadsorbed with the N atom closest to the surface in thefcc site (the stable site for N atomic adsorption). Theadsorption energy is calculated relative to the energy of
13
E−EF (eV)
∆DO
S [s
tate
s/(e
V c
ell)]
N
−10 −8 −6 −4 −2 0 2−8
−6
−4
−2
0
2
4
6
8
E−EF (eV)
∆DO
S [s
tate
s/(e
V c
ell)]
NH
−10 −8 −6 −4 −2 0 2−8
−6
−4
−2
0
2
4
6
8LDOS(N)LDOS(H)∆DOS(V)∆DOS(C)
E−EF (eV)
∆DO
S [s
tate
s/(e
V c
ell)]
NH2
−10 −8 −6 −4 −2 0 2−8
−6
−4
−2
0
2
4
6
8
E−EF (eV)
∆DO
S [s
tate
s/(e
V c
ell)]
NH3
−10 −8 −6 −4 −2 0 2−8
−6
−4
−2
0
2
4
6
8
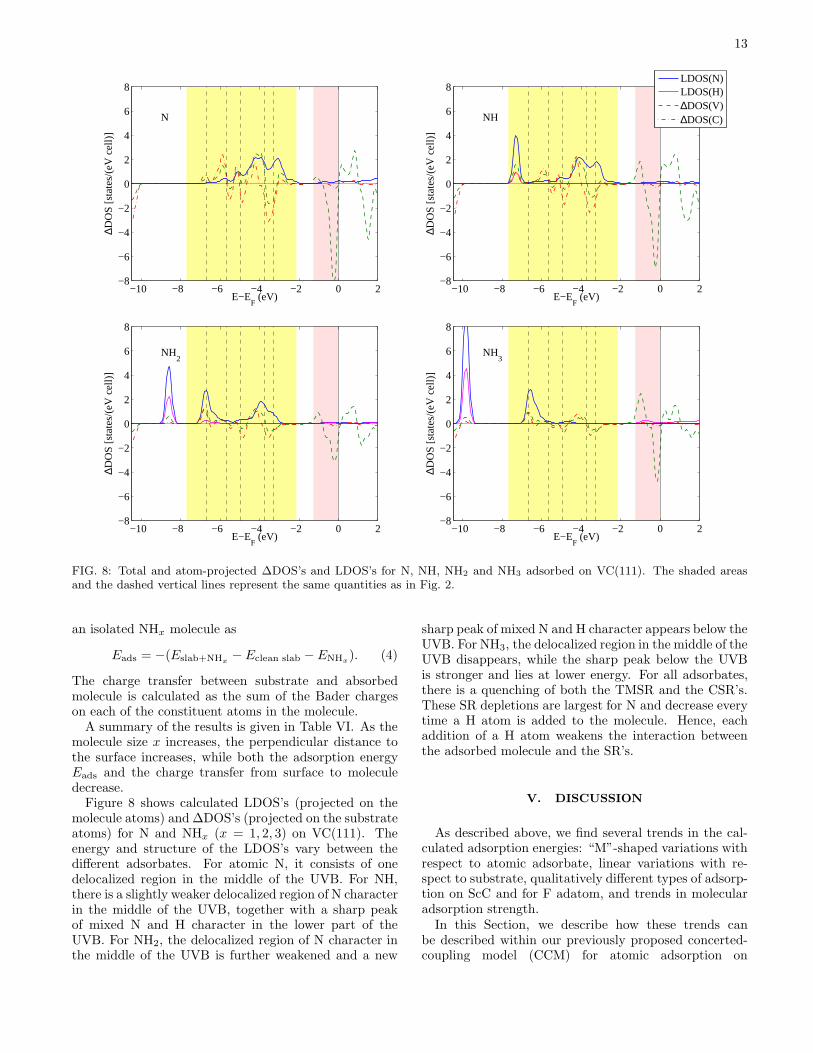
FIG. 8: Total and atom-projected ∆DOS’s and LDOS’s for N, NH, NH2 and NH3 adsorbed on VC(111). The shaded areasand the dashed vertical lines represent the same quantities as in Fig. 2.
an isolated NHx molecule as
Eads = −(Eslab+NHx− Eclean slab − ENHx
). (4)
The charge transfer between substrate and absorbedmolecule is calculated as the sum of the Bader chargeson each of the constituent atoms in the molecule.A summary of the results is given in Table VI. As the
molecule size x increases, the perpendicular distance tothe surface increases, while both the adsorption energyEads and the charge transfer from surface to moleculedecrease.Figure 8 shows calculated LDOS’s (projected on the
molecule atoms) and ∆DOS’s (projected on the substrateatoms) for N and NHx (x = 1, 2, 3) on VC(111). Theenergy and structure of the LDOS’s vary between thedifferent adsorbates. For atomic N, it consists of onedelocalized region in the middle of the UVB. For NH,there is a slightly weaker delocalized region of N characterin the middle of the UVB, together with a sharp peakof mixed N and H character in the lower part of theUVB. For NH2, the delocalized region of N character inthe middle of the UVB is further weakened and a new
sharp peak of mixed N and H character appears below theUVB. For NH3, the delocalized region in the middle of theUVB disappears, while the sharp peak below the UVBis stronger and lies at lower energy. For all adsorbates,there is a quenching of both the TMSR and the CSR’s.These SR depletions are largest for N and decrease everytime a H atom is added to the molecule. Hence, eachaddition of a H atom weakens the interaction betweenthe adsorbed molecule and the SR’s.
V. DISCUSSION
As described above, we find several trends in the cal-culated adsorption energies: “M”-shaped variations withrespect to atomic adsorbate, linear variations with re-spect to substrate, qualitatively different types of adsorp-tion on ScC and for F adatom, and trends in molecularadsorption strength.In this Section, we describe how these trends can
be described within our previously proposed concerted-coupling model (CCM) for atomic adsorption on
14
TiX(111) surfaces.7,9,10 First, the CCM is described bygiving an account of the main results of Refs. 7,9,10 andshown to apply also on the here considered TMC’s bypointing out the similarities in electronic structure re-sults. Then, the different adsorption-energy trends areexplained in terms of the CCM. Finally, the results laythe ground for the single descriptor εCCM for the adsorp-tion strength, recently introduced in Ref. 11.
A. Concerted-coupling model
For TM surfaces, the d-band model yields a successfuldescription of electronic structure and adsorption.61,62
For instance, its key parameter εd, the mean energyof the substrate d band, is a good descriptor for, e.g.,adsorption.63–65 Such a fact facilitates the design of newTM catalysts by computational screening.12–15
For adsorption on TMC’s, however, there are devia-tions from the d -band model.42,66 Indeed, we find thatdifferent TMC surfaces can have the same value of εdbut different Eads values. For example, the εd values forTiC(100) and TiC(111) surfaces are as close as 0.43 eVand 0.30 eV, whereas the Eads values for oxygen differconsiderably, being 5.79 eV and 8.76 eV, respectively.7
In the d -band model, adsorption trends are explainedby the interaction between the adatom frontier orbitaland the narrow TM d band. Using the terminology ofthe Newns-Anderson (NA) model for chemisorption,67–70
this bond is typically “strong” and results in the for-mation of separated bonding and antibonding adatom–substrate states (see case d in Fig. 9).68
In Refs. 7,9, and 10, atomic adsorption on the TiC andTiN (111) surfaces is described as a result of two typesof interactions between adsorbate and substrate. In theterminology of the NA model, the coupling of the adatomfrontier orbital is typically “strong” with the substrateTiSR and “weak” with the substrate XSR’s (X = C orN) (as in case d and in cases a–c in Fig. 9, respectively).A concerted action of these couplings gives a qualitativeexplanation for the calculated adsorption energy trendson the TiC(111)7,9,10 and TiN(111)8–10 surfaces. TheTiSR is present on the TiX(111) surfaces but not on the(001) ones. The XSR’s are found in the TiX(111) UVB’s.In the first mentioned coupling above, the large over-
lap of the localized TiSR with the adatom orbital causesa strong adatom–TiSR interaction (in the NA sense).Well-separated bonding and antibonding states of mixedadsorbate and Ti character are then formed (case d inFig. 9). The bonding-state energy lies below the free-adatom and TiSR levels, while the antibonding state re-sides above the TiSR level.In the other coupling, the bonding adatom–TiSR level
interacts with the XSR’s present in the substrate UVB.Due to the short range of the XSR’s (compared to theTiSR), this interaction is weak (in the NA sense) andcauses a mixture of broadening and shifting of the bond-ing adlevel–TiSR state. A state located in the middle of
the UVB is mainly broadened (case b in Fig. 9), while astate at the edge of the UVB is mainly shifted away fromthe UVB center of mass (cases a and c in Fig. 9).Evidence for this concerted coupling is given by
detailed analyses of the calculated adsorbate-inducedDOS’s (∆DOS’s) and of real-space visualizations of theKohn-Sham wave functions. These show that upon ad-sorption, there are (i) a sharp decrease in DOS at theTiSR energy; (ii) a sharp increase of DOS just abovethe TiSR energy; (iii) depending on the adatom species,narrow or broad bands of mainly adatom character atthe edge of or within the substrate UVB energy range,respectively; (iv) a depletion of X-localized UVB statesat the XSR energies; and (v) a formation of adatom-localized sub-peaks in between the energies of the sub-strate XSR’s. Points (i)–(iii) show that bonding and an-tibonding adlevel–TiSR states are formed, while points(iii)–(v) prove a coupling between the bonding adlevel–TiSR state and the XSR’s in the substrate UVB.More detailed analyses of the trends in calculated
∆DOS’s and Kohn-Sham wave functions for second- andthird-period adatoms on TiX(111) surfaces show that (i)the magnitude of the DOS reduction at the TiSR energydecreases successively as the adatom number Z increasesalong a period and (ii) the adatom–X bonding characterof the adatom-localized peaks increases as the adatomnumber Z increases along a period. These trends, whicharise from the successive lowering of the adlevel energyas Z increases, indicate that the adatom–TiSR couplingdecreases in strength along each adatom period, towardsthe right in the periodic table, while the contribution ofthe XSR’s to the bonding increases.Such trends provide a basis for understanding the cal-
culated trends in atomic adsorption energies. For in-stance, the maximum for the group-VI adatoms (O andS) is explained in terms of a stronger coupling to the sub-strate CSR’s. On the other hand, the weaker bonding ofgroup-VII adatoms (F and Cl) is explained by a weak-ened coupling to the CSR’s, due to the adatom state be-ing almost fully ionized by its interaction with the TiSR.Thus, the F and Cl adsorbates lack almost any covalentinteraction with the substrate UVB and their adsorptionis practically ionic in nature, as confirmed by Bader andcharge-density analyses. Also, the almost equal adsorp-tion strengths of C and N can be explained in terms ofthe opposite trends in adatom–TiSR and adatom–CSRcoupling strengths found for varying Z values.On the same basis, the CCM is also able to describe
changes in adsorption energies arising from changes inadsorption site, i.e., between fcc, hcp, and top O adatomson TiC(111).7
B. Generalization of the CCM to other TMC’s
The calculated energetics and electronic structures ofatomic adsorption on the TMC(111) surfaces described inSection III can be analyzed in the same way as described
15
∆(ε) Λ(ε)
Λ(ε)
Energy
Den
sity
of s
tate
sa b c ∆(ε)
Λ(ε)
Λ(ε)
d
Energy
Den
sity
of s
tate
s
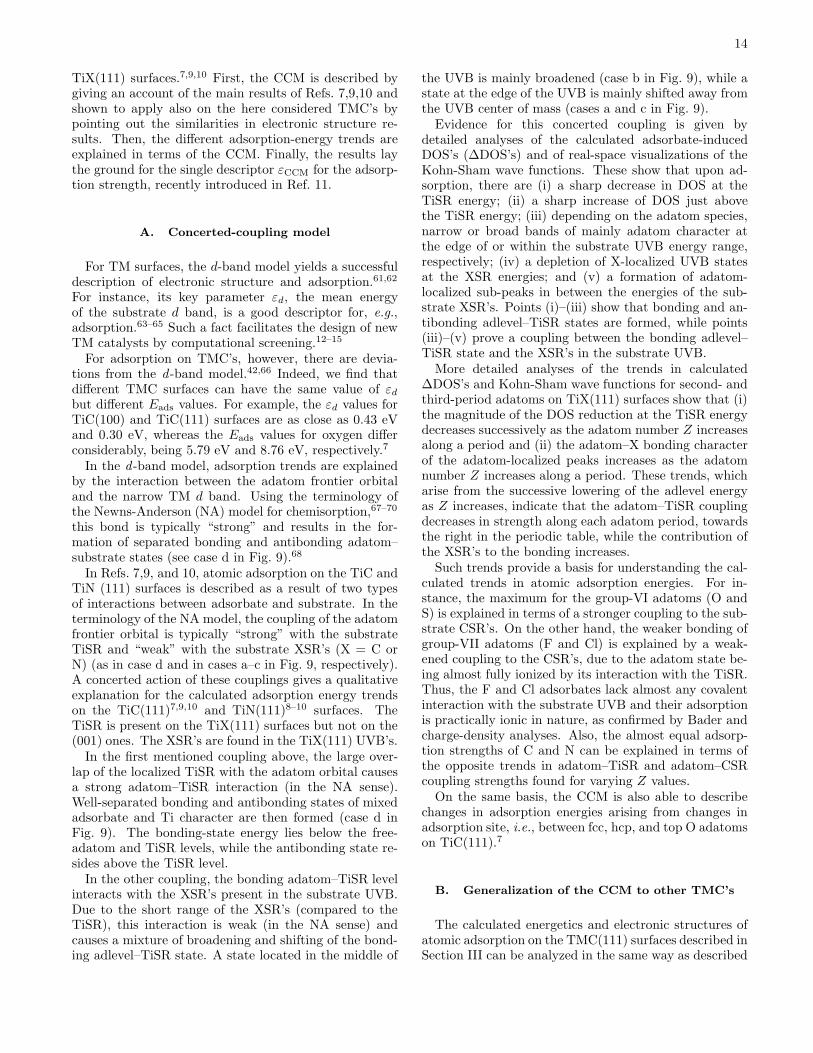
FIG. 9: A schematic representation of the solutions of the Newns-Anderson model for atomic chemisorption on a metalsurface.68 The left and right panels illustrate the “weak” and “strong” chemisorption limits, respectively. The solutions, thatis, the adatom-localized DOS’s after adsorption, are yielded by the intersections between the straight lines a–d and the functionΛ(ε). The energy of the adatom frontier orbital before adsorption is given by the intersection of the lines a–d and the x-axes.Thus, cases a and c correspond to a shift of the adlevel to lower and higher energies, respectively, while case d corresponds toa formation of well-separated bonding and antibonding levels. In case b, only a broadening of the adlevel is obtained. Thefunction ∆(ε) represents the DOS of the clean surface before adsorption. Adapted from Ref. 68.
above for TiX(111).The fact that upon adsorption the TMSR’s and CSR’s
are quenched on all considered surfaces shows that bothtypes of resonance participate in the substrate–adatombond. The strong character of the adatom–TMSR bondsis evidenced by the formation of well-separated bondingand antibonding states of mixed adatom and TM char-acter, at energies below and above the TMSR’s, respec-tively. The weak character of the adatom–CSR bonds isconfirmed by the broadening and/or shift of the bondingadatom–TMSR level.The exception is ScC(111), on which the adatom–CSR
coupling approaches a strong NA character, with a strongdepletion of CSR states in the middle of the UVB and theformation of separated bonding and antibonding statesbelow and above the UVB, respectively. This is dueto the stronger CSR’s on this surface, which in turnarises from the stronger C–C bonds in bulk ScC thanin the other TMC’s.51 Also, the adatom–TMSR couplingis qualitatively different on ScC(111), compared to theother TMC’s, as the TMSR of clean ScC(111) lies aboveEF and is thus empty before adsorption.Thus, the basic adsorption mechanism is the same on
all the considered TMC(111) surfaces, implying that thegeneral applicability of the CCM includes TMC(111) sur-faces. In addition, ScC(111) provides a playground fortesting the contribution of the adlevel–CSR coupling tothe total adsorption strength.In the following, we give more explicit support to the
applicability of the CCM to the TMC(111) surfaces byshowing that the CCM can be used to understand the
major features of the calculated atomic and molecularadsorption-energy trends on the considered TMC(111)surfaces.
C. Adsorption trends with respect to substrateand CCM
Figure 4(b) shows the calculated energy values foratomic adsorption on TMC(111) surfaces as functions ofthe substrate TM group number. In this subsection weshow that the CCM can capture its main trends.In a simple molecular two-level picture, the strength of
a bond is related to the energy shift between the levelsof the isolated constituents and of the hybridized statesresulting from the coupling. In a simplified version ofthe Newns model, an adsorbate and the active part ofthe substrate can be viewed as such a “molecule”.68 Ac-cordingly, from the calculated ∆DOS’s the bond strengthcan be extracted as the energy difference between the fi-nal bonding adatom level (i.e., after coupling to bothTMSR and CSR’s) and the TMSR peak in the surfaceDOS. The CCM is then able to explain the trends in bondstrength by relating this energy difference to concertedadatom–TMSR and adatom–CSR interactions.In the following, we employ such an approach to un-
derstand the qualitatively different trends in Eads valuesfor C and O adatoms, as the substrate TM group numberincreases from IV to VI [Fig. 4(b)].For C, the Eads values are approximately constant be-
tween groups IV and VI. The calculated ∆DOS’s (see
16
Fig. 5) show that the final bonding adatom level liesat the upper edge of the UVB on all considered sub-strates. Thus on all these substrates, the energy differ-ence between the final adatom level and the original sub-strate TMSR is approximately constant. This impliesthat the result of the concerted action of the adatom–TMSR and adatom–CSR’s interactions is approximatelyconstant. In particular, Fig. 5 shows that the DOS’s of allsubstrates resemble the same NA type of adlevel–CSR’sinteraction, that is, type c in Fig. 9.For O, with its lower 2p level, the Eads values decrease
strongly as the substrate TM group number increasesfrom IV to VI. This is reflected in the calculated ∆DOS’s(Fig. 6) by a strongly decreasing energy difference be-tween the final adatom level and the original substrateTMSR peak. Thus, in contrast to C, for O the concertedaction of the two types of coupling yields qualitativelydifferent results. In particular, Fig. 5 shows DOS’s thatcorrespond to adlevel–CSR’s interactions that vary in aqualitative way from (cf. Fig. 9) NA case a (on groupIV), to NA case b (on group V), and to NA case c (ongroup VI). As a consequence, the adlevel–CSR’s inter-actions cause a downward energy shift (on group IV), abroadening (on group V), and an upward energy shift (ongroup VI) of the bonding adlevel.We also notice that for both adsorbates the antibond-
ing adatom–TMSR level lies above EF (and is thusempty) for all substrates except the group-VI TMC’sδ-MoC and WC. This filling of antibonding states im-plies an extra decrease in adatom–TMC bond strength,as group V → VI. Indeed, this can be seen in the calcu-lated Eads trend for C [Fig. 4(b)].For all adsorbates except F, the calculated Eads val-
ues increase from ScC(111) to TiC(111). As describedabove, the adlevel–CSR’s interaction is more pronouncedon ScC(111) than on the other TMC’s, thus approachingthe strong NA limit. Also, the adatom–TMSR couplingis qualitatively different on ScC(111), due to the TMSRof clean ScC(111) lying above EF and being thus emptybefore adsorption. The weaker adsorption on ScC(111)can thus be understood to be due to the qualitativelydifferent interaction with the two types of SR’s.
D. Adsorption trends with respect to adsorbateand CCM
The adsorption-energy trends with respect to adsor-bate [Fig. 4(a)] show ”M“-shaped Eads trends for mostof the considered TMC’s. The trend on TiC(111) was an-alyzed in Ref. 7 and explained within the CCM to arisefrom competing opposite trends in adsorbate–TMSR andadsorbate–CSR’s interactions.The calculated ∆DOS’s for the here considered TMC’s
(illustrated for VC in Fig. 7) show trends that are sim-ilar to those found for TiC. At the same time, the Eads
trends for all considered TMC’s resemble the one onTiC(111), with a local maximum for the O adatom. How-
ever, on group-V TMC’s the calculated Eads values forO are approximately equal to the ones for C, and ongroup-VI TMC’s the O values are smaller than the onesfor C. Thus, the chemisorption strength of O appears toweaken relative to C as the substrate TM group numberincreases. This can be understood to be a consequenceof the different Eads trends for C and O that were de-scribed in Sec. VC above, with the adsorption strengthdecreasing much faster for O than for C as the TM groupnumber increases from IV to VI.On the other hand, the Eads values for ScC(111) show
a monotonic increase between B and O adatoms. As de-scribed above, the adlevel–CSR’s interaction is strongeron ScC(111) than on the other considered TMC(111) sur-faces. Therefore, the monotonically increasing trend (asB → O) of the adlevel–CSR’s coupling contribution tothe adatom–TMC bond is stronger on ScC(111).Finally, on all substrates there is a sharp decrease in
adsorption energy, as O → F. This arises from the weak-ened adlevel–CSR’s interaction, which is due to the factthat the adatom is almost fully ionic from its interactionwith the TMSR, as described previously on TiC(111).7
E. Molecular adsorption and CCM
The adsorption energies of the considered molecularadsorbates NHx (x = 1, 2, 3) on VC(111) show a de-creasing trend as x increases (Table VI). This trend canbe understood in terms of the CCM as arising from theconcerted coupling between each molecular orbital andthe two types of SR’s.The quenchings of both TMSR and CSR’s in the cal-
culated ∆DOS’s for NHx on VC(111) (Fig. 8) indicatethe presence of couplings to both types of SR’s. In ad-dition, the adsorbate-projected LDOS’s show stronglybound sharp peaks of mixed N and H character as well asmore delocalized regions of only N character within theUVB. A comparison with calculated DOS’s for the freeNHx molecules shows that the sharp peaks correspond tolow-energy molecular levels that interact weakly with thesubstrate SR’s. On the other hand, the delocalized re-gions arise from the coupling of higher-energy molecularlevels with the SR’s, in a way that is similar to the ad-sorption of atomic N. Figure 8 shows that as the numberx of H atoms in the molecule increases, the interaction ofthe higher-energy molecular levels with the SR’s weakens,thus lowering the adsorption strength.
F. Applicability of the CCM
The above discussion shows that for the atomic andmolecular adsorption on the TMC(111) surfaces a picturebased on the concerted action of two types of adatom–substrate interactions applies. It can be used to describekey features of the calculated adsorption-strength andelectronic-structure trends. In this concerted-coupling
17
−1.5 −1 −0.5 0 0.5 1 1.5
3
4
5
6
7
8
εCCM
(eV)
Ead
s(eV
)
H
B
C
NO
F
MoC WC NbC TaC VC ZrC TiC ScCδ−
FIG. 10: Correlation between Eads and εCCM for the atomicadsorbates H, B, C, N, O and F.
model (CCM), two types of SR’s participate in the bond,TM-localized SR’s (TMSR) and C-localized SR’s (CSR).Therefore we conclude that the CCM is valid for atomicadsorption on all the considered TMC(111) surfaces.
G. Descriptor for adsorption on TMC(111): εCCM
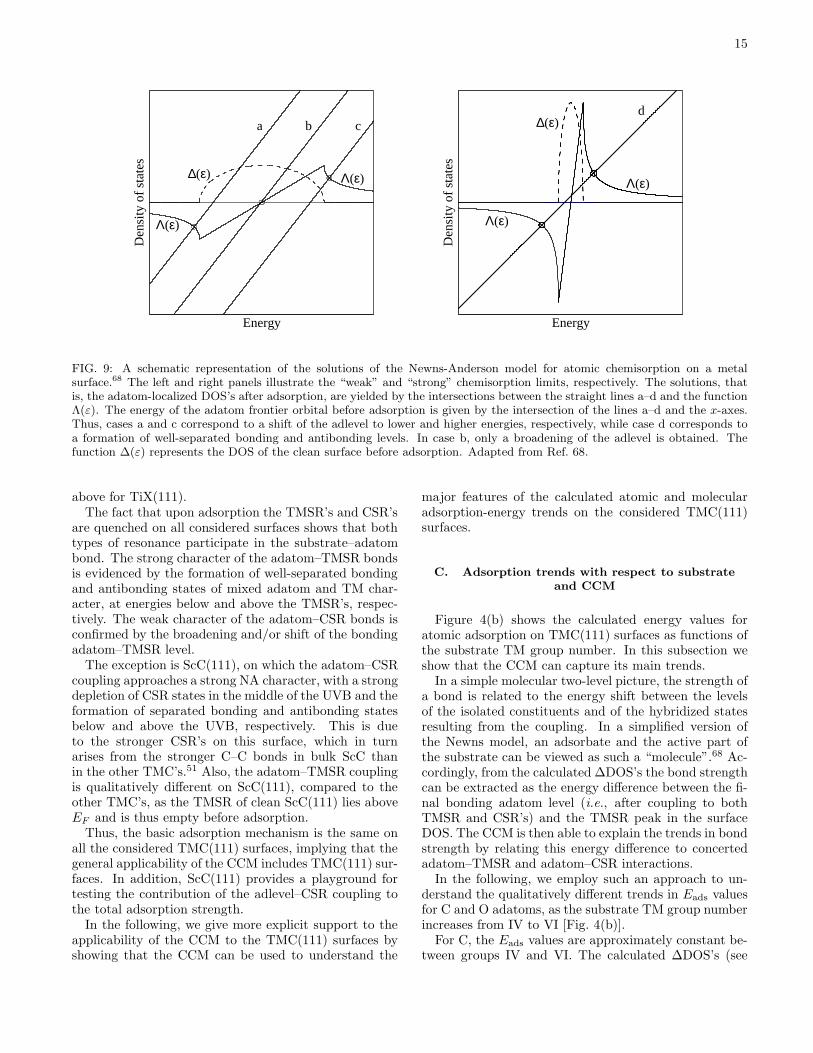
To be able to describe the variations in adsorptionstrength in a simple yet efficient way, a descriptorεCCM, defined as the mean energy of the TMSR, can beintroduced.11 Due to the approximately constant energydifference between TMSR and CSR’s in the consideredcompounds, such a descriptor is able to capture the im-portant variations of both TMSR and CSR energy trendswhile being at the same time both conceptually simpleand measurable or calculable.This is confirmed by Fig. 10, which shows a linear cor-
relation between our calculated Eads values and εCCM
for each of the considered atomic adsorbates, also whenthe results of Ref. 11 are significantly extended. The ex-ception is ScC(111), which is a consequence of the men-tioned qualitative difference in electronic structure of thissurface, that is, an empty TMSR and a strong adlevel–CSR coupling. As discussed above, the variations in thegradients of the lines for the different adsorbates can beunderstood within the CCM from the details in the in-teractions between the adlevel and the different SR’s.In Ref. 11, linear correlations are also found between
εCCM and the molecular adsorption energies of NH, NH2,and NH3, as well as the activation-energy barriers for N2.This is a consequence of the fact that both atomic andmolecular adsorptions appear to follow the same basicmechanisms of the CCM, as argued above. As a conse-quence, we show in Ref. 11 that scaling and Brønsted-Evans-Polanyi (BEP) relations apply for adsorption onTMC(111) surfaces. Such findings are of importance for
the design of new catalysts.
VI. CONCLUSIONS
The possibility to understand materials has today in-creased considerably, as DFT has developed into a predic-tive theory. One obvious application of DFT is to calcu-late numbers for bonding strengths, structure parametersand coordinates, etc. Another, slightly more demand-ing, application is to look for more detailed informationand develop conceptual frameworks and models in whichwe can formulate our understanding and on which wecan base our further thinking, including ideas about newmaterials. We have found that various densities of states(DOS’s) are excellent tools for such understanding andvehicles for thought. In our approach, extensive use oftotal, local, projected, and difference DOS’s are corner-stones in the building-up of a conceptual framework andmodel.This study deals with understanding the atomic and
molecular adsorption on the TMC(111) surfaces usingsuch a detailed electronic structure analysis approach.By extensive DFT calculations on ScC, TiC, VC, ZrC,NbC, δ-MoC, TaC, andWC, we study trends in clean sur-face properties, adsorption energies, and various DOS’s.In brief, we find that only a certain part of the surface-localized electronic structure, corresponding to the TM-localized (TMSR) and the C-localized (CSR) surfaceresonances (SR’s) are of importance to understand thetrends in adsorption energies from one TMC surface toanother and from one adsorbate to another. Despite theTM termination of the investigated TMC surfaces, thesecond-layer C atoms are found to play a crucial role inthe chemisorption. This is particularly evident on theScC(111) surface, where the TMSR is empty and wherethe CSR’s are particularly strong.Having thus identified the key parameters, we possess
the foundations for a concerted-coupling model (CCM)in which trends in adsorption strength are the resultof a concerted action of both adsorbate–TMSR andadsorbate–CSR’s couplings. This has earlier been shownfor the TiC and TiN (111) surfaces7,9,10 but the breadthand versatility are here shown by applications to otherTMC’s and trends, including: adsorption trends withrespect to substrate, adsorption trends with respect toatomic adsorbate, adsorption trends on ScC(111), ad-sorption trend for group-VII adatoms, and molecular-adsorption trends. This deepens the interpretation ofthe model and broadens its usefulness.The applicability of the CCM to both atomic and
molecular adsorption opens up the possibility to studyreactions for, e.g., catalytic applications on this class ofmaterials. For example, it allows the formulation of a sin-gle descriptor εCCM for the adsorption strength.11 Also, itimplies the existence of scaling relations between molecu-lar and atomic adsorption strengths as well as Brønsted-Evans-Polanyi relations.11
18
Since the CCM framework is based on rudimentarybonding principles with general applicability, we be-lieve that it is possible to generalize it to other mate-rials that possess surface-localized states. We have al-ready shown its applicability to atomic adsorption onTiN(111)9,10 and believe that the same chemisorptionmechanism should be valid for other nitrides. Ligand andvacancy systems have been shown to belong to the groupof materials where the CCM applies,11 as do certain TMsurfaces,11 where, however, it does not need to replacethe sufficient and natural d -band model. Natural exten-sions should include TM oxides, sulfides, and borides.Design of materials, including atomic-scale engineering,
is also an enticing prospect for further applications.
Acknowledgments
Valuable discussions with Anders Hellman are ac-knowledged. The calculations were performed at HPC2Nand NSC via the Swedish National Infrastructure forComputing. B. I. Lundqvist gratefully acknowledges sup-port from the Lundbeck foundation (Denmark) via theCenter for Atomic-scale Materials Design.
∗ Electronic address: [email protected] R. B. Levy and M. Boudart, Science 181 547 (1973).2 J. G. Chen, Chem. Rev. 96, 1477 (1996); H. H. Hwu andJ. G. Chen, Chem. Rev. 105, 185 (2005) and referencestherein.
3 M. Halvarsson and S. Vuorinen, Int. J. Refract. Met. HardMater. 15 169 (1997).
4 H. G. Prengel, W. R. Pfouts, and A. T. Santhanam, Surf.Coat. Technol 102 183 (1998).
5 H. Itoh, T. Ichinose, C. Oshima, T. Ichinokawa, and T.Aizawa, Surf. Sci. 254 L437 (1991).
6 J. Gunster, M. Baxendale, S. Otani, and R. Souda, Surf.Sci. 494 L781 (2001).
7 C. Ruberto, and B. I. Lundqvist, Phys. Rev. B 75, 235438(2007).
8 A. Vojvodic, C. Ruberto and B. I. Lundqvist, Surf. Sci.600, 3619 (2006).
9 C. Ruberto, A. Vojvodic and B. I. Lundqvist, Surf. Sci.600, 1612 (2006).
10 C. Ruberto, A. Vojvodic and B. I. Lundqvist, Solid StateCommun. 141, 48 (2007).
11 A. Vojvodic, A. Hellman, C. Ruberto, and B. I. Lundqvist,Phys. Rev. Lett. 103, 146103 (2009).
12 J. Sehested, K. E. Larsen, A. L. Kustov, A. M. Frey, T.Johannessen, T. Bligaard, M. P. Andersson, J. K. Nørskov,and C. H. Christensen, Top. Catal. 45, 9 (2007).
13 F. Abild-Pedersen, J. Greeley, F. Studt, J. Rossmeisl, T.R. Munter, P. G. Moses, E. Skulason, T. Bligaard, J. K.Nørskov, Phys. Rev. Lett. 99, 016105 (2007).
14 F. Studt, F. Abild-Pedersen, T. Bligaard, R. Z. Sørensen,C. H. Christensen, and J. K. Nørskov, Science 320, 1320(2008).
15 J. K. Nørskov, T. Bligaards, J. Rossmeisl, and C. H. Chris-tensen, Nature Chemistry 1, 37 (2009).
16 M. Aono, C. Oshima, S. Zaima, S. Otani, and Y. Ishizawa,Jpn. J. Appl. Phys. 20, L829 (1981).
17 J. Rundgren, Y. Gauthier, R. Baudoing-Savois, Y. Joly,and L. I. Johansson, Phys. Rev. B. 45, 4445 (1992).
18 Y. Hwang, T. Aizawa, W. Hayami, S. Otani, Y. Y.Ishizawa, and S.-J. Park, Surf. Sci. 271, 299 (1990).
19 K. Edamoto, E. Miyazaki, and H. Kato, Vacuum 41, 547(1990).
20 W. Hayami, R. Souda, T. Aizawa, S. Otani, and Y.Ishizawa, Phys. Rev. B. 47, 13752 (1993).
21 T. Aizawa, R. Souda, S. Otani, Y. Ishizawa, and C. Os-
hima, Phys. Rev. B 42, 11469 (1990).22 S. L. Hulbert, C. C. Kao, R. F. Garrett, R. A. Yang, J.
Vac. Sci. Technol. A 9, 1919 (1989).23 J. H Weaver, A. M. Bradshaw, J. F. van der Veen, F. J.
Himpsel, D. E. Eastman, and C. Politis, Phys. Rev. B 22,4921 (1980).
24 S. Zaima, Y. Shibata, H. Adachi, C. Oshima, S. Otani, M.Aono, and Y. Ishizawa, Surf. Sci. 157, 380 (1985).
25 K. Edamoto, T. Anazawa, A. Mochida, T. Itakura, E.Miyazaki, H. Kato, and S. Otani, Phys. Rev. B 46, 4192(1992).
26 K. Edamoto, T. Anazawa, S. Tokumitsu, A. Tanabe, R.Sekine, E. Miyazaki, H. Kato, and S. Otani, Solid StateCommun. 5, 435 (1996).
27 K. Edamoto, Y. Abe, T. Ikeda, N. Ito, E. Miyazaki, H.Kato, and S. Otani, Surf. Sci. 237, 241 (1990).
28 T. Anazawa, S. Tokumitsu, R. Sekine, E. Miyazaki, K.Edamoto, H. Kato, and S. Otani, Surf. Sci. 328, 263(1995).
29 A. M. Bradshaw, J. F. van der Veen, F. J. Himpsel, andD. E. Eastman, Solid State Commun 37, 37 (1980).
30 R. Souda, C. Ohima, S. Otani, Y. Ishizawa, and M. Aono,Surf. Sci. 199, 154 (1988).
31 K. Edamoto, E. Miyazaki, T. Anazawa, A. Mochida, andH. Kato, Surf. Sci. 269, 389 (1992).
32 K. Edamoto, A. Mochida, T. Anazawa, T. Itakura, and E.Miyazaki, Phys. Rev. B 46, 7127 (1992).
33 S. Tokumitsu, T. Anazawa, A. Tanabe, R. Sekine, E.Miyazaki, K. Edamoto, H. Kato, and S. Otani, Surf. Sci.351, 165 (1996).
34 T. Nakane, T. Noda, K. Ozakawa, and K. Edamoto, Surf.Sci. 433-435, 180 (1999).
35 T. Noda, M. Yamazaki, K. Ozawa, K. Edamoto, and S.Otani, Surf. Sci. 450, 27 (2000).
36 I. Kojima, M. Orita, E. Miyazaki, S. Otani, and Y.Ishizawa, Surf. Sci. 160, 153 (1985).
37 K. Edamoto, T. Anazawa, E. Shiobara, M. Hatta, and E.Miyazaki, Phys. Rev. B 43, 3871 (1991).
38 W. Hayami, R. Souda, T. Aizawa, S. Otani, and Y.Ishizawa, Surf. Sci. 346, 158 (1996).
39 T. Aizawa, W. Hayami, R. Souda, S. Otani, T. Tanaka,and Y. Ishizawa, Surf. Sci., 357, 645 (1996).
40 K. E. Tan, M. W. Finnis, A. P. Horseld, and A. P. Sutton,Surf. Sci. 348, 49 (1996).
41 Y. F. Zhang, J. Q. Li, and L. X. Zhou, Surf. Sci.488, 256
19
(2001).42 J. R. Kitchin, J. K. Nørskov, M. A. Barteau, and J. G.
Chen, Catal. Today 105, 66 (2005).43 Y.-F. Zhang, J.-Q. Li, K.-N. Ding, W.-K. Chen and L.-X.
Zhou, Acta Phys.-Chim. Sin. 19, 40 (2003).44 S. R. Bahn and K. W. Jacobsen, Comput. Sci. Eng. 4, 56
(2002); http://wiki.fysik.dtu.dk/dacapo.45 D. Vanderbilt, Phys. Rev. B 41, R7892 (1990).46 K. Burke, J. P. Perdew, and Y.Wang, in Electronic Density
Functional Theory, Recent Progress and New Directions,edited by J. F. Dobson, G. Vignale and M. P. Das (PlenumPress, New York and London 1998); pp. 81–111.
47 H. J. Monkhorst and J. D. Pack, Phys. Rev. B 13, 5188(1976).
48 L. Bengtsson, Phys. Rev. B 59, 12301 (1999).49 R. F. W. Bader, Chem. Rev. 91, 893 (1991).50 G. Henkelman, A. Arnaldsson, and H. Jonsson, Com. Mat.
Sci. 36, 354 (2006).51 A. Vojvodic and C. Ruberto, Submitted.52 S. V. Dudiy and B. I. Lundqvist, Phys. Rev. B 69, 125421
(2004).53 F. Vines, C. Sousa, F. Illas, P. Liu, and J. A. Rodriguez,
J. Phys. Chem. C, 111, 1307 (2007).54 P. W. Tasker, J. Phys. C: Sol. Stat. Phys. 12, 4977 (1979).55 F. Jona and P. M. Marcus, in The Structure of Surfaces II,
edited by J. F. van der Veen and M. A. Van Hove (Springer,Berlin, 1988) p. 90; K. Heinz, Surf. Sci. 299/300, 433(1994); and references therein.
56 P. J. Feibelman, Surf. Sci. 360, 297 (1996).57 C. Ruberto, Y. Yourdshahyan, and B. I. Lundqvist, Phys.
Rev. Lett. 88, 226101 (2002).58 M. Tsukada and T. Hoshino, J. Phys. Soc. Jpn. 51, 2562
(1982).59 B. Hammer, L. B. Hansen, and J. K. Nørskov, Phys. Rev.
B, 59, 7413 (1999).60 S. Kurth, J. P. Perdew, and P. Blaha, Int. J. Quantum
Chem. 75, 889 (1999).61 B. Hammer and J. K. Nørskov, Adv. Catal. 45, 71 (2000).62 T. Bligaard, and J. K. Nørskov, in Chemical Bonding at
Surfaces and Interfaces, edited by A. Nilsson, L. G. M. Pet-tersson, and J. K. Nørskov (Elsevier, Amsterdam, 2008).
63 B. Hammer and J. K. Nørskov, Surf. Sci. 343, 211 (1995).64 B. Hammer and J. K. Nørskov, Nature 376, 238 (1995).65 T. Bligaard, J. K. Nørskov, and B. I. Lundqvist, in Hand-
book of Surface Science Vol. 3, edited by E. Hasselbrinkand B. I. Lundqvist (Elsevier, Amsterdam, 2008).
66 E. M. Fernandez, P. G. Moses, A. Toftelund, H. A. Hansen,J. I. Martinez, F. Abild-Pedersen, J. Kleis, B. Hinnemann,J. Rossmeisl, T. Bligaard, and J. K. Nørskov, Angew.Chem. Int. Ed. 47, 4683 (2008).
67 P. W. Anderson, Phys. Rev. 124, 41, (1961).68 D. M. Newns, Phys. Rev. 178, 1123 (1969).69 T. B. Grimley, J. Vac. Sci. Technol. 8, 31, (1971).70 M. C. Desjonqueres and D. Spanjaard, Concepts in Surface
Physics, Springer-Verlag, Berlin Heidelberg, (1993).