
Solid state formation of calcium carbide
108
Graduate Theses, Dissertations, and Problem Reports 2014 Solid state formation of calcium carbide Solid state formation of calcium carbide Patrick Egbele Iyere Follow this and additional works at: https://researchrepository.wvu.edu/etd Recommended Citation Recommended Citation Iyere, Patrick Egbele, "Solid state formation of calcium carbide" (2014). Graduate Theses, Dissertations, and Problem Reports. 7316. https://researchrepository.wvu.edu/etd/7316 This Thesis is protected by copyright and/or related rights. It has been brought to you by the The Research Repository @ WVU with permission from the rights-holder(s). You are free to use this Thesis in any way that is permitted by the copyright and related rights legislation that applies to your use. For other uses you must obtain permission from the rights-holder(s) directly, unless additional rights are indicated by a Creative Commons license in the record and/ or on the work itself. This Thesis has been accepted for inclusion in WVU Graduate Theses, Dissertations, and Problem Reports collection by an authorized administrator of The Research Repository @ WVU. For more information, please contact [email protected].
-
Upload
khangminh22 -
Category
Documents
-
view
1 -
download
0
Transcript of Solid state formation of calcium carbide

Graduate Theses, Dissertations, and Problem Reports
2014
Solid state formation of calcium carbide Solid state formation of calcium carbide
Patrick Egbele Iyere
Follow this and additional works at: https://researchrepository.wvu.edu/etd
Recommended Citation Recommended Citation Iyere, Patrick Egbele, "Solid state formation of calcium carbide" (2014). Graduate Theses, Dissertations, and Problem Reports. 7316. https://researchrepository.wvu.edu/etd/7316
This Thesis is protected by copyright and/or related rights. It has been brought to you by the The Research Repository @ WVU with permission from the rights-holder(s). You are free to use this Thesis in any way that is permitted by the copyright and related rights legislation that applies to your use. For other uses you must obtain permission from the rights-holder(s) directly, unless additional rights are indicated by a Creative Commons license in the record and/ or on the work itself. This Thesis has been accepted for inclusion in WVU Graduate Theses, Dissertations, and Problem Reports collection by an authorized administrator of The Research Repository @ WVU. For more information, please contact [email protected].

SOLID STATE FORMATION OF CALCIUM CARBIDE
Patrick Egbele Iyere
Thesis submitted to the Benjamin M. Statler College of Engineering and Mineral Resources
at West Virginia University in partial fulfillment of the requirements
for the degree of
Master of Science in
Mechanical Engineering
Edward M. Sabolsky, Ph.D., Chair Ismail Celik, Ph.D. Bruce Kang, Ph.D.
Department of Mechanical and Aerospace Engineering
Morgantown, West Virginia 2013
Keywords: Calcium Carbide, Solid-State Synthesis, Industrial Microwave Furnace
Copyright 2013 Iyere, Patrick Egbele

All rights reserved
INFORMATION TO ALL USERSThe quality of this reproduction is dependent upon the quality of the copy submitted.
In the unlikely event that the author did not send a complete manuscriptand there are missing pages, these will be noted. Also, if material had to be removed,
a note will indicate the deletion.
Microform Edition © ProQuest LLC.All rights reserved. This work is protected against
unauthorized copying under Title 17, United States Code
ProQuest LLC.789 East Eisenhower Parkway
P.O. Box 1346Ann Arbor, MI 48106 - 1346
UMI 1555314
Published by ProQuest LLC (2014). Copyright in the Dissertation held by the Author.
UMI Number: 1555314

ABSTRACT
SOLID-STATE FORMATION OF CALCIUM CARBIDE
Patrick Egbele Iyere
Acetylene is known as an essential chemical building block with increasing prominent
applications as a raw material in the production of important organic compounds. An indirect
method used to synthesize acetylene is through the decomposition of CaC2 in the presence of
water. The current work investigated a process for the synthesis of calcium carbide via a solid-
state reaction route and the general kinetics of the reaction was characterized. The calcium
carbide was synthesized by conventional and microwave heating (6 kW, 2.45GHz) of micron-
sized calcium oxide and carbon powders in argon. The temperature range for these reactions was
between 1000-1800°C. The work succeeded in preparing CaC2 within several minutes using
microwave heating. A well-crystallized product was obtained with purities as high as 90% CaC2.
Three different phase were identified during the reactions depending upon the temperature
regime; CaC2 II (at 1600°C), CaC2 II & III (at 1650°C) and CaC2 I, II & III (at 1700°C) were
identified using a x-ray diffraction phase identification technique. The apparent activation energy
calculated was found to be approximately 125.66 kJ⋅mol−1.
In addition to variation in reaction temperature, uniaxial pellet compaction load, reaction
times, sample mass and heating rates were also varied. The influence of solid particle surface
contact, carbon source reactivity and mold configuration were included in this investigation. The
effects of the processing techniques and variables on the final density, microstructural properties

and percent purity of the resulting products were characterized using the gas chromatograph, X-
ray photoelectron spectroscopy and X-ray diffraction techniques.
Finally, the calcium carbide synthesized via microwave heating yielded 80% more
carbide formed compared to conventionally processed carbide at 1600⁰C. The reaction kinetics
was increased for all temperatures using the same feed amount. The density and degree of purity
of the products were affected by reaction temperature and exposure time, starting particle size of
the reactants and the dimension of the sample container.

i
We approve the thesis of Patrick E. Iyere.
Date of Signature
……………………………………………… …………………………
Edward M. Sabolsky, Assistant Professor,
West Virginia University, Morgantown, WV, USA
Committee Chair
……………………………………………… …………………………
Ismail Celik, Professor,
West Virginia University, Morgantown, WV, USA
……………………………………………… …………………………
Bruce Kang, Professor,
West Virginia University, Morgantown, WV, USA

ii
DEDICATION
In loving memory of my paternal grandparents, Mr. & Mrs. Mark Iyere Aisuebeogun

iii
TABLE OF CONTENTS
LIST OF TABLES v
LIST OF FIGURES vii
ACKNOWLEDGEMENTS xi
1.0 Introduction and Statement of the Objective 1
1.1 Goals of Research 4
1.2 Thesis Organization 5
2.0 BACKGROUND AND LITERATURE REVIEW 6
2.1 Electrical Resistance Furnace 6
2.2 Microwave Furnace 8
- Microwave Generation
- Microwave Transmission
- Microwave Applicator
2.3 Microwave Irradiation 12
- Microwave Receptive Materials
2.4 Microwave Applications in Powder Ceramic Synthesis 18
2.5 Ceramic Synthesis 21
- Combustion Synthesis of Ceramics
- Carbothermal Synthesis
2.6 Calcium Carbide Investigation 24
- Production of calcium carbide
- Kinetics of Calcium Carbide Formation
3.0 EXPERIMENTAL DETAILS 33
3.1 General Experimental Description 33

iv
3.2 Raw Materials and their Characterization 33
3.3 Powder Processing 37
3.4 Reaction Apparatus Used for Study 38
- Reaction Crucibles - Reaction Crucibles
3.5 Experimental Procedure 43
3.6 Analysis of Samples 44
- Weight Loss Measurement - Density Measurement - X-ray Diffraction Phase Analysis: Qualitative and Quantitative - Scanning Electron Microscopy (SEM) - Gas Analytical Technique
4.0 RESULTS AND DISCUSSION 51
4.1 Heat Energy Transfer Study 51
4.2 Reaction Model Discussion 52
4.3 Carbo-thermic reduction via conventional heating technique 54
- Weight measurement and analysis
4.4 Chemical Reactions and Microwaves Heaving 73
5.0 CONCLUSIONS 80
6.0 FUTURE WORK 83
APPENDICES 85
REFERENCES 87

v
LIST OF TABLES
Table Page
2.1 Heating elements for electrical resistance furnaces [13]. 7
2.2 Dielectric constants and loss tangent of typical dielectric materials [14]. 17
2.3: Engineering materials produced by SHS method [27]. 20
2.4 Effect of microwave heating rate as a result of varying incident power level [31]. 23
3.1 Characteristics of experimental starting materials. 34
3.2 Summary of milling parameters for 3:1 stoichiometric mixture of starting materials. 37
4.1 Sample pre-treatment program per run in the furnace. 56
4.2 Influence of particle size and applied pellets (12.77 mm diameter, 2.5 mm thickness, 0.55 g
average mass of powder granules) compaction load on the weight loss at reaction temperature
1500⁰C and 460 minutes reaction time in argon environment. 60
4.3 Weight loss as a function temperature for various carbon sources used. All experiments done
at 60 minute hold time and the reacted samples placed in zirconia combustion crucibles.
4.4 Temperature study results in conventional furnace. 63
4.5 Temperature study results in conventional furnace. 63
4.6: Infrared pyrometer calibration in conventional furnace for apparent emissivity 78
measurements.

vi
5.1 Comparison of microwave and conventional carbo-thermic reduction of lime reactions 80
completed.
vii
LIST OF FIGURES
Figure Page
1.1 Commercially important chemicals and their principal derivatives and applications 2
derived from acetylene [24].
2.1 Top and sectional view of a magnetron heating tube [14] 10
2.2 Electromagnetic spectrum and frequencies used in microwave processing [16]. 13
The most used frequency for material processing is 2.45GHz.
2.3 Relationship between the dielectric loss factor and ability to absorb microwave 14
power for some common materials [13].
2.4 Temperature profile within the test sample in: (a) conventional heating, 22
(b) microwave heating and (c) microwave hybrid heating.
3.1 SEM of carbon coal obtained from WVU Coal Research Corporation. 34
3.2 SEM back-scattered image of 3:1 stoichiometric mixture of graphite and lime 35
powder (Alfa Aesar).
3.3 XRD patterns of reagent grade calcium oxide (lime), graphite and the 3:1 36
stoichiometric mixture of both graphite and lime powder (Alfa Aesar).
3.4 XPS survey scan for 3:1 stoichiometric mixture of both graphite and lime 36
powder (Alfa Aesar supplies); Stable carbon peak formed at 284.5 eV as revealed from the
detailed scans for C1s, Ca2p and O1s.

viii
3.5: Low Voltage Nabertherm High-Temperature tube furnace model series RHTH. 40
3.6 Typical temperature profile of the conventional furnace; this represent a 40
temperature for experiment ramped up to 1800°C with 60 minutes exposure time then
allowed to cool down to room temperature.
3.7 Microwave Furnace Heating System; 12kW, 2.45GHz donated by Hadron 42
Technologies Inc.
3.8 Typical temperature profile obtained during microwave heating of C-CaO mixture 42
and power level used.
3.9 Insulating package for microwave reaction (Note: Not drawn to scale). 43
3.10 Gas generation and collection apparatus (Vacuum pump is detached). 49
3.11 PerkinElmer® Clarus® 580 Gas Chromatograph (GC) used to analyze 50
products obtained after hydrolysis in DI water. Sample trapped in an air-tight syringes
(Model: 1100 Gastight syringes, Hamilton Company, Reno, NV) and then attached to
the gas sampling port on the side of the GC.
4.1 Temperature measurement profile for various sample thickness. 52
4.2 XRD pattern for sample (pre-treated before ball milling) with Ca(OH)2 impurities. 55
Mass compositions of phases present were quantified by Rietveld technique and the calculated
amount of moisture picked up is 24.29% of initial mass. The bottom parts of the graph shows the
residue which is used to determine the goodness of the fit.

ix
4.3 Rietveld quantification of heat-treated sample mixture before introduction into the 56
furnace.
4.4 Influence of crucible configuration and particle size as a function of temperature 58
on the weight loss of reaction completed. Graphite crucible with and without lids were
used in this study.
4.5 XPS surface analysis technique depth profile scan for 1/3 carbon and calcium oxide 60
mixture reacted at 1500⁰C for 60 minutes. The surface was sputtered to make sure that carbon
detected is from the sample, not contaminant.
4.6 Weight loss as a function of temperature. All experiments were held at 60 64
and 120 minutes.
4.7 Relation between weight loss and exposure time. 64
4.8 Relation between actual conversion and exposure time. 66
4.9: Relation between (1−∛((1)−�))^2 and reaction time for 8µm particle sized 1/3 67
mixture of C and CaO .
4.10: Relation between logarithm apparent reaction kinetic constants against the 68
reciprocal of the reaction temperatures. Break-point at 1635⁰C.
4.11: XRD of ball-milled lime and carbon (graphite) mixture after reaction-1800⁰C. 69
Three CaC2 modifications identified.
4.12: SEM of ball-milled lime and carbon (graphite) mixture after reaction @ 1800⁰C 70
4.13: SEM of ball-milled lime and carbon (graphite) mixture after reaction @ 1700⁰C 70

x
4.14: SEM of ball-milled lime and carbon (graphite) mixture after reaction @ 1600⁰C 71
4.15: SEM of ball-milled lime and carbon (graphite) mixture after reaction @ 1800⁰C 71
4.16: Percent weight loss as a function of maximum microwave furnace temperature. 77
4.17: Comparison of calcium carbide yields in conventional tube and microwave 77
furnaces.
4.18: Comparison of calcium oxide consumed via microwave (MW) and conventional 78
heating.

xi
ACKNOWLEDGEMENTS
I would like to thank Dr. Sabolsky for his guidance, encouragement and patience throughout this
research work. I would also extend my appreciation to Dr. Celik and Dr. Kang for their inputs
and evaluation of my thesis.
I thank every member of our research group (present and past members) for their helpful
discussions about this work, for assistance with equipment and most of all for their friendship. I
would especially like to thank Dr. Steve Rowan for several helpful discussions on this work. I
also thank Dr. Singh for his assistance in using the GC equipment.
I would also like to thank my family for their love and support through all of my endeavors in
my life. I am especially grateful to my dad as well as Mr. Kehinde Phillips and Mrs. Michelle
Ukoh, that encouraged me to reevaluate my plans after undergraduate school and attend WVU
and for their all-round support.
I would also like to acknowledge LP Amina for supporting this research and Hadron
Technologies for the microwave furnace donation for this work.
This technical effort was performed in support of the US-China Clean Energy Research Center–
Advanced Coal Technology Consortium’s (CERC-ACTC) ongoing research in coal-to-chemical
conversion processes under the DOE contract DE-PI0000017.
1
1.0 Introduction-statement of the objective
The chemical industry is one of the largest industries in the United States and it is energy driven.
The industry heavily relies upon energy inputs for raw materials processing as well as for fuel
and power. In a bid to diversify the energy and chemical markets, and subsequently reduce its
complete reliance on oil and natural gas, attention is once more been turned to calcium carbide,
CaC2 formed from cheap carbon sources (e.g. coal, coal char, etc.), to produce acetylene which
will serve as a viable, cheap and clean alternative source of energy and chemical industry
feedstock, having been the mainstay in the early 1900s. World production of acetylene peaked
between 1960 and 1970 [24].
Calcium carbide is regarded an economic route to acetylene production industrially; combined
with water to generate acetylene according to reaction 1 below:
CaC2 (s) + 2H2O (l) <=> C2H2 (g) + Ca (OH) 2 (s) (1)
An approximately 80% of the acetylene produced using calcium carbide are used for chemical
related synthesis in the United States [1].
China also relies on acetylene to a large extent as an industrial fuel, mainly because it costs less
to make and use domestically than to import petroleum products for the same purpose. China’s
interest is based on the abundance of large deposit of both coal and lime stones resources locally,
which can be used to cheaply produce calcium carbide.
Acetylene is known as an essential chemical building block with increasing prominent
applications as a raw material in the production of important organic compounds such as vinyl
chloride monomer, acetic acid and anhydride and 1,4 butanediol. A list of commercially

2
important chemicals and their principal derivatives and applications are shown in Figure 1.1
[24].
Figure 1.1: Commercially important chemicals and their principal derivatives and applications derived from
acetylene [24].
Additionally, non-chemical related industrial usage of acetylene makes up about 20% in the
United States: oxy-acetylene welding and metal cutting, materials heat-treatment and production
of carbon for batteries. Iron and steel industry also use calcium carbide in steel desulphurization
and as flux agent in steel making [1].
Calcium carbide can be prepared by carbo-thermal reduction of metal oxides, direct reaction
between metal elements and carbon, and gas phase reaction of metal halides and appropriate
hydrocarbons [2]. For instance, some authors have reported syntheses of CaC2 from coal, coal
char, graphite and bio char as their carbon source [2-11]. However, most of the CaC2 produced

3
via these processes involved long carbo-thermic reactions (which take several hours) of CaO and
carbon source at temperatures in excess of 2000⁰C in industrial furnaces. Carbo-thermic
reduction of lime is known and believed to be a very simple and economical process for the
synthesis of CaC2 because of the availability of cheap raw materials used as precursors [11];
however, the high temperatures and long heating times required, mainly due to the inefficient
nature of the heat transfer between the heat source and the reaction charge, makes this process a
very energy-intensive synthesis route. Therefore, this process is less attractive in commercial
terms, considering the power consumption requirements to run the industrial furnaces that
provide the heat to cause the reaction. Consequently, there is much interest in the possible
formation of calcium carbide at a lower cost of production, with less energy usage and at
relatively lower temperature ranges with high yield and purity by other means [58].
Alternative synthesis routes that can provide a wide range of comparative advantages are being
explored. Microwave heating seems a suitable option comparatively. The use of microwave
energy has attracted significant attention in recent years as an alternative method for processing
materials. In the past decades, carbide, oxide, and nitride materials have been synthesized using
microwave heating techniques. One of the most important reasons for this is the potential for the
reduction in manufacturing costs due to shorter processing times, such as ultra-rapid
heating/cooling rates and shorter reaction times.
Microwave heating of materials as an alternative solid-state synthesis route provides faster
heating and cooling rates including volumetric heating of large and small samples which in turn
eliminate damage usually caused by thermal gradient commonly experienced with conventional

4
methods. Microwave synthesis does offer a fast and efficient means of processing certain
ceramic carbide powders; however, there is need to carefully select the ceramic system, given the
inability to combine microwaves with a vacuum environment.
1.1 Goals of Research
The main focus of this research is to obtain experimental data and measure conversion rates for
calcium carbide formation at 1000-2200°C to compliment and substantiate modeling work. The
objectives of these exploratory works are thus:
1) Characterize the reaction rates of carbon and calcium oxide precursors with various size
ratios and chemistries,
2) Develop a method to obtain kinetic reaction constants and draw a correlation between the
particle characteristics and the kinetic constants, and
3) Investigate the reaction mechanism and effect on kinetic constants by utilizing
microwave heating (in comparison to conventional convection heating).
In order to address these set objectives, the following tasks were required to be completed in this
research:
1) Directly synthesize calcium carbide in conventional and microwave furnace by
reducing effective volume to minimize vaporization.
2) Investigate the reaction and how it may change depending upon precursor
characteristics and heating method.
3) Research the influence of solid-solid surface contact and mass fraction.
4) Investigate the role of morphology and microstructural differences.

5
5) Investigate an alternative low cost, repeatable fabrication technique for calcium
carbide formation.
1.2 Thesis Organization
This thesis is composed of six chapters. The first chapter is an overview of the exploratory
research work: the essence of this research work; importance to the energy world and what tasks
needed to be completed in order to achieve these set objectives. Chapter two provides a detailed
background of refractory ceramics, heating techniques and methods, previous and current
synthesis approach and materials used. The synthesis, preparation, and characterization
methodology of the formed calcium carbide are covered in Chapter three. In chapter four, results
obtained in the course of this work are reported and discussed. Chapter five concludes the
objectives of the project completed while chapter 6 presents the future areas to continue the
work.

6
2.0 Background and Literature Review
Over the past decades, the ceramic industry has seen a rising interest in the processing and
synthesis of fine particles, with high-tech ceramic materials applications been the driving force.
Usually high temperatures (> 1200⁰C) are required for synthesis by both solid-state and liquid-
phase processes. Most of these reactions are usually completed inside furnaces which rely on
heat energy from fuel combustion, electricity, induction heating etc. Laboratory and industrial
scale furnaces, irrespective of sizes, are vital machine tools that serve as heat source for material
processing, heat treatment or sintering in laboratory, industrial and engineering applications [12,
17]. The needed heat to cause material transformation or refinement is supplied through direct,
indirect or hybrid heating of the materials or article inside a furnace compartment.
2.1 Electrical Resistance Furnace
Furnaces are devices use to apply heat to a material in order to cause a change in form and/or
properties. Electrical resistance furnace uses the principle of direct or indirect heating. An
electric resistance furnace is capable of operating at temperatures up to 2075°C in vacuum or in
hydrogen or noble-gas atmospheres. Problems of outgassing and atmosphere contamination by
furnace materials are largely circumvented by eliminating insulation [25].
In direct-heat electric furnaces, materials to be heated are used as the resistor, while the insulated
enclosure of the furnace is used to retain the heat. In contrast, the heating method in a resistance
furnace that uses indirect heating is such that electric current passes through the heating element,
or directly through metallic material and its internal resistance opposes the flow of current to
produce the needed heat. Materials with high thermal conductivity and stability, low vapor
pressure at elevated temperature are used as heating elements and some examples of the ones in
7
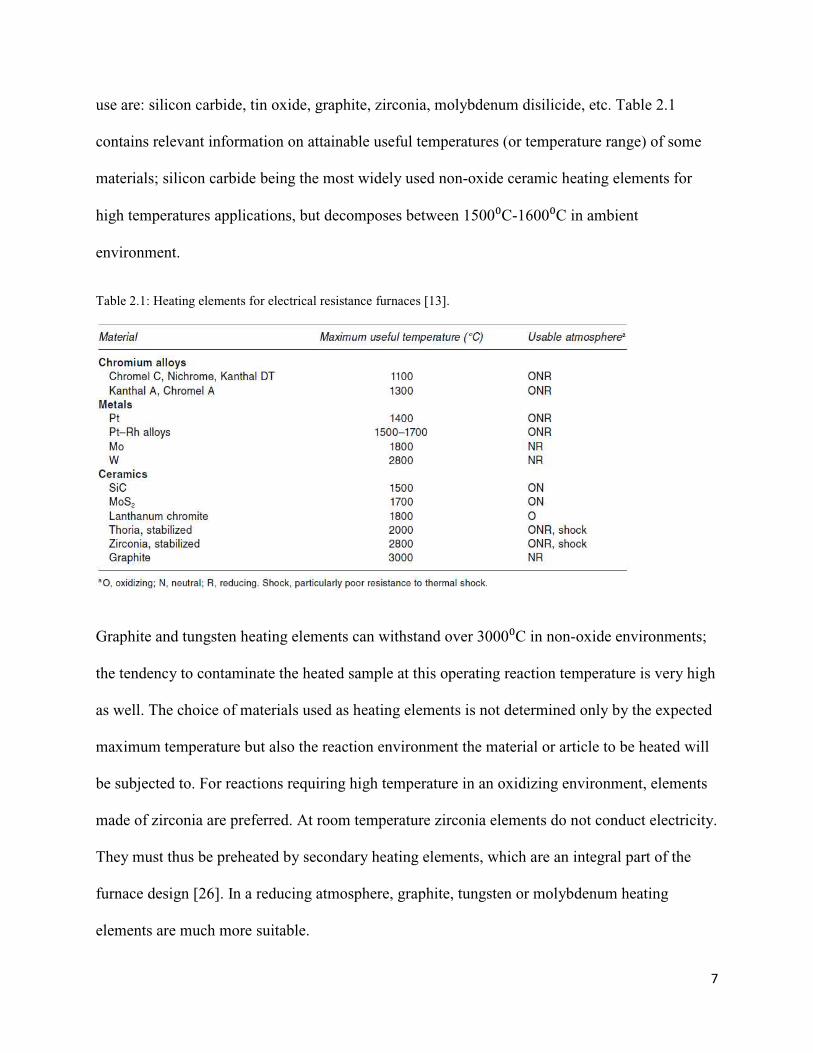
use are: silicon carbide, tin oxide, graphite, zirconia, molybdenum disilicide, etc. Table 2.1
contains relevant information on attainable useful temperatures (or temperature range) of some
materials; silicon carbide being the most widely used non-oxide ceramic heating elements for
high temperatures applications, but decomposes between 1500⁰C-1600⁰C in ambient
environment.
Table 2.1: Heating elements for electrical resistance furnaces [13].
Graphite and tungsten heating elements can withstand over 3000⁰C in non-oxide environments;
the tendency to contaminate the heated sample at this operating reaction temperature is very high
as well. The choice of materials used as heating elements is not determined only by the expected
maximum temperature but also the reaction environment the material or article to be heated will
be subjected to. For reactions requiring high temperature in an oxidizing environment, elements
made of zirconia are preferred. At room temperature zirconia elements do not conduct electricity.
They must thus be preheated by secondary heating elements, which are an integral part of the
furnace design [26]. In a reducing atmosphere, graphite, tungsten or molybdenum heating
elements are much more suitable.
8
The mode of heat transfer inside a resistance furnace is by convection, radiation and conduction.
Heat energy generated is transferred to the material to be heated from the set of heating elements
or a heating mantle of various design configurations. This mode of heat transfer to the article to
be heated constitute a major challenge as experienced in heating of larger ceramic samples; it
usually takes longer time to reach required temperature in the inner core as heat is transferred
from the material surfaces. Thermal stress in the material caused by thermal gradients as a result
of this type of heating (convection and conduction) to a ceramic bulk is also of utmost concern to
researchers. Other concerns about conventional heating mechanism are the use of expensive
heating elements and the high cost of energy needed to run large industrial electric furnaces over
a long period of time.
2.2 Microwave Furnace
Microwave furnaces are electromagnetic furnaces with the capability to generate indirect heating
through higher frequencies. Generally, adopted microwave frequency for large industrial
production is 915 MHz. For smaller production scale, scientific and domestic purposes, the
worldwide adopted microwave frequency is 2450 MHz (2.45 GHz) [35]. The difference between
Domestic Microwave Oven, DMO and the industrial ovens is in their power input. The
maximum allowable power for domestic applications is 700 W while about 6 kW for industrial
microwave oven. In contrast to the conventional furnace mode of energy transfer into the
experimental sample, microwave energy generated is transferred to the material to be heated
through molecular interaction with electro-magnetic field within the material. What is seen in the
conventional furnace is that thermal energy is transferred into a reaction system by using
electricity, gas or coal combustion to heat up the heating mantle or elements; this in turn heats up
the vessel, and the vessel then heats up the reaction mixture until it attain homogenous
9
temperature with a possibility of some thermal gradients [48]. This thermal energy will supply
the necessary energy to the reaction mixture to cause the product formation. The mechanism of
energy transfer in a microwave is however significantly different. Microwave energy heats the
sample through direct activation. Instead of heating the microwave, then the vessel, energy is
transferred to the reaction components within the solution, providing two different benefits:
• More efficient energy transfers to the reaction mixture, instead of the vessel.
• Reaction components at the center of the reaction are heated at the same rate as reactants
near the walls of the vessel [48].
This energy is much more precise and can be controlled to a specific region in a material.
Microwave heating can be used to form new materials by initiating chemical reactions through
selective heating of materials. The three major components of a microwave furnace are: the
source, the transmission lines and the applicator [14].
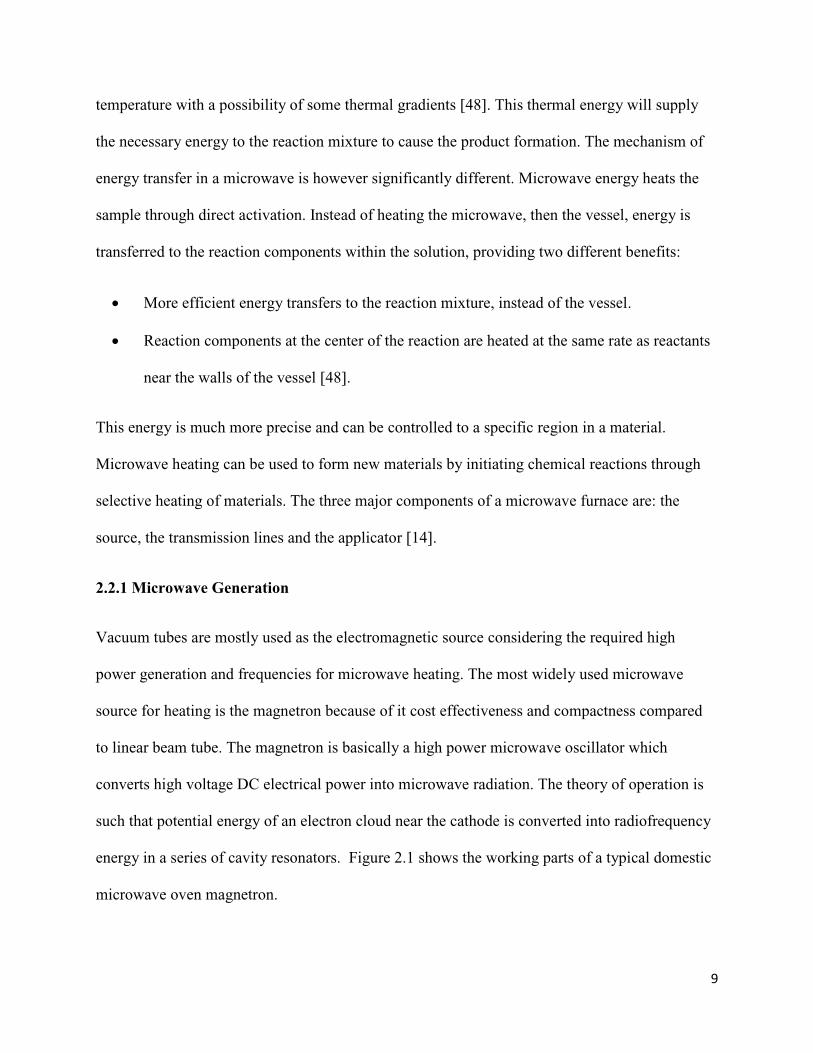
2.2.1 Microwave Generation
Vacuum tubes are mostly used as the electromagnetic source considering the required high
power generation and frequencies for microwave heating. The most widely used microwave
source for heating is the magnetron because of it cost effectiveness and compactness compared
to linear beam tube. The magnetron is basically a high power microwave oscillator which
converts high voltage DC electrical power into microwave radiation. The theory of operation is
such that potential energy of an electron cloud near the cathode is converted into radiofrequency
energy in a series of cavity resonators. Figure 2.1 shows the working parts of a typical domestic
microwave oven magnetron.
10
Figure 2.1: Top and sectional view of a magnetron heating tube [14].
Characteristically, magnetrons heating source operates at about 60 to 65% efficiency. The output
power of the magnetron can be controlled by adjusting the period of operation or adjusting the
cathode current or magnetic field strength, and is limited by the anode temperature. The excess
11
energy generated in heating the anode and cathode is removed by radiative fins (at 2.45 GHz, air-
cooled anodes can be used up to about 1.5 kW) or a circulating water jacket (for higher power
densities, up to 6 kW) [14, 48]. The other types of common microwave generating sources are
Klystrons and Traveling wave tubes (applications are found in variable-frequency microwave
furnaces).
2.2.2 Microwave Transmission
Generated radiation as a result of accelerated electrons has to be channeled in the direction of the
material sample to be heated inside the furnace chamber of the microwave oven. The two
transmission devices commonly used are determined by the frequency required. For low power
(lower frequencies), coaxial cable is used extensively; for communication, whereas high power
operating devices require hollow metal tubes, because of the high current density. Two modes of
microwave propagation are possible in waveguides: transverse electric (TE) and transverse
magnetic (TM). Other components used for protection purposes are the circulators, directional
couplers and turners [14, 48].
2.2.3. Microwave Applicator
Microwave energy from the waveguide is transferred to the material sample with the aid of the
applicator. The temperature fields within the material undergoing microwave heating are
inherently linked to the distribution of the electric fields within the applicator. The cavity in
which the material sample is laced is considered an applicator as well. There are several types of
applicators, with the common ones including waveguides, traveling wave applicators, single
mode cavities, and multi-mode cavities [14].

12
For processing materials, resonant applicators, such as single mode and multi-mode applicators,
are the most common because of their high field strengths. The type of applicator used in a
microwave processing system often depends on the materials to be processed. Commercially
available single mode, multi-mode, and variable frequency multi-mode processing systems are
all used for microwave processing research, and each of these systems has advantages and
disadvantages. Single-mode applicators are ideal for heating small volumes; multimode
applicators are used for processing larger samples, where more uniform heating is desirable. The
way a sample is placed within the cavity also affects the heating efficiency and uniformity;
therefore turntables are used to move the material sample through the field thereby lessen hot
and cold spot effects. In addition, mode stirrers (rotating metallic blades) are also employed to
obtain more uniform heating by perturbing the electrical field within the cavity [14].
2.3 Microwave Irradiation
A non-ionizing electromagnetic radiation with 1 m to 1 mm in wavelength corresponding to a
frequency of 300 to 300 GHz in the electromagnetic spectrum (as shown in figure 2.2) is known
as microwave radiation. Although microwaves can travel at the speed of light, microwave
however varies in length, based on frequency. There are four frequencies that are allowed by the
government for commercial microwave use: 915 MHz, 2450 MHz, 5800 MHz, and 22,125 MHz.
The frequency 2450 MHz has a length of 12.2 cm, which has an appropriate penetration depth
(the distance a microwave can travel into a standard sample), for use with small samples [48]. It
was the work of Professor Richard Gedye, Professor Raymond J. Giguere and George Majetich
in 1986 that first detailed its application in reactions, in contrast to available conventional
heating techniques [48, 49].

13
Figure 2.2: Electromagnetic spectrum and frequencies used in microwave processing [16]. The most used frequency
for material processing is 2.45GHz.
Microwave energy is a form of electromagnetic energy deposited in materials that couple with
microwaves, absorb the electromagnetic energy volumetrically, and transform this energy into
heat. This heating technique is not the same with the conventional heating methods whereby heat
is transferred between objects by the mechanisms of conduction, radiation and conduction, from
the material’s surfaces, then transferred to the core of the material. In contrast, microwave
heating generates heat within the material first and then heats the entire volume of the material
with the elimination of temperature gradient that generally exists with the conventional
approach. In comparison to x-rays, ultra violet and infrared, this form of energy does not break
atomic bonding; instead it causes the bonds to rotate in a material or causes dipoles end/or ions
to change their orientation/movement in phase with the electromagnetic field because of it low
frequency.

14
2.3.1 Microwave Receptive Materials
In the microwave field, materials are classified as transparent, opaque, absorbing and/or mixed-
absorber based on their ability to transmit or allow an electric field through them. Both electric
and magnetic properties of any material determine whether microwave radiation will be
reflected, absorbed or transmitted. In figure 2.3, the degree of susceptibility to microwave energy
for various materials is shown. Microwave receptive materials experience rapid and volumetric
internal heating, with reduced thermal gradient, lower processing time and relatively low energy
usage due to the penetrating capabilities of the energy through the materials. This explains why
the reaction kinetics and sintering of materials susceptive to microwave energy are relatively
faster when compared to conventional process [15].
Figure 2.3: Relationship between the dielectric loss factor and ability to absorb microwave power for some
common materials [13].
Other materials like many ceramics that are transparent or poor absorbers of microwave energy
can be heated to a critical temperature to make them good microwave absorbers. This can be

15
achieved through the addition of microwave absorbing additives or second phases in these types
of ceramics.
To a large degree, the absorption capabilities of every material depend on its compositional
make-up (including structure defects inherent in the material) and temperature. The absorption
behavior of a material also depends on the dielectric constant and loss tangent properties of the
materials (dielectric properties); these properties are related to temperature, moisture content,
density and material geometry, and are useful in predicting power absorption and depth of
microwave penetration characteristics of any material in a microwave energy field. The loss
tangent (tanδ) indicates the ability of a material to be polarized and heated.
The complex permittivity, ɛ*, of a dielectric determines the amount of interaction with
microwave energy, through the real part (ɛr’) and the imaginary part (ɛeff’’). The relationship
between permittivity and the heating of the dielectric can be related to the power absorbed per
unit volume (W/m3) through the following equations [18]:
ɛ* = ɛ0 (ɛr’-jɛeff’’) (2.1)
tanδ = ���’’
�’’ (2.2)
P, power absorbed per unit volume (W/m3) /�/ 2�� � �’ tanδ/�/ (2.3)
Where E is the electric field, σ is the electrical conductivity, f is the microwave frequency,
ɛ0 is the permittivity of free space, ɛr’ is the relative dielectric constant, ɛeff’’ is the dielectric
loss, j = (-1)1/2 and tanδ is the loss tangent.

16
The penetration depth at one-half power, D, is a useful parameter to determine how microwaves
penetrate and propagate through an absorbing material (18):
� �� ��.���� � !"#$ �%�’ / %�$&/'
Where λ0 is the incident wavelength, ε0 is the permittivity of free space, εr’ is the relative
dielectric constant and tan δ is the loss tangent.
When microwave energy heats a material, the rate of temperature increase in the material can be
derived as follows [51]:
()*+ ,
-./
Where Cp is the specific heat of the material and ρ is the density of the material.
In table 2.2, the dielectric properties (dielectric constant and loss tangent values) for some
materials (highly absorptive materials (with tan δ≥10−1)); dielectric constant, έr that measures the
ability of the material to be electrically polarized by an applied electric field, are presented.
Other vital influences that control diffusion behavior in microwave receptive materials are the
synthesis environment and additives inclusion. Materials that show high conduction and no
dielectric properties are regarded as reflectors since they inhibit the propagation of
electromagnetic waves by reflection. Transparent materials are low dielectric loss materials
allowing for the passage of microwaves without any losses. Microwave absorbing materials have
high loss and absorb microwaves energy depending on dielectric loss factor. Fine ceramic
powder such as silicon carbide, zirconia carbide, aluminum nitride, magnesia, carbon and
(2.4)
(2.5)

17
vanadium oxide, have high loss tangent and as such, have the potential to couple with
microwaves at room temperature. While, low-loss materials such as alumina, titanium oxide,
Table 2.2: Dielectric constants and loss tangent of typical dielectric materials [14]
silicon nitride and zirconia require preheating beyond a critical temperature before coupling with
microwave energy.

18
Above a critical temperature, many materials experience an increase in their susceptibility as the
dielectric loss factor increases, microwave couple well with the material and this simply implies
that the heated materials also contribute additional heat during synthesis process [11, 18].
The use of some materials as subsectors (preheaters) during microwave heating depends on the
response rate of the material in absorbing microwave energy; this is especially useful to aid
reduction of heating rate and uniformity of sintering for ceramic insulators in most instances.
These susceptor materials are usually in coarse powder sand but they could actually be in solid
block as well, for example a rod like shape, for strategic placement in preferred position inside
the heating package. High dielectric loss materials such as silicon carbide with a high response
rate are most times used as sintering bed or packaging material for a ceramic insulator that only
absorbs microwave energy at elevated temperature. The configuration and arrangement of these
suceptor to be used per specific ceramic powder are important factors. For instance, a density as
high as 99% can be achieved for a zirconia specimen at 1100⁰C sintering temperature [19, 20].
2.4 Microwave Applications in Powder Ceramic Synthesis
Sutton [18] first gave an insight into microwave applicability in ceramics processing in 1975, but
experimental research on processing ceramics using microwave heating actually commenced in
mid-1960. Ever since, researchers’ interests especially in high temperature applications have
been on the rise. Development of microwave heating technology thus commenced in the middle
to late period of the 1980’s, its advantage over existing conventional heating methods which is
characterized by fast densification and processing time for ceramic materials such as oxides,
mixed oxides, non-oxides, composite ceramics, etc. [30] continued to draw researchers’ interests.
The heating mechanism fundamentally distinguished both the microwave and available
19
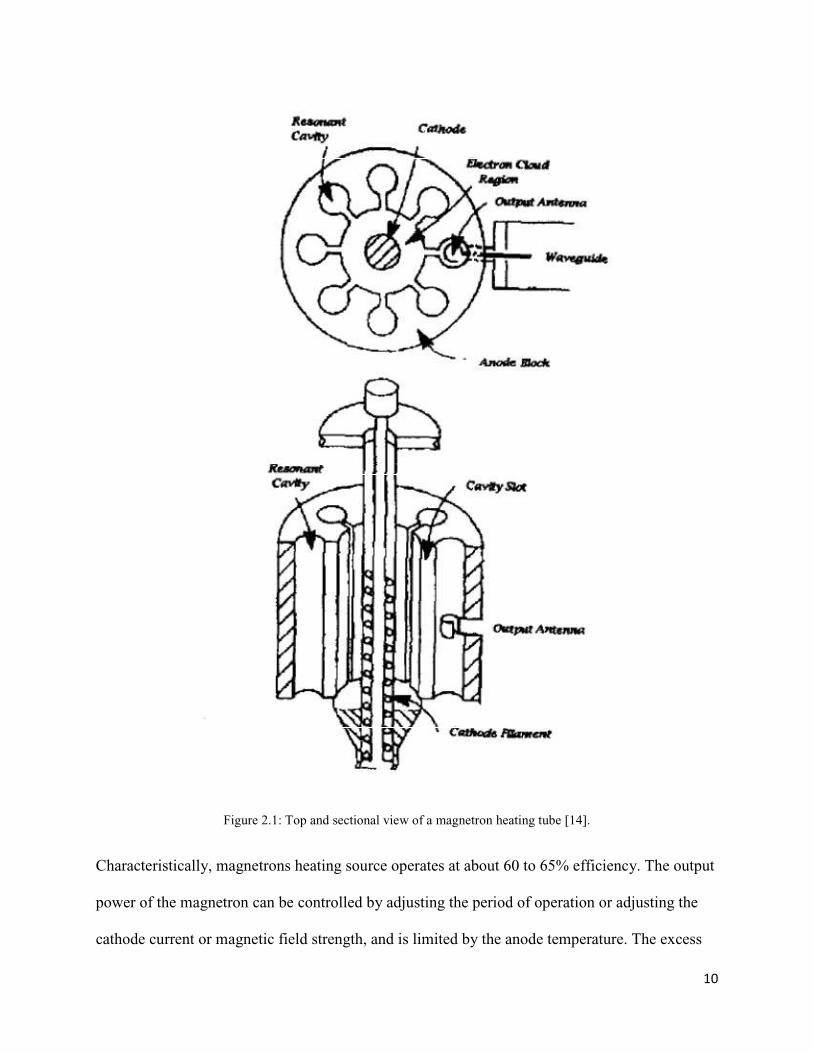
conventional methods. Figure 2.4 compares the temperature profile found in three different
modification of heating mechanism. In figure 2.4a, heat transfer mode is by radiation, conduction
and convection, typical conventional heating technique; in figure 2.4b, the sample absorbs
electromagnetic energy and generates heat from inside, and in figure 2.4c, a hybrid heating
mechanism that combines both microwave heating coupled with an external heating source.
Figure 2.4 Temperature profile within the test sample in: (a) conventional heating, (b) microwave heating and (c)
microwave hybrid heating [16].
Microwave processing of materials consume much lower energy to reach a higher heating rate
thus reduce synthesis duration. One of the earliest data collections geared towards process
parameter predictability was carried out by investigating the effect of power level on microwave
heating characteristic on several materials [31] and tabulated as seen in table 2.4. Heating rate
was reported to increase as the power level varied (500-2000 W) for high lossy materials such as
PbS and Fe3O4, but did not heat very well for very low-loss materials such as SiO2 and CaCO3.
In addition, the thermal runaway effect was reported for the first time. The test was run in a
controlled environment and test samples used were in powder forms. The maximum attainable
temperature and the time required were reported as well. Special cases observed during these
tests where the maximum temperature were obtained indicated time interval, termination of
experiment when sample melted, termination of the experiment when sample arced, also when

20
temperature exceeded thermocouple limits, when sample not run in rapid heating rate at lower
temperature, when sample not run as a result of violent boiling, and at sample boiling were
represented as a, b, c, d, e, f, g and h (alphabets in superscript) as used in the table [31].
Table 2.4: Effect of microwave heating rate as a result of varying incident power level [31].
Microwave synthesis also intensifies diffusion process leading to better grain distribution which
is responsible for higher density and other improved mechanical properties observed in most
high-lossy materials processed.
When processing ceramics, it is important to regulate the heating rate of the impacting energy in
order to achieve desire properties. This will help prevent in-built thermal stresses that may lead
to an undesired sample failure or crack during or after processing. For ceramic materials that
required preheating because of their low microwave energy absorbability, the practice from
literature is to control the uniformity of the ceramic microstructure which depends on the rate of

21
heating, as non-uniform microwave heating could result in thermal runaway effect which could
fracture the material as well. This behavior is seen in ceramics that require preheating to a
critical temperature before microwave coupling due to their low loss factors. What is
experienced is that a local volume reaches the critical temperature before the rest of the material
bulk; that area tends to exhibit an increase in temperature as a result of this localized rapid
heating and possible thermal runaway. One means of avoiding this behavior is to heat up the
ceramic just before the critical temperature through a conventional heat transfer process.
Microwave processed samples are expected to yield higher densification, finer grains, phase
formation, uniform microstructure, better aspect ratio and improve hardness. High heating
temperature influenced the attainment of these properties and significant effort to reducing heat
loss through proper insulation and better configuration is required.
2.5 Ceramic Synthesis
Ceramics are classified as oxide and non-oxide based engineering materials. Several
technologies have been developed over the past decades for making non-agglomerated, small
particle sized ceramic powders. Ceramics materials have solid, liquid and vapor phase synthetic
approaches. The targeted crystal structure, material properties, process parameters and conditions
influence the choice to adopt. Researchers in recent times have developed novel techniques for
small sized-ceramic powder synthesis, which can be used directly to form compact bodies for
variety of industrial and technological applications.
The properties of small-size structures of a material differ from that of the conventional bulk
materials due to their large surface-to-volume ratios [12]. However, the unusual mechanical and
electrical properties behavior experienced in some small sized-ceramics are as a result of the

22
combination of a relatively grain boundary arrangement along with the interactions of electrons
or dislocations. Some of the successful synthesis routes used thus far to process ceramics include
combustion, mechanochemical, carbothermal and Pechini’s methods.
2.5.1. Combustion Synthesis of Ceramics
Combustion synthesis methods are self-sustaining highly exothermic chemical reactions that
complete in minutes or seconds, for synthesizing a variety of oxide ceramics. Combustion
synthesis methods are very versatile for making all sorts of advanced materials, including
ceramics powder with various grain morphologies (lamellar, rod-like, etc.) [21] And several
types exist: Self-propagating high temperature synthesis (SHS), low-temperature combustion
synthesis (LCS), gel combustion, emulsion combustion, solution combustion synthesis (SCS),
etc.
The self-propagating high-temperature synthesis (SHS) has been applied to make varieties of
materials as enumerated in table 2.3. It has high rate of production, low energy usage and simple
processing steps. Depending upon the expected product, small-particle sized ceramic powder can
be prepared either in air or in a high pressure nitrogen environment. Two steps are involved:
thorough blending of starting materials and auto-ignition. When heat is applied to a mixture of
reactant powders, the activation energy for combustion is overcome, triggering a chemical
reaction [50]. Powders are milled to the desired particles sizes before synthesis; their
characteristics are primarily governed by heat of combustion and gas evolution. In this solid state
reaction technique, the reaction is activated by heat energy [18] and this heat energy is released
to cause reaction sequence among layers of reactant mixture. Desired end products can be
obtained by simply manipulating the chemistry and reaction conditions.
23
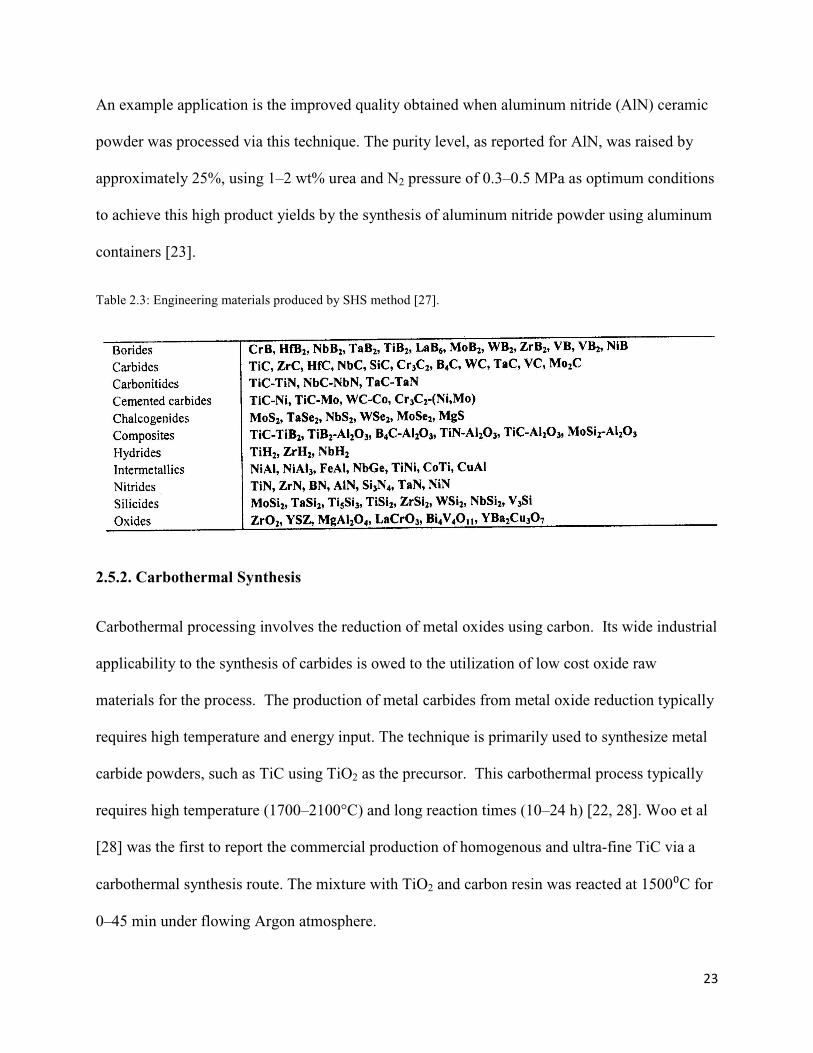
An example application is the improved quality obtained when aluminum nitride (AlN) ceramic
powder was processed via this technique. The purity level, as reported for AlN, was raised by
approximately 25%, using 1–2 wt% urea and N2 pressure of 0.3–0.5 MPa as optimum conditions
to achieve this high product yields by the synthesis of aluminum nitride powder using aluminum
containers [23].
Table 2.3: Engineering materials produced by SHS method [27].
2.5.2. Carbothermal Synthesis
Carbothermal processing involves the reduction of metal oxides using carbon. Its wide industrial
applicability to the synthesis of carbides is owed to the utilization of low cost oxide raw
materials for the process. The production of metal carbides from metal oxide reduction typically
requires high temperature and energy input. The technique is primarily used to synthesize metal
carbide powders, such as TiC using TiO2 as the precursor. This carbothermal process typically
requires high temperature (1700–2100°C) and long reaction times (10–24 h) [22, 28]. Woo et al
[28] was the first to report the commercial production of homogenous and ultra-fine TiC via a
carbothermal synthesis route. The mixture with TiO2 and carbon resin was reacted at 1500⁰C for
0–45 min under flowing Argon atmosphere.
24
The consumption of carbon in carbothermal reactions can be monitored theoretically by
measuring the weight loss, which defines the conversion degree. The amount of gasses generated
using reaction II is proportional to the carbon having reacted. It is calculated by the ratio of
the measured weight loss to its theoretical maximum value using the following equation:
0 ∆232
Where (∆m) is the mass loss measured, (m) the mass of carbon introduced and (a), a coefficient
characteristic of the reaction. The value of (a) is determined stoichiometrically [7].
2.6 Calcium Carbide Investigation
Calcium carbide is an important compound with a molecular formula CaC2. Pure form of
calcium carbide is colorless. It physical appearance depends on the level of purity and the
manufacturing technique used. Its properties include a high melting point (2160 °C) and high
boiling point (2300 °C). It has a density of 2.22 g/cm3 at 180oC. Four phases exist in the calcium
carbide (Ca-C) system. Three structurally ordered modifications are known at room temperature
and the disordered form IV at high temperature [34]. The crystal structure of CaC2-I is tetragonal
while CaC2-II is monoclinic. CaC2-II is considered the low temperature ground state of CaC2
[34]. The common crystalline form I at room temperature is a distorted rock-salt structure.
2.6.1 Production of Calcium Carbide
Literature review reveals a number of synthesis routes for making polycrystalline carbides. But
the first means and method for the production in an electric arc furnace was discovered and
demonstrated through the independent effort of T. L Willson and H. Moissan in 1888 and 1892.
(2.6)

25
Although CaC2 was formed as a side reaction product in various industrial processes, it was
neither isolated nor recognized. The generally accepted reaction for the formation is represented
as reaction (II) below:
3C (s) + CaO (s) <=> CaC2 (s) + CO (g) (II)
It was made from lime and coke in the electric furnace at temperature in excess of 2200°C, using
large amount of electric power. Since that time, the basic chemical method used to make the
material has not changed and has a heat of reaction of about 445.6 kJ/mole at an atmospheric
pressure but typically requires 4000 kWh/t of CaC2 = 923 kJ/mole in the prior art (39).
Although calcium carbide has many industrial applications as mentioned before, it is
predominantly mass produced for the production of the flammable gas acetylene. It has also
recently found new applications as a binder used on mechanical properties of concrete [37].
Unlike all powder ceramics highlighted thus far, most metal carbide synthesis and processing
methods reported till date are still completed at high temperature over a longer period of reaction
time. An example is seen in the solid state formation of calcium carbide from calcium oxide and
carbon precursors found in literature, which involved pressing powder mixture into cylindrical
pellets of a 3/1 mole mixture of carbon and lime between 1650°C and 1720°C at 50 mm Hg CO
pressure [7]. The difficulties in this conventional synthesis method are as mentioned before, high
temperatures and longer duration of the experiment.
There have been a number of patents granted in a direct effort to develop more efficient
techniques and synthesis routes for the production of calcium carbide using different furnace
designs and heating mechanisms. One is the preparation of calcium carbide in a shaft furnace by

26
W. Van Loon et al. granted in the year 1956. In their work, a mixture of fuel, which the main
constituent was carbon such coal, anthracite or charcoal with unslaked lime, dolomite and
limestone were fed into the shaft from the top of the furnace with the heat supply by burning part
of the fuel present by means of oxygen-containing blast injected into the furnace. The products
formed were collected at the lower part of the furnace. This process is complex and not
ecofriendly coupled with huge power consumption considering the complexity of their furnace
design and the energy sources.
In 1986, Sune Eriksson patented a method of manufacturing calcium carbide from powdered
lime and/or limestone. He injected powdered lime material together with a reducing agent, which
is optional, with the aid of a carrier gas into a plasma gas generated by a plasma generator. CO
and H2 where used as carrier gas and plasma gas respectively. Coke, charcoal, petroleum coke
and/or carbon black are suitable as reducing agent in piece form and the plasma gas used in the
process suitably consists of process gas recirculated from the reaction zone. The electric power
supplied was 1000 kW. 4 kg CaO/min was fed in as raw material and as reducing agent 3 kg coal
powder per minute and 0.4 kg coke per minute. For every 500 kg technical carbide produced
during the experiment, 78% CaC2 content was realized. The mean electricity consumption was 4
kWh per kg carbide produced.
El-Naas et al. also reported a 30% calcium carbide yield due to melting and agglomeration of
particles in the plasma zone [3]. In their work, they utilized a semi-batch fluid bed reactor with a
DC plasma torch. The precursors used were calcium oxide powder with a mean particle size of
about 170 µm which was reacted with two types of graphite, coke and methane. Argon gas was
used to initiate the plasma and hydrogen gas was then added to increase the power and raise the
plasma jet enthalpy. One of the best yield methods reported is by auto-thermal heating process

27
through the combustion of chars, with a considerably reduced temperature of about 500⁰C. 97%
CaC2 purity reported. The shortened reaction time and increase thermal efficiency in the
conversion of the fine biochar was achieved compared to a 2200⁰C reaction temperature for 1-2
h used in a conventional electric arc furnace [36]. These constraints inevitably resulted in high
energy cost and therefore make this route less attractive in commercial terms. Another drawback
is that the raw material must be in piece form, thus limiting the materials available because these
materials are cheaper in fine grained forms.
In addition to high power consumption and production cost usually associated with these
conventional techniques: auto-thermal, induction, plasma, electric and rotary arc found in prior
arts, impurities such as Ca, CaO, CaCO3, Ca(OH)2, amorphous carbon, graphite, etc are still
significantly present in the final product of some the works carried out, with some of these
impurities unavoidable considering the use of additive to aid some of these reactions and
process. If we consider electrodes in electric furnace that experienced partial worn out, these
take part in the process as contributing element in the form of carbon.
Another patented technology developed to address most of the challenges associated with
conventional was microwave heating. Prior arts used microwave heating for drying or sintering
until Lewis R. Finell and Tom E. Fuller (1985) patented a process for the production of a carbide
by-product with microwave energy and aluminum by electrolysis. Their effort at that time was
geared towards the principle that materials which are not susceptible to microwave heating will
be heated by placing it close enough to another material susceptible to microwave radiation.
Their art revealed that when there are two more reactants provided, where one is susceptible to
microwave radiation; microwave energy can be employed to bring about a chemical reaction.

28
Although there was no mention of the specific energy consumption in the patent abstract, one
would expect high energy consumption due to the complexity of their design. Other lacking
information in their work included: reaction mechanism, experimental observation,
quantification, reducing environment, starting materials form, specific temperature, reaction rate
and time.
Fine carbon materials in powder form are very good absorber of microwave (easily heated by
microwave radiation), and can heat other materials indirectly, or act as a catalyst and microwave
receptor in different heterogeneous reaction (33, 40). Chen et al. (1984) reported carbon to heat
in 0.2 min to 1000°C temperature. Reagent grades calcium oxide and calcium carbonate are
classified as inactive because of their absorbability of microwave irradiation as both reached
200°C and130°C, respectively, at the rate of 5°C/min (41).
2.6.2 Kinetics of Calcium Carbide Formation
Overall reaction representation for the formation of calcium carbide has been given above as
reaction II. This reaction falls in the category of non-catalytic gas-solid and solid-solid reactions
whereby solid reactants lead to gas and solid products. It is expected that this solid-solid reaction
should proceed through gaseous intermediates as in the case of the carbon reduction of metal
oxides.
Kemeyama (1956) proposed a two-step reaction mechanism (42):
CaO + C � Ca (g) + CO (III)
Ca (g) + 2C � CaC2 (IV)

29
These reactions are considered to proceed in two main steps: initiation and gas-solid reaction.
The first step is based on the ionization degree of carbon and subsequent diffusion into the lime
particles and forms various calcium vapor sites. Accessible carbon surface area was found to be
the main parameter in the stage. Studies show that step three and four reaction rates depend on
the area of contact between CaO and C (43), which implies that percent yield is proportional to
the rate of calcium vaporization. When Inou and Kameyama applied this technique to produce
CaC2, percent purity was 97 at 1700°C at 100 mm-Hg pressure in 1 h reaction time. Further
investigations from past work revealed that in addition to CO evolution, loss of vaporized
calcium also contributed to weight loss. The relationship is approximately linear with time, with
the velocity of the reaction doubled for every 32-34°C rise in temperature.
The second step of the reaction is diffusion-controlled; vaporized calcium migrates through the
layers of formed CaC2. Since this reaction is reversible, the chances of CaC2 decomposition into
its constituent’s elements increases as temperature increases, with increase and rapid
decomposition at 2200°C.
Tagawa and Sugawara (1962) work on the formation of calcium carbide in a solid state reaction
of calcium oxide with carbon in pellet forms, establishing that the reaction followed parabolic
kinetics model and that the rate of the reaction was governed by the diffusion of gas through the
product layer, as well as the diffusion of solids into the solid bulk and product layers [8].
Brookes, et al (1975) used a zero dimensional model for the formation of calcium carbide in
solid pellets based on the argument that the rate of movement of a reaction front through the
solid pellet is controlled by the heat transfer across a growing product layer [7].

30
[58] Mu and Hard (1987) examined the process of making acetylene from calcium carbide
created using a rotary kiln process, finding that it required less than 30 minutes to achieve lime
conversion rates of 50-80% [6]. Muller (1990) presented a detailed study of the properties and
reactions of calcium oxide (CaO) in burnt lime, including the diffusion of carbon into solid lime
and presented composite reactions of CaO and C in solid and liquid states [29, 58]. Most
recently, Li et al., (2012-13) explored the reaction mechanisms of CaC2 production from
pulverized coke and CaO at low temperatures, finding that there appeared to be either 2 or 3
distinct reaction mechanisms taking place, depending upon the initial ratio of carbon to CaO.
They also studied the influence of the major minerals present in coal-derived coke upon the
reaction of CaO with coke. In this second study, they found that, in general, the presence of
minerals in coal-derived coke reduced the formation of the desired CaC2 [52, 53, 58]. In general,
the previously-mentioned authors agree that the formation of calcium carbide from carbon and
lime is governed by the reactions II, III, IV and V as described in this write-up.
It is also widely accepted that once formed, CaC2 can either dissociate into calcium and carbon
via reaction (IV), or react with CaO per reaction (V).
CaC 5 2CaO 7 3Ca 5 2CO
Inability by some researchers to account for massive circulation of vaporized calcium as often
been pointed out in literature, usually brings conflict between research and production outcomes
as we have seen in all examples mentioned thus far.
Most, if not all, of the previous authors have studied the reactions listed in an effort to determine
the reaction rates of the chemical kinetics involved in the formation of CaC2. In these cases,
(V)

31
these previous authors have attempted to fit traditional reaction rate models to experimental data
with varying levels of success. However, most of these rate models are limited to a single global
reaction, and it is becoming widely accepted that the formation of CaC2 involves a multi-step
reaction mechanism [58].
Part of the work completed in collaboration with this work is to present two new methods for
modeling the chemical reaction mechanisms associated with the formation of Calcium Carbide
from Coke and Lime. The first of these new models is referred to as the progress variable model.
This model utilizes equilibrium mass fraction data to determine the direction that the reaction
must proceed in order to reach a state of chemical equilibrium [58]. The second model, known as
the multi-step reaction model, is based upon modeling the kinetic rates of the calcium carbide
formation and disassociation reactions [58].
In the current study, a general modeling paradigm is retained such that once validated it can be
implemented into readily available multi-dimensional computer codes to simulate CaC2
formation in complex reactors [58].
The constituents starting materials, synthesis technique used as well as the reaction temperature
also influence the activation energy of the reactions. To obtain pure CaC2 free of CaO impurities,
elemental calcium with graphite at 1070°K can be reacted in inert environment using a
conventional electric resistance furnace for 16hrs (44).
Ahlers and Ruschewit repeated the same experiment mentioned above in a modified domestic
microwave oven using a tablet pressed from 0.04 g Ca (1 mmol) and 0.036g graphite (3 mmol)
(Mfg.: Alfa, 99.6%, 100-200 mesh; Ca: Aldrich, 99.99%) stirred for 15 minutes at maximum

32
microwave power (800 W) (45). CaC2 (90% by weight), CaO (5%) and unreacted graphite were
obtained [45].
Although the studies mentioned above may give sufficient explanation of the kinetics of CaC2
formation, there is still need to accurately account for experimental conditions such as solid-solid
surface contact, pellet size and compaction and morphological and microstructural differences.
The reaction taking place using microwave energy may not follow the reaction paths as in
conventional methods, as this fundamentally rely on the dielectric properties of the compounds
present to drive the reaction and where this is not initially possible, a susceptor is used. It may
be possible that the reactions proceed through different routes to obtain the final product due to
the rapid reaction times, lower temperatures and localized heating, without an intermediate step.
It is the primary aim of the present study to investigate the feasibility of the solid phase
formation of calcium carbide, characterize the reaction rates of carbon and calcium oxide
precursors with various size ratios and chemistries, develop a method to obtain kinetic reaction
constants and draw a correlation between the particle characteristics and the kinetic constants.
This investigation includes obtaining reaction kinetics data to assist in defining the reaction
mechanism and difference in kinetic constants of the reaction through the use of microwave
heating compared to conventional convection heating.
33
3.0 EXPERIMENTAL DETAILS
3.1 General Experimental Description
The overall details of the experimental technique and procedure are described. Microwave and
conventional furnaces were used to prepare calcium carbide in a direct reaction of graphite; coal
and coal char as the carbon source with calcium oxide (lime) as the calcium source. These
experiments were carried out at different reaction temperatures, rates and hold times, weight
(molar) fraction and reaction location (within the furnace). For experimental works carried out in
the microwave, after mounting and aligning the sample for top surface temperature
measurement, the chamber was evacuated and backfilled with argon gas three times prior to any
run and a argon positive pressure was maintained throughout the run.
The products obtained were characterized using the X-ray Photoelectron Spectrometer (XPS)
and X-Ray Diffraction (XRD). The phase content from the XRD patterns was qualitatively
analyzed using Rietveld technique. The phase content was also characterized using a water
emersion process, where the gas produced through hydrolysis of final product from the furnace
reaction in distilled water was collected and analyzed using a Gas Chromatograph (GC). The
Scanning Electron Microscope (SEM) and Energy dispersive X-Ray Diffractometry (EDX) were
also used.
3.2 Raw Materials and their Characterization
The starting materials (powders) were characterized using X-Ray Diffraction (XRD), Scanning
Electron Microscope (SEM), Thermogravimetric Analysis (TGA) and Malvern Mastersizer 2000
particle size analyzer. The results of their particle size distribution measurements are recorded in
34
Table 3.1. Media to charge ratio used is 10:1. To obtain significant decrease in powder particle
size distribution, the media to charge ratio needs to be doubled not the duration.
Table 3.1 Characteristics of experimental starting materials. Powder mix: CaO-Graphite (CGM) CaO-Coal (CCM) CaO-CoalChar (CC2M) Ball milling duration: 24 96 504 24 24 (hr.) (hr.) (hr.) Particle Size Distribution, PSD (µm) D10 3.39 1.72 1.83 1.25 2.26 D50 13.72 11.77 8.50 2.75 10.56 D90 37.36 32.86 23.1 7.05 59.27
Theoretical Density 2.41 1.84 1.59 (g/cm3)
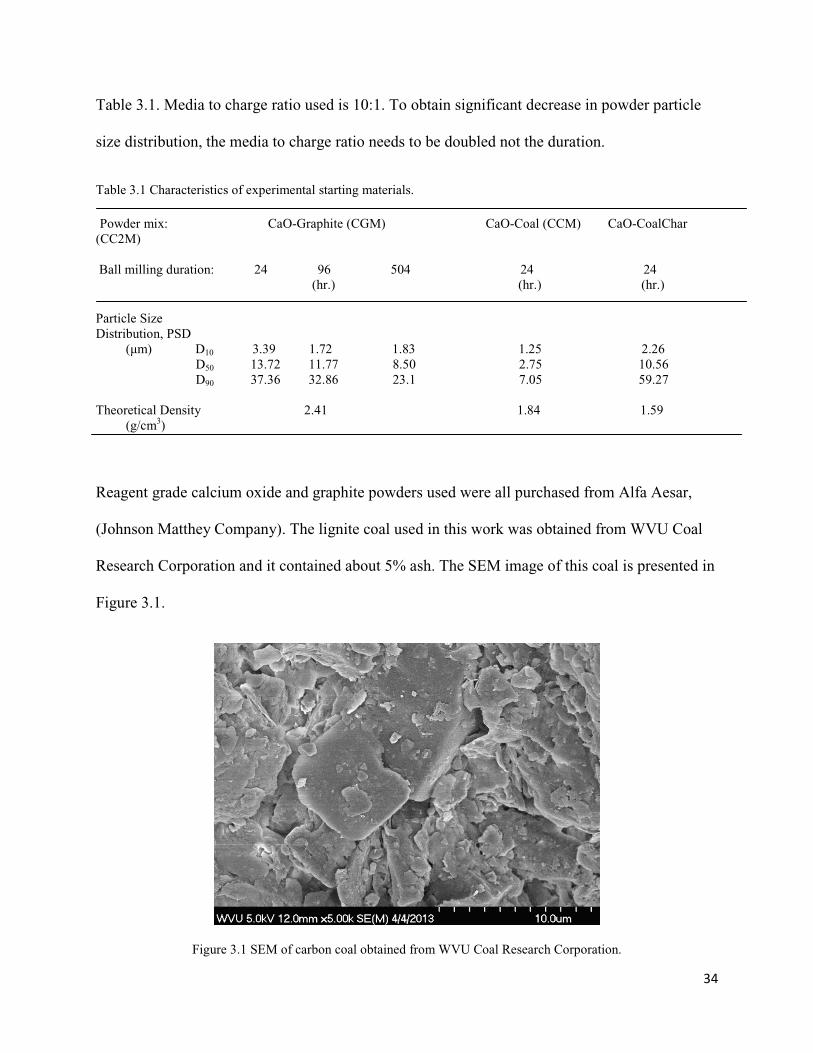
Reagent grade calcium oxide and graphite powders used were all purchased from Alfa Aesar,
(Johnson Matthey Company). The lignite coal used in this work was obtained from WVU Coal
Research Corporation and it contained about 5% ash. The SEM image of this coal is presented in
Figure 3.1.
Figure 3.1 SEM of carbon coal obtained from WVU Coal Research Corporation.

35
The essence of this is to distinguish the surface area of both coal and graphite carbons as the
accessible surface area influence the reaction rate.
An SEM image, XRD patterns and XPS survey and detailed scans of the 3/1 stoichiometry
mixture of the starting powders according to the generally accepted reaction are shown in Figure
3.2, 3.3 and 3.4 respectively. The mixture of these powder particles of the constituents’ materials
are well mixed, with composition identified and the expected phases defined as well. XRD
Rietveld refinement quantification technique used revealed the mixture consisted of 62.50 ±1.5
mass % of lime and 37.50 ±1.5 mass % of graphite.
Figure 3.2 SEM back-scattered image of 3:1 stoichiometric mixture of graphite and lime powder (Alfa Aesar).
Graphite Lime

36
Figure 3.3 XRD patterns of reagent grade calcium oxide (lime), graphite and the 3:1 stoichiometric mixture of both
graphite and lime powder (Alfa Aesar).
Figure 3.4: XPS survey scan for 3:1 stoichiometric mixture of both graphite and lime powder (Alfa Aesar supplies);
Stable carbon peak formed at 284.5 eV as revealed from the detailed scans for C1s, Ca2p and O1s.

37
3.3 Powder Processing
As-received reagent grade calcium oxide (average particle size of 4.62 µm) and graphite
(average particle size of 19.28 µm) powders were ball-milled for 24 hours, 96 hours and 504
hours in a suspension of isopropanol (1-Propanol), contained in a plastic bottle with zirconia
media charge to make three batches with different particle sizes. The charge to mass ratio used
was 10:1. The milling of the powder for furnace reactions was performed with the parameters
summarized in the Table 3.2 below. After milling, the suspension was dried using a “Rotavap”
evaporator (in vacuum at about 60⁰C). The powder was left inside a vacuum oven at 90⁰C for 2
hours to ensure that it was completely dry. The dried powder was sieved using a 250 µm sieve
and only the material which passed through the sieve was used for further processing.
Table 3.2: Summary of milling parameters for 3:1 stoichiometric mixture of starting materials. Milling apparatus Horizontal rotary ball mills
Milling speed 180 rpm
Milling time 24, 96, 504 hours (per batch)
Total mass of powder per batch Total mass of powder 50g
To improve surface contacts of the mixture to be reacted, cylindrical pellet discs of 12.77 mm in
diameter and varied thickness (approximately 1 mm-2.5 mm) were made by using an 11-ton
uniaxial press (1000 psi- 7000 psi). Approximately, 0.2-0.6 grams of powder was pressed in the
10 mm hardened tool steel die/punch set to obtain various green samples used for this work. The
calculations for the theoretical density (see equation 3.1) were carried out based on the rule of
mixtures formula:

38
9 :;<�; =>!? ∑ 2A∑BC
DCE 100
The densities (ρ) used for this calculation were 2.09-2.23 and 3.35g/cm3 for graphite and lime,
respectively. The fractional mass is represented as mi, while ρ theoretical represented the theoretical
density. The prepared samples were placed inside a crucible, with and without a lid, and the
sample was introduced into the furnace and positioned in the hot zone. After each run, the
reacted samples are pulled out of the furnace at a temperature below 300⁰C but above 100⁰C to
prevent interaction with air moisture and placed in a transfer vacuum container. Weight loss and
densification values are recorded before the samples are reacted and vacuum sealed in a plastic
bag (and stored in a 0% humidity glove box). Further processing was carried out within the glove
box.
The dimensions and weight of samples were averaged to measure the green density of the pellets
at 1.70 g/cc ± 0.02 at a 95% confidence level. Isothermal reaction kinetics were studied from
1000ºC to 1600ºC for microwave heating and 1500ºC to 1800ºC for conventional heating.
3.4 Reaction Apparatus Used for Study
3.4.1 Reaction Crucibles
Round alumina (20 ml x 15 ml), square graphite (70 ml x 30 ml x 15 ml) and zirconia
combustible boat (100 ml x 20 ml x 15 ml) crucibles were used. The boat and square crucibles
can contain four pellet samples in one batch run.
3.1

39
3.4.2 Reaction Furnace
Both conventional and microwave furnaces were used for this study. Figure 3.5 shows a picture
of the Nabertherm high-temperature tube furnace with low-voltage transformer and thermistor
(model series RHTH with a C799 standard vacuum tube of 40 cm inside diameter, 50 cm outer
diameter and 99 cm long) used in this work. The MoSi2 heating elements are in an easy to
replace hanging arrangement; can attain furnace chamber temperatures of maximum 1800 °C
(3272 °F). Its insulation materials are made of vacuum-molded fiberboards, allowing for
energy-saving operation and fast warm-up times because of low heat storage and thermal
conductivity. Experimental work can be done in a protective gas atmosphere, vacuum or even in
combustible gases. Temperature measurement is read by thermocouple type B and the
switchgear with controller separate from the furnace with a detach floor cabinet. The temperature
profile of a typical run at 1800⁰C and 60 min hold time is shown in figure 3.6.
Additionally, an MTI GSL-1500X-50 CE certified compact high temperature 9.84" O.D tube
furnace using 99.8% high purity processing alumina tube and SiC heating elements was also
used as back up furnace to complete reactions only at 1500⁰C. It has a vacuum sealing assembly
which connects with 1/4" gas hose to supply gas. The temperature of the MTI GSL1500X tubing
furnace is controlled by high precision SCR (Silicon Controlled Rectifier) digital controller with
accuracy +/-1°C and 30 segments programmable up to 1500°C. Both furnaces heating and
cooling rates were within the range of 3-5⁰C/minute.

40
Figure 3.5: Low Voltage Nabertherm High-Temperature tube furnace model series RHTH.
Figure 3.6: Typical temperature profile of the conventional furnace; this represent a temperature for experiment
ramped up to 1800°C with 60 minutes exposure time then allowed to cool down to room temperature.
Alumina tube Heating element
Gas bubbler
41
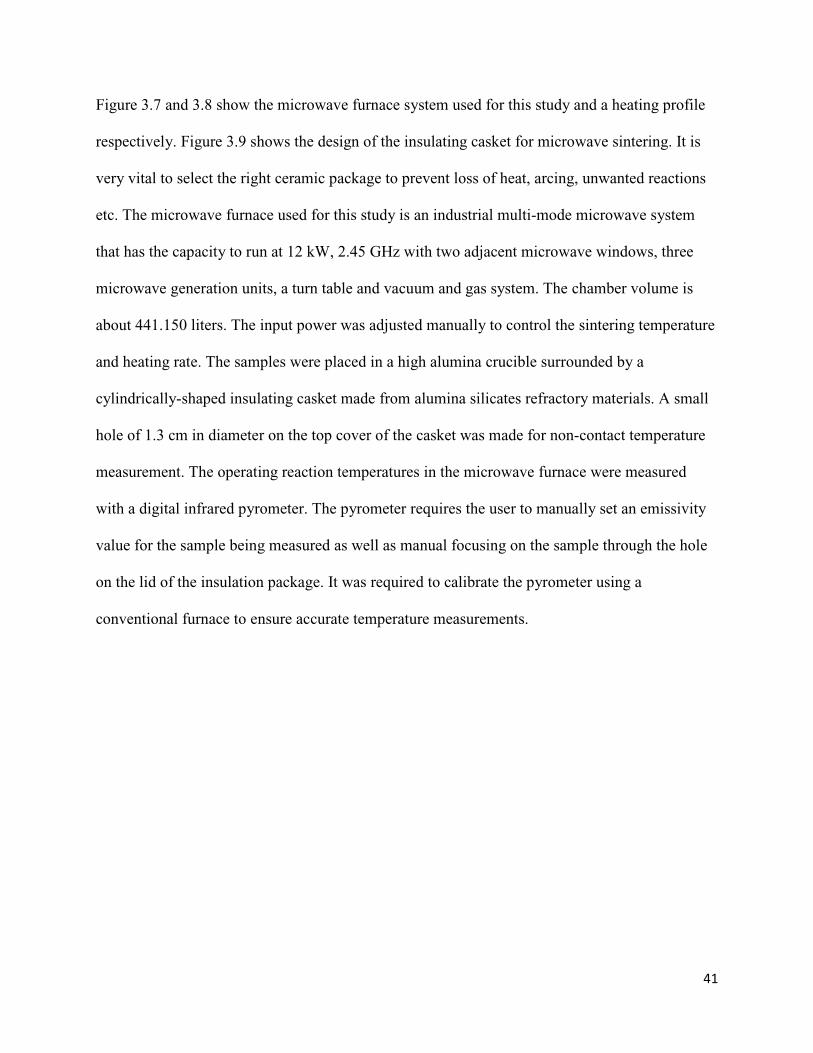
Figure 3.7 and 3.8 show the microwave furnace system used for this study and a heating profile
respectively. Figure 3.9 shows the design of the insulating casket for microwave sintering. It is
very vital to select the right ceramic package to prevent loss of heat, arcing, unwanted reactions
etc. The microwave furnace used for this study is an industrial multi-mode microwave system
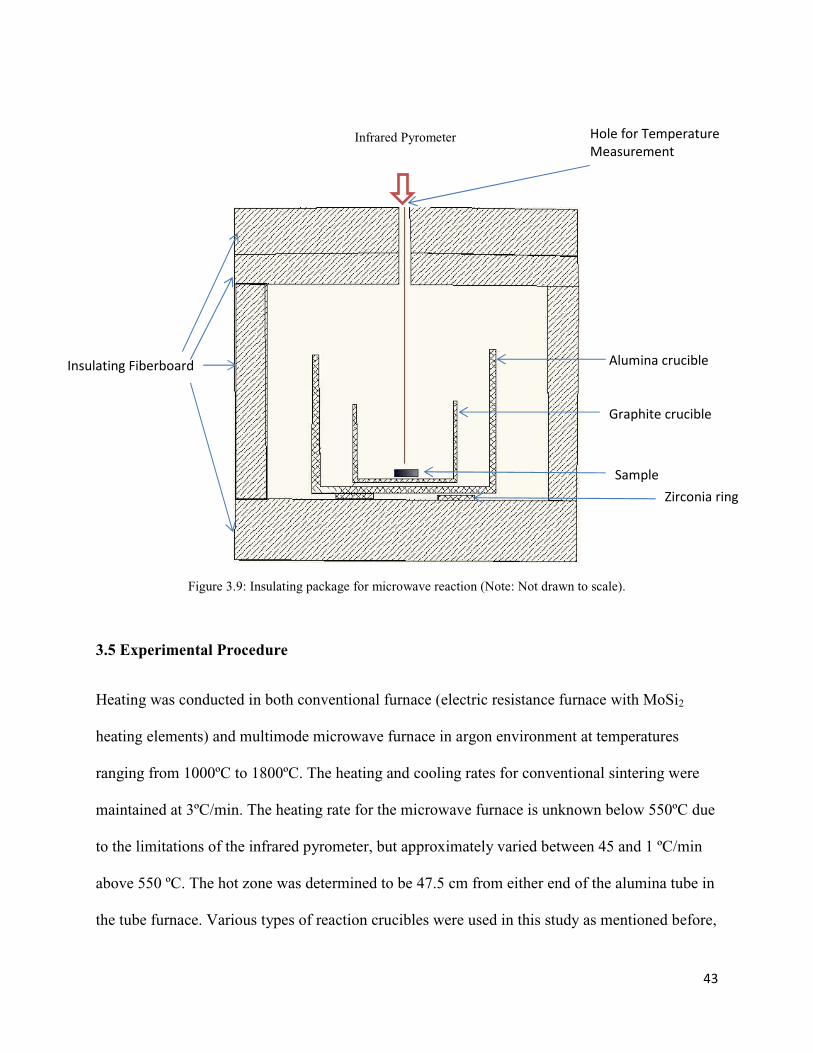
that has the capacity to run at 12 kW, 2.45 GHz with two adjacent microwave windows, three
microwave generation units, a turn table and vacuum and gas system. The chamber volume is
about 441.150 liters. The input power was adjusted manually to control the sintering temperature
and heating rate. The samples were placed in a high alumina crucible surrounded by a
cylindrically-shaped insulating casket made from alumina silicates refractory materials. A small
hole of 1.3 cm in diameter on the top cover of the casket was made for non-contact temperature
measurement. The operating reaction temperatures in the microwave furnace were measured
with a digital infrared pyrometer. The pyrometer requires the user to manually set an emissivity
value for the sample being measured as well as manual focusing on the sample through the hole
on the lid of the insulation package. It was required to calibrate the pyrometer using a
conventional furnace to ensure accurate temperature measurements.

42
Figure 3.7: Microwave Furnace Heating System; 12kW, 2.45GHz donated by Hadron Technologies Inc.
Figure 3.8: Typical temperature profile obtained during microwave heating of C-CaO mixture and power level used.
Infrared Pyrometer
Microwave Cavity
43
Figure 3.9: Insulating package for microwave reaction (Note: Not drawn to scale).
3.5 Experimental Procedure
Heating was conducted in both conventional furnace (electric resistance furnace with MoSi2
heating elements) and multimode microwave furnace in argon environment at temperatures
ranging from 1000ºC to 1800ºC. The heating and cooling rates for conventional sintering were
maintained at 3ºC/min. The heating rate for the microwave furnace is unknown below 550ºC due
to the limitations of the infrared pyrometer, but approximately varied between 45 and 1 ºC/min
above 550 ºC. The hot zone was determined to be 47.5 cm from either end of the alumina tube in
the tube furnace. Various types of reaction crucibles were used in this study as mentioned before,
Infrared Pyrometer Hole for Temperature
Measurement
Insulating Fiberboard Alumina crucible
Sample
Graphite crucible
Zirconia ring
44
to contain the samples. Initial experiments completed in the crucibles without lids inside the tube
furnace led to degradation and subsequent loss of tubes as a result of calcium vaporization
coupled with repeated heating. The reduction of the effective volume and use of lid has however
eliminated this challenge. The small closed graphite pots minimized diffusion through them.
In the case of microwave runs, melting of insulating package and reaction crucibles occurred due
to random hot-spots inside the microwave cavity. To curb this unwanted situation, a 1 inch offset
of zirconia ring pedestal and graphite-alumina ceramic system combination was incorporated
into the insulating package design.
For a regular run in the microwave, the furnace cavity was evacuated to 1 bar pressure level and
backfilled with a research grade argon gas three times and then the flow rate of the gas into the
microwave furnace throughout each run was maintained at 2 L/min. A bubbler was installed
below the furnace chamber for leak testing and ensuring positive pressure is maintained. Upon
conclusion of each test, the resulting samples were removed and stored within a vacuum
container. The samples were retrieved from the container to measure density and densification
and final weight (for weight loss information) and transferred to the glove box for further storage
before microscopy and phase characterization.
3.6 Analysis of Samples
3.6.1 Weight Loss Measurement
Weight loss characterization involved recording the mass of sample in both pellet and powder
forms before introducing it into the furnace for every run and also after taking it out of the
furnace. The same information is retrieved by weighing the container vessel, including ceramic
setter and graphite foil, before and after every run to determine the percent weight loss.

45
3.6.2 Density Measurement
The density of all of the reacted materials was measured using the Archimedes method and also
taking thickness and width dimensional information to determine Geometrical Density. The first
step in Archimedes was to measure the dry mass of the sample. The sample was then dropped in
a plastic cup half-filled with 2-Isopropanol, placed under vacuum at room temperature for 15
minutes. Then the mass of the samples suspended in 2-Isopropanol was measured. The sample
was then taken out of the 2-Isopropanol filled cup and excess 2-Isopropanol was removed from
the sample by dabbing it with a cloth. The mass of this “2-Isopropanol-impregnated” sample was
then measured. The calculations for this method are briefly outlined in equations (3.2) and
(3.3).
Bulk density (g/cm3): 9 �*$�-C/H$�IJKI$ (3.2)
Open porosity (%): LM N IJK*�IJKI$O 100% (3.3)
Where,
ρIPA (ρ Isopropan-2-ol) = density of Isopropan-2-ol at room temperature = 0.786 g/cm3,
d = dry mass of the sample,
w = mass of IPA-impregnated sample in IPA,
we= mass of IPA-impregnated sample.
46
3.6.3 X-ray Diffraction Phase Analysis: Qualitative and Quantitative
Samples in the form of powder, solid and crushed pellet, before and after reaction, were scanned
in a PANalytical XRD using Cu-Kα radiation. For the Rietveld calculations, it was necessary to
scan over a wide range from 15o through 110o for all measurements using a step-size of 0.05o,
and holding for 25 seconds per step. The quantitative phase analysis was made with the X’pert
Highscore Plus software using the structural data given in the ICDD database.
The weighted profile R-value, Rwp can be defined as the mean weighted difference between the
calculated diffraction pattern (fitted by a least squares approximation up to a best fit) and the
measured XRD pattern. This parameter is calculated as shown in equation 3.4.
QIR S∑ TC�UCVK UCW$'
∑ ICUCV' XY/
Where,
wi = mass of component phase I,
yio= intensity of experimentally observed XRD peaks for phase I,
yic= intensity of Rietveld calculated XRD peak for phase i.
Thus, Rwp is representative of the error in the result of the Rietveld calculation. An Rwp value of
less than or equal to 10% was considered an acceptable agreement between experimental spectra
and calculated spectra. However, it is recommended that the visual examination of calculated
profile and experimental profile match be done. Results were accepted even if the Rwp value was
still more than 10% provided that all peaks identified are accounted for and the RBragg value,
which does modify the R for a specific phase, which should be less than < 50.
(3.4)

47
3.6.4 Scanning Electron Microscopy (SEM)
Scanning electron microscopy (SEM) was used to analyze the microstructural development,
grain size and the different phases presence in the sample mix before and after reactions. In this
work, reacted samples are usually broken into two pieces before sputtering deposition of a thin
layer of gold or platinum to increase sample conductivity and also protect the integrity of the
surface.
3.6.5 Gas Analytical Technique
Hydrolysis testing was performed to quantify yield percent of calcium carbide synthesized. In
this test, acetylene or/and hydrogen is generated by placing the reactant on a hanging pan inside
a 125 cm3 flask containing 100 cm3 of water, attached to a pressurized 500 cm3 capacity steel
cylinder with a vacuum gauge and valves at both ends (as shown in figure 3.10). When the
sample is dropped, the valve end attached to the flask is opened to collect the generated gas.
Pressure and temperature before, during and after the reaction were recorded, and the collected
gas sample was analyzed with a gas chromatograph (GC) to determine the gas composition.
The GC technique adopted can detect gaseous impurities and also quantitatively determine the
mixture constituents. For GC experiments, gas samples were taken by attaching an air-tight
syringes (Model: 1100 Gastight syringes, Hamilton Company, Reno, NV) to the gas sampling
port. Three gas samples were taken at 20 minute intervals after each run and then tested in a gas
chromatograph (Model: Clarus GC 580, Perk Elmer Waltham, MA), shown in figure 3.11, to
determine the gas composition. A gas standard (Catalog: 501662 Gas standard, Supelco, PA,
USA) was used for calibration of the gas chromatograph for detecting carbon monoxide, carbon
dioxide, methane, ethane, ethylene & acetylene each at 1% in nitrogen. Another gas standard
48
(Product: N6107201 Gas standard, Perkin Elmer, Shelton CT, USA) was used to calibrate the
gas chromatograph for hydrogen.
Argon was used as the carrier gas for this system since the value of the thermal conductivity of
helium gas is closed to that of hydrogen gas.

49
Figure 3.10: Gas generation and collection apparatus (Vacuum pump is detached).
Sampling Cylinder
Sample flask
Vacuum gauge
Sample flask

50
Figure 3.11: PerkinElmer® Clarus® 580 Gas Chromatograph (GC) used to analyzed products obtained after
hydrolysis in DI water. Sample trapped in an air-tight syringes (Model: 1100 Gastight syringes, Hamilton Company,
Reno, NV) and then attached to the gas sampling port on the side of the GC.

51
4.0 Results and Discussion
The experimental conditions and results obtained from experiments completed on the
carbothermic synthesis of calcium carbide for this exploratory work are presented in this chapter.
The results discussed are for the reactions completed in both the microwave and conventional
furnaces. The lime and carbonaceous material (coal, graphite and coal char) precursors used in
these experiments were varied as explained in chapter 3 and the effect of the heating method,
material chemistries and morphologies on the reaction were investigated. As outlined in the
objective statement, the principal parameters influencing the reaction mechanism were
determined from experimental observations of weight loss and carbide formed analysis after the
reaction was completed. Some of the formulas used in obtaining these quantities from the
experimental data, as well as detailed sample calculations, for results obtained by the GC are
presented in Appendix I.
4.1. Heat Energy Transfer Study
With reference to the generally accepted reaction for the formation of calcium carbide,
represented here as reaction II, to form one mole of calcium carbide, the energy required is
approximately 464.8 kJ. The reaction rate for endothermic gas-solid reactions is affected by heat
transfer from the furnace to the reactants [2]. To determine whether the total energy transferred
to the sample particles measure up with the heat absorbed by the samples placed at the furnace
hot-zone region during a run, a separate study was conducted in which the effects of pellet
thickness (for a given pellet diameter) on the heating rate of the lime and carbon mixture was
examined. Pellet thickness from 1mm to 4mm where exposed to heat inside the furnace. The
data shown in figure 4.1 was generated with a 2D conduction heat transfer code in Matlab. It was

52
determined that for a furnace heating rate of 3 ⁰C per minute in a conventional furnace, the
actual temperature profiles of the pellets followed closely the temperature profile (as shown in
figure 4.1) of the furnace with negligible variation due to differences in pellet thickness. This
study was however not necessary for reactions completed using microwave heating because the
temperature were taken from the sample surface with the pyrometer. The emissivity was
calibrated and manually adjusted for accurate off-surface temperature measurements.
Figure 4.1: Temperature measurement profile for various sample thickness.
4.2 Reaction Kinetics, Model Parameters and Gravimetric Measurement
Experimental studies are described theoretically and mathematically by a model and translated
into rate equation. The mechanistic bases for modeling solid-state kinetic studies are nucleation,
geometrical contraction, diffusion, and reaction order [56]. Table 4.1 summarizes existing
models from literatures.
0
500
1000
1500
2000
0 200 400 600 800 1000
Te
mp
era
ture
[K
]
Time [min]
Thickness 1mm Thickness 1.5mm
Thickness 2mm Thickness 2.5mm
Furnace Temp

53
The general representation of rate equation is:
Z[Z AeK�^_/`a$f�α$ (4.1)
Where, A is the pre-exponential (frequency) factor, Ea is the activation energy, T is absolute temperature, R is the gas constant, f(α) is the differential form of the reaction model, and α is the conversion [56]. Table 4.1: Solid-State Rate and Integral Expressions for Different Reaction Models [56]
In this work, reaction kinetics in the solid-state was studied by powder X-ray diffraction (PXRD)
and gas chromatographic analytical methods. The measured parameter was transformed into a
conversion fraction that was used in the kinetic equations. The apparent conversion (AC) or
degree of reaction at various reaction exposure times obtained at different temperature levels
were calculated using equation 4.2.
AC TCCKTCT�
(4.2)

54
Where,
Wi= Sample weight loss before exposure time
Wii= Sample weight loss after exposure time
W0 = Maximum theoretical weight loss calculated from the generally accepted reaction II
The percent calcium oxide used to form the carbide was therefore estimated using the
relationship:
% CaO Conversion = def_f2
egHh E 100
Where,
NCaC2 = number of moles of CaC2; NCaC2≡NC2H2
NCa = number of moles of Ca; equivalent to that of CaO before reaction.
It is assumed that calcium found in the final product existed as CaO before the commencement
of the reaction, and the amount in percent of the total Ca that existed as CaC2 in the sample was
represented at the percent conversion to CaC2. .
4.3 Carbo-thermic Reduction Via Conventional Heating Technique
4.3.1 Ca(OH)2 Impurities
Initial exploratory results obtained from reactions completed between 1500-1800⁰C recorded
high weight losses. Preliminary investigations from literature suggest that the calcium carbide
decomposition at higher temperature and calcium vaporization might be contributing to the
weight loss. However, it is also possible the specimen would either gain weight or transfer mass
(4.3)

to another form during the sample preparation stages before reaction even take
pre-treatments carried out on the starting materials before ball milling. If this is the case, calcium
oxide might have picked up moisture and transformed into calcium hydroxide at room
temperature at the ball-milling, sieving or pellet pressing stages.
To verify this, two sets of experiments were conducted with and without known Ca(OH)
impurities, to determine the contribution of this inclusion in the reactants mixture
an XRD confirmation of about 24% moisture picked up
reaction take place.
Figure 4.2: XRD pattern for sample (pre
phases present were quantified by Rietveld technique and the calculated amount of moisture picked up is 24.29% of
initial mass. The bottom parts of the graph shows the residue which is used to determine the goodness
After a couple of runs, about 20% additional weight loss were recorded due to this inclusion. To
address this new development, an additional heat treatment step was introduced before pellet
pressing. Heat treatment here is not the same as that
material mixture; it is usually completed before introducing the sample into the furnace. The
heat treatment program used is provided in table 4.2
to another form during the sample preparation stages before reaction even takes place despite the
treatments carried out on the starting materials before ball milling. If this is the case, calcium
picked up moisture and transformed into calcium hydroxide at room
milling, sieving or pellet pressing stages.
To verify this, two sets of experiments were conducted with and without known Ca(OH)
contribution of this inclusion in the reactants mixture
an XRD confirmation of about 24% moisture picked up and present in the mixture before
(pre-treated before ball milling) with Ca(OH)2 impurities. Mass compositions of
phases present were quantified by Rietveld technique and the calculated amount of moisture picked up is 24.29% of
The bottom parts of the graph shows the residue which is used to determine the goodness
After a couple of runs, about 20% additional weight loss were recorded due to this inclusion. To
address this new development, an additional heat treatment step was introduced before pellet
pressing. Heat treatment here is not the same as that carried out before ball-milling the starting
material mixture; it is usually completed before introducing the sample into the furnace. The
heat treatment program used is provided in table 4.2 and was henceforth used for subsequent
55
place despite the
treatments carried out on the starting materials before ball milling. If this is the case, calcium
picked up moisture and transformed into calcium hydroxide at room
To verify this, two sets of experiments were conducted with and without known Ca(OH)2
contribution of this inclusion in the reactants mixture. Figure 4.2 is
in the mixture before
. Mass compositions of
phases present were quantified by Rietveld technique and the calculated amount of moisture picked up is 24.29% of
The bottom parts of the graph shows the residue which is used to determine the goodness of the fit.
After a couple of runs, about 20% additional weight loss were recorded due to this inclusion. To
address this new development, an additional heat treatment step was introduced before pellet
milling the starting
material mixture; it is usually completed before introducing the sample into the furnace. The
used for subsequent
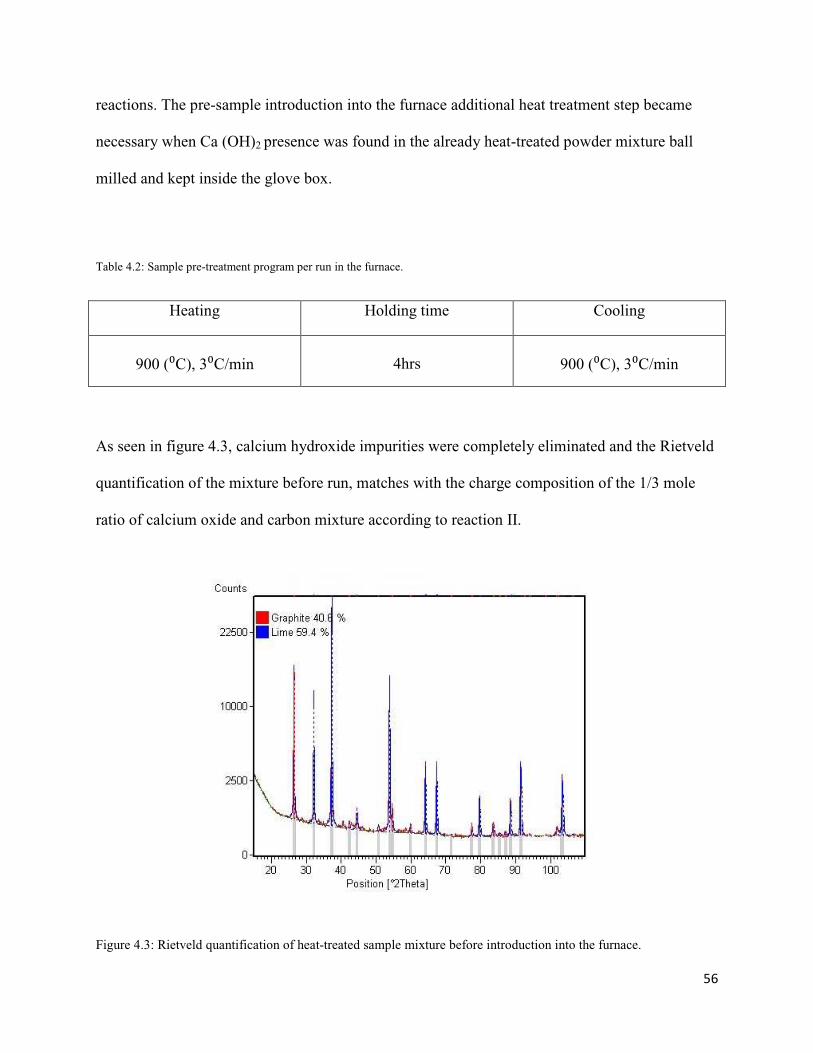
56
reactions. The pre-sample introduction into the furnace additional heat treatment step became
necessary when Ca (OH)2 presence was found in the already heat-treated powder mixture ball
milled and kept inside the glove box.
Table 4.2: Sample pre-treatment program per run in the furnace.
Heating Holding time Cooling
900 (⁰C), 3⁰C/min
4hrs
900 (⁰C), 3⁰C/min
As seen in figure 4.3, calcium hydroxide impurities were completely eliminated and the Rietveld
quantification of the mixture before run, matches with the charge composition of the 1/3 mole
ratio of calcium oxide and carbon mixture according to reaction II.
Figure 4.3: Rietveld quantification of heat-treated sample mixture before introduction into the furnace.

57
4.3.2 Influence of Mold and Tube Materials
Preliminary experiments were conducted using alumina and zirconia as the materials for the boat
crucibles and an alumina tube material described in chapter 3. However, it was unsatisfactory
because of the reaction of the mold and tube materials with escaping calcium vapor at higher
reaction temperatures. This is evident due also to the difficulty encountered in removing samples
from the crucible and the crucible from the tube due to adhesion caused by the extensive
deposition of the calcium deposits onto the wall of the crucible and tube. These reactions are
possible thermodynamically within a temperature range of 900 to 1200⁰C (46). Ca12 Al14F2 O32
and Ca5Al6O14 compounds were identified as contaminants in reaction completed using alumina
crucible. To show that the vaporizing calcium escape, the exit carrier gas (in this work argon)
that is usually bubbled through D.I. water at the exit end of the tube was collected and analyzed.
This gas is collected over some of the experiments conducted at 1500⁰C for 60 minute
isothermal hold and then analyzed. Results obtained were compared to pure distilled water and a
significant amount of Ca was found present. In distilled water, less than 0.1 mg/L of calcium was
found present while 1.92 mg/L of Calcium detected in the collected exit water analyzed. The
detection limit for the method used is 0.1 mg/L.
However, the use of a graphite crucible in this kind of environment yielded positive results. So
far, it was possible to continue a series of experiments using one graphite crucible with no loss
recorded due to chemical interaction. All subsequent experiments were therefore completed in
the graphite mold. It is not the same with the tube as the methods introduced to trap some of the
escaping vaporized calcium inside the crucible; in order to extend the service life of the tube,
seem not to have worked out as expected, it only managed to reduce this effect minimally.
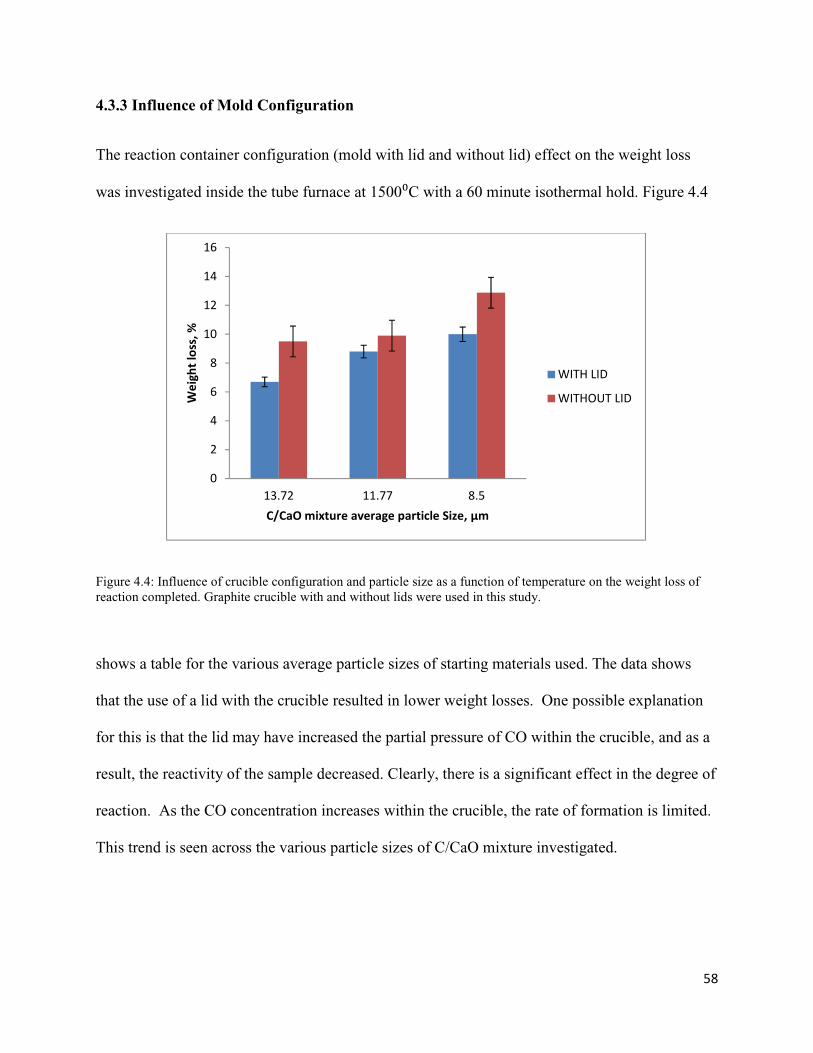
58
4.3.3 Influence of Mold Configuration
The reaction container configuration (mold with lid and without lid) effect on the weight loss
was investigated inside the tube furnace at 1500⁰C with a 60 minute isothermal hold. Figure 4.4
Figure 4.4: Influence of crucible configuration and particle size as a function of temperature on the weight loss of reaction completed. Graphite crucible with and without lids were used in this study.
shows a table for the various average particle sizes of starting materials used. The data shows
that the use of a lid with the crucible resulted in lower weight losses. One possible explanation
for this is that the lid may have increased the partial pressure of CO within the crucible, and as a
result, the reactivity of the sample decreased. Clearly, there is a significant effect in the degree of
reaction. As the CO concentration increases within the crucible, the rate of formation is limited.
This trend is seen across the various particle sizes of C/CaO mixture investigated.
0
2
4
6
8
10
12
14
16
13.72 11.77 8.5
We
igh
t lo
ss,
%
C/CaO mixture average particle Size, μm
WITH LID
WITHOUT LID

59
4.3.3 Investigation of Reaction Variables’ Influence
Experimental results obtained from reacting a 1/3 mixture (on a mole basis) of lime and carbon
was used to study the kinetics of the formation of calcium carbide.
The formation of calcium carbide from carbon and lime is governed by multi-step reactions II,
III, IV and V as agreed by most previous works. It is also widely accepted that once CaC2 is
formed, CaC2 can either dissociate into calcium and carbon via reaction (IV), Ca (g) + 2C �
CaC2(s) or react with CaO(s) per reaction (V), CaC2�s$ 5 2CaO�s$ 7 3Ca�g$ 5 2CO (g).
The reaction path in this work followed a multi-step mechanism. Mukaibo et al. [43] found the
procession of reaction III, CaO + C � Ca (g) + CO above 1150 °C, while reaction IV, Ca (g) +
2C � CaC2 did not take place below 1300°C. The Tammann temperature (approximately half
the melting point in kelvin) for CaO is 1158⁰C. At this temperature,
the mobility and reactivity of the molecules in the bulk of CaO become appreciable. In our
experiment at 1500⁰C, we carried out the heating of a C/CaO mixture, calcium metal evaporated
from the sample were found from the analysis of DI water collected at the exit end of the furnace
after the run-the carrier gas is usually bubbled through this DI water at the exit end of the
furnace. As explained before, 1.92 mg/L of Calcium was detected in the sample exit water
analyzed as against > 0.1 mg/L present in the control sample D.I. water. The detection limit for
the method used was 0.1 mg/L.
Also, XPS surface analysis instrument which can provide elemental and chemical information
about the surface region (first 1- 30 monolayers) of nearly any solid material (see figure 4.5)
found an appreciable presence of calcium and calcium oxide as carbon decreases across the
depth probed. The essence of this analysis is to monitor the distribution of the constituent

60
materials and quantify phases present after the reaction of the pressed pellet of C/CaO mixture at
1500⁰C for 60 minutes. Figure 4.5 shows the depth profile analysis data collected for the reacted
sample (1/3 carbon and calcium oxide mixture reacted at 1500⁰C for 60 minutes).
Figure 4.5: XPS surface analysis technique depth profile scan for 1/3 carbon and calcium oxide mixture reacted at 1500⁰C for 60 minutes. The surface was sputtered to make sure that carbon detected is from the sample, not contaminant. Specifications:
• Detection limits (all elements except H): ~ 0.01 monolayer, or ~ 0.1% bulk
• Measurement depth: 10 - 50 Å; area: 0.2 - 1 mm dia.
• Sample size: 0.1mm to 76.2mm dia. x 25.4mm thick
• Spectrometer: Monochromatized Al (ka) Source; Vacuum ~ 5 x 10E(-10) torr
The surface was sputtered to make sure that carbon detected is not surface contaminant. It can be
seen that the concentration of calcium element close to the surface decreases; some of these are
the ones displaced towards the exit end of the tube as detected by the water analysis test. An
estimated 6% calcium carbide was formed using the XPS quantification technique. Meanwhile,
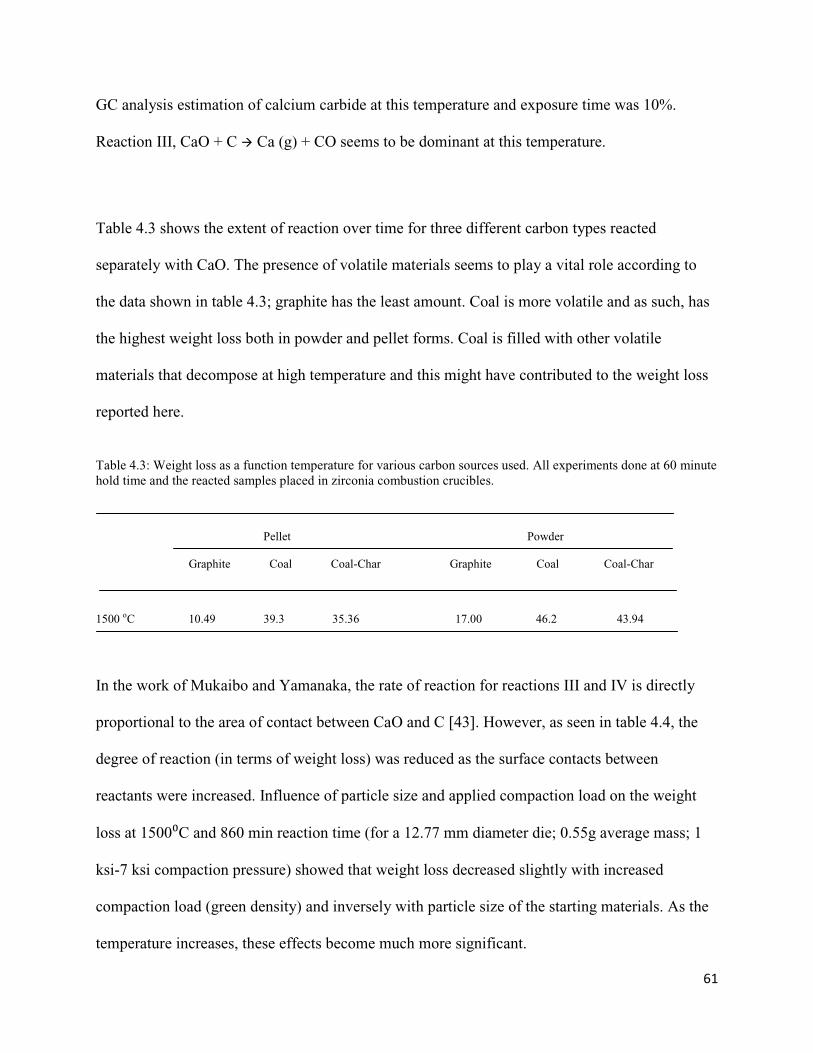
61
GC analysis estimation of calcium carbide at this temperature and exposure time was 10%.
Reaction III, CaO + C � Ca (g) + CO seems to be dominant at this temperature.
Table 4.3 shows the extent of reaction over time for three different carbon types reacted
separately with CaO. The presence of volatile materials seems to play a vital role according to
the data shown in table 4.3; graphite has the least amount. Coal is more volatile and as such, has
the highest weight loss both in powder and pellet forms. Coal is filled with other volatile
materials that decompose at high temperature and this might have contributed to the weight loss
reported here.
Table 4.3: Weight loss as a function temperature for various carbon sources used. All experiments done at 60 minute hold time and the reacted samples placed in zirconia combustion crucibles.
Pellet Powder
Graphite Coal Coal-Char Graphite Coal Coal-Char
1500 oC 10.49 39.3 35.36 17.00 46.2 43.94
In the work of Mukaibo and Yamanaka, the rate of reaction for reactions III and IV is directly
proportional to the area of contact between CaO and C [43]. However, as seen in table 4.4, the
degree of reaction (in terms of weight loss) was reduced as the surface contacts between
reactants were increased. Influence of particle size and applied compaction load on the weight
loss at 1500⁰C and 860 min reaction time (for a 12.77 mm diameter die; 0.55g average mass; 1
ksi-7 ksi compaction pressure) showed that weight loss decreased slightly with increased
compaction load (green density) and inversely with particle size of the starting materials. As the
temperature increases, these effects become much more significant.

62
Table 4.4: Influence of particle size and applied pellets (12.77 mm diameter, 2.5 mm thickness, 0.55 g average mass of powder granules) compaction load on the weight loss at reaction temperature 1500⁰C and 460 minutes reaction time in argon environment. Particle Size Distribution, D50 % Weight Loss (µm) Pellets Compaction Pressure (kPsi) 1 2 3 5 7 8.5 12.88 12.58 12.20 12.14 13.72 7.5 7.1 6.28 5.9 5.87
Lower CaO size provides higher surface area for Ca loss and increased particle-particle contact
for solid state reaction. Weight loss may have decreased with compaction due to less solid-gas
interfaces (for sublimation) and more solid-solid interfaces (for reaction). The tortuosity may
have increased which may decrease mass diffusion of Ca vapor out of the structure (increasing
local vapor pressure, which would decrease sublimation rate) and the same would restrict the
product CO out of the structure which locally references the reaction path.
The expectation for solid-solid surface compaction behavior was to have more yield as the
reactants are in close proximity, however, this was not what happened. This is because of the
restriction in solid-state mass transfer of calcium vapor and CO released possibly caused by
formed CaC2 around reactants and trapped CO. The CO being the lighter gas is expected to
displace heavier vaporize Ca, which means that Ca vapor diffuses in the gas form, adsorbs on the
carbon surface, and then nucleates the desired phase in situ.
Dejun Shi et al. (47) investigated and confirmed restriction in movement of calcium vapor and
CO released during carbide formation. This is possibly caused by formed CaC2 around reactants
and trapped CO. They showed this in their work by introducing potassium carbonate as an
63
additive during the synthesis of calcium carbide to permit alternative transport route for contact
between CaO and carbon, which was essential for the solid-solid reaction to increase yield of
calcium carbide. The role of potassium carbonate was attributed to its melting and dissolution of
CaO which enhanced the mass transfer of the latter to the carbon reactant. The carbonate would
melt because it has a low melting temperature in none oxidizing atmosphere and the capillary
action of the liquid pulled the particles closer (by reducing diffusion distances) and provided a
means for liquid phase transport of Ca to the carbon interface (by dissolving in the carbonate
solution since the liquid phase transport is faster compare to solid-state transport). A 10%
increase in yield was reported for aided reaction in terms of permitting alternative transport route
compared to the unaided reaction.
Figures 4.6, 4.7 as well as table 4.5, 4.6, respectively, show the effect of holding time and
temperature on CaC2 formation via conventional heating. All curves of the weight loss against
time in the temperature range 1500-1700⁰C are exponential. Figure 4.6 and 4.7 show the course
of the reactions at four and three temperatures, respectively. It is expected that higher reaction
temperatures or longer holding times will yield more CaC2. It is clear that the temperature has a
profound influence on the rate of the reaction and densification. The density of the products
decreases accordingly as the temperature and holding time is increased (table 4.5 and 4.6). This
is believed to be due to the enhanced vapor pressure of calcium, which is a function of
temperature and an enhanced diffusivity of the materials. As the temperature is raised, calcium
particles melt and disperse such that the vapor pressure of calcium increases to a level that the
porous C/CaO matrix is penetrated to allow contact with carbon to form calcium carbide.

64
Figure 4.6: Weight loss as a function of temperature. All experiments were held at 60 and 120 minutes.
Figure 4.7 Relation between weight loss and exposure time.
0
0.1
0.2
0.3
0.4
0.5
0.6
0.7
0.8
0.9
1
1450 1500 1550 1600 1650 1700 1750 1800 1850
Per
cent
Wei
ght L
oss
Hold temperature, ⁰C
60 minutes 120 minutes
0
0.05
0.1
0.15
0.2
0.25
0.3
0.35
0 10 20 30 40 50 60 70
We
igh
t lo
ss,
g
Time, min.
1700 ⁰C
1650 ⁰C
1600 ⁰C

65
Table 4.5: Temperature study results in conventional furnace. Reactants: Lime, Graphite (LGM) Mold material and condition: Zirconia combustible boat crucible and without lid Furnace type & atmosphere: 1800°C RHTH, Argon gas, 0.25bar Sample mass and form: 0.55g, Pellet Ball milling duration (hours): 24 & 96 Uni-axial compaction pressure: 1kPsi. Batch Code Temperature Time* Green Density Sintered Density Percent Weight Loss Apparent Conversion Name oC min g/cm3 g/cm3 T D** % 24 LGM 1500 560 1.91 1.73 77.93 10.49 1600 593 1.90 1.53 68.92 21.21 1700 627 1.91 1.01 45.50 52.56 1800 660 1.90 0.82 36.94 66.82 24 LGM 1500 620 1.92 1.74 78.38 14.11 1600 653 1.92 1.35 60.81 28.21 1700 687 1.92 0.92 41.44 59.63 1800 720 1.91 0.75 33.68 71.77 96 LGM 1500 560 1.85 1.46 65.77 30.76 1600 593 1.80 1.17 52.90 46.71 1700 627 1.67 0.87 39.19 68.65 1800 660 1.85 0.66 29.73 79.84 * Total time, treact (minutes) = thold + (theat/2) + (tcool/2) ** Based upon the theoretical density (TD) of the tetragonal CaC2 I (2.22 g/cm3)
Table 4.6: Temperature study results in conventional furnace. Reactants: Lime, Graphite (LGM) Mold material and condition: Graphite square crucible and with lid Furnace type & atmosphere: 1800°C RHTH, Argon gas, 0.25bar Sample mass and form: 0.55g, Pellet (pre-introduction heat treatment) Ball milling duration (hours): 504 Uni-axial compaction pressure: 1kPsi. Batch Code Temperature Time* Green Density Sintered Density Percent Weight Loss AC Name oC min g/cm3 g/cm3 T D** % % 504 LGM 1500 560 1.75 1.62 72.97 5.73 7.7 1600 593 1.79 1.42 63.96 13.57 41.47 1700 627 1.75 1.33 59.91 39.53 51.69 AC-Apparent Conversion

66
The apparent conversions based on weight loss curves in all experiments are parabolic (figure 4.8).
Figure 4.8 Relation between actual conversion and exposure time.
The conversion rate appears to increase exponentially with increasing temperature, which is an
indication that the reaction followed a diffusion-controlled mechanism. The rate of solid state
reaction when the diffusion process is rate-determining is expressed by the 3-dimentional
parabolic model [56]:
Degree of reaction (= apparent conversion) = �1 k l�1m k �$$ nopq3r+ (4.3)
Where, α is the apparent conversion, k is the reaction rate constant and the total reaction time,
treact is the time the sample was exposed to and it is given by:
opq3r+ osMt* 5 �+uJHv $ 5 �+WVVw
$ (4.4)
The three-dimensional diffusional (D3) model is based on the assumption of spherical solid
particles. The parabolic kinetics given in equation (4.3) was therefore used to determine the
reaction path and the curve shown in figure 4.9. The linearity of this curve indicates an apparent
0
0.1
0.2
0.3
0.4
0.5
0.6
0.7
0.8
0.9
0 20 40 60 80
De
gre
e o
f re
act
ion
Time, min.
1700 ⁰C
1650 ⁰C
1600 ⁰C

67
diffusion-controlled reaction. The slope of these lines was used to determine the apparent
reaction constant, k. The activation energy for the range of temperature considered in this work
is 125.66 kJ/mol; it was obtained by plotting the logarithm apparent reaction kinetic constants
shown in the data in figure 4.9 against the reciprocal of the absolute temperatures. The data
shown in figure 4.10 were used to compute the activation energy. The slope of the curve was
multiplied by the gas constant, R using the value 8.134kJ/mol, to obtain the activation energy.
Figure 4.9: Relation between (1−∛((1)−�))^2 and reaction time for 8μm particle sized 1/3 mixture of C and CaO .
y = 0.0009x - 0.0005
y = 0.0002x - 0.0003
y = 3E-05x - 0.0004
-0.01
0
0.01
0.02
0.03
0.04
0.05
0.06
0 10 20 30 40 50 60 70
(1−
∛∛ ∛∛((1
)−�� ��)
)^2
oooo_xxxxyyyyzzzz{{{{oooo, min.
1700⁰C
1600⁰C
1500⁰C

68
Figure 4.10: Relation between logarithm apparent reaction kinetic constants against the reciprocal of the reaction
temperatures.
Tagawa and Sugawara reported 598 kJ mol−1 at a CO pressure of 50 mmHg and 836 kJ mol−1
at a CO pressure of 100 mmHg. They reacted granules compressed from fine charcoal and CaO
(at least 74 microns average particle sizes) with the 1/3 molar stoichiometric ratio as defined by
reaction II here, CaO + 3C → CaC2 + CO, and experimentally fit their data with the diffusion
model, (1 − (1 − α)1/3)2 = kt [8].
Guodong Li et al. also reported their apparent activation energy as about 456 kJ mol−1 at the
lower temperature range and about 256 kJ mol−1 at the higher-temperature range (20, 140, 250
and 680 microns average particle sizes and bituminous coke as carbon source). They attributed
the difference in activation energies to minimal CO pressure due to the constant purging by
Argon [53].
Reduced activation energy for high temperature is usually attributed to presence of CaC2⋅CaO
eutectics at temperature greater than 1700⁰C for formation of calcium carbide. The break point at
1640⁰C seems to suggest so here, even though studies by both chemical and x-ray diffraction of
0
0.0002
0.0004
0.0006
0.0008
0.001
0.0012
5 5.1 5.2 5.3 5.4 5.5 5.6 5.7
k,
(min
-1)
1/T, 104 (K-1)
125.66 kJ/mol

the reactions completed (Figures 4
intermediate phase. In figure 4.11, calcium carbide formed was identified at 1800
evidence of any intermediate phases
dissolved at higher temperature, calcium oxide and calcium hydroxide
from figures 4.12-15 show no evidence of any intermediate phase(s)
a typical carbide phase that is very diffic
crystals [57] detected. In figure 4.15, the dominant phases were plate
oxide, which is an indication of about 6
quantification technique used in this work.
Figure 4.11: XRD of ball-milled lime and carbon
(Figures 4.11, 4.12, 4.13, 4.14 and 4.15) did not identify any
. In figure 4.11, calcium carbide formed was identified at 1800
any intermediate phases other than unreacted graphite, graphite from carbide that
dissolved at higher temperature, calcium oxide and calcium hydroxide. The same observation
15 show no evidence of any intermediate phase(s) (CaC.CaO/CaC
a typical carbide phase that is very difficult to quantify particle size and with no ty
In figure 4.15, the dominant phases were plate-like carbon and calcium
oxide, which is an indication of about 6-10% carbide formed confirmed by XPS, GC and XRD
quantification technique used in this work.
milled lime and carbon (graphite) mixture after reaction-1800⁰C. Three CaC2 modifications identified.
69
did not identify any
. In figure 4.11, calcium carbide formed was identified at 1800⁰C with no
other than unreacted graphite, graphite from carbide that
. The same observation
/CaC2.CaO ) but
o typical shapes of
like carbon and calcium
10% carbide formed confirmed by XPS, GC and XRD
modifications identified.
70
Figure 4.12: SEM of ball-milled lime and carbon (graphite) mixture after reaction @ 1800⁰C.
Figure 4.13: SEM of ball-milled lime and carbon (graphite) mixture after reaction @ 1700⁰C.

71
Figure 4.14: SEM of ball-milled lime and carbon (graphite) mixture after reaction @ 1600⁰C.
Figure 4.15: SEM of ball-milled lime and carbon (graphite) mixture after reaction @ 1500⁰C.

72
The reaction completed here seem to have proceeded differently in two temperature range: 1500
to 1640 °C and 1640 to 1700 °C. The apparent activation energy calculated was found to be
approximately 125.66 kJ⋅mol−1. The difference in activation energies when compared to that seen
in literature might not be unconnected to the minimal CO pressure in this work as a result of
constant purging by Argon gas, and that would yield much less activation energies. The local CO
concentration may be low near the reaction interface, which would allow for the reaction to be
completed closer to equilibrium conditions.
Another factor is the influence of the particle size used; the average particle in this work is about
9 times smaller than the starting C/CaO materials reported in literature for calcium carbide
formation.
The rate limiting factors considered are: 1) diffusion of CaO into C reactant, and 2) CO diffusion
through the formed products. The literature understanding on the mass transfer limit for the
reactants in terms of direction of the mass transfer, for CaO toward diffusion towards carbon or
from carbon towards CaO, or vice versa, has not been consistent [53]. Liu et al. showed that the
mass transfer direction is mainly from CaO to carbon [53]. This is in agreement with the
outcome of our experiments on how various carbon surface areas affect the initial temperature of
the reaction. However, real time monitoring of this reaction in an environmental SEM will give a
perfect answer to this, and we have it as part of the future works to be completed.

73
4.4: Chemical Reactions and Microwaves Heating
4.4.1: Temperature Measurement in Microwave Furnace
A very important aspect of microwave experiments is the accurate measurement of temperature
inside the furnace and this has been of serious concern in this work. There has been no generally
agreed standard temperature measurement technique accepted in the microwave synthesis
community. It is very important to note that the temperature measurement technique used should
not interfere with the microwave field or disturb the thermal distribution of the sample being
measured [54, 55]. In this work, the temperature measurement in the microwave furnace was
measured with a digital infrared pyrometer in this work. This is a Minolta-Land Cyclops 152
portable thermometer designed for temperature in the range 500 to 3200° C. The digital output is
made available over an RS-232 communication with a response time 30 ms (display 0.6 s). The
accuracy of the reading is ±0.5%. The pyrometer requires that the user manually enter an
emissivity value for the specific sample being measured as well as manually focus on the sample
through the hole on the lid of the insulation package. The distance from the sample top and the
pyrometer gun tip should not exceed 1 m. To ensure accuracy of temperature measured off the
sample surface, the emissivity of the sample being tested was calibrated using a conventional
furnace. Emissivity compensation is in range 0.1 to 1.0.
The pellet samples were heated to temperatures from 1000ºC to 1400°C and held for 30 minutes
in a conventional furnace. The temperature for the calibration in the conventional furnace were
measured with a K-type thermocouple and pyrometric shrinkage disks to determine the
approximate emissivity values to be entered in the infrared pyrometer used during the reaction
runs. A quartz window was employed in another identical set of experiments, to simulate the
conditions during microwave sintering.

74
Other conditions of the microwave were also simulated, including using the same sample
container to hold the samples. Table 4.7 lists the measured emissivity, for the conditions of these
calibration experiments in the conventional furnace, at various temperatures. The measured
emissivity did not vary significantly with increasing temperature. The same values of emissivity
were used for all microwave reaction experiments (0.72 ± 0.02 at a 95 % confidence interval
with quartz window; 0.47 ± 0.02 at a 95% confidence interval without the quartz window). The
accuracy of temperature measurement with the infrared pyrometer was determined to be within
5°C of the temperature measured with a K-type thermocouple in conventional sintering
experiments.
Table 4.7: Infrared pyrometer calibration in conventional furnace for apparent emissivity measurements.
Temperature (⁰C) Measured Emissivity (ε)
Thermocouple TempChek Without window With Window
1400 1405 0.70 0.46
1300 1398 0.70 0.46
1200 1195 0.71 0.46
1100 1104 0.72 0.49
1000 999 0.75 0.49
Average values
(95% confidence
measured range)
0.72± 002
0.47± 002
4.4.2: Microwaves Reactions
The use of microwave energy has been attracting significant attention in recent years as an
alternative method for processing ceramic materials. One of the most important reasons for this

75
is the potential for reductions in manufacturing costs due to shorter processing times and
consequent energy savings.
In this present work, we investigated the synthesis of calcium carbide in a multi-mode
microwave furnace using a specific insulation package design (with a graphite crucible container
to assist in rapid heat up of the reactants). The graphite crucible was used so that the reaction
container would be capable to withstand possible shock while the material was processed in an
inert atmosphere. Included with this work was a comparison between the reaction kinetics of the
microwave processed material versus that of the conventional furnace. These experiments were
conducted to verify the basic advantages of microwave application to carbo-thermic chemical
reduction reactions with the expectation of developing a new kind of continuous reactor.
The precursors used for this work are carbon graphite and calcium oxide materials in both pellet
and powder forms. Carbon materials in powder form are very good absorbers of microwaves
(easily heated by microwave radiation), and can heat other materials indirectly, or to act as a
catalyst and microwave receptor in different heterogeneous reaction. Chen et al (1984) reported
carbon to heat to 1000°C in 0.2 min. Meanwhile, reagent grades calcium oxide, calcium
carbonate, were reportedly classified as inactive, both reached 200°C and130°C respectively at
the rate of 5°C/min.
Even though calcium oxide is almost transparent to microwaves at room temperature, and hence
cannot be heated readily, microwave energy will heat carbon powders almost instantaneously
provided that the particle size is similar to the depth of penetration. This gives the possibility of
heating homogeneous mixtures of lime and carbon from various sources extremely fast and
volumetrically with higher energy conversion efficiency than can be achieved via conventional
76
furnace heating. Microwave applications to chemical reactions open new possibilities: fast and
efficient means of processing ceramic carbide powders; however, special care needs to be taken
over the selection of the ceramic system and the reaction environment.
In the experiments completed, the microwave furnace was used to heat the samples to
temperatures between 1000 and 1600°C, as measured by the pyrometer strategically placed to
measure the sample surface temperatures. Once the desired temperature was obtained, the power
to the furnace was shut off and the samples were allowed to cool rapidly. Similar to conventional
tube furnace outcome, the samples were analyzed for weight loss and the amount of calcium
carbide present.
In figure 4.16, the effect of holding time and temperature on CaC2 formation for microwave
heating were shown. The curve is approximately exponential which suggests a diffusion-
controlled path. Part of the future works for these experiments involved 10 minutes time interval
study of reaction of 1/3 mixture of C/CaO, to understand the actual reaction mechanism.
Figure 4.17 compares the calcium carbide yields obtained in the microwave furnace to those
obtained in the tube furnace experiments. Samples were analyzed with the GC to quantify the
amount of carbide formed and XRD to identify phases present in the final product. Calculations
and data are presented in appendix I. The reacted samples were pre- getting rid of the hydroxide
inclusion that erroneously contributes to weight loss usually reported. As presented here, the
microwave furnace process leads to significantly greater yields, with higher reaction temperature
or longer holding times yielding more CaC2. The weight loss reported here includes both Ca loss,
hydroxide inclusion and the decomposition of formed CaC2.

77
Figure 4.16: Percent weight loss as a function of maximum microwave furnace temperature. C/CaO mixture average particle size of approximately 15 µm.
Figure 4.17: Comparison of calcium carbide yields in conventional tube and microwave furnaces. C/CaO mixture average particle size of approximately 15 μm.
It is clear that temperature has a profound influence on the rate of the reaction. Unlike in the
conventional heating whereby calcium vaporization and subsequent loss seem to be increased, it
0
5
10
15
20
25
0 500 1000 1500 2000
% W
eig
ht
Loss
Holding Temperature , ⁰C
0
20
40
60
80
100
1000 1500 1600 1700 1800
Pe
rce
nt
yie
ld
Temperature, °C
Conventional
furnace
Microwave
furnace
78
is however not the case with microwave. Calcium oxide consumption (estimated from both
weight loss and XRD) increased fairly exponentially as temperature increased (as shown in
figure 4.18). The mode of heating basically influenced the reaction rate significantly, where the
intrinsic heating due to microwave coupling resulted in high reaction rates locally (which are
different from that of conventional heating).
A significant feature to note in figure 4.18, which shows the amount of calcium oxide reduced
for different temperature levels and time, is the initiation of carbo-thermal reduction at
temperatures much lower than expected. From the data obtained, reduction commenced at
1000⁰C for reaction completed inside the microwave furnace. The lowest temperature for carbide
formation reported for conventional methods is at 1460⁰C [53]. The use of microwave heating
clearly resulted in apparent enhancement in the chemical reaction as expected.
Figure 4.18: Comparison of calcium oxide consumed via microwave (MW) and conventional heating.
0
20
40
60
80
100
120
900 1100 1300 1500 1700 1900
% C
aO
Co
nsu
me
d
Holding temperature
Conventional
MW

79
The use of some materials as subsectors (preheaters) during microwave heating depends on the
response rate of the material in absorbing microwave energy; this is especially useful to aid
increase in heating rate and sintering uniformity for ceramic insulators. These susceptor
materials are usually in coarse powder sand but they could actually be in solid block as well, for
example a rod like shape, for strategic placement in preferred position inside the heating
package. High dielectric loss materials such as silicon carbide with a high response rate are most
times used as sintering bed or packaging material for a ceramic insulator that only absorbs
microwave energy at elevated temperature. The configuration and arrangement of these
susceptors to be used per specific ceramic powder are important factors.
In our work, C/CaO mixture was placed inside a graphite crucible enclosed in an alumina
insulating casket. We did not have the traditional SiC or other qualified packing materials as
susceptor; the use of graphite as part of the reacting mixture and as crucible seem to have served
as microwave absorption platform. The graphite crucible as used act as both container vessel and
the preheater in this case. The casket design is simple in design with the primary aim to minimize
heat loss and also homogenized heat distribution around the heating environment in the course of
the reaction. Another important thing to note in our work is the system of filling and purging the
reaction environment as described in the experimental section here. Presence of oxygen could
combine with CO to form CO2 and this further combine with Ca(OH)2 from CaC2 interaction
with air moisture in the process of cooling the furnace to form calcium carbonate as the final or
part of the final product .
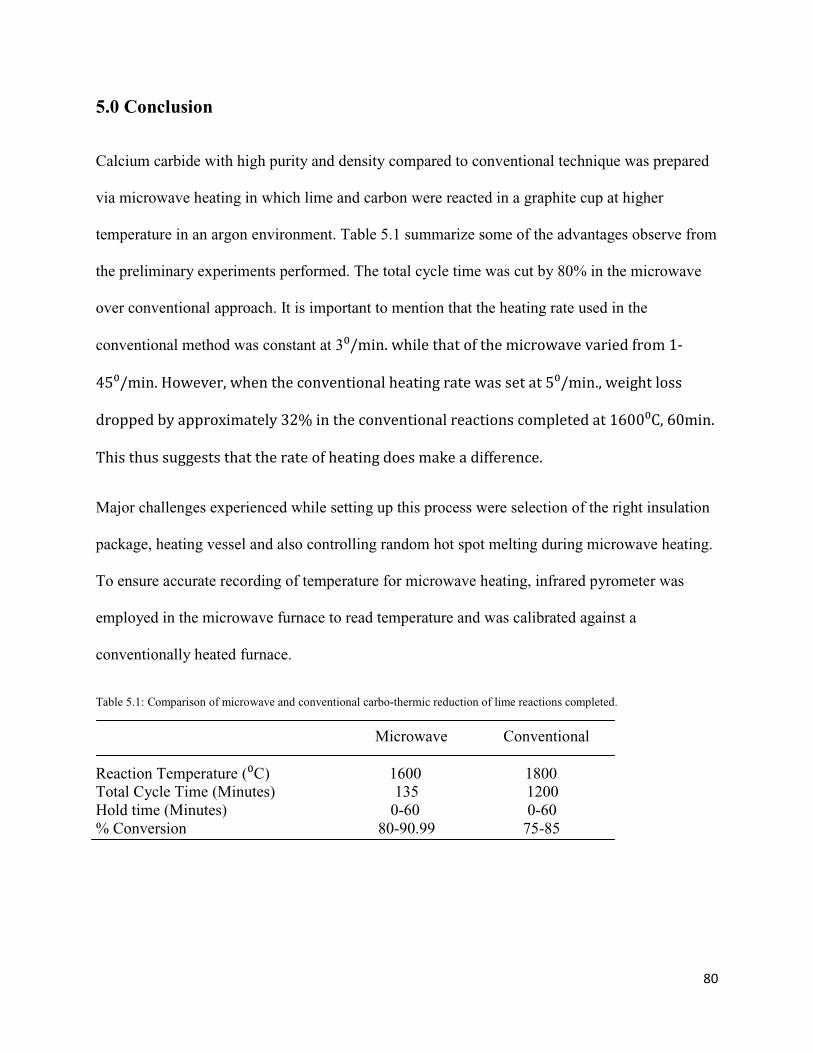
80
5.0 Conclusion
Calcium carbide with high purity and density compared to conventional technique was prepared
via microwave heating in which lime and carbon were reacted in a graphite cup at higher
temperature in an argon environment. Table 5.1 summarize some of the advantages observe from
the preliminary experiments performed. The total cycle time was cut by 80% in the microwave
over conventional approach. It is important to mention that the heating rate used in the
conventional method was constant at 3⁰/min. while that of the microwave varied from 1-
45⁰/min. However, when the conventional heating rate was set at 5⁰/min., weight loss
dropped by approximately 32% in the conventional reactions completed at 1600⁰C, 60min.
This thus suggests that the rate of heating does make a difference.
Major challenges experienced while setting up this process were selection of the right insulation
package, heating vessel and also controlling random hot spot melting during microwave heating.
To ensure accurate recording of temperature for microwave heating, infrared pyrometer was
employed in the microwave furnace to read temperature and was calibrated against a
conventionally heated furnace.
Table 5.1: Comparison of microwave and conventional carbo-thermic reduction of lime reactions completed.
Microwave Conventional Reaction Temperature (⁰C) 1600 1800 Total Cycle Time (Minutes) 135 1200 Hold time (Minutes) 0-60 0-60 % Conversion 80-90.99 75-85

81
The residual materials after the reactions were calcium oxide, unreacted calcium and free carbon.
The types of reaction container condition, insulation package, particle size, pellet compaction
load and reaction time and temperatures influenced the products purity and densification.
Overall, the results of this work showed that microwave heating could be used to synthesize
CaC2 uniformly and quickly at lower temperatures than conventional method. However,
contamination of samples caused by hydrolysis of the highly reactive CaC2 samples formed to
atmospheric air, during ejection and transfer into the glove box for further processing, should be
eliminated completely. In addition, pre-reaction contamination such as CaO conversion into
Ca(OH)2 could also contribute about 25% of H2O ( amount contribution depends on the level of
exposure) picked up during ball-milling and sieving after ball-milling of samples. In our
experiments, these contaminations were limited (completely removed before reaction) by
introducing additional heat-treatment step before introduction of sample into the furnace and the
use of air-tight sample holders during x-ray analyses.
The problems described above were fixed and similar experiments were completed using
conventional furnace. The reactions completed in conventional furnaces where fitted in a 3-
dimensional: Degree of reaction (= apparent conversion) =�1 k l�1m k �$$ nopq3r+. Here we
found the activation energy to be 107 kJ/mol and 12 kJ/mol for lower and higher temperature
range respectively, which was different from what was found in literature. Also we found the
apparent reaction kinetic constants at 1500⁰C, 1600⁰C and 1700⁰C temperature levels as 0.0001,
0.0041 and 0.006 respectively per minute.
An analytical independent determination of all major constituents of the products after reaction
was developed. Rietveld technique as used determined the mass composition for all phases

82
present in simple steps, compare to several multi-steps chemical titration and back calculation
and estimation and exit CO monitoring that exclude trapped amount as practiced for decades.
The standard deviation was 5%.

83
6.0 Future Work
This work mainly focused on gathering experimental kinetic data and measures the conversion
rates for reaction completed in both conventional tube furnace and microwave furnace. While
we have been able to characterize the reaction rates of carbon and calcium oxide precursors with
various size ratios and chemistries and also draw a correlation between the particle
characteristics and the kinetic constants obtained from the reactions completed, there is also need
to perform these experiments in detail.
1) Using other carbon sources such as coal, carbon black and coal char to measure
their influence using relatively smaller sizes than what is presently found in the
literature. The reactivity of carbon does affect the formation of carbide as we have
shown in terms of weight loss at 1500⁰C, 60 minutes. It is important to first
effectively quantify through a proximate analyses, the amount of carbon content
in coal for instance, and the role other volatile materials present play, so as to be
able to compare the outcome with carbon graphite. This will be different from
what others have done in the past since this reaction will be completed inside the
microwave and phase quantification by XRD Rietveld technique. Complete coal
and coal-char based reactions at 1500⁰C-1700⁰C with slow and fast cooling
reaction process for both powder and pellet samples. Variables are packing
density, morphology, reaction time and thickness.
2) The role of smaller calcium oxide sizes specifically to determine how it influences
solid-solid surface contact and mass transfer at that level. The inability to
effectively quantify the amount that vaporizes is reasonable for conflicting
information on kinetic mechanism of this reaction from literature.

84
3) In situ monitoring of the influence of CO/Ar mix composition variation on the
reaction mechanism.
4) Continue tests in the microwave furnace for enhanced transformation kinetics and
low power consumption; completing at 15 minutes holding time interval to
determine the reaction rates constant and activation energy (1000-2100⁰C).
5) Initiate exploratory real-time reaction monitoring of morphological influence on
the reaction mechanism using e-SEM.
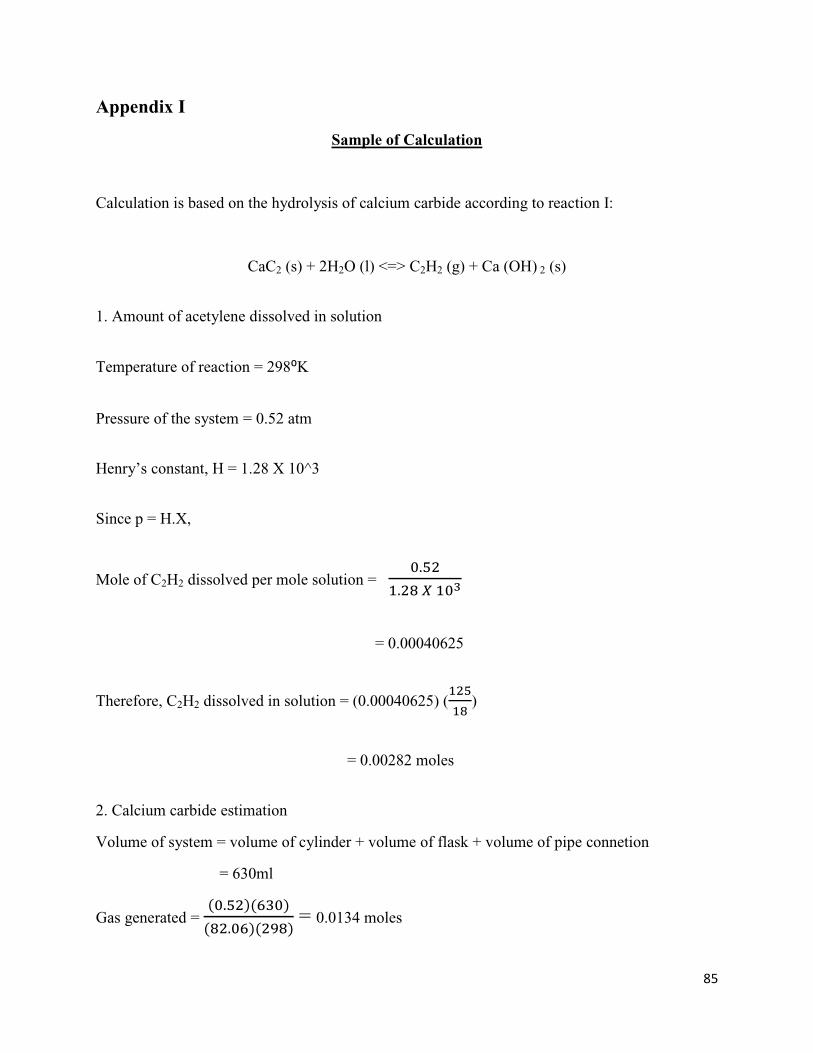
85
Appendix I
Sample of Calculation
Calculation is based on the hydrolysis of calcium carbide according to reaction I:
CaC2 (s) + 2H2O (l) <=> C2H2 (g) + Ca (OH) 2 (s)
1. Amount of acetylene dissolved in solution
Temperature of reaction = 298⁰K
Pressure of the system = 0.52 atm
Henry’s constant, H = 1.28 X 10^3
Since p = H.X,
Mole of C2H2 dissolved per mole solution = �.�
Y. � � Y�m
= 0.00040625
Therefore, C2H2 dissolved in solution = (0.00040625) (Y �Y� )
= 0.00282 moles
2. Calcium carbide estimation
Volume of system = volume of cylinder + volume of flask + volume of pipe connetion
= 630ml
Gas generated = ��.� $����$
�� .��$� ��$ = 0.0134 moles

86
Moles of C2H2 from the composition obtained from the GC = 0.0134 (0.05)
Total moles of C2H2 = 0.0035
Weight percent of CaC2 = (0.0035)(64.08) = 0.2236 g
Yield percent = 0.2236g/0.5555g = 40.25

87
References
1. http://www.airproducts.com/~/media/Files/PDF/company/safetygram-13.pdf, page 2 Air Products and Chemicals, Inc., 1994 2. P. Schwarzkopf and R. Kieffer, Refractory Hard Metals-Borides, Carbides, Nitrides and Silicides. Mc Millan Co.,NY (1953). 3. M. H. El-Naas, R. J. Munz and F. Ajersch, Solid-Phase Synthesis of Calcium Carbide in a Plasma Reactor, Plasma Chemistry and Plasma Processing Volume 18, Number 3 (1998), 409-427. 4. K. Baba and N. Shohata, Manufacture of calcium carbide micropowders by high frequency plasma method, Japanese patent, No. 63112409 (1988). 5. P. Hellmold and W. Gordziel, Investigation of the particular reactions of CaC2: Investigation of the formation of CaC2 from calcium oxide and carbon, Chem. Technol. 35, 297-300 (1983). 6. Mu, J. Jacob, and Robert A. Hard, A rotary kiln process for making calcium carbide. Industrial & engineering chemistry research 26.10 (1987): 2063-2069. 7. C. Brookes, C. E. Gall, and R. R. Hudgins, A model for the formation of calcium carbide in solid pellets, Can. J. Chem. Eng. 53, 527-535 (1975). 8. H. Tagawa and H. Sugawara, The kinetics of the formation of calcium carbide in solid-solid reaction, Bull. Chem. Soc. Jpn. 35, 1276-1279 (1962). 9. C.W. Zhu, G. Y. Zhao and V. Hlavacek, A dc plasma-fluidized bed reactor for the production of calcium carbide. Journal of materials science 30.9 (1995): 2412-2419. 10. Guodong Li, Qingya Liu, Zhenyu Liu, Z. Conrad Zhang, Chengyue Li, and Weize Wu, Production of Calcium Carbide from Fine Biochars, Angew. Chem. Int. Ed. 2010, 49, 8480- 8483. 11. N. A. Hassine, J. G. Binner and P. Cross, Synthesis of Refractory Metal Carbide Powders via Microwave Carbothermal Reduction, T. E. International Journal of Refractory Metals and Hard Materials vol. 13 issue 6, 1995 p. 353-358. 12. D. Agrawal, Latest developments in microwave materials processing, Materials research innovations, 14 (1) (2010) 3-8. 13. E.T. Thostenson and T. W. Chou, Microwave processing: fundamentals and applications Composites Part A: Applied Science and Manufacturing, 30 (9), pp. 1055-1071(1999). 14. Craig Saltiel, Heat and mass transfer in microwave processing, Advances in heat transfer, 33, (1999) 1-94.

88
15. Chris Y. Fang & Clive A. Randal & Michael T. Lanagan & Dinesh K. Agrawal, Microwave processing of electroceramic materials and devices, J Electroceram 22:125–130 (2009). 16. M. Oghbaei, O. Mirzaee, Microwave versus conventional sintering: A review of fundamentals, advantages and applications, Journal of Alloys and Compounds, 494 (2010) 175 -189. 17. T. Mazona, M.A. Zaghete, J.A. Varela and E. Longo, Barium strontium titanate nanocrystalline thin films prepared by soft chemical method, Journal of the European Ceramic Society 27 (2007) 3799–3802. 18. W.H. Sutton, Microwave processing of ceramic materials, Ceramic Bulletin; 68(2): (1989) 376–384. 19. M. A Janney, C.L.Calhoun and H.D.Kimrey, Microwave Sintering of Solid Oxide Fuel Cells- 1.Ziconia –8% Yttria, J. Am. Ceram. Soc., 75(2), (1992) 341-346. 20. P.D.Ramesh, D.G.Brandon, L. Schachter, Use of partially oxidized SiC particle bed for microwave sintering of low loss ceramics, Mater. Sci. Engg. A., 266 (1-2), (1992) 211-220. 21. Guanghua Liu, Jiangtao Li and Kexin Chen, Combustion Synthesis of Ceramic Powders with Controlled Grain Morphologies, Advances in Ceramics - Synthesis and Characterization, Processing and Specific Applications, Prof. Costas Sikalidis (Ed.), ISBN: 978-953-307-505-1, InTech, (2011). Available at: http://www.intechopen.com/books/advances-in-ceramics-synthesis-and-characterization-processing-and-specific-applications/combustion-synthesis-of-ceramic-powders-with-controlled-grain-morphologies. 22. Yasuo Gotoha, Kensaku Fujimuraa, Mikio Koikea, Yutaka Ohkoshia, Masanobu Naguraa, Kensuke Akamatsub and Shigehito Dekib, Synthesis of titanium carbide from a composite of TiO2 nanoparticles/methyl cellulose by carbothermal reduction, Materials Research Bulletin 36 (2001) 2263–2275. 23. C. N. Lin and S. L. Chung, Combustion synthesis method for synthesis of aluminum nitride powder using aluminum containers (II). J. Mater. Res., 19(3), (2004) 3037–3045. 24. http://www.chemsystems.com/reports/search/docs/prospectus/MC06_Acetylene-Pros.pdf 25. F. H. McRitchie and N. N. Ault, Design of a High-Temperature Resistance Furnace. Journal of the American Ceramic Society, (1950), 33: 25–26. 26. http://www.agni.de/chinese/2100C_furnace.htm.
27. Lazau, Peculiarities of ceramics powder synthesis using combustion method, Revue Roumaine de Chimie, 2005, 50(11-12), 919-927. 28. Young-Chul Woo, Ho-Jae Kang and Deug J. Kim, Formation of TiC particle during carbothermal reduction of TiO2, Journal of the European Ceramic Society 27 (2007) 719–722.

89
29. M. B. Muller, Structure, properties and reactions of CaO in burnt lime, Scand. J. Metall. 1990, 19, 64-71. Part 1-3. 30. H.S. Hao, L.H. Xu, Y. Huang, X.M. Zhang, Z.P. Xie, Kinetics mechanism of microwave sintering in ceramic materials, Science in China Series E: Technological Sciences, 52, (2009) 2727-2731. 31. S. L. McGilla, J. W. Walkiewicza and G. A. Smyresa, The effects of power level on the microwave heating of selected chemicals and minerals, Reno Research, Bureau of Mines, pp. (1988) 247-252. 32. Cheng-Yu Hsieh, Chun-Nan Lin, Shyan-Lung Chung, Jiping Cheng, Dinesh K. Agrawal, Microwave sintering of AlN powder synthesized by a SHS method, Journal of the European Ceramic Society 27 (2007) 343–350. 33. D. M. P. Mingos, D. R. Baghurst, Chem. Soc. Rev. 1991, 20, 1. 34. Johanna Nylén, Sumit Konar, Peter Lazor, Daryn Benson and Ulrich Häussermann1, Structural behavior of the acetylide carbides Li2C2 and CaC2 at high pressure, The Journal of Chemical Physics 137, 224507 (2012). 35. http://www.atlantachemical.com/learning_center/microwave_heating.htm 36. G. Li, Q. Liu, Z. Liu, Zhang, Z. C., C. Li and W. Wu, Production of Calcium Carbide from Fine Biochars, Chem. Int. Ed., 49: (2010), 8480–8483. 37. N. Makaratat, C. Jaturapitakkul, and T. Laosamathikul, Effects of Calcium Carbide Residue–Fly Ash Binder on Mechanical Properties of Concrete. J. Mater. Civ. Eng., 22(11), (2010), 1164–1170. 38. L.G. Carreiro et al., Fuel processing technology 91 (2010), 1028-1032. 39. Guodong Li, Qingya Liu, Zhenyu Liu, Z. Conrad Zhang, Chengyue Li, and Weize Wu, Production of calcium carbide from Fine Biochars, Angew. Chem. Int. Ed. (2010) 49, 8480-8483. 40. J.A. Menéndez , A. Arenillas, B. Fidalgo, Y. Fernández, L. Zubizarreta, E.G. Calvo and J.M. Bermúdez, Microwave heating processes involving carbon materials, Fuel Processing Technology 91 (2010) 1–8. 41. T.T. Chen, J.E. Dutrizac, K.E. Haque, W. Wyslouzil and S. Kashyap, The relative transparency of minerals to microwave radiation, Can. Metall. Quart. 23 (1), 1984: 349–351. 42. N. Kameyama, Electrochemistry: Theory and Application, Vol. III-2, 1956, pp. 134-141. 43. Mukaibo and Yamanaka, Kinetics of the first stage of the reaction proceeding calcium carbide under reduced pressure, J. Chem. Soc. Japan, Ind. Chem. Sect. 56, 1953: pp. 73-75.

90
44. M. Knapp and U. Ruschewitz, Structural Phase Transitions in CaC2, Chem. Eur. J. 2001, 7, 874. 45. Ruth Ahlers and U. Ruschewitz, On the Synthesis of Binary and Ternary Carbides in a Modified Domestic Microwave Oven, Journal of Inorganic and General Chemistry, Volume 631, Issue 6-7, May 2005: pages 1241-1246. 46. G. A. Meerson, Yu. G. Olesov and V. I. Pryalochnikov, The reduction of zirconium dioxide by calcium carbide and cyanamide, Soviet Atomic Energy Volume 14, Issue 6 , 1963 ,pp 586-592. 47. Shi, Dejun, Ke Qiao, and Zifeng Yan. Effect of potassium carbonate on catalytic synthesis of calcium carbide at moderate temperature. Frontiers of Chemical Science and Engineering 5.3 (2011): 372-375. 48. http://www.cem.com/page130.html 49. R. Gedye, F. Smith and K. Westerway, The use of microwave ovens for rapid organic synthesis, Tetrahedron letters 1986, 27(3); 279-282. 50. T. Wang, R. Y. Liu, M. L. Zhu and J. S. Zhang, Activation Energy of Self-Heating Process Studied by DSC, Journal of Thermal Analysis and Calorimetry, vol. 70, pp. 507-519, 2002. 51. Chun Lin He, Shao Jian Ma, Xiu Juan Su, Yan Qing Chen and Yu Shi Liang, Calorimetry Study of Microwave Absorption of Some Solid Materials, Journal of Microwave Power and Electromagnetic Energy, 47 (4), 2013, pp. 251-261. 52. G. Li; Q. Liu and Z. Liu, CaC2 production from pulverized coke and CaO at low temperatures reaction mechanisms, Ind. Eng. Chem. Res. 2012, 51, 10742-10747. 53. G. Li; Q. Liu and Z. Liu, CaC2 production from pulverized coke and CaO at low temperatures influence of minerals in coal-derived coke, Ind. Eng. Chem. Res. 2013, 51, 10748-10754. 54. E. Pert, Y. Carmel, A. Birnboim, T. Olorunyolemi, D. Gershon, J. Calame, I.K. Lloyd, and O.C. Wilson, Jr., Temperature Measurements during Microwave Processing: The Significance of Thermocouple Effects, J. Amer. Ceram. Soc., 84 [9] 1981-1986 (2001). 55. R. W. Bruce, A. W. Fliflet, R. P. Fischer, D. Lewis, III, B. A. Bender, G.M. Chow, R. J. Rayne, L. K. Kurihara, and P. E. Shoen, Millimeter-Wave Processing of Alumina Compacts, pp 287-294 in Ceramic Transactions, Vol. 80, Microwave: Theory and Application in Materials Processing IV. Edited by D. E. Clark, W. H. Sutton and D. A Lewis. American Ceramic Society Inc., Westerville, OH, 1997.

91
56. Ammar Khawam, and Douglas R. Flanagan, Solid-State Kinetic Models: Basics and Mathematical Fundamentals, J. Phys. Chem. B, 2006, 110 (35), 17315-17328 57. Hahne, B, Gordziel, and W, Meerbote (1990), Some results of microscopic and x-ray-investigations of calcium carbide, Crystal Research and Technology, 25(3), 313-324.
58. Steven Lee Rowan, Ismail Celik, Jose Escobar Vargas, Suryanarayana Raju Pakalapati, and Matt Targett, Reaction Kinetics Modeling of CaC2 Formation From Coal and Lime, Ind. Eng. Chem. Res., Just Accepted Manuscript : Publication Date (Web): 16 Jan 2014.