111.pdf - NCBI
82
STUDIES IN MILK SECRETION. V. ON THE VARIATIONS AND CORRELATIONS OF MILK SECRETION WITH AGE' JOHN W. GOWEN Maine Agricultziral Experiment Station, Orono, Maine [Received September 8, 19191 TABLE OF CONTENTS INTRODUCTION ................................................................ I I I Material and methods ........................................................ 112 Variation of Jersey milk production with age at commencement of test.. ........ I14 Analytical constants describing the variation of milk production at different ages.. 119 The correlation of Jersey 8-months milk production with age at test.. .......... 129 Types of the regression of milk production on age of Jersey cattle.. ............ 132 The nature of the curve of the standard deviation of milk production.. ........ 133 The correlation between milk yield of one lactation and that of succeeding lacta- tions ........................... .i .................................... 135 13j time the cow is retained in the herd .................................. 144 the cow is retained in the herd 148 eight-months milk production at any other given age .................. 156 The regression of the milk production of the different lactations on each other.. 164 The correlation of the milk production of a given age with the total production of two lactations ..................................................... 169 Practical aspect of the correlations for milk production of one lactation record with another lactation record .......................................... 180 The relative contribution of one year's milk production to the total production over the first five lactations ........................................... 181 SUMMARY .................................................................... 182 LITERATURE CITED ............................................................. 186 Mean milk production of cows retained long or short periods in the herd.. .. The standard deviation of milk production as influenced by the length of The coefficients of variation of milk productiQn as influenced by the time The correlation of eight-months milk production at a given age with the ........................................ INTRODUCTION A large body of exact scientific data on milk production has been ac- cumulated since the time of the establishment of the ADVANCED REGIS- TRY SYSTEM of the HOLSTEIN-FRIESIAN ASSOCIATION OF AMERICA and its later adoption by the Associations of the other breeds of dairy cattle. These completed records are unique in several ways, chief among which Papers from the Biological Laboratory, MAINE ~RICULTURAL EXPERIMENT STATION, No. 126. GENETICS 5: 111 Mr 1920
-
Upload
khangminh22 -
Category
Documents
-
view
0 -
download
0
Transcript of 111.pdf - NCBI

STUDIES IN MILK SECRETION. V. ON T H E VARIATIONS AND CORRELATIONS OF MILK SECRETION W I T H AGE'
JOHN W. GOWEN Maine Agricultziral Experiment Station, Orono, Maine
[Received September 8, 19191
TABLE O F CONTENTS INTRODUCTION ................................................................ I I I
Material and methods ........................................................ 112
Variation of Jersey milk production with age at commencement of test.. ........ I14 Analytical constants describing the variation of milk production at different ages.. 119 The correlation of Jersey 8-months milk production with age at test.. .......... 129 Types of the regression of milk production on age of Jersey cattle.. ............ 132 The nature of the curve of the standard deviation of milk production.. ........ 133 The correlation between milk yield of one lactation and that of succeeding lacta-
tions ........................... .i .................................... 135 1 3 j
time the cow is retained in the herd .................................. 144
the cow is retained in the herd 148
eight-months milk production at any other given age .................. 156 The regression of the milk production of the different lactations on each other.. 164 The correlation of the milk production of a given age with the total production
of two lactations ..................................................... 169 Practical aspect of the correlations for milk production of one lactation record
with another lactation record .......................................... 180 The relative contribution of one year's milk production to the total production
over the first five lactations ........................................... 181 SUMMARY .................................................................... 182 LITERATURE CITED ............................................................. 186
Mean milk production of cows retained long or short periods in the herd.. . . The standard deviation of milk production as influenced by the length of
The coefficients of variation of milk productiQn as influenced by the time
The correlation of eight-months milk production at a given age with the ........................................
INTRODUCTION
A large body of exact scientific data on milk production has been ac- cumulated since the time of the establishment of the ADVANCED REGIS- TRY SYSTEM of the HOLSTEIN-FRIESIAN ASSOCIATION OF AMERICA and its later adoption by the Associations of the other breeds of dairy cattle. These completed records are unique in several ways, chief among which
Papers from the Biological Laboratory, MAINE ~ R I C U L T U R A L EXPERIMENT STATION, No. 126.
GENETICS 5: 111 Mr 1920

I13 JOHN W. GOWEN
is the fact that the records of the cows included among them must meet a certain standard of performance. This standard for entry has the effect of cutting out certain records of cows of the given breed. Thus the JER-
SEY REGISTRY OF MERIT (THE AMERICAN JERSEY CATTLE CLUB 1906) says that, “if the test is commenced the day the cow is two years old, or previous to that day, she must produce within one year from the date the test begins, 250.5 pounds of butter-fat. For each day the cow is over two years at the beginning of her year’s test, the amount of butter- fat she must produce in: the year is fixed by adding 0.1 (one-tenth) of a pound for each such day to the 250.5 pounds required when two years old. This ratio of increase applies until the cow is five years old at the beginning of her test, when the required amount will have reached 360 pounds, which will be the amount of butter-fat required of all cows five years old or over. These standards are based upon one complete year’s record from the time of beginning, regardless of any time which may be lost by being dry or calving during the period.” Three facts are ob- viously true of the JERSEY REGISTRY OF MERIT cows as compared with a true sample taken at random of the milking cows of the Jersey breed; ( I ) the cows making up the REGISTRY OF MERIT are a selected sample: (2) the scale of the selection is linear having its lower limit 250.5 pounds of butter-fat production at 2 years and its upper limit 360 pounds at 5 years and over; ( 3 ) this requirement means that for each day of age at test that frequency distributions of years production are cut off per- pendicularly at the requirement and only those animals making greater yields than this are allowed to be entered into the REGISTRY OF MERIT. The data taken from this REGISTRY OF MERIT are not the true data for the Jersey breed and conclusions based on it cannot be considered as ap- plying to the breed as a whole or to the general problems of milk secre- tion.
MATERIAL AND METHODS
T o supply this need of exact data on the Jersey breed as a whole the MAINE AGRICULTURAL EXPERIMENT STATION has obtained the recorded data on one of the largest pure-bred Jersey herds known. The data are exceptional in the following ways : ( I ) The records extend back to the year 1897 when the herd was organized; (2) the animals are practically all straight Island stock : ( 3 ) they have been under the oversight and di- rection of one manager since 1901; (4) exact records are kept of the milk production, butter fat and butter-fat percent; ( 5 ) many of the in- dividual animals have records for several different lactations. The elimi-

CORRELATIONS OF MILK SECRETION WITH AGE 113
nation of variation of the milk production of cows or groups of cows caused by changes of any one or more of these five factors is important for the analysis of the causative mechanism of milk and butter-fat pro- duction. I t is obvious that these records are free from such variables. They constitute a homogeneous group of data representing the Island Jersey under constant conditizns of management and climate.
Such an accumulation of exact qatistical data on the cows of the Jersey breed, for problems <of so much interest, both biologically and eco- nomically, warrants the application of adequate biometrical methods in their analysis. ~ Such analysis is now well recognized by most investi- gators as of the utmost importance to our understanding of the funda- mental principles of physiology which underlie the process of milk secretion itself. c,
The general problems attacked are those of the individual variation between the lactating functiogs of different dairy cows at a given age. What is the true type of the frequency’distributions of milk produc- tion? What relation exists between the mean productions of the suc- cessive ages in a’ true random sample of the Jersey breed? An under- standing of these andosimilar questions is necessary to the fuller utiliza- tion of the data f%und in theherd book of tlie registry association for as previously pointed out the requirement for entrance acts as a true truncating agent to the frequency distribution of a given age. Without a knowledge of the type of these frequencies n; true correction factors may be determined to properly allow for the increase in age of the cows either for direct comparison of yields or for inheritance studies.
The biometrical methods used are in general those of any adequate analytical treatment of a quantitative subject. In each c3se reference to the source of the original publication where the methods may be found are given where the formula is first used. In each case the standard de- viations have SHEPPARD’S correction applied to. them as a glance at the data shows that high contact ii’present .in the distributions.
Two diseases have been present in the herd, tuberculosis and abortion. The tuberculous animals were all eliminated early in the herd’s history by the use of the tuberculin test. All records from animals which were proven to be tubercular or ,which aborted were not used. Records from animals normally healthy but sick during a given lactation were not used. All of the cows have been kept in climatic conditions similar to those of western Virginia.
A word as to the method of keeping the data and its transfer to this
_.
The data used-for study are all from normal, healthy cows.
GENETICS 5: Mr 1920

114 JOHN W. GOWEN
STATION is perhaps necessary. All records are made at the time of milk- ing on the daily milk sheets for the given cow which are kept in the barn. The milking takes place twice a day, the records are for night; and morn- ing. The Tveekly production taken from these sheets is transferred to the herd ledger by a trained bookkeeper. The total production for a given month is found together with the yearly production by adding the weekly totals. All records are recorded to pounds and tenths. The cows are tested bi-monthly by the BABCOCK test and the percentage of butter- fat is recorded beside its corresponding monthly milk yield. All weigh- ings and readings are recorded immediately after they are made so there is little chance of, inaccuracy. From these records the author has ex- tracted 1741 complete 8-months records of healthy cows for milk pro- duction. Of these 1741, 1713 have records for the butter-fat percent. The weighted monthly averages of the bi-monthly test have been used to obtain the weighted 8-months average for the 8-months lactation period chosen for study.
VARIATION O F JERSEY MILK PRODUCTION WITH AGE A T
COMMENCEMENT O F TEST
The tabulation of these records in complete eight-months records has been done by the author. The choice of a proper interval of grouping for age was decided upgn as one year, that is, grouping all of those Hec- ords commenced while the cows were z years, no months and no days, to 3 years, no months and no days, and so on to include up to fo years, no months and no days. The group IO years-and-above has been in- cluded in one group as the numbers were quite small in the older age classes. The absolute and percentage frequencies determined for the different age classes are shown in table I.
Table I together with figure I makes clear the following points in re- gard to frequency distributions of milk production.
( I ) The frequency polygons show milk production to be quite sym- metrical.
( 2 ) The range of variation is quite considerable, extending from one cow which produced under 1500 pounds for the eight-months period to one which produced over ~ Q , O O O pounds.
(3) The polygons change their shape with increase in age at the com- mencement of the test, those of the early ages being higher at the mode and less scattered than those of the later years. (4) There appears to be only one mode in all of the distributions.
From this it seems probable that the polygons belong to the unimodal

GO
WE
N,
J. W
., O
N T
HE
VA
RIA
TIO
NS
AN
D C
OR
REL
ATI
ON
S O
F M
ILK
SE
CR
ET
ION
W
ITH
A
GE
Fre
quen
ry d
istr
ibut
ions
of
vari
atio
ns for
the
eig
ht-m
onth
s la
ctat
ion
reco
rds of a
hom
ogen
eous
hw
d of J
erse
y cows a
t di
ffer
ent
ages
. A
bsol
ute
and
TA
BL
E I
perc
e@ta
ge fr
eque
ncie
s.
Age
, 2 y
rs.,
o m
os.,
to
Age
, 3 y
rs.,
o m
os.,
to
Age
, 4 y
rs.,
o m
os.,
to
Age
, 5 y
rs.,
o m
os.,
to
6 yr
s.,
o m
os.
Age
, 6 y
rs.,
o m
os.,
to
7 yr
s., o
mos
. 4
yrs.
, o
mos
. 5
yrs.
, o
mos
.
2,
.8
1.0
6500
to 7000
7000 to
750
0 75
00 t
o xoo
o 80
00
to 8
500
8500
to
woo
wo
o to
950
0 95
00 t
o Io
ooo
roo0
0 to
105
00
Tot
al
100.
0
GE
NE
TIC
S 5
: 11
5 M
r 19
20

__
_~
__
prod
uced
Po
unds
of
milk
1000 to 1
500
I500
to 2Ooo
2000
to 2500
2500
to 3000
3000
to 3500
3500 to
4O
oo
4000 t
o 4500
v
Age
, 7 yr
s., 0 m
os.,
to
Age
, 8 y
rs.,
o m
os.,
to
Age
, g yrs., 0 m
os.,
to
Age
, IO y
rs.,
o m
os.,
to a
bove
T
otal
pop
ulat
ion
9 y
rs.,
o m
os.
IO y
rs., o
mos
.
Abs
olut
e Pe
rcen
tage
A
bsol
ute
Perc
enta
ge
freq
uenc
y fr
eque
ncy
freq
uenc
y fr
eque
ncy
.I
yrs.
, m
as*
i
2
2.4
.6 1
.8 6
7.1
5.9
212
12.2
11.8
I1
12.9
18
16.8
279
16.0
4.1
7.1
5 16
9.4
14.1
I
11.8
6 7.
I 8
7.5
2
1.2
I 7
I5
I3
10.2
15
I 7.6
27
21.3
I5
17.6
I5
11.8
5 5.9
10.2
8
94
9 7. I
8 9.4
I3
3.9
2
2.4
I 1.8
16.5
12.4
11.8
8.2
5.9
5 I .8
2
I .6
I I .2
I .8
I .8
I 1.2
4500 t
o 50
00
to 5
500
5500
to
6ooo
6ooo to
650
0 65
00 to
7000
7000 to
7500
7500
to
so00
8o
oo t
o 8500
8500 t
o 9
000
.6
9Ooo
to
9500
9500
to
Iooo
o I
.8
Ioooo to r
oyx)
I
.8
21
19.6
274
15.7
19
17.8
266
15.3
I2
11.2
I 6.2
9.3
7
6.5
127
7.3
5 4-7
82
4.7
2
1.9
58
3.3
I .9
26
1.5
15
.9
.2
3
2
.I
2
.I
3 .2
Tot
al
100.2
I 127
1 10
0.0
100.1
I7
99.9
1741
I 100.0

CORRELATIONS OF MILK SECRETION WITH AGE
type although this point cannot be accurately determined, as the his- tograms are quite flat-topped.
The accuracy of these conclusions is further brought out by a study of the chief physical constants of the distributions. Table 2 gives the four constants, mean, standard deviation, coefficient of variation, and skewness, together with their probable errors for each frequency of age.
1 1 7
2 yrs., o mos., to 3 yrs., o mos. 3 yrs., o mos., to 4 yrs., o mos. 4 yrs., o mos., to 5 yrs., o mos. 5 yrs., o mos., to 6 yrs., o mos. 6 yrs., o mos., to 7 yrs., o mos. 7 yrs., o mos., to 8 yrs., o mos. 8 yrs., o mos., to g yrs., o mos. 9 yrs., o mos., to IO yrs., o mos. IO yrs., o mos., and above
TABLE 2 Constants of variation of milk production for the successive ages at test in Jersey milk.
(Eight-months lactation period.)
1 Mean 1 deviation
_ _ _ _ _ _ _ ~ __
Standard Coefficient of ~ Skewness variation I
I
Age at test
4032.9 f 31.7 4686.5 f 46.8 4992.9 rfr 46.3 5281.4 f 57.0 5536.5 * 64.5 5314.7 2 64.9 5226.4 f 77.9 4938.2 f 95.3 4838.8 2 70.3
818.9 f 22.4 1101.5 2 33.1 1079.4 f 33.0 1262.8 & 40.3 1325.3 rfr 45.6 1255.0 rfr 45.9
1302.6 k 67.4 1302.0 f 55.1
1077.3 rfr 49.7
20.304 2 .577 23,503 2 .7IZ $.O.a642 2 .Os@ 21.619 f .684 +0.3532 k .0635 23.911 rfr .&I -1 0.3894 & ,0714 23.938 rfr .865 $0.2586 rfr .d28 23.613 rt 4-07
26.377 f 1.453 24.912 2 1.111 +0.3141 * .I173 22.264 f 1.028
Total population 1249.7 & 14.3
It seems best to postpone the complete discussion of the facts brought out in this table until other data to be presented are available. A few general points of especial interest may be mentioned, however. The mean milk production for the eight-months period for those cows which are between 2 and 3 years of age is 4032.9 pounds. From this point the milk production rises rapidly at first, then more slowly to a maximum at about 7 years. From this maximum the decline in milk production is less rapid toward the higher ages.
The difference between the production of 2 years and 6 months and the maximum is significant, as the difference is about 20 times its prob- able error (1503.6k71.9). The difference between the maximum pro- duction and that for the IO years and above is also significant, as the difference is more than 6 times the probable error (697.7k95.40). This rise and fall of milk production with age has already been shown, by the work of this laboratory (PEARL 1914)~ to conform to that group of curves described by a logarithmic function.
The standard deviation varies between 818.9 pounds at the age of 2 to 3 years to 1325.3 pounds at the age of 6 to 7 years. The rise of the
25.569 f .SI0 +0.3150 2 0222
GENETICS 6: 1Mr 1920

I IS JOHK W. GOWEN
standard deviation is more direct than is the rise of the mean curve. From the maximum the curve remains parallel with the base line for some years when it again drops to a lower deviation at the highest age at test. This rise and fall is significant as judged by the probable errors of the difference (PEARL 1909). The difference of the maximum stan- dard deviation at 6 to 7 years from that at z to 3 years is 506.4 pounds of milk where the probable error is 9 .8 pounds, or the difference is practically IO times the probable error and the probability that this dif- ference did not come from random sampling is considerably greater than ~,ooo,ooo,ooo to I (ELDERTON 1901, PEARSON 1900). The difference between the maximtlm standard deviation and that at IO year4 and above is 248.0 pounds and the probable error is 67.5 pounds or 3.68 times the probable error and the probability that this difference did not come from random sampling is 75.2 to I . The conclusison seems justified from the above facts that the standard deviation varies with age at test in such a way that the absolute amount of the standard deviation is leastat the early age, increases rapidly to a maximum at about 5 years and 6 months, re- mains at this maximum for about four years then falls agajn toward
The coefficient of variation for the milk production af the successive ages are all high as compared with those already known for other simi- lar data. This large size in the coefficients is brought out by table 3.
the later ages. 0
TABLE 3 Comparison data for coeficients o f variation o f amount o f secretion.
Coefficient of Source of 1 variation 1 data Secretion
-
Organism
Domestic fowl (Bm-ed Plymouth Rock) , Annual egg production Cattle, British Holstein Gallons of milk Cattle, Ayrshire Gallons of milk Cattle, Jersey Pounds of milk
* Probable error calculated by author from totals given in GAVIK'S paper. + Calculated by the author from the means and standard deviation as given by VIGOR (1913).
Of the substances studied annual egg production is the most variable. The coefficients .of variation for milk production correspond remarkably well considering the diversity of the sources from which they are taken. They all go to show that milk production varies around a mean of 25,
or about 9 percent less variable than egg production. This difference is significant. The mechanism of the secretion of the sum of the egg

CORRELATIONS O F MILK SECRETION WITH AGE 119
parts to form the egg is shown to be more variable than that for the secretion of the milk parts to form the milk. Taking this reasoning back to its ultimate source, such a significant difference shows that the secretory cells of the mammary glands work with greater precision than do the cells of the oviduct. Such a difference in the precision of action of the two sets of cells would seem to indicate a greater approach to perfection, in a mechanical sense, in the cells of the udder than is true of the cells of the aviduct.
The skewness of the two sets of data furnish another interesting con- trast. The skewness for annual egg production for Barred Plymouth Rock hens is -0.205 whereas the skewness for Jersey milk production is +0.315. Not only is the sign different but the actual amount is dif- ferent. This cannoi be explained on the basis of any selection for high producers that may have taken place, as both sets of data are about equally subject to such selection. The data" for the successive age groups all go to show that where the distributions for milk production are skew they are all plus. This lends further strength to the belief that the distribution for the yearly production of the two sets of glands is skew in opposite directions. One thing is common in the two cases, the skew- ness in each is small in amount. This is of especial importance as it shows an approach to the value where the typical Gaussian curve of error may describe these functions.
ANALYTICAL CONSTANTS DESCRIBING T H E VARIATION OF MILK PRODUC- TION AT DIFFERENT AGES
The general physical constants of milk production having been con- sidered, the further analysis of its problems requires a knowledge of the types of frequency distributions which go to make up the lactation record of a cow during her life time. "In the solution of this kind of data comes the ahswer to such problems as, does the type of milk- production distribution of cows milking at two years old differ from that of cows milking at three years old. This question is of great im- portance in considering the milking records of advanced-registry ani- mals where it is necessary to form an opinion of the capacities of a breed from the milking abilities of a selected sample where the selection is not at random-but removes those cows producing under a certain amount.
This feature of the problem is seen in the work of REITZ (1909) on the inheritance of butter-fat production in Holstein Friesian cattle.
GENETICS 5 : Mr 1920
I 2 0 JOHN W. GOWEN
I1 8069.15
71.7407 3.36
The data for this problem came from the advanced registry of Holstein Friesian cattle, Since as a requirement to entry in this registry the cows must produce more than a certain amount of butter-fat, the cor- relation from such data measuring the strength of inheritance are sub- ject to a double selection. RIETZ in correcting for this selection uses the method devised by PEARSON to determine the whole of a normal curve when a portion of it is known. The accuracy of the corrections depend then on the curves for milk production and for butter-fat per- centage being normal.
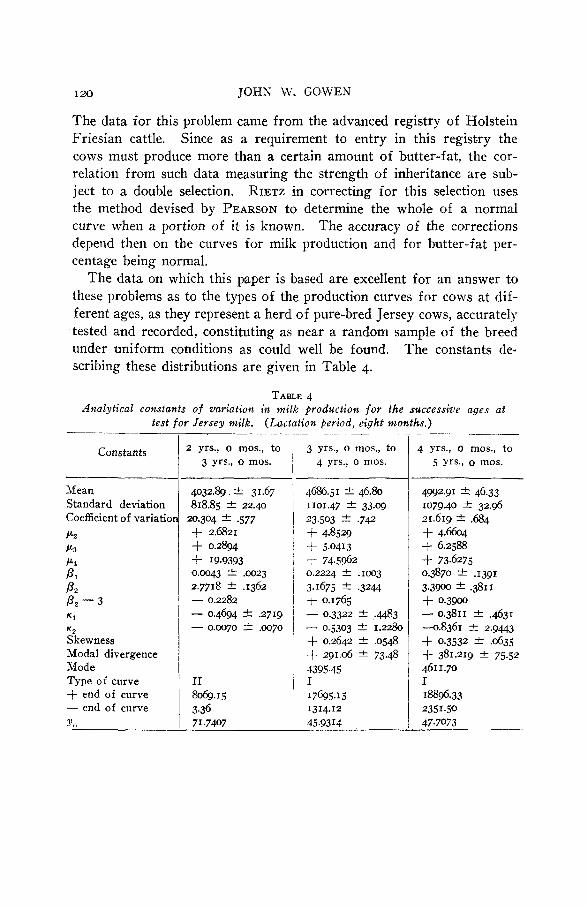
The data on which this paper is based are excellent for an answer to these problems as to the types of the production curves for cows at dif- ferent ages, as they represent a herd of pure-bred Jersey cows, accurately tested and recorded, constituting as near a random sample of the breed under uniform conditions as could well be found. The constants de- scribing these distributions are given in Table 4.
I I7%5. I5
45.9314 1314.12
TABLE 4 Analytical constants of variation in milk production for the successive ages at
test for Jersey milk. (Lactation period, eight months.)
Constants
Mean Standard deviation Coefficient of variatioi PZ P3
P4
PI P Z
P Z - 3 K 1
KZ Skewness Modal divergence Mode Type of curve + end of curve - end of curve
____ 2 yrs., o mos., to ' 3 yrs., o mos., to
3 yrs., o mos. ' 4 yrs., o mos. I
4032.Xg. 3. 31.67 818.85 f 22.40
20.304 f .577 + 2.6821 + 0.28gq + 19.9393 0.004 C .0023 2.7718 C .1362 - 0.2282
- 0.0070 k ,0070 - 0.4694 k 2719
4686.51 C 46.80
23.503 f .742
$. 5.0413 -k 74.5962 0.2224 C .roo3 3.1675 -C- .3244
1101.47 & 33.09
+ 4.8529
+ 0.1765 - 0.3322 lk 4 8 3 - 0.5303 -1- 1.2280 + 0.2642 -C ,0548 + 291.06 & 73.48 3395.45
4 yrs., o mos., to 5 yrs., o mos.
4992.91 * 46.33
21.619 rf: .684 + 4 . m + 6.2588 + 73.6275
3.3900 -1- ,3811 f 0.3900 - 0.3811 -C- ,4631 4 . 8 3 6 1 -1- 2.9443 + 0.3532 -C .Of535 + 381.219 75.52 461 1.70
1079.40 a 32.96
0.3870 2 .I391
r 18896.33 235130 47.7073
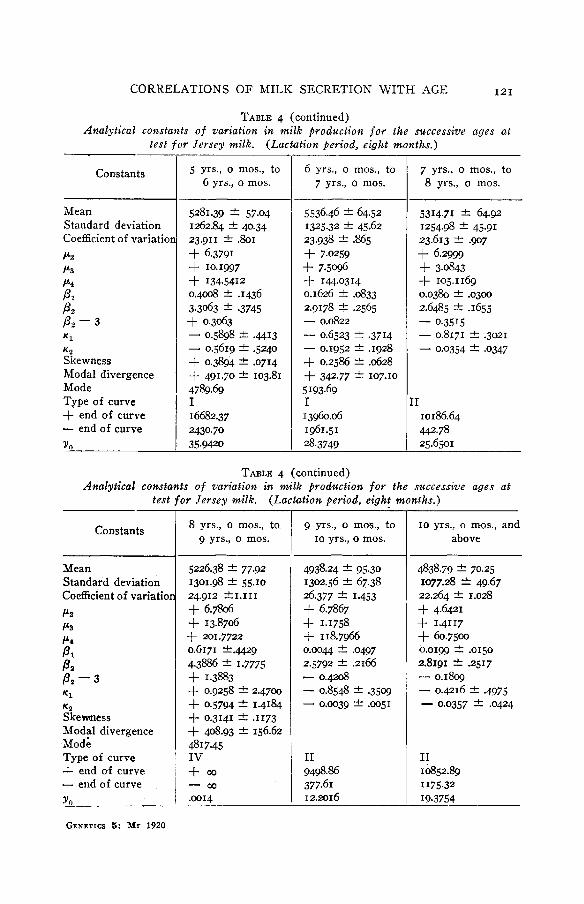
CORRELATIONS OF MILK SECRETION WITH AGE I21
Mean Standard deviation Coefficient of variation PZ P3
P4
PI P 2
Pz - 3 K 1
K Z Skewness Modal divergence Mode
TABLE 4 (continued) Analytical constants of variation in milk production for the successive ages at
test f o r Jersey milk. (Lactation period, eight months.)
5281.39 f 57.04 1262.84 f 40.34 23.911 f. .%I + 6.3791 + 10.1997 + 134.5412 0.4008 f .1436 3.3063 f .3745 + 0.3063 - 0.5898 Zk 4413
+ 0.3894 Ifl .0714 + 491.70 f 103.81 4789.69
- 0.5619 f .5240
I
9 yrs., o mos., to IO yrs., o mos.
5 yrs., o mos., to 6 yrs., o mos.
Constants
IO yrs., o mos., and above
4938.24 f 95.30 1302.56 f 67.38 26.377 2 1.453 + 6.7867 + 1.1758 + 118.7966 0.0044 & .0497 2.5792 k .2166 - 0.4208 - 0.8548 f .3509 - 0.0039 f ,0051
I1 9498.86 377.61 12.2016
6 yrs., o mos., to 7 yrs., o mos.
~
4838.79 f 70.25 1077.28 k 49.67 22.264 Zk 1.028 + 4.6421 + 1.4117 + 6.7500 0 . O I g g f .OI 50 2.8191 -C .q17 - 0.1809 - 0.4216 f. .4975 - 0.0357 f .OF4
I1 10852.89 1175.32 19.3754
5 536.46 f. 64.52 1325.32 f 45.62
+ 7.0259 23.938 f. .%5
+ 7.5096 + 144.0314 0.1626 f .0833 2.9178 f .2565 - 0.0822 - 0.6523 Zk .3714 - 0.1952 f .1928 + 0.2586 f .0628
5193.69 I 13960.06 I 961.5 I 28.3749
+ 342.77 f. 107.10
7 yrs., 0 mos., to 8 yrs., o mos.
5314.71 f 64.92 1254.98 45.91 23.613 f. .go7 + 6.2999 + 3.0843 + 105.1169 0.0380 If: .03m 2.6485 f. .1655
- 0.8171 f .3021 - 0.3515
- 0.0354 f .OS47
I 10186.64
25.6 501 442.78
TABLE 4 (continued) Analytical coltstants o f variation in milk production for the successive ages a t
test for Jersey milk. (Lactation period, eight months.)
Constants
Mean Standard deviation Coefficient of variatioi PZ P3
P 2
P a - 3 K 1
K l Skewness Modal divergence Mode Type of curve + end of curve - end of curve y o
GENETICS I: ,Mr 1920
8 yrs., o mos., to- g yrs., o mos.
5226.38 f 77.92 1301.98 f 55.10
+ 6.7806 + 13.8706
0.6171 2.4429 4.3886 f 1.7775 + 1.3883 + 0.9258 f 2.4700 + 0.5794 1.4184
+ 408.93 f 156.62 48 17.45 IV + o o
.0014
24.912 ZkI.111
+ 201.7722
+ 0.3141 f .I173
CO -

I22 JOHN W. GOWEN
Constants
Mean Standard deviation Coefficient of variation P2
P3
P4
P I
P* P, - 3
TABLE 4 (continued) Analytical constants of variation in milk production f o r the successive ages at
test for Jersey milk. (Lactation period, eight months.)
Total population
4887.56 f 20.21 1249.71 -t- 14.28 25.569 & .3IO + 6.2471 + 9.6623
~ + 138. 3606 0.3829 2 .&I3 3.5454 '-c -1979 + 0.5454
Modal divergence Mode
Attention may be directed first to the moments of the individual dis- tributions of milk production for the groups of the successive yearly ages. The third moment is consistently plus and on the whole rather small. I n no case is the value so great as three times its probable error. pz is likewise only slightly different from the value 3 demanded by the normal curve. I n no case is this difference as great as three times its probable error. Out of the nine age groups into which the data have been di- vided &-3 is plus four times and minus five times. No consistency is shown in the sign and it seems safe to say its change of direction comes from random sampling. The sign of K ] is plus once and minus eight times; its value in no case exceeds three times its probable error. The sign of K* is of course, governed by that of K]. The absolute value varies between 0.0039 and 0.8361. The values of the probable errors are all large in comparison with the values of K * .
These facts all lead to the conclusion that no great confidence can be placed in either the sign or the absolute magnitude of the criterion for the frequency type. Such big probable errors of K~ and K~ suggest that all of the curves are near the critical limit of more than one type of frequency curve. The problem now becomes: what is the chance that
The moments lead to values of PI which are rather small.
+ 393.65 2 29.91 4493.91
yo 288.674

CORRELATIONS OF MILK SECRETION WITH AGE 123
a frequency distribution, other than that indicated by the criteria may be obtained to fit the data equally well. I t is necessary therefore to turn to the probable errors of the frequency type itself to determine this ques- tion. The tables and diagrams necessary for the speedy determination of this have been calculated by RHIND (1909). Comparison of the values of Z1 2, with diagram for the frequency type contained in this paper together with the other necessary calculations shows the types indicated iq table 4 should give a good fit.
The distributions for the successive ages are shown to be equally types I and I1 with one which is type IV. Five of the curves are skew and four symmetrical; eight are limited in range in both directions and one is unlimited in range. The equations to these curves are as follows.
Age at test 2 years to 3 years: X2 10.648
Age at test 3 years to 4 years:
3081.32
Age at test 4 years to 5 years:
6.2322 X
(1 - 13299.70
Y =45.9314 ( 1 + 1
) 25*4999 14284.63 )4.0347(I - 2260.20 Y = 47,7073 (1 + Age at test 5 years to 6 years:
j4*5074 I 1892.68 Y = 35.9420 (1 + 1 2*8776 (1 -
2358.99 Age at test 6 years to 7 years:
* 1 Y = 28.3749 (1 + 1 3.8103 (1 - 8766.38 3232.1 7 Age at test 7 years to 8 years:
y = 25.6501 (I - X a , 1 6.0352 23,735,702
Age at test 8 years to g years: X
21.08~2 tan - I y = .0014 (I + x2 ' )+.gm e 3477.66
IZ,Og4,088
GENETICS 5: Mr 1920

124 JOHN W. GOWEN
Age at test g years to I O years:
YW4 X Z
20,7991 307 y = 12.2016 ( I -
Age at test IO years and above: X Z 14.0831
Y = 19.3754 (1 - ) 3691 6995 I9
Total population :
* 1 213.a4 x 8.086 X
( 1 - ' 91 385.33
y=288.674 ( I f ) 3464.52
The histograms and the fitted curves for the milk production of the individual ages are shown in figure I . All of the areas have been re- duced to a percentage base so that the ordinates and areas of each dis- tribution could be compared directly.
It is clear to the eye that on the whole the graduation of the data by the fitted curves is rather good. Measured mathematically by the test of goodness of fit (ELDERTON 1901; PEARSON 1900) of the theoretical curve to the raw data the value of P ranges between 0.5864 and 0.9942 as shown by table 5 .
TABLE 5 Values o f P f o r the fit of the theoretical cuwes to the obser-vational cumes for
milk production of Jersey cattle.
Age at test P I -
2 years to 3 years 3 years to 4 years 4 years to 5 years 5 years to 6 years 6 years to 7 years 7 years to 8 years 8 years to g years g years to IO years
IO years and above
This table brings out the excellence of the graduation of the data by the frequency curves.
As previously stated eight of the nine curves are of limited range in both directions and one of unlimited range in either direction. The limits of these ranges are of especial interest since they indicate the highest and lowest milk production expected for a given age. It is evi-

E?
I I fd
oo
~d
oo
sho
o W
O @do0
1500
3500
S$
OO
7500
e;sW
zdm
4&0
sdoo
sd
oo
io40
0
8Mon
ths M
ilk P
rodu
ction
(Po
unds
) FIGURE
I.-H
isto
gram
s an
d fi
tted
curv
es s
how
ing
the
vari
atio
n of
m
ilk p
rodu
ctio
n fo
r ea
ch y
ear
of
age.
T
he a
rea
of
each
cu
rve
is r
educ
ed t
o un
ity s
a th
at a
ny d
istr
ibut
ion
of a
giv
en a
ge
may
be
com
pare
d w
ith
ony
othe
r at
ano
ther
age
. T
he r
elat
ive
incr
ease
in
the
heig
ht o
f th
e m
odel
ord
inat
es a
t th
e lo
wer
and
hig
her
ages
of
lact
atio
n as
com
pare
d w
ith
the
ages
6 to
IO
year
s is
qui
te e
vide
nt.
The
fitt
ed c
urve
s ar
e al
l PE
AR
SON
ty
pe c
urve
s th
e co
nsta
nts
of w
hich
are
see
n in
tab
le 4
. G
ENET
ICS 5
: 12
5 M
r 19
20

I 26 JOHN W. GOWEN
dent that in the symmetrical curves (type 11) the plus end of the range is not as high as in the type I curves, in fact, the end of the range of high milk producers is rather underestimated than overestimated. The type I curves estimate the highest expected milk production at what we might consider a fair estimate. Thus, Jersey cows 3 years to 4 years old would not be expected to produce more than 17,695 pounds of milk in 8 months. This is borne out by the actual experience of the breed. The figure 10,186 for the 8-months production in the 7-year to 8-year class is low, however, compared with the production of certain REGISTRY-OF- MERIT cows; e.g., Passport is known to have produced 19,694 pounds in one year. Such a difference in the plus end of the range would seem to indicate a real difference of this group of Jerseys from those of the ad- vanced registry group in the direction of an extended range for the REGISTRY-OF-MERIT animals.
The minus end of the range is equally interesting. The type I1 curves again do not give as good an estimate as the type I. They are in most cases too low. The low end of the production scale for this group of cattle is on the whole pretty well estimated, however. For the data themselves we have one observation as low as 125o-pound group. The estimate for this particular range is on the whole rather low (3.36 pounds of milk). In any case the author has in his note-book a record of milk production for one year of an Aberdeen Angus cow at 6 years 6 months of only 244.7 pounds which is not so far different from the above low-range estimate. Such records as these show us that the low margin of production is not on the whole overestimated. In all of this work it must also be remembered that the limited- and unlimited-range curves have unly a small frequency at these points. Thus the fact that we have one curve whose range is not limited should not trouble us, as the frequencies of this range beyond the customary limits, become very small indeed.
All of the curves are of the mesokurtic type as the values of Pz-3 are small and in each case less than three times the probable error of P2. Furthermore the sign of the kurtosis is plus in four cases and minus in five showing more clearly if necessary the mesokurtic nature of all of the distributions.
The changes in the position of the modal ordinate with increasing age generates a curve rising almost linearly to its high point a t a produc- tion of 5314 pounds for 7 years and 6 months. From this high point' it falls toward a lower production for the maximum frequency of the older cows.
CORRELATIONS O F MILK SECRETION W I T H AGE 127
a00 2000 3ooo 4000 5ooO 6000 7000 BODO MOO & O m 8 Month W k Production (Porn&)
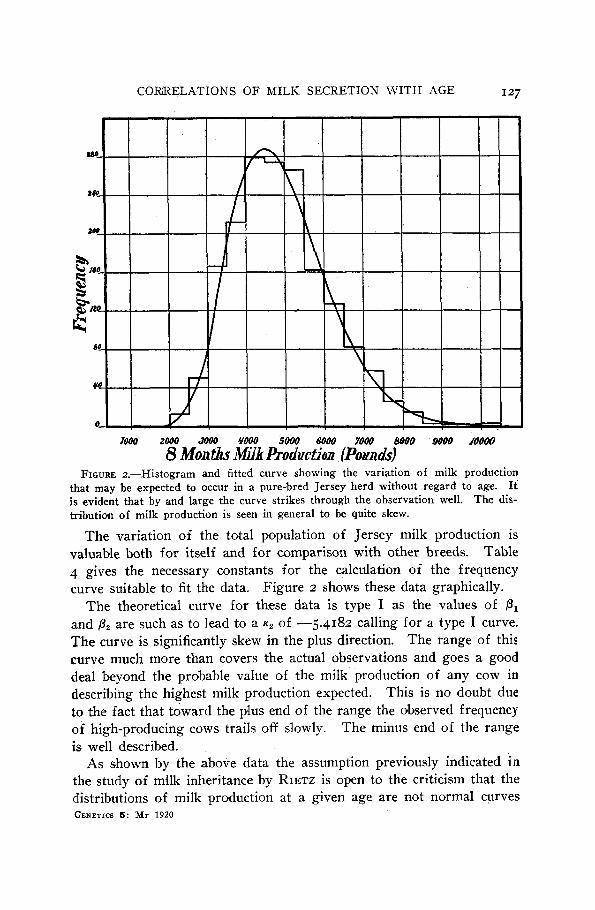
FIGURE 2.-Histogram and fitted curve showing the variation of milk production that may be expected to occur in a pure-bred Jersey herd without regard to age. It is evident that by and large the curve strikes through the observation well. The dis- tribution of milk production is seen in general to be quite skew.
The variation of the total population of Jersey milk production is valuable both for itself and for comparison with other breeds. Table 4 gives the necessary constants for the calculation of the frequency curve suitable to fit the data.
The theoretical curve for these data is type I as the values of PI and p2 are such as to lead to a K* of -5.4182 calling for a type I curve. The curve is significantly skew in the plus direction. The range of this curve much more than covers the actual observations and goes a good deal beyond the probable value of the milk production of any cow in describing the highest milk production expected. This is no doubt due to the fact that toward the plus end of the range the observed frequency of high-producing cows trails off slowly. The minus end of the range is well described.
As shown by the above data the assumption previously indicated i n the study of milk inheritance by RIETZ is open to the criticism that the distributions of milk production at a given age are not normal curves
Figure 2 shows these data graphically.
GENETICS 5 : Mr 1920
2s -
a0 -
IS -
lo -
6-
80
-
3 ki b Q,
20-
Q
10 -
b5
-
b k
0-
15-
8-
I ,
I I
1000
30
00
5000
70
00
DODO
15
00
9500
55
00
7500
95
00
2000
go
00
60
00
. 80
00
JOOO
O
8 M
onth
's Milk
Pro
ducti
on (P
ound
s) F
IGU
RE
3.
-His
togr
ams
and
fitt
ed c
urve
s sh
owin
g th
e va
riat
'on
of m
ilk p
rodu
ctio
n of
ea
ch y
ear
of
age.
T
he f
itted
cu
rves
in
this
cas
e ar
e al
l no
rmal
cur
ves
calc
ulat
ed f
rom
tab
le 4.
The
his
togr
ams
are
the
sam
e as
thos
e of
fig
ure
I.
Eac
h di
stri
buti
on is
dra
wn
on a
bas
is o
f ar
ea e
qual
to
one,
so
that
eac
h cu
rve
is d
irec
tly
com
para
ble
with
oth
ers.
It
is
evi-
de
nt t
hat
the
fit a
s a
who
le i
s no
t as
goo
d 'a
s in
fig
ure
I, e
spec
ially
at
the
ends
of
the
rang
e.
GE
NE
TIC
S 5:
128
Mr
1920
16 -
ro -
s-
0-

1 2 9
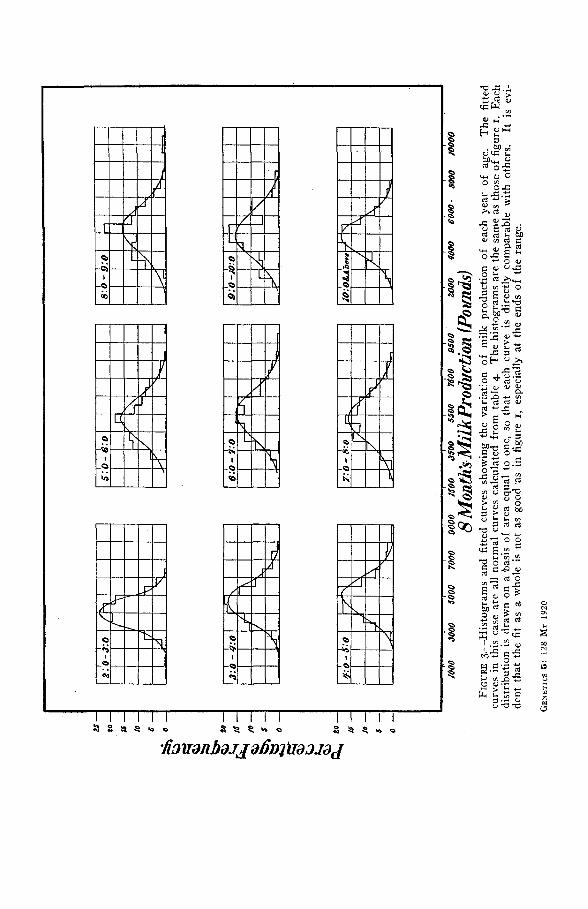
but belong in general to the type I and type I1 curves. The problem be- comes that of how great an error is introduced by regarding the data as described by normal curves. Normal curves have been fitted to the above data to make the comparison. These curves together with their corresponding histograms are shown in figure 3.
I n comparison with figure I the normal curves are seen in general to describe the tail frequencies poorly. The P for the fit of these curves are shown in table 6.
CORRELATIONS OF MILK SECRETION W I T H AGE
Age at test
2 years to 3 years -.
3 years to 4 years
P
0.4335 0.4130
4 years to 5 years 5 years to 6 years 6 years to 7 years 7 years to 8 years 8 years to g years g years to IO years
I O years and above
0.0943 0.7442 0.7450 0.8532
0.5083 0.5517
0,9333
These data (table 6) show that normal curves do not describe milk production at different ages as well as do the proper type curve. The difference in the fit of the type curves over the normal curve comes especially in the description of the tails and the skewness of these distri- butions. The fit of the normal curves is not bad, however, and in all probability no serious error would be made in the use of them for the determination of the corrections to be applied to the correlations from double-selected data as was dofie by RIETZ.
THE CORRELATION OF JERSEY 8-MONTHS MILK PRODUCTION WITH THE AGE AT TEST
Common knowledge among dairymen is that milk production and age at the commencement of the lactation are correlated in such a way that advancing age means increased production. The opinion is general that this increase is a linear one. This opipion has been shown to be er- roneous by previous work of this laboratory (PEARL 1gr4) on the sta- tistics of the 7-day records of American Jersey cattle found in “Jersey sires with their tested daughters,” published by the AMERICAN JERSEY
GENETICS 5 : M r 1920

JOHN W. GOWEN 130
CATTLE CLUB. In this work sqven-day milk production is shown to be a logarithmic curve and not a straight line.
I t remains to be shown what is the curve describing a true random sample of the Jersey breed for a longer milking period. Data of this sort is important for several reasons, chief among which, both prac- tically and theoretically, is the necessity of having suitable correction factors for age to allow comparison of milk records at different periods in the lives of different cows. Toward the solution of this problem the following facts are necessary : What correlation exists between age and milk production? Is this correlation sufficient so that it must be taken into account in considering records of different cows at different ages? What is the equation of the regression line between these two variables? Table 7 furnishes the data necessary for this study.
The correlation and its accompanying constants for these two variables are shown in table 8.
TABLE 8 Constants measuring the association between amount of eight-months milk produced
alzd age at test o f Jersey cows.
0.2596 t .OISI O.&3 .OI32 0.1689 t .ox11 0.1161 t .om8 r r l - r $- r2 T
This table makes clear several facts concerning the influence of age on milk production. The correlation of +0.2596t.o151 shows that age at test and milk production are significantly correlated variables. Taken in conjunction with the correlation ratio it shows clearly that age of the cow at commencement of test must be considered in com- paring the records of different cows if the conclusion from the com- parison is to be valid. The value of the correlation ratio +0.4283 k . 0 1 3 2 is considerably higher than the ,correlation coefficient. This dif- ference is shown to be highly significant by the value of w . 1 6 8 9 k .0~01 . I t is altogether probable therefore that the regression of age on milk production is a skew regression. This is shown to be a fact by the constant to measure such skewness. v2-r2, 0.1161~.0108, is about 11 times its probable error. The regression is therefore known to be skew. Since this is true the correlation ratio is a better measure of the true correlation than is the correlation coefficient. The relation of age a t test is then doubly significant in any comparison of the records of two cows. The regression having been shown to be skew it becomes necessary to deal with it separately.

GO
WEN
, J. W
., O
N T
HE
V
AR
IAT
ION
S A
ND
C
OR
RE
LA
TIO
NS
OF
MIL
K
SEC
RE
TIO
N W
ITH
A
GE
TA
BL
E
7, C
orre
latio
n su
rfac
e fo
v p
ow
ds
of m
ilk a
nd a
ge a
: te
st for
Jer
sey
cattl
e.
(Lac
tati
on p
erio
d, e
ight
ino
ntlz
s.)
1:6
-z:o
I
I 2:
6-
2:o
- 3:o
2:
6 I
3:o-
3:6
3:
6- 4
:o
4: 0
- 4:
6
4:6-
5:o
5:
o- 5
:6
5:6-
6:o
6:
o- 6
:6
6:6-
7:o
7:
o- 7
:6
7:6-
8:o
8:
o- 8
:6
8:6-
g:o
g:
o- g
:6
I 9 : 6
-10 : 0
IO:
0-1
0 : 6
10
:6-1
1:0
1 11
:o-1
1:6
I 11
:6-1
2:0
1 12
:0-1
2:6
I 1
2: 6
-13:
o
I 13
:o-1
3:6
I 14
:o-1
4:6
I 14
:6-1
5:o
1 15
:0-1
5:6
I 15
:6-1
6:6
1
13:6
-14:
0 I
Tot
al
I
GEN
ETIC
S 5:
Mr
1920
5 15
IO
2
2
4 19
54
51
56
42
19
7 2
I 4
6 7
11
12
4
4 4
21
2
2
33
30
20
13
8 3
2 3
3 6
91
41
91
6 8
7 3
5 2
I 2
8 15
31
24
25
15
7
8
I 2
I 7
11
13
~0
24
13
8 3
5 3
I 7
13
16
14
23
10
5
7 g
2 I
I
5 I3
12
I9
I7
I5
14
9
4 3
3 I
2 2
10
14
8
14
12
12
5
6 3
3 I
4 6
g1
51
51
z1
6
8 7
4 I
2
I
I 7
7 7
10
15
8
7 4
2 I
I I
2 8
8 3
12
7 6
5 3
I I
2
I 4
5 16
11
19
7~
6
5 5
2
3 11
8 9
90
14
I4
9
5 I
3 I
.
I3
43
79
7
3.
51
I
3
I 3
4.
6
8 5
5 3
I I
I 1
13
96
11
4
I 3
32
24
33
11
1
13
26
53
41
I
21
1
I 2
12
I
21
21
I
I1
I
1
13
I I
If
I

2:3
3:3
4.3
53
63
7:3
8:3
93
1
03
1J
:3
123
133
14.3
/5:3
Age
at C
omm
ence
men
t of
Test
(Gar
s and
Mon
ths)
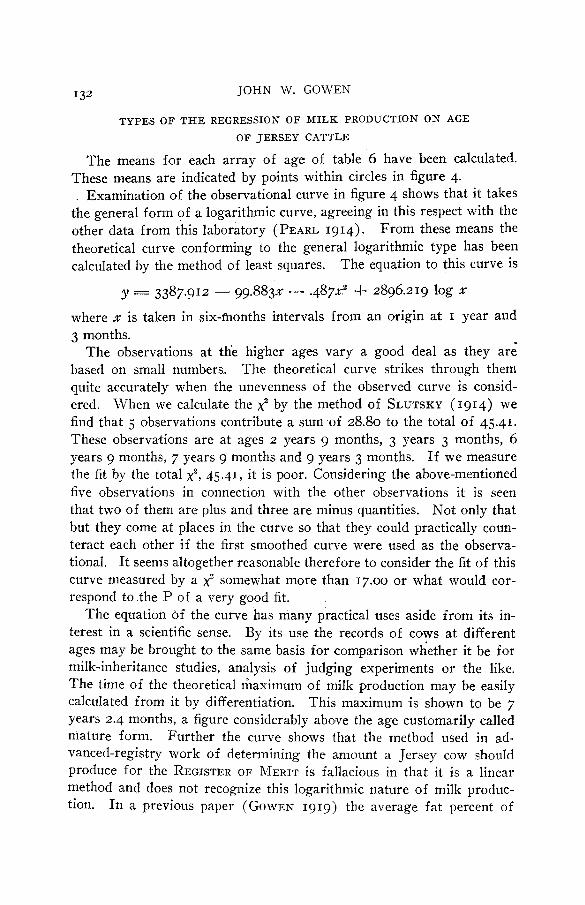
. F
IGU
RE
4.
-Dia
gram
sh
owin
g th
e ab
serv
ed m
eans
and
the
oret
ical
mea
ns
for
Jers
ey
eigh
t-m
onth
s m
ilk p
rodu
ctio
n at
T
he c
urve
as
a w
hole
is
evid
ently
of
the
loga
rith
mic
T
he o
bser
vatio
ns a
re r
epre
sent
ed a
s an
y gi
ven
age.
T
he o
bser
ved
mea
ns a
re c
alcu
late
d fr
om t
able
7.
type
des
crib
ed w
ell
by t
he t
heor
etic
al c
urve
the
con
stan
ts o
f w
hich
are
giv
en b
elow
. th
e sm
all
circ
les.
GEN
ETIC
S 5:
131
Mr
1920
JOHN W. GOWEN
TYPES O F THE REGRESSION O F MILK PRODUCTION ON AGE O F JERSEY CATTLE
132
The means for each array of age of table 6 have been calculated. These means are indicated by points within circles in figure 4. . Examinatioa of the observational curve in figure 4 shows that it takes
the general form of a logarithmic curve, agreeing in this respect with the other data from this laboratory (PEARL 1914). From these means the theoretical curve conforming to the general logarithmic type has been calculated by the method of least squares. The equation to this curve is
where x is taken in sixmonths intervals from an origin at I year and 3 months.
The observations at the higher ages vary a good deal as they are based on small numbers, The theoretical curve strikes through them quite accurately when the unevenness of the observed curve is consid- ered. When we calculate the x2 by the method of SLUTSKY (1914) we find that 5 observations contribute a sum of 28.80 to the total of 45.41. These observations are at ages 2 years g months, 3 years 3 months, 6 years 9 months, 7 years 9 months and g years 3 months. If we measure the fit by the total x2, 45.41, it is poor. Considering the above-mentioned five observations in connection with the other observations it is seen that two of them are plus and three are minus quantities. Not only that but they come a t places in the curve so that they could practically coun- teract each other if the first smoothed curve were used as the observa- tional. It seems altogether reasonable therefore to consider the fit of this curve measured by a x2 somewhat more than 17.00 or what would cor- respond to the P of a very good fit.
The equation of the curve has many practical uses aside from its in- terest in a scientific sense. By its use the records of cows at different ages may be brought to the same basis for comparison whether it be for milk-inheritance studies, analysis of judging experiments or the like. The time of the theoretical maximum of milk production may be easily calculated from it by differentiation. This maximum is shown to be 7 years 2.4 months, a figure considerably abomve the age customarily called mature form. Further the curve shows that the method used in ad- vanced-registry work of determining the amount a Jersey cow should produce for the REGISTER OF MERIT is fallacious in that it is a linear method and does not recognize this logarithmic nature of milk produc- tion. In a previous paper (GOWEN 1919) the average fat percent of

I33
Jersey COWS is given as 5.12. Assuming this figure and dividing the pounds of butter-fat by it gives us the average requirement for milk production in one year. Supposing that of the year’s records is made in the first 8 months of lactation ( a figure reasonably close to the ex- pected (PEARL 1915)) the required production is found to be 3600 pounds at 2 years and 5200 pounds at 5 years. From figure 3 it is evi- dent therefore that if a cow is to be pushed for the advanced registry the best time to get her in, is to have her calve at about 3 years 3 months of age.
Causally considered the logarithmic nature of milk production is of a good deal of interest. The work o i a number of students of growth, beginning with MINOT’S (1891 ) notable studies on rabbits and guinea- pigs has shown that the phenomena of growth are also a logarithmic function of age. This law appears of wide general application as the work of LEWENZ and PEARSON (1904) have shown that it holds for growth in children; DONALDSON (1908, 1909, 1910, I ~ I I ) , HATAI (191 I ) and JACKSON (1913) have shown it to be of general application to the growth of certain organs in the white rat; PEARL (1907) and PEARL and SURFACE (1915) have shown it to be true for Ceratophyllum and maize. I t seems, therefore, altogether likely that the mammary glands of the cow also follow this rule. Should this prove true the in- crease of milk production with age seems of much significance in parallel- ing these growth phenomena. This paralleling of the two functions would in fact seem to indicate a causal relation between the two in that the increase in milk production may depend chiefly on the increase in actual mass of the mammary gland due to growth of this organ and not due to any relative increase in the ability of the cells to secrete more milk.
CORRELATIONS OF MILK SEICRETION W I T H AGE
THE NATURE O F THE CURVE O F THE STANDARD DEVIATION
O F MILK PRODUCTION
The curve found by plotting the standard deviations of 8-months milk production for each six months age intervals is shown in figure 4. The circles represent the actual standard deviations of the age arrays calcu- lated from table 7. A glance at these suffices to show that the curve is no4 the customary linear one. It has rather the appearance of a para- bola or logarithmic curve. The actual choice of the type of curve de- scribing these data, other things being equal, depends on the fit of the theoretical curve. to the observational data. Accordingly two curves
GEXETICS 5 : X r i920
I34 JOHN W. GOWEN
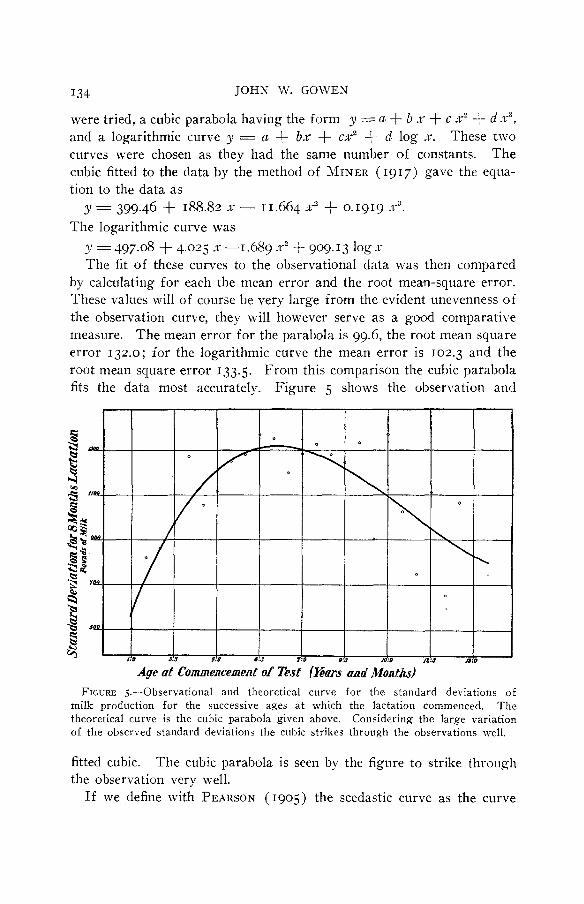
were tried, a cubic parabola having the form y = a + b A- + c x2 f d x3, and a logarithmic curve y = a + b x + cx2 + d log x. These two curves were chosen as they had the same number of constants. The cubic fitted to the data by the method of MINER (1917) gave the ecltia- tion to the data as
The logarithmic curve was y = 399.46 + 188.82 x - 11.664 x2 + 0.1919 x3.
y=497.08 + 4.025 x-1.689x2 + 909.13 logn The fit of these curves to the observational data was then compared
by calculating for each the mean error and the root mean-square error. These values will of course be very large from the evident unevenness o i the observation curve, they will however serve as a good comparative measure. The mean error for the parabola is 99.6, the root mean square error 132.0; for the logarithmic curve the mean error is 102.3 and the root mean square error 133.5. From this comparison the cubic parabola fits the data most accurately. Figure 5 shows the observation and
Age at Commencement of Test (Bars and M o A ~ ~ s ) FIGURE j.-Observational and theoretical curve for the standard deviations of
milk production for the successive ages a t which the lactation commenced. The theoretical curve is the cubic parabola given above. Considering the large variation of the observed standard deviations the cubic strikes through the observations well.
fitted cubic. the observation very well.
The cubic parabola is seen by the figure to strike through
If we define with PEARSON (1905) the scedastic curve as the curve

I35 CORRELATIONS OF MILK SECRETION W I T H AGE
formed by the ratios of standard deviations of the x arrays of /3 divided by the standard deviation of /3 plotted to A-, then it is evident that the standard-deviation lines of milk production show that the value of 7 is will form, when divided by the standard deviation of milk production at all ages, a cu;ve similar in shape to the curve plotted in figure 5. Milk production with age is therefore heteroscedastic. As the change in the scedastic curve follows a regular system the curve is nomic.
The facts brought forth in the discussion of the regression and standard-deviation lines of milk production show that the value of 7 is nearer the value of the true correlation of milk production with age than is the value of F. I t therefore strengthens more strongly if need be the argument of age correction in all milk-production studies involv- ing comparisons of milk production at different times in a COW’S life.
T H E CORRELATION BETWEEN T H E MILK YIELD O F ONE LACTATION AND THAT O F SUCCEEDING LACTATIONS
Mean milk prodwtion of cows retained lopig or short periods in the herd
Up to this point the discussion has dealt entirely with the influence of age on amount of milk produced in a given lactation and the variability of the milk produced during it. In the present section the phase of the problem dealing with one lactation in its relation to another will be considered.
The functioning of the mammary glands may be considered depend- ent upon three main factors, which, taken in order of their natural se- quence are : heredity ; development through feeding, etc. (environmental circumstances), of these organs up to their commencing to secrete ; and lastly environmental factors in their widest sense acting during the months when the gland is active. I t is reasonably clear that on our ability to distinguish the relative influence of these three basic variables depends many of the common a priori dairy practices as well as furnish- ing a solid foundation for the analysis of the causal mechanism of milk production itself. The analysis is a complex one and needs to be at- tacked by many channels. The present investigation was undertaken in the hope that by an analysis of the intra-individual variation of milk secretion from lactation to lactation some light would be given on the relative merits of these three variables. The homogeneous nature of the material is such, however, that the investigation necessarily deals chiefly with the first of these variables. GENETICS 5 : xr i w o

JOHN W. GOWEN 136
Little work on milk secretion has been done that approaches the prob- lem from this viewpoint. Of the available data those on the English herds analyzed by GAVIN (1913) are undoubtedly the best. This in- vestigation on a mixed herd of British Holsteins and grade Short Horns furnishes data of value for the records of the first lactation in com- parison with the yields of subsequent lactations. In all of this work the measure of the lactation used is what he designates as the "revised maximum," this term being defined as the maximum day yield of the lactation which is three times reached or exceeded. These results are considered largely for their strictly practical bearing. They are of little use to the American farmer in that he is accustomed to deal with records over a certain limit of time and not maximum productions. These facts make it evident that no repetition in either data or aim of the investigation occurs in these studies. The constants derived by GAVIN will be of a good deal of interest for comparison with those pre- sented here as together they show the range of variation to be expected under the different conditions of England and the United States, a mixed herd and a pure-bred herd, and a difference in the measure of the lacta- ting capacity from lactation to lactation.
The preliminary steps should include a study of the population of each frequency which is to be compared. The' data for this compari- son are taken from the correlation tables beginning with number 9 and ending with 40.
T- 9 Colrrelation surface for amount of eight-months milk production at two years old and
amount of eight-months milk production at three years old for purebred Jersey cows.
3 years old
2000-2500
3000-3500 2500-3000
3500-4000 2 4000-4500 2 4500-5000
5000-5500 5500-6000 6000-6500
h
I
I 5 5 I I 8 5 1 1 5 I I
3 6 1 1 1 1 5 3 2 2 4 1 1 7 4 3 I I
2 2 2 4 8 6 6 7 2 2 5 2 2 1 3 1 1
I I 2 I 1 1 I 1
- .
I I1
33 39 35 39 17 7 2
~
Total I 3 18 M 36 39 24 16 13 5 6 2 I 1 184

CORRELATIONS OF MILK SECRETION W I T H AGE I37
4-5
4962.64 -I- 59.63 5031.05 f 60.19
5033.22 2 59.05 5141.67 f 67.93 5143.81 f 65.17 5067.07 f 62.08 4994.90 f 103.53
TABLE IO Correlation surface for amount of eight-months milk production at two years old
and amount of eight-months milk prodzlction at f o u r years old f o r purebred Jersey c o w .
4 years old
5 -6
5542.86 f 74.47
5190.55 f 67.40 534.41 k 80.52
5401.64 f 76.40 5315.89 f 65.87 5298.28 k 69.64 5468.18 f 65.79
I1
29 41 41 33 I3 6
2 to 3
4 to 5 5 .to 6 6 to 7 7 to 8
3 to 4
Total 21 15 32 23 35 17 11 IO 6 2 I I I 174
The tabled constants are presented in the following order, ( I ) the means of each of the compared populations (table I I ) , (2) the stan- dard deviations of each of the-compared populations (table 20), and the coefficients of variation of each of the compared populations (table 2 5 ) . The vertical columns of each table present the means, standard devia- tions, etc., of the age indicated when correlated with each of the lacta- tion records made at the age on the left of the table. Thus, the means of the 8-months' milk production of the two-year group that is corre- lated with the three-year group, is 4141.30 pounds of milk. The value of the mean production in this column should of course be the same if the population of milk production of the two-year group is the same for the cows kept to their three-year-old lactation as it is for the cows kept to their seven-year-old lactation. Table 11 presents the data for the comparisons of these mean milk productions.
TABLE 11
Mean 8-months milk production of a given age when correlated w i th other given ages.
4141.30 f 40.12 4091.95 f 37.66 4178.57 f . ~ . 6 2 4192.62 f 48.71 4156.59 f 58.81
Age I 2-3 I 3-4 I I
4642.16 t 57.56 4739.51 f 04.10 4819.57 f 72.78 4867.35 f 77.53 4698.11 i. 75.14 5171.05 f 199.66
GENETICS 5 : Mr 1920

138 JOHN iV. GOWEN
TABLE I I (continued) Mean S-?iionths milk production of a given age zwhen correlated with other given ages.
2 to 3 3 to 4 4 to 5 5 to 6 6 to 7 j to 8 8 to I O
IO and olde
6-7
5f54.10 * 88.77 5710.87 rt 89.16 5612.50 r+ 104.63 5631.15 2 83.22
5399.19 * 115.94 5371.62 * j4.90 5382.81 k 61.45
7-8
5464.29 rt 86.47 5459.18 * 87.31 5435.84 2 80.10 5521.32 * 73.79 5334.68 * 78.04
5220.20 rt 63.66
8-10
5094.04 * 81.11
5152.44 & 78.20 5208.62 * 75.90 5189.19 k 71.69 5081.13 * 74.40
5ogg.06 rt 91.12
5185.48 & 69.65 - .. -
IO and older
4925.00 k 119.59
4760.m * 101.39 4907.89 '' 144.32
4868.18 * 108.99 4914.06 * 84.65 4831.08 * 85.76 4903.23 2 69-14
The data presented in this table are graphically represented in figure 6. In this figure the mean 8-months milk production is given at the left. The line at the top of the figure represents the mean milk production of the two-year-olds that had lactations at the other ages sho,wn on the lower margin of the figure. The next line down represents the 3-year mean production when compared with the other ages, etc. The ages with which these are compared are shown in the bottom margin of the figure. The lines generated by the mean productions of each of these age groups should, of course, be parallel with the base of the figure within the limits of random sampling if the population of 8-months milk pro- duction for the given age is the same irrespective of the age at which the subsequent lactation was made.
The curve for the mean eight-months milk production of the two- year-old group (the top curve of figure 6) is as close to a straight line parallel with the base of the figure as could well be expected. At no place is there more than 6;-pound divergence from such a line. This divergence is seen in table 11 to be only slightly over the probable error of the mean production.
The curve for the three-year-old group is more variable than the two- year group due no doubt to the numbers on which it is based being less. The curve on the whole has a slight tendency upward as we progress from left to right. I t is doubtful if this general trend is significant in comparison with the probable errors of the constants. Taken at its face value, however, it would indicate that the cows with a lactation record at IO years of age would have had in general a slightly better record at three years old than would the general three-year-old group. That is, the cows of the three-year-old group were culled slightly so that the cows kept for milk production were somewhat better con-s than the average run of three-year-olds.

COWRIELATIONS OF MILK SECRETION WITH AGE I39
Ages Correlated FIGURE 6.-Curves showing the mean eight-months milk production of a given age at
each successive age with which the given age is correlated. The ordinates are the pounds of milk produced and the abscissae are the ages of the groups with which the given age is correlated. Proceeding from top to bottom of the figure the first line rep- resents the mean milk production of the 2-year to 3-year group; the second the 3-year to 4-year group ; the third the &year to 5-year ; the fourth the 5-year to 6-year; the fifth the 6-year to 7-year; the sixth the 7-year to 8-year; the seventh the 8-year to Io-year, and the last the Io-year-and-older group. The lines obviously are quite irregular but in general do not diverge greatly from a line parallel with the base of the figure. GENETICS 5 : Mr 1920

140 JOHN W. GOWEN
TABLE 12
Correlation surface for amount o f eight-months milk production at two years old and amount o f eight-months milk Production at five years old for
pure-bred Jersey cows.
5 years old
~
2000-2 j00 2500-3000 3000-3500
2 4@JO-4500 g 4500-5000 P4 5 ~ - 5 5 0 0
5500aooo 6000-6500
Total
5: 3500-4000
I I 2 2
1 5 6 9 2 2 1 1 2 2 4 3 6 3 I 2
1 2 8 9 4 5 3 1 1 2 I 3 5 3 4 6 4 2 I
I 1 1 3 2 4 I 1 1 1 1
I I
I
I 2 1 I I
I j 5 5 1 2 2 I 1 1 4 2 1 3 3 2 I 1 1 7 7 5 2 5 3
4 5 4 5 1 4 2 I
I
5 27 23
29
5
36
I2
2 - I
I 6
22
I7 32 26
7 I O 12 23 24 15 14 14 11 6 3 o o o I 1 140
TABLE 13 Correlation surface for amount o f eight-months milk production at two years old and
amount o f eight-months milk production a t six years old for pwe-bred Jersey cows.
6 years old
2000-2500
a 3000-3500 "0 3500-4000 5 4000-4500 g 4500-5@33
2500-3000
fl 5000-5500 5500-6000 6000-6500 --
i Total I 5 g 1 1 1 2 1 5 1 8 1 7 9 1 3 4 4 I I I 1 1 1 2 2

141 CORRELATIOKS OF MILK SECRETION WITH AGE
TABLE 14 Correlation surface f o r amoumf o f eight-months milk productiofi at two years pld
and amount of eight-months milk production at seven years old for pure-bed Jersey cows.
7 years old
I I 1 2
I 1 5 2 4 4 2 I 1 3 3 2 1 2
1 1 1 4 9 3 4 2 I I 3 3 5 I 1
2 2 1 3 2 I I
I 1
2000-2500 2500-3000 3000-3500
0 3500-4000 9
4000-4500 K 4500-5000
5000-5500 5500-6000 6000-6500
v1
Total 0
I
4 19 I3 26
I4 8 4 2
8 U)
2000-2500 2500-3000
35@3-40@3 3 4000-4500 ry 4500-500s,
5 ~ - 5 5 0 0 5500-6000
% 3000-3500
x
I I 2
4 1 2 7 I I I 6 4 I 2 I I7
1 1 1 2 3 6 3 4 21
1 4 5 3 6 5 2 4 2 32 7 3 3 3 2 I9
4 2 1 1 I 9 1
I 1 I 2
TABLE 15 Jdrrelation surface f o r amoumt of eight-months milk production at two years old
and amoultt of eight-months milk production af eight and nine y e w s old f o r pure-bred Jersey cows.
0
8 and ,g years old

142 JOHN W. GOWEN
able errors. Thus in the six-year group the difference is 371.3kI07.g or 3.4 times its probable error. Furthermore the drop in the value of the milk production of the six-year group is quite sudden, occurring with those cows which lactate in their seventh year and older. Selection can-
TABLE 16
and amount of eight-months milk production at ten years and older fov pure-bred Jersey cows.
Correlation surface fo r anaownt o f eight-months milk production at two years old
IO years old and older
2500-3000 2 3000-3500
3500-4000 2 4000-4500
4500-5000 5000-5500 5500-6000
Total
0
N
8 3 8 U) N
__
2
5 3
1 9 1 :
TABLE 17 Correlation surface f o r amount o f eight-molzths milk production a t three years old
and amount of eight-months milk production at f o b years old f o r pure-bred Jersey cows.
4 years old
2000-2500 2500-3000 3000-3500 3500-4000
a 4000-4500 O 4500-5000
5500-6000
- 2 5000-5500
w 6000-6500 6500-7000 7000-7500 7500-8000
Total
I
I I 1 I
3 4 3 2 1 2 3 9 5 4 1 4 2 7 9 1 0 I I I I
I 1 5 6 2 2 2 1 6 4 7 5 2 2
3 2 2 2 1 1 I 2 2 2 1
3 1 1 I I I 1
I
I 11 11 28 29 32 14 IO 9 4 2 I I
I
4 I3 24 36 27 19
8 5 4
I1
I
-1 I53
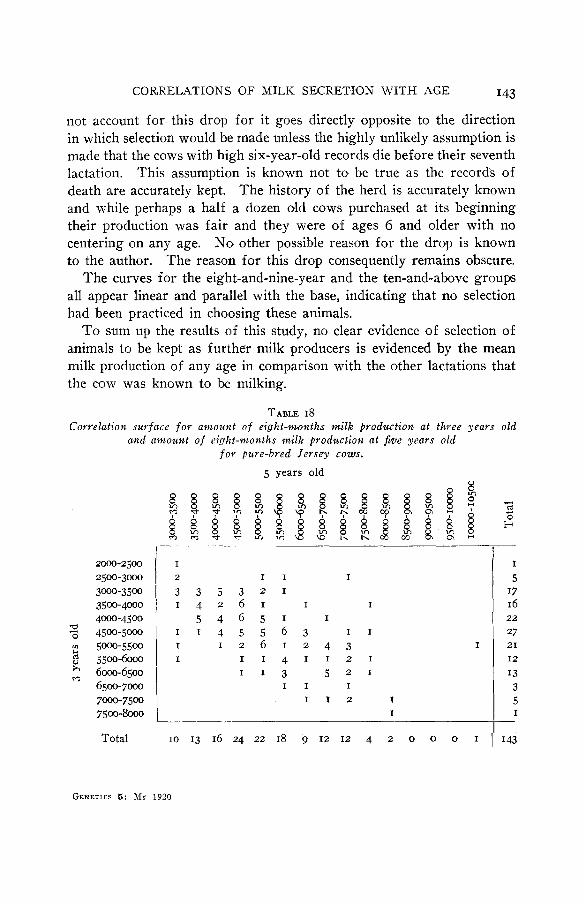
CORRELATIONS OF MILK SIXRETION WITH AGE I43
1 3 3 5 3 2 1 1 1 4 2 6 1 I I
5 4 6 5 1 I
1 1 4 5 5 6 3 I 1 I 1 2 6 1 2 4 3 I I 1 1 4 1 1 2 1
1 1 3 5 2 1
I 1 I I
I I 1 2 I
I
not account for this drop for it goes directly opposite to the direction in which selection would be made unless the highly unlikely assumption is made that the cows with high six-year-old records die before their seventh lactation. This assumption is known not to be true as the records of death are accurately kept. The history of the herd is accurately known and while perhaps a half a dozen old cows purchased at its beginning their production was fair and they were of ages 6 and older with no centering on any age. No other possible reason for the drop is known to the author. The reason for this drop consequently remains obscure.
The curves for the eight-and-nine-year and the ten-and-above groups all appear linear and parallel with the base, indicating that no selection had been practiced in choosing these animals.
T o sum up the results of this study, no clear evidence of selection of animals to be kept as further milk producers is evidenced by the mean milk production of any age in comparison with the other lactations that the cow was known to be milking.
I7 16
27 22
21 I 2
I3 3 5 I
TABLE 18 Correlation surface f o r amount of eight-months milk production at three years old
and amount of eight-months milk production at five years old f o r pure-bred Jersey COWJ.
5 years old
2000-2500
3000-3500 3500-4000 4000-4500 5 4500-5000
8 5500-6000
r?
2500-3000
E 5000-5500
6000-6500 6500-7000 7000-7500 7500-8000
Total
GENETICS 5 : Mr 1920
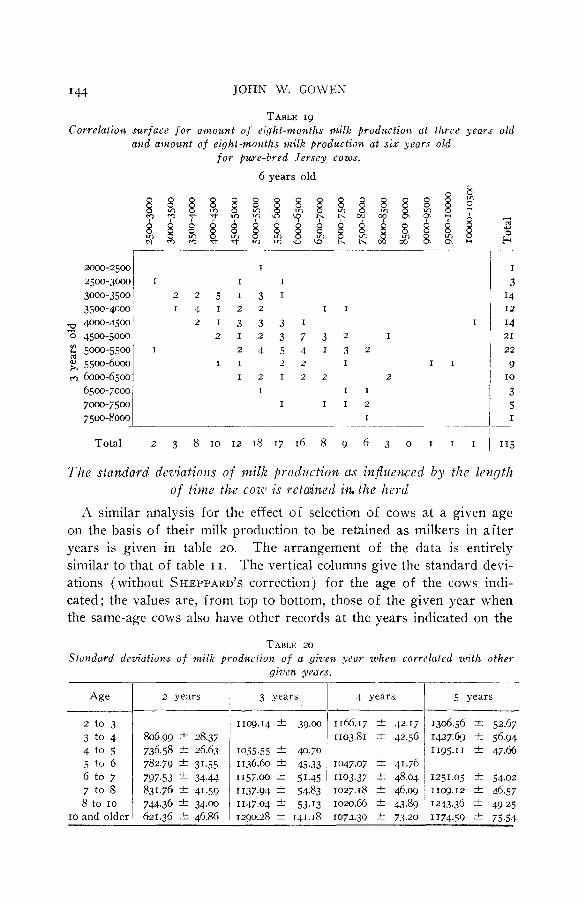
I44 JOHN W. GOWEK
2 to 3 3 to 4 4 to 5 5 to 6 6 to 7 7 to 8 8 to I O
IO and older
TABLE 19 Correlation surface fo r amount of eight-months milk production at tlzrce years old
and amount of eight-months milk production at six gears old f o r pwe-bred Jersey cows.
6 years old
! 11~9.14 C 39.00 1166.17 C 42.17 136.56 rt 52.67 806.99 +- 28.37 1103.81 -C 42.56 1427.69 I: 56.94 736.58 +- 26.63 1055.55 40.70 i 1195.11 rt 47.66 782.79 C 31.55 1136.60 C 45.33 1047.07 3~ 41.76 ' 797.53 -I 34.44 1157.00 rt 51.45 , 1103.37 2 48.04 ~ 1251.05 * 54.02 831.76 C 41.59 1137.94 I 54.83 1027.18 4 46.09 j 110g.12 -C 46.57 744.34 C 34.00 I 1147.04 * 53.13 I , 1020.66 i- 43.89 1243.36 I 49.25 621.36 -C 46.86 I 1290.28 C 141.18 1 1074.39 i- 73.20 1174.59 ? 75.54
I I I I
2 2 5 1 3 1 1 4 1 2 2 I 1
2 1 3 3 3 1 2 1 2 3 7 3 2 I
I 2 4 5 4 1 3 2 I 1 2 2 I
I 2 1 2 2 2
I I 1
I I 1 2
I
I
I 1
I
3 I4
I4 12
21
22
9
3 5
I O
I
Total 2 3 8 IO 12 18 17 16 8 g 6 3 o I I I 1 115
Tlze standard deviations of milk firodirction as infizicizced by the lmgtlz o f time the cos' is retained in. the herd
A similar analysis for the effect of selection of cows at a given age on the basis of their milk production to be retained as milkers in after years is given in table 20. The arrangement of the data is entirely similar to that of table I I . The vertical columns give the standard devi- ations (without SHEPPARD'S correction) for the age of the cows indi- cated; the values are, from top to bottom, those of the given year when the same-age cows also have other records at the years indicated on the
TABLE 20 Standard deviations o f milk production of a given year when correlated m t h other
given yeurs. I I

CORlRiELATIONS OF MILK SECRETION WITH AGE
TABLE 20 (continued) Standard deviations of milk production o f a given year when correlated wi th other
I45
given years.
Age 1 6 years 1 7 years 1 8 and gyears 1 IO and older
2 to 3 1 1453.51 f 62.76
1699.38 f 73.99 1417.51 2 63.04
1222.82 f 61.14
1262.45 f 56.65 1281.58 -C 61.75
1255.63 f 81.12 1390.96 f 64.43 1285.72 & 55.29 1355.07 f 53.67 1293.65 & 50.69 1355.50 52.61 7 to 8
8 to IO ~ o a n d older
1121.10 5 84.54 932.63 4 1oz.05
1052.16 t 71.68 1198.34 * 77.07 1004.11 2 59.87 1093.68 2 60.63 1141.55 2 48.89
1274.72 f 54.60 1236.58 -C 48.47 1159.80 2 45.01 1108.36 -C 66.08 1061.13 t 58.83
left margin of the table. The data for the calculation of these constants are taken from correlation tables g to 40.
These data are graphically represented in figure 7, the values of the standard deviations being represented as ordinates and the ages at which the cows had another lactation as the abscissae. The curves progressing from top to bottom of the figure are for the lactation at the 2, 3, 4, 5 , 6, 7, 8-and-g and Io-and-older groups. The lines generated by those curves should, of course, be parallel with the base if there has been no selection practiced. If selection has been at any given place it should be expected to curtail the low-producing cows and thus reduce the standard deviation of the population as a whole.
TABLE 21 Correlation surface for amount of eight-months milk production at three years old
and amount of eight-months milk production at seven years old for p&e-bred Jersey c o w .
7 years old
2 3 4 2 1 1 I I 3 1 3 1 2 1 1 1
2 4 4 1 4 3 I 2 2 2 2 2 2 2 I
I 2 1 I
4 1 3 3
2500-3000 3000-3500 3500-4000 3 4000-4500
v1 4500-5"J g 5000-5500
5500-6000 6000-6500 6500-7000 7000-7500
K)
- 7500-8000
I5 I3 19 I5 5
I 1
Total I I 4 7 1 0 1 3 1 7 9 1 3 1 3 6 I 2 I ( 98 GENETICS 5 : Mr 1920

146 JOHN W. GOWEN
2500-3000
3000-3500
3500-4000 4000-4500
m 5000-5500 $ 4 5 ~ - 5 0 0 0
2 5500aooo 6000-6500 6500-7000
7000-7500
rr)
TABLE n Correlation sawface for amount of eight-months milk production at three years old
years old f o r pure-bred Jersey cows. and amount of eight-months milk production at eight and nine
8 and g years old
I 1 2 I 1 1 2 3 3 I 2 1 2
I 2 3 3 2 2 3 1 1 2 1 1 I
1 2 2 6 2 5 1 1 2 2 5 5 2 1
2 1 2
2 1 2 2 2 1 2 I I 2
I I
I I
6 I5 I3 10
18
6
4
20
I2
2
Total I 4 7 I 2 12 I5 20 8 I4 4 5 2 0 0 0 I I ( I o 6
The curves for the two, three, four, five, seven, eight-and-nine and ten-and-older age groups are obviously linear and foIIow a general course parallel with’ the base. The standard deviations for each of these given ages are therefore constant to all intents and purposes.? Since one effect of selection is to reduce the standard deviation of the selected race in
TABLE 23 Correlation surface for amount of eight-month?; milk Production at three years old
and amount of eight-months milk produetion at ten years and older f o r pure-bred Jersey cows.
3 years old
I 1
I 1 1 1 1 I 1 I
I 2 1 1
I I
I 1

CORlRlELATIONS OF MILK SECRETION WITH AGE 147
" FIGURE 7.-Curves showing the standard deviations for eight-months milk production
of a given age in the cow's life a t the successive ages with which the given age is correlated. The ordinates are the standard deviations for the pounds of milk pro- duced. The abscissae are the ages of the groups with which the given age is cor- related and for which the given age had the standard deviation plotted. Proceeding from top to bottom the curves show the standard deviation for the 2, 3, 4, 5 , 6, 7, 8- a n d 9 and Io-year-and-older age groups. The lines are quite regular and in general are parallel with the base as would be expected if no selection were practiced.
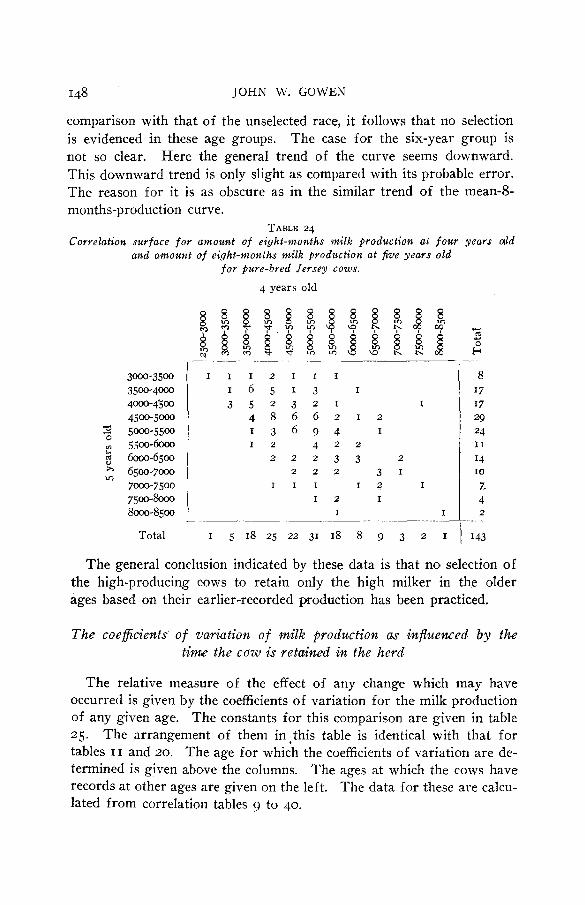
I48 JOHN W. GOWEN
comparison with that of the unselected race, it follows that no selection is evidenced in these age groups. The case for the six-year group is not so clear. Here the general trend of the curve seems downward. This downward trend is only slight as compared with its probable error. The reason for it is as obscure as in the similar trend of the mean-8- months-production curve.
TABLE 24 Correlation surface f o r amount of eight-mowths milk production at f o u r years ald
and amount of eight-months milk prodztction at five years old f o r purebred Jersey cows.
4 years old
3000-3500 3500-40@3 4000-4300 4500-5000
2 5000-5500
$ 5ooO-6500
7.500-- so00-8500
: 5500-6000
6500-7000 7000-7500
ro
Total
1 1 1 2 1 1 1
1 6 5 1 3 I
3 5 2 3 2 1 I 4 8 6 6 2 1 2
I 2 4 2 2 1 3 6 9 4 I
2 2 2 3 3 2
2 2 2 3 1 I 1 1 I 2 I
I 2 I
I I
I 5 1 8 2 5 2 2 3 1 1 8 8 g 3 2 I
The general conclusion indicated by these data is that no selection of the high-producing cows to retain only the high milker in the older ages based on their earlier-recorded production has been practiced.
The coefficimts of variation. of milk production a z ~ influenced by th8e time the cow is retained in the herd
The relative measure of the effect of any change which may have occurred is given by the coefficients of variation for the milk production of any given age. The constants for this comparison are given in table 25. The arrangement of them inethis table is identical with that for tables 11 and 20. The age for which the coefficients of variation are de- termined is given above the columns. The ages at which the cows have records at other ages are given on the left. The data for these are calcu- lated from correlation tables g to 40.
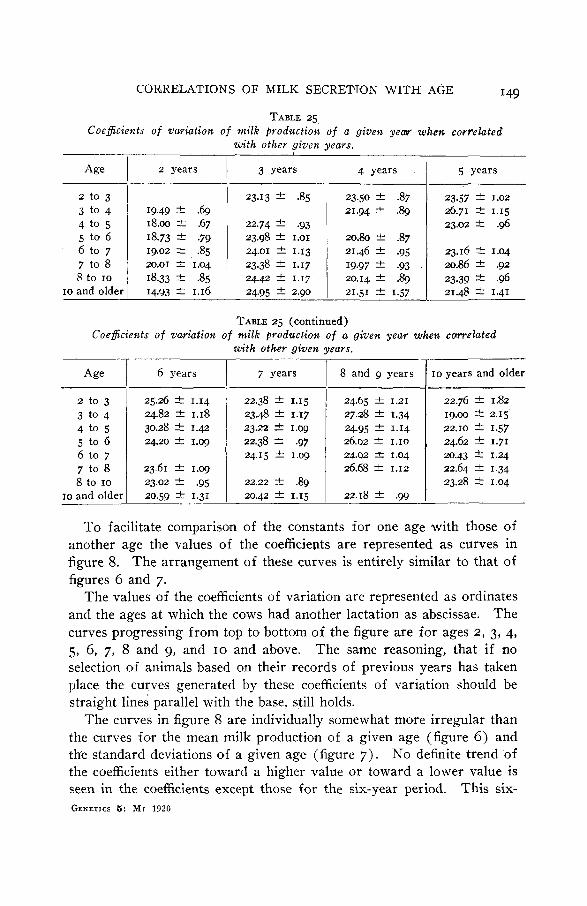
I49 CORRELATIONS OF MILK SBCRETION W I T H AGE
TABLE 25 Coeficients of variation of milk production of a given year when covrelated
with other given years.
4 years - 23.50 C .87 21.94 2 .89
20.80 2 .87 21.46 k .95 19.97 2 .93 20.14 2 .8g 21.51 C 1.57
2 to 3 3 to 4 4 to 5 5 to 6 6 to 7 7 to 8 P to IO
IO and older
5 years
23.57 ?'Z 1.02 26.71 t 1.15 23.02 +- .g6
23.16 t 1.04 20.86 t -92 23.39 -c .96 2148 k 1.41
19.49 -+ .69 18.00 2 6 7 18.73 rt .79 19.02 +- .85 20.01 t 1.04 18.33 rt .S5 14.93 3. 1.16
23.13 f .85
22.74 2 9 3 23.98 C 1.01 24.01 C 1.13 23.38 & 1.17 24.42 2 1.17 24.95 C 2.90
TABLE 25 (continued) Coefficients of variation of milk production of a given year when correlated
with other given years.
1 8 and g years I O years and older I Age 1 6 years 1 7 years
2 t o 3 3 to 4 4 to 5 5 to 6 6 to 7 7 to 8 8 to IO
IO and older
25.26 rt 1.14 24.82 2 1.18 30.28 t 1.42 24.20 -C 1.0g
23.61 t 1.0g
23.02 t .95 20.59 rt 1.31 _______
22.38 f 1.15 23.48 C 1.17 23.22 5z 1.09 22.38 f .97 24.15 f 1.09
22.22 2 .8g 20.42 t 1.15
24.65 f 1.21
24.95 C 1.14 26.02 & 1 .10
26.68 f 1.12
27.28 2 1.34
24.02 L 1.04
22.18 k .gg
22.76 t 1.82 19.m 2 2.15 22.10 2 1.57
, 24.62 * 1.71
22.64 -C 1.34 20.43 2 1.24
23.28 t 1.04
To facilitate comparison of the constants for one age with those of another age the values of the coefficients are represented as curves in figure 8. The arrangement of these curves is entirely similar to that of figures 6 and 7.
The values of the coefficients of variation are represented as ordinates and the ages at which the cows had another lactation as abscissae. The curves progressing from top to botto'm of the figure are for ages 2 , 3, 4, 5 , 6, 7, 8 and 9, and I O and above. The same reasoning, that if no selection of animals based on their records of previous years has taken place the curves generated by these coefficients of variation should be straight lines parallel with the base, still holds.
The curves in figure 8 are individually somewhat more irregular than the curves for the mean milk production of a given age (figure 6) and the standard deviations of a given age (figure 7). No definite trend of the coefficients either toward a higher value or toward a lower value is seen in the coefficients except those for the six-year period. This six- GENETICS 5 : Mr 1920
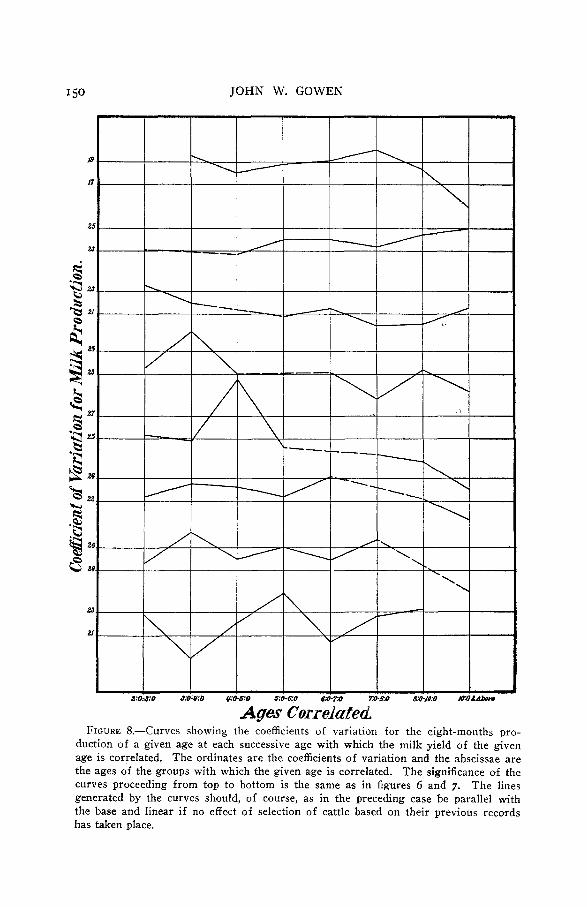
JOHN W. GOWEN
Ages Correlated. FIGURE 8.-Curves showing the coefficients of variation for the eight-months pro-
duction of a given age at each successive age with which the milk yield of the given age is correlated. The ordinates are the coefficients of variation and the abscissae are the ages of the groups with which the given age is correlated. The significance of the curves proceeding from top to bottom is the same as in figures 6 and 7. The lines generated by the curves should, of course, as in the preceding case be parallel with the base and linear if no effect of selection of cattle based on their previous records has taken place.
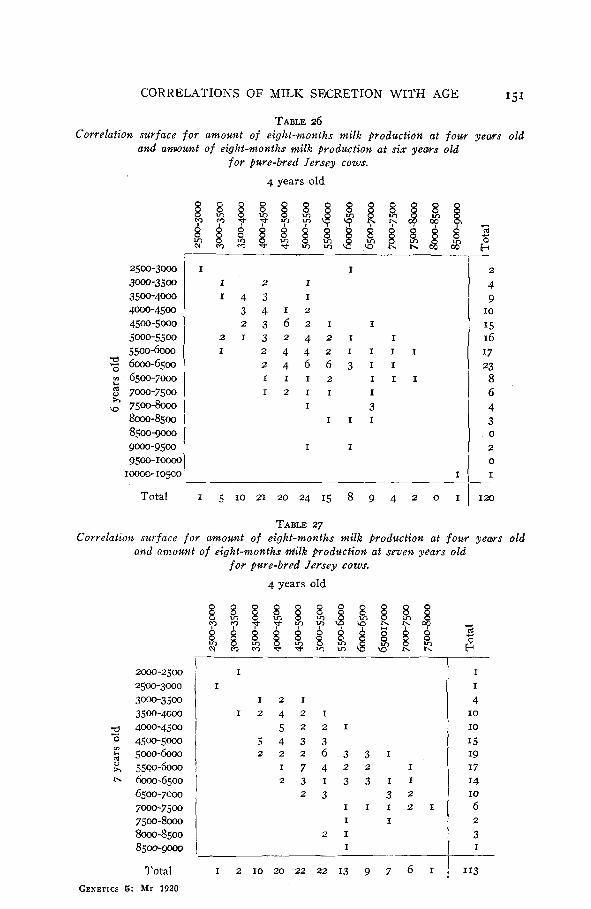
151 CORRELATIONS OF MILK SECRETION WITH AGE
TABLE 26 Correlation surface f o r amount o f eight-months milk production at four y e w s old
and amount o f eight-months milk production at six y e w s old f o r pwre-bred Jersey cows.
4 years old
2500-3000 3m-3500
4000-4500 4500-5000 5000-5500 5500-6000 6000-6500 6500-7000
3500-4000
$ 7000-7500 \o 7500-bO 1 x
8000-8500 1 8500-9ooo I 9000-9500 1 9500-Ioooo I Ioooo-ro5oo I
I I I 2 I I 4 3 I
3 4 1 2 2 3 6 2 1 I
2 1 3 2 4 2 1 I I 2 4 4 2 1 1 1 1
2 4 6 6 3 1 1 1 1 1 2 I 1 1 1 2 1 1 I
I 3 I 1 1
I I
I
2
4 9 IO 15 16 I7 23 8 6 4 3 0
2 0 I
Total I 5 IO 21 20 24 15 8 g 4 2 o I 1 120
TABLE 27 Correlation surface for ancount of eight-months milk production at four y e w s old
and amoztnt of eight-months &ilk productiort at seven years old for pure-bred Jersey c0w.r.
4 years old
2000-2500
3000-3500 3500-4000
-d 4000-4500
2500-3000
"0 4500-5000
K 55w-Go00 h 6000-6500
6500-7000 7000-7500 7500-8000 8000-8500 8500-9000
2 5000-6000
Total GENETICS 5: Mr 1920
I I
I 2 1 I 2 4 2 1
5 2 2 1 5 4 3 3 2 2 2 6 3 3 1
1 7 4 2 2 I 2 3 1 3 3 1 1
2 3 3 2 1 1 1 2 1 I I
2 1 I
I I 4 IO IO I5 I9 17 I4 IO 6
3 2
I
I 2 IO 20 22 22 13 g 7 6 I I 113

1.52 JOHN W. GOWEN
year curve is quite irregular. The general tendency is slightly down- ward indicating if it proves significant some selection on the basis of the
TABLE 28 Correlation surface f o r amount of eight-mioaths milk production at four years old
and amount o f eight-months milk production at eight and nine years old for pure-bred Jersey cows.
8 and g years old
-I
2 I
I2
26 25 17 18
6 4
IO
2
2500-3000 3000-3500 3500-4000
45~-5Mx7
h 55006000
9 4000-4500
3 5000-5500
* 6000-6500 6500-7000 7000-7500 7500-8000 I
I
I I 1 1 2
I I 1
1 3 3 1 1 1 I I 1 2 2
I I 3 3 2 I 2 I I 1
I 1 2 I I I
I 1
I
2 3 1 2 3 1
1 1 5 3 8 1 1 3 2 4 2 2 4 1 2 1 1
2 3 3 I 1
2 2 2 5 3 6 4 2
2 4 4 2 4 I 1
2 I 2 I 2 I 1
I I ~ ~~
Total 2 I IO g 15 16 31 11 7 12 6 I I o o o I I 123
TABLE zg Correlation surface for amount of eight-months milk production at four years old
and amount of eight-months miEk production at ten years and older fop. pwe-bred Jersey cows.
4 years old
2000-2500
9 3000-3500
2 4000-4500
2500-3000
0 v1 3500-4000
0 X 4500-5000 $ 5000-5500 4 5500-6OOo .& 6000-6500
6500-7000 E 7000-7500
I I
5 3
6
5 4
I1
I1
I
I -

CORRELATIONS OF MILK SECRETION WITH AGE I53
six-year milk production. Neglecting the rise at four years as obviously extraneous to the general trend of the curve, the difference between the six-year coefficients of variation for cows which were milked at 2 years and the six-year coefficients of variation for cows which were milked at IO years is 4.67 -t- 1.74, or the divergence is 2.7 times its probable error. The difference is therefore doubtfully significant, in fact probably not significant.
The conclusion which may be derived from these data is that no effect of selection of cows on the basis of their milk records is manifested by the coefficients of variation for any given age taken in conjunction with the length of time the cows remain as milkers in the herd.
I I I
TABLE 30 Correlation surface f o r amount o f eight-months milk production at five years old
and amount of eight-months milk production at Six years old f o r pure-bred Jersey cows.
5 years old
I4 I 4 I9 I7 16 8
6 IO
2
I 1 2
4 3 2 2 4 2 5 1 I I 4 5 3 1 2 1 4 5 4 I 1
2 1 1 7 1 1 3 1
1 1 3 2 5 3 1 I 1 4 2
I 1 1 2 2 1
2 3 I I
I I I
7 13 g 1 8 24 13 IO 13 11 I
l 2 1 ;
Among the important general conclusions coming out of this study of the mean 8-months milk production, the standard deviation and coeffi- cients of variation of this milk production within the different age groups determined separately for the other ages at which they had lactations in the herd, perhaps the most important is that the data for which the curve of mean milk production with age (figure 4) was obtained are free GENETICS 5: Mr 1920

I54 JOHN W. GOWEN
TABLE 31 Correlation surface for amount of eightmonths milk production at five years old
and amount of eight-months milk production at seven years old f o r pure-bred Jersey cows.
5 years old
I I 1 I 1 1 2 3 1
2 2 1 4 4
2 2 2 4 5 4 1 2 1 I 2 4 2 2
3 5 3 4 5 1
2 6 4 5 3 I
I 2 2 1 2 2 I
3 1 3 I I 2 1
I 1 I I
_____. --
2000-2500
3000-3500 3500-4000 4ooo-4500 4500-5-
2500-3000
: 5--5500 2 5500-6000 9 6000-6500 p\ 6500-7000
7000-7.500 7500-sooo 8000-8500 8500-9000
Total
x
I 2
9 I3 21
23 I1 21
I1 8 4 3 I
~
from any error due to selection of cows that were to remain in the herd on the basis of the records they made in their first, second or later lac- tations. From this it follows that the rise and fall of the curve for mean milk production with advancing age is due strictly to the physiological changes brought about in the mammary functions of the cow by age. The general equation to this physiological change expresses the law by which it is governed in the same way that MINOT (1891, 1907), LEWENZ and PEARSON (1go4), DONALDSON (1908, 1909, 1910, I ~ I I ) , HATAI (191 I ) , and PEARL with the assistance of PEPPER (1go7), have expressed the similar law for the manner in which the metabolic functions produc- ing growth change with increasing age.
Added significance is given by this analysis to the conclusions previ- ously indicated concerning the variation of milk within a given age, the correlation of age and milk production and the change of the variability of milk production with age,

I55 CORRELATIONS OF MILK SECRETION WITH AGE
TABLE 32 Correlation surface f o r amount of eightmonths milk production at five years old
and amount o f eight-months milk prodzaction at eight and nine years old f o r pure-bred Jersey cows.
5 years old
zooo-25oa 2500-3000 3000-3500 3500-qooo 4000-4500 4500-5000
2 5000-5500 O 5500-6000 5 6000-6500 a 7000-7500 9 7500-8000
00 Sooo-8500 8500-9000 9000-9500
6500-7000 a
9500-1000
I I 2 1 I 3 1 1 I 3 5 1 1 3 2 1 2 2 4 4 4 3 1 I 2 2 7 3 1 1
4 4 4 4 2 1 1 2 3 2 4 3 2 2 1 r 1 6 4 1 z z 1 1
1 1 1 1 3 4 2 I 2 1
I I 1
I
4 6 16
I7
18 20 I3 4
20
20
I 2 0
0 I
TOW-10500 1 I i I
Total 11 13 I7 I6 30 20 I4 IO 7 2 4 I 1 145 TABLE 33
Correlation surface f o r amount of eight-months milk production at five years old and amoirnt of eight-months miilk production at ten years and
oldw f o r pure-ked Jersey cows. 5 years old
-1- I 2000-2500 2500-3000 3000-3500
4 3500-4000 “0 4000-4500 3 4500-5OOo : 5000-5500 $ 5 5 0 0 - ~
I.#
x 6000-6500 S 6500-7000
7000-7500 7500-8000
Total
GENETICS 5 : Mr 1920
I I I
2 1 I 1 I I 3
I 2 1 1 1 I 1 2 1 1 2 2 1
3 I 4 2 1 I I 2 1
I I I 3 1
I I I I
I 2
5 5 7 IO I1
5
5 2
I I

156 JOHN W. GOWEN
2000-2500 I I 1
2500-3000 I
3000-3500 I 2 2 3500-4000 2 4 2 1 1 2
4000-4500 1 4 2 3 I 1
2 4500-5000 3 2 6 5 2 O 5000-5500 I 1 4 1 5 3 2 3 2
I 3 2 7 I 1 6500-7oOO 1 1 3 3 2 1
7000-7500 I I 1 1 1 1 1
5 5500-6000 I 1 1 1 2 3 4 1 1
I I
6000-6500 I 7500-8000 I s o o o 4 3 5 ~ I I I I
The correlation of eight-months milk production at a given age with the eight-months milk production at arty other given age
For a firm foundation of our practical agriculture, particularly dairy- ing, knowledge of the inter-relationships of the workings of the mam- mary functions at one age in comparison with its precision of action at another age can scarcely be too exact. The existing practice is, as al- ready pointed out, largely empirical in its nature, often leading to ques- tionable results. The reflection of the questionable nature of these prac- tices is seen in the not uncommon practice of dairymen neglecting the records of the first lactation as a measure of the cow’s possibilities for future production.
2 I
5 I2 I 2
18 22
I4 15
6
3
I1
2
TABLE 34 Cowelation swface for amount of eight-months milk production at six years old
and amouotf of eight-months milk productiofi at seven years old f o r pure-bred Jersey cows.
6 years old
Total 2 3 1 3 1 7 1 3 2 0 1 5 2 1 6 6 4 3 o I 124
The correlations between the milk production of various lactations with one another have material importance as well as theoretical interest for these problems. If the correlation is high it is evident from the practical side that the culling of the herd through the use of dependable criteria will result in the increase of profits to its owners. From the biological side, a high correlation means that the animals composing the herd are innately differentiated (presumably due to their inherited com- plex) in their mammary capacities.

I57 CORRFLATIONS OF MILK SECRETION W I T H AGE
TABLE 35 Correlation surface for amount o f eight-molzths milk production at six years old
and amount of eight-months milk production at eight and aine years old f o r pure-bred Jersey cows.
8 and g years old
I 1 I 1 I 2 2
1 2 4 3 1 I 2 2 1 2 1 3 1 1
2 4 1 3 6 6 1 3 2
3 2 5 3 . 5 1 1 I 3 2 6 4 3 1
1 3 1 3 I 2 2 4 1 I
I 1 2 1 4 4 3 2 1 1
I 1 I 1 I 1 ___
4 5
I4 2s U]
20 20
1 9 I1 2
4
I1
Total 2 5 11 g 15 19 31 14 18 15 6 I I o o I I 148
The determination of the correlations for these data is of especial interest, for, as previously shown in the earlier part of this paper, the data are of exceptional value in that they are on a pure-bred Jersey herd kept intact for many years; the lactation records for several lactations are recorded on a number of the animals; and the herd has been subject to no detectable culling based on the production of a given lactation. From these data there have been extracted lactation records to the num- ber of 3178 pairs having a full eight-months lactation free from any disease or sickness or other trouble known to influence the records. These records have been formed into twenty-eight correlation tables the most of which are of considerable size.
After careful consideration it was decided that since these tables have much of scientific and practical value to the practice of dairy husbandry they had better be printed in toto. These tables are reproduced in the text tables numbers g to 40.
The means, standard deviations and coefficients of variation for these correlation tables have been presented in tables 11, 20 and 25. Table 32 gives the correlations and their probable errors for all ages at which the lactation records were divided. The vertical columns give the corre- lations of the milk production at the age heading the column with the GENETICS 6: Mr 1920

158 JOHN W. GOWEN
TABLE 36 Cowelatiolz surface f o r amount of eight-months milk prodwtion at six years old
and amount of eight-months milk production at ten years and older f o r pure-bred Jersey cows.
6 years old
I
I I 1 I I
2 I
I 2
2 . 1 4 2 I 1 2 1
4 I I
I I
2 3 1 I 2 3 I
3 5 1
3 1 I 2
3 I
I
4 5 8 15 14 7 5 3 I
TABLE 37 Correlation surface f o r amount o f eight-months milk production at seven years old
and amount of eight-months milk production ut eight and nine years old f o r pure-bed Jersey cows.
8 and g years old
7 I I 1
I 1 1 2 2 I
I 1 3 1 2 4 1 I
1 3 5 2 6 5 2 2 1 I 2 3 2 5 3 3 2 2
1 1 2 6 1 3 1 3
2 1 3 4 2 2 1
3 3 5 3 3
I 4 4 2 1 3 2
1 1 1 1 1 1 1 I I I
2 8
I7 I4 27 23 I8 I7 I5 8 2
Total 3 5 8 16 m 20 30 13 I4 11 7 I I o o I I I 151
milk production at the ages indicated at the left-hand margin of the table.

I59 CORRELATIONS OF MILK SECRETION WITH AGE
As will be noted the correlations necessary to give the complete set of correlations for any given age are repeated, e.g., the correlation of milk production at 2 years with that a t 3 years is +0.5764+.0332 and ap- pears in the 2-year column. The correlation of the 3-years milk produc- tion with that of 2 years will, of course, be the same (0.57641.0332) and is repeated in the three-year column. In this manner a complete picture of the relationship of the lactations of the a-year groups with the other lactations of the other groups is given in the column.
TABLE 38
production of another given age. Coeficients o f cowelation o f milk prodzlction of a given age w'th the milk
2 to 3 3 to 4 4 to 5 5 to 6 6 to 7 7 to 8 8 to IO
IO and older
2 to 3 3 to 4 4 to 5 5 to 6 6 to 7 7 to 8 8 to IO
IO and older
+o.5500 f .0426 $0.5815 rt .0468 +0.4938 k ,0488 fo.5305 k .0452 44.5394 f .0&3 +q.5376 f .o& +O.5624 4 .O@I +0.6328 2 .Os80 +0.4154 f .OS03 +0.7306 f .OZ& $0.5667 2 .0403 $0.5405 f .os97
+0.6515 5 .0349 +0.4800 f ,0427 $0.5750 i .0367
+0.5750 f .os67 +0.3036 f ,0712 ~ +0.5113 f .o&
$0.6515 f .OS49 +.qROo 4 .0@7 +0.4578 T .0666 ____
2-3 years
+0.5764 2 .os32 +0.5426 k ,0361 fo.5373 4 . O d +0.5500 k .0&6 +0.5815 k .O468 +0.4938 -t .0488 S0.5603 $ .07p
3-4 years
+0.5764 k .os32
+0.6206 f .OS35 $0.5479 * -0395 +0.5305 f ,0452 fo.5394 ,0483 +0.5376 k .0465 +0.6336 f a925
4-5 years
$0.5426 f>, ,0361 $0.6206 f .OS35
+0.5541 * .OS91 4-0.5624 ,0421 +0.6328 -I- ,0380
+0.2IU k ,0919 t0.4154 .OS03
5-6 gears
$0.5373 2 .04& $0.5479 2 -0395 f0.5541 2 .OS91
TABLE 38 (continued) Coeficients of correlation of milk production of a given age wifh the inilk
producti0.n of another given age.
8-10 years IO years and OM& I- 6-7 years r - 1 7-8 years -
+0.5603 k .073z +0.6336 t .0925 + O . Z I G t .Og1g t-0.5371 4 -0697 +0.4578 k ,0666 fo.3036 -t .0712 $.0.5113 f .OM8
The order of magnitude of these correlations is from +0.7306 for the correlation of 8-months milk productions during the ages 5 to 6 and 6 to 7 years, and +o.z144 for the correlation of the productions during the ages 4 to 5 and IO years and older. Such correlations indi- cate that the milk production of one lactation may be predicted with rela- tively little inaccuracy from the milk production of another lactation. The graphs showing these correlations for each year are seen in figure 9.
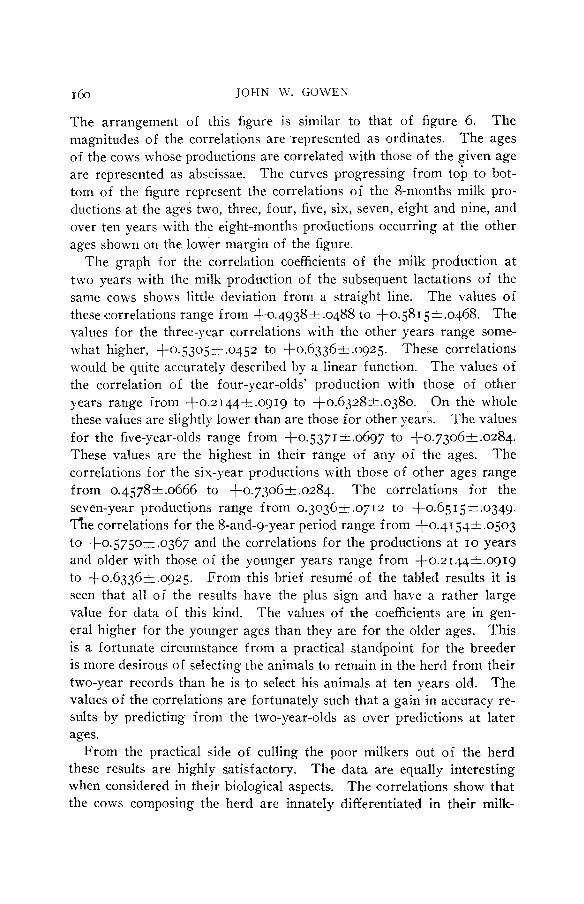
I 6 0 JOHN W. COWES
The arrangement of this figure is similar to that of figure 6. The magnitudes of the correlations are represented as ordinates. The ages of the cows whose productions are correlated with those of the given age are represented as abscissae. The curves progressing from top to bot- tom of the figure represent the correlations of the 8-months milk pro- ductions at the ages two, three, four, five, six, seven, eight and nine, and over ten years with the eight-months productions occurring at the other ages shown on the lower margin of the figure.
The graph for the correlation coefficients of the milk production at two years with the milk production of the subsequent lactations of the same cows s h o w little deviation from a straight line. The values of these correlations range from +0.4938t.0488 to +0.5815*.0468. The values for the three-year correlations with the other years range some- \\-hat higher, +0.5305& .04 j 2 to +0.6336t .0925. These correlations would be quite accurately described by a linear function. The values of the correlation of the four-year-olds' production with those of other years range from +0.2144t.0919 to +0.6328t.0380. On the whole these values are slightly lower than are those for other years. The values for the five-year-olds range from +0.5371 t .0697 to +0.73063-.0284. These values are the highest in their range of any of the ages. The correlations for the six-year productions with those of other ages range from 0.4578-t.0666 to +0.7306+- .0284. The correlations for the seven-year productions range from 0.30363~ .0712 to fo.65 I 5k.0349. f i e correlations for the 8-and-9-year period range from +0.415.4.r'.0503 to fo.5750-11.0367 and the correlations for the productions at I O years and older with those of the younger years range from +0.2144-t.o91g to +0.6336t.0925. From this brief resum6 of the tabled results it is seen that all of the results have the plus sign and have a rather large value for data of this kind. The values of the coefficients are in gen- eral higher for the younger ages than they are for the older ages. This is a fortunate circumstance from a practical standpoint for the breeder is more desirous of selecting the animals to remain in the herd from their two-year records than he is to select his animals at ten years old. The values of the correlations are fortunately such that a gain in accuracy re- sults by predicting from the two-year-olds as over predictions at later ages.
From the practical side of culling the poor milkers out of the herd these results are highly satisfactory. The data are equally interesting when considered in their biological aspects. The correlations show that the cows composing the herd are innately differentiated in their milk-

CORRELATIONS OF MILK SECRETION WITH AGE 161
FIGURE 9.-Curves showing the coefficients of correlation of milk production of a given age and the milk production occurring at any other given age. The ordinates a re the values of the correlation coefficients. The abscissae are the ages at which the lactation record compared with the record at the given age, was made. Thus the top curve of the figure shows the correlations of records made at two years old with the records made at subsequent ages. From this curve the correlation between two-years milk production and three-years milk production is found on the three-year line of the two-year curve (top curve of figure) to be 0.5764. The correlation of the two-year and four-year record is found on the four-year line where the two-year line crosses it (top curve of figure) to be 0.5426, etc. The dotted lines serve to connect the correlations immediately preceding and following fhe age for which the line is drawn.
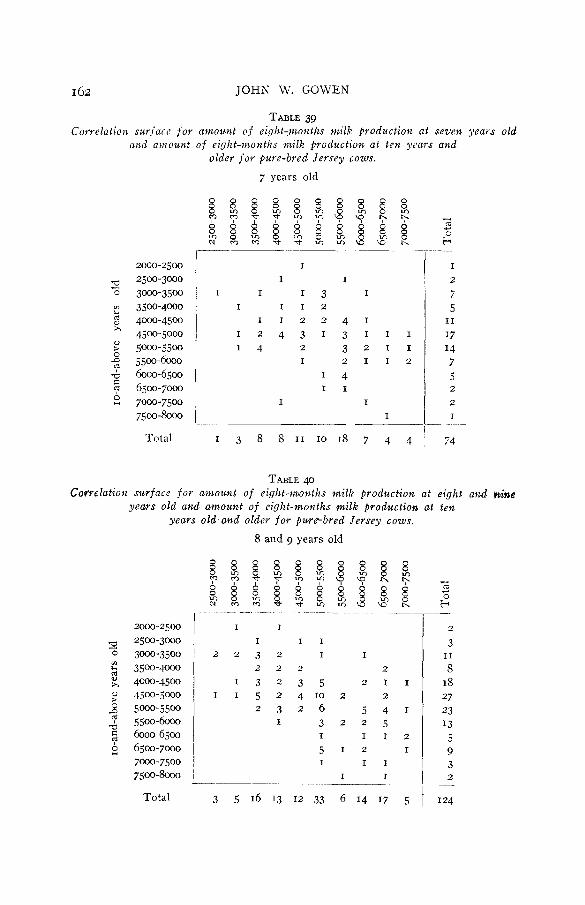
I 62 JOHN W. GOWEN
TABLE 39 Correlation surfacc for amount o f eight-months milk productiota at seven years old
and amount of eight-months milk productiolz at ten years and older f o r pure-bred Jersey cows.
7 years old
2000-2500
2500-3000 0 3000-3500 9
rd 4000-4500 3500-4000
' 4500-5000 0 $ 5000-5500 n 5500-6000 ? w 6000-6500 9 6500-7000
7500-?Q@3 !! 7000-7500
Total
i I
1 I I
I I I 3 I
I 1 2 2 4 1 I I 1 2
1 2 4 3 1 3 1 1 1 I 4 2 3 2 1 1
I 2 1 1 2
I 4 I 1
I I
I
I 3 8 8 1 1 1 0 1 8 7 4 4
I
2
7 5
I7 I4 7 5
I1
2
2
I -
74
TABLE 40 Cowelation surface for amount of eight-months milk production at eight and hime
years old and amount of eight-months milk production at ten years old and older for pure-bred Jersey cows.
8 and g years old
I I I
I I 1
2 2 3 2 I I
2 2 2 2
1 3 2 3 5 2 1 1 I I 5 2 4 1 0 2 2
I 3 2 2 5 2 3 2 6 5 4 1
I I 1 2
5 1 2 I I I 1
I I
2
3
8 IS 27 23 I3 5 9 3
I 1
2
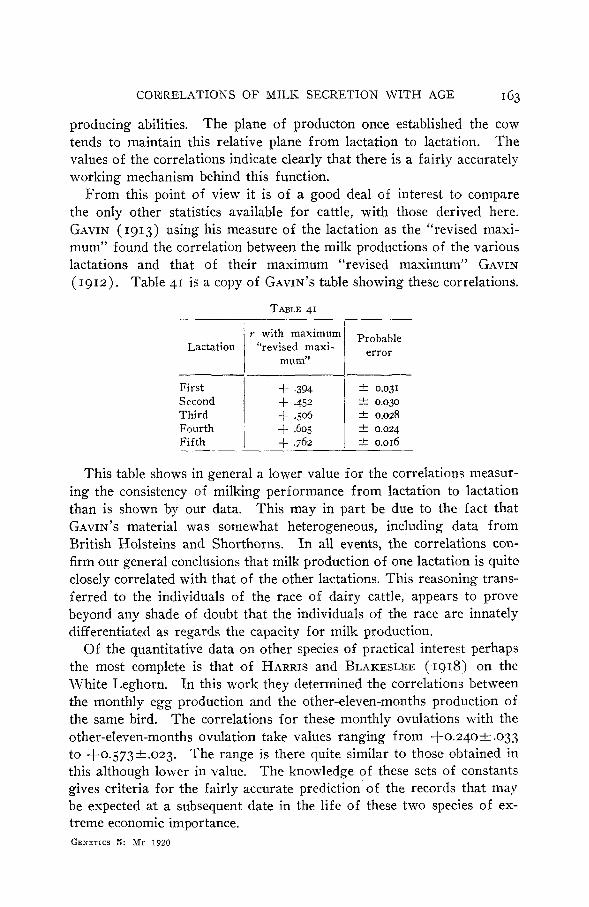
CORRELATIONS OF MILK SECRETION WITH AGE 163
producing abilities. The plane of producton once established the cow tends to maintain this relative plane from lactation to lactation. The values of the correlations indicate clearly that there is a fairly accurately working mechanism behind this function.
From this point of view it is of a good deal of interest to compare the only other statistics available for cattle, with those derived here. GAVIN (1913) using his measure of the lactation as the “revised maxi- mum” found the correlation between the milk productions of the various lactations and that of their maximum “revised maximum” GAVIN (1912). Table 41 is a copy of GAVIN’S table showing these correlations.
TABLE 41
1 r with maximum
mum” Lactation “revised maxi-
Probable error
First Second Third Fourth Fifth
This table shows in general a lower value for the correlations measur- ing the consistency of milking performance from lactation to lactation than is shown by our data. This may in part be due to the fact that GAVIN’S material was somewhat heterogeneous, including data from British Holsteins and Shorthorns. I n all events, the correlations con- firm our general conclusions that milk production of one lactation is quite closely correlated with that of the other lactations. This reasoning trans- ferred to the individuals of the race of dairy cattle, appears to prove beyond any shade of doubt that the individuals of the race are innately differentiated as regards the capacity for milk production.
Of the quantitative data on other species of practical interest perhaps the most complete is that of HARRIS and BLAKESLEE (1918) on the White Leghorn. In this work they determined the correlations between the monthly egg production and the other-eleven-months production of the same bird. The correlations for these monthly ovulations with the other-eleven-months ovulation take values ranging from +0.240+ .OS3 to +0.573f.o23. The range is there quite similar to those obtained in this although lower in value. The knowledge of these sets of constants gives criteria for the fairly accurate prediction of the records that may be expected at a subsequent date in the life of these two species of ex- treme economic importance. GENETICS 5 : Mr 1920
* 0.031 k 0.030 * 0.028
+ ,394 + .452
+ .605 + 362 & 0.016 2 0.024
I

164. JOHIV W. GOWEN
THE REGRESSION OF THE MILK PRODUCTIONS O F THE DIFFERENT LACTA-
TIONS ON EACH OTHER
The constants necessary to determine the approach of the regression to linearity are given in table 42. The values of the correlation coefficients have been repeated for greater ease in drawing conclusions from the values of the correlation ratios.
In this table the values of the correlation ratios range from 0.4382 to 0.8189. The conclusions drawn from a study of the correlation coeffi- cients is thus confirmed by these correlation ratios.
As is generally well recognized, the coefficients of correlation depend for their accuracy on the regression lines being closely described by a linear function. The values of the correlation ratio on the other hand do not depend on this fitting of linear functions to the rough regression lines but do give a measure of the association from the regression line itself. If this rough regression is linear the two constants should agree within the limits of their probable errors. In table 42 columns 7 9 and r,’_rZ give constants to measure this agreement. The last column gives the multiple number of times 7 ’ 4 is to the probable error. This column gives us in a form easily appreciated the measure of what sig- nificance can be attached to these constants. The values range from 0.33 to 4.46, from an insignificant deviation to one probably significant. Of the 28 values only six are less than 2 times their probable error. The average of the 28 constants shows that the mean deviation is 2.42 .times the probable error. On the face of this it would seem that there is a slight deviation of the regression lines from the linear. This deviation may be due to the duration of life covered by the age units within which the lactation records were correlated. These units were in general of one year in length. During this time, as was shown earlier in this paper, there is a non-linear rise in milk production. One year appears to be of sufficient length of time to have produced this effect in the milk yield. To this effect the appearance of a regression differing slightly from the linear may be attributed. I t would appear that should a shorter unit of time be chosen, the value of the correlation coefficients would agree more closely with those of the correlation ratios.
This reasoning, while apparently probable, does not prove true, as a later section of the paper dealing with regressions over five lactations shows. This slight lack of linearity must therefore be considered due either to chance or to some obscure causes. In any case it will not in- fluence the results materially where the correlations are used as con- stants for calculation.
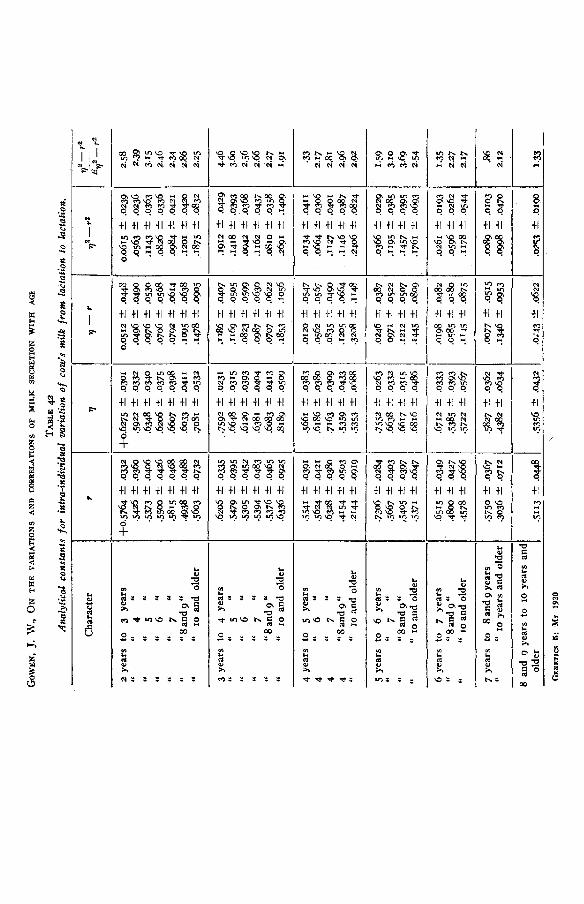
GO
WEN
, J. W
., O
N T
HE
VA
RIA
TIO
NS
AN
D C
OR
RE
LA
TIO
NS
OF
MIL
K
SEC
RE
TIO
N WITH
AG
E
TA
BL
E 4
Anal
ytic
al c
onsta
nts
for
intra
-indi
vidu
al v
aria
tion
of c
ow's
milk
from
lact
atio
n to
lac
tatio
n.
Cha
ract
er
-
rl-'
0.051
2 f .0
448
-049
6 f 490
.q76
f .o
s30
.0706
& ,05
68
.1og5
f .6
38
.0792
f .o
614
.I478
f .o
go5
r
5 ye
ars
to
6 ye
ars
"
7 ''
"8 an
d 9 "
"
.75o6
-4 .mQ
,566
7 f .0
403
,5405
f ,0
397
t ~~
2 y
ears
to
3
year
s '
"
4 "
"
5 "
' U
6
16
"
7 "
" 8
and
g "
"
IO a
nd o
lder
" '
+0.57
64 f .0
332
,542
6 f .O
S60
.5373
f -
044
.55m
f .o
&
.5815
f .0
468
.4938
f .0
4@
.5603
e .0
732
to.6
27j f .0
301
.5922
f .0
332
.6348
f ,030
.6d
rt
.os7
5 .f&
f .0
398
6033
f .W
II
.7oSr
-C
.05
32
0.61
5 f .m
39
.0563
-C
.02
36
~1
43
2 .
0363
,0
826 f ,0
336
.og84
& .O&I
.I20
1 f .
ow
~
87
5 f .o
f332
2.58
3.15
2.
46
2.34
2.86
2.25
2.39
~~
3 ye
ars
to
4 ye
ars
"
"
5 "
"
6 'I
"
7 "
"8 an
d g
I'
"
IO an
d ol
der
' 4 ye
ars
to
5 ye
ars
4 "
6 "
4 "
7 ''
4 "8
and
g "
"
IO a
nd o
lder
.T?
% I
.0407
.I
16
f .o
s05
.a23
-t-
.0599
.
e7
f .0
530
~8
53
f .i
o56
,070
7 f .
&22
.012
0 -4
.O
S47
.Os3
5 3:
,0
490
.0562
f .0
56j
.I205
f .0
664
,3208
k ~
14
8
.0246
f .0
387
137;
* .0
522
-- .I212 f .O
S07
.I445
f .of309
4.46
3.6
0 2.5
6 2.
66
2.27
1.91
.33
2.17
2.81
2.9
6 2.9
2
.75gz
f ,0
231
,6648 2
.031
5 .61
29 f .O
S93
6381
f .0
404
do83
& .0
413
8189
f .o
s09
.566
r &
.of
83
,716
3 f .0
309
.5359
f ,0
433
.5353
f .
om
6186
f .O
S%
~912 f .o
&g
.og+ f .
0368
~
16
2 f .0
47
.OSIO f .0
358
.*I
c .I
409
.0664
c .
OM
.I418
f .O
S93
.Or3
4 f .O
qII
.1127
f .o
401
.1146
f .0
387
.240
6 rt
.08
24
.0366
f .ozzg
~rg
g
k ,0
385
J457
f .0
395
.1761
f ,0693
.7552
* .02
63
6638
f .0
3p
,661
7 &
.os
15
,65216 &
,04
86 -
,671
2 f ,0
333
-538
5 *
.039
3 .57
22 f .O
s67
.5827
f .0352
.438
2 f .06w
1.59
3.1
0 3.
69
2.54
1.35
2.27
2.1
7
.org8 f a
482
.cq5
* .a
;%
.1r$
5 f ,0
875
.m77
e .o
s15
.1~
6 f .o
g53
---
.0261
f .O
r93
,117
8 f ,0
544
.os9
6 f .o
&
.5750
f ,0
367
" IO y
ears
and
old
er I .
3036
& .0
712
I' 7 ye
ars
to
8 an
d g y
ears
.oo@ f .o
r03
.m f .0
470
.%
2.12
8 an
d 9
year
s to
IO
year
s an
d al
der
.5113
.%S
GEN
ETIC
S E: Yr
1920
.0;43
f ,622
.5356
f ,0432
\
.075
.1
.OIW

CORKELATIOXS OF MILK SECRETION W I T H AGE 165
From these correlation coefficients in tables 41 and 42 it is possible to form the straight-line prediction of‘the milk yield of any age from the yield of any other age. As emphasized repeatedly in the various sections of this paper dealing with the separate subjects, the predictions may be criticised on the following grounds : that the mean milk yield rises with age in a line described by a logarithmic function; that the standard devi- ation of this milk yield rises in line described by a cubic parabola; and that the values of the correlation coefficients differ from the values of the correlation ratios by 2.42 times the probable error of 7’-y2. Such criticisms are recognized and admitted at once. I t is believed that even admitting these there are a number of important points which may be elucidated by these equations.
The general equation for these regressions is given by U U
Y Y
Y= ( M e a n y - ~ y y ~ M e a n y ) +l;yy 7 Y Y Y
where y = 8-months milk yield in a given year and Y the expected milk yield for the year desired. The results of the substitution of the values of tables 11 to 42 in this equation are given in table 43.
As the milk production is given in pounds the second term of each of these equations gives the gain in expected milk yield for the given age, if one pound increase in actual production is made during the test. The calculation of an expected yield is, therefore, a simple matter of direct substitution.
Before discussing the relative practical and theoretical merits of these equations for the study of milk records it may be well to take up the equations individually. The coefficients of the y’s (actual yields) rep- resent the reliance that may be put on these actual yields for subsequent productions. The information desired by those who use these coeffi- cients for actual records may be divided into two heads: ( I ) At what age should the cow make her record to give the best index of her po- tential producing abilities? ( 2 ) T o what age should the records, made at different periods in the life of the cow, be corrected so that the maxi- mum reliance may be placed on the corrected record?
The first of these questions entails a study of the coefficients of the y’s for the ages at which the record was made. The data for this are given in table 44. The equations in this table are of no value save for this comparison, for if any record is to be corrected the equations in table 43 should be used.
GENETICS 5 : Mr 1920

GO
WE
N,
J. w
., O
N T
HE
VA
RIA
TIO
NS
AN
D
CO
RR
EL
AT
ION
S O
F M
ILK
SE
CR
ET
ION
W
ITH
AG
E
TA
BL
E
43
Regr
essi
oit
equa
tions
of
the
milk
yie
ld f
or a
ny a
ge f
rom
tha
t of
any
lac
tatio
n re
cord
at
anot
her
age.
2
year
s to
3 y
ears
yz
3 ye
ars
to 4
yea
rs y
3 4
year
s to
5 y
ears
y1
5 ye
ars
to 6
yea
rs y
5 6
year
s to
7 y
ears
yB
7
year
s to
8 y
ears
Y,
I A
ge a
t w
hich
exp
ecte
d m
ilk y
ield
is
des
ired
Reg
ress
ion
equa
tion
Y =
213
0.0
+ ,4
1943
1~
Y =
239
1.2
+ .34
27Y
a Y =
239
4.4
+ .3
219y
j Y
= 2
456.
2 +
.301
8y6
Y =
1~
5.3
+ .3
955y
7
5 ye
ars
to
6 ye
ars
Reg
ress
ion
equa
tion
Reg
ress
ion
equa
tions
of
the
milk
yie
ld f
or a
ny a
ge
froi
n th
at o
f an
y la
ctat
ion
reco
rd a
t an
othe
r ag
e.
._
__
__
_.
__
_
Age
at
whi
ch e
xpec
ted
milk
yie
ld
is d
esir
ed
Age
at
whi
ch m
ilk y
ield
w
as m
ade
-
2
year
s to
3
year
s y2
3
year
s to
4 y
ears
y3
4 ye
am
to 5
yea
rs y
4
5 ye
ais
to 6
yea
rs y
z 6
year
s to
7 y
ears
yc
7 ye
ars
to 8
yea
rs y
, 8
year
s to
IO
yea
rs y
s IO
yea
rs a
nd
abov
e vl
n
6 ye
ars
to 7
yea
rs
1 7
year
s to
8 y
ears
I
Reg
ress
ion
equa
tion
Y =
191
0.8 +
.8549yz
Y =
250
2.2 +
.607
5y3
Y =
143
5.1 +
.77/
'8y4
Y =
216
5.0 +
.631
4y3
Y =
177
9.2 +
,65
85
~~
8 y
ears
to
IO
year
s ~
IO
year
s an
d ab
ove
Reg
ress
ion
equa
tion
1 R
egre
ssio
n eq
uati
on
GEN
ETIC
S 5: 166 Mr 1920

167 CORRELATIONS OF MILK SECRETION WITH AGE
TABLE 4 Average regression equations of milk records at the same age f o r the expected records
made throughout the l i fe of the cow. (Summarized f r o m table 43.)
Age at which milk record was made1 Regression equation
2 years to 3 years 3 " to 4 I'
4 " to 5 "
5 " to 6 "
6 '' to 7 "
7 " to 8 "
8 " to IO "
IO years and over
Y = 1521.3 + ,8927y. y = 2268.9 + .5893Y3 Y = 2122.9 + .5637yn Y = 2110.4 + .5440y6 y = 2353.3 + .478Oys Y = 2262.8 + .5039yr I Y = 2813.2 + .4639ylO y = 2724.7 + .4315ys
These data in table 44 show the average values of the regression equations for each age. The coefficients of the y's are the largest at the early years of the cow's life. While quite irregular the values tend to decline as the age when the lactation is made increases. Practically con- sidered this manner of decline is very fortunate. The first lactation be- ing the one most accurately measuring the expectation of the cow in subsequent years enables the farmer or dairymen to determine with greatest certainty from this lactation what the cow is most likely to pro- duce. On this basis the herd may be culled of the poor producers after the first lactation in full knowledge that they would always remain rela- tively low milkers throughout their life time. Theoretically considered the trend of this decline is of equal interest. Most published records on all breeds of cattle have the greatest number of cattle tested when two years old. I t is of considerable consequence, therefore to have the rec- ords of the two-year-olds a reasonably accurate measure of the cow's milking capacity. I t is of further interest to know that these two-year- olds are the most dependable index of this producing ability.
The data in table 45 summarize the information necessary to deal with the second question. As for table 44 the equations are of no value save for the comparison in hand. If any record is to'be corrected the equations of table 43 should be used.
This table shows that the highest values of the coefficients of the y's occurs for the ages 6 years to 7 years. On each side of these ages the values decline toward both the-lower and higher years. Practically con- sidered this maximum of the curve shows that the relative potentialities of the cows within the herd is most accurately determined by correcting the records of these animals to the age basis of 6 years to 7 years. This as determined previously in the paper is near the age when the maxi- mum production of this group of Jerseys may be expected. GENETICS 5 : Mr 1920

I 68 JOHN W. GOWEN
2 years to 3 years 3 " to 4 "
Y = 2367.3 + .34&2-2 Y =z 1926.5 + .579'~x-3
Before turning to other phases of the subject it may be well to discuss the practical and theoretical errors that in some measure vitiate the use of these equations given in table 43. In the practical application the equations will only give values approximately correct. The reason for this is found in an earlier section of the paper where it was shown that milk production is a highly variable character. This variation is suffi- cient to cause a not _inconsiderable difference in the records of certain cows from lactaiion to lactation. The difference in these records is also expressed in the corrected expected records as calculated from these equations.
The equations are in slight error since they do not take account of the lack of linearity of regression. This difference is such as to make only a very slight error as may be judged by the fact that $-r2 is on an average 2.42 times its probable error (page 164).
None of the above errors are very serious drawbacks to the actual use of their equations in practical dairying. The reason for this is simple. The main object for which these equations are of use in a practical sense (the culling the herd of the poor milkers) is little in- fluenced by small errors as the dairyman is not going to select the ani- mals he is going to keep on a difference of one pound. His selections will be as widely separated as possible.
In dealing with milk records frQm the view-point of inheritance an- other question should be considered, namely, what makes the regression of the different lactations toward the mean of the general population? Is it an expression of a genotype or is it variation impressed by environ- ment on the genotype in its phenotypic expression? From the general physiological side of milk-production studies the facts all point to the explanation of this regression as principally due to the conditions not
169 CORRELATIONS OF MILK SECRET’ION W I T H AGE
being ideal for the full expression of a cow’s potentialities. A few il- lustrations will make this clear. The work of WING and FOORD (1904) in New York and ECKLES (1912) in Missouri, have shown that meager feeding will reddce the quantity of milk that a cow will produce in a given lactation. WOLL (1902) has reported Danish records to prove that indoor housing decreases milk yield. DOLGICH has shown that working the cows in excess decreases the milk flow. If it is admit- ted, as it seems it must be that these known variations influence the potential capacities of cows for milk production, it is equally likely that the whole environmental complex in which the cow lives also influences the yield. The studies of PEARL and MINER (1919) indicate these environmental influences amount on an average to as much as one-third of the observed coefficients of variation of the milk of a cow. These environmental influences undoubtedly vary from lactation to lactation and from cow to cow. Such conditions make for regression, for it is only the fortunate coincidence that favors the full expression of the cow’s milking capacities. If these considerations are granted as the true state of affairs, inheritance studies of milk production certainly should disregard this regression, as the inclusion of it (as is done by the use of these regression equations) would simply befog the true mechan- ism if not hide it altogether. Under these circumstances the student of inheritance should use the equation of the mean curve and not the regres- sion equation to count the records of the individual cows, if possible choosing the best record of the series of records as in all probability this represents the fullest expression of the cow’s genetic constitution.
THE CORRELATION O F T H E MILK PRODUCTION O F A GIVEN AGE WITH THE TOTAL PRODUCTION O F TWO LACTATIONS
This question and the further extension of it to cover the case of the cow’s whole lactation history are of especial interest to the practical dairyman. H e is interested primarily in the total yield he may expect from a cow rather than the yield of individual lactation.
T’wo sets of correlations have been determined to answer this problem ; one set on the data as above given where the correlation is between the lactation record of the given year and the lactation records of the given year plus the record of some other year ; the second a special set of cor- relations for the correlation of the summed production for the first five lactations with their component parts.
The first set of correlations may fortunately be calculated without
GENETICS 5 : Mr 1920
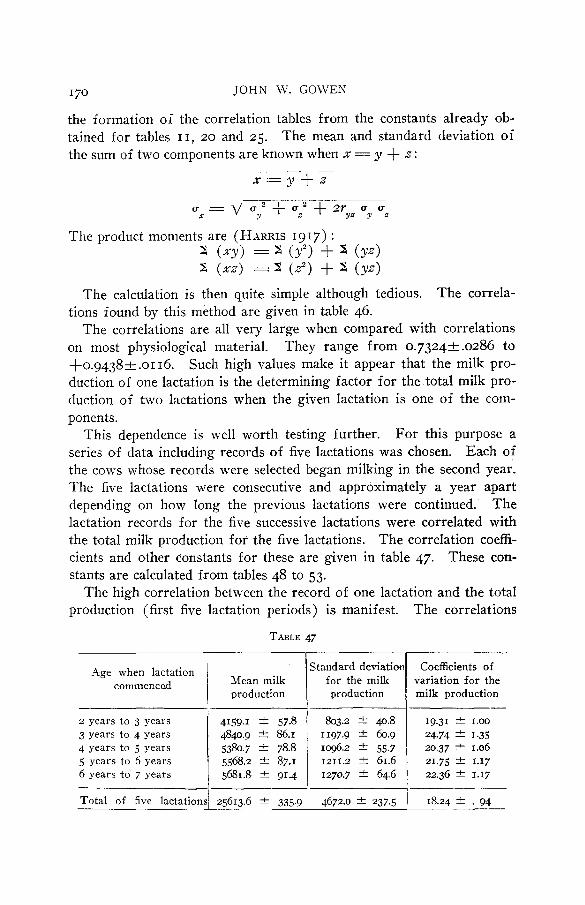
JOHN W. GOWEN 170
the formation of the correlation tables from the constants already ob- tained for tables 11, 20 and 25. The mean and standard deviation of the sum of two components are known when x = y + x :
x= F+ z
,4ge when lactation commenced Mean milk
production
U = u 2 + ugZ + 27 U U, Y YZ Y
Standard deviation Coefficients of for the milk variation for the production milk production
The product moments are (HARRIS 1917) : 2 (XY> = 8 (Y") + 8 (YZ) r, (xz ) = 8 ( 2 2 ) + 8 (yz)
The calculation is then quite simple although tedious. The correla- tions found by this method are given in table 46.
The correlations are all very large when compared with correlations on most physiological material. They range from 0.73242.0286 to +0.94382.0116. Such high values make it appear that the milk pro- duction of one lactation is the determining factor for the total milk pro- duction of two lactations when the given lactation is one of the com- ponents.
For this purpose a series of data including records of five lactations was chosen. Each of the cows whose records were selected began milking in the second year. The five lactations were consecutive and approximately a year apart depending on how long the previous lactations were continued. The lactation records for the five successive lactations were correlated with the total milk production for the five lactations. The correlation coeffi- cients and other constants for these are given in table 47. These con- stants are calculated from tables 48 to 53.
The high correlation between the record of one lactation and the total production (first five lactation periods) is manifest. The correlations
This dependence is well worth testing further.
TABLE 47
5 years to 6 years 6 years to 7 years
5568.2 C 87.1 1211.2 & 61.6 21.75 2 1.17 5681.8 2 91.4 1270.7 k 64.6 22.36 Zk 1.17

.GO
WE
N, 3.
-w.,
ON
TH
E V
AR
IAT
ION
S A
ND
CO
RR
EL
AT
ION
S O
F M
ILK
SE
CR
ET
ION
WITH A
GE
.lA
BL
E 46
Cor
rela
tion
betw
een
thr
lact
atio
n re
cord
of
a gi
ven
year
and
the
lac
tatio
tt re
rord
of
tlze
giz
m y
enr
plus
th
r rr
cord
-0.8443
2
.Or4
3 .5
~a
* .0173
.e030 t .
uzoz
,7961
?
.022
4 .8403 f .
om8
.78o8 f .
0252
.So2
6 2
.0379
,895
4 f .O
IOP
.848
9 f ,0157
3463
t .OI79
.<%
I3 *
.OI7h
.5jo
3 c .
or82
.g337
2 .OI@
Cha
ract
er*
-
j3 a
nd (
z +
3)
!4 an
d (z
+ 4)
!s
and
(2 +
5)
j6 a
nd (
3 +
6)
'7 a
nd
(2
+ 7)
18 a
nd 9 a
nd (
z +
S an
d 9)
1 IO a
nd o
ver
and
(2
+ IO
and
ove
r)
:3 an
d (3
+ 4
) is
and
(3
+ 5)
:C
i an
d (3 +
6)
i7 all
tl
(3 f 7
) ,s
axl
5) an
d (.?
+ 7)
I IO
ant
! ov
cr a
nd (
3 +
IO a
ncl
over
)
3 a
nd (
2 +
3)
2 a
nd (
2 +
4)
z an
d (2 +
5)
2 a
nd (
2 +
6)
2 a
nd (2 +
7)
z an
d (z
+ 8
and 9)
z an
d (2 +
IO a
nd o
ver)
3
ad
(3 +
4)
3 an
d (3
+ s)
3
and
(3 +
6)
3 an
d (3
+ 7
) 3
and
(3 -t
P nn
d 9)
3
and
(3 +
IO an
d ov
er)
4 an
d (4
t- 5
) 4
and
(4 +
6)
4 an
d (4
I- 7)
4 an
tl (4
4- 8
and
9)
4 an
d (4 +
IO a
rid o
ver)
5
and
(5 +
6)
s an
d (5
4. 7)
5 an
d (5 +
S an
d 9)
j a
nd (
5 +
IO a
nd o
ver)
6
and
(6 +
7)
6 an
d (6
+ 8
and
9)
6 an
d (6
+ IO
and
ove
r)
7 an
d (7 +
8 an
d 9)
7 an
d (7 +
IO a
nd o
ver)
R
aiitl
9 a
nd
(8 a
nd 9
+ IO
and
ove
r)
* Und
er c
hara
cter
is
rcco
rclc
d fi
rst
,8661
2 ,0140
.8740 C
.ozr
g ,9077
-C
.or4
.S534
.org
r ,8
690
&
,020
6 .8@1
k
.or3
5
;S an
d 9
and
(5 +
8 and
9)
'IO
and
ovc
r an
d (j +
IO a
nd o
rer)
7 a
nd (
6 +
7)
'8 a
nd 9
and
(6 +
8 an
d 9)
IO a
nd o
ver
and
(6 4
Io
and
over
) ,,
8 an
d g
and
(7 +
S an
d 9)
,870
3 2 ,0147 11
IO a
nd o
ver a
nd (
8 an
d y +
IO a
nd o
ver'
lact
atio
n re
cord
was
cor
rela
ted
with
the
sum
of
the
two
lact
atio
n re
cord
s m
ade
at th
e ag
es i
ndic
ated
in t
he p
aren
thes
is.
The
nc/e
at
whi
ch t
he f
irst
lact
atio
n w
as m
ade
is r
ecor
ded
as t
he t
erm
in p
aren
thes
is.
The
pEzcs
sig
n si
gnif
ies
that
thi
s rc
cort
l w
as a
ddcd
to
the
reco
rd m
ade
at t
he a
ge i
ndic
ated
as
the
seco
nd t
erm
of
the
pare
nthe
sis,
GE
~F
TJC
? I,: Xi-
1930
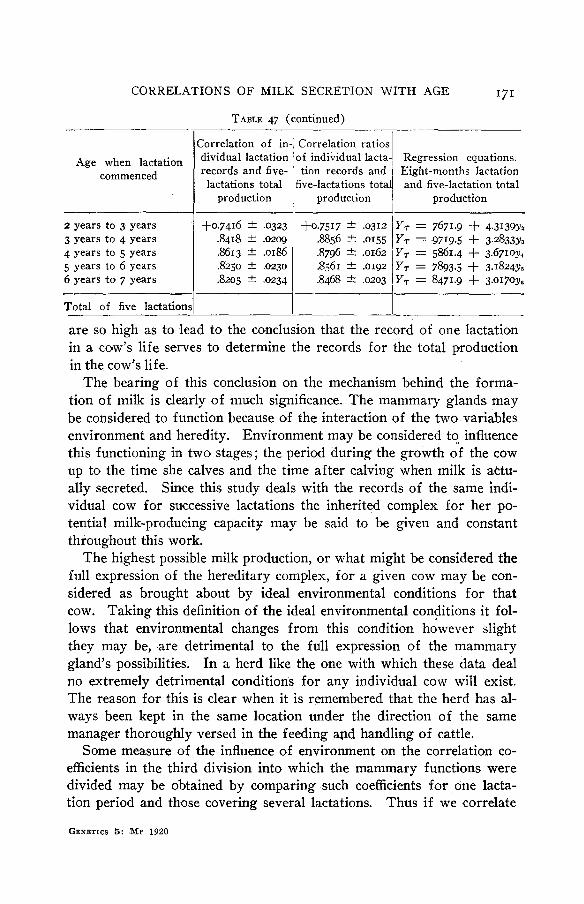
171 CORRELATIONS OF MILK SECRETION WITH AGE
TABLE 47 (continued)
Correlation ratios of individual lacta- tion records and
five-lactations total production
]Correlation of in Regression equations. Eight-months Iactation and five-lactation total
production
Age when lactation commenced
I production
dividual lactation records and five- lactations total
2 years to 3 years 3 years to 4 years 4 years to 5 years 5 years to 6 years 6 years to 7 years
+0.7416 h ,0323 A418 -C . o m .%13 -C- .OI% .8250 & ,0230 .8205 2 .0234
Total of five lactation4
f0.7517 * .OS12 .a56 & .OI55 ,8796 C .0162 .8561 & ,0192 ,8468 2 ,0203
are so high as to lead to the conclusion that the record of one lactation in a cow’s life serves to determine the records for the total production in the cow’s life.
The bearing of this conclusion on the mechanism behind the forma- tion of milk is clearly of much significance. The mammary glands may be considered to function because of the interaction of the two variables environment and heredity. Environment may be considered to influence this functioning in two stages; the period during the growth of the cow up to the time she calves and the time after calving when milk is actu- ally secreted. Since this study deals with the records of the same indi- vidual cow for successive lactations the inherited complex for her po- tential milk-producing capacity may be said to be given and constant throughout this work.
The highest possible milk production, or what might be considered the fill1 expression of the hereditary complex, for a given cow may be con- sidered as brought about by ideal environmental conditions for that cow. Taking this definition of the ideal environmental conditions it fol- lows that environmental changes from this condition however slight they may be, are detrimental to the full expression of the mammary gland’s possibilities. In a herd like the one with which these data deal no extremely detrimental conditions for any individual cow will exist. The reason for this is clear when it is remembered that the herd has al- ways been kept in the same location under the direction of the same manager thoroughly versed in the feeding apd handling of cattle.
Some measure of the influence of environment on the correlation co- efficients in the third division into which the mammary functions were divided may be obtained by comparing such coefficients for one lacta- tion period and those covering several lactations. Thus if we correlate
GENETICS 5 : Mr 1920

GW
EN
, J.
W.,
ON
TH
E V
AR
IAT
ION
S AND C
OR
RE
LA
TIO
NS
OF
MIL
K
SEC
RE
TIO
N WITH A
GE
TA
BL
E
Cor
rela
tion
surf
ace
for
amou
nt o
f ei
ght-
mon
ths
milk
pro
duct
ion
for
the
firs
t fiv
e la
ctat
ions
in
the
cow’
s li
fe
and
the
amou
nt of
eigh
t-m
onth
s m
ilk W
oduc
tion
at two y
ears
old
fo
r pu
re-b
red
Jers
ey
cow
s.
Tot
al p
rodu
ctio
n fo
r fir
st f
ive
lact
atio
ns
(eig
ht-m
onth
s pe
riod
s)
‘I
I
I I
12
11
32
24
I
1
I2
1
31
13
I
1
I I
I 2
31
23
23
11
I
13
2
12
24
21
11
1
11
I
I I I
I I
I1
2000-2500
2500
-300
0
0 3500-4000
3 3
000-3500
2 4000-4500
N 5ooo-5500
5500--
6000
-650
0
E 45
00-5
000
Tot
al
I I
3 2
5 4
4 610 5
6 4
8 s
Q 3
s 2
2
I I
I I 8
8
GE
NE
TIC
S 5:
172
’ M
r 19
20

U
u u
u u
u - ( Y u
m
m
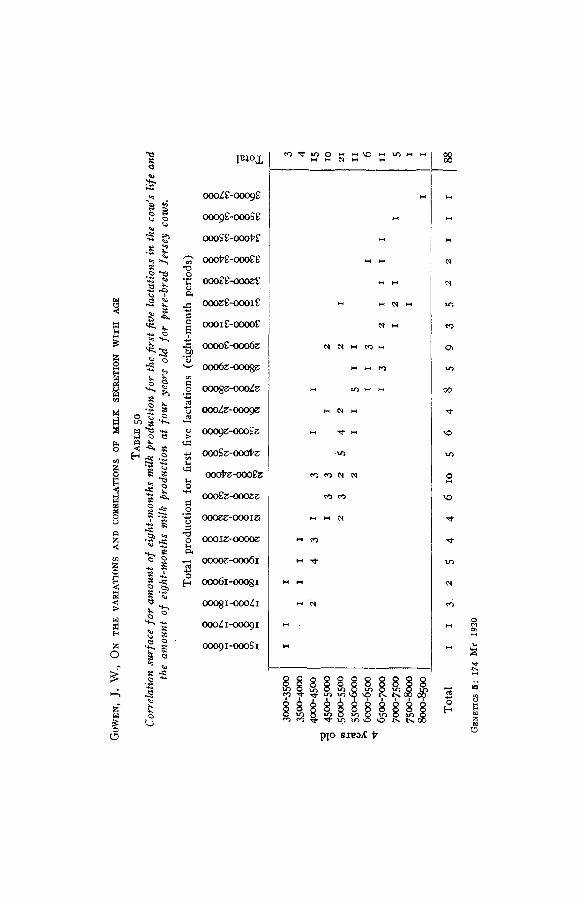
GO
WE
N,
J. W
., O
N T
HE
VA
RIA
TIO
NS
AN
D
CO
RR
EL
AT
ION
S O
F M
ILK
SE
CR
ET
ION
WITH A
GE
TA
BL
E
50
Cor
rela
tion
surf
ace
for a
mou
nt o
f ei
ght-
mon
ths
milk
pro
duct
ion
for
the
firs
t fiv
e la
ctat
ions
in
the
cow
's life
and
the
amou
nt o
f ei
ght-
mon
ths milk
prod
zlct
ion
at f
owr
year
s ol
d fo
r pu
re-b
red
Jers
ey c
ows.
Tot
al p
rodu
ctio
n fo
r fir
st f
ive
lact
atio
ns
(eig
ht-m
onth
per
iods
)
3000
-350
0 35
00-4
000
4000
-45@
3 1
3 45
00-5
000
2 ~~006000
a
5000
-550
0
6000
-650
0 6500-7000
7000
-750
0 7
50
0-
~
8000
-850
0
-I.
I 1
I I
3 1
x1
1
4 2
4
31
3
I I
I5
I3
3
I 2
10
2
32
54
2
2
I 2
1
11
3
I 6
I3
12
11
11
I1
I 5
I I
I I
I1
2
11
51
1 I
21

GW
EN
, J.
W.,
ON
TH
E VARIATION
S A
ND
CORRELATIONS
OF MILK S
EC
RE
TIO
N
WIT
H
AG
E
TA
BL
E
51
Cor
rela
tion
surf
ace
for
aino
unt
of e
ight
-mon
ths
milk
pro
duct
ion
for
thd
;fir
st f
ive
lact
atio
lzs
in t
he c
ow’s
life
and
the
amou
nt o
f ei
ght-
mon
ths
milk
pro
duct
ion
ut f
ive
year
s ol
d fo
r pu
re-b
red
Jers
ey c
ows,
Tot
al p
rodu
ctio
n fo
r fi
rst
five
lact
atio
ns (
eigh
t-m
onth
s pe
riod
)
I I
1
11
22
1
3500-4000
4000-4500
I I
2
13
33
2
I I
I4
22
3
I1
d
45c4
3-5-
I
I1
1
g:E
I I
21
3
I
4 7 5 I3
I5
I1
6500-7000
7000-7500
7500-8000
8000
-850
0
’ I
I2
2
I I
1
2
I1
2
I1
9
I I
1
I I
12

B 6 years old
- W N
O -1 -I I
Total
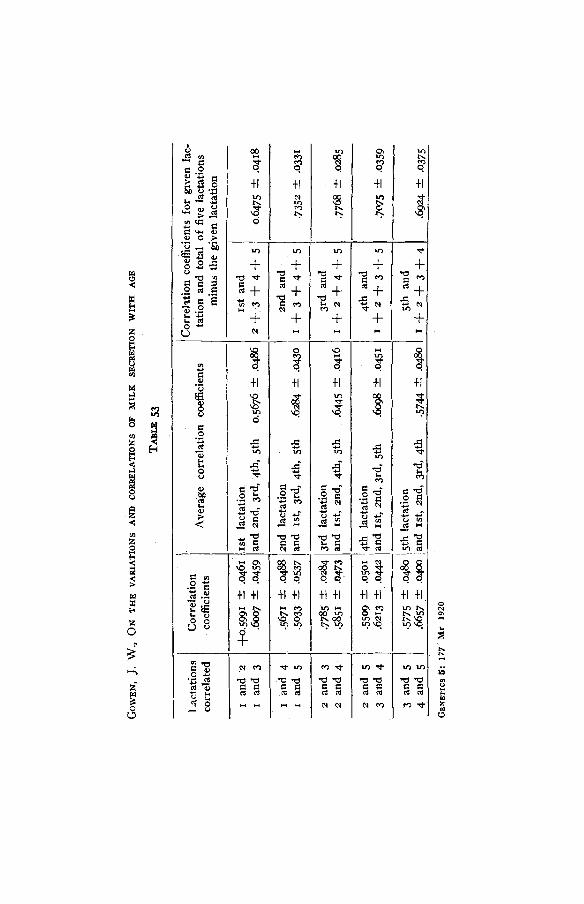
GO
WEN
, J.
W.,
ON
TH
E V
AR
IAT
ION
S AND C
OR
RE
LA
TIO
NS
OF MILK
SEC
RE
TIO
N W
ITH
AG
E
T" 53
Lac
tati
ons
Cor
rela
tion
co
rrel
ated
co
effi
cien
ts
Ave
rage
co
rrel
atio
n co
effi
cien
ts
I I
Cor
reht
ion
coef
fici
ents
for
giv
en l
ac-
tati
on a
nd t
otal
of
five
lac
tati
ons
min
us t
he g
iven
lac
tati
on
1st
and
I 0.
5676
t .
0486
2
+ 3 +
4 + 5 I
4th,
5th
0.
6475
f .0
418
~- 2
and
3 2
an
d 4
-
i ~
.778
5 f ,0
284
3rd
lact
atio
n .5
851 2 .
0473
an
d Is
t, an
d, 4
th,
5th
3rd
and
I +
2 +
4 +
5 .6
445 2
.0416
,776
8 f .0
285
2
and
5 3
and
4
~-
~~
-550
9 t .
0501
4t
h la
ctat
ion
4th
and
.6213 &
.o
w a
nd x
st, z
nd, 3
rd,
5th
.W -C
.0
45I
I + 2
4- 3
+ 5
~0
75
f .o
s59
~
3 an
d 5
I 4
and
5 .5
775 f: .
04&
5t
h la
ctat
ion
.665
7 f ,0
400
and
Ist,
2nd,
3rd
, 4t
h 5t
h an
d I +
2 +
3 + 4
.57
4 r+
.04%
69
24 r
+ .0
375

JOHN W. GOWEN 178
the milk production of two-year-olds with the total production of the next four lactations and compare these correlations with those for the two-year-olds correlated separately with each of the other lactations we will have a measure of the action of environment in affecting milk pro- duction of the cow as against the relatively steady environment over a longer period. The data of table 47 furnish the constants for the neces- sary calculations of the long-time lactation periods. The calculations for the short time involve the calculation of twelve correlations. These data are shown in table 53.
The correlation coefficients of the given lactation with the total of the first five minus the given lactation are in general about 0.1 higher than the mean correlation coefficient as found by averaging the correlations of the separate lactation with the given one. The consistency of the difference rather than the amount leads to the conclusion that this dif- ference while slight is biologically significant. Such being the case the environment may be roughly said to effect a lowering of the corre- lation coefficient which on an average amounts to from one-seventh to one-eighth the correlation coefficient of the average environment under which these cows live.
I t is impossible to get any accurate means of measuring the relative influence of the environmental conditions of the younger years. From the history of the herd, the standard conditions for all the young stock and the similarity of the feeding, etc., it seems doubtful if such environ- mental differences as do exist in the calf period are of as great conse- quence to the subsequent milk production as are such differences in the actual lactation cycle.
These results are in conformity with those of GALTON (1895) for widely different material on the differential action of “nurture and na- ture” in favoring the much greater influence of nature over nurture in the somatic expression of a characte;. The intensity with which a given cow maintains a given plane of milk production throughout life indi- cates a fair degree of precision in the mechanical operation of the in- herited factors which appear in large measure to govern the amount of milk produced.
The comparison of the accuracy with which this control mechanism works with that of similar secretions in other species has a good deal of direct bearing on the subject. The only data available are for the egg of the domestic fowl. This egg, like milk, is composed of a number of substances going to make up the whole. It differs from milk in being recorded in number of eggs produced and not in pounds. The eggs are

CORRELATIONS OF MILK SECRET’ION WITH AGE I79
further produced in clutches, each clutch extending over a short time in the year. These clutches are recurrent and might be considered to paral- lel the successive lactation cycles. Egg production differs from milk production in a further vital particular. The stimulation of the secretion in an egg depends on the passage down the oviduct of an egg yolk or other foreign body. The amount of egg albumen, etc., secreted depends on the number of egg yolks released from the ovary and not on any innate property of albumen secretion as does the secretion of the parts to form milk. Remembering these differences it is still of a good deal of interest to compare the correlation which may exist between suc- cessive periods of egg production and the total number produced in a given period and the correlations for successive periods of milk produc- tion and the production for the first five lactations as derived in table 47.
Correlations obtained by HARRIS and BLAKESLEE (1918) for the suc- cessive monthly egg productions of White Leghorn pullets with their first annual production, range from +0.372&.030 to 0.695+.018 with an average of 0.556. The correlations of the successive yearly produc- tions and the total of the first five lactations shown in table 47 range from S0.7416k.0323 to 0.8613rt.0186. The difference between these correlations is striking. In the proper calculation of this difference it must be remembered that the correlations for egg production is for the twelve-month period where the production for the individual-month cor- relation contributes only one-twelfth to the total annual egg production while that for the milk production contributes about one-fifth to the total production of the five lactations. The correlation would therefore be expected slightly larger for the milk production. This increased size of the milk correlations over the egg correlations is very small relative to the whole difference, as the confirmatory results of table 38 (page 159) show. The correlations for the milk production of the successive lac- tations, therefore, represent in concrete terms that a greater reliance may be placed in the milk records of one lactation as measuring the cow’s capacity than can be placed in the monthly egg records as measuring the hen’s capacity for annual production. Such being the case, if we gener- alize this conclusion in its ultimate terms, the causative mechanism be- hind milk production works with greater fineness and precision than does the mechanism for egg production. Since this mechanism seems in its broadest sense to be of hereditary origin in the two cases, it fol- lows that in the cow this hereditary complex ‘is less influenced in its action by environment than is the action of the material stuffs of the fowl for egg production.
GENETICS 5: Mr 1920

1 8 0 JOHN W. GOWEN
PRACTICAL ASPECT O F THE CORRELATIONS FOR MILK PRODUCTION O F ONE
LACTATION RECORD WITH ANOTHER LACTATION RECORD
The constants deduced in table 47 have a good deal of practical value to the dairyman and to the student of farm management. To illustrate, suppose a herd which has 1000 two-year-olds which have just com- pleted their first lactation, is chosen at random. The manager of this herd will wish to know what animals to save for future lactations and the student of farm management desires to know what may be expected for the total production of the animals to enable him to determine the plane to which the herd should be culled for the greatest profit to the owner. The equations derived from table 4 on page IZO allow the determination of the distribution of the cows as to their eight-months yield of milk if the one thousand two-year-old cows are drawn at ran- dom from a population similar to that of the Jerseys of these data. The equation for this curve may be repeated for sake of convenience of those who desire to check the results.
From the actual eight-months milk production of table 47 the equa- tion to determine the sum of the expected lactation yields of the first five lactations is given by
YT =7671-9 -k 4-3139Yz
where YT is the total expected yield of the five lactations and yz is the
actual yield of the two-year-old cow. Perhaps one of the easiest ways to table the necessary information for
its readiest uses is to have the summation of both the number of COWS
and their expected total production. This summation to be from both ends of the range of milk produced, The data for such a comparison are given in table 54.
If all the cows in this herd are kept to their sixth lactation the average production for each cow for the five lactations would be 25,070 pounds of milk. Noting the summed number of cows in column four if the 217 poorest producers are culled from the herd the cows left in the herd will produce on an average 26,408 pounds or on an average 5,389 pounds more milk than the cdlled cows. Again if the dairyman decides to cull out 543 of the thousand animals the production of the 457 re- maining will be 28,192 pounds or 5,747 pounds more than the culled cows on the average for the summed productions for the five lactations.
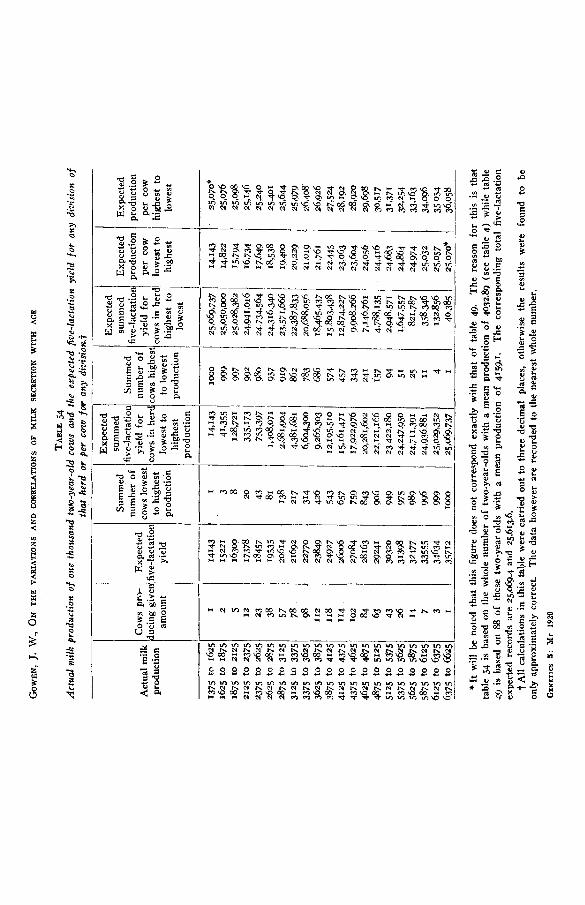
GO
WEN
, J. W
., O
N THE V
AR
IATI
ON
S AND C
OR
RE
WT
ION
S OF MILK S
ECPE
TIO
N
WIT
H
AC
E
1375
to 1
625
r625
to
I875
18
75 t
o 21
25
2125
to
2375
23
75 t
o 26
25
2625
to
2875
337s
to
362
5 36
25 t
o 38
75
2875
to
3125
31
25 t
o 33
75
3875
to
412
51
4125
to
4375
43
75 t
o 46
2.5
4875
to
5125
51
25 t
o 53
75
4625
to
4875
5375
to
5625
56
25 t
o 58
75
5875
to
6125
TABLE 54
Ac
tual
nki
lk p
rodu
ctio
n of
one
thou
sand
tm
-yea
r-ol
d co
ws a
nd t
he e
xpec
ted f
ive-
lact
atio
n yie
ld f
or a
ny d
ivisi
on o
f th
at h
erd
or p
er c
ow fw an
y di
visio
n.$
6125
to
6375
63
75 t
o 6
625
prod
uctio
n
I I 2 5 23
38
57
78
98
I2
I I2
I 18
114
I02 84
63
43
26
14 7 3
Expe
cted
iv
e-la
ctat
io
yiel
d
1414
3 15
221
1630
3 17
378
1845
7 I9535
2061
4 21
692
2277
0 23
849
2492
7 26006
2708
4 28
163
2924
1 30
320
313@
32
177
3355
5
3S712
3463
4
~
Sum
med
nu
mbe
r 01
:o
ws l
owes
to
hig
hest
prod
uctio
n
I 3 8 43
81
217
314
426
543
657
759
843
906
949
97s
989
996
999 20
138
Io0
0
Expe
cted
su
mm
ed
we-
lact
atio
yi
eld
for
ows i
n he
r!
low
est t
o hi
ghes
t pr
oduc
tion
14,1
43
41.35
5 12
8,721
33
5,173
75
3,397
1 ,&
07I
2.@31
,901
4,381
,681
6,604
,300
9,265
.303
12,195.5ro
15,16
1,471
17
,922
,976
20
,281,6
02
22,12
1,166
23
422.1
80
24,24
7,950
24
,7 I 1
.391
25@
3%35
2 25
,069.7
37
24,93
6 881
Sum
med
nu
mbe
r of
ow
s hi
ghes
to
low
est
prod
uctio
n
loo0
99y
997
992
980
957
919
862
783
686
571
4.57
3 13
241
IS7 94
51
25 4 I1 I
Expe
cted
su
mm
ed
ive-
lact
atic
yi
eld
for
'ows
in h
e1
high
est
tc lo
wes
t
25 06
9773
; 25
,054
00(
25,028,38:
24.941.01C
24,73
4,564
24
.316
.34~
23
,5/'1
,66f
22
.387.8
33
ao,6
88,0
56
18,46
5.437
IS .80
.?.43
8 12
,874
,227
9.9
08.&
7,1
46.76
1 4.7
f%I3
5 2.9
4948
.571
1,647
.557
821.7
87
358.3
46
132.8
56
40.38
5 _
__
_
Expe
cted
pr
oduc
tion
per
cow
lo
wes
t to
hi
ghes
t
14,1
43
14,82
2 15
,794
16,73
4 17
649
18,53
8 19
.400
20.23
21,01
9 21
.761
22.44
5 23
,063
23,60
4 24
056
24.41
6 24
.683
24.86
4 24
.9i4
25
,032
25,05
7 25
.070*
_
__
Expe
cted
pr
oduc
tion
per
cow
hi
ghes
t to
lo
wes
t
25P7
0*
25,07
6 25
093
25,14
6 25
.240
25,40
1 25
,644
25,97
9 =6
,408
6,92
6 27
,524
28,1
92
28,92
0 29,698
3057
31
,371
32
.254
33.16
3 34
.096
36,05
8 35
054
*It w
ill b
e no
tcd
that
thi
s fig
ure
does
not
cor
resp
ond
exac
tly w
ith t
hat
of
tabl
e 49
. T
he r
easo
n fo
r th
is i
s th
at
tabl
e 9 is
bas
ed o
n th
e w
hole
num
ber
of t
wo-
year
-old
s w
ith a
mea
n pr
oduc
tion
of 4
032.8
9 (s
ee t
able
4)
whi
ie ta
ble
49 i
s ba
sed
on 88
of t
hese
tw
o-ye
ar o
lds
with
a m
ean
prod
uctio
n of
415
9.1.
The
cor
resp
ondi
ng t
otal
fiv
e-la
ctat
ion
expe
cted
rec
ords
are
25,
069.
4 an
d 25
.613.6
. $A
ll c
alcu
latio
ns i
n th
is ta
ble
wer
e ca
rried
out
to th
ree
deci
mal
pla
ces,
othe
rwise
the
res
ults
wer
e fo
und
to b
e on
ly a
ppro
xim
atel
y co
rrec
t. T
he d
ata
how
ever
are
reco
rded
to
the
near
est
who
le n
umbe
r. GENETICS
5: Mr
1920

CORBtELATIONS OF MILK SECRETION WITH AGE I81
_ _ 2 years and total
4 years and total 5 years and total 6 years and total
3 years and total
As the records dealt with in this paper are all for the first eight months of lactation it follows that most cows will extend beyond this limit and produce more milk. In using this table to determine what cows may be kept profitably, this fact should be kept in mind. If the dairyman has determined the complete cost of producing his milk a knowledge of the price he receives for it will allow him to determine at once from column three what cows he should keep in the herd.
-0.2897 2 .0659 4.39
- .0667 & .0716 .93 - .0240 k .071g .33 4- .&7 -C ,0719 .I2
+ .1905 2 .0693 2.75
THE RELATIVE CONTRIBUTION OF ONE YEAR’S MILK PRODUCTION TO THE
A little thought on the subject will convince one that even though there is a substantial correlation between the lactation records of the in: dividual lactation and the total production over several lactations it by no means follows that the individual cows necessarily contribute the same relative amounts of milk to the individual lactations and to the total of the five-lactation groups. The problem may be quantitatively analyzed by the determination of the correlation between the total of the five lac- tations of the individual cows and the deviation of the pounds of milk produced by them in the single lactations from their probable value. The calculations of this correlation may be most easily made by the method of HARRIS (1909, 1918). The formula for the correlations is given by the equation
TOTAL PRODUCTION OVER THE FIRST FIVE LACTATIONS
? - X / W Z J Y
1/ I- YX.2+( ?-ky-vz/vu)~ rzz =
where the y’s represent the individual lactation records and the X’S the totals for the five lactations. The five constants for these are tabled in table 55.
T- ss Correlation between the total milk prodzcttion of the five-lactation records and the
deviation of the individual records f r o m their probable values.
Correlation + probable error I ! Age when corre-
lation records were made
GENETICS 5 : Mr 1920

I 82 JOHN W. GOWEN
These correlations of table 55 change their sign three times, two of them being plus and three minus; their magnitudes range between +o. 1905k .0693 and -0.2897f.0659. As adjudged by their probable errors only two of the correlations can be considered significant. Taken at their face value these coefficients would seem to indicate that the high- est producers at two years contribute relatively less to the total produc- tion over several lactations than was their expected share and that these same high producers contribute relatively more in their second lactation to this total than was to be expected of them. I n the other lactations each individual of a given grade contributed approximately its propor- tionate expected share to the total production. These relations of the deviations from their probable yields of the first and second lactations are hard to account for in terms of the known physiology of the mam- mary gland. The parallel already indicated of the logarithmic nature of growth and milk production with age seems to point to a possible causal relation between growth of the mammary gland and the quan- tity of its secretion. Should this prove true the problem of this differ- ential relative contribution of the high producers at two years old and at three becomes a problem of the relative duration of growth of the mammary gland in the high, medium and low producers and not a cyclic action of different sets of factors for milk production itself. This means that the factors which govern milk production have their regu- lating power maintained in the same relative strength throughout the life of the cow with the exclusion of any group of factors acting within this life time for any short period.
SUMMARY
The purpose of this paper is to present quantitative data, along with the biometrical analysis of the same, on the normal variations and cor- relations of milk production during the cow’s life. The necessity of such data and analyses is well recognized now, in physiological and genetic investigations of a quantitative subject. The economic value of milk gives this investigation a significant relation to improvement in yield and in the selection of cows to remain within the herd. The materials used for this study are peculiarly suited to the ends in view. They are a strictly homogeneous group of milk records of normal pure-bred Jersey cows maintained under the conditions of a large farm, managed by a well-trained man thoroughly versed in his business. While the conclu- sions derived from this study are stated in general form, it is not pre- sumed that the conclusions have more generality than the data on which
183
they are based. I t is altogether probable however that the conclusions drawn do apply to most of the other dairy breeds of cattle.
The conclusions of most moment may be summarily stated as in the following paragraphs. Unless otherwise stated, the conclusions apply to the pure-bred Jersey herd the data for which are given in this paper.
The frequency polygons for milk production are only slightly un- symmetrical. The range of variation is large, one cow producing less than 1500 pounds in her eight-months lactation period, another cow producing more than 10,000 pounds for her eight-months lactation period. The height of the modal ordinate for the frequency polygons is greatest in the earlier and later years of the cow’s life. Only one mode is evident in any of the histograms. From this it appears likely that these curves are unimodal curves. Too much stress should not be laid on this however since certain of the distributions appear quite flat-topped.
The analytical constants show that the eight-months-milk-production curves are of the PEARSON types I, I1 and IV. The skewness of these curves is all in the positive direction and rather small in amount. This small size of the skewness is of considerable interest to those investigators who deal with advanced-registry data since it would indicate that these data can with but small error be fitted by normal curves to determine certain of their needed constants.
The correlation coefficient between age at the commencement of test and milk production in comparison with the correlation ratio for the same variables shows that the regression of milk production on age is far from linear. This regression curve when analyzed turns out to be a logarithmic function. Attention is called to the fact that this same kind of logarithmic function also describes the relation of growth to age. This paralleling of the two functions may indicate that a causal relation exists between them such that increased milk production chiefly depends on increase in size of the mammary gland caused by growth.
The standard deviations of milk production progressing from the heifer to the aged cow are described by a cubic parabola. This regular change of the standard deviation of milk production groups shows that the curve formed by them falls into the heteroscedastic, nomic class as defined by PEARSON.
Correlation tables for milk production of the different age groups are presented.
The means derived from these tables remain, within the limits of ran- dom sampling, the same for any given age at test irrespective of the age at which the same cows were subsequently tested.
CORRELATIONS OF MILK SECRETION WITH AGE
GENETICS 5 : Mr 1920
JOHN W. GOWEN
The standard deviations for the various age groups also remain at the same value within the limits of sampling irrespective of the age at whish a subsequent test may be made.
As would be expected from their derivation and as actually checks out to be the case the coefficients of variation do not change within the age group for the cows which are retained in the herd for longer or shorter periods. These facts show that the cows which were kept in the herd as two-year-olds were all equally likely to be kept in the herd until they became aged cows as far as the milk production of these two-year-olds was concerned. Generalizing this statement cows which were kept in the herd at any given age were all equally likely to be kept in the herd at any other age as far as the milk record of any of those cows at the given age was concerned. This point removes any possible objection to the accuracy of the correlations for the milk productions at the various ages at least so far as concerns the cows remaining in the herd on the basis of their milk production being high.
The correlation coefficients for the milk production of one lactation with that of another lactation at another age range from +0.2144 2.0919 to +o.7306a .0284. The signs of these correlation coefficients are all plus. The numerical values are large enough to be significant. Each set of correlation coefficients for the milk production at a given age with the milk productions at other ages in the cow’s life deviate only slightly from a line which is approximately linear, taking a nearly con- stant value for each age. The mean value for these correlation coeffi- cients of milk production of one lactation at any age with the milk production of another lactation at another age is +0.5352.
This mean value of the coefficient of correlation seems to be generally applicable to milk producti0.n for on somewhat similar data GAVIN finds results which are comparable to these.
These correlation coefficients are high for this kind of data as may be seen from the fact that correlation coefficients of similar nature for egg production range lower and have a lower mean +0.4458 than do these correlation coefficients for milk production.
The magnitude of these correlation coefficients in comparison to those on egg production put in terms of the physiology of the two sets of glands, mammary and ovary, means that the mammary gland works with more mechanical precision than does the ovary.
The linearity of all the regressions is established by the calculation of the correlation ratios and their comparison with the corresponding cor- relation coefficients.
185
From the means, standard deviations and correlation coefficients are formed the straight-line equations for the prediction of the amount of milk production of any given lactation at any age from these known variables at another age. Ex- amination of these equations seems to show that most stress is laid on the milk production at two years old by the coefficients, indicating that the milk production at this age represents more accurately than any other the future possibilities of the cow. Similar analysis reveals the fact that correction of the milk records to about the age of maximum productivity of the cow gives the nearest approach to the correct milk production for that cow.
The correlation coefficients of milk production at a given age with the total milk production of two lactations are presented in table 46. These correlations prove to be very high, ranging from +.7324f.o286 to +0.94384.0116. Such high values make it appear that the milk production of one lactation is the determining factor for total milk pro- duction of two lactations when the given lactation is one of the compo- nents.
This conclusion is confirmed by a study of a smaller series of data where the first five lactation records are known, the first commencing at two years old and the other four commencing approximately a year apart. These correlation coefficients for milk production of a lactation at a given age with the total milk production over the five lactations range from +0.7416+.0323 to +0.8613+.0186. Each regression is linear as is shown by a comparison of the correlation coefficients and correlation ratios.
A means of measuring the effect of environmental changes on the coefficient of correlation of the milk production of a lactation at a given age with the milk production of a lactation at another age is given. This measure depends on the difference in the correlation coefficients of the milk production of a given age correlated with the milk productions of several successive lactations and the correlation of the milk production of the given lactation and the total milk production of the other lacta- tions. In the first case the environmental changes of the different lac- tations as they affect milk production make themselves felt in the cor- relation coefficients ; in the second case the use of the total milk produc- tion gives a mean of these environmental effects. The outcome of this study shows the environmental changes reduce the correlation one-ninth to one-eighth of what it would be under the conditions of an average environment. This result makes it clear that for these Jerseys heredity
CORRELATIONS OF MILK SECRETION WITH AGE
These equations are given in table 43.
GENETICS 5 : Mr 1920

I 86 JOHK W. COWEN
plays a greater part in their milk. production from lactation to lactation than environment.
The correlation coefficients for the milk production of one lactation with that over several lactations, furnishing as it does the basis for the regression formula by which milk production over long periods may be predicted from shorter ones, is of the greatest practical importance in culling the herd of the mediocre animals. The use of these coefficients is illustrated in table 54.
The relative contribution of the different lactations to the total milk production over a long period shows that in the first lactation the high- producing cows do not produce quite as much relatively as they would be expected to produce. In the second lactation these same high-produc- ing cows produce relatively more than they would be expected to produce. Thereafter the contribution of any class is at random. The significance of the relative contribution of the first two years is only slight. In view of these facts the conclusion may be drawn, that the factors which gov- ern milk production have their regulatory power maintained in the same relative strength throughout the life of the cow to the exclusion of any group of factors acting within this life for any short period.
LITERATURE CITED
BOAS, F., 1897 The growth of Toronto children. Rept. Commissioner of Education
BOAS, F., and WISSLER, C., 1 9 5 Statistics of growth. U. S. Bur. of Education,
CURTIS, M. R., 1914 A biometrical study of egg production in the domestic fowl. IV. Factors influencing the size, shape, and physical constitution. Arch. f. Ent- wicklungsmech. d. Organ. 39 : 217-327.
DONALDSON, H. H., 1go8 A comparison of the albino rat with man in respect to the growth of the brain and of the spinal cord. Jour. Compar. Neurol. and
1909 On the relation of the body length to the body weight and to the weight of the brain and of the spinal cord in the albino rat (Mus norvegicus var. albus). Jour. Compar. Neurol. and Psych. 19 : 155-167.
1910 On the percentage of water in the brain and in the spinal cord of the albino rat. Jour. Compar. Neurol. and Psych. 20: 119-144.
1911 A comparison of the Norway rat with the albino rat in respect to body length, brain weight, spinal-cord weight, and the percentage of water in both the brain and the spinal cord. Jour. Compar. Neurol. and Psych.
ECKLES, C. H., 1912 Influence of fatness of cow at parturition on percent of fat in
ELDERTON, W. PALIN, 191 Tables for testing the goodness of fit of theory to obser-
GALTON, FRANCIS, 1885, Natural inheritance. 259 pp. London: Macmillan and Co.
2 : 1541-1599.
2: 25-132.
Psych. 18 : 345-389.
21 : 417-458.
milk. Missouri Agric. Exp. Sta. Bull. 100. pp. 183-202.
vation. Biometrika 1 : 155-164.

187 COKRELATIONS OF MILK SECRETION W I T H AGE
GALTON, FRANCIS, 1895 English men of science : their natnre and nurturc. s i i i+~o6 pp.
GAVIN, WILLIAM, 1912 An interpretation of milk records. Jour. Roy. Soc. England.
GAVIN, WILLIAM, 1913 Studies in milk records on the accuracy of estimating a cow’s milking capability by her first lactation yield. Jour. Agric. Sci. 5 : 377-391.
GOWEN, JOHN W., 1919 Variations and mode of secretion of milk solids. Jour. Agric. Res. 16 : 79-102.
HARRIS, J. ARTHUR, 1909 The correlation between a variable and the deviation of a dependent variable from its probable value.
1917 The correlation between a component, and between the sum of two or more components, and the sum of the remaining components of a variable. Quar. Publ. Amer. Stat. Doc. Dec. 15 : 854-859.
1918 Further illustrations of the applicability of a coefficient measuring the cor- relation between a variable and the deviation of a dependent variable from its probable value.
The correlation between egg produc- tion during various periods of the year in the domestic fowl. Genetics 2 :
HATAI, SHINKISHI, 1911 An interpretation of growth curves from a dynamical stand- point. Anat. Rec. 5 : 373-382.
JACKSON, C. M., I913 Postnatal growth and variability of the body and of the var- ious organs in the albino rat. Amer. Jour. Anat. 15: 1-69.
LEWENZ, M. A., and PEARSON, KARL, 1904 On the measurement of internal capacity from cranial circumference.
MINER, JOHN RICE, 1915 Fitting logarithmic curves by the method of moments. Jour. Agric. Res. 3 : 411-423.
On the ifitting of logarithmic curves by the method of moments, with an introductory statement on the use of logarithmic curves in biological and agricultural investigations by Raymond Pearl. Jour. Agric. Res. 3 : 411-423.
MINER, JOHN RICE, 1917 Proc. Nat. Acad. Sci.
MINOT, C. S., 1891 Senescence and rejuvenation. First paper; on the weight of guinea-pigs. Jour. Physiol. 12 : 97-153.
I907 The problem of age, growth and death. 111. The rate of growth. Pop. Sci. Monthly 71 : 193-216.
PEARL, RAYMOND, 1 9 9 A biometrical study of egg production in the domestic fowl. I. Variation in annual egg production. U. S. Dept. Agric., Bur. Animal Ind.
1909 A biometrical study of egg production in the domestic fowl. 11. The fre-
1914 On the law relating milk flow to age in dairy cattle. Proc. Soc. Exper.
1914 Biometrics.-An important contribution to statistical theory. -\mer. Nat.
1915 Report of progress on animal husbandry investigations in 1915. Maine Agric. Exp. Sta. Misc. Publ. 519.
PEARL, RAYMOND, with the assistance of PEPPER, OLIVE M., 1907 Variation and dif- ferentiation in Ceratophyllum. Carnegie Inst. Washington, Publ. 58. 136 pp.
PEARL, RAYMOND, and SURFACE, FRANK M., 1915 Growth and variation in maize. Zeitschr. ind. Abstamm. U. Vererb. 14: 97-203.
New York: D. Appleton and Company.
73 : 153-175.
Biometrika 6 : 436-443.
Genetics 3: 328-353. HARRIS, J. ARTHUR, and BLAKESLEE, A. F., 1917
27-73.
Biometrika 3 : 266-297.
1915
A note on the fitting of parabolas. 3 : 91-95.
Bull. 110. pp. 1-80.
quency constants of a variable z = f (x lx2 ) .
Biol. and Med. 12: 18-19.
Biometrika 6 : 437-438.
48 : 505-507.
pp. 1-27,
GENETICS 5: Mr 1920

I 88 JOHN W. GOWEIC’
PEARSON, K., 1go0 On the criterion that a given system of deviations from the prob- able in the case of a correlated system of variables is such that it can be reasonably supposed to have arisen from random sampling. Phil. Mag.
1905 Mathematical contributions to the theory of evolution. XIV. On the gen- eral theory of skew correlation and non-linear regression. Draper’s Com- pany Res. Mem., Biometric Series 2. 54 pp. London: Dulau 13 Co.
1914 Tables for statisticians and biometricians. Ixxxiii+143 pp. Cambridge, England : Cambridge University Press.
RHIND, A. J., 1909 Tables to facilitate the computation of tqe probable errors of the chief constants of skew frequency distributions. Biometrika 7 : 127-147 and 386-397.
RIETZ, H. L., 1909 On inheritance in the production of butter fat. Biometrika 7 : 106-126.
SLUTSKY, E., IQ14 On the criterion of goodness of fit of the regression lines and on the best method of fitting them to the data. Jour. Roy. Statist. Soc. 77 : 78-84.
THE AMERICAN JERSEY CATTLE CLUB, 1906-1916 Registry of merit, Vols. I to 5. 502,
VIGOR, H. D., 1913 The correlation between the percentage of milk fat and the quan- tity of milk produced by Ayrshire cows. Supplem. Jour. Board of Agric. 1-28.
WING, HENRY H., and FOORD, JAMES A., 1904 Record of an attempt to increase the fat in milk by means of liberal feeding. Cornel1 University Bull. 222. pp.
Official tests of dairy cows. Ann. Rept. Wisconsin Agric. Exp.
5 0 : 157-175.
578, 544, 624 PP.
21-39. WOLL. F. W., 1g0z
Sta. 19:107-127.