jphysiol01270-0127.pdf - NCBI
20
J. Phy8iol. (1961), 155, pp. 543-562 543 With 10 tezt-ftgurem Printed in Great Britain PRESYNAPTIC INHIBITION AT THE CRAYFISH NEUROMUSCULAR JUNCTION BY J. DUDEL* AND S. W. KUFFLER From the Neurophysiology Laboratory, Department of Pharmacology, Harvard Medical School, Boston 15, Mamsachu8ett8, U.S.A. (Received 24 October 1960) There are three possible ways in which synaptic inhibition may reduce excitation. (1) Inhibition may reduce the amount of excitatory trans- mitter that is released from nerve terminals when they are activated by a nerve impulse; this is presynaptic inhibition. (2) The reaction of the post- synaptic receptors to a constant amount of released transmitter may be reduced, for instance by competition. (3) The post-synaptic membrane may be altered in such a way that the depolarizing action of the excitatory transmitter is opposed. There exists good evidence for the last alternative only, namely, that the membrane conductance of the post-synaptic region is increased, with the membrane potential staying near the resting potential. This inhibitory mechanism of a specific post-synaptic permeability increase (to K+ and/or Cl-) seems to be widespread in different species and has been demonstrated in the vertebrate heart, the mammalian central nervous system, in crusta- cea at neuromuscular junctions and nerve cell synapses, as well as in various other preparations (Fatt & Katz, 1953; Coombs, Eccles & Fatt, 1955; Kuffler & Eyzaguirre, 1955; Trautwein & Dudel, 1958; for a recent review see Kuffler, 1960). In this study on the crayfish neuromuscular junction we present evi- dence for a presynaptic mechanism. The inhibitory nerve impulse acts on the excitatory nerve terminals and decreases the probability of release of quanta of excitatory transmitter. A prelimiInary report has appeared (Dudel & Kuffler, 1960). METHODS As previously described, the abductor muscle of the dactylopodite in the crayfish was used (Dudel & Kuffler, 1961a). For altering the muscle membrane potential the current- pasing electrode was filled with saturated potassium citrate solution (Boistel & Fatt, 1958). These electrodes were preferable because they carried more readily maintained currents of up to 10-'A. * Present address: Physiologisches Institut, Akademiestr. 3, Heidelberg, Germany.
-
Upload
khangminh22 -
Category
Documents
-
view
0 -
download
0
Transcript of jphysiol01270-0127.pdf - NCBI
J. Phy8iol. (1961), 155, pp. 543-562 543With 10 tezt-ftguremPrinted in Great Britain
PRESYNAPTIC INHIBITION AT THE CRAYFISHNEUROMUSCULAR JUNCTION
BY J. DUDEL* AND S. W. KUFFLERFrom the Neurophysiology Laboratory, Department of Pharmacology,
Harvard Medical School, Boston 15, Mamsachu8ett8, U.S.A.
(Received 24 October 1960)
There are three possible ways in which synaptic inhibition may reduceexcitation. (1) Inhibition may reduce the amount of excitatory trans-mitter that is released from nerve terminals when they are activated by anerve impulse; this is presynaptic inhibition. (2) The reaction of the post-synaptic receptors to a constant amount of released transmitter may bereduced, for instance by competition. (3) The post-synaptic membranemay be altered in such a way that the depolarizing action of the excitatorytransmitter is opposed.
There exists good evidence for the last alternative only, namely, thatthe membrane conductance of the post-synaptic region is increased, withthe membrane potential staying near the resting potential. This inhibitorymechanism of a specific post-synaptic permeability increase (to K+ and/orCl-) seems to be widespread in different species and has been demonstratedin the vertebrate heart, the mammalian central nervous system, in crusta-cea at neuromuscular junctions and nerve cell synapses, as well as invarious other preparations (Fatt & Katz, 1953; Coombs, Eccles & Fatt,1955; Kuffler & Eyzaguirre, 1955; Trautwein & Dudel, 1958; for a recentreview see Kuffler, 1960).In this study on the crayfish neuromuscular junction we present evi-
dence for a presynaptic mechanism. The inhibitory nerve impulse acts onthe excitatory nerve terminals and decreases the probability of release ofquanta of excitatory transmitter. A prelimiInary report has appeared(Dudel & Kuffler, 1960).
METHODS
As previously described, the abductor muscle of the dactylopodite in the crayfish wasused (Dudel & Kuffler, 1961a). For altering the muscle membrane potential the current-pasing electrode was filled with saturated potassium citrate solution (Boistel & Fatt, 1958).These electrodes were preferable because they carried more readily maintained currents ofup to 10-'A.
* Present address: Physiologisches Institut, Akademiestr. 3, Heidelberg, Germany.

J. DUDEL AND S. W. KUFFLER
RESULTS
Conductance increase during inhibitionSome features of the conductance-increase mechanism, first demon-
strated by Fatt & Katz (1953), are presented here largely to make clear thedistinction from presynaptic inhibition. Inhibitory stimulation reducesthe potential change that is produced when a current is applied across thejunctional membrane, i.e. the resistance of the membrane has decreased
Fig. 1. Conductance increase during depolarizing inhibitory junctional potentialin abductor of the dactyl. One recording and one current-passing electrode insertedinto a muscle fibre. Current pulses of 1-5 x 10-gA monitored in upper sweep werepassed across the membrane at rest (lower sweep) and during inhibitory potential.Stimnulation frequency of inhibitory. nerve was 150/sec. Note reduction of theelectrotonic potential from 7 to 2 mV by inhibition.
during inhibition. This is seen in Fig. 1, where two sweeps are super-imposed. The lower record gives the electrotonic potential in the restingstate of the membrane caused by the current pulse (upper trace). In themiddle trace the inhibitory axon was stimulated by a short train ofinhibitory impulses at 150/sec and a small depolarization of the fibre re-sulted. The same current pulse, if applied during the plateau of inhibitoryjunctional potentials (i.j .p.s), set up a much reduced electrotonic potentialwith a more rapid time course. The calculated membrane conductanceduring inhibition, as measured by this method, was frequently increasedten times above the resting value.The most characteristic feature of the conductance type mechanism is
the reversal of the i.j .p. near the resting potential. The method of deter-miningy the reversal potential was used routinely in the present studies.
544

PRESYNAPTIC INHIBITION
An example is shown in Fig. 2. The membrane was depolarized by passingcurrent through a second intracellular micro-electrode. Starting with aresting potential of 80 mV the i.j.p.s became negligibly small at 72 mVand reversed their direction with additional depolarization. Arrows markthe reversal potential.The reversal potential obtained in Fig. 2 may not indicate exactly the
true inhibitory equilibrium potential, being slightly too positive, becausethe current electrode does not depolarize the whole fibre uniformly (seeBurke & Ginsborg, 1956, for discussion of an analogous problem). Here,however, this introduces only a small error. The reversal or equilibrium
Fig. 2. Trains of inhibitory junctional potentials (150/see for 0-2 see) repeatedevery 2 sec. Resting potential at start 80 mV shifted to 61 mV by pa.ssing currentthrough a second intracellular micro-electrode. Arrows mark the reversal potentialof inhibitory pdtentials at 72 mV.
potential for i.j .p.s was also determined by depolarizing the fibre uni-formly by excess K+, instead of by current, and no significant differencefrom the result of Fig. 2 (arrows) was noted.
An additional mechanism fOr inhibitionIn their original work Fatt & Katz (1953) thought that the reduction of
excitatory junctional potentials (e.j.p.s) was too great to be brought aboutby a conductance increase alone, and they suspected an additional mecha-nism (cf. Kuffler & Katz, 1946). Experimental conditions have now beenfound in which the post-synaptic conductance increase mechanism cannotaccount for any of the observed reduction of the e.j.p. In Fig. 3 singleexcitatory stimuli set up excitatory junctional potentials of 2 mV (Fig. 3A)Single inhibitory stimuli caused a small depolarization of about 0*2 mV(Fig. 30C). The inhibitory equilibrium level, however, as found by themethod shown in Fig. 2, and further determined by K depolarization(above), was at the dotted line 6 mV more positive than the restingpotential. In this situation in which the excitatory junctional potentialdoes not reach the inhibitory reversal level, the inhibitory conductance
35 PilysIO. CLv
545

J. DUDEL AND S. W. KUFFLER
mechanism cannot reduce the e.j.p. If the i.j.p. is timed to fall on thepeak of the e.j.p., it should still depolarize, since the i.j.p. is still 'below'(more negative than) its reversal potential. In fact, it should add to thee.j.p. This seemed to be the case in Fig. 3B, where the combined potential,if changed at all, was somewhat bigger. To our surprise, however, if thei.j.p. was timed to precede the e.j.p. by 3 msec, the e.j.p. was greatlyreduced (Fig. 3D). This cannot be explained by a mechanism of inhibitoryconductance increase, which can shift the membrane potential only towardthe inhibitory reversal level. Therefore, an additional mechanism had tobe postulated. Still further evidence for an additional mechanism will bepresented below with the results on extracellular recording (Figs. 6-8).
Fig. 3. Intracellular records from abductor muscle fibre. Resting potential 86 mV,inhibitory reversal level (rev, pot.) 6 mV more positive (interrupted line), K+ insolution reduced to 2-7 mm.. A: single excitatory junctional potential (e.j.p.) of2 mV. C: single inhibitory junctional potential (i.j.p.) depolarizing 0-2 mV.B: inhibitory axon stimulated 1.5 msec after excitatory axon; i.j.p. coincides withpeak of e.j.p. D: inhibitory axon stimulated 3 m-sec before excitatory axon; i.j.p.seen before e.j.p. which is greatly reduced.
A close examination of Fig. 3D reveals that the rising phase of the smalli.j.p. was over when the e.j.p. started. The maximumof the ihbitoryconductance increase occurs during the rise of the i.j.p., and the residualconductance increase during the falling phase of the i.j.p. must have beenrelatively small at a time when the reduction of the subsequent e.j.p. wasseen to be maximal.To obtain the above type of reduction of e.j.p.s the M.timin of inhibitory
-stimuli in relation to the excitatory ones was quite critical. If the inhibi-tory stimulus preceded the excitatory one by 1-3 msec the effect wa-s
546

PRESYNAPTIC INHIBITION 547
maximal and then declined over a further 3-5 msec. The importance oftiming of the excitatory-inhibitory stimuli for reducing excitatory poten-tials, as is shown in Fig. 4, has been known for a long time and similarcurves were obtained by Marmont & Wiersma (1938), Kuffler & Katz(1946) and Fatt & Katz (1953). The significance of the timing effect forour experiments is that it revealed a type of inhibition that could not beaccounted for by the conductance-increase mechanism.
mV
3~~~ ~~ *0 0_ 0_
+2. 0b 0ix 03 0+ 2-5 3<
cio Control
0 0o
0
2-0 -20 - _
E
CL 1.5 .|
i.j.p. follows e.j.p. i.j.p. precedes e.j.p.
-10 -5 0 5 10
Interval between excitatory and inhibitory stimuli (msec)
Fig. 4. Experiment as in Fig. 3. The inhibitory equilibrium potential was 6 mVmore positive than resting potential. Control gives size of e.j.p. without anyinhibitory stimulation.
Another way of showing the influence of timing of impulses is ilustratedin Fig. 5. Inhibitory and excitatory nerves were stimulated at rates of100/sec for 120 msec. In Fig. 5B each inhibitory nerve stimulus wasdelivered 2-5 msec before the excitatory one, while in Fig. 5A it was given8-0 msec before each excitatory stimulus. The e.j.p.s were much morereduced in Fig. 5B, where the timling was maximally effective.
Effect of inhibition on extracellularly recorded e.j.p.sThe existence of a second type of inhibition in addition to the post-
synaptic conductance-increase mechanism can also be shown by recordingextracellularly from individual junctional areas with micro-electrodes.This recording method has the advantage that the quantum content of thesynaptic potentials can be determined statistically (Dudel & Kuffler,
35-2

J. DUDEL AND S. W. KUFFLER
1961 a, b), and more specific results on the nature of the second type ofinhibition can be obtained.
In the lower sweep of Fig. 6A are shown extracellular records from asingle junctional area. The e.j.p.s are negative, in contrast to the intra-cellular junctional potentials which are recorded simultaneously (uppersweep). The latter are made up of activity in the entire muscle fibre. Ifproperly timed inhibitory impulses were added in Fig. 6B, the intracellulare.j.p. heights were reduced, as one would expect. The significant change in
Fig. 5. Minimally and maxmlyeffective timiing for inhibition. Intracellularrecording, resting potential near 75 mV. A: upper sweep, excitatory stimuli at100/sec for 120 msec; lower sweep, inhibitory stimuli 'recede excitatory stimnuli by8 msec. B: same excitatory and inhibitory trains as in A, but in lower sweep theinhibitory stimulus precedes each excitatory one by 2.5 msec, resultinginmaximallyeffective reduction of the e.j.p.s.
the extracellular records from the single junction was the increased numberof failures (arrows), i.e. the excitatory impulse failed to release packets oftransmitter. At the same time, the mean amplitude of the 'hits' wasreduced in size (see below, Table 1).
In Fig. 7 more detail is included in a fast sweep. Three consecutivesweeps were superimposed, repeated at a rate of 5/sec. Fig. 7A showsexcitation alone, with the stimulus artifacts in the lower record followedby the motor nerve impulse (arrow) arriving near the junction. Then twonegative extracellular e.j .p.s appeared on the lower sweep, which lasted a
548
PRESYNAPTIC INHIBITION
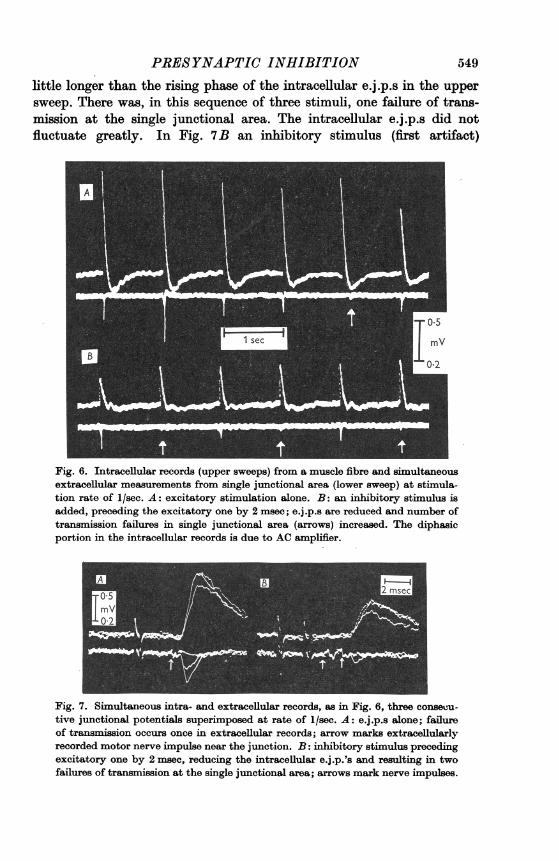
little longer than the rising phase of the intracellular e.j.p.s in the uppersweep. There was, in this sequence of three stimuli, one failure of trans-mission at the single junctional area. The intracellular e.j.p.s did notfluctuate greatly. In Fig. 7B an inhibitory stimulus (first artifact)
Fig. 6. Intracellular records (upper sweeps) from a muscle fibre and simultaneousextracellular measurements from single junctional area (lower sweep) at stimula-tion rate of 1/sec. A: excitatory stimulation alone. B: an inhibitory stimulus isadded, preceding the excitatory one by 2 msec; e.j.p.s are reduced and number oftransmission failures in single junctional area (arrows) increased. The diphasicportion in the intracellular records is due to AC amplifier.
Fig. 7. Simultaneous intra- and extracellular records, as in Fig. 6, three consecu-tive junctional potentials superimposed at rate of 1/sec. A: e.j.p.s alone; failureof transmission occurs once in extracellular records; arrow marks extracellularlyrecorded motor nerve impulse near the junction. B: inhibitory stimulus precedingexcitatory one by 2 msec, reducing the intracellular e.j.p.'s and resulting in twofailures of transmission at the single junctional area; arrows mark nerve impulses.
549

J. DUDEL AND S. W. KUFFLER
preceded the excitatory one by 2 msec. On the lower beam we now see twoextracellular nerve impulses (arrows), the first being inhibitory. They are1*5 msec apart, a little less than the stimulus interval, presumably owingto different conduction distances and speeds of propagation. Again, all theintracellular e.j.p.s were reduced and in the lower beam the number oftransmission failures was increased from 1 to 2. Only one e.j.p. ofabout50 ,uV remains (see below).
Figures 6 and 7 show that inhibition can considerably reduce theaverage extracellular response. This reduction of the extracellular e.j.p.cannot be brought about by an increased membrance conductance. This
/ C1 2
Fig. 8. 'Equivalent circuit' diagram showing external and internal recording con-ditions. Long dotted line indicates surface of fibre (see text).
point can be readily appreciated if the extracellular recording conditionsare analysed.
Figure 8 gives an 'equivalent circuit', modified from that given bydel Castillo & Katz (1956, Fig. 17b) for recording extracellularly fromvertebrate end-plates. A is the active excitatory junctional area, Re is themembrane resistance of this area and Ee is the driving force for the e.j.p.:B1 is the resistance of the small extracellular fluid volume outside thejunction, where the synaptic current density is very high. B representsthe distant indifferent electrode. B2 is the 'input resistance' (i.e. betweena point inside the fibre (C) and the extracellular fluid (B)). The intracellularelectrode records between C and B, the extracellular electrode betweenB and a part of B1. There are two alternative locations for an inhibitory
550

PRESYNAPTIC INHIBITIONmembrane conductance increase to act on this circuit. First, the inhibi-tory synaptic membrane could be so close to the excitatory one that Reand Ri are in parallel and the inhibitory and excitatory synaptic currentsflow through the same restricted extracellular fluid volume with a resist-ance R1. The second alternative is for the inhibitory synaptic area to besome distance away from A, so that it is in parallel with R2. It can beshown that in both cases the reduction of Ri (inhibitory conductanceincrease) does not diminish the extracellularly recorded e.j.p. If in alterna-tive (1) an appreciable current were produced, extracellular potentialsshould be recorded on inhibitory stimulation. We have not seen suchpotentials. In alternative (2) the inhibitory resistance decrease worksessentially as a shunt to R2. R2 is small compared with R1 + Re, as is seenfrom the fact that the intracellular junctional potential is much smallerthan its driving force E,e, as pointed out by del Castillo & Katz (1956).Thus shunting R2 cannot diminish current flow through R1; it could onlyslightly increase it, producing a larger extracellular e.j.p.
Therefore, the reduction of the extracellularly recorded e.j.p.s duringoptimally timed inhibition provides another demonstration of an inhibi-tory mechanism which cannot be accounted for by an increase in mem-brane conductance. By themselves the above results do not allow us todistinguish the site of action of this other inhibitory mechanism. The sitemay be presynaptic, with less transmitter released per impulse, or it maybe post-synaptic, for instance, with competition taking place betweenexcitatory and inhibitory transmitters. By the use of a statistical analysis,however, it was possible to show that less transmitter was released duringinhibition and that the site of action must therefore be presynaptic. Thatis, presynaptic inhibition should reduce the number rather than the size ofexcitatory transmitter quanta. Competitive inhibition would have theconverse effect. Information about quantum size and number can beobtained by statistical treatment of our extracellular records from singlesynaptic areas.
Statistical treatmentFigure 9 gives the size distribution of extracellular e.j.p.s from a single
junctional area with and without inhibition. Each graph contains 1000counts. At a frequency of 5/sec there are relatively few transmission failuresin the uninhibited junction. With inhibition the failures increase from 72to 570 and there are fewer large e.j.p.s. For instance, in the uninhibitedjunction there are 32 e.j.p.s of 150 ,V, while inhibition reduces them to 2.The whole distribution is shifted to the left.The inhibited e.j.p.s were sharply grouped around a peak of about
40 ,V. They must have a very low quantum content, because more thanhalf the responses were failures. A fitting Poisson curve could, therefore,
551
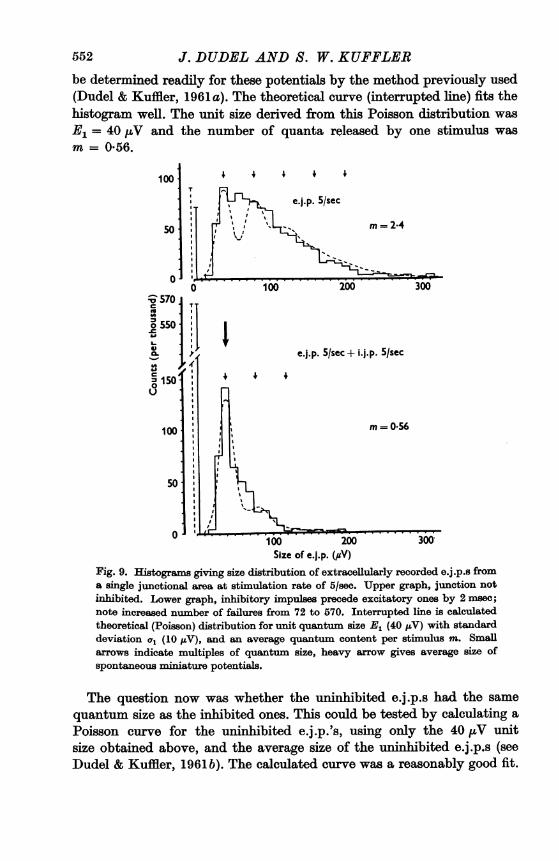
552 J. DUDEL AND S. W. KUFFLERbe determined readily for these potentials by the method previously used(Dudel & Kuffler, 1961 a). The theoretical curve (interrupted line) fits thehistogram well. The unit size derived from this Poisson distribution wasE= 40 ,uV and the number of quanta released by one stimulus wasm= 0*56.
100 1 4 4 +T
e.j.p. 5/sec
so~ ~~-.m=2*4
:1,:0 R.0 100 200 300
0 5501
Sk e.j.p. 5/sec + i.j.p. S/sec10
so
100 m=~~102 0 300
Fig. 9. Histogralms giving size distribution of extracellularly recorded e.j.p.s froma single junctional area at stimulation rate of 5/sec. Upper graph, junction notinhibited. Lower graph, inhibitory impulses precede excitatory ones by 2 msec;note increased number of failures from 72 to 570. Interrupted line is calculatedtheoretical (Poisson) distribution for unit quantum size E, (40 uV) with standarddeviation a, (10 ILV), and an average quantum content per stimulus m. Smallaxrows indicate multiples of quabntum size, heavy arrow gives average size ofspontaneous rniniature potentials.
The question now was whether the uninhibited e.j.p.s had the same
quantum size as the inhibited ones. This could be tested by calculating aPoisson curve for the uninhibited e.j.p.'s, using only the 40 ,uV unitsize obtained above, and the average size of the nihbited e.j.p.s (seeDudel A; Kuffler, 1961b). The calculated curve was a reasonably good fit.
PRESYNAPTIC INHIBITIONThus it was shown that inhibition of the e.j.p.s could be described as areduction of the average quantum content from 2-4 to 0-6 while the size ofthe unit remained unchanged.An independent control of the size of the quantum E1 is derived from
the average size of the spontaneous miniature potentials. Fourteen spon-taneous potentials were observed during the experiment of Fig. 9, with anaverage size of E8 = 41 ,uV and a standard deviation of a1 = 11 ,uV. Esthus agrees well with the quantum size E1.The possibility could be considered that the inhibitory effect on the release of excitatory
transmitter fluctuates over a wide range, possibly in a quantal way. This would result in alarge fluctuation of the probability for the release of quanta of excitatory transmitter.However, the Poisson theorem assumes that the probability of release of quanta is the samefor each stimulus. A wide fluctuation of this probability would distort the Poisson distribu-tion considerably. Since we were able to fit the inhibited e.j.p.s by a Poisson distribution,the inhibition of the excitatory transmitter release should be relatively constant with eachinhibitory stimulus. If the inhibitory transmitter is released in quanta, the quantum contentof the inhibitory potentials would have to be relatively high even at low frequencies. Suchan assumption would be in line with the observation that at low stimulation frequencies(around 1/sec) the amplitude of the intracellular i.j.p.s fluctuated less than that of theintracellular e.j.p.s.
A simpler statistical treatment consists in using a relation derived fromPoisson's theorem. It relates the number of trials (n) and failures (no) oftransmission n/nO to mean quantum content m. m is given by the averagesize E of e.j.p.s divided by the unit size E1, as treated in the previouspapers (Dudel & Kuffler, 1961a, b).
log E m.(1)
All values except E1 can be determined directly and so E1 can be calculated.Table 1 gives a comparison of e.j.p.s with and without inhibition in six
experiments. The calculated values for E1 (unit size) agree well for inhibitedand uninhibited junctions. In the same experiments the average size ofspontaneous potentials (Es) was measured and, as expected, was found tobe in close agreement with E1 (Dudel & Kuffler, 1961 a). The last column(Ei) gives the intracellular e.j.p.s, i.e. the integrated activity from thewhole fibre. A comparison ofthe intracellular e.j .p. reduction during inhibi-tion with the reduction of extracellular e.j.p.s gives an interesting pictureof the variability of activity in individual junctions. The differences inreduction can be quite striking. In experiment No. 3 the average extra-cellular e.j.p. size is radically reduced to less than 1/20 by inhibition, whilethe intracellular e.j.p. is only halved. This must mean that the effective-ness of inhibition at individual junctional areas varies greatly.
In the preceding study (Dudel & Kuffler, 1961 b) it was shown thatfailure by a nerve impulse to set up an e.j.p. at a single junctional area did
553
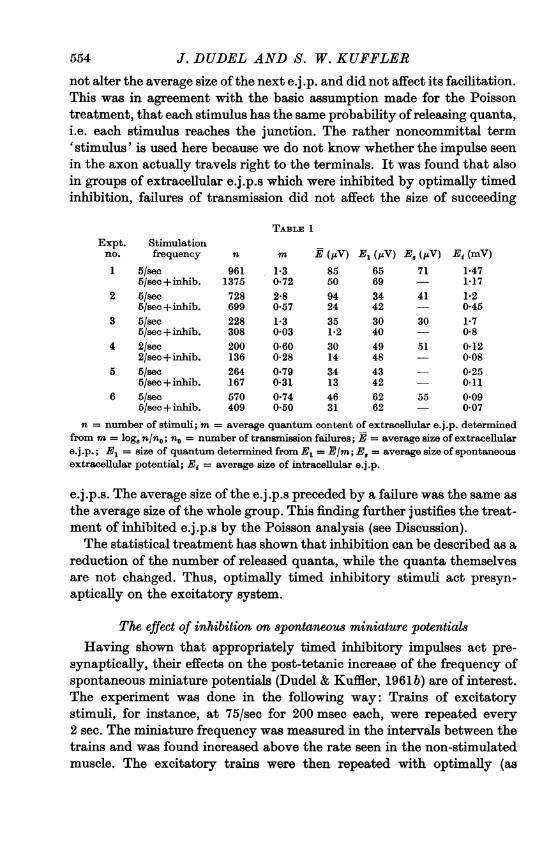
554 J. DUDEL AND S. W. KUFFLERnot alter the average size ofthe next e.j.p. and did not affect its facilitation.This was in agreement with the basic assumption made for the Poissontreatment, that each stimulus has the same probability ofreleasing quanta,i.e. each stimulus reaches the junction. The rather noncommittal term'stimulus' is used here because we do not know whether the impulse seenin the axon actually travels right to the terminals. It was found that alsoin groups of extracellular e.j.p.s which were inhibited by optimally timedinhibition, failures of transmission did not affect the size of succeeding
TABLE 1Expt. Stimulationno. frequency n m E (1V) E1 (V) Es (,V) Es (mV)1 5/sec 961 13 85 65 71 147
5/sec+inhib. 1375 0-72 50 69 - 1172 5/sec 728 2-8 94 34 41 1-2
5/sec +inhib. 699 0-57 24 42 0 453 5/sec 228 13 35 30 30 17
5/sec+inhib. 308 0 03 12 40 0-84 2/sec 200 0*60 30 49 51 0-12
2/sec+ inhib. 136 0-28 14 48 - 0-085 5/sec 264 0-79 34 43 0-25
5/sec+inhib. 167 0-31 13 42 0.116 5/sec 570 0-74 46 62 55 0-09
5/sec+inhib. 409 0-50 31 62 0 07n = number of stimuli; m average quantum content of extracellular e.j.p. determined
from m = log, n/nO; nO = number of transmission failures; E = average size of extracellulare.j.p.; E1 = size of quantum determined from E1 = R/m; E, = average size of spontaneousextracellular potential; Ei = average size of intracellular e.j.p.
e.j.p.s. The average size of the e.j.p.s preceded by a failure was the same asthe average size of the whole group. This finding further justifies the treat-ment of inhibited e.j.p.s by the Poisson analysis (see Discussion).The statistical treatment has shown that inhibition can be described as a
reduction of the number of released quanta, while the quanta themselvesare not changed. Thus, optimally timed inhibitory stimuli act presyn-aptically on the excitatory system.
The effect of inhibition on 8pontaneous miniature potentialsHaving shown that appropriately timed inhibitory impulses act pre-
synaptically, their effects on the post-tetanic increase of the frequency ofspontaneous miniature potentials (Dudel & Kuffler, 1961 b) are of interest.The experiment was done in the following way: Trains of excitatorystimuli, for instance, at 75/sec for 200 msec each, were repeated every2 sec. The miniature frequency was measured in the intervals between thetrains and was found increased above the rate seen in the non-stimulatedmuscle. The excitatory trains were then repeated with optimally (as

PRESYNAPTIC INHIBITIONFig. 5B) and minimally (Fig. 5A) effective inhibitory timing. A count ofspontaneous miniature potentials between the trains showed that theywere reduced when the excitatory-inhibitory timing was set for maximalreduction of the e.j.p.s. A tabulation of the results from two experiments isshown in Table 2. The decrease of miniature frequency was significant atthe 99.9% level. Since miniature potentials are released presynaptically,anything that changes the frequency of release presumably acts pre-synaptically. This effect therefore shows once more that inhibition has apresynaptic effect.
TABLE 2
Expt. Conditioning Inhibition Measurements Miniatureno. train timing n frequency S.E.
1 50/sec min. 106 1.44/sec 0-0650/sec optimal 159 1.13/sec 0-06
2 75/sec mi. 148 2.61/sec 0 0975/sec optimal 94 1.98/sec 0 10
One more observation, in which inhibition is likely to affect the pre-synaptic terminals, concerns post-tetanic facilitation. A train of condi-tioning excitatory stimuli, for instance, at 50/sec for 1 sec, was followedby a facilitation of single test stimuli for 10 sec or longer. If in the con-ditioning train inhibitory stimuli were set to precede each excitatory one by2 msec (as in Fig. 5B), the subsequent post-tetanic facilitation was signifi-cantly reduced. If, however, the same inhibitory impulses were timed toarrive at the junction after the excitatory ones, there was no noticeableeffect on post-tetanic facilitation.
Relationwhip of inhibition to facilitationIn a formal sense the reduction of the probability of release by inhibition
is the opposite of facilitation. Thus presynaptic inhibition could be inter-preted as a removal or prevention of facilitation. If this were true, pre-synaptic inhibition would reduce e.j.p.s to their non-facilitated size. As aconsequence, greatly facilitated, large e.j .p.s would be reduced by a greaterfactor than the smaller, less facilitated ones. This, however, is not so,because it was found that if e.j.p.s were set up at 10 or 20/sec they werereduced by optimally timed presynaptic inhibition by the same proportionas the much less facilitated e.j.p.s at 1/sec. An illustration is given inTable 3. The percentage of e.j.p. reduction seen in the last coluimn clearlydoes not depend on the frequency of excitatory stimulation. This reductionby the same proportion, independent of e.j.p. size, seems remarkable (seeDiscussion). To obtain it, however, one has to take the precaution in theseexperiments of keeping the inhibitory facilitation constant. For instance,
555

556 J. DUDEL AND S. W. KUFFLERthe inhibitory frequency was left unchanged at 10/sec in the above tests.The change in excitatory stimulation rate from 10/sec to 1/sec was simplymade by cutting out nine of the ten stimuli by an electronic gate (decadecounter). Only the inhibitory i.j.p. which precedes the e.j.p. by 2 msecwill have a presynaptic inhibitory action. The others precede the e.j.p. bymore than 100 msec and have no inhibitory effect (cf. Fig. 4); they onlyserve to keep facilitation of the i.j.p.s constant.The above experiments had a very different outcome if both excitatory
and inhibitory frequencies were reduced together. Then there was much lessreduction of the e.j.p. at a lower frequency. An example is given in experi-ment No. 3, Table 3. With inhibitory stimulation at 2/sec there was
TABLr 3
Expt. e.j.p. e.j.p. size i.j.p. e.j.p.+i.j.p. Reductionno. frequency (mV) frequency size (mV) of e.j.p. (%)
1 20/sec 16-0 20/sec 7 0 562/sec 1-6 20/sec 0 7 56
10/sec 4-5 10/sec 2-4 471/sec 0 7 10/sec 0 37 47
2 5/sec 8-5 5/sec 5-8 320.5/sec 3-6 5/sec 2-8 2210/sec 11*0 10/sec 7-0 361/sec 4-4 10/sec 258 36
3 2/sec 2-0 2/sec 1 9 520/sec 15-2 20/sec 10-2 332/sec 2*4 20/sec 1*6 33
practically no reduction of e.j.p.s (5 %). This experiment demonstrates thatpresynaptic inhibition also is facilitated like the post-synaptic inhibitorypotential (Fig.1B, Dudel & Kuffler, 1961b).
The effect of gamma-aminobutyric acid (GABA) and pre8ynaptic inhibitionIn search of a mechanism for presynaptic inhibition one has to examine
whether the inhibitory nerve acts on the excitatory terminals electrically,i.e. by current spread, or chemically, by the action of a transmitter. Ouronly available evidence indicates that there are chemoreceptor sites on theexcitatory fibre endings. We were able to mimic presynaptic inhibition byGABA.
It is known that GABA increases the post-synaptic membrane conduct-ance in a manner similar to inhibitory nerve stimulation. Accordingly itshifts the membrane potential to the inhibitory equilibrium level, i.e. thepotential change due to GABA reverses at the same potential at whichinhibitory potentials reverse (Kuffler, 1960). For the present test oneneeds conditions in which the known inhibitory post-synaptic conductanceincrease by GABA can be excluded, as it was excluded for neural inhibi-
PRESYNAPTIC INHIBITION
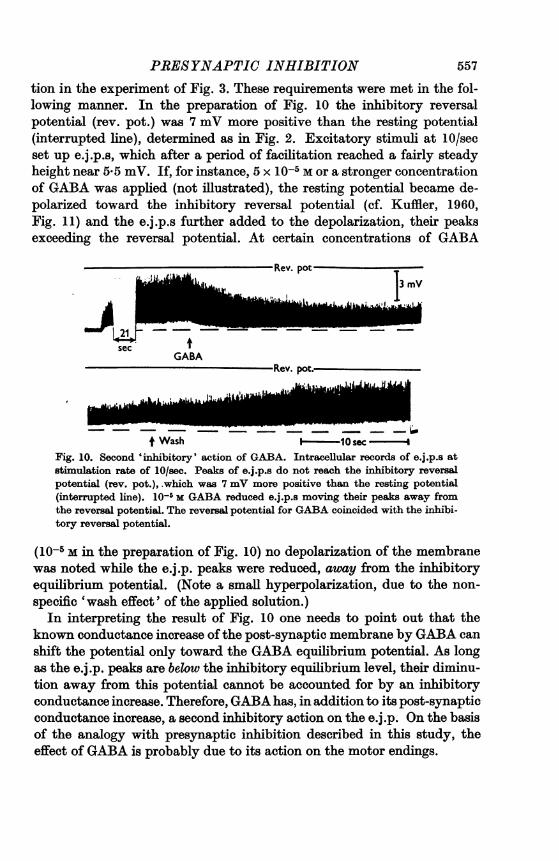
tion in the experiment of Fig. 3. These requirements were met in the fol-lowing manner. In the preparation of Fig. 10 the inhibitory reversalpotential (rev. pot.) was 7 mV more positive than the resting potential(interrupted line), determined as in Fig. 2. Excitatory stimuli at 10/secset up e.j.p.s, which after a period of facilitation reached a fairly steadyheight near 5 5 mV. If, for instance, 5 x 10⁻⁵m or a stronger concentrationof GABA was applied (not illustrated), the resting potential became de-polarized toward the inhibitory reversal potential (cf. Kuffler, 1960,Fig. 11) and the e.j.p.s further added to the depolarization, their peaksexceeding the reversal potential. At certain concentrations of GABA
Rev. pot
i1, 1~~~~~~~~~3mV
secGABA
-Rev. pot.
Wash - 10 sec- 4Fig. 10. Second 'inhibitory' action of GABA. Intracellular records of e.j.p.s atstimulation rate of 10/sec. Peaks of e.j.p.s do not reach the inhibitory reversalpotential (rev. pot.), -which was 7 mV more positive than the resting potential(interrupted line). 10-' m GABA reduced e.j.p.s moving their peaks away fromthe reversal potential. The reversal potential for GABA coincided with the inhibi-tory reversal potential.
(10-5 M in the preparation of Fig. 10) no depolarization of the membranewas noted while the e.j.p. peaks were reduced, away from the inhibitoryequilibrium potential. (Note a small hyperpolarization, due to the non-specific 'wash effect' of the applied solution.)In interpreting the result of Fig. 10 one needs to point out that the
known conductance increase ofthe post-synaptic membrane by GABA canshift the potential only toward the GABA equilibrium potential. As longas the e.j.p. peaks are below the inhibitory equilibrium level, their diminu-tion away from this potential cannot be accounted for by an inhibitoryconductance increase. Therefore, GABA has, in addition to its post-synapticconductance increase, a second inhibitory action on the e.j.p. On the basisof the analogy with presynaptic inhibition described in this study, theeffect of GABA is probably due to its action on the motor endings.
557
J. DUDEL AND S. W. KUFFLER
DISCUSSION
Our results concerning the conductance increase in crustacean musclefibres during inhibition are in full agreement with those of other workers(Fatt & Katz, 1953; Boistel & Fatt, 1958; Grundfest, Reuben & Rickles,1959; Hagiwara, Kusano & Saito, 1960). The conductance increase in cray-fish muscle during inhibition is predominantly an increase in the perme-ability to C1-, a conclusion confirmed once more by our finding thatchanging the membrane potential by excess K+ did not significantly alterthe inhibitory equilibrium potential (Fig. 2).An examination of the evidence for presynaptic inhibition may be made
in two stages. First, that a new mechanism in addition to conductanceincrease exists, and secondly that this mechanism is, in fact, presynaptic.The evidence for an additional mechanism is quite direct. Two experi-mental situations were presented in which an inhibitory conductance in-crease could not be expected to reduce the e.j.p. amplitude. In one theinhibitory equilibrium potential was more positive than the peak of thee.j.p.s, yet they were reduced by properly timed inhibition (Fig. 3). In theother the excitatory synaptic current was measured by extracellularmicro-electrodes. This synaptic current was not changed by the inhibitorypost-synaptic conductance increase. We found, however, very strong reduc-tions with inhibitory stimulation (Figs. 6 and 7).The positive evidence for the presynaptic mechanism is less direct than
the evidence which excludes the post-synaptic conductance increase inspecific instances. The principal new result reported here is that duringinhibition the size of the released quanta was unchanged, while their num-ber was reduced, i.e. less transmitter was released. This alone requires thatthe process be presynaptic provided the quanta are released presynapti-cally. The reasons for the latter assumption were presented in the first twopapers in this series (Dudel & Kuffler, 1961 a, b). It should be recalled thatthese papers did not contain direct evidence for the presynaptic release ofquanta but showed the close and detailed analogy with the quantalrelease in the vertebrate junction; there the evidence for quantal releasefrom the presynaptic terminals was complete (Katz, 1958).
There are numerous questions left about the details of the presynapticevents. Not even the structural relationship between the excitatory andinhibitory terminals is known. Under the light microscope the axons runtogether and split up together into fine arborizations on the muscle surface(for early references see D'Ancona, 1923; Tiegs, 1924; van Harreveld,1939).
Physiologically there is the problem whether the inhibitory axon exertsits effect on the motor terminals electrically, by current flow, or chemically,
558

PRESYNAPTIC INHIBITIONby means of a transmitter. The motor endings appear to have chemo-receptor sites because the presynaptic neural inhibition could be repro-duced by applying GABA. This substance mimics, in all known respects,the effects of the inhibitory transmitter (Kuffler, 1960). Another point infavour of chemical interaction is the timing relationship of impulses. Theinhibitory impulse has to arrive near the junction more than 1 msec beforethe excitatory impulse for a maximal presynaptic inhibitory effect. Syn-aptic delays of 1 msec are usually seen in our nerve-muscle junctions. Ifthe inhibitory transmitter acts on the excitatory nerve with the samedelay, its effect would appear just at the time when the motor impulsearrives at that region. For an electrical interaction, on the other hand, a1 msec minimal delay seems rather long. In addition, one can detect somepresynaptic inhibition even when the inhibitory impulse precedes theexcitatory one by 5-6 msec (Fig. 4). This fits much better if the inter-action is chemical, and makes electrical transmission unlikely.In respect to the mechanisms of the reduction of the probability of
release by inhibition, very few facts are available. We have evidence thatunder normal conditions the nerve impulse, or perhaps its attenuatedelectrotonic extension, does get to the terminals even when no quanta arereleased (Dudel & Kuffler, 1961b). The chemical steps between the mem-brane potential change and the release of transmitter are unknown. Thus,when we measure the probability of release we are dealing with the end-product of an unknown chain of events. Therefore, any discussion aboutthe control of transmitter release during facilitation or inhibition remainsspeculative (Curtis & Eccles, 1960). The principal facts for which anyeventual theory will have to account are these: inhibition can reduce post-tetanic facilitation or the release of spontaneous miniature potentials onlyif the inhibitory impulses precede the excitatory ones by a critical time;and further, the inhibited e.j.p.s still fit the Poisson distribution curve, onlythe probability of release is reduced. Significantly, even during inhibition,the failure to release a quantum after a stimulus does not influence theaverage quantum content of the e.j.p. set up by the next stimulus. Thisexcludes inhibitory action being an intermittent conduction block at suchdistance from the junction that no effective membrane potential changewould reach the terminal.
Although many possible mechanisms might explain presynaptic inhibit-ion, we would point out that the main known action of the inhibitory trans-mitter can be used for a consistent explanation. One may assume that theinhibitory nerve impulse releases in its terminal region a transmitter whichacts on the neighbouring motor nerve fibre by increasing the conductancefor a few milliseconds, as it does in the post-synaptic muscle membrane.The increased conductance, in turn, will decrease the electrical potential
559
J. DUDEL AND S. W. KUFFLERchange which serves as a 'stimulus' for the terminal. If this change wereelectrotonic (see below) one could explain the fact that the inhibitorreduces the e.j.p. independently of its size (Table 3). The size of thestimulus probably controls the average amount of quanta which are re-leased and could also determine the extent of post-tetanic facilitation.That the size of a nerve impulse can control transmitter output has beensuggested by the experiments of del Castillo & Katz (1954), who hyper-polarized the terminals and obtained larger end-plate potentials. Hagiwara& Tasaki (1958) also were able to reduce or increase synaptic potentials inthe squid stellate ganglion, by changing the presynaptic membranepotential.The advantage of the above suggestions is the possibility of an experi-
mental test. Attempts to record changes in the size of the motor nerveimpulse in the terminals have not yet been successful. We have also triedto determine the 'excitability' of the terminals (Wall, 1958) by stimulatingthem at the spots where the extracellular junctional potentials wererecorded. It was not possible to set up impulses in the motor axon bypassing current through this terminal area. This may lead one to suspectthat the fine terminal stretch actually does not carry all-or-none impulsesas the axon does, but is reached by electrotonic potentials only.There are some suggestions for a presynaptic mechanism of inhibition
elsewhere in the nervous system. Of special interest is the observation byFrank & Fuortes (1957), who saw inhibition of monosynaptic excitation inthe spinal cord of cats without any appreciable change in the excitabilityof the post-synaptic cell. This 'remote inhibition' of Frank & Fuortes maywell be presynaptic. A similar report comes from J. C. Eccles and hisco-workers (personal communication). Therefore a definite possibilityexists that the mammalian nervous system may also make use of a pre-synaptic mechanism.
SUMMARY
1. At crustacean neuromuscular junctions, as well as in numeroussynapses elsewhere, the inhibitory transmitter acts by increasing the post-synaptic permeability to certain ions while the membrane potential re-mains near the resting level.
2. If inhibitory impulses are timed to arrive at the neuromuscularjunction 1-6 msec before the excitatory impulse, they reduce the excitatoryjunctional potentials (e.j.p.s). It is demonstrated that in specific instancesthis reduction of e.j.p.s cannot be brought about solely by an increase ina post-synaptic inhibitory conductance.
3. The average number and size of quanta released by an excitatorynerve stimulus from nerve terminals were determined at individual junc-tional areas with extracellular micro-electrodes. Properly timed inhibition
560

PRESYNAPTIC INHIBITION 561
reduced the number of released quanta while their size remained un-changed. Therefore, this type of inhibition acts at a presynaptic site on theexcitatory nerve terminals, reducing their output of transmitter. Theseresults do not support as mechanisms of inhibition either a post-synapticdecrease of sensitivity to the transmitter or a conduction block of theexcitatory nerve.
4. Applied gamma-aminobutyric acid has an inhibitory effect in addi-tion to its post-synaptic inhibitory conductance increase. This and a mini-mal synaptic delay of about 1 msec suggest chemical transmission from theinhibitory to the excitatory nerve terminals.
5. Presynaptic inhibition reduces the post-excitatory facilitation ofe.j.p.s as well as the post-excitatory frequency increase of spontaneousminiature potentials. Presynaptic inhibition itself shows a process offacilitation, much like the inhibitory junctional potential.
We wish to thank Dr David Potter who participated in some of the experiments,Dr Edwin Furshpan for helpful discussions, and Mr R. B. Bosler for his unfailing assistanceduring the course of this study. Financial support by the United States Public HealthService and by the Mallinckrodt Foundation is acknowledged.
REFERENCESBoISTEL, J. & FATT, P. (1958). Membrane permeability change during inhibitory trans-
mitter action in crustacean muscle. J. Physiol. 144, 176-191.Butxx, W. & GINwsORG, B. L. (1956). The action of the neuromuscular transmitter on the
slow fibre membrane. J. Physiol. 132, 599-610.CooMms, J. S., Eccrms, J. C. & FATT, P. (1955). The specific ionic conductance and the
ionic movements across the motoneuronal membrane that produce the inhibitory post-synaptic potential. J. Phy8iol. 130, 326-373.
CulTis, D. R. & Eccizs, J. C. (1960). Synaptic action during and after repetitive stimula-tion. J. Physiol. 150, 374-398.
D'ANcoNA, V. (1923). Per la miglior conoscensa delle terninosioni nervose nei muscolisomatici dei crosticei decopodi. Trab. Lab. Invest. biol. Univ. Madr. 23, 393-423.
DEL CASTIsLO, J. & KATZ, B. (1954). Changes in end-plate activity produced by presynapticpolarization. J. Physiol. 124, 586-604.
DEL CASTILLO, J. & KATZ, B. (1956). Localization of active spots within the neuromuscularjunction of the frog. J. Physiol. 132, 630-649.
DUDEL, J. & KUFFLER, S. W. (1960). A second mechanism of inhibition at the crayfishneuromuscular junction. Nature, Lond., 187, 247-248.
DuDEL, J. & KUFFLER, S. W. (1961 a). The quantal nature of transmission and spontaneousminiature potentials at the crayfish neuromuscular junction. J. Physiol. 155, 514-529.
DUDEL, J. & KUFFLER, S. W. (1961b). Mechanism of facilitation at the crayfish neuro-muscular junction. J. Physiol. 155, 530-542.
FATT, P. & K-ATZ, B. (1953). The effect of inhibitory nerve impulses on a crustacean musclefibre. J. Phy8iol. 121, 374-389.
FRANx, K. & FuoRTEs, M. G. F. (1957). Presynaptic and post-synaptic inhibition of mono-synaptic reflexes. Fed. Proc. 16, 39-40.
GRUNDFEST, H., REuIBEN, J. P. & RicxLTs, W. H., Jr. (1959). The electrophysiology andpharmacology of lobster neuromuscular synapses. J. gen. Phy8iol. 42, 1301-1323.
HAGIWARA, S. & TAsA , I. (1958). A study of the mechanism of impulse transmissionacross the giant synapse of the squid. J. Physiol. 143, 114-137.
36 PHYSIO. CLV

562 J. DUDEL AND S. W. KUFFLERHAGIWARA, S., KusANo, K. & SATo, S. (1960). Membrane changes in crayfish stretch
receptor neuron during synaptic inhibition and under action of gamma-aminobutyricacid. J. Neurophysiol. 23, 505-515.
KATZ, B. (1958). Microphysiology ofthe neuro-muscular junction. A physiological 'quantumof action' at the myoneural junction. Johns Hopkins Hosp. Bull. 102, 275-295.
KurrLKa, S. W. (1960). Excitation and inhibition in single nerve cels. Harvey Lect. 1958-1959. New York: Academic Press.
KUFFLEB, S. W. & EYZAGUIRRE, C. (1955). Synaptic inhibition in an isolated nerve cell.J. gen. Physsol. 39, 155-184.
KuFrLER, S. W. & KATZ, B. (1946). Inhibition at the nerve-muscle junction in crustacea.J. Neurophysiol. 9, 337-346.
MARmoNT, G. & WIpRtsMA, C. A. G. (1938). On the mechanism of inhibition and excitationof crayfish muscle. J. Physiol. 93, 173-193.
TIEGs, 0. W. (1924). On the mechanisms of muscular action. Aust. J. exp. Biol. med. Sci.1, 11-29.
TRAUTWEiJ, W. & DUDEL, J. (1958). Zulm Mechanismus der Membranwirkung des Acetyl-cholin an der Herzmuskelfaser. Pflaig. Arch. ges. Physiol. 266, 324-334.
VAN HARREVELD, A. (1939). The nerve supply of doubly and triply innervated crayfishmuscles related to their function. J. comp. Neurol. 70, 267-284.
WALL, P. D. (1958). Excitability changes in afferent fibre terminations and their relation toslow potentials. J. Physiol. 142, 1-21.