Commentaries - NCBI
9
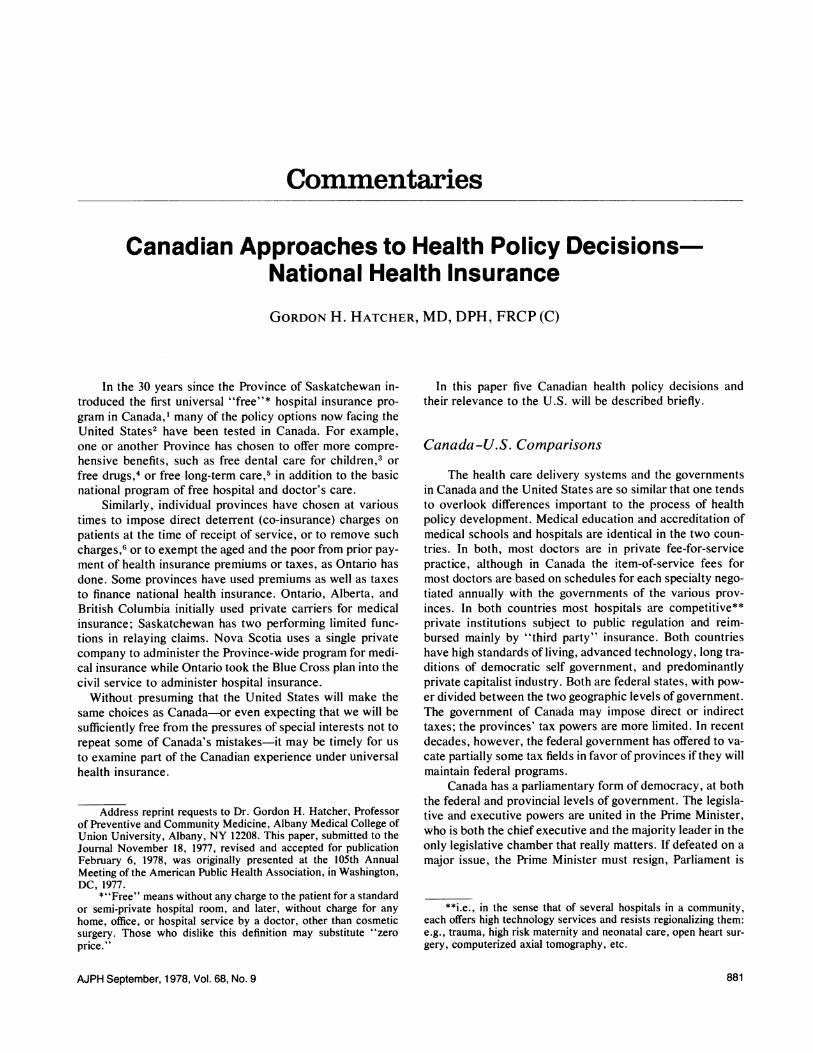
Commentaries Canadian Approaches to Health Policy Decisions- National Health Insurance GORDON H. HATCHER, MD, DPH, FRCP (C) In the 30 years since the Province of Saskatchewan in- troduced the first universal "free"* hospital insurance pro- gram in Canada,' many of the policy options now facing the United States2 have been tested in Canada. For example, one or another Province has chosen to offer more compre- hensive benefits, such as free dental care for children,3 or free drugs,4 or free long-term care,5 in addition to the basic national program of free hospital and doctor's care. Similarly, individual provinces have chosen at various times to impose direct deterrent (co-insurance) charges on patients at the time of receipt of service, or to remove such charges,6 or to exempt the aged and the poor from prior pay- ment of health insurance premiums or taxes, as Ontario has done. Some provinces have used premiums as well as taxes to finance national health insurance. Ontario, Alberta, and British Columbia initially used private carriers for medical insurance; Saskatchewan has two performing limited func- tions in relaying claims. Nova Scotia uses a single private company to administer the Province-wide program for medi- cal insurance while Ontario took the Blue Cross plan into the civil service to administer hospital insurance. Without presuming that the United States will make the same choices as Canada-or even expecting that we will be sufficiently free from the pressures of special interests not to repeat some of Canada's mistakes-it may be timely for us to examine part of the Canadian experience under universal health insurance. Address reprint requests to Dr. Gordon H. Hatcher, Professor of Preventive and Community Medicine, Albany Medical College of Union University, Albany, NY 12208. This paper, submitted to the Joumal November 18, 1977, revised and accepted for publication February 6, 1978, was originally presented at the 105th Annual Meeting of the American Public Health Association, in Washington, DC, 1977. *"Free" means without any charge to the patient for a standard or semi-private hospital room, and later, without charge for any home, office, or hospital service by a doctor, other than cosmetic surgery. Those who dislike this definition may substitute "zero price." In this paper five Canadian health policy decisions and their relevance to the U.S. will be described briefly. Canada -U.S. Comparisons The health care delivery systems and the governments in Canada and the United States are so similar that one tends to overlook differences important to the process of health policy development. Medical education and accreditation of medical schools and hospitals are identical in the two coun- tries. In both, most doctors are in private fee-for-service practice, although in Canada the item-of-service fees for most doctors are based on schedules for each specialty nego- tiated annually with the governments of the various prov- inces. In both countries most hospitals are competitive** private institutions subject to public regulation and reim- bursed mainly by "third party" insurance. Both countries have high standards of living, advanced technology, long tra- ditions of democratic self government, and predominantly private capitalist industry. Both are federal states, with pow- er divided between the two geographic levels of government. The government of Canada may impose direct or indirect taxes; the provinces' tax powers are more limited. In recent decades, however, the federal government has offered to va- cate partially some tax fields in favor of provinces if they will maintain federal programs. Canada has a parliamentary form of democracy, at both the federal and provincial levels of government. The legisla- tive and executive powers are united in the Prime Minister, who is both the chief executive and the majority leader in the only legislative chamber that really matters. If defeated on a major issue, the Prime Minister must resign, Parliament is **i.e., in the sense that of several hospitals in a community, each offers high technology services and resists regionalizing them: e.g., trauma, high risk maternity and neonatal care, open heart sur- gery, computerized axial tomography, etc. AJPH September, 1978, Vol. 68, No. 9 881
-
Upload
khangminh22 -
Category
Documents
-
view
0 -
download
0
Transcript of Commentaries - NCBI
Commentaries
Canadian Approaches to Health Policy Decisions-National Health Insurance
GORDON H. HATCHER, MD, DPH, FRCP (C)
In the 30 years since the Province of Saskatchewan in-troduced the first universal "free"* hospital insurance pro-gram in Canada,' many of the policy options now facing theUnited States2 have been tested in Canada. For example,one or another Province has chosen to offer more compre-hensive benefits, such as free dental care for children,3 orfree drugs,4 or free long-term care,5 in addition to the basicnational program of free hospital and doctor's care.
Similarly, individual provinces have chosen at varioustimes to impose direct deterrent (co-insurance) charges onpatients at the time of receipt of service, or to remove suchcharges,6 or to exempt the aged and the poor from prior pay-ment of health insurance premiums or taxes, as Ontario hasdone. Some provinces have used premiums as well as taxesto finance national health insurance. Ontario, Alberta, andBritish Columbia initially used private carriers for medicalinsurance; Saskatchewan has two performing limited func-tions in relaying claims. Nova Scotia uses a single privatecompany to administer the Province-wide program for medi-cal insurance while Ontario took the Blue Cross plan into thecivil service to administer hospital insurance.
Without presuming that the United States will make thesame choices as Canada-or even expecting that we will besufficiently free from the pressures of special interests not torepeat some of Canada's mistakes-it may be timely for usto examine part of the Canadian experience under universalhealth insurance.
Address reprint requests to Dr. Gordon H. Hatcher, Professorof Preventive and Community Medicine, Albany Medical College ofUnion University, Albany, NY 12208. This paper, submitted to theJoumal November 18, 1977, revised and accepted for publicationFebruary 6, 1978, was originally presented at the 105th AnnualMeeting of the American Public Health Association, in Washington,DC, 1977.
*"Free" means without any charge to the patient for a standardor semi-private hospital room, and later, without charge for anyhome, office, or hospital service by a doctor, other than cosmeticsurgery. Those who dislike this definition may substitute "zeroprice."
In this paper five Canadian health policy decisions andtheir relevance to the U.S. will be described briefly.
Canada -U.S. Comparisons
The health care delivery systems and the governmentsin Canada and the United States are so similar that one tendsto overlook differences important to the process of healthpolicy development. Medical education and accreditation ofmedical schools and hospitals are identical in the two coun-tries. In both, most doctors are in private fee-for-servicepractice, although in Canada the item-of-service fees formost doctors are based on schedules for each specialty nego-tiated annually with the governments of the various prov-inces. In both countries most hospitals are competitive**private institutions subject to public regulation and reim-bursed mainly by "third party" insurance. Both countrieshave high standards of living, advanced technology, long tra-ditions of democratic self government, and predominantlyprivate capitalist industry. Both are federal states, with pow-er divided between the two geographic levels of government.The government of Canada may impose direct or indirecttaxes; the provinces' tax powers are more limited. In recentdecades, however, the federal government has offered to va-cate partially some tax fields in favor of provinces if they willmaintain federal programs.
Canada has a parliamentary form of democracy, at boththe federal and provincial levels of government. The legisla-tive and executive powers are united in the Prime Minister,who is both the chief executive and the majority leader in theonly legislative chamber that really matters. If defeated on amajor issue, the Prime Minister must resign, Parliament is
**i.e., in the sense that of several hospitals in a community,each offers high technology services and resists regionalizing them:e.g., trauma, high risk maternity and neonatal care, open heart sur-gery, computerized axial tomography, etc.
AJPH September, 1978, Vol. 68, No. 9 881

COMMENTARIES
dissolved, and a general (federal or provincial) election fol-lows in which all seats are up for election. This system en-courages party discipline, and gives the majority party whenelected the power to carry out a program it promised thepeople during the election campaign. This also makes gov-ernment more accountable: the Prime Minister cannot blameone of the Houses of Congress, or the courts, if he fails toimplement a program-such as national health insurance-that he promised during an election.
This is not to suggest there are not the same special in-terests in Canada as the U.S., nor that Canadian politicalleaders always keep their promises. However, the Canadiansystem tends to force government to confront special inter-ests more openly, to inform the public in order to securetheir support, and then to work out in some detail the com-promises, the points for negotiation, and the elements of apublic policy that will not be negotiable. This process is fa-miliar to Americans as well, but in the U.S. there is morebehind-the-door bargaining with individual Senators or sub-committee counsel, and less clarity and consistency in thelegislative package that emerges. Thus U.S. Medicare wasonly passed in 1965 with benefits limited to the aged, andwith reimbursement arrangements for hospitals and doctorsthat guaranteed a runaway cost inflation.
Universal hospital insurance was first introduced in Sas-katchewan in 1947, and enacted federally as a grant-in-aidprogram to the provinces in 1958. Similarly Saskatchewanintroduced universal medical (physicians' services) insur-ance in 1962; the federal program followed in 1968. BritishColumbia, Alberta, and Newfoundland in particular, also de-veloped public programs prior to the federal legislation. Insome cases the provinces had to modify their programs tomeet the relatively few conditions for federal reimbursementof approximately one-half the cost.
This chronology makes it clear that in Canada provincialgovernments have substantial powers and responsibilitiesfor health services. Although the parallel with the state gov-ernments in the U.S. is close, some Canadian provinceshave shown more initiative in introducing universal healthinsurance. The government of Canada, unlike the UnitedStates government, felt it lacked the constitutional authorityfor unilateral administration of health insurance.t Hereagain, the Canadian government system tended to enforce asharper definition of certain policy issues before the nation-wide federal-provincial health insurance programs were im-plemented.
L. Universal Access to Care with Dignity
Universal coverage of the population was one of the Ca-nadian federal requirements both for hospital insurance andfor physicians' services insurance. The formula for federalmatching assists the poorer provinces. The definition of
tThe wording of the British North America Act of 1967 wouldseem to give the Canadian government sufficient constitutional au-thority, but the political realities limited the federal government tosetting conditions for federal subsidy of provincial health insurance.
"universal" to include 90 per cent of the population initially,increasing later to 95 per cent and now to virtually the wholepopulation, gave large industrialized provinces time to phasein employee groups with various types of prior insurancecoverage.
The language "access for all Canadians on equal termsand conditions" precluded exclusion of a higher incomegroup who would seek care in a separate "private" system,or of a lower income group who might receive second classservices. It also limited the extent to which provinces mightimpose deterrent "co-insurance" charges at a time of receiptof service or require high health insurance "premiums"which are regressive taxes. Thus a means test for health careneed be applied only to a very small number of persons, usu-ally already on welfare, who cannot afford the premiums,rather than to the many who could not meet the costs ofillness.
Some traces of special treatment for the well-to-do havepersisted in the limitation of hospital insurance benefits tostandard ward or semi-private rooms, unless privacy is med-ically necessary, and in the opting out arrangements used bya small proportion of doctors in most provinces.t# Otherwisethe fee schedule, negotiated periodically between the prov-ince and the provincial medical association, sets a ceiling foreach visit, service, or procedure.
Apart from these two items, the government of Canadawas firm in its commitment to equal access to hospital andmedical care. In a sense, the provincial governments bargainwith the hospitals and doctors on behalf of all their citizensto set the rates for hospital and medical services, and thenmake the rules so patients are not overcharged and insurancepremiums are subsidized by progressive income and othertaxes. Canadians believe that essential health care shouldnot be for sale to the highest bidder, or offered to the work-ing poor only as a handout. Canadians feel strongly thatpeople who have been self-supporting all their lives shouldnot have to go to the welfare department and submit to ameans test when they are sick and old, as so many U.S.Medicare patients must do to pay their deductibles and co-insurance. Even conservative governments in Canada sparetheir citizens of all ages this indignity.
All physicians' services, including all office visits, andall hospital care-not only catastrophic costs-are coveredin Canada, with virtually no co-payment. Before introducinghealth insurance, hospitals and medical schools were over-built in anticipation of a flood of demand for free care-aflood that never materialized. Instead, the use of serviceswas equalized between lower and upper income groups, aswas documented in Quebec by Enterline's study.7However, the use of services has gradually increased
with the supply of hospital beds and physicians. The initialfailure to recognize the importance of supply constraints tocost containment has been the major factor in Canada's healthcost inflation. Nevertheless, costs in Canada-where cov-erage is universal with no deterrent co-insurance-still run
tt1n these cases the doctor may, by prior agreement with thepatient, charge him a specified amount above a provincial fee sched-ule.
AJPH September, 1978, Vol. 68, No. 9882

COMMENTARIES
TABLE 1 -Health Care Expenditures (Public and Private) for the U.S. and Canada (% of GrossNational Product)
1960 1970 1975
U.S. Canada U.S. Canada U.S. Canadaa
Hospital Care 1.8 2.2 2.8 3.3 3.3 3.4Physician Services 1.1 0.9 1.5 1.2 1.6 1.1All Personal
Heafth Care 4.5 4.7 6.3 6.2 7.3 6.1Administration/
Prepayment 0.2 0.1 0.3 0.1 0.4 0.1TOTAL HEALTH CARE 5.3 5.5 7.5 7.0 8.4 6.8
a) PreliminarySources: U.S., Social Securty Administration, Department of Health, Education, & Welfare Canada, Department
of National Health and Welfare, courtesy William Mennie
below those of the United States. Yet in the U.S., universalcoverage has not been attained, and the aged now pay moreout-of-pocket when they are sick than before Medicare,*8 sothat many must also apply for welfare medical care (i.e.Medicaid). Table 1 compares U.S. and Canadian health carecosts.
An interesting observation is that administrative costs inCanada-with a single government health insurance agencyin each province-are only one-fourth those in the UnitedStates, with its multiple carriers and intermediaries, and co-insurance.
I. The Data Base
There is one real advantage to paying all doctors by fee-for-service for every visit or procedure, and paying all hospi-tals for every individual admission, out of a single publichealth insurance program for all the population in a largegeographic region such as a province or state. This is theavailability of a data base that enables the program managersto monitor utilization and costs of health care services. Un-der and over-utilization of services and differences betweenregions and age groups can be identified and resulting pro-gram improvements initiated and evaluated. Such a database is essential to regional health planning and cost contain-ment.
Productivity of physicians and institutions can be mea-sured and analyzed by characteristics of the providers (suchas the doctor's medical specialty or the hospital's classifica-tion and services) and also by characteristics of the patients(such as age, sex, diagnosis, surgical operation, and rural!urban location). The annual reports of several provincialhealth insurance programs,** and of the Dominion Bureau of
*U.S. over age 65 out-of-pocket expense: in 1967, $236.72; in1976, $403.53
**See especially the Annual Reports of the Saskatchewan Hos-pital Services Plan, and of the British Columbia Hospital InsuranceService, since 1950; of the Saskatchewan on Medical Care Insur-ance Commission since 1964; and more recent reports from Alberta,Ontario, Quebec and Nova Scotia.
Statistics (now Statistics Canada)9 are exemplary com-pendia, while for decades the special studies by the researchunit in the Department of National Health and Welfareheaded by William Mennie'0 have pioneered the develop-ment of economic analyses.
The Canadian health insurance claims-based data sys-tem is also a valuable resource for detecting over-servicingand over-charging by physicians-a form of abuse that hasbeen far more frequently detected in Canada than "exces-sive demand" by patients. Only in a national health insur-ance plan that covers the whole population of a large healthcare region for all medical and hospital care, paid through asingle administrative agency, is it possible to examine thetotal workload of each physician and compare his pattern ofutilization and costs to his peers.
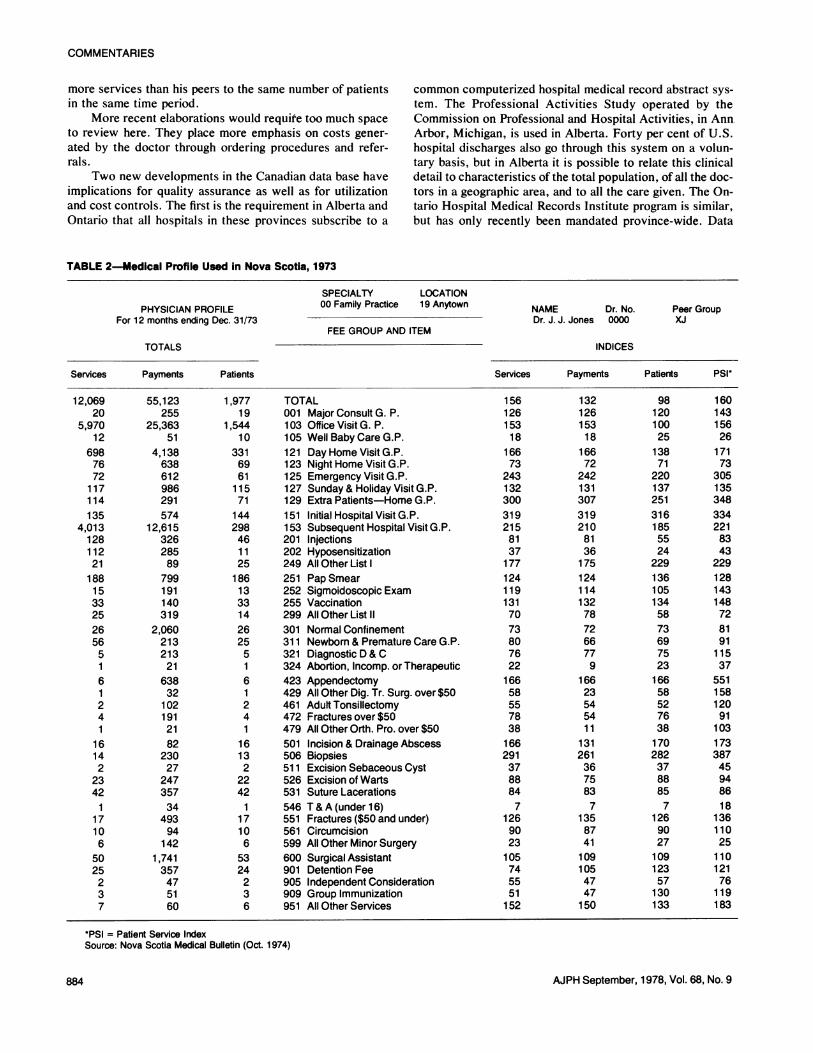
Saskatchewan was the first province to introduce uni-versal insurance for physician services, in 1962.t This pro-gram became the model for all of Canada when the federalgovernment offered matching grants-in-aid to the Provincesin 1968. Shortly thereafter Saskatchewan developed thehealth insurance claims-based medical profiles that makepossible the control of over-utilization and related cost over-runs.12 The early Saskatchewan medical profiles were pro-gressively elaborated and, in various forms, are now used inall provinces. The computer is programmed to print out de-tails for special investigation on the patterns of practice andcosts of physicians deviating from the mean for their special-ty group and region by more than a specified amount, e.g.,two standard deviations. Table 2 is the medical profile usedin Nova Scotia five years ago. It illustrates the overview of adoctor's total activities this method affords. The indices arepercentages, 100 being the averages for the doctor's"peers." The Patient Service Index (PSI) in the last columnis obtained by dividing the number of services by the numberof different patients receiving them, and then comparing thisdoctor with his peers. Thus 160 means he gave 60 per cent
tA doctors' strike postponed the inauguration of the programfor a few months in Saskatchewan, and probably dissuaded doctorsfrom such tactics elsewhere for a decade.11
AJPH September, 1978, Vol. 68, No. 9 883
COMMENTARIES
more services than his peers to the same number of patientsin the same time period.
More recent elaborations would requite too much spaceto review here. They place more emphasis on costs gener-ated by the doctor through ordering procedures and refer-rals.
Two new developments in the Canadian data base haveimplications for quality assurance as well as for utilizationand cost controls. The first is the requirement in Alberta andOntario that all hospitals in these provinces subscribe to a
common computerized hospital medical record abstract sys-tem. The Professional Activities Study operated by theCommission on Professional and Hospital Activities, in AnnArbor, Michigan, is used in Alberta. Forty per cent of U.S.hospital discharges also go through this system on a volun-tary basis, but in Alberta it is possible to relate this clinicaldetail to characteristics of the total population, of all the doc-tors in a geographic area, and to all the care given. The On-tario Hospital Medical Records Institute program is similar,but has only recently been mandated province-wide. Data
TABLE 2-Medical Profile Used in Nova Scotia, 1973
SPECIALTY LOCATIONPHYSICIAN PROFILE 00 Family Practice 19 Anytown NAME Dr. No. Peer Group
For 12 months ending Dec. 31/73 Dr. J. J. Jones 0000 XJFEE GROUP AND ITEM
TOTALS INDICES
Services Payments Patients Services Payments Patients PSI*
1,97719
1,54410
33169611157114429846112518613331426255161241
161322242
17106
5324236
TOTAL001 Major Consult G. P.103 Office Visit G. P.105 Well Baby Care G.P.121 Day Home Visit G.P.123 Night Home Visit G.P.125 Emergency Visit G.P.127 Sunday & Holiday Visit G.P.129 Extra Patients-Home G.P.151 Initial Hospital Visit G.P.153 Subsequent Hospital Visit G.P.201 Injections202 Hyposensitization249 All Other List I251 Pap Smear252 Sigmoidoscopic Exam255 Vaccination299 All Other List II
301 Normal Confinement311 Newborn & Premature Care G.P.321 Diagnostic D & C324 Abortion, lncomp. or Therapeutic423 Appendectomy429 All Other Dig. Tr. Surg. over $50461 Adult Tonsillectomy472 Fractures over $50479 All Other Orth. Pro. over $50501 Incision & Drainage Abscess506 Biopsies511 Excision Sebaceous Cyst526 Excision of Warts531 Suture Lacerations546 T & A (under 16)551 Fractures ($50 and under)561 Circumcision599 All Other Minor Surgery600 Surgical Assistant901 Detention Fee905 Independent Consideration909 Group Immunization951 All Other Services
15612615318
16673
24313230031921581371771241191317073807622166585578381662913788847
1269023105745551152
13212615318
16672
2421313073192108136175124114132787266779
16623545411
1312613675837
13587411091054747150
981201002513871
2201372513161855524
2291361051345873697523166585276381702823788857
126902710912357130133
16014315626
17173
3051353483342218343
22912814314872819111537
55115812091
10317338745948618
1361102511012176119183
*PSI = Patient Service IndexSource: Nova Scotia Medical Bulletin (Oct. 1974)
AJPH September, 1978, Vol. 68, No. 9
12,06920
5,97012
6987672117114135
4,0131281122118815332526565161241
16142
2342
117106
5025237
55,123255
25,36351
4,138638612986291574
12,61532628589799191140319
2,06021321321638321021912182
23027
24735734
49394
1421,741357475160
884
COMMENTARIES
from the abstracts are available to the provincial health in-surance programs and their medical review bodies, as well asto individual medical staff committees.
In 1975 and 1976 the author interviewed senior healthinsurance officials and medical profession or medical reviewbody representatives in 10 of the 12 provinces, as well as atthe federal level. Questions related mainly to their experi-ence of controlling costs under universal "free" health in-surance, while maintaining quality. A striking finding wasthat cost control and quality control were not inconsistent.Over-servicing of patients for extra income was often foundassociated with medical care of poor quality; economy andgood quality are often associated. Universal use of the Quali-ty Assurance Monitor of the PAS system in association withpopulation-based health statgs measures holds promise for aquantitative epidemiological evaluation of this health insur-ance claims-based experience.
The second Canadian development is the linkage-againin Saskatchewan with its free drug program-of hospital,medical, and drug utilization data based on health insuranceclaims. This has new potential for analysis of the quality ofcare rendered to a patient over time for a given diagnosis, aswell as for reviewing patterns of care by diagnosis for a givenpractitioner for comparison to his peers, and to explicit stan-dards.
The physician profiles and patient care profiles project-ed in the U.S. Professional Standards Review Organizationlegislation are realities in many Canadian provinces, and inuse for utilization control and for some quality inquiries.This is because they are based on universal health insuranceclaims with a single "carrier" or plan for each large definedgeographic area (i.e., a province); they do not require awhole costly new data collection and processing system.
III. Integration ofHealth Care System Controls
Canada has recently imposed wage and income controlsat the federal level,13 which accounts in part for the drop inhealth care expenditures as per cent of Gross National Prod-uct in the past two years, while-those in the U.S. continuedup more rapidly after U.S. controls were removed (see Table1). -
However, it is at the provincial government level that anintegrated health cost containment policy has evolved out ofthe experience of public administration of universal compre-hensive health insurance. Initially'price controls were themajor method of cost containment in Canada, exercised atthe provincial level by prospective government line-by-linereview of individual hospital budgets, and by fee schedulenegotiations with physicians. Later utilization review, usingmedical profiles and average length of hospital stay by diag-nosis, was added. Some provinces have tried to include inbargaining with physicians a total budgeting concept insteadof just fees, to put physicians at financial risk as a group ifutilization and substitution of high fee items of service forlow ones led to overall cost escalation greater than approvedfee schedule increases. But the major reliance now is placedon resources constraints, i.e., hospital bed/population ratios
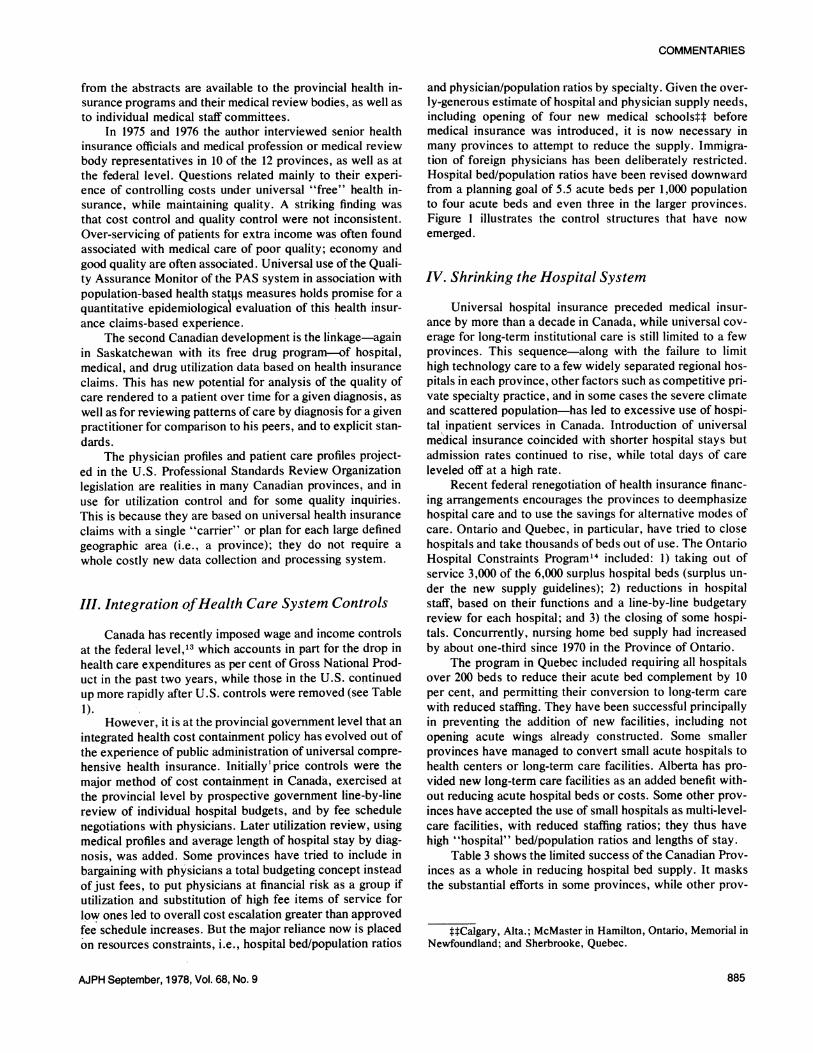
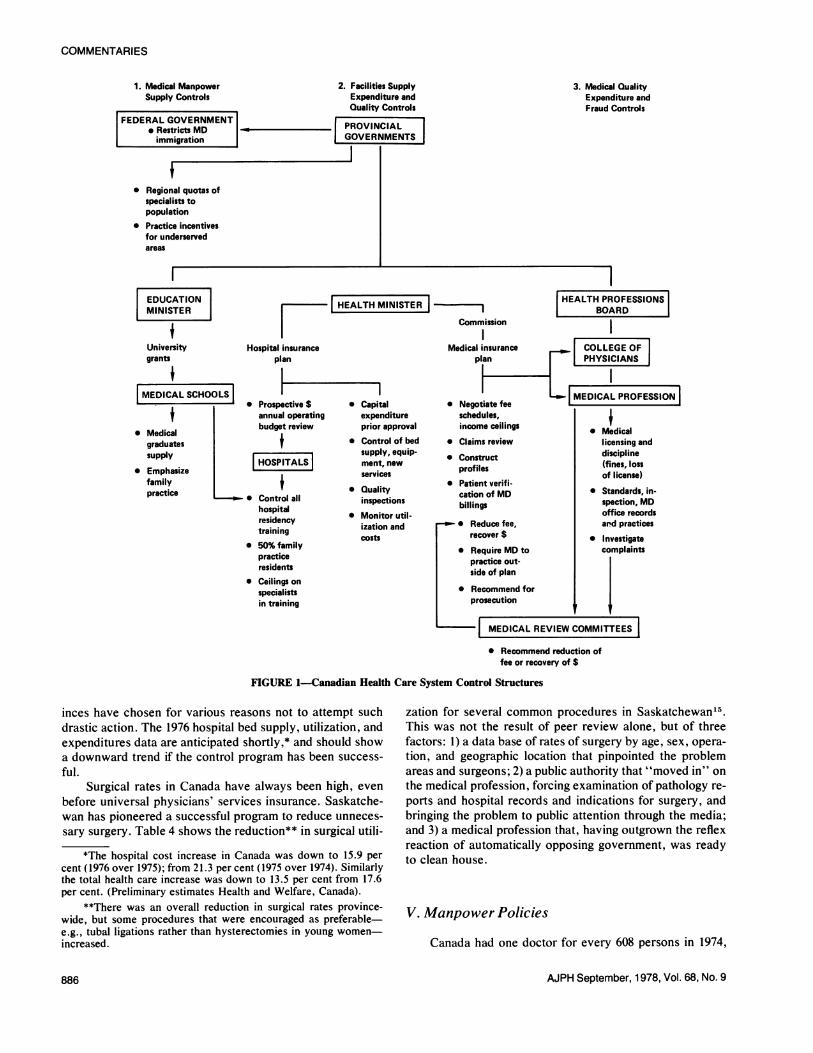
and physician/population ratios by specialty. Given the over-ly-generous estimate of hospital and physician supply needs,including opening of four new medical schoolstt beforemedical insurance was introduced, it is now necessary inmany provinces to attempt to reduce the supply. Immigra-tion of foreign physicians has been deliberately restricted.Hospital bed/population ratios have been revised downwardfrom a planning goal of 5.5 acute beds per 1,000 populationto four acute beds and even three in the larger provinces.Figure 1 illustrates the control structures that have nowemerged.
IV. Shrinking the Hospital System
Universal hospital insurance preceded medical insur-ance by more than a decade in Canada, while universal cov-erage for long-term institutional care is still limited to a fewprovinces. This sequence-along with the failure to limithigh technology care to a few widely separated regional hos-pitals in each province, other factors such as competitive pri-vate specialty practice, and in some cases the severe climateand scattered population-has led to excessive use of hospi-tal inpatient services in Canada. Introduction of universalmedical insurance coincided with shorter hospital stays butadmission rates continued to rise, while total days of careleveled off at a high rate.
Recent federal renegotiation of health insurance financ-ing arrangements encourages the provinces to deemphasizehospital care and to use the savings for alternative modes ofcare. Ontario and Quebec, in particular, have tried to closehospitals and take thousands of beds out of use. The OntarioHospital Constraints Program14 included: 1) taking out ofservice 3,000 of the 6,000 surplus hospital beds (surplus un-der the new supply guidelines); 2) reductions in hospitalstaff, based on their functions and a line-by-line budgetaryreview for each hospital; and 3) the closing of some hospi-tals. Concurrently, nursing home bed supply had increasedby about one-third since 1970 in the Province of Ontario.
The program in Quebec included requiring all hospitalsover 200 beds to reduce their acute bed complement by 10per cent, and permitting their conversion to long-term carewith reduced staffing. They have been successful principallyin preventing the addition of new facilities, including notopening acute wings already constructed. Some smallerprovinces have managed to convert small acute hospitals tohealth centers or long-term care facilities. Alberta has pro-vided new long-term care facilities as an added benefit with-out reducing acute hospital beds or costs. Some other prov-inces have accepted the use of small hospitals as multi-level-care facilities, with reduced staffing ratios; they thus havehigh "hospital" bed/population ratios and lengths of stay.
Table 3 shows the limited success of the Canadian Prov-inces as a whole in reducing hospital bed supply. It masksthe substantial efforts in some provinces, while other prov-
t: Calgary, Alta.; McMaster in Hamilton, Ontario, Memorial inNewfoundland; and Sherbrooke, Quebec.
AJPH September, 1978, Vol. 68, No. 9 885
COMMENTARIES
1. Medical Manpower 2. Facilities SupplySupply Controls Expenditure and
Quality ControlsFEDERAL GOVERNMENT lI
* Restricts MD PROVINCIALimmigration GOVERNMENTS
* Regional quotas ofspecialists topopulation
* Practice incentivesfor underservedareas
3. Medical QualityExpenditure andFraud Controls
NHEALTH MINISTE C I| ~~~~~~~~Commission
ospital insuranceplan
Prospective $annual operatingbudget review
$| PITALS|
Control allhospitalresidencytraining50% familypracticeresidentsCeilings onspecialistsin training
* Capitalexpenditureprior approval
* Control of bedsupply, equip-ment, newservices
* Qualityinspections
* Monitor util-ization andcosts
HEALTH PROFESSIONSBOARD
II I
Medical insurance COLLEGE OFplan PHYSICIANS
_ MEDICAL PROFESSION0Negotiate fee. .
* Medical
licensing anddiscipline(fines, lossof license)
* Standards, in-spection, MDoffice records
* Reduce fee, ard practicrecover $ * Investigate
* Require MD to complaintspractice out-side of plan
* Recommend forprosecution
| MEDICAL REVIEWCOMMITTEES I
ices
* Recommend reduction offee or recovery of $
FIGURE 1-Canadian Health Care System Control Structures
inces have chosen for various reasons not to attempt suchdrastic action. The 1976 hospital bed supply, utilization, andexpenditures data are anticipated shortly,* and should showa downward trend if the control program has been success-
ful.Surgical rates in Canada have always been high, even
before universal physicians' services insurance. Saskatche-wan has pioneered a successful program to reduce unneces-
sary surgery. Table 4 shows the reduction** in surgical utili-
*The hospital cost increase in Canada was down to 15.9 percent (1976 over 1975); from 21.3 per cent (1975 over 1974). Similarlythe total health care increase was down to 13.5 per cent from 17.6per cent. (Preliminary estimates Health and Welfare, Canada).
**There was an overall reduction in surgical rates province-wide, but some procedures that were encouraged as preferable-e.g., tubal ligations rather than hysterectomies in young women-increased.
zation for several common procedures in Saskatchewan15.This was not the result of peer review alone, but of threefactors: 1) a data base of rates of surgery by age, sex, opera-
tion, and geographic location that pinpointed the problemareas and surgeons; 2) a public authority that "moved in" on
the medical profession, forcing examination of pathology re-
ports and hospital records and indications for surgery, andbringing the problem to public attention through the media;and 3) a medical profession that, having outgrown the reflexreaction of automatically opposing government, was readyto clean house.
V. Manpower Policies
Canada had one doctor for every 608 persons in 1974,
AJPH September, 1978, Vol. 68, No. 9
EDUCATIONMINISTER
$University Hcgrants
IFMEDICAL SCHOOLS I
* Medicalgraduatessupply I
* Emphasizefamilypractice I 0
S
C
schedules,income ceilings
* Claims review
* Constructprofiles
* Patient verifi-cation of MDbillings
886

COMMENTARIES
TABLE 3-Trends in Hospital Use In Canadian Public GeneralHospitals
1968 1975
Beds* 5.4 5.2Admissions* 149 153Days of Care* 1547 1512Average Length of Stay 10.3 days 9.3 days
*per 1000 populationSource: Statistics Canada and Department of National Health and Wel-
fare
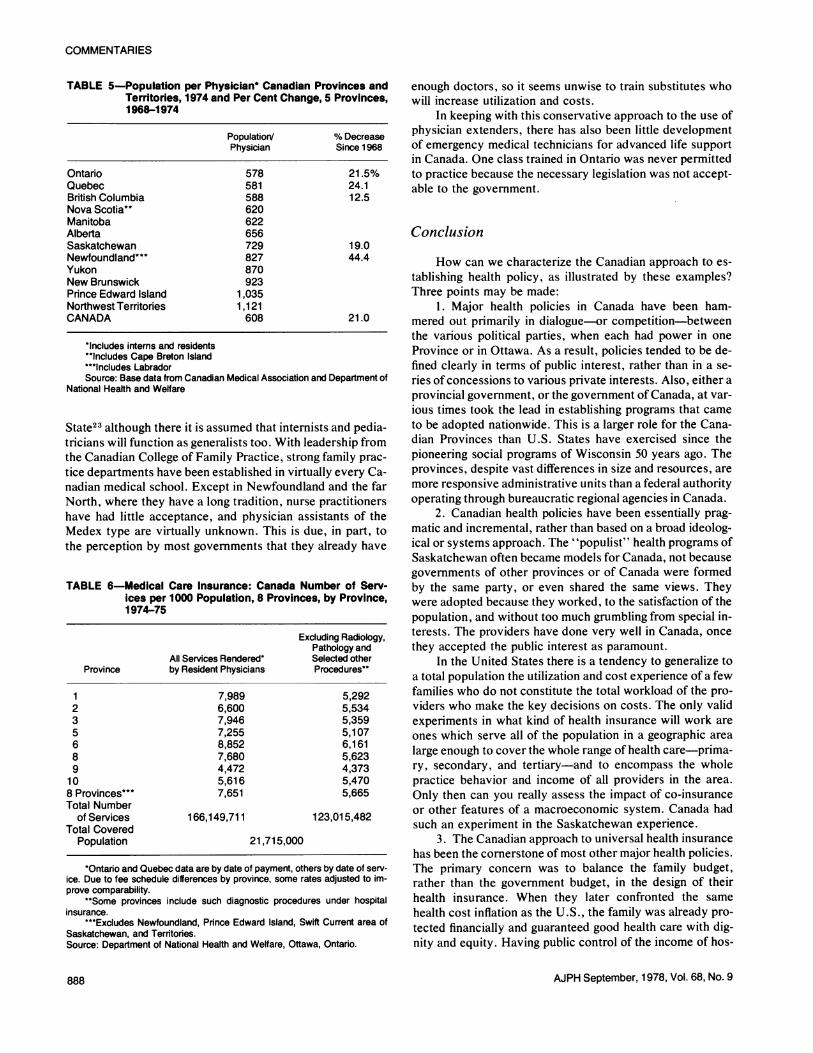
when the Ontario Health Minister secured the support ofQuebec in asking Ottawa to restrict the immigration of physi-cians. About one-half the doctors in Canada are general orfamily practitioners. There are still great disparaties in sup-ply between provinces, and to a lesser extent within prov-inces, as is apparent in Table 5. This table also shows thedramatic increase in physician supply since 1968.
Differential fee schedules and resulting differences inphysician incomes between provinces could be used to at-tract or discourage physician immigration between prov-inces, if a province could afford the former or endure its doc-tors' wrath invoked by the latter. Even before nationwidemedical insurance, health insurance administrators were em-phasizing that every new doctor in practice cost the countryan amount several times his income annually. Somers andSomers, in their recent survey article,16 cite studies estimat-ing the additional costs per physician as $200,000 a year ormore. Data from individual provinces' medicare programs,where they maintain files on each doctor's "generated"medical costs as well as income paid to him for medical serv-ices, arrive at somewhat similar average figures.
A satisfactory formula for estimating "generated" hos-pital costs has not been developed. It needs to take accountof hospital use had the additional doctors not come into thesystem. The provinces and the federal authority share theseextra health costs about equally, so the federal governmenthas felt that the provinces negotiated with providers on thebasis of "50 cent" dollars. The recent (1977) change in the
TABLE 4-Reduction in Surgical Rates-Saskatchewan 1973-1975
Surgical Procedure 1973 1974 1975
Rates/1,000 PopulationTonsillectomy and/orAdenoidectomy 6.21 5.76 5.38
Appendectomy 2.52 2.08 1.87Varicose Vein Ligation 1.54 1.12 1.07Cholecystectomy 4.02 3.52 3.27
Rate/1,000 FemalesHysterectomy (Abdominal) 4.18 3.04 2.39Salpingectomy, Ovariectomy
or Ovarian Cystectomy 2.36 1.31 0.89Tubal Ligation 6.16 7.27 7.46
Source: G. H. Hatcher, Fogarty International Center, National Institutes ofHealth
federal financing formula ensures a province a fairly definiteproportion of certain tax revenues, instead of a percentage ofits health insurance costs. It is expected this will encouragethe provinces to drive harder bargains with providers.
Each province and its medical association negotiate feeschedules or prices periodically; but rarely-and only re-cently-has utilization of physicians services been negoti-ated. Since Price x Use = Cost, and under fee-for-servicemore costly services can be substituted for cheaper feeschedule items, a slow but steady escalation in medical costsand utilization was the experience of each province. AnnualReports of the Medical Care Insurance Commissions or simi-lar agencies in each province must be examined carefully toestimate the actual increases, because of transfers betweenmedical and hospital insurance programs in some cases. Thefederal matching data for 1974-75 indicate an annual in-crease of about 8 per cent nationwide.17 LeClair has notedthat the per cent increases were greater before universal freemedicare than after.18 Provinces with more rapidly increas-ing physician/population ratios, as well as those with moregenerous price (fee) settlements with their doctors, had morerapid increases. Saskatchewan analyzes in each Annual Re-port of its Medical Care Insurance Commission, the contri-butions of each factor to its increased costs.19
Table 6 shows the levels of utilization of physiciansservices reached when new federal-provincial health man-power policies were commenced. These are generous levelsof care, and probably adequate even in the provinces withthe lowest rates. In the United States the rate is about fivephysician vists per person per year.20
Having accepted responsibility for providing care, pay-ing for it, and having a source of data on all doctors and allpatients through their health insurance programs, the Cana-dian Provinces have been studying the manpower issues. To-gether with the medical profession, the federal governmenthas recently analyzed medical specialty distribution and pro-ductivity, and graduate medical education output.21 Oneprovince (Quebec) has legislated, but not yet enforced, ceil-ings for the supply of the various medical specialists by geo-graphic region, who can be paid under health insurance. Theconviction is growing that physicians generate their own de-mand for care, and that control of excessive surgery and ex-cessive hospitalization depends on controlling the supplyand distribution of specialists.16' 22
Canadian medical manpower policy has now become re-strictive instead of expansionist, and increased supply is tar-geted to geographic areas defined as in short supply. Havingequal fee schedules through a province uses market forces toattract physicians to rural and other underserved areas, inaddition to special financing arrangements under medicare.This is because such areas usually have a higher population/physician ratio and lower practice costs than urban and sub-urban areas. It seems improbable that recommended ratiosof a given medical specialty to population will become morethan rough guidelines for allocation of funds for residencytraining.
The decision to retain at least the 50-50 ratio of generalpractitioners to specialists is a more firm policy in Canada.This ratio has recently been recommended for New York
AJPH September, 1978, Vol. 68, No. 9 887
COMMENTARIES
TABLE 5-Population per Physician* Canadian Provinces andTerritories, 1974 and Per Cent Change, 5 Provinces,1968-1974
Population/ % DecreasePhysician Since 1968
Ontario 578 21.5%Quebec 581 24.1British Columbia 588 12.5Nova Scotia** 620Manitoba 622Alberta 656Saskatchewan 729 19.0Newfoundland**' 827 44.4Yukon 870New Brunswick 923Prince Edward Island 1,035Northwest Territories 1,121CANADA 608 21.0
*Includes interns and residents"Includes Cape Breton Island***Includes LabradorSource: Base data from Canadian Medical Association and Department of
National Health and Welfare
State23 although there it is assumed that internists and pedia-tricians will function as generalists too. With leadership fromthe Canadian College of Family Practice, strong family prac-tice departments have been established in virtually every Ca-nadian medical school. Except in Newfoundland and the farNorth, where they have a long tradition, nurse practitionershave had little acceptance, and physician assistants of theMedex type are virtually unknown. This is due, in part, tothe perception by most governments that they already have
TABLE 6-Medical Care Insurance: Canada Number of Serv-ices per 1000 Population, 8 Provinces, by Province,1974-75
Excluding Radiology,Pathology and
All Services Rendered* Selected otherProvince by Resident Physicians Procedures"
1 7,989 5,2922 6,600 5,5343 7,946 5,3595 7,255 5,1076 8,852 6,1618 7,680 5,6239 4,472 4,373
10 5,616 5,4708 Provinces"** 7,651 5,665Total Number
of Services 166,149,711 123,015,482Total Covered
Population 21,715,000
*Ontario and Quebec data are by date of payment, others by date of serv-ice. Due to fee schedule differences by province, some rates adjusted to im-prove comparability.
"Some provinces include such diagnostic procedures under hospitalinsurance.
***Excludes Newfoundland, Pnnce Edward Island, Swift Current area ofSaskatchewan, and Territories.Source: Department of National Health and Welfare, Ottawa, Ontario.
enough doctors, so it seems unwise to train substitutes whowill increase utilization and costs.
In keeping with this conservative approach to the use ofphysician extenders, there has also been little developmentof emergency medical technicians for advanced life supportin Canada. One class trained in Ontario was never permittedto practice because the necessary legislation was not accept-able to the government.
Conclusion
How can we characterize the Canadian approach to es-tablishing health policy, as illustrated by these examples?Three points may be made:
1. Major health policies in Canada have been ham-mered out primarily in dialogue-or competition-betweenthe various political parties, when each had power in oneProvince or in Ottawa. As a result, policies tended to be de-fined clearly in terms of public interest, rather than in a se-ries of concessions to various private interests. Also, either aprovincial government, or the government of Canada, at var-ious times took the lead in establishing programs that cameto be adopted nationwide. This is a larger role for the Cana-dian Provinces than U.S. States have exercised since thepioneering social programs of Wisconsin 50 years ago. Theprovinces, despite vast differences in size and resources, aremore responsive administrative units than a federal authorityoperating through bureaucratic regional agencies in Canada.
2. Canadian health policies have been essentially prag-matic and incremental, rather than based on a broad ideolog-ical or systems approach. The "populist" health programs ofSaskatchewan often became models for Canada, not becausegovernments of other provinces or of Canada were formedby the same party, or even shared the same views. Theywere adopted because they worked, to the satisfaction of thepopulation, and without too much grumbling from special in-terests. The providers have done very well in Canada, oncethey accepted the public interest as paramount.
In the United States there is a tendency to generalize toa total population the utilization and cost experience of a fewfamilies who do not constitute the total workload of the pro-viders who make the key decisions on costs. The only validexperiments in what kind of health insurance will work areones which serve all of the population in a geographic arealarge enough to cover the whole range of health care-prima-ry, secondary, and tertiary-and to encompass the wholepractice behavior and income of all providers in the area.Only then can you really assess the impact of co-insuranceor other features of a macroeconomic system. Canada hadsuch an experiment in the Saskatchewan experience.
3. The Canadian approach to universal health insurancehas been the cornerstone of most other major health policies.The primary concern was to balance the family budget,rather than the government budget, in the design of theirhealth insurance. When they later confronted the samehealth cost inflation as the U.S., the family was already pro-tected financially and guaranteed good health care with dig-nity and equity. Having public control of the income of hos-
AJPH September, 1978, Vol. 68, No. 9888
COMMENTARIES
pitals and doctors through their health insurance program,when the inflation and recession hit, followed by the energycrisis, Canada's health care system weathered the storm bet-ter than other elements in the economy.
Universal free health care in Canada, run by the govern-ment, costs only one-fourth as much to administer as theU.S. co-insurance ridden public-private system.* All healthcare in Canada costs only about three-fourths as much as inthe U.S. Finally, what health status measures we have rateCanadians as healthier than white Americans,24 although itwould be rash to attribute this to their health care systemalone.
REFERENCES1. Roth, FB et al The Saskatchewan experience in payment for
hospital care. Am. J. Public Health 43:752-6, June 1953.2. Policy Considerations and Issues for National Health Insurance
U.S.D.H.E.W. Office of the Secretary. National health insur-ance-statement of issues. 4 pages, processed October 1977.
3. Statutes of Saskatchewan, an act for the provision of certaindental services in Saskatchewan, 1974. Regina, Sask.
4. Smisheck, W (The Honourable). The Saskatchewan pre-scription drug plan. Sask. Legislative Assembly April 17, 1974.Regina, Sask.
5. Alberta Social Services and Community Health, and HealthCare Insurance Commission: Alberta extended health benefitsprogram. Processed 1976, Edmonton, Alta.
6. Beck, RG. The effects of co-payment on the poor. J. of HumanResources, Winter 1974. Also see Andreopoulos, S (Editor).National health insurance-can we learn from Canada. Page 57,John Wiley & Sons, 1975.
7. Enterline, PE et al. The distribution of medical services beforeand after medicare-the Quebec experience. N. Eng. J. Med.289:1175-6, 1973.
8. Gibon R, Mueller M, and Fisher C: Age differences in healthcare spending. Social Security Bulletin August 1977. (Table 5)U.S.DHEW, Social Security Administration.
9. Statistics Canada (Annual Reports). Hospital statistics (Cat. 83-227 to 229). Hospital morbidity statistics (82-206); Surgical pro-cedures and treatments (82-209); and Medical services and asso-ciated diagnoses 1971 (82-533). Ottawa, Ont. KIA 026, 1977.
*Table 1, line 4. In 1975, U.S. costs were about $600 per per-son, and Canadian cost about $450 (U.S. dollars) per person.
10. Health and Welfare Canada, Health Economics & Statistics Di-vision. Earnings of physicians in Canada 1962-72; Expenditureon personal health care in Canada 1960-1971; Review of healthservices in Canada, 1975; Physician services provided undermedical care insurance in 5 Canadian provinces 1970-71 and1971-72; etc. Ottawa, Ont.
11. Badgley, R and Wolfe, S in Doctor's strike: medical care andconflict in Saskatchewan, MacMillan, Toronto 1967.
12. The Saskatchewan Statutes. The Saskatchewan medical care in-surance act, 1961. Regina, Sask.
13. Government of Canada, Minister of Finance. Attach on infla-tion. (Policy statement in House of Commons) October 14,1975, Hansard, Ottawa, Ont.
14. Ontario Ministry of Health. Constraints program review Jan.Feb. 1976, dated March 1976, pp. 114, Queen's Park, Toronto.
15. Saskatchewan Medical Care Insurance Commission. Annual re-ports 1974, 1975, Table 14., Regina, Sask.
16. Somers, H and Somers, A. A proposed framework for health,and health care policies. Inquiry XIV, p. 141, June 1977.
17. Health and Welfare Canada. Annual report medical care 1974-75. Ottawa, Ont. 1976.
18. Andreopoulos (Ed.) op. cit. (reference 6) page 79.19. Saskatchewan Medical Care Insurance Commission. Annual re-
ports 1974, 1975, op. cit. Analysis of per cent change in annualgross payments, Table 3, Regina, Sask.
20. U.S.D.H.E.W. National Center for Health Statistics. Currentestimates from the national health survey U.S. 1974, Table 20.Rockville, Md. Sept. 1975.
21. National Committee on Physician Manpower (Reports on) Re-quirements for physicians in Canada. Health and Welfare Cana-da, Ottawa, Ont., 1975 (There is a report for each specialty).
22. Vayda, E. A comparison of surgical rates in Canada and in Eng-land and Wales. N. Eng. J. Med. 289:1224 (Dec. 6, 1973).
23. State University of New York. Report of regents task force onmedical school enrollment and physician manpower. 1975, Al-bany, N.Y.
24. Cochrane, AL. World health problems, Canadian J. of PublicHealth 66:280-7, (July, Aug. 1975).
ACKNOWLEDGMENTSSupport is acknowledged from the Fogarty International Center
for Advanced Study in the Health Sciences, where the author wasVisiting Research Professor in 1975-76.
AJPH September, 1978, Vol. 68, No. 9 889