NUREG-0800 Final SRP Section 5.4.2.1, Revision 4, "Steam ...
Upload
khangminh22Category
view
1download
0
NUREG/IA-0127GRS-.101
International MPR--1346
Agreement Report
Reactor Safety IssuesResolved bythe 2D/3D ProgramEdited by:P. S. Damerell, J. W. Simons,MPR Associates, Inc.
Prepared Jointly by:Japan Atomic Energy Research InstituteGesellschaft fuer Anlagen-und ReaktorsicherheitSiemens AG, UB KWUU.S. Nuclear Regulatory CommissionLos Alamos National LaboratoryMPR Associates, Inc.
Office of Nuclear Regulatory ResearchU.S. Nuclear Regulatory CommissionWashington, DC 20555-0001
July 1993
Reprinted October 1993Prepared as part of Arrangement on Research Participation and Technical Exchange betweenthe Federal Minister for Research and Technology of the Federal Republic of Germany(BMFI) and the Japan Atomic Energy Research Institute (JAERI) and the United States Nu-clear Regulatory Commission (USNRC) in a Coordinated Analytical and Experimental Studyof the Thermo-hydraulic Behavior of Emergency Core Coolant during the Refill and RefloodPhase of a Loss-of-Coolant Accident in a Pressurized Water Reactor (the 2D/3D Program).
Published byU.S. Nuclear Regulatory Commission

NOTICE
This report was prepared under an international cooperative agree-ment for the exchange of technical information. Neither the UnitedStates Government nor any agency thereof, or any of their employ-ees, makes any warranty, expressed or implied, or assumes anylegal liability or responsibility for any third party's use, or the resultsof such use, of any information, apparatus product or process dis-closed in this report, or represents that its use by such third partywould not infringe privately owned rights.
Available from
Superintendent of DocumentsU.S. Government Printing Office
Mail Stop SSOPWashington, DC 20402-9328
and
National Technical Information ServiceSpringfield, VA 22161

NUREG/IA.-0127* GRS-101
International MPR-1346
Agreement Report
Reactor Safety IssuesResolved bythe 2D/3D ProgramEdited by-P. S. Damerell, J. W. Simons,MPR Associates, Inc.
Prepared Jointly by.Japan Atomic Energy Research InstituteGesellschaft fuer Anlagen-und ReaktorsicherheitSiemens AG, UB KWUU.S. Nuclear Regulatory CommissionLos Alamos National LaboratoryMPR Associates, Inc.
Office of Nuclear Regulatory ResearchU.S. Nuclear Regulatory CommissionWashington, DC 20555-0001
July 1993
Prepared as part of Arrangement on Research Participation and Technical Exchange betweenthe Federal Minister for Research and Technology of the Federal Republic of Germany(BMFT) and the Japan Atomic Energy Research Institute (JAERI) and the United States Nu-clear Regulatory Commission (USNRC) in a Coordinated Analytical and Experimental Studyof the Thermo-hydraulic Behavior of Emergency Core Coolant during the Refill and RefloodPhase of a Loss-of-Coolant Accident in a Pressurized Water Reactor (the 2D/3D Program).
Published byU.S. Nuclear Regulatory Commission


ABSTRACT
The 2D/3D Program studied multidimensional thermal-hydraulics in a PWR core andprimary system during the end-of-blowdown and post-blowdown phases; of a large-break LOCA (LBLOCA), and during selected small-break LOCA (SBLOCA) transients.The program included tests at the Cylindrical Core Test Facility (CCTF), the Slab CoreTest Facility (SCTF), and the Upper Plenum Test Facility (UPTF), ani computeranalyses using TRAC. Tests at CCTF investigated core thermal-hydraulics; and overallsystem behavior while tests at SCTF concentrated on multidimensional core thermal-hydraulics. The UPTF tests investigated two-phase flow behavior in the downcomer,upper plenum, tie plate region, and primary loops. TRAC analyses evaluated thermal-hydraulic behavior throughout the primary system in tests as well as in PWRs. Thisreport summarizes the test and analysis results in each of the main areas whereimproved information was obtained in the 2D/3D Program. The d'scussion isorganized in terms of the reactor safety issues investigated.
iii

TABLE OF CONTENTSPaae
EXECUTIVE SUMMARY xix
DEDICATION/FOREWORD xxiii
ACKNOWLEDGEMENTS xxv
1.0 INTRODUCTION 1-1
1.1 Background 1-11.2 Objectives of 2D/3D Program 1-21.3 Overview of 2D/3D Program 1-31.4 Organization of Report 1-4
2.0 SUMMARY AND SAFETY IMPLICATIONS 2-1
2.1 ECC Delivery to Lower Plenum during Depressurization 2-12.2 Entrainment in Downcomer during Reflood 2-22.3 Steam/ECC Interactions in Loops 2-32.4 Effect of Accumulator Nitrogen 2-42.5 Thermal Mixing of ECC and Primary Coolant 2-42.6 Core Thermal-hydraulic Behavior 2-52.7 Water Delivery to and Distribution in Upper Plenum 2-52.8 Water Carryover and Steam Binding with Cold Leg Injection 2-62.9 Hot Leg Countercurrent Flow 2-7
3.0 OVERALL SYSTEM BEHAVIOR DURING A LOCA 3-1
3.1 Cold Leg Injection Plant 3.1-1
3.2 Combined Injection Plant 3.2-1
3.3 Downcomer Injection Plants 3.3-1
3.3.1 US Downcomer Injection Plant 3.3.1-13.3.2 FRG Downcomer Injection Plant 3.3.2-13.3.3 Japanese Downcomer Injection Plant 3.3.3-1
3.4 Upper Plenum Injection (UPI) Plant 3.4-1
v
TABLE OF CONTENTS (Cont'd)
Pae
4.0 EVALUATION OF TESTS AND ANALYSES TOADDRESS KEY REACTOR SAFETY ISSUES 4-1
4.1 ECC Delivery to Lower Plenum duringDepressurization
4.1-14.1.1 Cold Leg Injection 4.1-74.1.2 Downcomer Injection 4.1-94.1.3 Combined Injection 4.1-12
4.2 Entrainment in Downcomer during Reflood 4.2-1
4.2.1 Cold Leg Injection 4.2-44.2.2 Downcomer Injection 4.2-74.2.3 Combined Injection 4.2-10
4.3 Steam/ECC Interactions in Loops 4.3-1
4.3.1 Cold Leg Injection 4.3-44.3.2 Hot Leg Injection 4.3-64.3.3 Combined Injection 4.3-8
4.4 Effect of Accumulator Nitrogen Discharge 4.4-1
4.5 Thermal Mixing of ECC and Primary Coolant 4.5-1
4.6 Core Thermal-hydraulic Behavior 4.6-1
4.6.1 Cold Leg lnjection/Downcomer Injectionwith and without Vent Valves 4.6-5
4.6.2 Upper Plenum Injection 4.6-104.6.3 Combined Injection 4.6-13
4.7 Water Delivery to and Distribution in the Upper Plenum 4.7-1
4.7.1 Upper Plenum Injection 4.7-44.7.2 Hot Leg Injection 4.7-6
vi

TABLE OF CONTENTS (Cont'd)
Page
4.8 Water Carryover and Steam Binding withCold Leg Injection 4.8-1
4.9 Hot Leg Countercurrent Flow 4.9-1
5.0 BIBLIOGRAPHY 5-1
6.0 ABBREVIATIONS AND ACRONYMS 6-1
7.0 NOMENCLATURE 7-1
APPENDICES
A. BRIEF DESCRIPTION OF TEST FACILITIES, INSTRUMENTATION ANDTESTS CONDUCTED A.1-1
A.1 Cylindrical Core Test Facility (CCTF) A.1-1
A.1.1 Facility Description A.1-1A.1.2 Catalog of Tests A.1-7
A.2 Slab Core Test Facility (SCTF) A.2-1
A.2.1 Facility Description A.2-1A.2.2 Catalog of Tests A.2-5
A.3 Upper Plenum Test Facility (UPTF) A.3-1
A.3.1 Facility Description A'3-1A.3.2 Catalog of Tests A.3-8
B. TRAC COMPUTER CODE DESCRIPTION AND LIST OF ANALYSES B-1
B.1 Evolution of TRAC and Description of TRAC-PF1/MOD2 B.1-1
B.2 Catalog of Analyses B.2-1
B.2.1 PWR Analyses B.2-1B.2.2 CCTF Test Analyses B.2-1B.2.3 SCTF Test Analyses B.2-1B.2.4 UPTF Test Analyses B.2-1
vii
LIST OF FIGURES
Page
3.1-1 Calculated Pressure Transient for US/J PWR withCold Leg Injection 3.1-7
3.1-2 Calculated Rod Temperature Transient for US/J PWR withCold Leg Injection 3.1-8
3.1-3 Summary of LBLOCA Behavior in a Cold Leg Injection PWR,End-of-Blowdown/Refill Phase 3.1-9
3.1-4 Summary of LBLOCA Behavior in a Cold Leg Injection PWR,Early Reflood (Accumulator Injection) 3.1-9
3.1-5 Summary of LBLOCA Behavior in a Cold Leg InjectionPWR Shortly After N2 Injection Starts 3.1-10
3.1-6 Summary of LBLOCA Behavior in a Cold Leg InjectionPWR during N2 Injection 3.1-10
3.1-7 Summary of LBLOCA Behavior in a Cold Leg Injection PWR,Late Reflood (LPCI) 3.1-11
3.2-1 Overall System Behavior in a Combined Injection IntegralTest at UPTF (Test No. 18) 3.2-4
3.2-2 Summary of LBLOCA Behavior in a Combined Injection PWR,End-of-Blowdown/Refill Phase 3.2-5
3.2-3 Summary of LBLOCA Behavior in a Combined Injection PWR,Reflood Phase 3.2-5
3.3.1-1 Summary of LBLOCA Behavior in a B&W PWR,
End-of-Blowdown/Refill 3.3.1-7
3.3.1-2 Summary of LBLOCA Behavior in a B&W PWR, Reflood 3.3.1-7
3.3.2-1 ECCS Configuration for MK PWR 3.3.2-4
3.3.2-2 Summary of LBLOCA Behavior in the MK PWR,End-of-Blowdown/Refill 3.3.2-5
.3.3.2-3 Summary of LBLOCA Behavior in the MK PWR, Reflood 3.3.2-5
viii
Paaie
3.3.3-1 ECCS Configuration for Japanese PWRs withDowncomer Injection 3.3.3-6
3.4-1 Summary of LBLOCA Behavior in a UPI PWR,
Late Reflood 3.4-3
4.1-1 PWR End-of-Blowdown Phenomena in the Downcomer 4.1-16
4.1-2 Steam Injection and ECC Delivery Rates for UPTFCold Leg Injection Tests 4.1-17
4.1-3 Example Subcooling Contour Plot for UPTF Cold LegInjection Tests (Reference G-907) 4.1-17
4.1-4 Glaeser Correlation of ECC Delivery in UPTF Cold LegInjection Tests (Reference G-415) 4.1-18
4.1-5 Best-Fit of Dimensionless Steam and Delivery Rates forUPTF Cold Leg Injection Tests (Reference U-455) 4.1-19
4.1-6 Effect of Scale Factor on Calculated jg* for ECC Injectionto all Cold Legs (Reference U-455) 4.1-20
4.1-7 Comparison of End-of-Blowdown/Refill Transients in theCold Leg Injection Tests at UPTF and CCTF (Reference U-455) 4.1-21
4.1-8 TRAC/Data Comparison of Delivery Rates for UPTF Cold LegInjection Tests 4.1-22
4.1-9 Steam Injection and Delivery Rates for UPTF DowncomerInjection Tests 4.1-23
4.1.10 Example Subcooling Contour Plot for UPTF DowncomerInjection Tests (Reference G-221) 4.1-24
4.1-11 Comparison of UPTF and Typical B&W PWR Hot/Cold Leg,and Downcomer Injection Nozzle Arrangement 4.1-25
4.2-1 PWR Reflood Phenomena in the Cold Leg/Downcomer Region 4.2-12
4.2-2 Siemens Downcomer Level/Entrainment Correlation forUPTF Cold Leg Injection Tests (Reference G-41 1) 4.2-13
ix
PaQe
4.2-3 MPR Downcomer Level/Entrainment Correlation forUPTF Cold Leg Injection Tests (Reference U-455) 4.2-14
4.2-4 Comparison of Upper Downcomer Dimensions andEffect on Dimensionless Velocity 4.2-15
4.2-5 Downcomer Wall Steam Generation and Effect on DowncomerWater Level in CCTF Cold Leg Injection Test (Reference U-455) 4.2-16
4.2-6 Estimated Downcomer Water Level in a Cold Leg InjectionPWR during Reflood (Reference U-455) 4.2-17
4.2-7 Downcomer Void Height Versus Steam Flow for UPTFDowncomer Injection Tests (Reference U-460) 4.2-18
4.2-8 Comparison of UPTF and CCTF Results for DowncomerInjection with Downcomer Entrainment Correlation forCold Leg Injection (Reference U-460) 4.2-19
4.3-1 Cold Leg Flow Regimes 4.3-12
4.3-2 Cold Leg Flow Regime Data from UPTF Cold LegInjection Tests (Reference U-458) 4.3-13
4.3-3 Condensation Efficiency for Stratified Flow Conditionsin UPTF Cold Leg Injection Tests (Reference U-458) 4.3-13
4.3-4 Effect of Scale and Nozzle Orientation on theTransition from Plug to Stratified Flow in theCold Legs (Reference U-458) 4.3-14
4.3-5 Hot Leg Flow Regime Data from UPTF Hot LegInjection Tests (Reference G-41 1) 4.3-15
4.3-6 Comparison of Results from Creare Hot LegCountercurrent Flow Tests with TheoreticalCurve for Stable Plug Flow (Reference G-41 1) 4.3-16
4.4-1 Initial Changes in Core and Downcomer WaterLevels and Suppression of Steam Condensationdue to Accumulator N2 Pressurization of Downcomer 4.4-9
x
Page
4.4-2 PWR LOCA Conditions Just Before Accumulator WaterInjection Ends and N2 Discharge Begins 4.4-10
4.4-3 PWR LOCA Conditions Just After N2 Discharge Begins 4.4-10
4.4-4 PWR LOCA Conditions Maximum Core Level duringN2 Discharge 4.4-11
4.4-5 PWR LOCA Conditions Near End of N2 Discharge 4.4-11
4.4-6 Corrected Core and Downcomer Water Levels forUPTF Test 27A (Reference U-459) 4.4-12
4.4-7 Composition of Steam/Nitrogen Mixture in Downcomerand Cold Leg during UPTF Test 27A (Reference U-459) 4.4-13
4.4-8 TRAC/Data Comparison of Vessel Pressures duringNitrogen Discharge for UPTF Test 27A (Reference U-716) 4.4-14
4.5-1 Diagram of ECC Stratification in Cold Leg andDowncomer of a PWR 4.5-4
4.5-2 Vertical Fluid Temperature Distribution inCold Leg for UPTF Test 1 4.5-5
4.5-3 Dimensionless Fluid Temperature along DowncomerCenterline 500 Seconds after Start of ECCInjection for UPTF Test 1 4.5-6
4.6-1 Heat Transfer and Hydraulic Flow Regimes for
Bottom Reflood (Reference E-459) 4.6-20
4.6-2 Void Fraction in Core 4.6-21
4.6-3 Quench Front Propagation and Core CollapsedUquid Level 4.6-22
4.6-4(a) Parameter Effects on Clad Temperature 4.6-23
4.6-4(b) Parameter Effects on Clad Temperature 4.6-24
xi

Page
4.6-5 Effect of Peak Power Ratio on Heat TransferCoefficient in SCTF 4.6-25
4.6-6 TRAC/Data Comparison of DifferentialPressures for CCTF Test C2-16 4.6-26
4.6-7 TRAC/Data Comparison of Rod Temperatures forCCTF and SCTF Tests 4.6-27
4.6-8 TRAC/Data Comparison of TurnaroundTemperatures for SCTF Core-Ill Tests 4.6-28
4.6-9 TRAC/Data Comparison of Core DifferentialPressures for CCTF Test C2-4 4.6-29
4.6-10 Apparent Preferential Water Downflow Region(Shaded) Inferred from Core Temperature Responsein CCTF-11 UPI Base Case Test 4.6-30
4.6-11 Quench Times at 3.05 Meter Elevation inCCTF UPI and Cold Leg Injection Tests 4.6-31
4.6-12 Cladding Temperatures with CombinedECC-Injection, SCTF Run 717 4.6-32
4.6-13 Comparison of Cladding Temperatures withContinuous and Intermittent ECC-Injection,SCTF Run 717 and Run 724 4.6-32
4.6-14 Range of Cladding Temperature HistoriesCalculated with TRAC using UcensingAssumptions Compared to a ConservativeUcensing Calculation 4.6-33
4.7-1 Upper Plenum Phenomena during Reflood
in a UPI PWR 4.7-13
4.7-2 Upper Plenum Phenomena with Hot Leg Injection 4.7-14
4.7-3 Breakthrough Flow Area versus Scale Factor(Reference U-454) 4.7-15
xii

Page
4.7-4 Downflow versus Scale Factor (Reference U-454) 4.7-15
4.7-5 Hot Leg Water Carryover versus Scale Factor(Reference U-454) 4.7-16
4.7-6 Non-Dimensional Collapsed Liquid Level inUpper Plenum versus Scale Factor (Reference U-454) 4.7-16
4.7-7 Downflow Area versus ECC-Injection Rate for UPTF HotLeg Injection Tests 4.7-17
4.7-8 Dimensionless Gas Velocity versus Facility Scalefor Tie Plate CCFL with Hot Leg Injection 4.7-17
4.8-1 Steam Binding Phenomena in a PWR during Reflood 4.8-10
4.8-2 Upper Plenum Equilibrium Liquid Inventory Correlationfor UPTF Separate Effects Tests and Comparison toScaled Facilities (Reference U-456) 4.8-11
4.8-3 Hot Leg Equilibrium Liquid Inventory Correlation fromUPTF Separate Effects Tests and Comparison to OtherUPTF Tests and SCTF-ll (Reference U-456) 4.8-12
4.8-4 SG Inlet Plenum Equilibrium Liquid Inventory Correlationfrom UPTF Separate Effects Tests and Comparison toCCTF-II Data (Reference U-456) 4.8-13
4.8-5 Behavior for a Best-Estimate Transient forUPTF Test 17B (Reference U-456) 4.8-14
4.8-6 Predicted Water Accumulation in US/J PWRs for a
Best-Estimate Transient (Reference U-456) 4.8-15
4.8-7 Effect of Steam Binding on Peak Clad Temperature 4.8-16
4.9-1 Reflux Condensation Flow Paths 4.9-9
4.9-2 Steam/Water Flow Relationship from UPTF Hot LegSeparate Effects Test (Reference U-452) 4.9-10
xiii

Page
4.9-3 Comparison of UPTF Data to Theoretical Models andCorrelations from Small-Scale Tests 4.9-11
4.9-4 Comparison of Experimental Results from UPTF toCalculated Predictions of CCFL (Reference U-452) 4.9-12
4.9-5 Comparison of UPTF Void Fraction Measurements toWallis Flooding Correlation (Reference U-452) 4.9-13
4.9-6 Comparison of UPTF Data to Computer Analyses 4.9-14
4.9-7 Comparison of Small-Scale Facility RefluxCondensation Experimental Results to UPTFTest Results (Reference U-452) 4.9-15
A.1 -1 Cylindrical Core Test Facility (CCTF) A.1-15
A.1 -2 Schematic Diagram of CCTF Main Parts A.1-16
A.1-3 CCTF Core-lI Pressure Vessel A.1-17
A.1 -4 CCTF Pressure Vessel Cross Sections A.1 -18
A.1-5 CCTF Heater Rod Geometry A.1 -19
A.2-1 Overview of Slab Core Test Facility A.2-7
A.2-2 Vertical Cross Section of SCTF Core-IlPressure Vessel A.2-8
A.2-3 Horizontal Cross Sections of theSCTF Core-I and -II Pressure Vessel atFour Elevations A.2-9
A.3-1 UPTF Primary System A.3-14
A.3-2 UPTF Flow Diagram A.3-15
A.3-3 UPTF Test Vessel A.3-16
A.3-4 UPTF Core Simulator Injection System A.3-17
xiv
Page
A.3-5 UPTF Core Upper/Plenum Interface A.3-18
A.3-6 UPTF Steam Generator Simulators andWater Separators A.3-19
A.3-7 UPTF Pump Simulator A.3-20
A.3-8 UPTF Containment Simulator A.3-21
A.3-9 UPTF ECC Injection System Flow Diagram A.3-22
xv
LIST OF TABLES
Paae
3.1-1 ECC System Design Parameters for PWRs withCold Leg Injection 3.1-6
3.3.1-1 ECC System Design Parameters for B&W PWRs 3.3.1-6
3.3.3-1 ECC System Design Parameters for JapanesePWRs with Downcomer Injection 3.3.3-5
4.1-1 Summary of Tests Related to ECC Deliveryduring Depressurization 4.1-14
4.2-1 Summary of Tests Related to DowncomerEntrainment during Reflood 4.2-11
4.3-1 Summary of Tests Related to Steam/ECCInteraction in the Loops 4.3-10
4.4-1 Summary of Tests and Analyses Addressingthe Effect on Nitrogen Discharge fromECC Accumulators 4.4-6
4.4-2 Summary of Results from 2D/3D Tests thatInvestigated the Effect of the Dischargeof Nitrogen from ECC Accumulators 4.4-7
4.4.3 Summary of Results from TRAC PWR Analysesthat Investigated the Effect of theDischarge of Nitrogen from ECC Accumulators 4.4-8
4.6-1 Summary of Test Facilities Related toCore Thermal-Hydraulic Behavior 4.6-17
4.6-2 Summary of Parameter Effects on Core HeatTransfer for Bottom Flooding Tests 4.6-19
4.7-1 Summary of Tests and Analyses Related toUPI Phenomena 4.7-9
xvi
Paae
4.7-2 Summary of Tests and Analyses Related toUpper Plenum Water Delivery and Distributionwith Hot Leg Injection 4.7-10
4.8-1 Summary of Tests and Analyses Related toWater Carryover and Steam Binding 4.8-8
4.9-1 Summary of Tests and AnalysesAddressing Hot Leg Countercurrent Flowand Reflux Condensation 4.9-6
4.9-2 Comparison of Hot Leg CCFL Tests 4.9-7
A.1-1 CCTF and SCTF Tests A.1-8
A.3-1 UPTF Tests A.3-10
B.2-1 TRAC PWR and Related Calculations B.2-2
B.2-2 TRAC Analyses of CCTF Core-I Tests B.2-6
B.2-3 TRAC Analyses of CCTF Core-Il Tests B.2-7
B.2-4 TRAC Analyses of SCTF Core-I Tests B.2-9
B.2-5 TRAC Analyses of SCTF Core-Il Tests B.2-10
B.2-6 TRAC Analyses of SCTF Core-Ill Tests B.2-11
B.2-7 TRAC Analyses of UPTF Tests B.2-12
xvii

EXECUTIVE SUMMARY
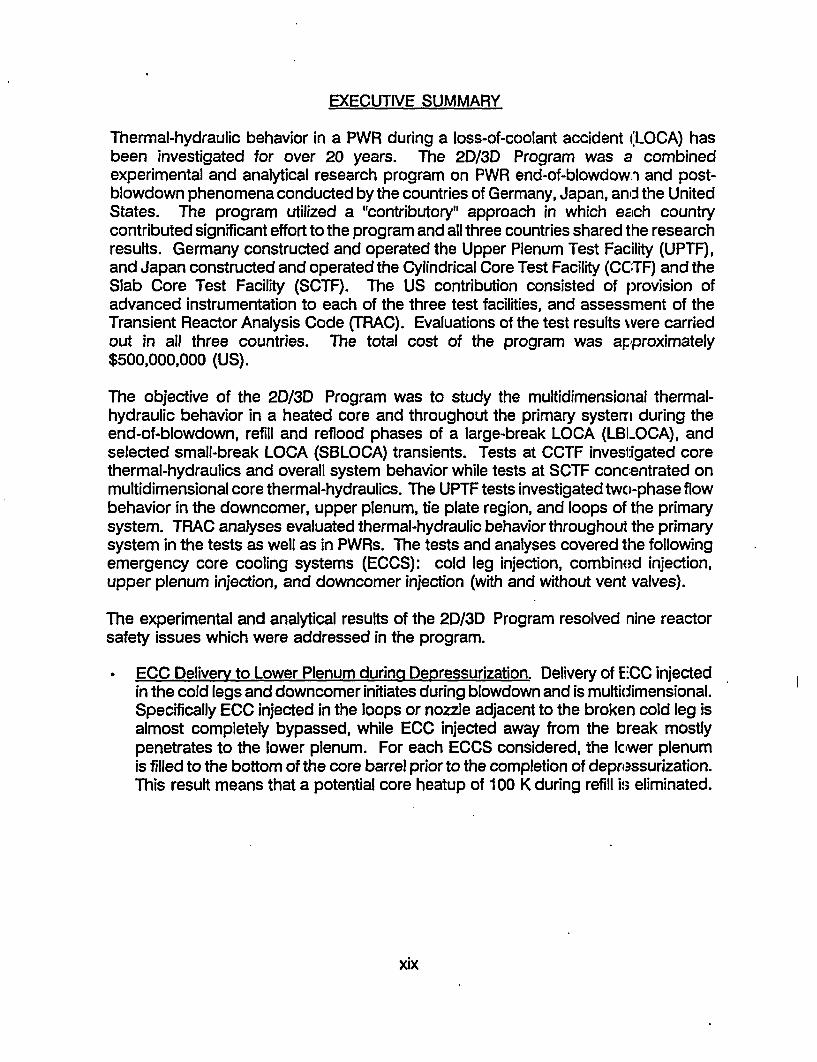
Thermal-hydraulic behavior in a PWR during a loss-of-coolant accident (:LOCA) hasbeen investigated for over 20 years. The 2D/3D Program was a combinedexperimental and analytical research program on PWR end-of-blowdow. and post-blowdown phenomena conducted by the countries of Germany, Japan, and the UnitedStates. The program utilized a "contributory" approach in which each countrycontributed significant effort to the program and all three countries shared the researchresults. Germany constructed and operated the Upper Plenum Test Facility (UPTF),and Japan constructed and operated the Cylindrical Core Test Facility (CC:TF) and theSlab Core Test Facility (SCTF). The US contribution consisted of provision ofadvanced instrumentation to each of the three test facilities, and assessment of theTransient Reactor Analysis Code (TRAC). Evaluations of the test results wvere carriedout in all three countries. The total cost of the program was approximately$500,000,000 (US).
The objective of the 2D/3D Program was to study the multidimensional thermal-hydraulic behavior in a heated core and throughout the primary system during theend-of-blowdown, refill and reflood phases of a large-break LOCA (LBLOCA), andselected small-break LOCA (SBLOCA) transients. Tests at CCTF investigated corethermal-hydraulics and overall system behavior while tests at SCTF concentrated onmultidimensional core thermal-hydraulics. The UPTF tests investigated two-phase flowbehavior in the downcomer, upper plenum, tie plate region, and loops of the primarysystem. TRAC analyses evaluated thermal-hydraulic behavior throughout the primarysystem in the tests as well as in PWRs. The tests and analyses covered the followingemergency core cooling systems (ECCS): cold leg injection, combined injection,upper plenum injection, and downcomer injection (with and without vent valves).
The experimental and analytical results of the 2D/3D Program resolved nine reactorsafety issues which were addressed in the program.
ECC Delivery to Lower Plenum during Depressurization. Delivery of ECC injectedin the cold legs and downcomer initiates during blowdown and is multidimensional.Specifically ECC injected in the loops or nozzle adjacent to the broken cold leg isalmost completely bypassed, while ECC injected away from the break mostlypenetrates to the lower plenum. For each ECCS considered, the lower plenumis filled to the bottom of the core barrel prior to the completion of depressurization.This result means that a potential core heatup of 100 K during refill is eliminated.
xix
Entrainment in Downcomer during Reflood. With cold leg ECC injection ordowncomer ECC injection with vent valves, the downcomer water level during latereflood is reduced up to 1 m below the cold leg elevation by the combination ofwall boiling and water entrainment in the downcomer steam flow. The increasein the reflood peak clad temperature (PCT) due to the reduction in downcomerdriving head is estimated to be 15 K.
Steam/ECC Interactions in Loops. With cold leg or hot leg ECC injection,stratified flow always occurs when the condensation potential of the ECC is lessthan the steam flow. Plug flow occurs only when the condensation potential of theECC exceeds the steam flow. Regardless of flow regime, a substantial amountof steam is condensed in the loops, and almost all ECC is delivered to the reactorvessel.
Effect of Accumulator Nitrogen. The discharge of nitrogen from accumulatorsconnected to the cold legs or downcomer causes a sudden high flow of nitrogeninto the primary system which pressurizes the top of the downcomer causing asurge of water into the core. Although core heat transfer was not covered in the2D/3D tests, TRAC analyses predict the hottest parts of the core are quenchedby the surge in core water level.
Thermal Mixing of ECC and Primary Coolant. For ECC injection into the cold legswhile the loops are stagnated, ECC entering the downcomer is significantlywarmed by mixing in the cold leg and the resultant plume of cooler water in thedowncomer decays quickly. These results suggest that ECC injection into water-filled cold legs does not cause severe local changes in fluid temperature at thevessel wall which could lead to pressurized thermal shock.
Core Thermal-hydraulic Behavior. Core cooling is adequate for the ECCS typesinvestigated. Behavior in the core during reflood is influenced by two-phase andmultidimensional flow phenomena.
- In the bottom flooding case, water is quickly carried to the upper regionsof the core with the steam flow. This two-phase flow establishes good corecooling above the quench front. Also, the lateral water distribution is nearlyuniform due to efficient lateral redistribution.
xx
With top injection (i.e., hot leg or upper plenum injection), water flows downthrough the core in local regions while a two-phase steam/water mixtureflows up to the upper plenum in the remainder of the core. Core coolingis enhanced in the water downflow regions relative to the two-p'hase upflow(i.e., bottom flooding) region. Note that, since water downflow to the coreinitiates during end-of-blowdown/refill, core cooling in the downflow regionsactually initiates prior to reflood.
Water Delivery and Distribution in the Upper Plenum. For hot leg or upper plenuminjection, downflow of ECC from the upper plenum to the core occurs in localregions below the injection locations, and is not limited by countercurrent flow atthe tie plate. Also, most of the steam upflow from the core is condensed in theupper plenum or hot legs, and returned to the core with the water downflow.
Water Carryover and Steam Binding with Cold Leg Iniection. With cold leg ECCinjection, water carryover to the steam generator tube regions is delayed about 20to 30 seconds by de-entrainment and accumulation in the upper plenum, hot legs,and steam generator inlet plena. It is estimated that de-entrainment .upstream ofthe tube regions reduces the reflood PCT by about 180 K relative to the situationwhere no de-entrainment occurs.
* Hot Leg Countercurrent Flow. Uninhibited water runback in the hot legs isexpected for reflux-condenser conditions of an SBLOCA.
Tests and analyses from the 2D/3D Program have allowed a relatively completeunderstanding of ECCS performance during the end-of-blowdown, refill, and refloodphases of an LBLOCA to be developed. The adequacy of existing systems has beenconfirmed, and the margin associated with traditional, conservative evaluationapproaches has been quantified.
xxi

DEDICATION/FOREWORD
In the mid-seventies experiments and analytical evaluations revealed thatmultidimensional thermal-hydraulic phenomena could have significant impact on loss-of-coolant accident (LOCA) transients in PWRs. But even the largest test facilities inoperation at that time (e.g., LOFT, LOBI, or PKL) were scaled down geometrically bytwo or three orders of magnitude. Therefore these facilities could not resolve theissues associated with multidimensional effects on emergency core cooling.
In addition, safety evaluations in the framework of licensing procedures for nuclearpower plants employed conservative assumptions and calculational models toenvelope the key parameters of principal safety significance. But in the la:e seventiesthe need for best-estimate evaluation of core damage to be expected during a LOCAwas recognized. Such analyses were needed for risk assessment studies.
To meet these needs, comprehensive thermal-hydraulic investigations in a single, full-scale test facility were evaluated, but this approach was found to be too expensive andtechnically impractical. In searching for more practical solutions, the authors and otherscientists engaged in reactor safety research in Germany, Japan and the US,developed a vision to resolve this problem by combining and adjusting the reactorsafety research programs conducted in the three respective countries. They proposedto couple the Japanese 1/20-scale heated core experimental program's CCTF andSCTF, with the German full-scale Upper Plenum Test Facility. The Japanese heated-core facilities would concentrate on one-dimensional and two-dimensional affects whilethe UPTIF would test full-scale multidimensional effects using a core simulator. Eachof the facilities would be outfitted with advanced instrumentation for evauating localtwo-phase flow phenomena. The connecting link would be the multidimensionalcomputer code TRAC. Both TRAC and the instrumentation were to be developed andsupplied by the US. The authors proposed this approach to governmentrepresentatives who were responsible for reactor safety research in their respectivecountries. The governments eventually approved the proposed approach and thetrilateral 2D/3D Program was brought to reality.
The 2D/3D Program lasted about 15 years and cost approximately $500 million (US)in total. It is the largest research program ever conducted in the field of reactor safety.Today, the excellent results justify the time and funds expended upon thisextraordinary program. All major questions which arose concerning tlie influencemultidimensional thermal-hydraulic effects may have on emergency core coolingprocesses during design basis accidents have been answered. The technical resultsand the experience gained by the 2D/3D Program enable us today to clolse the issuesabout design basis accidents and concentrate in the future on issues arising frombeyond design basis events and accident management. Work on these issues willfurther improve the safety of nuclear energy production.
F. Mayinger L S. Tong. M. Nozawa
xxiii


ACKNOWLEDGEMENTS
This report summarizes the efforts of countless engineers, scientists, technicians, andsupport personnel in each of the three participating countries. The Proje•ct Leaderswould like to thank each of these individuals for their contribution to the overallsuccess of the 2D/3D Program.
"Reactor Safety Issues Resolved by the 2D/3D Program" was prepared jointly bypersonnel from the three participating countries. Specific people who have contributedin the preparation and review of this report are summarized below by organization.
GRSR. ZipperK. LieschB. RiegelI. Vojtek
USNRC
SiemensP. WeissF. DepischR. EmmerlingJ. Liebert
INEL
TUMF. Mayinger
LANL
JAERIY. MuraoT. IguchiFl. AkimotoT. IwamuraT. OkuboA. OhnukiY. Abe
MPR
F. DamerellJ. SimonsK CardanyE. ClaudeA. RussellM. SmithF. VollmerK Wolfe
G. RheeL. Shotkin
S. Naff D. Siebe
The editors would like to thank Ms. C. M. Christakos of MPR for her assistance inpreparing this report.
xxv

Section 1
INTRODUCTION
1.1 BACKGROUND
Historical Perspective
The thermal-hydraulic response of a PWR primary coolant system to a Loss;-of-CoolantAccident (LOCA) and the performance of the Emergency Core Cooling System(ECCS) have been areas of research interest for two decades. The primary objectiveof LOCA/ECCS research has been to improve the understanding and modeling of thephenomena so that safety margins can be better quantified and more realisticevaluation approaches can be utilized. Initially, the focus of the research was thedepressurization (blowdown) transient. Later the focus shifted to include the post-blowdown phases (refill and reflood).
The 2D/3D Program was the major program on PWR end-of-blowdowl and post-blowdown phenomena for the countries of Germany, Japan, and the United States.The formal program name is 'The International Program on the Thermal-HydraulicBehavior of ECC during the Refill and Reflood Phases of a LOCA in a PWR". Thecommon name became "2D/3D Program" because refill/reflood phenomena arestrongly influenced by multidimensional (20 and 3D) effects.
Participants in 2D/3D Program
The participants in the 2D/3D Program were the governments of the Federal Republicof Germany (FRG), Japan, and the United States of America (US) as represented bythe following agencies:
" The Federal Ministry for Research and Technology (BMFT) in FRG.
• The Japan Atomic Energy Research Institute (JAERI) in Japan.
" The US Nuclear Regulatory Commission (USNRC) in the US.
1-1

The 2D/3D Program used a "contributory" approach. Each of the three participantscontributed significant effort to the program and all three countries shared the researchresults. There was no exchange of funds between the participants. This approachfostered technical cooperation among the three countries.
Scope of 2D/3D Program
In general terms, the scope of the 2D/3D Program was PWR LOCA post-blowdownphenomena. Sections 1.2 and 1.3 present a more detailed discussion of the specificobjectives and approach of the program. The major facilities in the 2D/3D Programconstituted some of the largest and most sophisticated thermal-hydraulic facilities everemployed. This is reflected in the combined financial commitment of the threeparticipants which exceeded the equivalent of US $500,000,000.
Purpose and Scope of this Report
This report presents a summary of the 20/3D Program in terms of the reactor safetyissues investigated. The major issues are discussed individually and the findings,conclusions, and resolutions based on all of the relevant tests and analyses arepresented. This report is a companion to another report entitled "21/3D ProgramWork Summary Report," which summarizes the principal test and analysis results ofthe program in terms of the contributing efforts of the participants.
Availability of Results from 2D/3D Program
Numerous reports document the detailed results from the 2D/3D Program; many arecited in this report. Most of these reports have a restricted availability per the2D/3D Program International Agreement. The detailed reports have been madeavailable to users in the three host countries for the purposes of improving reactorsafety.
1.2 OBJECTIVES of 2D/3D PROGRAM
As previously discussed, the overall objective of the 21/3D Program was to study thepost-blowdown phases of a PWR LOCA, and to provide improved experimental dataand analysis tools for this transient. The detailed objectives of the 2D/3D Program aresummarized below.
1. Study the effectiveness of ECC systems (including cold leg injection, combinedinjection, upper plenum injection, and downcomer injection) during the end-of-blowdown and refill phases of a large, cold leg break LOCA by evaluating:
1-2

* Penetration of ECC to the lower plenum during high flows that exist at end-of-blowdown.
* Condensation of steam by ECC.
* lUquid storage in cold legs, downcomer, upper plenum, and hot legs.
* The liquid flow pattern through the core (for hot leg and upper plenuminjection) and resultant core cooling.
2. Study the effectiveness of several types of ECC systems during the re'•Iood phaseof a large break LOCA by evaluating:
* Entrainment, storage, and transport of liquid water in the upper core, upperplenum, hot legs, and steam generators.
* Vaporization of entrained water in steam generators.
* Steam condensation by ECC near injection points.
* Steam/ECC interaction and flow patterns, particularly in regions betweenthe ECC injectors and the core.
• ECC flow rate to the core.
* Convective flow patterns and heat transfer in the core.
o Downcomer driving head and loop pressure drop.
3. Study selected phenomena from other transients; e.g., hot leg steam/watercountercurrent flow during a small break LOCA (SBLOCA), fluid/fluid mixing duringa pressurized thermal shock event, and high pressure ECC injection into the hotlegs during an SBLOCA in which the core uncovers.
1.3 OVERVIEW OF 2D/3D PROGRAM
The objectives of the 2D/3D Program were addressed using a combinedexperimental/analytical approach. Three major facilities were designed, fabricated,and operated within the 2D/3D Program.
1-3

. Cylindrical Core Test Facility (CCTF) in Japan
" Slab Core Test Facility (SCTF) in Japan
" Upper Plenum Test Facility (UPTF) in FRG
The design of each facility involved input from all three countries. Advancedinstruments were designed and fabricated by the US for use in all three facilities.
Evaluations of the experimental data were carried out in all three countries. A majoranalysis program involving the assessment and use of a best-estimate computer codewas carried out in the US. The computer code is the Transient Reactor Analysis Code(TRAC).
1.4 ORGANIZATION OF REPORT
The main body of this report is in Sections 3 and 4. Section 3 covers PWR LOCAbehavior based on the results of the 2D/3D Program. Several types of PWR ECCSconfigurations are covered individually in Section 3. Section 4 covers the reactorsafety issues individually. For each issue, the phenomena and their importance aredefined, the tests and analyses related to the issue are identified, and the conclusionsand applications to PWRs are discussed.
1-4

Section 2
SUMMARY AND SAFETY IMPLICATIONS
As discussed in Section 1, the objectives of the 2D/3D Program were to studythermal-hydraulic phenomena occurring during the end-of-blowdown, refill, and refloodphases of a large break LOCA and selected other transients. In Section 4 of thisreport, the program results are discussed in the form of nine separate "issues". An"issue" refers to a set of phenomena occurring in a specific location or region duringa specific time frame. A summary of key program results and their implications forsafety is discussed below for each of the nine issues. Within each issue, t:he types ofECC injection affected by the issue are identified.
2.1 ECC DELIVERY TO LOWER PLENUM DURING DEPRESSURIZATION
A key issue with regard to core cooling during a large, cold leg break L.OCA is theextent to which ECC can be delivered to, and accumulated in, the lower plenum duringthe end-of-blowdown (ECC bypass issue). In large-scale tests in the 2D/2D Program(UPTF), multidimensional behavior was observed in the downcomer whlch stronglyaffected ECC delivery. Specifically, ECC injected into the cold leg adjzcent to thebroken cold leg is almost completely bypassed during end-of-blowdown. ECC injectedto cold legs away from the broken cold leg has a greater tendency to be delivered,and complete delivery of this water occurs prior to the completion of blowdown.
For ECC injected into the downcomer with vent valves between the upper olenum anddowncomer, the EOC delivery behavior was similar to that described above for coldleg injection. However, this was the result of two offsetting phenomena. First,downcomer ECC injection tended to promote bypass, apparently due to ECC beingmore finely distributed in the upper region of the downcomer because of high velocityinjection jets. Separate effects tests with downcomer injection but without vent valvesconfirmed strong bypass throughout end-of-blowdown, although it appears nozzleconfiguration details may significantly influence the results. When the vent valves wereunlocked, significant delivery of water from the nozzle away from the break wasobserved because the flow through the vent valves changed the flow rate and flowpattern in the downcomer.
For combined ECC injection, ECC injected in the hot leg passes through the core tothe lower plenum. During the end-of-blowdown, lower plenum refill is initiated by hotleg ECC. Shortly thereafter, the ECC injected to the cold legs away from the break
2-1
is delivered to the lower plenum, but the ECC injected to the cold leg adjacent to thebreak continues to be almost completely bypassed.
For all three ECC injection modes, refill of the lower plenum up to the lower edge ofthe core barrel occurred by end-of-blowdown. This result significantly shortens theportion of the refill phase where core cooling is very low and significant core heat upcould occur. Past safety analyses usually assumed that ECC injected prior toconclusion of blowdown is totally lost. The large-scale test results from the 2D/3DProgram have demonstrated this assumption to be conservative.
2.2 ENTRAINMENT IN DOWNCOMER DURING REFLOOD
During reflood, steam flows via the intact loops to the downcomer and out the brokencold leg. Water entrainment from the downcomer can occur in the steam flow out thebreak. Further, steam generation on hot downcomer walls can create voiding in thedowncomer. The combination of downcomer wall boiling and entrainment can reducethe downcomer collapsed water level which affects the driving head for core flooding.
These phenomena were observed and studied in small- and large-scale tests in the2D/3D Program. One important observation, supported by analysis, is that for full-height facilities where the vertical flow area in the downcomer is scaled by the scalefactor, water entrainment in the steam flow and attendant level reduction increasedwith scale. This is due to increases in the steam velocity in the downcomer and at thebroken cold leg nozzle at large-scale.
For US/J PWRs cold leg injection, the downcomer behavior is affected by theinteraction of steam and ECC in the cold legs. During accumulator injection, all of theintact loop steam flow is condensed. Consequently, there is no steam flow out thebroken cold leg and entrainment does not occur. Further, subcooled water isdelivered to the downcomer and boiling on the downcomer walls is suppressed. Asa result, the downcomer fills to the cold leg (i.e., spillover) elevation. During LPCI, theintact loop steam flow is partially condensed and the ECC delivered to the downcomeris essentially saturated. The uncondensed steam entrains water from the downcomerout the break. As the saturated water gradually replaces subcooled water in thedowncomer, wall boiling begins to create voiding in the downcomer. These twoeffects are calculated to reduce the downcomer level by up to 1.0 m during reflood.
For downcomer injection with vent valves, the overall behavior is similar to cold leginjection although there are some phenomenological differences. ECC injected in thedowncomer nozzle nearest the broken cold leg was almost fully swept out the breakduring LPCI, but ECC injected to the other nozzle was delivered to the downcomerwith minimal entrainment when the vent valves were open. With the vent valves closedentrainment increased and the observed level reduction was more severe than for cold
2-2
leg injection, although the phenomena in this case appear to be strongly related tonozzle configuration details (e.g., elevation and azimuthal spacing relative to cold legs).
GPWRs with combined injection are not affected by downcomer entrainment duringreflood since most of the steam generated in the core is condensed by subcooledECC injected to the hot legs. Any remaining intact loop steam flow is completelycondensed by ECC injected in the cold legs, and there is no steam flow out thebroken cold leg to entrain water.
Downcomer entrainment and wall boiling lead to a downcomer level reduction duringreflood for PWRs with cold leg or downcomer injection. The assumption usually madein past safety analyses that the downcomer is full to the spillover level is appropriatefor combined injection plants and slightly nonconservative for cold leg and downcomerinjection plants. The extent of nonconservatism is estimated to be about 15 K in cladtemperature for typical PWR conditions.
2.3 STEAM/ECC INTERACTIONS IN LOOPS
Interaction of steam and ECC in the loops affects ECC delivery to the reactor pressurevessel. These phenomena were investigated by several integral and separate effectstests in the 2D/3D Program. A variety of flow regimes were observed, dependingprimarily on steam flow, ECC flow, and ECC subcooling. A key correlation parameterproved to be the thermodynamic ratio (RT which is the ratio of steam condensationpotential to steam flow. Three basic flow regimes were identified, as follows:
" stratified flow
" stable plug flow
" unstable plug flow
Regardless of scale, stratified flow was always observed for RT <:1; i.e., thecondensation potential of the ECC was less than the steam flow. In these casessaturated (or nearly saturated) water flows at the bottom of the pipe while steam flowsat the top of the pipe. Note that the loop steam flow and ECC injection are cocurrentin the cold leg and countercurrent in the hot leg. Plug flow only occurred for RT >1;i.e., the loop steam flow is less than that needed to heat the ECC flow to saturationtemperature. The transition from stratified to plug flow in the cold lecIs was onlyslightly dependent on scale and injection configuration. Analyses indicated stable plugflow was established when the momentum of the loop steam flow exceeded thehydrostatic force at the plug end, which is dependent on pipe diameter. Otherwiseunstable plug flow occurs; i.e., plugs form and decay periodically. Plug formation canoccur rapidly and produce strong condensation events.
2-3

For all flow regimes, a substantial amount of steam is consumed by condensation.In general, condensation tends to be near the maximum possible amount; either theECC is heated to saturation or the entire steam flow is condensed. ECC delivery tothe reactor vessel fluctuates during plug flow and either fluctuates or occurs steadilyduring stratified flow. Regardless of the flow regime, ECC is completely delivered tothe pressure vessel.
2.4 EFFECT OF ACCUMULATOR NITROGEN
In some PWRs nitrogen would be discharged into the primary coolant system after theaccumulator water has been delivered. This occurs for US/J PWR designs whereasin GPWRs the accumulators are designed not to empty completely.
When nitrogen enters the cold legs and downcomer, condensation is almost totallysuppressed and the downcomer is pressurized by the high flow of noncondensiblegas. This causes a surge of water into the core which has a beneficial effect on corecooling. During this in-surge, the downcomer water level is decreased and ECC isswept out the broken cold leg by nitrogen flow. The surge of water into the coreresulted in increased steam generation in the core and water carryover to the upperplenum. Increased steam generation and the reduced downcomer water headsubsequently lead to a water out-surge to the downcomer, which removes thebeneficial core cooling effect. Hence, the effect is temporary. Tests in the 2D/3DProgram confirmed the phenomena discussed above. Due to limitations of testfacilities used in the program, quantification of the effect of accumulator nitrogendischarge on core temperatures was not covered.
2.5 THERMAL MIXING OF ECC AND PRIMARY COOLANT
During some transients or small break LOCAs, ECC is injected at high pressure(HPCI) into the primary system. If subcooled ECC is injected into water-filled cold legswhile the loops are stagnated, the extent to which cold water could potentially causelocal cooldown of the primary vessel wall is an important issue (Pressurized ThermalShock Issue).
Prior to the 2D/3D Program, analyses and small-scale tests showed effective thermalmixing of cold ECC and primary coolant would occur at the injection location and inthe downcomer, thus mitigating temperature reductions at the vessel wall. In UPTFtests, mixing of subcooled ECC and primary coolant occurred at the injection location.Thermal stratification developed in the cold leg. Cold water flowed at the bottom ofthe cold leg towards the downcomer while warm water flowed at the top of the pipefrom the downcomer to the injection location where it mixed with the ECC. Thetemperature of the subcooled water stream at the bottom of the cold leg wassignificantly higher than that of the ECC.
2-4

Another mixing process occurred at the cold leg-to-downcomer junction. Due to thisadditional mixing, the subcooling rapidly decayed in a plume in the downcomer.Overall mixing of ECC and primary coolant was found to be very effective so that coldECC does not appear to cause severe local changes of fluid temperature alt the vesselwall which could lead to pressurized thermal shock.
2.6 CORE THERMAL-HYDRAULIC BEHAVIOR
Core thermal-hydraulic behavior determines the fuel rod temperature histoiy during anLBLOCA and is sensitive to the boundary conditions at the core created by ECCsystem effectiveness and overall system response. The core behavior during refloodwas studied extensively in the 2D/3D Program in tests at CCTF and SCTI" while corebehavior during end-of-blowdown was investigated in previous tests outside the 2D/3DProgram.
During end-of-blowdown, a two-phase mixture flows through the core providing corecooling. In addition, in PWRs with combined hot and cold leg ECC injection, hot leginjected ECC is delivered to the core in local regions below the hot legs. Portions ofthe core in these downflow regions are expected to be quenched prior to thecompletion of blowdown.
In the brief period after blowdown and before the lower plenum refills to the bottomof the core, the core heats up almost adiabatically in plants with cold leg ordowncomer injection. In combined injection and upper plenum injection plants, ECCwater is delivered to the core during this period. The majority of this water flows downthrough the core in areas located below the injectors, providing local core cooling.
When the water level increases to the bottom of the core, reflood begins arid extensivesteam generation initiates. Some of the bottom flood water is entrained by steam flow,and two-phase flow is quickly established over the entire core. This process re-establishes core cooling at all axial locations. The principal quench front on the rodsadvances steadily up the core. In cold leg or downcomer injection systems, ECCflows down the downcomer and enters the core from the bottom. For ECC injectedin hot legs or the upper plenum, water flows down the core in local regions andcontributes to the global core reflood process described above. In these localregions, cooling is enhanced and the fuel rods are quenched sooner than those in thenon-downflow region. In fact, for hot leg injection, most fuel rods in the waterdownflow regions are quenched prior to reflood.
2.7 WATER DELIVERY AND DISTRIBUTION IN THE UPPER PLENUM
Some PWRs inject ECC directly to the upper plenum. Also, PWRs with combinedinjection inject ECC into the hot and cold legs simultaneously. In these cases, theECC delivery to, and distribution in, the upper plenum create specific boundary
2-5
conditions for core cooling. In the end-of-blowdown and refill phases, the ECCinjected into the upper plenum or hot legs is delivered to the upper plenum and flowsdown through the core in local areas adjacent to the injectors. Steam condensationby subcooled ECC supports rapid depressurization of the primary system.
During reflood, steam and entrained water are flowing from the core to the upperplenum and toward the hot legs. Water delivery and distribution in the upper plenumare strongly affected by interaction between steam and subcooled ECC. With upperplenum injection, extensive condensation occurs in the upper plenum which reducessteam flow to the hot legs and adds to the water available for downflow to the core.Under typical conditions, the ECC flow condenses about 70% of the steam flow.About 90% of the available water flows to the core in a local region below the injector;the water downflow is only slightly subcooled. With combined injection, condensationin the hot legs near the ECC injectors creates subcooled ECC plugs which areintermittently delivered to the upper plenum. Although extensive condensation occursin the upper plenum, water flows to the core in local regions with substantialsubcooling. Steam generated in the core is almost entirely consumed bycondensation in the core, upper plenum, and hot legs. Nearly all of the available wateris delivered to the core.
For both upper plenum injection and combined injection, liquid accumulation in theupper plenum was not extensive at large-scale (UPTF). Specifically, upper plenumliquid fractions were about 10%. This result is in contrast with small-scale tests (e.g.,CCTF and SCTF) which showed significant upper plenum accumulation. Finally, atlarge-scale the liquid distribution was observed to be two-dimensional; i.e., higherliquid accumulation above ECC downflow regions.
2.8 WATER CARRYOVER AND STEAM BINDING WITH COLD LEG INJECTION
During reflood, steam generated in the core flows through the upper plenum and hotlegs toward the break. Some of the water carried by the steam flow evaporates dueto heat transfer from hot surfaces, principally the steam generator tubes. Thisadditional steam flow inhibits core venting and can degrade core cooling. Thisphenomenon is referred to as steam binding and was investigated in several tests inthe 2D/3D Program. For cold leg or downcomer injection, CCTF and SCTF testsshowed that liquid carryover from the core started almost immediately after refloodinitiation. The extent of carryover was time-dependent and also dependent on the testconditions, but tended to be about 10% to 40% of the core inlet flow.
Water carried out of the core in the steam flow de-entrained mainly in the upperplenum and steam generator inlet plena. This de-entrainment produced a delay ofabout 20 to 30 seconds in the delivery of water to the tube regions of the steamgenerators. At large-scale, water accumulation and (in some cases) runback in thehot legs initiated after the delay, which reduced the amount of water carried to the
2-6
steam generators. The increased hot leg water storage was the principal effect ofscale. The overall effect of de-entrainment is to reduce the peak clad temperature.Specifically, it is estimated that de-entrainment upstream of the steam generator tuberegions reduces the peak clad temperature by about 180 K compared to the situationwhere no de-entrainment would occur.
PWRs with upper plenum or combined ECC injection are not sensitive to steambinding due to interaction of steam and ECC (i.e., condensation in the upper plenumand hot legs) as discussed in Section 2.7.
2.9 HOT LEG COUNTERCURRENT FLOW
In some small break LOCA scenarios, the primary coolant inventory decreases to theextent that heat removal is achieved by the reflux condenser mode. In this mode,steam flows from the reactor vessel through the hot legs to the steam generatorscountercurrent to condensate flowing back from the steam generators to the upperplenum.
Countercurrent flow in the hot leg was examined in large-scale LIPTF tests.Comparison of the UPTF results to the results of previous small-scale tests indicatedthat increased scale favors water runback. Analyses showed that uninhibited waterrunback is expected during reflux condenser conditions of a PWR small break LOCAscenario.
2-7

Section 3
OVERALL SYSTEM BEHAVIOR DURING A LOCA
This section describes overall system behavior of a PWR during a LOCA based ontests and analyses performed within the 2D/3D Program. The discussion addressesonly a large, cold leg break LOCA (LBLOCA) transient, which was the principal focusof the 2D/3D Program. Detailed information on the various reactor safety issuesassociated with an LBLOCA is contained in Section 4 of this report. Section 4 alsocovers certain non-LBLOCA safety issues investigated in the 2D/3D Program;specifically, reflux condenser mode of a small-break LOCA (see Section 4.9), highpressure injection into the hot legs during an SBLOCA in which the core uncovers(see Section 4.7.2), and pressurized thermal shock (see Section 4.5).
The experimental and analytical programs of the 2D/3D Program provided expandedinsights into the complex two-phase thermal-hydraulic behavior of a heated core andthe primary system during the end-of-blowdown, refill, and reflood phases of a LOCA.Tests at CCTF investigated core thermal-hydraulics and overall system behavior whiletests at SCTF concentrated on multidimensional core thermal-hydraulics. The UPTFtests included integral tests and separate effects tests for the investigation ofmultidimensional two-phase flow behavior in the downcomer, the upper Diolenum, thetie plate region, and the loops of the primary system. The descriptions of PWRbehavior in this section reflect the results of TRAC analyses and tests from the2D/3D Program.
The descriptions of overall system behavior during an LBLOCA for PWRs with differentECCS configurations are covered in separate subsections. The subsections andcorresponding ECCS types are listed below.
* 3.1 Cold Leg Injection Plant
* 3.2---- Combined Injection Plant
• 3.3 Downcomer Injection Plants
- 3.3.1 US Downcomer Injection Plant
- 3.3.2 FRG Downcomer Injection Plant
-- 3.3.3 Japanese Downcomer Injection Plant
3.4 Upper Plenum Injection Plant
3-1

3.1 COLD LEG INJECTION PLANT
PWRs are equipped with safety systems which inject emergency core co D1ant (ECC)in the event of a LOCA. ECC systems typically consist of three types of coolantinjection systems: accumulator (ACC) injection, low pressure coolant injection (LPCI),and high pressure coolant injection (HPCI). The ACC system provides high flow rate,short duration injection from pressurized accumulator tanks, while the LPCI systemprovides low flow rate, long duration flow. The HPCI system provides long duration,high pressure flow at an even lower flow rate. For most PWRs in the US and Japan,all ECC systems inject water into the primary system through nozzles in the cold legs.
During an LBLOCA, water from the pressurized accumulators is automatically injectedinto the reactor vessel when the reactor pressure drops below the accurmulator tankpressure. HPCI flow is also injected into the vessel with the accumulator ilow, but theHPCI flow is small in comparison to the accumulator flow. The accumulator tanks aresized so that when emptied, the lower plenum is filled and core reflood has begun.At low pressures, LPCI flow begins and continues indefinitely. HPOI normallycontinues throughout the LPCI injection phase, but the flow rate is dominated by theLPCI system. Design parameters for ECC systems of PWRs with cold leg injection aretabulated for three different PWR designs in Table 3.1-1.
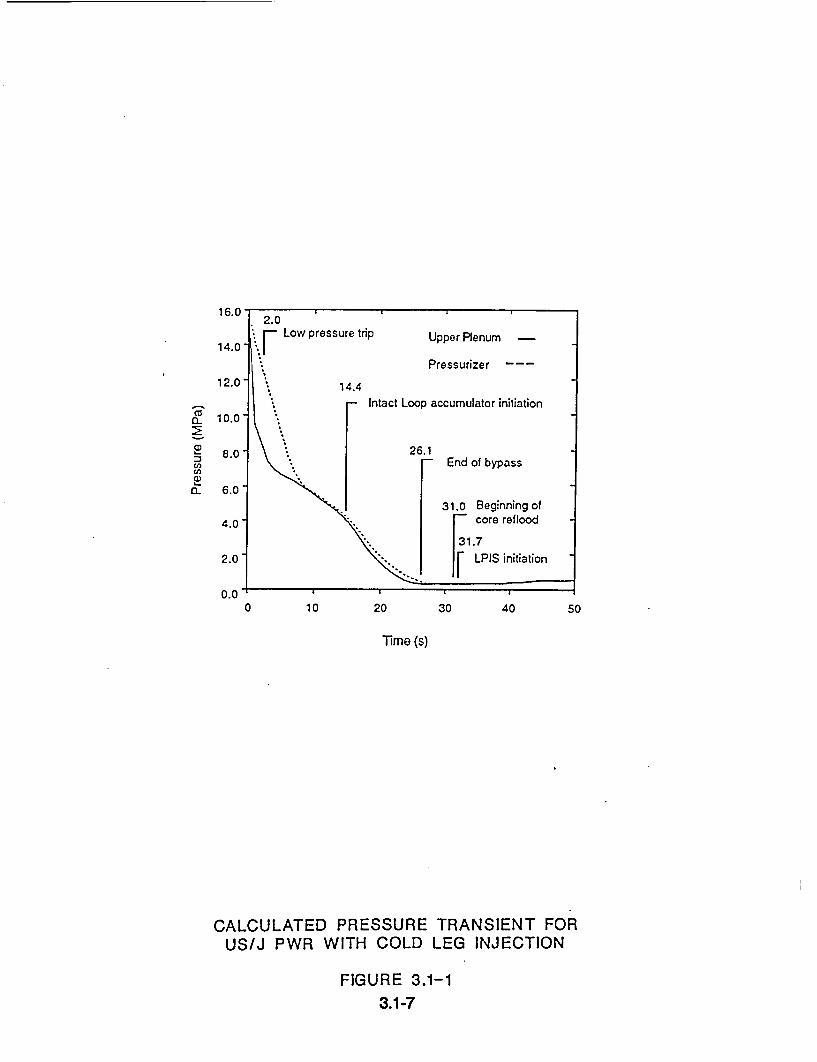
Thermal-hydraulic behavior in the reactor coolant system during an LBLOCA isdescribed below. The discussion is divided chronologically into the following timeperiods: blowdown, end-of-blowdown/refill, early reflood, accumulator nitrogendischarge, and late reflood. The sequence of events is indicated on Figures 3.1-1 and3.1-2 which show the pressure and rod temperature transients, respectively, fromTRAC calculations for US/J PWRs with cold leg injection.
Blowdown
The 2D/3D Program did not investigate system behavior during the blowdown portionof an LBLOCA. Based on results from other reactor safety research programs, it isknown that during blowdown, most of the initial contents of the reactor coolant systemare rapidly expelled through the break. A significant fraction of the water initiallypresent in the reactor coolant system flashes to steam, which drives the flow out thebroken cold leg. The pressure in the primary system decreases as the blowdownprogresses. After approximately 25 seconds, the reactor coolant s;ystem andcontainment equalize at a pressure of about 350 kPa.
End-of-Blowdown/Refill (see Figure 3.1-3)
During the end-of-blowdown, the reactor coolant system is filled with steam except forthe lower plenum which still contains some water. The steam is vented to containmentby either flowing around the bottom of the core barrel and up the downcomer to the
3.1-1

break or through the loops to the break. The water inventory in the lower plenumcontinues to decrease from entrainment by the steam flow around the core barrel andfrom flashing due to decreasing system pressure. The reverse steam flow in the coreprovides limited core cooling, which reduces to almost zero as the flow stops at theend-of-blowdown.
When the system pressure has decreased below the accumulator pressure (1,400 to4,600 kPa, depending on plant design), the accumulators automatically inject ECC intothe cold legs. Water plugs form in the cold legs, as the steam flow through the loopsis condensed by the high flow of subcooled ECC. Plug formation consumes a fewseconds of ECC delivery and thus slightly delays ECC delivery to the downcomer.This delay is not detrimental because the system is at a pressure where significantECC bypass could occur if ECC reached the downcomer. The water plugs in the coldlegs oscillate, causing fluctuations in the flow of ECC into the downcomer.
In the downcomer, the two-phase (i.e., steam and entrained water) upflow initiallyentrains the ECC flow directly out the broken cold leg (i.e., ECC bypass) therebypreventing ECC from refilling the lower plenum. However, as blowdown proceeds andthe upflow decreases, the bypass also decreases and ECC is delivered to the lowerplenum. Based on the UPTF tests, ECC delivery to the lower plenum initiates at theloops away from the break at a pressure of about 800 kPa. Delivery from the loopnear the break initiates later in the end-of-blowdown when the steam upflow is lower.
By the completion of blowdown, the lower plenum is filled almost to the bottom of thecore barrel. Within a few seconds of the end of depressurization, the vessel fills to thecore inlet and refill is complete. Hence, refill and blowdown are overlapping ratherthan consecutive. Overlapping blowdown and refill reduces the time to core reflood,and therefore the adiabatic heat-up period, by about 10 seconds over consecutiveblowdown and refill. Reference U-455 estimates the reduction in claddingtemperatures at reflood initiation for overlapping, rather than consecutive, blowdownand refill is 100 K (see Section 4.1.1).
Early Reflood (Accumulator Iniection) (see Figure 3.1-4)
In the early portion of reflood, the downcomer water level increases rapidly due to thehigh ECC flow from the accumulators. Based on CCTF and UPTF tests, thedowncomer water level stabilizes at the cold leg elevation due to water spillover outthe broken cold leg. Heat release from the vessel wall initiates as the downcomer fills.Tests and analyses show that this heat release heats up the downcomer waterinventory but does not result in vaporization because the subcooling of the waterdelivered to the vessel is sufficient to suppress boiling.
3.1-2

The increase in downcomer water level forces water into the core. Steam generationin the core initiates first at the bottom of the core as water enters the core from thelower plenum. However, within a few seconds, water entrained by the boiling processis present throughout the core and core cooling is occurring at all elevations. Theentrained water is evenly distributed across the core (i.e., horizontal or rad al direction)regardless of the initial power and temperature profiles in the core. The steamgenerated in the core is vented to containment via the upper plenum and reactorcoolant loops. Some of the water in the upper region of the core is carried by thesteam flow out of the core; the average quality for the net flow at the core exit is 40%for this part of the transient.
Initially, the core flooding rate is high and the collapsed water level in the coreincreases rapidly. When the downcomer water level reaches the cold leg elevationand water spills out the break, the core flooding rate decreases quickly. However,since the core steam generation is essentially the same as during early reflood, thereduction in the core flooding rate results in lower rates of water accumulation in thecore and water carryover out of the core.
Water carried out of the core is either de-entrained in the upper plenum or carried overwith the steam to the reactor coolant loops. In the upper plenum, the water which de-entrains either accumulates as a two-phase mixture or falls back to the core. Thewater carried over to the loops de-entrains and accumulates in the steam generator(SG) inlet plena. Entrained water does not reach the steam generator tube regionsduring the accumulator injection portion of reflood.
In the intact cold legs, the steam flow toward the downcomer is completely condensedby the subcooled ECC. Due to the high ECC flows, the condensation results in themaintenance of water plugs in the cold legs which oscillate upstream and downstreamfrom the injection nozzle location. Consequently ECC delivery to the pressure vesselfluctuates.
Once the downcomer has filled to the cold leg elevation, flow out the broken cold legis primarily single-phase water flow since the intact loop steam flow is completelycondensed and vaporization in the downcomer is suppressed.
Accumulator Nitro-gen Discharge
When the water in the accumulators is depleted, the nitrogen that pressurizes thetanks escapes through the ECC piping. The nitrogen quickly pushes ECC water fromthe intact cold legs into the reactor vessel downcomer. Also, water in the top of thedowncomer and in the broken cold leg is pushed toward the break. The primarysystem (particularly the region into which the nitrogen is injected) is pressurized for ashort period until the nitrogen can leave the system.
3.1-3

System pressure is further increased by suppression of steam condensation. Asnitrogen mixes with and displaces steam, the rate of condensation becomes muchlower than when pure steam was in contact with the subcooled water. Theaccumulation of uncondensed steam contributes to the temporary pressurization ofthe downcomer and cold leg regions of the primary system.
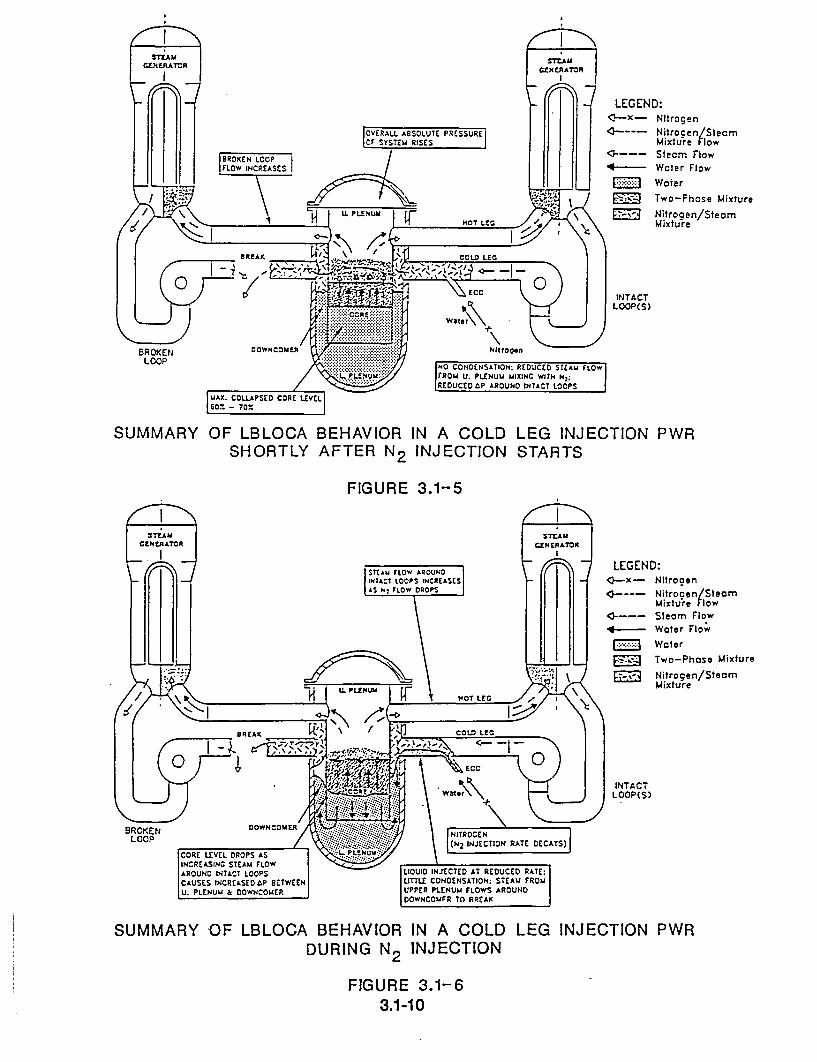
Before the nitrogen discharge begins, the pressure above the core exceeds thepressure in the downcomer due to the pressure drop of steam flowing from the upperplenum around the intact loops. This pressure difference keeps the water level in thecore lower than in the downcomer. The nitrogen pressurization of the downcomerdisrupts the existing pressure distribution and forces a portion of the water in thedowncomer into the lower plenum, displacing lower plenum water into the core (seeFigure 3.1-5). TRAC analyses predict that core water inventory increases from avolume fraction of 0% to 20% before nitrogen discharge to a maximum of 60% to 70%(see Section 4.4).
The lower plenum water is subcooled, in part due to the rise in pressure. As the watersurges into the core, heat is absorbed until, after a brief delay during which the wateris heated to saturation, additional steam is produced. The increased steam productionin the core increases the pressure above the core. The pressure increase, coupledwith a decreasing nitrogen discharge rate, eventually stops the rise in core water leveland then forces some of the water to flow out of the core and back into the lowerplenum (see Figure 3.1-6). TRAC analyses predict that the core water inventoryfollowing the out flow from the core to downcomer is greater than the inventory beforenitrogen discharge (30 - 40% volume fraction versus 0 - 20% - see Section 4.4).
As discussed in Section 4.4, the 2D/3D test data regarding the effect of nitrogendischarge are limited. Specifically, the 2D/3D tests did not simulate the peakmagnitude and duration of the core level surge, the long-term effects of the nitrogendischarge, or the effect of these phenomena on core cooling; however, TRACanalyses predict that the core water level surge quenches the hottest portion of thehottest rod.
Late Reflood (LPCI) (see Figure 3.1-7)
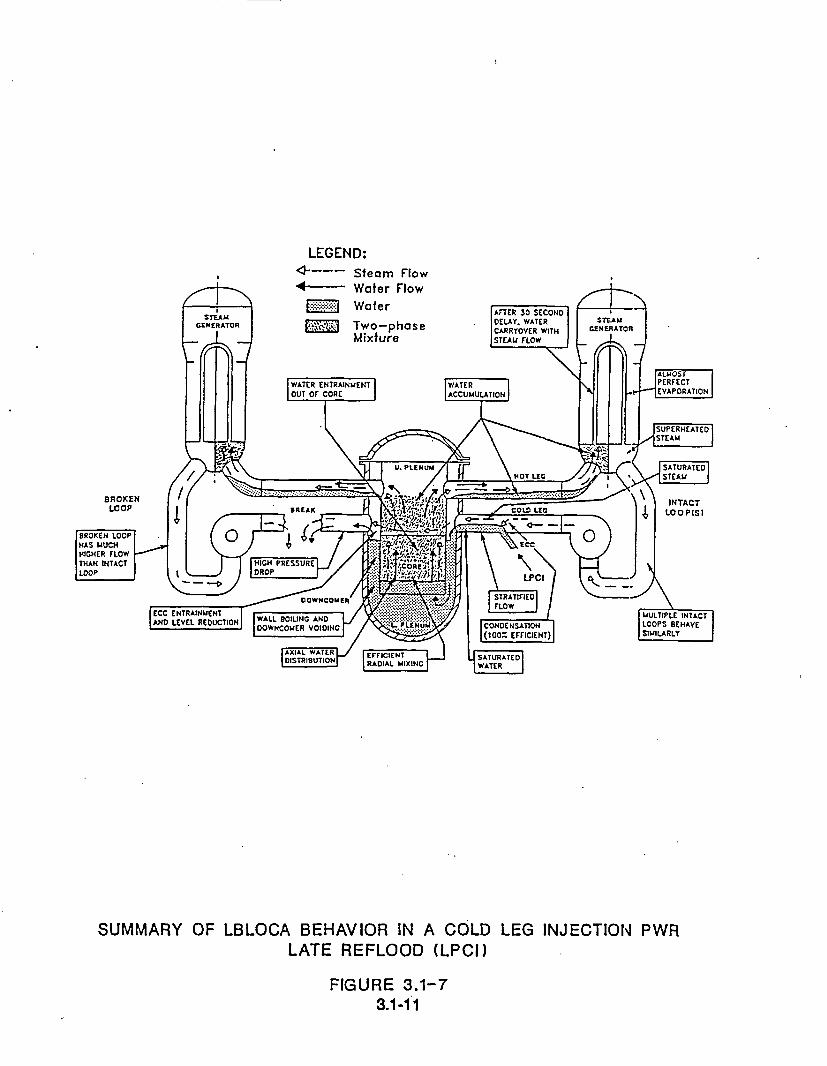
As previously indicated, water carryover out of the core decreases prior to terminationof accumulator injection when the downcomer water level reaches the cold legelevation. Later in reflood, however, water carryover out of the core increases as thequench front reaches the upper regions of the core. Reflood ends when the entirecore is quenched. The quality for the net flow out of the core is about 90% whenaccumulator injection terminates but decreases to less than 45% just prior to wholecore quench.
3.1-4
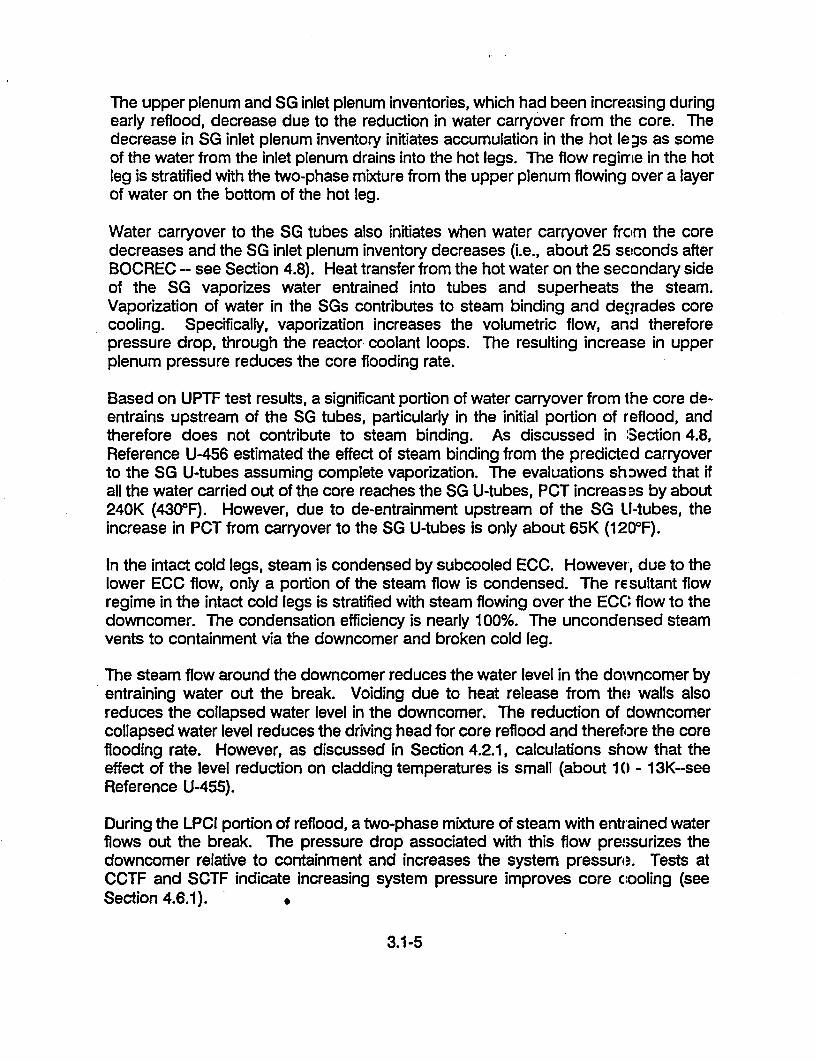
The upper plenum and SG inlet plenum inventories, which had been increasing duringearly reflood, decrease due to the reduction in water carryover from the core. Thedecrease in SG inlet plenum inventory initiates accumulation in the hot legas as someof the water from the inlet plenum drains into the hot legs. The flow regime in the hotleg is stratified with the two-phase mixture from the upper plenum flowing over a layerof water on the bottom of the hot leg.
Water carryover to the SG tubes also initiates when water carryover from the coredecreases and the SG inlet plenum inventory decreases (i.e., about 25 seconds afterBOCREC - see Section 4.8). Heat transfer from the hot water on the secondary sideof the SG vaporizes water entrained into tubes and superheats the steam.Vaporization of water in the SGs contributes to steam binding and degrades corecooling. Specifically, vaporization increases the volumetric flow, and thereforepressure drop, through the reactor coolant loops. The resulting increase in upperplenum pressure reduces the core flooding rate.
Based on UPTF test results, a significant portion of water carryover from ihe core de-entrains upstream of the SG tubes, particularly in the initial portion of reflood, andtherefore does not contribute to steam binding. As discussed in Section 4.8,Reference U-456 estimated the effect of steam binding from the predicted carryoverto the SG U-tubes assuming complete vaporization. The evaluations sh 3wed that ifall the water carried out of the core reaches the SG U-tubes, PCT increas-as by about240K (4300F). However, due to de-entrainment upstream of the SG LI-tubes, theincrease in PCT from carryover to the SG U-tubes is only about 65K (1 2D0 F).
In the intact cold legs, steam is condensed by subcooled ECC. However, due to thelower ECC flow, only a portion of the steam flow is condensed. The resultant flowregime in the intact cold legs is stratified with steam flowing over the ECO flow to thedowncomer. The condensation efficiency is nearly 100%. The uncondensed steamvents to containment via the downcomer and broken cold leg.
The steam flow around the downcomer reduces the water level in the downcomer byentraining water out the break. Voiding due to heat release from the walls alsoreduces the collapsed water level in the downcomer. The reduction of downcomercollapsed water level reduces the driving head for core reflood and therefore the coreflooding rate. However, as discussed in Section 4.2.1, calculations show that theeffect of the level reduction on cladding temperatures is small (about 10 - 13K-seeReference U-455).
During the LPCI portion of reflood, a two-phase mixture of steam with entrained waterflows out the break. The pressure drop associated with this flow pressurizes thedowncomer relative to containment and increases the system pressun.r. Tests atCCTF and SCTF indicate increasing system pressure improves core cooling (seeSection 4.6.1).
3.1-5
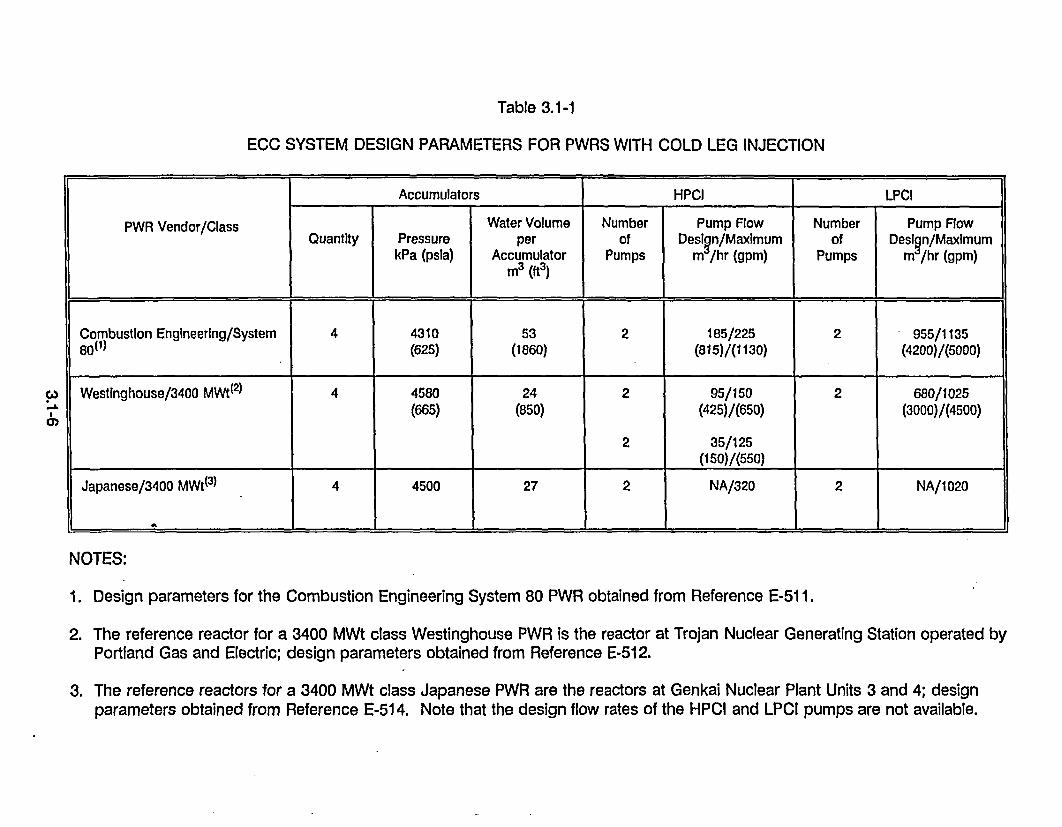
Table 3.1-1
ECC SYSTEM DESIGN PARAMETERS FOR PWRS WITH COLD LEG INJECTION
Accumulators HPCI LPCI
PWR Vendor/Class Water Volume Number Pump Flow Number Pump FlowQuantity Pressure per of Design/Maximum of Desiln/MaxlmumkPa (psla) Accumulator Pumps m /hr (gpm) Pumps m /hr (gpm)
m3 (ft3)
Combustion Engineering/System 4 4310 53 2 185/225 2 955/113580(1) (625) (1860) (815)/(1130) (4200)/(5000)
ca Westinghouse/3400 MWt(2) 4 4580 24 2 95/150 2 680/1025(665) (850) (425)/(650) (3000)/(4500)
2 35/125(150)/(550)
Japanese/3400 MWt 3) 4 4500 27 2 NA/320 2 NA/1020
NOTES:
1. Design parameters for the Combustion Engineering System 80 PWR obtained from Reference E-51 1.
2. The reference reactor for a 3400 MWt class Westinghouse PWR is the reactor at Trojan Nuclear Generating Station operated byPortland Gas and Electric; design parameters obtained from Reference E-512.
3. The reference reactors for a 3400 MWt class Japanese PWR are the reactors at Genkai Nuclear Plant Units 3 and 4; designparameters obtained from Reference E-514. Note that the design flow rates of the HPCI and LPCI pumps are not available.
E. 10.0
8.0 26.1End of bypass
a)
a. 6.031.0 Beginning of
4.0 core reflood
31.7
2.0" LPIS initiation
0.0 ..0 10 20 30 40 50
Time (s)
CALCULATED PRESSURE TRANSIENT FOR
US/J PWR WITH COLD LEG INJECTION
FIGURE 3.1-1
)
3.1-7

E
cc:
0 25 50 75 100 125 150 175 200
Time(s)
Maximum BE Rod Temperature
£
E"oIt-0
1100
1000
900
800
700
600
500
400
3000 25 50 75 100 125 150 175 200
lime (s)
Maximum EM Rod Temperature
CALCULATED ROD TEMPERATUREUS/J PWR WITH COLD LEG
FIGURE 3.1-23.1-8
TRANSIENT FORINJECTION

BROKENLOOP
INTACTLOOPIS)
SUMMARY OF LBLOCA BEHAVIOR IN A COLD LEG INJECTION PWREND-OF-B LOWDOWN/REFILL PHASE
FIGURE 3.1-3
LEGEND:
4-
~,- ':'~
Steam FlowWater FlowWater
Two-phaseMixture
BROKENLOOP
INTACTLOOPMS)
IPLUG ILOW INI
iIENTAC ODLG
IWATR SPREADING
SUMMARY OF LBLOCA BEHAVIOR IN A COLD LEG INJECTION PWREARLY REFLOOD (ACCUMULATOR INJECTION)
FIGURE 3.1-43.1-9
LEGEND:<--x- Nitrogen
•.---- Nitrooen/SteamMixture Flow
------ Steam Flow4 Water Flow
SWaterSTwo-Phase Mixt
E Nitrogen/Steamure
Mixture
INTACT
* C.RELOOP(S)
BROKEN DOWNCOuMR NitoO•nLOOP :::::::::::::::::
LOO::P :'i!::!•::!::•aO CONDENSATION: REDUCED STEAM FLOW.*. ... ....... .rRau u. PLENUu uiXINC wITH H2;
R.EIDUCEDr P AROUND INTACT LOOPS
MAX. COLLAPSED CORE LEVEL60% - 70'_
SUMMARY OF LBLOCA BEHAVIOR IN A COLD LEG INJECTION PWRSHORTLY AFTER N 2 INJECTION STARTS
FIGURE 3.1-5
LEGEND:'Q-x- Nitrogen
•----• Nitroaen/SteamMixture Flow
)------ Steam Flow
4- Water Flow
SWaterSTwo-Phase Mixture
- Nitrogen/SteamMixture
INTACTLOOP(S)
LIOUID INJECTED AT REDUCED RATE:UITTLE CONDENSATION. STEAU FROMUPPER PLENUM FLOWS AROUNDDOWNCOUVR Tn RREAK
SUMMARY OF LBLOCA BEHAVIOR IN A COLD LEG INJECTION PWRDURING N2 INJECTION
FIGURE 3.1-63.1-10
SUMMARY OF LBLOCA BEHAVIOR IN A COLD LEG INJECTION PWRLATE REFLOOD (LPCi)
FIGURE 3.1-73.1-11


3.2 COMBINED INJECTION PLANT
The ECC systems in four-loop German (Siemens/KWU; 1300 MWe) PWRs consist ofthree types of coolant injection systems, namely: high pressure coolant injection(HPCI), accumulator (ACC) injection, and low pressure coolant injection (LPCI). Aunique feature of the GPWR design is that each of the ECC systems injects coolantinto the primary system through nozzles in the hot legs as well as through nozzles inthe cold legs. This type of injection scheme is termed "combined injection."
During an LBLOCA, the HPCI system is actuated at a primary system pressure ofabout 11,000 kPa. When the pressure in the primary system has decreased to2,600 kPa, the ACCs automatically start to inject ECC. When the primary systempressure reaches about 1,100 kPa, injection by the LPCI system commences. HPCIcontinues throughout the ACC and LPCI phases, but ECC flow rate is dominated bythe ACC and LPCI flows.
Overall system behavior in a combined injection PWR during an LBLOCA is describedbelow based on findings from 2D/3D tests and the results of a TRAC-PF1/MOD1calculation with 5/8 injection (Reference G-661). Schematics depicling systembehavior at several times in a UPTF test are shown in Figure 3.2-1. The discussionbelow is divided into the following time periods: blowdown, end-of-blowdown/refill, andreflood.
Blowdown
System behavior during blowdown was not investigated within the 2D/31) Program.This discussion is based on test results from other safety research programs, and theresults of code analyses. Overall, system behavior during blowdown is independentof the ECCS configuration until ACC injection starts.
During blowdown, the initial contents of the primary system are expelled through thebreak to containment as the system depressurizes. The net flow in the reactor vesselis from the core to the lower plenum and up the downcomer to the broken cold leg.The rate at which primary coolant is discharged is controlled by the critical flow at thebreak. For a 200% cold leg break, the pressures in the primary system and thecontainment equalize approximately 35 seconds after break initiation at a pressure ofabout 400 kPa.
End-of-Blowdown/Refill (see Figure 3.2-2)
When the primary system pressure has decreased below 2,600 kPa, the ACCsautomatically start to inject ECC into the hot and cold legs. A few seconds. later highlysubcooled ECC from the hot legs is delivered to the upper plenum and penetratesthrough the tie plate to the core. Water penetration to the core occurs. only within
3.2-1

defined areas (20-40% of the total core area, depending on the number of activatedhot leg ECC systems-see Figure 4.7-7) located in front of the delivering hot legs.While a significant portion of the steam in the hot legs and the upper plenum iscondensed by ECC injected into the hot legs, UPTF tests indicate that ECC whichpenetrates through the tie plate is still highly subcooled (-70 K).
Water downflow from the upper plenum initiates core cooling during end-of-blowdown.SCTF tests indicate the portions of the core in the downflow regions are immediatelyquenched. CCTF tests indicate that heat transfer in the remainder of the core isslightly enhanced by the water downflow. Some of the water downflow is vaporizedand steam flows out the top and bottom of the core; however, most of the waterdownflow is heated to near saturation and flows to the lower plenum. When the steamflow around the bottom of the core barrel is high, a substantial part of the waterdownflow which reaches the lower plenum is entrained out the break; the remainderof the water downflow is accumulated in the lower plenum. As the steam flow aroundthe bottom of the core barrel decreases, entrainment decreases and the rate of wateraccumulation to the lower plenum increases.
UPTF tests (References G-018 and G-218) and a TRAC analysis (Reference G-661)indicate that the lower plenum inventory starts to increase about ten seconds beforethe end of depressurization at a system pressure of 1,000 kPa. This level increase isprimarily due to hot leg ECC injection which penetrates through the tie plate and corebecause most of the ECC injected in the cold legs is entrained out the break by theupflow in the downcomer. However, as blowdown progresses and the upflowdecreases, bypass also decreases and ECC penetrates down the downcomer to thelower plenum. Based on UPTF tests, delivery of ECC injected into the cold legsinitiates at the cold legs away from the break when the system pressure decreasesbelow 800 kPa.
In the end-of-blowdown phase, water plugs form in the cold legs as steam iscondensed by the high flow of'subcooled ECC. These plugs oscillate upstream anddownstream from the injection nozzle location resulting in fluctuations in ECC deliveryto the downcomer. In the hot legs, water plugs form and collapse periodically;consequently, ECC delivery to the upper plenum also fluctuates.
By the completion of blowdown, the lower plenum is filled to the bottom of the corebarrel. A few seconds later, the vessel fills to the core inlet and refill is complete.Hence, the end-of-blowdown and refill are overlapping rather than consecutive. Thisreduces the time to core reflood and therefore the heat-up period of the non-downflowregions of the core; consequently, cladding temperatures in the non-downflow regionsat reflood initiation are lower than for consecutive end-of-blowdown and refill. Asindicated in Section 4.1.3, the reduction in cladding temperatures at reflood initiationis about 80 - 100 K.
3.2-2

Reflood
Initially, the downcomer water level increases rapidly as ECC injected into the cold legsis delivered to the downcomer and ECC injected into the hot legs penetrates throughthe core to the lower plenum and flows into the downcomer. When the downcomerwater level reaches the cold leg elevation, water spills out the broken cold leg and thewater level stabilizes.
Core thermal-hydraulic behavior during reflood is strongly heterogeneous (seeFigure 3.2-3). Specifically, the core is separated into two regions. Within the waterdownflow region, the core is mainly quenched from the top down by the waterdownflow from the upper plenum. Outside the water downflow region, core coolinginitiates at the bottom of the core as water entering the core from the lower plenumis vaporized. Water entrained by the boiling process is carried to the upper regionsof the core initiating core cooling at all elevations.
UPTF tests indicate more than 80% of the steam generated in the core is condensedin the upper plenum and hot legs. The uncondensed steam flows through the loops.However, since most of the steam is condensed in the upper plenum and hot legs, theloop steam flows are minimal and the flow pressure drop is small. Consequently, thecore flooding rate is high (0.15 - 0.25 m/s per SCTF tests).
The steam flow in the intact loops is completely condensed in the cold legs and nosteam enters the downcomer; consequently, there is no reduction in downc omer waterlevel due to entrainment out the break.
Water plugs form in both the hot and cold legs due to condensation of steam by thehigh flow of subcooled water. UPTF tests indicate the hot leg plugs are unsteady andthe cold leg plugs oscillate. In both cases, delivery to the reactor vessel fluctuates.The fluctuating nature of ECC delivery does not adversely affect core heat transfer andquench times.
In a TRAC calculation of an LBLOCA, the average powered rods were, quenched90 seconds after break initiation. Whole core quench occurred within 130 seconds ofbreak initiation (Reference G-661).
3.2-3

System pressure
Steam 1 P=1080 kPo 1Start of main test phase
37.5s
Steam mass flow
tI1 ECC
ECCýBy pas sI
1P=390 kPo I End of Blowdown46.5s
T
Bottom of Core Recovery
I 52.9s
7
"IEnd of Test Phase
76.Os
I
iliI
OVERALL SYSTEM BEHAVIOR IN A COMBINED INJECTIONINTEGRAL TEST AT UPTF (TEST NO.18)
FIGURE 3.2-13.2-4

Legend:WStearn
• Water
Two-Phase Mixure
BrokenLoop
Lower
SUMMARY OF LBLOCA BEHAVIOR IN A COMBINED INJECTION PWREND-OF BLOWDOWN/REFILL PHASE
FIGURE 3.2-2
Legend:-_ - Stemrn
4 Water
EYE Water
Two-Phase Mixture
I Condensation
BrokenLoop
Broken LoopSteam Flow
SUMMARY OF LBLOCA BEHAVIOR IN A COMBINED INJECTION PWRREFLOOD PHASE
FIGURE 3.2-33.2-5

3.3 DOWNCOMER INJECTION PLANTS
The ECCS configuration of PWRs with downcomer injection varies consider-ably amongthe three countries participating in the 2D/3D Program; consequently, overall systembehavior during an LBLOCA is described in a separate subsection for each PWR. Thesubsection and corresponding PWR are listed below.
0 3.3.1 US Downcomer Injection Plant
. 3.3.2 FRG Downcomer Injection Plant
. 3.3.3 Japanese Downcomer Injection Plant
3.3-1

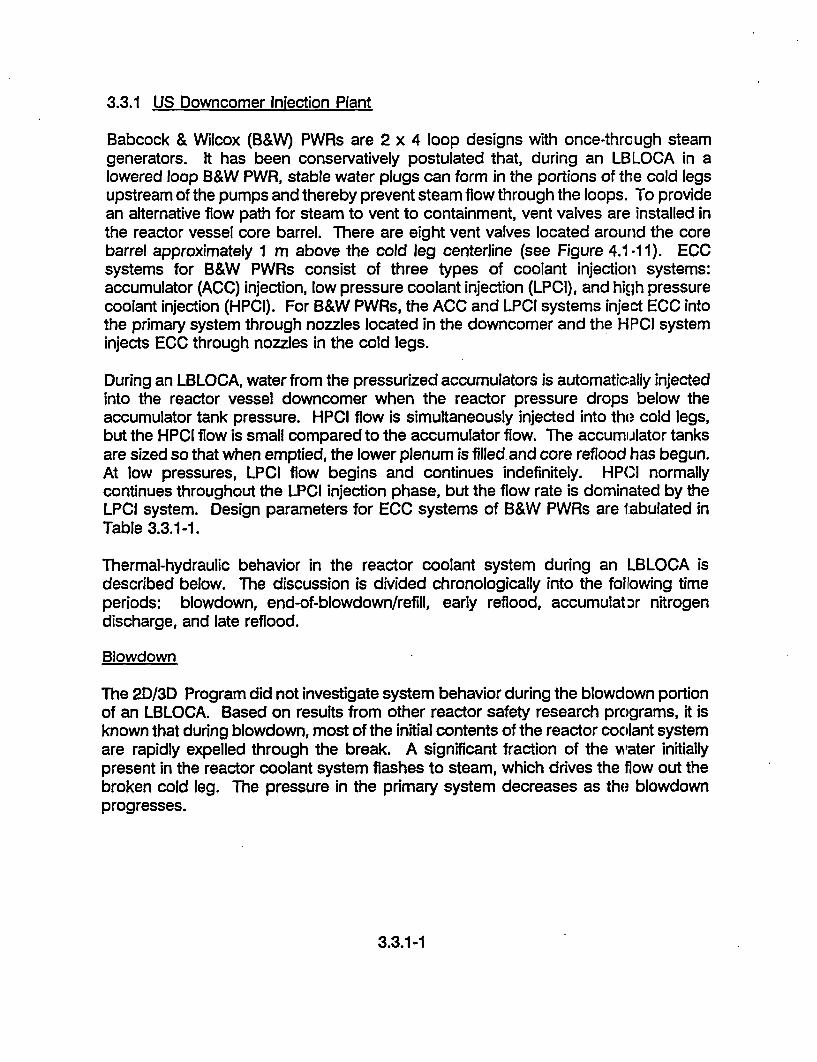
3.3.1 US Downcomer Iniection Plant
Babcock & Wilcox (B&W) PWRs are 2 x 4 loop designs with once-through steamgenerators. It has been conservatively postulated that, during an LBLOCA in alowered loop B&W PWR, stable water plugs can form in the portions of the cold legsupstream of the pumps and thereby prevent steam flow through the loops. To providean alternative flow path for steam to vent to containment, vent valves are installed inthe reactor vessel core barrel. There are eight vent valves located around the corebarrel approximately 1 m above the cold leg centerline (see Figure 4.1-11). ECCsystems for B&W PWRs consist of three types of coolant injection systems:accumulator (ACC) injection, low pressure coolant injection (LPCI), and high pressurecoolant injection (HPCI). For B&W PWRs, the ACC and LPCI systems inject ECC intothe primary system through nozzles located in the downcomer and the HPCI systeminjects ECC through nozzles in the cold legs.
During an LBLOCA, water from the pressurized accumulators is automatically injectedinto the reactor vessel downcomer when the reactor pressure drops below theaccumulator tank pressure. HPCI flow is simultaneously injected into the cold legs,but the HPCI flow is small compared to the accumulator flow. The accumulator tanksare sized so that when emptied, the lower plenum is filled and core reflood has begun.At low pressures, LPCI flow begins and continues indefinitely. HPCI normallycontinues throughout the LPCI injection phase, but the flow rate is dominated by theLPCI system. Design parameters for ECC systems of B&W PWRs are tabulated inTable 3.3.1-1.
Thermal-hydraulic behavior in the reactor coolant system during an LBLOCA isdescribed below. The discussion is divided chronologically into the following timeperiods: blowdown, end-of-blowdown/refill, early reflood, accumulator nitrogendischarge, and late reflood.
Blowdown
The 2D/3D Program did not investigate system behavior during the blowdown portionof an LBLOCA. Based on results from other reactor safety research programs, it isknown that during blowdown, most of the initial contents of the reactor coolant systemare rapidly expelled through the break. A significant fraction of the water initiallypresent in the reactor coolant system flashes to steam, which drives the flow out thebroken cold leg. The pressure in the primary system decreases as the blowdownprogresses.
3.3.1-1

End-of-Blowdown/Refill (see Figure 3.3.1-1)
During the end-of-blowdown, the reactor coolant system is filled with steam except fora small amount of water in the lower plenum. Vent valves located in the core barrelabove the cold leg centerline provide a steam path from the upper plenum directly tothe downcomer. Steam is vented to containment by flowing around the bottom of thecore barrel and up the downcomer to the break and by flowing through the ventvalves and around the downcomer to the break. The water inventory in the lowerplenum continues to decrease from entrainment by the steam flow around the corebarrel and from flashing due to decreasing system pressure. Steam flow in the coreprovides limited core cooling which is eliminated as the flow stops at the end-of-blowdown.
When the system pressure has decreased below the accumulator pressure(4,200 kPa), the accumulators automatically inject ECC into the downcomer. Thereis a small amount of HPCI injection to the cold legs, but this flow is negligible relativeto the ACC injection. In the downcomer, the steam upflow initially entrains the injectedECC directly out the broken cold leg (ECC bypass) thereby preventing ECC fromrefilling the lower plenum. However, as blowdown proceeds and the steam flowdecreases, bypass also decreases and ECC is delivered to the lower plenum. InUPTF tests for cold leg injection, ECC delivery to the lower plenum from the loopsaway from the break begins at a pressure of about 800 kPa. As discussed inSection 4.1.2, there were no transient full-scale tests which simulated B&W PWRs.However, because the steady-state full-scale test results for downcomer injection (withvent valves) were similar to the test results for cold leg injection, ECC delivery to thelower plenum for downcomer injection is expected to begin at approximately the samepressure. Thus, delivery to the lower plenum from the nozzle opposite the breakbegins at approximately 800 kPa. Delivery from the nozzle adjacent to the breakbegins later in the end-of-blowdown when the steam upflow is significantly reduced.
At the completion of blowdown, the lower plenum is filled almost to the bottom of thecore barrel. Within a few seconds of the end of depressurization, the vessel is filledto the core inlet and refill is complete. Hence, refill and blowdown are overlappingrather than consecutive. Overlapping blowdown and refill reduces the time to corereflood, and therefore the adiabatic heat-up period. It was estimated inReference U-460 that the reduction in cladding temperature at reflood initiation foroverlapping blowdown and refill versus consecutive blowdown and refill isapproximately 100 K (see Section 4.1.2).
3.3.1-2

Early Reflood (Accumulator Injection)
In the early portion of reflood, the downcomer water level increases rapidly due to thehigh ECC flow from the accumulators. Based on CCTF test results, the downcomerwater level reaches the cold leg elevation resulting in water spillover out the brokencold leg. Heat release from the vessel wall is initiated as the downcomer fills. Testsand analyses show that this heat release does not cause vaporization of thedowncomer water inventory because the subcooling of the water delivered to thevessel is sufficient to suppress boiling.
The downcomer water level increase drives water into the core. Steam generation inthe core begins first at the bottom of the core as water enters the core from the lowerplenum. However, within a few seconds, water entrained by the boiling process isdistributed throughout the core and core cooling occurs at all elevations. In B&Wlowered loop plants, stable water plugs can form in the intact cold legs which preventsteam flow through the intact loops. Thus, all of the steam generated in the core isvented through the vent valves to the downcomer and then out the break tocontainment. Some of the water in the upper core is carried by steam flow out of thecore to the vent valves.
Initially, the core flooding rate is high and the collapsed water level in the coreincreases rapidly. When the downcomer water level reaches the cold leg elevationand water spills out the break, the core flooding rate decreases quickly. However,since the core steam generation is essentially the same as during early reflood, thereduction in the core flooding rate results in lower rates of water accumulation in thecore and water carryover out of the core.
Water carried out of the core is either de-entrained in the upper plenum or carried withthe steam through the vent valves to the downcomer. Water which is de-entrained inthe upper plenum either accumulates as a two-phase mixture or falls back to the core.
Accumulator Nitrogen Discharge
When the water in the accumulators is depleted, the nitrogen that pressurizes theaccumulators escapes through the ECC piping. Water in the top of the downcomeris pushed toward the break. The primary system (particularly the region into whichthe nitrogen is injected) is pressurized for a short time until the nitrogen escapes tocontainment. System pressure is further increased due to the suppression of steamcondensation by the presence of the non-condensible nitrogen. The accumulation ofuncondensed steam contributes to the temporary pressurization of the downcomerand cold leg regions of the primary system.
3.3.1-3
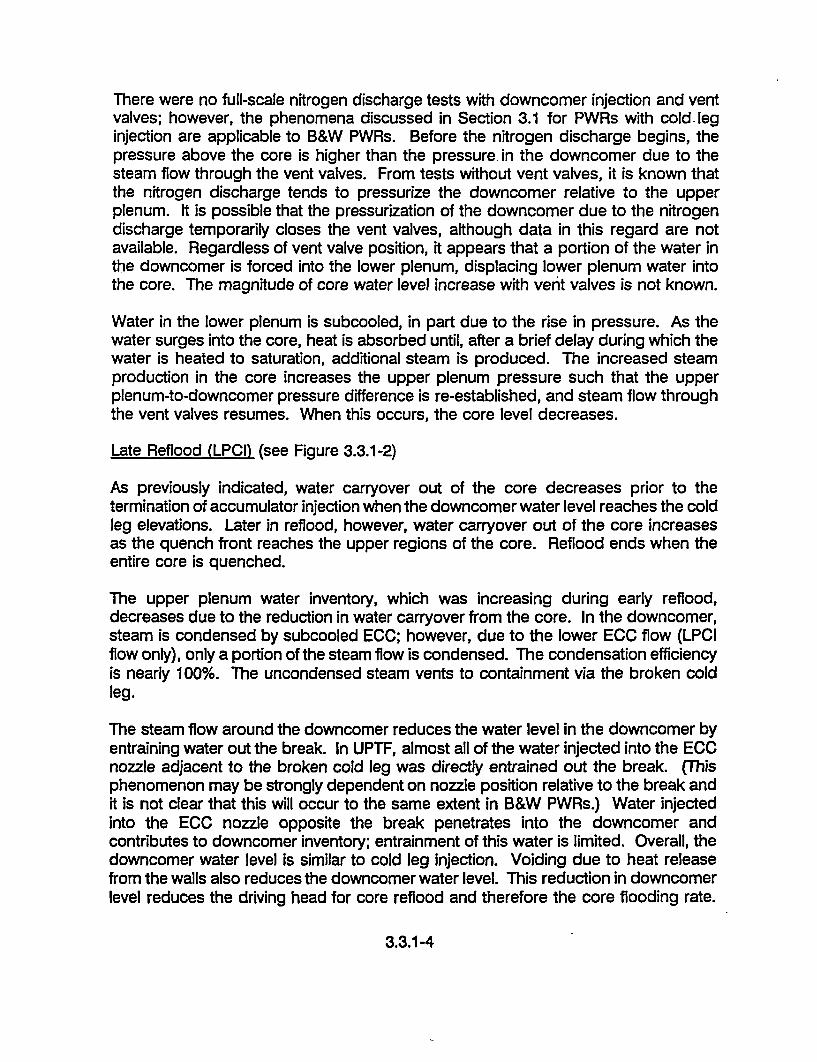
There were no full-scale nitrogen discharge tests with downcomer injection and ventvalves; however, the phenomena discussed in Section 3.1 for PWRs with cold. leginjection are applicable to B&W PWRs. Before the nitrogen discharge begins, thepressure above the core is higher than the pressure. in the downcomer due to thesteam flow through the vent valves. From tests without vent valves, it is known thatthe nitrogen discharge tends to pressurize the downcomer relative to the upperplenum. It is possible that the pressurization of the downcomer due to the nitrogendischarge temporarily closes the vent valves, although data in this regard are notavailable. Regardless of vent valve position, it appears that a portion of the water inthe downcomer is forced into the lower plenum, displacing lower plenum water intothe core. The magnitude of core water level increase with vent valves is not known.
Water in the lower plenum is subcooled, in part due to the rise in pressure. As thewater surges into the core, heat is absorbed until, after a brief delay during which thewater is heated to saturation, additional steam is produced. The increased steamproduction in the core increases the upper plenum pressure such that the upperplenum-to-downcomer pressure difference is re-established, and steam flow throughthe vent valves resumes. When this occurs, the core level decreases.
Late Reflood (LPCI) (see Figure 3.3.1-2)
As previously indicated, water carryover out of the core decreases prior to thetermination of accumulator injection when the downcomer water level reaches the coldleg elevations. Later in reflood, however, water carryover out of the core increasesas the quench front reaches the upper regions of the core. Reflood ends when theentire core is quenched.
The upper plenum water inventory, which was increasing during early reflood,decreases due to the reduction in water carryover from the core. In the downcomer,steam is condensed by subcooled ECC; however, due to the lower ECC flow (LPCIflow only), only a portion of the steam flow is condensed. The condensation efficiencyis nearly 100%. The uncondensed steam vents to containment via the broken coldleg.
The steam flow around the downcomer reduces the water level in the downcomer byentraining water out the break. In UPTF, almost all of the water injected into the ECCnozzle adjacent to the broken cold leg was directly entrained out the break. (Thisphenomenon may be strongly dependent on nozzle position relative to the break andit is not clear that this will occur to the same extent in B&W PWRs.) Water injectedinto the ECC nozzle opposite the break penetrates into the downcomer andcontributes to downcomer inventory; entrainment of this water is limited. Overall, thedowncomer water level is similar to cold leg injection. Voiding due to heat releasefrom the walls also reduces the downcomer water level. This reduction in downcomerlevel reduces the driving head for core reflood and therefore the core flooding rate.
3.3.1-4

However, as discussed in Section 4.2.2, calculations show that the increase incladding temperature due to the level reduction is small (about 13 - 18 K-seeReference U-460).
3.3.1-5

Table 3.3.1-1
ECC SYSTEM DESIGN PARAMETERS FOR B&W PWRS
Accumulators HPCI LPCI
PWR Vendor/Class WaterPressure Volume Number Pump Flow Number Pump Flow
Quantity kPa (psia) per of m3/hr (gpm) of m3/hr (gpm)Accumulator Pumps PumpsM3 (ft3) I1-
Babcock & 2 4200 30 3 114 2 680Wilcox/2600 MWt () (615) (1040) (500) (3000)
NOTE:
1. The reference reactor for a 2600 MWt B&W PWR is Crystal River Unit 3 operated by Florida Power Corporation; designparameters obtained from Reference E-513.
54W,

Note: For simplicity hot legs are NOT shownand only one intact cold leg is shown
Note: For simplicity hot legs are NOT shown-and only one intact cold leg is shown
AccumulatorInjection
Cold Leg
C',-L
Legend:
4--Steam Flow
Water Flow
Water
Legend:
Steam Flow
Water Flow
Water
Two-phaseMixture
Two-phaseMixture
SUMMARY OF LBLOCA BEHAVIOR IN A B&W PWREND-OF-BLOWDOWN/REFILL
SUMMARY OF LBLOCA BEHAVIOR IN A B&W PWRREFLOOD
FIGURE 3.3.1-1 FIGURE 3.3.1-2


3.3.2 FRG Downcomer Injection Plant
The Muelheim-Kaerlich (MK) plant in the FRG, which was built by Brown BoveriReactor (BBR-now Asea Brown Boveri or ABB), is a 2 x 4 loop PWR similar in designto a raised loop Babcock & Wilcox (B&W) PWR. Like B&W PWRs, the MK reactorvessel is equipped with vent valves in the core barrel to allow steam to vent directlyfrom the upper plenum to the downcomer during a LOCA. The vent valves arelocated approximately 1 m above the hot leg nozzles.
The configuration of ECC system of the MK PWR is shown in Figure 3.3.2-1. TheECCS has four separate systems. Two of the systems inject ECC directly into thedowncomer and two systems inject ECC into the loops. For each loop, ECC isinjected into only one of the two cold legs. Each system consists of three types ofinjection; namely, high pressure coolant injection (HPCI), accumulator (ACC ) injection,and low pressure coolant injection (LPCI). The primary system pressure at which thedifferent types of injection initiate are listed below.
" HPCI 12,750 kPa
" ACC 4,200 kPa
" LPCI 1,300 kPa
Overall behavior in an ABB/BBR PWR during an LBLOCA is described below basedon findings from 2D/3D tests and the results of a TRAC-PF1/MOD1 calculation for theMK PWR (Reference G-662). The discussion below is divided into the following timeperiods: blowdown, end-of-blowdown/refill, and reflood.
Blowdown
System behavior during blowdown was not investigated within the 2D/3[) Program.This discussion is based on the results of other safety research programs, and theresults of code analyses.
Upon initiation of the break, the pressure in the primary system decreases rapidly asthe water inventory expands and fluid is discharged out the break. When the systempressure reaches saturation pressure (12,500 kPa), steam is produced by flashing andheat transfer in the core, and the rate of depressurization decreases. Steam producedin the core vents to containment by flowing through the vent valves to the downcomerand out the break. As the primary system inventory decreases, the lower plenumwater seal is lost. This allows some of the steam in the core to flow around thebottom of the core barrel and up the downcomer to the break.
3.3.2-1

End-of-Blowdown/Refill (see Figure 3.3.2-2)
During the end-of-blowdown, the primary system is filled with steam except for thelower plenum which still contains some water. Steam in the reactor vents out thebroken cold leg by flowing through the vent valves and around the downcomer to thebreak, and by flowing around the bottom of the core barrel and up the downcomerto the break. Based on UPTF tests, the steam flow through the vent valves constitutes30-40% of the total steam flow (see Section 4.1.2).
When the primary system pressure decreases below 4,200 kPa the ACCsautomatically start to inject ECC into the downcomer and cold legs. Steam condenseson the high flow of highly subcooled ECC. The high condensation rate reduces thesystem pressure and accelerates system depressurization. At the end of blowdown,the primary system pressure is actually lower than containment pressure; thereforesteam flows into the primary system from containment.
The upflow in the downcomer initially entrains all the ECC flow directly out the brokencold leg (ECC bypass); however, as blowdown proceeds and the upflow decreases,bypass also decreases and ECC is delivered to the lower plenum. Per the UPTFtests, ECC injected adjacent to the break is largely bypassed during blowdown.Consequently, lower plenum refill is primarily due to delivery of ECC injected awayfrom the break (see Section 4.1.2).
By the completion of blowdown, the lower plenum is filled to the bottom of the corebarrel. A few seconds later, the vessel fills to the core inlet and refill is complete.Hence, the end-of-blowdown and refill are overlapping rather than consecutive. Thisreduces the time to core reflood and therefore the core heatup period. Consequently,cladding temperatures at reflood initiation are lower than for consecutive end-of-blowdown and refill. As indicated in Section 4.1.2, the reduction in claddingtemperatures at reflood initiation is about 100 K.
Reflood (see Figure 3.3.2-3)
ECC flows down the downcomer to the lower plenum and into the core. Steamgeneration initiates at the bottom of the core as water enters the core. Quenchpropagation is therefore from the bottom up. Water entrained by the boiling processis carried to the upper regions of the core providing core cooling above the quenchfront. Overall, thermal-hydraulic behavior in the core is similar to that described inSection 3.1 for cold leg injection PWRs. However, the core flooding rate is higher thanin cold leg injection PWRs because, as discussed below, the back pressure for ventingsteam from the core is lower.
3.3.2-2

Steam generated in the core is vented to containment via the upper plenum and eitherthe vent valves or reactor coolant loops. Since the flow resistance of the reactorcoolant pumps is large compared to the vent valves, most of the steam flows throughthe vent valves and only a small amount flows through the loops. Due to the low flowthrough the loops, the flow pressure drop for the steam venting from the core(i.e., system back pressure) is lower than for cold leg injection PWRs.
In the upper plenum, some of the water carried out of the core de-entrain.; and eitherfalls back to the core or accumulates. The remainder of the water is either entrainedby the steam flow through the vent valves or carried over to the loops. However,since the steam flow through the loops is small, carryover to the hot legs and steamgenerators is low.
3.3.2-3

pump pumpboron waterstorage tank
boron waterstorage tank
boron waterstorage tank
993 cm2 each
core
pump pump
ECCS CONFIGURATION FOR MK PWR
FIGURE 3.3.2-1
3.3.2-4
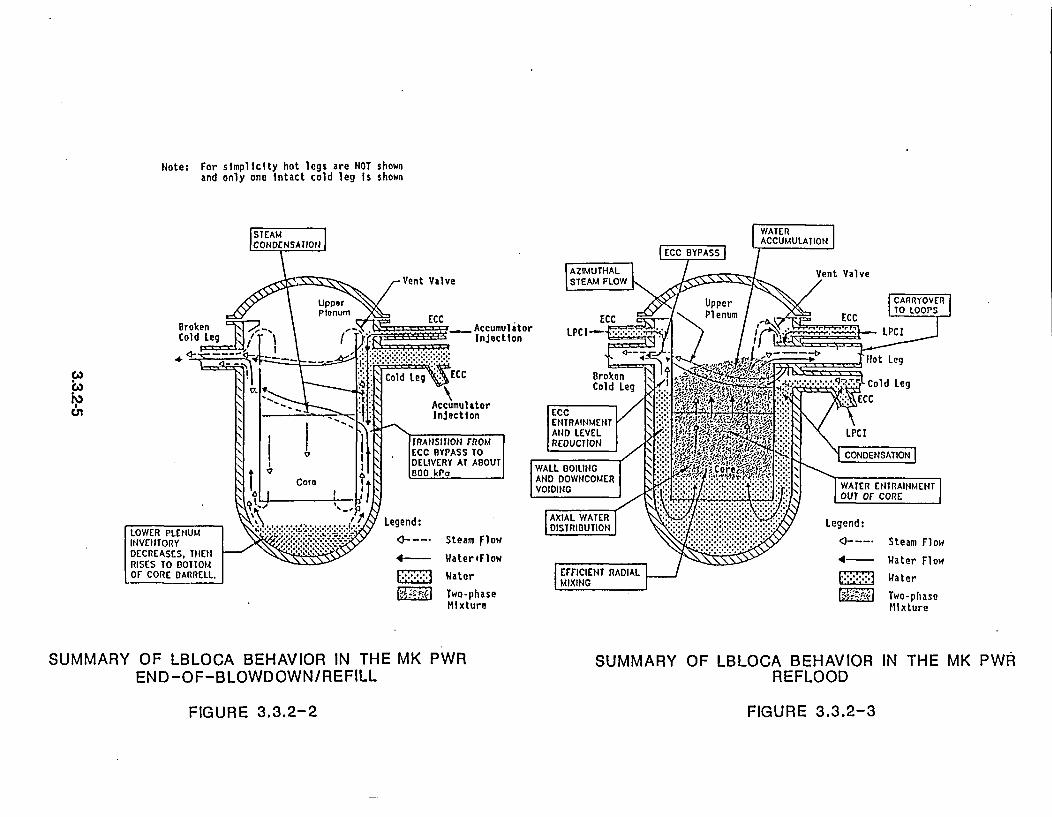
Note: For simplicity hot legs are NOT shownand only one intact cold leg is shown
AccumulatorInjection
CA)
V1
SUMMARY OF LBLOCA BEHAVIOR IN THE MK PWREND-OF-BLOWDOWN/REFILL
SUMMARY OF LBLOCA BEHAVIOR IN THE MK PWRREFLOOD
FIGURE 3.3.2-2 FIGURE 3.3.2-3


3.3.3 Japanese Downcomer Injection Plant
Some Japanese PWRs with a power rating of about 500 MWe are equipped withdowncomer injection-type ECCS. These PWRs have two reactor coolant loops withone hot leg and one cold leg per loop. Unlike the B&W and ABB/BBR PWRs withdowncomer injection, these PWRs do not have vent valves in the core barrel.
As shown in Figure 3.3.3-1, the ECCS for these two-loop PWRs consists ofaccumulators, high pressure injection (HPI) pumps, and low pressure injection (LPI)pumps. The design parameters for each part of.the ECCS are listed in Table 3.3.3-1.The LPI pumps inject water directly into the downcomer. The two injection nozzles arelocated on the side wall of the downcomer at about the cold leg elevation. Since eachof the two LPI pumps are connected to both injection nozzles, ECC is injectedsymmetrically in both the no-LPI-pump failure case and the single-failure case. Theratio of the effective LPI flow rate to core power is approximately 20% hig her than infour-loop PWRs.
The ACCs and HPI pumps inject ECC through nozzles in the cold legs. Each of thetwo ACCs is connected to both cold legs. Similarly, both HPI pumps inject ECC intoboth of the cold legs. The ratio of the effective ACC water volume to core power isapproximately the same as in the four-loop PWRs.
The cold leg diameter and downcomer gap for these two-loop PWRs with clowncomerinjection are comparable to those of four loop PWRs. However, since the primarysystem volume is about half that of four-loop plants, the break area relative, to systemvolume is larger in the two-loop PWRs.
System behavior in a two-loop PWR with downcomer injection is described brieflybelow. The description is divided into the following time periods: blowdown, end-of-blowdown/refill, early reflood, accumulator nitrogen discharge, and late reflood. Thedescription of late reflood includes both evaluation model (EM) and best-estimate (BE)conditions.
Blowdown
System behavior during the blowdown portion of an LBLOCA for the two-loopdowncomer injection PWR should be essentially the same as that for the four-loopcold leg injection PWR (see Section 3.1). However, as indicated above, the break arearelative to the system volume is larger for the two-loop PWR. Consequently, theprimary system pressure is expected to decrease faster in the two-loop, downcomerinjection PWRs than in larger four-loop PWRs (i.e., blowdown is shorter).
3.3.3-1

End-of-Blowdown/Refill
When the primary system pressure has decreased below the ACC pressure, the ACCsautomatically start to inject ECC into the cold legs. A water plug forms in the intactcold leg as the steam flow through the loop is condensed by the high flow ofsubcooled ECC. The water plug oscillates in the cold leg causing fluctuations in theflow of ECC into the downcomer. Shortly after the start of ACC injection when theprimary system pressure has decreased further, the LPI system starts to inject ECCdirectly into the downcomer.
Initially, the two-phase (steam with entrained water) upflow in the downcomer entrainsthe ECC out the broken cold leg (i.e., ECC bypass); however, as blowdown proceedsand the upflow decreases, the bypass also decreases and ECC is delivered to thelower plenum. Lower plenum refill is initiated primarily by ACC injection into the intactcold leg. Since the LPI flow rate into the downcomer is small in comparison to theACC injection into the intact cold leg, lower plenum refill behavior should becomparable to that for cold leg injection PWRs (see Section 3.1).
By the completion of blowdown, the lower plenum is filled almost to the bottom of thecore barrel. Within a few seconds of the end of depressurization, the lower plenumwater level reaches the core and refill is complete. Hence, refill and blowdown areoverlapping rather than consecutive. This limits the cladding temperatures at refloodinitiation by reducing the duration of the adiabatic heat-up period.
Early Reflood (Accumulator Iniection)
In the early portion of reflood, the downcomer fills rapidly with subcooled water. Thewater level in the downcomer stabilizes at the cold leg elevation as water spills out thebroken cold leg. This increase in downcomer water level forces water into the core.Steam generation initiates at the bottom of the core as water enters the core from thelower plenum; however, within a few seconds, water entrained by the boiling processis present throughout the core and core cooling is occurring at all elevations.
Steam and entrained water from the core enter the upper plenum where part of thewater de-entrains and accumulates. Steam exits the upper plenum via the intact andbroken loop hot legs. The steam which flows through the intact loop is completelycondensed in the cold leg by the subcooled ECC injection.
Accumulator Nitrogen Discharge
Thermal-hydraulic behavior during ACC nitrogen discharge is expected to be the sameas that described in Section 3.1 for cold leg injection PWRs. Specifically, the flow ofnitrogen into the downcomer pressurizes the downcomer and suppressescondensation in the intact cold leg until the nitrogen is vented out the break. The
3.3.3-2

increase in downcomer pressure forces water from the downcomer into the core;however, this insurge of water increases steam generation in the core whichpressurizes the upper plenum and forces water back into the downcomer.
Late Reflood (LPCl)
ECC injected into the cold leg and downcomer flows down the downcomer to thelower plenum and into the core. Due to the downcomer water level oscillationsdescribed below, the core flooding rate is oscillatory. The average core flooding rate,however, is nearly constant for the duration of the transient. Overall, therm al-hydraulicbehavior in the core is similar to that described in Section 3.1 for cold leg injectionPWRs.
Some of the water carried out of the core de-entrains and either falls back to the coreor accumulates in the upper plenum, hot legs, and steam generator inlet plena. Theremainder of the water carryover from the core is carried over to the stearm generatorU-tubes. Heat transfer from the secondary side vaporizes entrained water in theU-tubes; hence, flow in cold legs consists of single-phase, superheated s3team.
In the intact cold leg, steam is condensed by the subcooled ECC injection; however,due to the reduction in ECC injection into the cold leg (HPCI versus ACC and HPCI),only a portion of the steam flow is condensed. The resultant flow regime in the intactcold leg is stratified with steam flow over the ECC flow to the downcomer.
The steam flow from the intact loop enters the downcomer where some cf the steamis condensed by the ECC injection into the downcomer. Condensation is intermittentas U-tube oscillations of the core and downcomer water levels occur. When thedowncomer water level is below the ECC injection nozzle, steam condensationincreases due to good steam access to the ECC injection stream and subcooled wateron top of the downcomer water column. Increased condensation reduces thepressure in the downcomer relative to the core pressure which forces water out of thecore and into the downcomer. The increase in steam condensation alsc. warms thetop portion of the downcomer water column to near saturation. As the downcomerwater level rises, steam access to the ECC injection stream is blocked by saturatedwater and condensation is reduced. The reduction in condensation increases thedowncomer pressure which forces water from the downcomer back into the core andstarts the cycle again (Reference J-973). The character of this oscillation is influencedby the vertical position of the downcomer injection nozzles slightly below the cold legnozzles.
Overall, condensation in the two-loop downcomer injection PWRs is low becausecontact between steam and the LPCI flow is limited; consequently, ECC accumulatingin the downcomer is still subcooled. The subcooling is sufficient tb suppressdowncomer voiding.
3.3.3-3

The downcomer water level and condensation oscillations described above areexpected to occur only for the single-failure case. In the no-failure case, completecondensation of the steam flow from the intact cold leg into the downcomer isexpected.
3.3.3-4
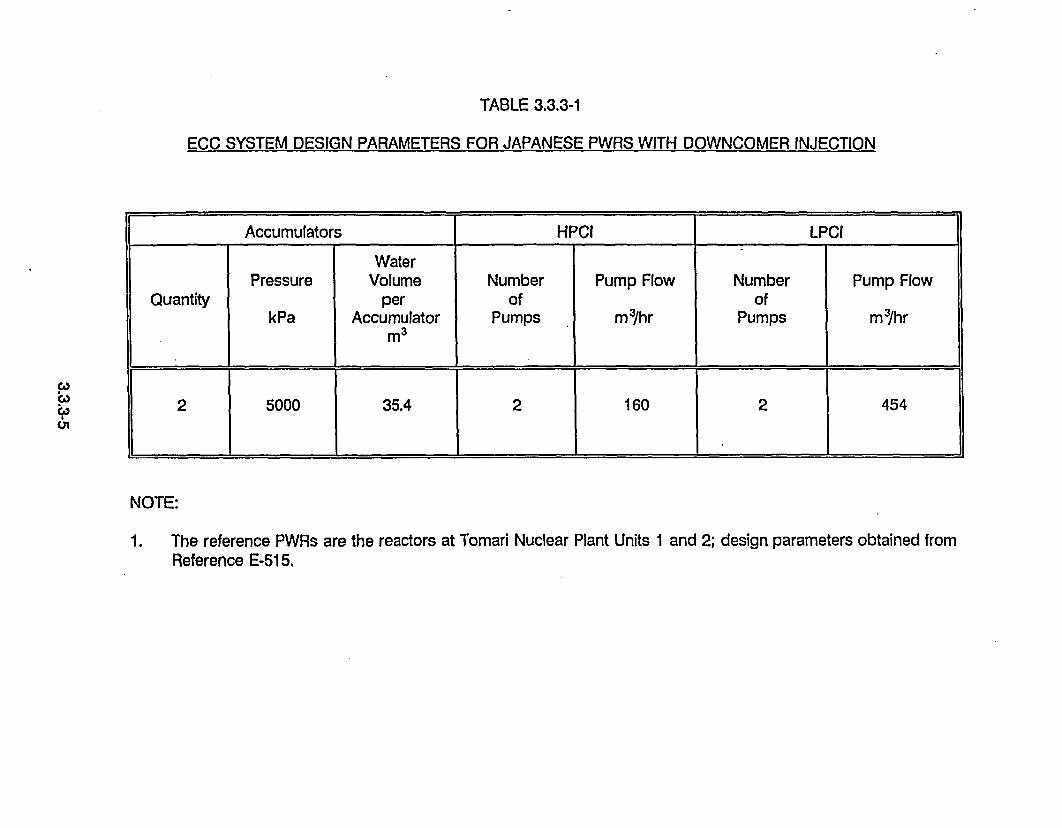
TABLE 3.3.3-1
ECC SYSTEM DESIGN PARAMETERS FOR JAPANESE PWRS WITH DOWNCOMER INJECTION
CA,
cj~~01
Accumulators HPCI LPCI
WaterPressure Volume Number Pump Flow Number Pump Flow
Quantity per of ofkPa Accumulator Pumps m3/hr Pumps m3/hrm 3
2 5000 35.4 2 160 2 454
NOTE:
1. The reference PWRs are the reactors at Tomari Nuclear Plant Units 1 and 2; design parameters obtained fromReference E-515.

I
SG Steam GeneratorPZR Pressurizer
RWST Refueling Water Storage TankAcc AccumulatorHPI High Pressure Injection PumpLPI Low Pressure Injection Pump
ECCS CONFIGURATION FOR JAPANESE PWR'S
WITH DOWNCOMER INJECTION.
FIGURE 3.3.3-1
3.3.3-6

3.4 UPPER PLENUM INJECTION (UPI) PLANT
In some two-loop PWRs in the US and Japan, low pressure coolant injection (LPCI)is into the upper plenum, rather than into the cold legs as in three- and four-loopplants. Except for the LPCI injection location, the ECC system configuration andinjection sequence at these PWRs are similar to that described in Section :3.1 for coldleg injection PWRs.
Blowdown, Refill, Early Reflood and Accumulator Nitrogen Discharge
Early in the LBLOCA transient, until the accumulator (ACC) water inventory is depleted,system behavior in an upper plenum injection (UPI) PWR is similar to that for a coldleg injection PWR. This is because ACC injection is into the cold legs in both typesof plants, and the ACC injection rate is much higher than the LPCI flow rate.Accordingly, the behavior during the blowdown, end-of-blowdown/refill, and earlyreflood phases is similar to that described in Section 3.1. The only significantdifference is that some upper plenum accumulation and cooling of the rods near thetop of the core occurs due to the LPCI flow into the upper plenum during refill andearly reflood. The effects of accumulator nitrogen discharge in a UPI plant are alsoexpected to be the same as those in a cold leg injection plant (see Section 3.1), sincethe locations, timing, and relative amounts of nitrogen discharge are similar.
Late Reflood
The late reflood (LPCI) period, after depletion of accumulator inventory, is qualitativelydifferent in a UPI PWR. Figure 3.4-1 shows the hydraulic behavior in a UPI plantduring the late reflood period. The most notable characteristic is that ECC enters thecore from the top and the net flow rate at the bottom of the core is negalive (towardthe downcomer). A positive flow rate (flow from the downcomer to the core) is theflooding mechanism for plants with cold leg injection. Even though flow directions aredifferent for the two types of injection, there is similar liquid accumulation in the corewhich provides global core cooling; i.e. the net core flooding rate is similar to that forcold leg injection.
ECC water flows from the upper plenum down to the core in a local region, coveringabout 10% of the core. The size of the downflow region in a UPI plant is determinedby interpolating between CCTF (subscale) and UPTF (above full-scale). L'IPTF resultsshow there is a small amount of subcooling (10 - 15 K) in the downflow. Thedownflow region is beneath the ECC injection nozzle and does not change during thetransient. CCTF results show that the initial downflow partially quenches the rods inthe downflow region so that less steam is generated in that region for the remainder
3.4-1

of the transient, and, consequently, there is less resistance to water downflow. Nearthe top of the core in the downflow region, core cooling is enhanced by thedownflowing water. In other core regions, an upflowing steam/water mixture providescooling, comparable to that in cold leg injection PWRs.
Subcooled injection water and steam generated in the core mix completely in theupper plenum and the top of the core, leading to significant steam condensation.Based on UPTF data with an extensive network of thermocouples, it appears most orall of the mixing occurs in the upper plenum. As discussed above, this means thatwater delivered to the core has a small amount of subcooling. The major result is thatthe amount of steam which needs to be vented through the loops to containment isdecreased by condensation. For a single-failure LPCI assumption, the injected watercondenses about 40% of the steam produced in the core at the beginning of reflood,and a higher fraction as the core heat release decays. For a no-failure LPCIassumption, the steam flow is entirely condensed.
In the upper plenum, accumulation of water to a steady-state inventory occurs quickly;i.e., within several seconds after start of reflood. UPTF results show that the waterdistribution across the flow area is uniform except at the breakthrough region wheremore water accumulates. The differential pressure resulting from water accumulationis a small fraction of the total loop differential pressure.
In a UPI plant, a larger fraction of the injected water is carried over to the hot legs andsteam generators, in comparison to a cold leg injection plant. The result is that morewater is vaporized in the steam generators, contributing to the steam binding effectwhich degrades core cooling. Thus, the UPI configuration has two opposing effectson steam binding; condensation in the upper plenum (discussed above) reduces theamount of steam flowing through the loops, while liquid carryover to the steamgenerators increases the steam flow rate. CCTF results indicate the net effect is abenefit (less resistance to steam venting) compared to a cold leg injectionconfiguration. In the PWR, the carryover rate is expected to be less, and thecondensation rate the same, as in CCTF (based on scaling effects as deduced fromcomparison of CCTF and UPTF results) so the net effect of UPI in a PWR should beless steam binding.
3.4-2

BROKENLOOP BEKCL I
/ • y/ [ [}DOWNVLOW C•NAXIAL WATER L
DISTIBUTON I ,0.----- Steam F
AND RDIAL I , - water FI
UPFLW RGIONI • water
TwoPhi
SUMMARY OF LBLOCA BEHAVIOR IN A UPI PWR
LATE REFLOOD
FIGURE 3.4-1
3.4-3

Section 4
EVALUATION OF TESTS AND ANALYSES TOADDRESS KEY REACTOR SAFETY ISSUES
This section summarizes the evaluations of the experimental and analytical results ofthe 2D/3D Program to address various reactor safety issues. Each issue is coveredindividually in the manner shown in Figure 4-1. For each issue the phenomena andtheir importance are defined, tests and analyses related to the issue are identified, andthe conclusions and applications to the PWRs are discussed. Each issue is; discussedin a separate section. For issues relevant to PWRs with different ECCS con~figurations,the application of the test and analysis results to PWRs are covered •In separatesubsections by ECCS configuration. These separate subsections also includetechnical findings and conclusions which are specific to a given ECCS ccnfiguration.
4-1


4.1 ECC DELIVERY TO LOWER PLENUM DURING DEPRESSURIZATION
Definition of Issue and Description of Phenomena
In a large, cold leg break LOCA at a PWR, most of the initial contents of the reactorcoolant system are rapidly expelled through the break. A two-phase mixture offlashing and entrained fluid is forced up the downcomer and out the broken cold leg,as the pressure in the primary system decreases from its initial value of 15,500 kPato an "equilibrium" value of 200 - 400 kPa, which represents the equilibrium pressurebetween the primary system and containment. When the pressure has decreased toa predetermined value in the range of 1,400 - 4,600 kPa, depending on plant design,the accumulators begin to automatically inject ECC into the reactor coolant system.The purpose of this ECC is to rapidly refill the reactor vessel lower plenum and startreflooding the reactor core.
When the accumulator ECC (which is highly subcooled) is first injected, the system isstill blowing down. During the end-of-blowdown (EOB), the steam/water flow path isup the downcomer and out the broken cold leg nozzle (see Figure 4.1-1). The two-phase upflow may entrain some or all of the ECC injected into the cold Iegs and/ordowncomer directly out the broken cold leg. This is referred to as "EGCC ypass". Asblowdown proceeds and the downcomer upflow decreases, the bypass alsodecreases and ECC can be delivered, allowing some initial filling of the lower plenum.
In PWRs with combined injection, ECC injected into the hot legs is delivered to thelower plenum via the upper plenum and core. When the steam flow around thebottom of the core barrel to the downcomer is high, a substantial part of the waterdownflow which reaches the lower plenum is entrained out the break. However, asthe steam flow decreases, entrainment decreases and delivery increases. The waterdownflow through the core initiates core cooling during end-of-blowdown (seeSection 4.6.3).
The "refill" phase of the LOCA starts with the initiation of ECC accumulation in thelower plenum and lasts until the reactor vessel water level reaches the bottom of thecore. During this phase, the reactor vessel average wall temperature tend 5 to be nearits full power value of 560 K; hence, steam generation on the hot walls can contributeto the overall steam flow up the downcomer.
Importance of Issue to PWR LOCA
The rapid depressurization of the reactor vessel and the resulting two-phase flow inthe lower plenum and downcomer tend to prevent the accumulation of ECC in thelower plenum. The interaction of the steam/water flow in the lower plenum anddowncomer is important since it affects how quickly the reactor vessel refills.Specifically, for cold leg or downcomer injection, ECC delivery to the lower plenum is
4.1-1
controlled by the countercurrent flow limitation in the downcomer. However, for hotleg injection, ECC accumulation in the lower plenum is controlled by entrainment bythe steam flow around the bottom of the core barrel. Higher ECC delivery andaccumulation during the blowdown phase reduces the duration of the refill phase,limiting the clad temperature at the beginning of reflood.
Tests and Analyses that Relate to the Issue
ECC delivery to the lower plenum during blowdown has been investigated innumerous transient and quasi-steady tests both in the 2D/3D Program and elsewhere.The transient tests evaluated the transient progression of phenomena under typicalPWR conditions at the EOB and the quasi-steady tests evaluated downcomercountercurrent flow under controlled conditions. Table 4.1-1 lists only the testsconsidered in this report. In the 2D/3D Program, tests were performed at UPTF andCCTF to investigate ECC delivery at large-scale. The UPTF tests included tests withcold leg ECC injection, downcomer ECC injection, and combined ECC injection. Thecold leg ECC injection tests consisted of Tests 4A and 5A which were transient EOBsimulations, and Tests 5B, 6, and 7 which were quasi-steady tests. The downcomerECC injection tests consisted of Tests 21 A, 21 B, and 22 which were quasi-steadytests, and Test 24 which was a transient test. The combined injection tests includedTests 3, 18, 19, and 28 which were transient tests. In CCTF, three cold leg injectiontransient tests (C2-11, C2-14, and C2-17) and three combined injection transient tests(C2-19, C2-20, and C2-21) simulated EOB/refill conditions.
Outside the 2D/3D Program, several small-scale tests with various geometries andflow conditions have been performed (see Reference E-401). Table 4.1-1 lists thefacilities that are included in the scale comparisons presented in this report.
The evaluations of the UPTF cold leg injection tests and downcomer injection tests,including comparisons to subscale tests are provided in References U-455 and U-460,respectively. Evaluation of the UPTF combined injection tests is covered inReference G-41 1. The major results of these evaluations and comparisons aresummarized below.
Several post-test TRAC calculations of the UPTF tests have also been performed(References U-711 and U-715). These have included TRAC-PF1/MOD1 calculationsof all UPTF Test 6 runs (Reference E-61 1), and TRAC-PF1/MOD2 calculations of UPTFTest 4A; Test 5A; Test 6, Run 133; and Test 7, Runs 200 and 201; Test 21A; andTest 22A (see Appendix B).
Summary of Key Results and Conclusions from Tests and Analyses
The following discussion focuses on the tests and analyses in which ECC was injectedinto only the cold legs and is applicable to PWRs with cold leg injection, cold
4.1-2

leg/downcomer injection, and combined injection. Application of these results toPWRs are covered in the following subsections by ECCS configuration. Thesubsections on downcomer injection (Subsection 4.1.2) and combined injection(Subsection 4.1.3) also cover tests and analysis results specific to these ECCSconfigurations.
The results of the full-scale UPTF tests have shown multidimensional phenomena inthe downcomer not previously observed in small-scale tests. The steam upflow andthe calculated ECC delivery to the lower plenum for the quasi-steady UPTF tests withcold leg injection are plotted in Figure 4.1-2. This plot shows that deliverycharacteristics are very different between the loop near the break (Loop 1) and theloops away from the break (Loops 2 and 3). Specifically, ECC injected into the loopnear the break was mainly bypassed while ECC injected in the loops away from thebreak was delivered to the lower plenum. Contour plots of fluid temperaturemeasurements (i.e., subcooling) in the downcomer are consistent with theseobservations (see Figure 4.1-3). Based on the delivery data in Figure 4.1-2 and fluidtemperature contour plots, Siemens identified the following flow regimes for ECCdelivery in UPTF (Reference G-907).
" Complete bypass from Loop 1 with partial delivery from Loops 2 and 3 for highsteam flows (>320 kg/s).
" Complete bypass from Loop 1 and nearly complete delivery from Loops 2 and 3for intermediate steam flows (..100 kg/s and <320 kg/s).
* Partial delivery from Loop 1 and complete delivery from Loops 2 and 3 for lowsteam flows (< 100 kg/s).
Several methods have been proposed to correlate these UPTF flooding data. Eachmethod is discussed briefly below.
The Siemens analysis (Reference G-907), discussed above, identified threedifferent flow regimes for countercurrent flow in the downcomer. These analysesindicated that ECC delivery from Loops 2 and 3 appears to be injection limited forsteam flows up to 320 kg/s. This suggests that the UPTF data do not reveal thetrue countercurrent flow limitation at steam flows less than 320 kg/s end leads toa representation of UPTF flooding characteristics as a three-region curve (seeFigure 4.1-2).
The correlation proposed by H. Glaeser includes a term for the proximity of eachECC injection location to the broken cold leg to account for the multidimensionalbehavior observed in the tests (see References G-415 and G-915). This term isapplied to steam flow (K*9) for each cold leg, resulting in a lower effective,dimensionless steam upflow at the loops away from the break, and therefore
4.1-3

higher ECC delivery from these loops. Similarly, for the cold leg near the break,the effective steam flow is higher, and ECC is more easily bypassed. Thecorrelation is plotted in Figure 4.1-4.
MPR calculated a simple best-fit correlation of the UPTF data using the j*parameter (Reference U-455). Separate correlations were done for runs withLoop 1 injection only and runs with uniform injection to all three loops. Theresulting curves are shown on Figure 4.1-5. Since some of the data are injection-limited, the correlation is not a CCFL correlation; however, the correlation isconsidered a useful tool for the comparison and application evaluations discussedin Reference U-455.
Although UPTF has provided the only full-scale test data on this issue, a large bodyof data has been obtained from small-scale tests, particularly from the Creare andBattelle Columbus Laboratoryfacilities (References E-417, E-001 through E-004, E-414,and E-420). The principal effort of these small-scale tests was to evaluate the effectof various downcomer flooding parameters on countercurrent flow limitation (CCFL)curves, at different facility scales. CCFL curves determined from the Battelle andCreare facilities were presented in RIL-128 (Reference E-412).
The previous evaluation of the small-scale data from Creare and Battelle ColumbusLaboratory (Reference E-412) recommended using momentum flux scaling (i.e., usingthe Kutateladze parameter or K*, to scale the complete bypass point) for applyingsmall-scale results to full-scale. However, the full-scale UPTF data indicate that Wallisparameter (j') scaling may be more appropriate. The calculated steam velocity, j*,. ata given delivery rate, j, is plotted versus the scale factor for UPTF and the five Creareand Battelle subscale facilities on Figure 4.1-6. The two plots show the calculatedsteam upflow (a* ) that would allow delivery rates (j * of 0.0125 (500 kg/s at full-scale)and 0.025 (1000 kg/s at full-scale) for a given injection rate (ij nof 0.037, or 1500 kg/sat full-scale). The calculated j'*'s for the subscale facilities were obtained using thecorrelation and constants from Reference E-412; the UPTF values were calculatedusing the best-fit correlation shown in Figure 4.1-5. Note that the j * value for500 kg/s delivery at UPTF is from the CCFL-limited portion of the data, wAile that for1000 kg/s delivery may be artificially low because delivery may have been injection-limited. As shown in the figure, the steam flow at full-scale for the given delivery ratesis better predicted by constant j'scaling than constant momentum flux scaling; hence,j* scaling may be more appropriate for predicting ECC delivery at full-scale(Reference U-455).
UPTF Test 4A was a transient test which simulated the EOB and refill phases of aLOCA. The pressure and lower plenum mass inventory transients for this test areshown in Figure 4.1-7. In terms of ECC delivery and bypass, two importantcharacteristics of the transient were identified. First, ECC delivery behavior occurredin two distinct phases: an initial period of very high two-phase downcomer upflow with
4.1-4

little ECC delivery and rapidly decreasing lower plenum inventory, then quicklychanging to a period of high, probably injection-limited, ECC delivery. The transitionbetween these periods occurred at a relatively high pressure (about 800 to 1200 kPa),well before the end of the blowdown phase). Second, the lower plenum inventorydeficit was rapidly recovered, and by the time blowdown was complete, the lowerplenum was filled almost to the bottom of the core barrel. The liquid level could notbe higher than the bottom of the core barrel since a flow path from the core to thedowncomer is required during blowdown.
Figure 4.1-7 also compares UPTF Test 4A with EOB/refill transients for open looptests at CCTF (CCTF Tests C2-14 and C2-17). The lower plenum mass is scaled upto UPTF using the lower plenum volume scale factor. Note that although the initialpressure for the tests is different, blowdown is completed for all tests at approximatelythe same time (19 to 24 seconds). More importantly, however, the location of themass turnaround point (the time at minimum lower plenum inventory) relative to thepressure transient is very different for UPTF and the CCTF tests. Specifically, thispoint occurs high on the pressure transient curve in UPTF (about 800 kPa), but almostat the end of the transient at CCTF (about 200 to 300 kPa). This key difference wasalso observed in comparisons of blocked loop tests (including UPTF Test 5A withCreare 1/5-scale Test 9066, and CCTF Test C2-11 -Reference U-455).
Although the mass turnaround point occurs earlier in UPTF, the general shape of theinventory transient is similar for all tests: before the turnaround, mass is lost from thelower plenum very quickly, but after, ECC delivery increases rapidly and may even beinjection limited. This indicates that the period of partial delivery of ECC may be verybrief (for the loops away from the break) and that large uncertainties in i:he floodingcurve may have little effect on the rate of water accumulation in the lower plenumwhen applied to estimating the EOB/refill transient. However, predicting the detailedtime history of lower plenum refill (e.g., initiation of delivery) depends on the accuracyof the flooding curve.
Post-test TRAC calculations of the quasi-steady UPTF tests were performed using bothMOD1 and MOD2. The MOD2 calculations predicted the multidimensional behaviorobserved in the tests when adequate model noding was used. Specifically, a modelwith eight azimuthal sectors, rather than four, was required to suitably predict multi-dimensional behavior. In the MOD2 calculations, the predicted delivery was greatlyimproved over MOD1 calculations. This improvement in the prediction of ECC deliverywith MOD2 is shown in Figure 4.1-8 which compares the ECC delivery rates calculatedwith MODI and MOD2 with the UPTF test data.
Post-test TRAC-PFI/MOD2 calculations of the transient UPTF tests predi,ted the keycharacteristics of these transients. Specifically, TRAC predicted an initial p .riod of highdowncomer upflow with little ECC delivery and decreasing lower plenum inventorywhich quickly changed to a period of high ECC delivery. Also, TRAC predicted that
4.1-5

the lower plenum was filled by the end of depressurization, which is consistent withthe test data.
4.1-6
4.1.1 Cold Leg Iniection
Two important implications for US/J PWRs arise from the UPTF countercurrent flowtest results. Delivery occurs first at loops away from the break and, a short time later,from the loop near the break. The transition from very low to very high EC deliveryalso occurs quickly (for the loops away from the break), and little time is spent on thepartial delivery portion of the CCFL curve. Thus it appears knowledge of the full-scaleCCFL curve with a high degree of certainty is not a requirement for accurate, best-estimate, EOB/refill predictions. In addition, the full-scale results appear 1:o be betterpredicted by j*, rather than K', scaling from small-scale results, which gives a morefavorable full-scale ECC delivery (Reference U-455).
Second, the mass turnaround point (i.e., the beginning of refill) during the EOB/refilltransient occurs well before the primary system is completely depressurized. Becauseof this, UPTF test results indicate that the lower plenum was essentially refilled to thebottom of the core barrel by the time the primary system pressure equalized withcontainment. In a PWR best-estimate calculation, allowing the lower plenum to berefilled by the end of the blowdown phase reduces the core adiabatic heat-up timebefore the beginning of the reflood phase. Assuming an overlapping blowdown andrefill reduces the time to core reflood by about 10 seconds over a consecutiveblowdown and refill. This reduces clad temperatures at the beginning of reflood byabout 100K (Reference U-455). Similar reductions in the overall peak clad temperaturewould also be expected. This indicates the conservatism in the assumption that refillis not initiated until blowdown is complete.
Several key differences, however, may have an effect on the applicability of theseUPTF results to PWRs. These differences include:
Cold Leg Arrangement - Wider cold leg spacing than in UPTF (which has loopsspaced at 450 and 1350 intervals like a Westinghouse plant) may result in differentbypass/delivery behavior from the loop near the break. With wider spacing (suchas in the reference Combustion Engineering plant with 600 x 120° spacing),delivery from the loop near the break may be enhanced.
Thermal Shield - No thermal shield was present in the UPTF downcomer. A "pad"type shield is estimated to reduce the downcomer flow area by about 10%,increasing superficial velocities by a similar amount. For a cylindrical shield,however the flow area blockage and superficial velocity increase is about 30%.While such an increase in velocity could reduce ECC delivery, the cylindrical shieldcould also create two flow channels, separating the upward and downward flows,and possibly improving delivery.
4.1-7

ECC Flow Rate - In the UPTF tests with ECC injection to three loops, the flow ratewas about 500 kg/s per loop. However, the typical ECC injection rate at the endof the accumulator discharge period is about 700 kg/s per loop for 3400 MWtclass Westinghouse PWRs and about 970 kg/s per loop for CombustionEngineering System 80 PWRs. Because more steam can be condensed at thehigher ECC flow rates, delivery would be higher, and the UPTF results areconservative.
The conclusion is that the UPTF results are representative of PWR behavior, althoughdowncomer configuration differences (such as cylindrical thermal shield) must beconsidered in applying these results (Reference U-455).
The ability of TRAC-PFI/MOD1 to predict ECC delivery to the lower plenum for coldleg injection PWRs was evaluated as part of the USNRC's Code Scaling, Applicability,and Uncertainty (CSAU) study. The evaluation was based largely on the analyses ofUPTF tests. While MOD1 significantly underpredicts delivery to the lower plenum (seeSection 4.1), the CSAU study determined that the impact of the poor prediction ofdelivery on the prediction of PCT was small. Specifically, it was estimated thatTRAC-PF1/MOD1 overpredicts PCT by as much as 19 K due to underpredicting ECCdelivery to the lower plenum (Reference E-61 1).
4.1-8
4.1.2 Downcomer Injection
The results of the UPTF tests with downcomer injection revealed multidimensionalcharacteristics of ECC delivery similar to that observed in the cold leg injection tests.The core simulator steam injection rate and calculated ECC penetration rate for thedowncomer injection tests are plotted in Figure 4.1-9. The plots show that ECCinjected through the nozzle near the break (Nozzle 1) was largely bypassed while ECCinjected through the nozzle away from the break (Nozzle 2) penetrated down thedowncomer. For example, in an open vent valve test with a steam flow of 100 kg/sand an ECC injection rate of 900 kg/s, the penetration rate for injection int:o Nozzle 1was near zero while the penetration rate for injection into Nozzle 2 was; 750 kg/s.Fluid temperature contour plots also show this multidimensional behavior (seeFigure 4.1-10).
For downcomer injection with the vent valves open, the delivery rate was essentiallyconstant for all steam flows tested, indicating that countercurrent flow limitaijon (CCFL)conditions were not reached during the tests (see Figure 4.1-9). The delivery rate forinjection to Nozzle 2 only was similar to the delivery rate for injection to both nozzles,again confirming that ECC injected adjacent to the break was bypassed and ECCinjected opposite the break was delivered. Highly subcooled ECC injection had littleeffect on the ECC delivery rate, for two reasons: (1) the vent valves provided anoncountercurrent flow path for steam, reducing the potential for condensation; (2)CCFL conditions were apparently not reached, so any reduction in steam upflow hadlittle effect on ECC delivery. Finally, increased ECC injection velocity (due to theinstallation of thermal sleeves in the downcomer injection nozzles) had no appreciableeffect on ECC delivery.
For downcomer injection with the vent valves locked shut, the ECC delivery rate wassubstantially affected by the steam injection rate, indicating that CCFL conditions werereached during these tests (see Figure 4.1-9). As shown in Figure 4.1-9, ECC deliverywith closed vent valves was lower than with open vent valves. This difference in ECCdelivery is due to differences in the amount of steam upflow in the downcorner and thesteam flow pattern in the top of the downcomer. Specifically, with the vent valvesopen, the steam upflow-was lower because about 1/3 of the steam injection flowedthrough the vent valves. The vent valve steam flow created a circumferential flow inthe downcomer which appeared to reduce/redirect downcomer upfiow and facilitateECC delivery. Finally, Figure 4.1-9 indicates that, for closed vent va'-ves, highlysubcooled ECC injection produced much higher delivery than saturated ECC.
Figure 4.1-9 includes the results of the UPTF downcomer countercurrent flow testswith cold leg injection. Comparison of the cold leg injection tests to the downcomerinjection tests indicates that ECC delivery for downcomer injection with closed ventvalves was significantly less than for cold leg injection. However, delivery for
4.1-9
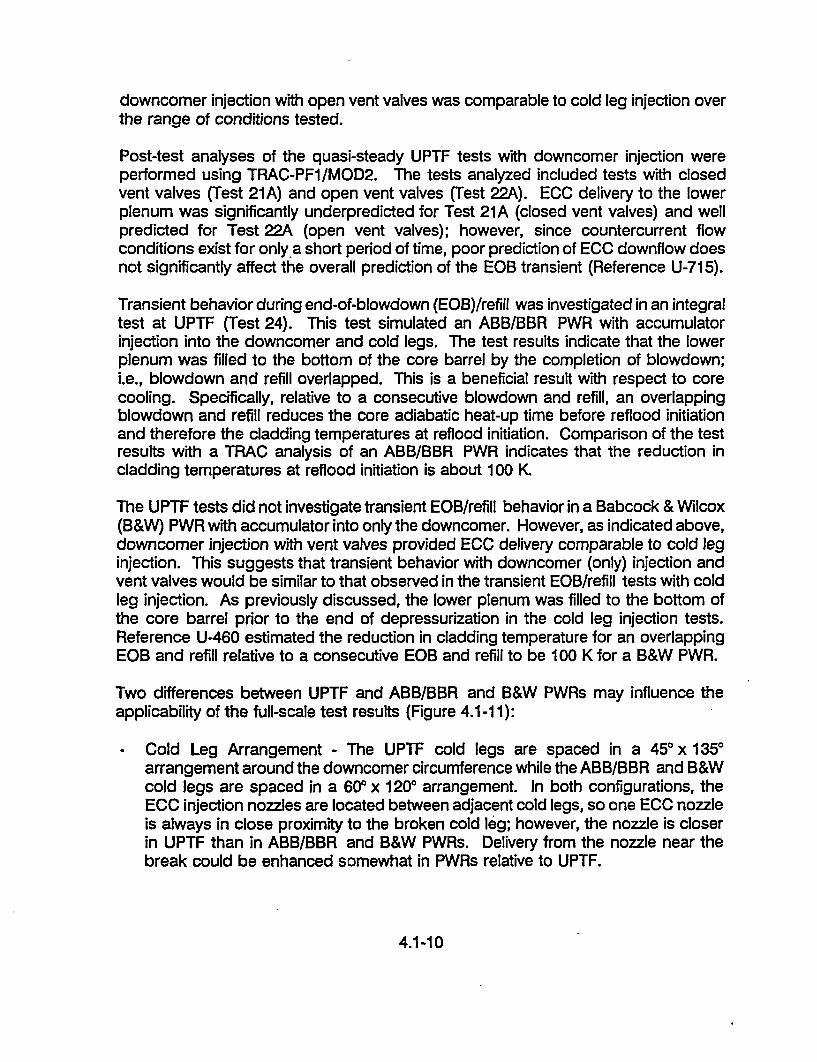
downcomer injection with open vent valves was comparable to cold leg injection overthe range of conditions tested.
Post-test analyses of the quasi-steady UPTF tests with downcomer injection wereperformed using TRAC-PF1/MOD2. The tests analyzed included tests with closedvent valves (Test 21A) and open vent valves (Test 22A). ECC delivery to the lowerplenum was significantly underpredicted for Test 21 A (closed vent valves) and wellpredicted for Test 22A (open vent valves); however, since countercurrent flowconditions exist for only a short period of time, poor prediction of ECC downflow doesnot significantly affect the overall prediction of the EOB transient (Reference U-715).
Transient behavior during end-of-blowdown (EOB)/refill was investigated in an integraltest at UPTF (Test 24). This test simulated an ABB/BBR PWR with accumulatorinjection into the downcomer and cold legs. The test results indicate that the lowerplenum was filled to the bottom of the core barrel by the completion of blowdown;i.e., blowdown and refill overlapped. This is a beneficial result with respect to corecooling. Specifically, relative to a consecutive blowdown and refill, an overlappingblowdown and refill reduces the core adiabatic heat-up time before reflood initiationand therefore the cladding temperatures at reflood initiation. Comparison of the testresults with a TRAC analysis of an ABB/BBR PWR indicates that the reduction incladding temperatures at reflood initiation is about 100 K
The UPTF tests did not investigate transient EOB/refill behavior in a Babcock & Wilcox(B&W) PWR with accumulator into only the downcomer. However, as indicated above,downcomer injection with vent valves provided ECC delivery comparable to cold leginjection. This suggests that transient behavior with downcomer (only) injection andvent valves would be similar to that observed in the transient EOB/refill tests with coldleg injection. As previously discussed, the lower plenum was filled to the bottom ofthe core barrel prior to the end of depressurization in the cold leg injection tests.Reference U-460 estimated the reduction in cladding temperature for an overlappingEOB and refill relative to a consecutive EOB and refill to be 100 K for a B&W PWR.
Two differences between UPTF and ABB/BBR and B&W PWRs may influence theapplicability of the full-scale test results (Figure 4.1-11):
Cold Leg Arrangement - The UPTF cold legs are spaced in a 450 x 1350arrangement around the downcomer circumference while the ABB/BBR and B&Wcold legs are spaced in a 6(0 x 1200 arrangement. In both configurations, theECC injection nozzles are located between adjacent cold legs, so one ECC nozzleis always in close proximity to the broken cold leg; however, the nozzle is closerin UPTF than in ABB/BBR and B&W PWRs. Delivery from the nozzle near thebreak could be enhanced somewhat in PWRs relative to UPTF.
4.1-10

Vent Valve Flow Area - While the vent valves in UPTF and ABB/BBR and B&WPWRs are identical in size and number, the two vent valves in UPTF opposite theECC injection nozzles were locked shut throughout the UPTF tests. Thus, thevent valve flow area in the UPTF tests was 6/8 or 75% of the B&W vent valve flowarea, reducing the benefit of vent valve steam flow in UPTF (relative to PWRs).The larger flow area available in PWRs for vent valve steam flow could producehigher ECC delivery rates than were found in the UPTF tests.
The UPTF results are considered to be representative of ABB/BBR and B&W PWRbehavior, provided that the above differences are considered in applying the results.
4.1-11

4.1.3 Combined Injection
ECC delivery to the lower plenum for combined injection ECC systems wasinvestigated in transient tests at UPTF (see Table 4.1-1). These tests includeddepressurization transients for simulation of the end-of-blowdown (EOB)/refill phase.The UPTF tests were open loop tests; that is, steam from the test vessel was ventedto containment through the intact loops and broken loop hot leg, as well as aroundthe bottom of the core barrel and up the downcomer to the broken cold leg. Theresults of the UPTF tests are summarized below.
After a brief delay for accumulation in the cold legs, ECC injected into the cold legsentered the downcomer. As previously discussed, the steam upflow in the down-comer initially entrained almost all ECC delivered to the downcomer out the brokenleg; however, as the upflow decreased, bypass decreased and cold leg ECC injectionpenetrated to the lower plenum. The transition from complete bypass to partialdelivery and to essentially complete delivery was very rapid.
ECC injected in the hot legs flowed toward the upper plenum, counter to the steamflow through the loops. The interaction of steam and ECC in the loops resulted in theformation of water plugs and fluctuations in ECC delivery to the upper plenum (seeSection 4.3.2). In the hot legs and upper plenum, steam was condensed by the ECCinjected in the hot legs.
ECC delivered to the upper plenum flowed down through the tie plate and core to thelower plenum. In the UPTF tests, the steam upflow through the tie plate was smallsince most of the steam in the test vessel vented to containment by flowing aroundthe bottom of the core barrel and up the downcomer to the break; consequently,almost all ECC delivered to the upper plenum penetrated through the tie plate to thelower plenum. Tests at CCTF and SCTF showed that water downflow through thecore initiated core cooling in the downflow region. In SCTF tests, rods in thedownflow region were almost quenched before blowdown was complete. Analysesand code calculations indicate that, for the GPWR case, the fuel rods in the downflowregions are quenched prior to reflood (see Section 4.6.3).
In the UPTF tests, lower plenum refill was initiated at a system pressure of 1000 kPaby the downflow of ECC injected in the hot legs. Shortly later, at a system pressureof 800 kPa, ECC injected in the cold legs penetrated to the lower plenum. The lowerplenum was filled to the bottom of the core barrel prior to the end of depressurization(i.e., the equilibration of primary system and containment pressures).
A TRAC calculation of a best-estimate LOCA transient in a GPWR indicated that thelower plenum mass turnaround point (i.e., initiation of lower plenum refill) occurredabout 10 seconds before the end of depressurization at a system pressure of1000 kPa. The lower plenum liquid fraction at that time was 10%. Like the UPTF
4.1-12

tests, lower plenum refill was complete prior to the end of depressurization(Reference G-661).
In conclusion, the test results demonstrated that hot leg ECC injection contributedsignificantly to lower plenum refill during the end-of-blowdown phase of an LBLOCA.With combined hot leg and cold leg injection, the lower plenum inventory increasedrapidly and reached the bottom of the core barrel before depressurization wascomplete. Rapid filling of the lower plenum reduces the period for core heat-upthereby limiting clad temperatures at the beginning of reflood. For a GPWR with fiveof the eight injection locations active, calculations indicate that refilling the lowerplenum during the end-of-blowdown reduces the core heat-up period by aboutten seconds and the cladding temperatures at reflood initiation by 80 - 100 K relativeto the case where the lower plenum is assumed to be empty at the completion ofblowdown. Within the water downflow regions of the core, most of the fuel rods arequenched during EOB by the flow of ECC from the upper plenum through the coreto the lower plenum.
4.1-13

Table 4.1-1
SUMMARY OF TESTS RELATED TO ECC DELIVERY DURING DEPRESSURIZATIONPage 1 of 2
ECC DowncomerFacility Injection Type of Tests Scale1 References
Type OD Gapmm mm(In) (in)
UPTF Cold Leg Quasl-steady; 1 4870 250 G-004, G-005, G-006, G-007, G-204,Transient (192) (9.8) G-205, G-206, G-207, G-41 1, U-455
Downcomer2 Quasi-steady; 1 4870 250 G-021, G-022, G-024, G-221, G-222,Transient (192) (9.8) G-224, G-41 1, U-460
Combined Integral 1 4870 250 G-003, G-018, G-019, G-028, G-203,(192) (9.8) G-218, G-219, G-228, G-411
CCTF Cold Leg Transient 0.22 1085 61.5 J-059, J-062, J-065, J-257, J-260,(43) (2.4) J-263
Creare Cold Leg Quasi-steady; 0.18 892 38 E-001, E-4171/5 Scale Transient (35) (1.5)
Creare Cold Leg Quasi-steady; 0.060 292 12.7, 25.4 E-002, E-003, E-4141/15 Scale Transient (11.5) (0.5, 1.0)Creare Cold Leg Quasi-steady; 0.032 152 6.4 E-002, E-003, E-4141/30 Scale Transient (6.0) (0.25)
Battelle Columbus Cold Leg Quasi-steady 0.13 618 31.2 E-4202/15 Scale (24) (1.2)
Battelle Columbus Cold Leg Quasi-steady 0.063 307 15, 25.4 E-0041/15 Scale (12) (0.6, 1.0)
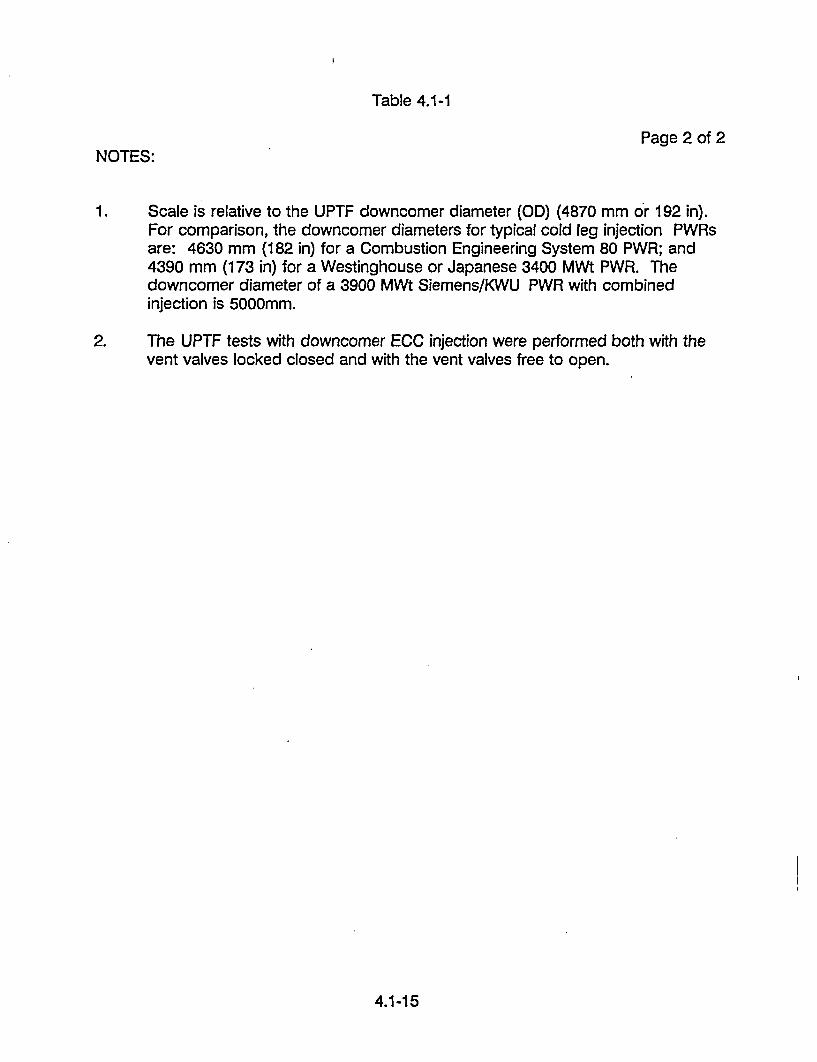
Table 4.1-1
Page 2 of 2NOTES:
1. Scale is relative to the UPTF downcomer diameter (OD) (4870 mm or 192 in).For comparison, the downcomer diameters for typical cold leg injection PWRsare: 4630 mm (182 in) for a Combustion Engineering System 80 PWR; and4390 mm (173 in) for a Westinghouse or Japanese 3400 MWt PWR. Thedowncomer diameter of a 3900 MWt Siemens/KWU PWR with combinedinjection is 5000mm.
2. The UPTF tests with downcomer ECC injection were performed both with thevent valves locked closed and with the vent valves free to open.
4.1-15
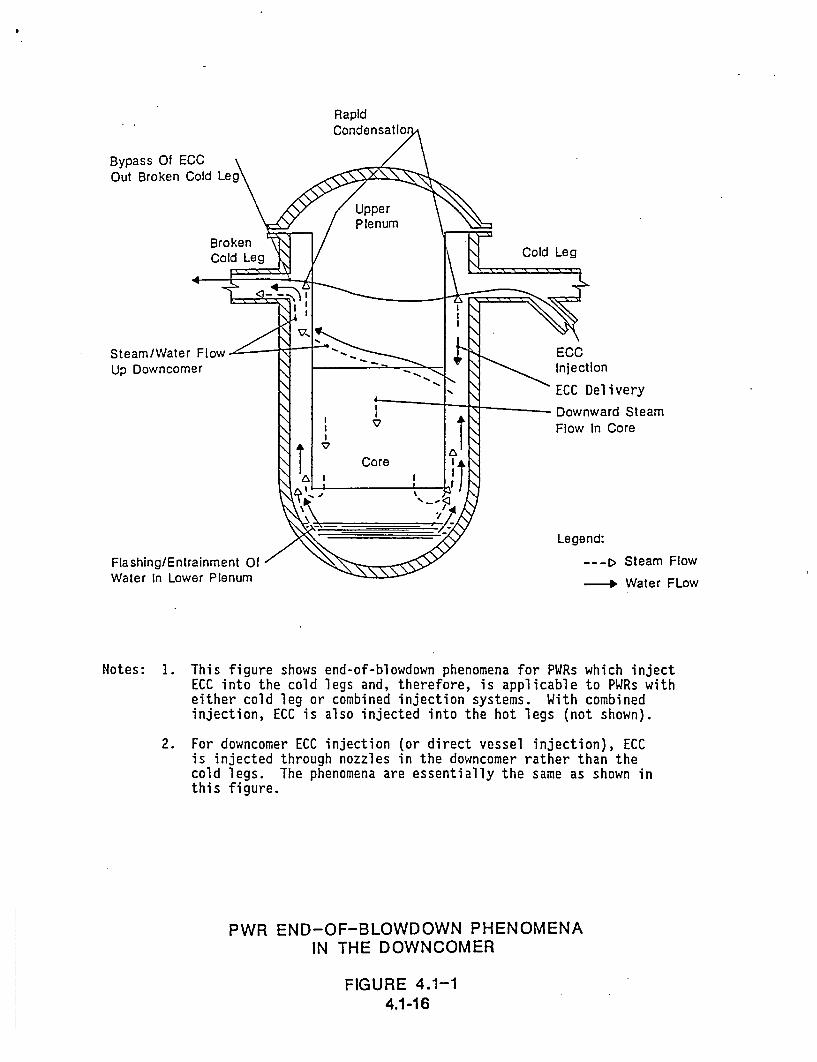
RapidCondensatl,
Bypass Of ECC \Out Broken Cold Leg"
Cold Leg
Up DowncomerECCInjection
ECC Delivery
Downward SteamFlow In Core
Legend:
-- -r Steam Flow
- Water FLowFlashing/Entrainment OfWater In Lower Plenum
Notes: 1. This figure shows end-of-blowdown phenomena for PWRs which injectECC into the cold legs and, therefore, is applicable to PWRs witheither cold leg or combined injection systems. With combinedinjection, ECC is also injected into the hot legs (not shown).
2. For downcomer ECC injection (or direct vessel injection), ECCis injected through nozzles in the downcomer rather than thecold legs. The phenomena are essentially the same as shown inthis figure.
PWR END-OF-BLOWDOWN PHENOMENAIN THE DOWNCOMER
FIGURE 4.1-14.1-16

500
SLO UPTF Test 6AT400 41 0 UPTF Test 7
, Injection into 115KLoops 1, 2 and 3
300
495 kg/s 489 kgls200 -
o)Injection into-Loop 2OyK 121K Break 3
100-- ,a Tsub 26 K 492 kgh
200 400 600 800 1000 12 0 0 kg/sComplete delivery
Water delivery from cold legs 2 +3 df
STEAM INJECTION AND ECC DELIVERY RATESFOR UPTF COLD LEG INJECTION TESTS
FIGURE 4.1-2
1600
Steam Flow:Time:
400 kg/s62.7 s
Subcooling:Above 2K rJ
.6-.2K LI
.10-. 6KBelow .10 K
Distribution of subcooling In downcomer
UPTF Test 6, Run 131
EXAMPLE SUBCOOLING CONTOUR PLOTFOR UPTF COLD LEG INJECTION TESTS
(REFERENCE G-907)
FIGURE 4.1-3
4.1-17
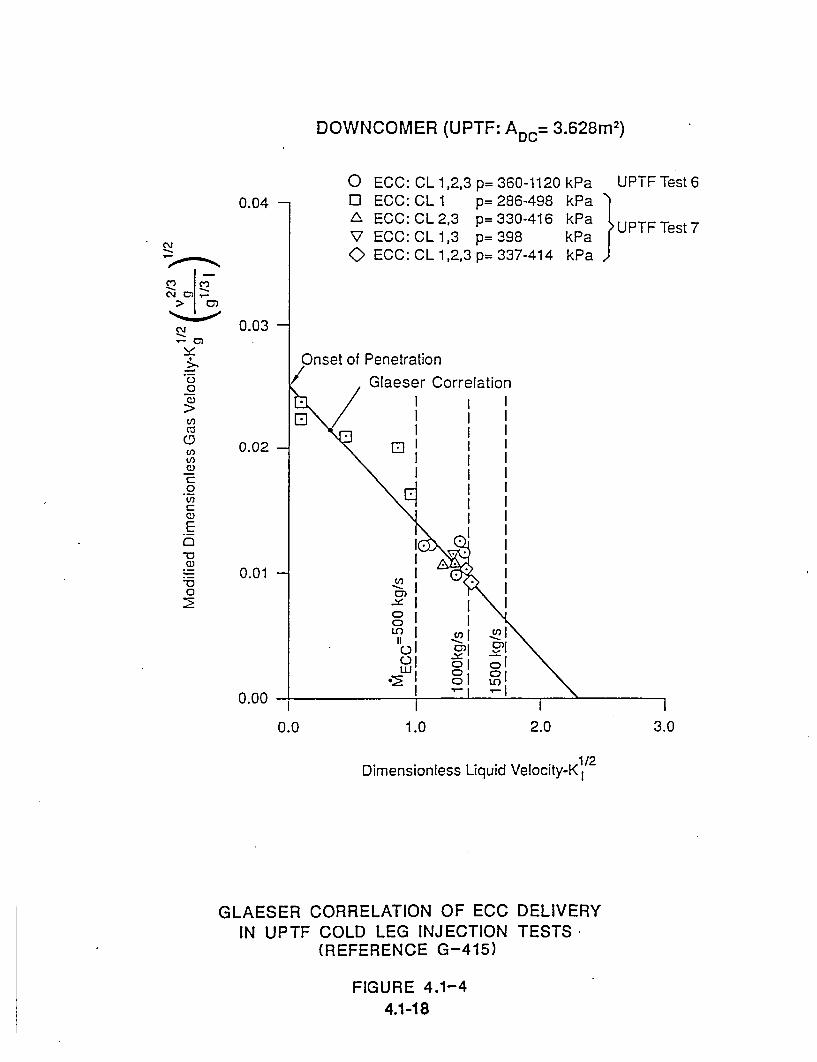
DOWNCOMER (UPTF: A DC= 3.628m 2)
0.0400
ECC: CL 1,2,3 p= 360-1120 kPa UPTF Test 6ECC: CL 1 p= 286-498 kPaECC:CL2,3 p= 3 3 0- 4 16 kPa UPTFTest7ECC: CL 1,3 p= 3 9 8 kPaECC: CL 1,2,3 p= 337-414 kPa
co) co2
C\j
0V)
02,
0.03
0.02
0.01
of Penetration
Glaeser
\]
Correlation
I ,
cr)
:EII
0.00
0.0 1.0 2.0 3.0
Dimensionless Liquid Velocity-K1/2
GLAESER CORRELATION OF ECC DELIVERYIN UPTF COLD LEG INJECTION TESTS*
(REFERENCE G-415)
FIGURE 4.1-44.1-18

1/2 * 1/2
Legend: J .eff C + m.jf
O ECC Injection to Loops 1, 2 and 3 f C m
A ECC Injection to Loops 2 and 3 or Loops land 3 Curve I 0.80 0.819 -4.193
o ECC Injection to Loop I Only Curve 2 0.80 0.214 -0.769
1-,
1/2
4-
U,
U
C'-
Dimensionless Delivery, j
BEST-FIT OF DIMENSIONLESS STEAM AND DELIVERY RATESFOR UPTF COLD LEG INJECTION TESTS
(REFERENCE U-455)
FIGURE 4.1-5
4.1-19
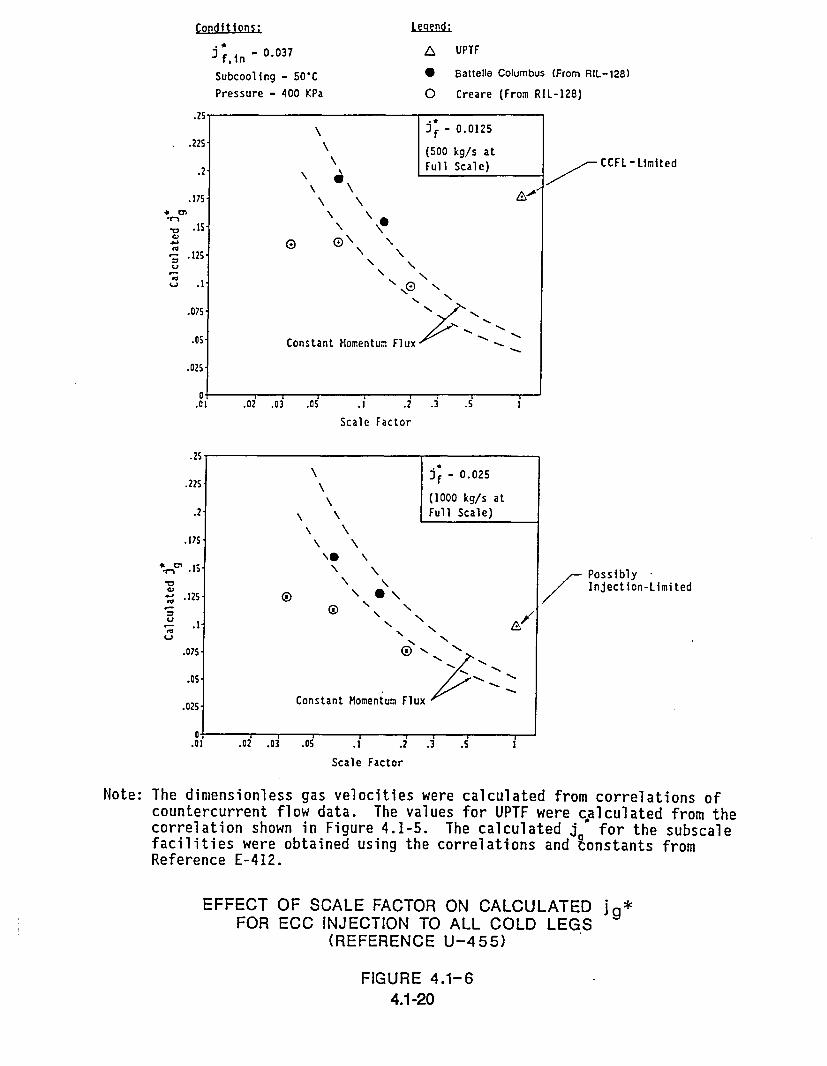
Conditions:
JIn " 0.037
Subcooling - 50"CPressure - 400 KPa
UPTF
* Battelle Columbus (From RIL-128)
0 Creare (From RIL-128)
71
.225
.2
.175
C,a A
.12S-
07
.075'
.025.
\f - 0.0125
(500 kg/s atFull Scale)
\ \
\\\ \
® ®\\ \
\ NNN
C t MConstant Momentum Flux -
CCFL - Limited
.01 .O2 .03 .05 .2 .i .A .s
Scale Factor
.2.
.17S.
- .12
.075
.W5
.025.
Jf - 0.025
(1000 kg/s atFull Scale)
\N NCt M
\ N
\ \
Constant Momentum Flux
Possibly •Injection-Limited
.04 .02 .03 .05 .1 .2 .3 .5 1
Scale Factor
Note: The dimensionless gas velocities were calculated from correlations ofcountercurrent flow data. The values for UPTF were calculated from thecorrelation shown in Figure 4.1-5. The calculated j* for the subscalefacilities were obtained using the correlations and Eonstants fromReference E-412.
EFFECT OF SCALE FACTORFOR ECC INJECTION TO
(REFERENCE
ON CALCULATED jgALL COLD LEGS
U-455)
FIGURE 4.1-64.1-20

UPTF Mass Transient Turnaround"• 200
8 -CTF Break Opens
0) (Both Tests)
600. CCTF Test C 2-14 ECC Starts5.-
CCTF Test C2-17 ECC Starts
400" CCTF Test CZ-17 Mass TransientTurnaround
200-
CCTF Test C2-14 Mass TransientTurnaround
0-0 10 is 2d 25 30 35 40
Time, sec
40000.UPTF Refill Complete
35000/ ° ,/r30000/
Slope Corresponds to /100% Delivery from /
250 Three Loops /CCTF Refill"25000 Complete
~/20000"
= /15000-S CCTF Test C2-]4
_Turnaround
10000.
UPTF Blowdown Complete
UPTF-- ý CCTF Test C2-17/ , CCTF Blowdown Complete
0 Turnaround Turnaround /d 10 15 20 25 30 35 40
Time, sec
Note: All tests shown in this figure were performed with the loops open.
COMPARISON OF END-OF-BLOWDOWN/REFILL TRANSIENTSIN THE COLD LEG INJECTION TESTS AT UPTF .AND CCTF
(REFERENCE U-455)
FIGURE 4.1-74.1-21
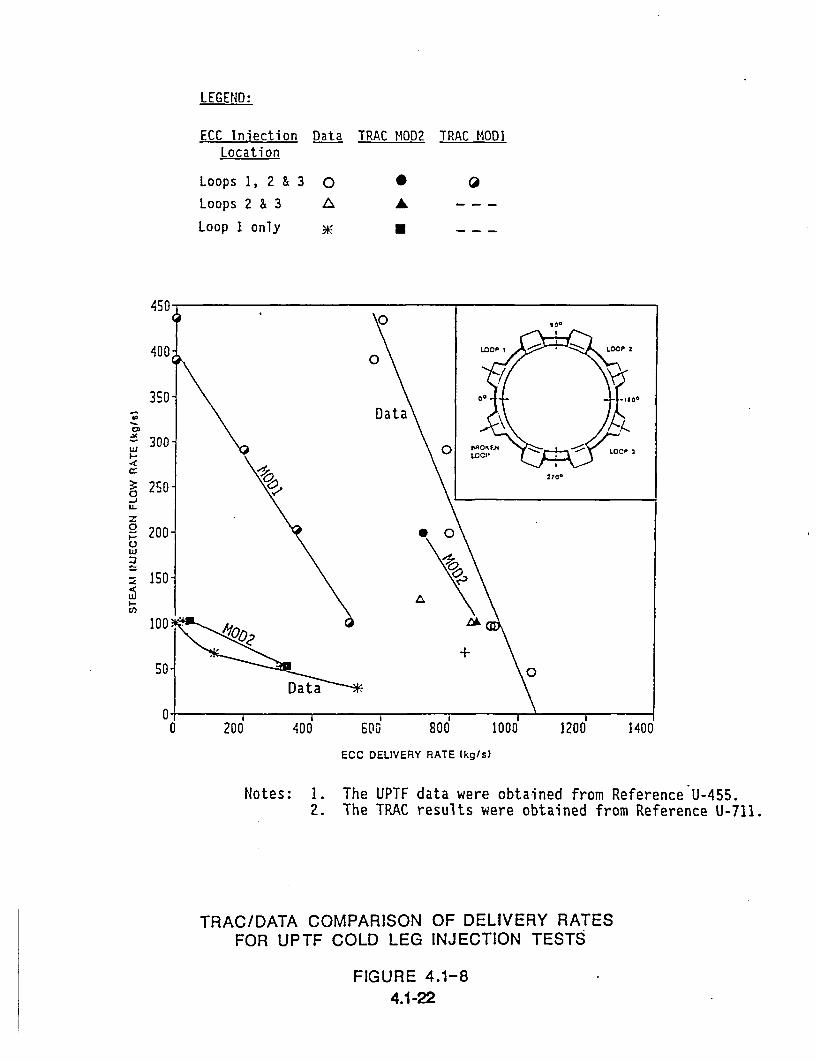
LEG END:
ECC Injection DataLocation
Loops 1, 2 & 3
Loops 2 & 3
Loop 1 only
0A
TRAC MOD2
0A
[]
TRAC MODI
C:
0-Ji-
z0
I-
ECC DELIVERY RATE Ikg/s)
Notes: I.2.
The UPTF data were obtained from Reference U-455.The TRAC results were obtained from Reference U-711.
TRAC/DATA COMPARISON OF DELIVERY RATESFOR UPTF COLD LEG INJECTION TESTS
FIGURE 4.1-84.1-22

-LEGEND: * Cold leg ECC injection to Loops 1, 2 and 3O Cold leg ECC injection to Loop 1 only* Downcomer ECC injection to Nozzles I and 2; vent valves free to open•1 Downcomer ECC injection to Nozzle 2 only; vent valves free to open* Downcomer ECC injection to Nozzle 1 only; vent valves free to open* Downcomer ECC injection to Nozzles 1 and 2; vent valves closed4 Downcomer ECC injection to Nozzle 1 only; vent valves closed
Note: Nozzle 1 and Loop 1 are adjacent to the broken cold leg, andNozzle 2 and Loops 2 and 3 are opposite the broken cold leg.
C0
600 800
ECC Delivery Rate(kg/s)
STEAM INJECTION AND DELIVERYFOR UPTF DOWNCOMER INJECTION
RATESTESTS
FIGURE 4.1-9
4.1-23

Steam Flow: 316 kg/sTime: 74.4 s
Vent Valves: Closed
9g0 3600 2700 1800
EE
0)
Distribution of Subcooling in Downcomer
UPTF Test 21A, Run 272
Temp. Difference, K
[ii]
VEJ
Above - 3-20-- 11-70--20
Below -70j
Saturated/Superheated
Subcooled
EXAMPLE SUBCOOLING CONTOUR PLOT FORUPTF DOWNCOMER INJECTION TESTS
(REFERENCE G-221)
FIGURE 4.1-10
4.1-24
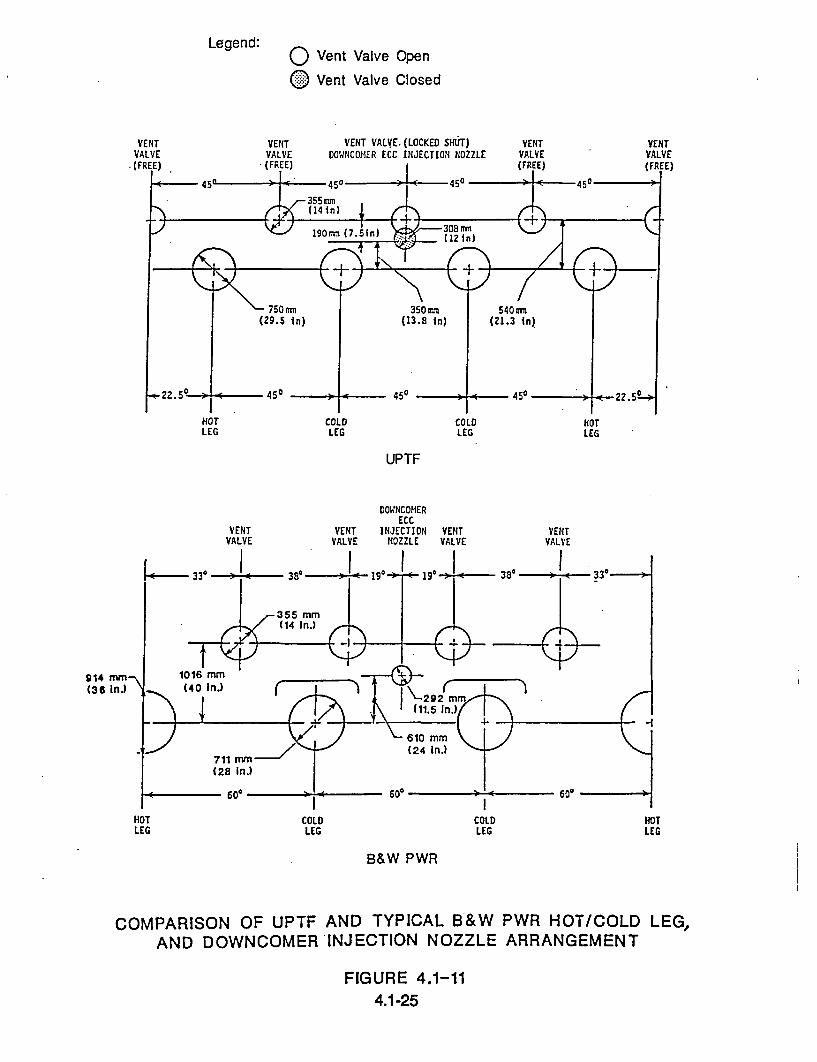
Legend: o Vent Valve Openo Vent Valve Closed
VENTVALVE(FREE)
VENT VALVE.(LOCKED SHtiT)DOWNCOMER ECC INJECTION NOZZLE
HOT COLD COLD HOTLEG LEG LEG LEG
UPTF
DOWNCOMERECC
INJECTIONNOZZLE
914 MM(36 InJ
HOT COLD COLDLEG LEG LEG
HOTLEG
B&W PWR
COMPARISON OF UPTF AND TYPICAL B&W PWR HOT/COLD LEG,AND DOWNCOMER INJECTION NOZZLE ARRANGEMENT
FIGURE 4.1-114.1-25


4.2 ENTRAINMENT IN DOWNCOMER DURING REFLOOD
Definition of Issue and Description of Phenomena
In a cold leg break LOCA, the beginning of the "reflood" phase occurs when thereactor vessel water level reaches the bottom of the core. This creates a sealbetween the core and the downcomer, and further ECC injection tends to fill thedowncomer to near the cold leg elevation. The difference in water level betweenthe downcomer and the core provides the driving head for core flooding. Thisdriving head also creates a pressure difference from the top of the core to the topof the downcomer which tends to cause core steam generation to flow out of thecore and through the loops to the downcomer. In combined injection PWRs,essentially all of the steam flow is condensed by hot leg and/or cold leg ECC andthere is no steam flow into the downcomer. In cold leg injection or downcomerinjection PWRs, steam flows to the downcomer via intact loops or vent valves.Some of the steam is condensed by ECC injected in the cold legs or in thedowncomer. Any steam not condensed, along with steam generated in thedowncomer due to superheated walls, flows circumferentially around thedowncomer and out the broken cold leg, potentially entraining and carrying away aportion of the ECC. These reflood phenomena are illustrated in Figure 4.2-1.
Importance of Issue to PWR LOCA Behavior
The circumferential flow of steam around the downcomer and the generation ofsteam on superheated downcomer walls tend to entrain ECC in the downcomerregion. The interaction of steam flow, wall boiling, and ECC entrainment isimportant since it affects the water level in the downcomer. Reduction of thedowncomer liquid level below the spillover level (which is at the bottom of the coldleg nozzles) reduces the available driving head and tends to reduce the coreflooding rate. This prolongs quench times and potentially allows higher cladtemperatures in the core.
Tests and Analyses that Relate to the Issue
The steam/water interaction and entrainment in the downcomer have beeninvestigated in separate effects tests at UPTF and integral tests at UPTF and CCTF.The separate effects tests evaluated the influence of steam flow and downcomerwall superheat on downcomer water level and entrainment, and the integral testsprovided information on the transient characteristics of these phenomena. Thetests included tests with cold leg ECC injection, downcomer ECC injection, andcombined ECC injection. Table 4.2-1 lists the tests considered in this evaluation.
4.2-1

The evaluations of the UPTF cold leg injection tests and downcomer injection tests,including comparisons to the CCTF tests, are provided in References U-455 andU-460, respectively. Evaluation of the UPTF combined injection tests is covered inReference G-41 1. The major results of these evaluations and comparisons aresummarized below.
Post-test TRAC calculations have been performed for tests at both CCTF andUPTF. These analyses include TRAC-PF1/MOD1 calculations of several CCTFtests (References U-621 through U-628, and U-631) and of UPTF Test 2(Reference U-714). TRAC-PF1/MOD2 calculations have been performed for CCTFTest C2-4 (Reference U-714), and UPTF Tests 23 and 25 (References U-715 andU-714, respectively).
Summary of Key Results and Conclusions from Tests and Analyses
The UPTF separate effects tests were designed to create a steady-state equilibriumamong the downcomer water level, steam flow rate, ECC entrainment rate, andvessel drainage. Steam entered the downcomer from either the intact cold legs orthe vent valves, and ECC was injected into either the cold legs or downcomer. Thevessel was simultaneously drained to simulate the loss of water inventory from thevaporization of ECC in the core that would occur in an actual PWR. The intent wasto hold these conditions constant long enough for the downcomer water level andentrainment rate to reach equilibrium. Similar flow conditions were created withcold leg injection, downcomer injection with vent valves, and downcomer injectionwithout vent valves.
The results of the separate effects tests indicate that as the steam flow increased,liquid entrainment out the broken cold leg increased which tended to reduce thedowncomer water level. As the ECC injection rate increased, the downcomer waterlevel increased due to the combination of reduced steam flow from increasedcondensation and the higher rate of excess ECC supply to the downcomer.Correlations which relate the "void height' (reduction in the collapsed water levelbelow the cold legs) to the steam and entrainment flow rates were independentlydeveloped by Siemens and MPR. Both correlations are based on the results of theUPTF tests with cold leg injection. While the assumptions and approaches of thetwo correlations are different, both correlations are consistent with the test data andpredict about the same level reduction for given flow conditions. Each correlationis described below.
The Siemens correlation assumes that entrainment primarily occurs in front ofthe broken cold leg nozzle because the steam flow and water level are highestat that location. This correlation is based on fundamental hydraulic equations,while the shear stress coefficient and constants in the correlation were
4.2-2

determined from UPTF tests. The steam flow in the correlation is the totalsteam flow out the break, which includes steam generation in the downcomer.Figure 4.2-2 is a plot of the correlation with the test data. The development ofthis correlation is discussed in detail in Reference G-41 1.
The MPR correlation assumes entrainment can occur throughout thedowncomer due to the azimuthal steam flow, and that the level reductions dueto entrainment and steam generation are separate and additive. Wall steamgeneration is taken into account by correcting the measured void height for thevoiding due to the steam generation. The void height due to wall boiling (orbottom void height) is based on the steam generation rate corresponding tothe calculated downcomer wall heat release, and a void fraction correlationdeveloped by JAERI for vertical steam flow in a column of liquid. As shown inFigure 4.2-3, the "top" void height (level reduction due to entrainment) wasplotted as a function of the ratio of the effective steam flow and the entrainmentrate. The effective steam flow is defined as the injected steam flow lesscondensation. A detailed description of the development of this correlation isprovided in Reference U-455.
Detailed discussions of the 2D/3D Program results are provided inSubsections 4.2.1, 4.2.2, and 4.2.3 for cold leg injection, downcomer injection, andcombined injection, respectively.
4.2-3

4.2.1 Cold Lea Iniection
The preceding discussion of test results covered UPTF Test 25 which evaluated theeffect of parametric variations in the loop steam flow and cold leg ECC injectionrates on entrainment and level reduction in the downcomer. The followingdiscussion covers the results of integral tests and the effect of wall boiling on thedowncomer water level reduction.
In integral tests at UPTF and CCTF, the downcomer water level (and therefore thedriving head available for core flooding) was reduced below the cold leg elevationby ECC entrainment in the steam flow and by boiling on superheated downcomerwalls. Note that while water spillover out the break due to water level oscillationscan also contribute to the downcomer water level reduction, entrainment and wallboiling are considered the dominant phenomena.
Figure 4.2-3, the plot of the MPR void height correlation, includes data points fromCCTF Test C2-4 and UPTF Test 2. These integral tests were counterpart tests. Asshown on Figure 4.2-3, the dimensionless steam flow and top void height weremuch lower in CCTF Test C2-4 than in UPTF Test 2. This is a result of scaleeffects which greatly reduced the top void height in the scaled CCTF. Thisreduction was due to the relatively enlarged circumferential flow area in thesubscale facility. Figure 4.2-4 illustrates how these geometric differences affectdimensionless velocities. It also shows that the UPTF and CCTF results bound thebehavior expected in a PWR (i.e., j*CCTF < J PWR < JtUPTF)
In the UPTF tests with wall superheat, the initial downcomer liquid inventory wassaturated water and ECC delivered to the top of the downcomer was warmed tonearly saturation by condensation in the cold legs. Accordingly, essentially all ofthe downcomer wall heat release contributed to steam generation. However, inCCTF tests, the steam generation was temporarily suppressed because thedowncomer inventory was initially subcooled. Although it was not observed inCCTF tests, it appears there could be situations where LPCI water is not fullyheated to saturation in the cold legs. The delivery of subcooled water to thedowncomer can suppress wall boiling and downcomer voiding.
CCTF tests also displayed a transient wall boiling effect which was not observed inthe UPTF tests, but which is likely to occur in a PWR. The top diagram ofFigure 4.2-5 shows the calculated heat release and estimated steam generationrate for CCTF Test C2-4. With the high flow of subcooled ECC during accumulatorinjection, the initial downcomer inventory was highly subcooled (by as much as100 K) and most of the energy initially released by the superheated walls simplyheated the downcomer inventory. Steam generation began to occur afteraccumulator injection was terminated, when ECC entering the downcomer wassaturated, not subcooled. As saturated water slowly replaced the subcooled water
4.2-4

at the top of the downcomer, steam generation increased to a maximum, but thenfell off as the total wall heat content and heat release rate decreased.
Also shown in Figure 4.2-5 is the collapsed downcomer water level for Test C2-4.This figure illustrates the influence of the wall steam generation on the downcomerlevel/entrainment behavior observed in most CCTF Core-li reflood tests. As steamgeneration increased in the first 150 seconds after the downcomer was filled,voiding due to steam generation (bottom voiding) increased, corresponding to thedecrease in the collapsed water liquid level. After about 200 seconds, the steamgeneration rate dropped, decreasing bottom voiding and corresponding to theincrease in the collapsed water level. Thus the variation in the downcomer waterlevel appears to be mostly due to bottom voiding, while the void height created byECC entrainment in the loop steam flow (the top void height) remains fairlyconstant at a small value.
Comparisons to the TRAC analyses showed that the TRAC-PF1/MOD2 analysis ofCCTF Test C2-4 did not show the observed level reduction transient due todowncomer wall steam generation. Instead, the calculated downcomer level was atthe spillover elevation throughout the transient. It appears the code did notcorrectly calculate steam condensation in the cold legs which allowed saturatedwater to be delivered to the downcomer in the tests. Instead, subcooled water wasdelivered to the downcomer, which suppressed steam generation from wall heatrelease.
The TRAC-PF1/MOD2 analysis of UPTF Test 25 generally underpredicteddowncomer water level. Since it is unclear as to why TRAC underpredicted thedowncomer water level, the accuracy of the code in predicting local downcomerphenomena could not be evaluated. Reference E-609 concluded that, since theimpact of downcomer entrainment and wall boiling on PCT is small, theunderprediction of downcomer level is not a significant contributor to codeuncertainty.
Using the test results and evaluations described above, the best-estimate drivinghead available in a Westinghouse PWR during the reflood period was calculated.The void height contribution due to entrainment in the loop steam flow was basedon the loop steam flow rate and the core inlet mass flow rate from best-estimateCCTF tests. The ECC entrainment rate was calculated-from the ECC injection rateand the core inlet flow rate, assuming a steady downcomer level. Using the MPRentrainment correlation, the top void height was estimated as essentially zero to0.25 m. The higher value (0.25 m) corresponds to the single-LPCI-pump failureECC flow rate of 240 kg/s, while the zero void height corresponds to the no-failureECC flow rate of 420 kg/s. In the no-failure case, all of the intact loop steam flowis condensed, so there is no steam flow out the broken cold leg and no leveldepression due to entrainment.
4.2-5
The contribution to the total void height resulting from wall boiling was estimatedbased on conduction-limited wall heat release and the fraction of that available forsteam generation. For the no-failure LPCI case, steam generation was suppressedthroughout the transient. For the single-failure case, ECC delivered to thedowncomer was assumed to be saturated as observed in CCTF, and steamgeneration gradually increased as the saturated water replaced subcooled water inthe downcomer. Steam generation in the PWR (for single-failure LPCI case) wouldbe about five percent of the total loop steam flow.
With an effective downoomer length of 5 m, the PWR bottom void height wascalculated to range from 0.3 m initially to 0.7 m for the majority of reflood. The totalmaximum estimated void height in the PWR was therefore 0.95 m. The resultingdowncomer liquid level is shown on Figure 4.2-6. Assuming the core liquid levelmeasured in CCTF Test C2-4 is representative of that for a PWR, the downcomerdriving head would be about 2.6 m of water. Note that since the bottom of thecold legs are at an elevation of 4.95 m in the Westinghouse PWR, the maximumdowncomer driving head would be about 3.5 m. Based on the calculated drivinghead, it was estimated that, relative to no downcomer voiding (i.e., the full 3.5 mdriving head), the overall increase in PCT during reflood would be 13 K(Reference U-455). Thus, while assuming the downcomer remains completely filled(to the bottom of the cold leg nozzles) is a nonconservative assumption, the overallinfluence of downcomer voiding on the reflood PCT is estimated to be relativelysmall.
4.2-6

4.2.2 Downcomer Iniection
As previously indicated the separate effects tests at UPTF were intended tomaintain constant flow conditions long enough for the downcomer water level andentrainment rate to reach equilibrium. However, in the tests with downcomer ECCinjection, the downcomer water level did not always reach steady state in the timeallowed. This was apparently due to the fact that a large fraction (40 - 50%) of theECC bypassed the downcomer entirely and traveled directly out the break,meaning less ECC was delivered to the vessel than expected. Direct bypass ofabout half of the injected ECC appeared to be a result of the close proximity of oneof the ECC injection nozzles to the break at UPTF (see Figure 4.1-11).Accordingly, this result is not necessarily directly applicable to B&W and ABB/BBRplant configurations.
The results of the UPTF separate effects tests with downcomer injection are shownin Figure 4.2-7, a plot of void height versus steam flow. For comparison,Figure 4.2-7 also includes data from the cold leg injection tests. The steam andECC flow rates were similar for all the tests. Note that the circled data points werethe only ones which achieved equilibrium, so the other data points would beexpected to move to a lesser void height as they approached equilibrium.
As shown in Figure 4.2-7, the void height for downcomer injection without ventvalves was significantly higher than for cold leg injection. This difference wasattributed to the location of the downcomer injection nozzles above the cold legs(where steam enters the downcomer). This configuration favored bypass(Reference U-460).
Figure 4.2-7 also shows that the void height for downcomer injection with ventvalves was lower than for downcomer injection without vent valves because thesteam entered the downcomer via the vent valves rather than the cold legs. Withthe vent valves open, steam entered the downcomer at a higher elevation whichfavored flow stratification and reduced entrainment. This reduction in entrainmentcompensated for direct ECC bypass. Consequently, as shown in Figure 4.2-7, thevoid height for downcomer injection with vent valves was comparable to cold leginjection (Reference U-460).
The UPTF tests with open vent valves simulated both single-phase steam flow andtwo-phase steam/water flow through the vent valves. Test results indicate that, forthe same steam flow, the void height with two-phase flow through the vent valveswas higher than with single-phase flow (see Figure 4.2-7). Apparently, entrainmentout the break increased due to the higher momentum flux in the downcomer(Reference U-460).
4.2-7
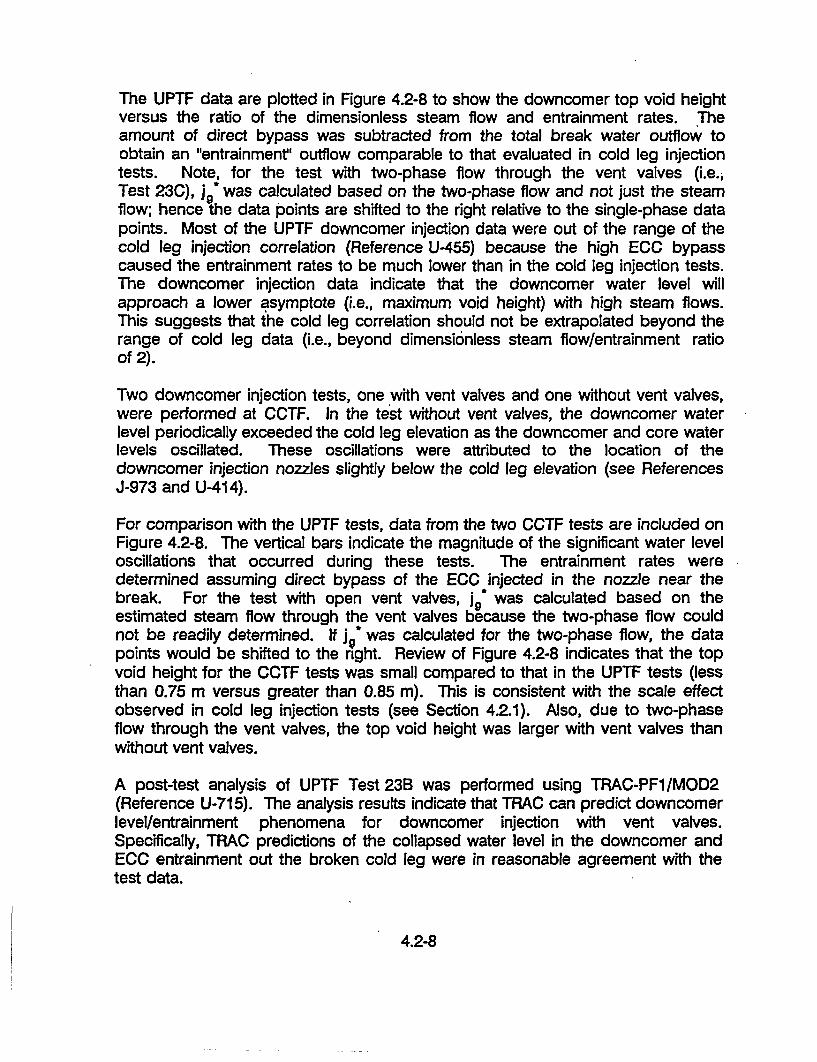
The UPTF data are plotted in Figure 4.2-8 to show the downcomer top void heightversus the ratio of the dimensionless steam flow and entrainment rates. Theamount of direct bypass was subtracted from the total break water outflow toobtain an "entrainment" outflow comparable to that evaluated in cold leg injectiontests. Note, for the test with two-phase flow through the vent valves (i.e.,Test 23C), jg* was calculated based on the two-phase flow and not just the steamflow; hence the data points are shifted to the right relative to the single-phase datapoints. Most of the UPTF downcomer injection data were out of the range of thecold leg injection correlation (Reference U-455) because the high ECC bypasscaused the entrainment rates to be much lower than in the cold leg injection tests.The downcomer injection data indicate that the downcomer water level willapproach a lower asymptote (i.e., maximum void height) with high steam flows.This suggests that the cold leg correlation should not be extrapolated beyond therange of cold leg data (i.e., beyond dimensionless steam flow/entrainment ratioof 2).
Two downcomer injection tests, one with vent valves and one without vent valves,were performed at CCTF. In the test without vent valves, the downcomer waterlevel periodically exceeded the cold leg elevation as the downcomer and core waterlevels oscillated. These oscillations were attributed to the location of thedowncomer injection nozzles slightly below the cold leg elevation (see ReferencesJ-973 and U-414).
For comparison with the UPTF tests, data from the two CCTF tests are included onFigure 4.2-8. The vertical bars indicate the magnitude of the significant water leveloscillations that occurred during these tests. The entrainment rates weredetermined assuming direct bypass of the ECC injected in the nozzle near thebreak. For the test with open vent valves, jg* was calculated based on theestimated steam flow through the vent valves because the two-phase flow couldnot be readily determined. If j* was calculated for the two-phase flow, the datapoints would be shifted to the right. Review of Figure 4.2-8 indicates that the topvoid height for the CCTF tests was small compared to that in the UPTF tests (lessthan 0.75 m versus greater than 0.85 m). This is consistent with the scale effectobserved in cold leg injection tests (see Section 4.2.1). Also, due to two-phaseflow through the vent valves, the top void height was larger with vent valves thanwithout vent valves.
A post-test analysis of UPTF Test 23B was performed using TRAC-PF1/MOD2(Reference U-715). The analysis results indicate that TRAC can predict downcomerlevel/entrainment phenomena for downcomer injection with vent valves.Specifically, TRAC predictions of the collapsed water level in the downcomer andECC entrainment out the broken cold leg were in reasonable agreement with thetest data.
4.2-8
To determine what effect entrainment and downcomer voiding may have on anactual PWR with downcomer ECC injection, the increase in PCT for a B&W2600 MWt plant was estimated. The assumption was made that half of the injectedECC was bypassed (as in the UPTF tests), and the cold leg injection correlationwas used to estimate the void height due to entrainment. Use of the cold legcorrelation is reasonable since the UPTF data in Figure 4.2-7 indicate similar voidheights in the downcomer injection/vent valve and cold leg injection tests; also, theexpected PWR flow conditions are within the range of the cold leg injection data.The increase in PCT due to the bypass and entrainment phenomena was estimatedto be in the range of 13 - 18 K at a B&W plant, indicating that the overall influenceof downcomer voiding on reflood PCT is relatively small (Reference U-460). Notethat this estimate is based on the downcomer water level reaching steady-stateearly in the reflood period. If ECC bypass occurs in the B&W plant as in the UPTFtests, the attainment of steady-state downcomer water level could be delayed suchthat an additional increase in reflood PCT could result (Reference U-460).
4.2-9

4.2.3 Combined Injection
The results of combined injection integral tests at CCTF and SCTF indicate thatmost of the downcomer wall heat transfer was to subcooled water which waspresent in the downcomer due to high ECC injection rates. The presence ofsignificant subcooling was confirmed in UPTF tests. The subcooling was sufficientto completely suppress wall boiling; therefore no voiding due to wall heat release isexpected in combined injection PWRs.
In the UPTF tests with combined ECC injection into cold leg and hot leg, the ECCflows were sufficiently high (about 400 kg/s per injection port) to condense all ofthe loop steam flow during reflood; consequently, there was no downcomer waterlevel reduction due to entrainment flow out the broken cold leg.
In conclusion, downcomer level reductions due to wall boiling or entrainment arenot expected in a PWR with combined cold and hot leg ECC injection.
4.2-10
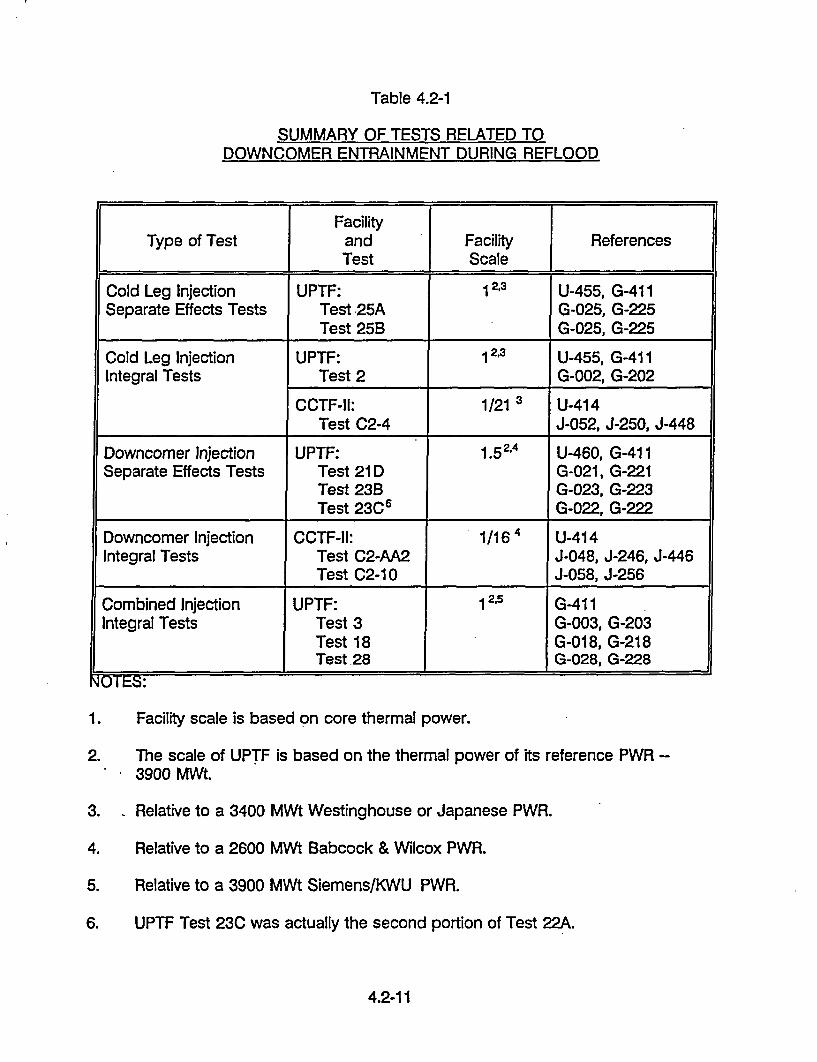
Table 4.2-1
SUMMARY OF TESTS RELATED TODOWNCOMER ENTRAINMENT DURING REFLOOD
FacilityType of Test and Facility References
Test Scale
Cold Leg Injection UPTF: 12,3 U-455, G-411Separate Effects Tests Test .25A G-025, G-225
Test 25B G-025, G-225
Cold Leg Injection UPTF: 12.3 U-455, G-411Integral Tests Test 2 G-002, G-202
CCTF-I1: 1/21 3 U-414Test C2-4 J-052, J-250, J-448
Downcomer Injection UPTF: 1.5 2A U-460, G-411Separate Effects Tests Test 21 D G-021, G-221
Test 23B G-023, G-223Test 23C6 G-022, G-222
Downcomer Injection CCTF-11: 1/16" U-414Integral Tests Test C2-AA2 J-048, J-246, J-446
Test C2-10 J-058, J-256
Combined Injection UPTF: 12.5 G-411Integral Tests Test 3 G-003, G-203
Test 18 G-018, G-218Test .28 G-028, G-228
kOTES:
1. Facility scale is based on core thermal power.
2. The scale of UPTF is based on the thermal power of its reference PWR -
3900 MWt.
3. Relative to a 3400 MWt Westinghouse or Japanese PWR.
4. Relative to a 2600 MWt Babcock & Wilcox PWR.
5. Relative to a 3900 MWt Siemens/KWU PWR.
6. UPTF Test 23C was actually the second portion of Test 22A.
4.2-11
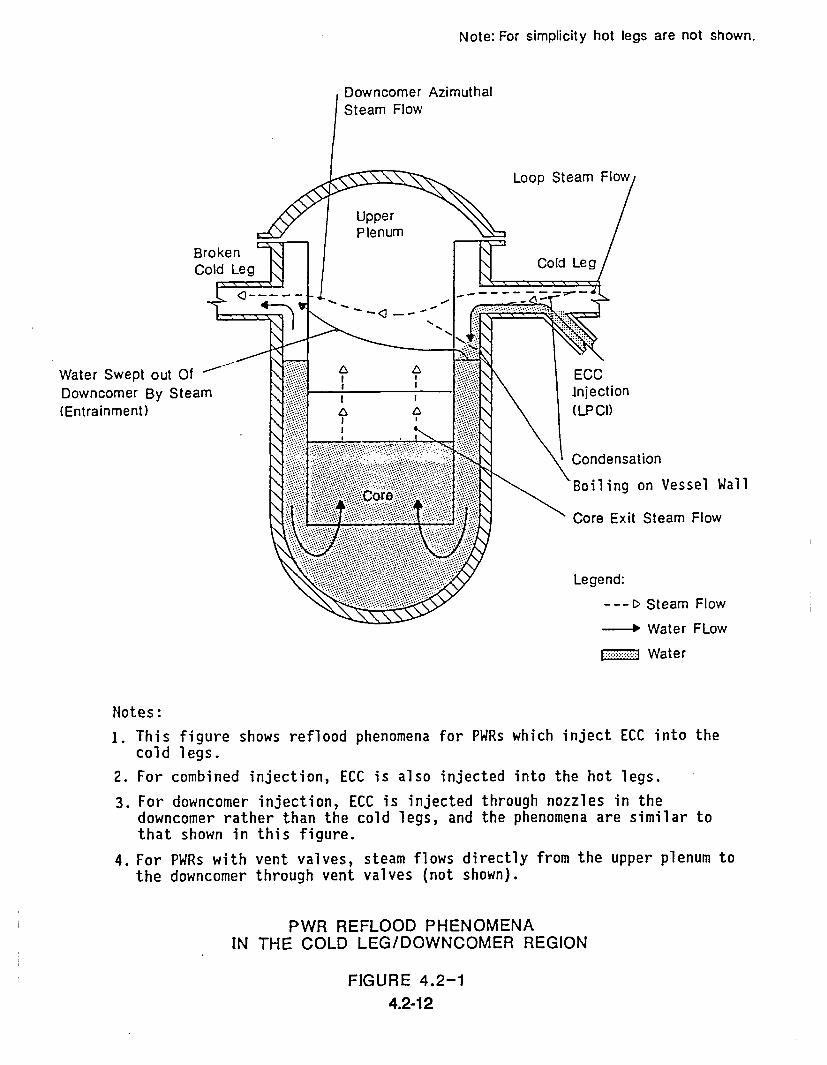
Note: For simplicity hot legs are not shown.
Water Swept out OfDowncomer By Steam(Entrainment)
Boiling on Vessel Wall
Core Exit Steam Flow
- -- C> Steam Flow
- Water FLow
_ Water
Notes:
1. This figure shows reflood phenomena for PWRs which inject ECC into thecold legs.
2. For combined injection, ECC is also injected into the hot legs.
3. For downcomer injection, ECC is injected through nozzles in thedowncomer rather than the cold legs, and the phenomena are similar tothat shown in this figure.
4. For PWRs with vent valves, steam flows directly from the upper plenum tothe downcomer through vent valves (not shown).
PWR REFLOOD PHENOMENAIN THE COLD LEG/DOWNCOMER REGION
FIGURE 4.2-14.2-12

V 7v -i; (H +HT)' -PS s'Ms(Cl -M + C2)
E
C-
-I-
80
70
60
50
40
30-
20
10.
Ms Steam flow rate
M= Water flow rate
fECc = Total ECC injectionrate into cold legs
C1 = 0.044 s 7/6
kg 1/6. m
C2 = 0.0187 5
2/3kg •
C1. C2 dependent on pressureand geometry/G411/
00 10 20 30 40 50 60 70 80
ý (C 1 s. M + C2) kg 4 13/(m .s 1/3)
SIEMENS DOWNCOMER LEVEL/ENTRAINMENT CORRELATIONFOR UPTF COLD LEG INJECTION TESTS
(REFERENCE G-411)
FIGURE 4.2-2
4.2-13

Leqend: 0 UPTF Test 25, Phase A (Hot Walls)
UPTF Test 25, Phase B (No Hot Wallsi
UPTF Test 2 (Hot Walls)
CCTF Test C2-4 (Hot Walls)
H 0. .**h 2v,top 0.35 g,eff / jf,ent)
g,eff g - 0.8 g,cond
1.8
C-0
E
0
CD
CL
0F-
0
I-.
* /..Jg,eff / f,ent
Notes: 1.
2.
The correlation is based on the UTPF Test 25 data.
Time averaged value is shown for 25-B-II data point.Downcomer level fluctuations, however, were approximately± 0.9 m. Typical level fluctuations for other pointswere ±0.2 m.
MPR DOWNCOMER LEVEL/ENTRAINMENT CORRELATIONFOR UPTF COLD LEG INJECTION TESTS
(REFERENCE U-455)
FIGURE 4.2-34.2-14
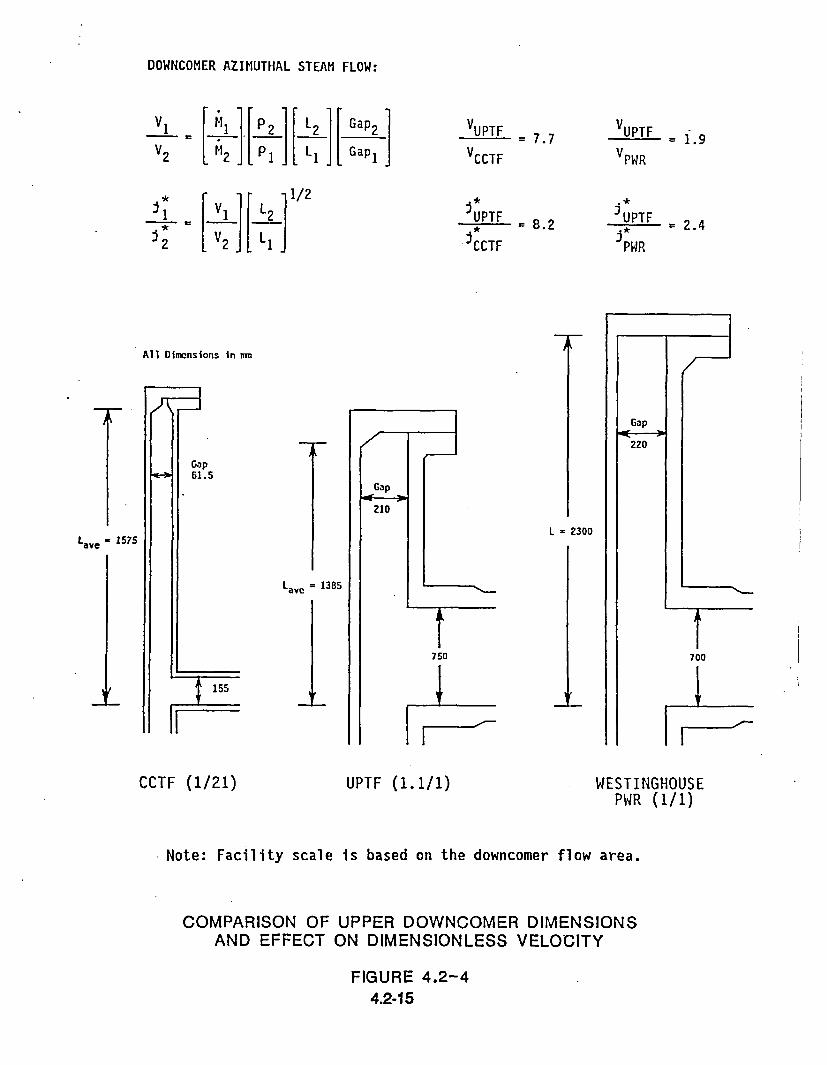
DOWNCOMER AZIMUTHAL STEAM FLOW:
V1
V12
V2
[ [ý2 [L2 IIGap?]
V12 PiII a 1
VUPTF 7
VCCTF
JUPTF* =8.2
JCCTF
VUPTF i
V PWR
UPTFUT = 2.4
PWR
All Dimcnsions in mn
-V-Gap61.5
Gap
210
L - 2300Lave - 1575
Lave = 1385
aIe
750
155
Im
CCTF (1/21) UPTF (1.1/1) WESTINGHOUSEPWR (1/1)
Note: Facility scale is based on the downcomer flow area.
COMPARISON OF UPPER DOWNCOMER DIMENSIONSAND EFFECT ON DIMENSIONLESS VELOCITY
FIGURE 4.2-44.2-15
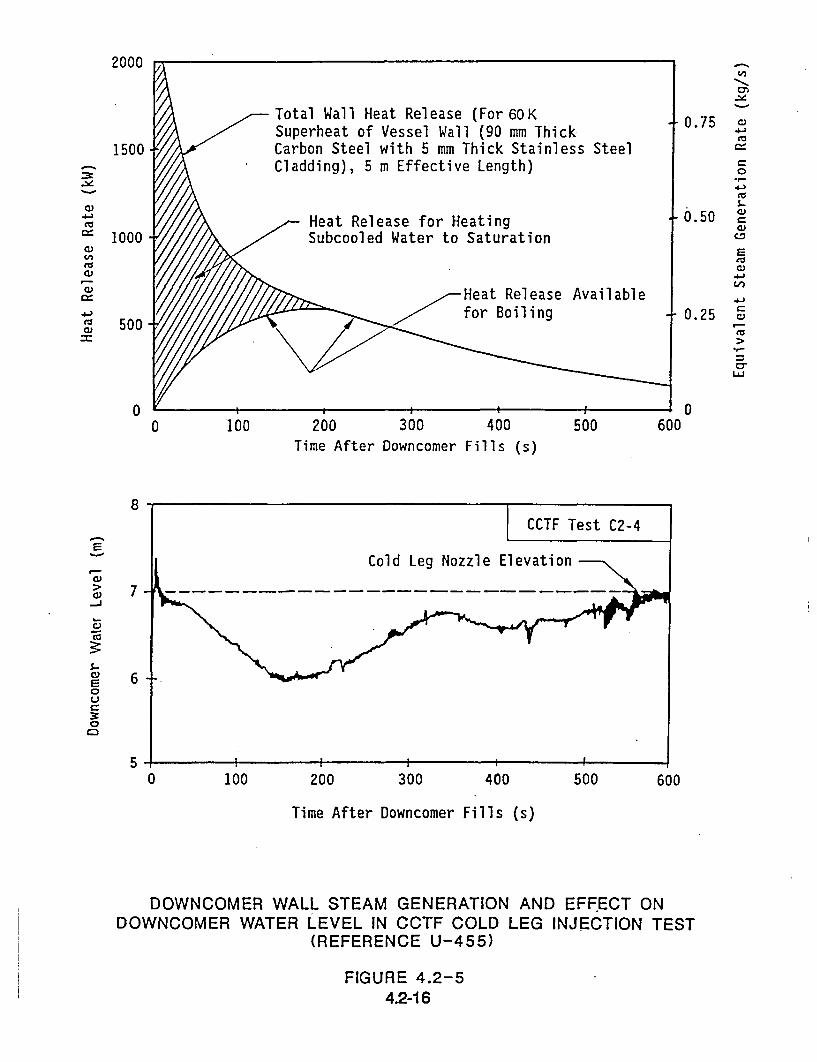
CL)
CL)
2000
1500
1000
500
0.75
4J
S..
0.50-6
E'C
0.25 -
I-LLJJ
00
8
0 100 200 300 400 500Time After Downcomer Fills (s)
600
S
9-C)
a)-J
C,
S..C)S0U
30
7
6
50 100 200 300 400 500 600
Time After Downcomer Fills (s)
DOWNCOMER WALL STEAM GENERATION AND EFFECT ONDOWNCOMER WATER LEVEL IN CCTF COLD LEG INJECTION TEST
(REFERENCE U-455)
FIGURE 4.2-54.2-16
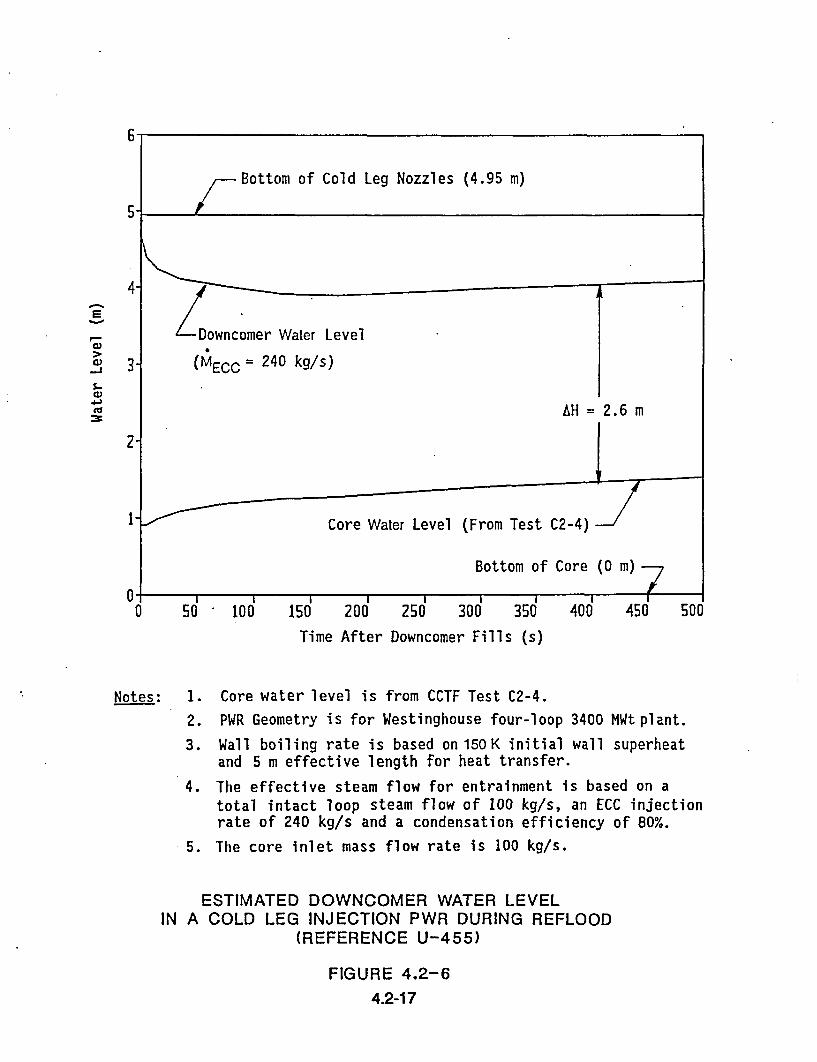
E
I-
03
-J
1-03
'U
Time After Downcomer Fills (s)
Notes: I. Core water level is from CCTF Test C2-4.
2. PWR Geometry is for Westinghouse four-loop 3400 MWt plant.
3. Wall boiling rate is based on 150K initial wall superheatand 5 m effective length for heat transfer.
4. The effective steam flow for entrainment is based on atotal intact loop steam flow of 100 kg/s, an ECC injectionrate of 240 kg/s and a condensation efficiency of 80%.
5. The core inlet mass flow rate is 100 kg/s.
ESTIMATED DOWNCOMER WATER LEVELIN A COLD LEG INJECTION PWR DURING REFLOOD
(REFERENCE U-455)
FIGURE 4.2-6
4.2-17

2.50 -
2.25 -
2.00-
1.75.-
1.50
1.25
-21.00-
0.75-
0.50-
0.25-
DC INJECTION WITHOT
-UPTF TEST 21D
DC IOJECTION WITHN
+ UPTF TEST 23C(Steaam/Water Flow T
"<'UPTP TEST 23B(Steam Flow Thru V'
CL INJECTION WITHO
UPTF TEST 25A
Circled Points Achieved
UT VV
/V ---
hru VV)
UT VV
Equilibribm ........
...........
0.00 III I I I I I I I
0 10 20 30 40 50 60 70 80 90 100 110Steam Flow Rate (kg/s)
DOWNCOMERFOR UPTF
VOID HEIGHT VERSUS STEAM FLOWDOWNCOMER INJECTION TESTS(REFERENCE U-460)
FIGURE 4.2-74.2-18

0
0
0F-
2.75
2.50
2.25
2.00
1.75
1.50
1.25
1.00
0.75
0.50
0.25
0.00
-0.25
-0.50
-0.75
-1.00
MPR CORRELATION -- .......FOR COLD LEG . '".... ........ ....INJECTION....• ... .i. .. .. ...," ..... ....... . ...... ...
........... A ......... ...... A.....
DC]..... ..
... .. ..
... .......... .-- . -;--.. .. .. . .
INJECTION WITHOUT VV
UPTF TEST 21D
CCTF TEST C2-AA2
INJECTION WITH VV
UPTF TEST 23C
UPTF TEST 23B
CCTF TEST C2-1.0
TICAL BARS SHOWILLATION MAGNITUDES
. ° .
VEROSc
I I I I I I I
0 0.5 1 1.5 2 2.5 3gW f * 1/4Jg,oeJ f, e
3.5 4 4.5 5 5.5 6
COMPARISON OF UPTF AND CCTF RESULTSFOR DOWNCOMER INJECTION
WITH DOWNCOMER ENTRAINMENT CORRELATIONFOR COLD LEG INJECTION
(REFERENCE U-460)
FIGURE 4.2-8.4.2-19


4.3 STEAM/ECC INTERACTIONS IN LOOPS
Definition of Issue and Description of Phenomena
During an LBLOCA, ECC is injected into the reactor coolant system to refill the lowerplenum and reflood the core. For most PWRs, the ECC is injected through nozzlesin the reactor coolant piping; i.e., cold legs and/or hot legs. The interaction of theloop steam flow with subcooled ECC results in either a plug flow regime or aseparated flow regime depending on the steam flow rate, ECC flow rate, ECCsubcooling, and ECC injection configuration.
Plug flow regimes are characterized by the formation of a water plug which fills thepipe cross section. In plug flow, the plug can either remain stationary or oscillaterelative to the injection nozzle location.
Separated flow is typically stratified flow. The steam and water flows can becocurrent (e.g., cold leg ECC injection) or countercurrent (e.g., hot leg ECCinjection).
Because the steam and ECC flow rates change with time during the course of aLOCA, changes in flow regime also occur. In some cases an "intermediate" flowregime can occur, in which the flow switches between plug and separated regimes,even for relatively constant conditions; this regime is called unstable plug flow.
With cold leg injection, both the ECC and steam flows are toward the downcomer(i.e., cocurrent). In this case, plug formation is determined by steam condensation.Oscillatory plug flow occurs at high ECC flows due to condensation oscillations. Whenthe plug/steam interface is downstream of the ECC nozzle, the steam condenses onthe plug interface which is continuously supplied with subcooled ECC. This strongcondensation causes a reduction in steam pressure in the cold leg which draws theplug upstream. When the plug/steam interface is upstream of the ECC nozzle, theinterface becomes saturated and condensation reduces significantly. Steam pressureincreases and pushes the plug downstream until the interface is exposed to the ECCnozzle and the process repeats. As the ECC flow decreases, the magnitude of theoscillations decreases. At low ECC flows, the plug breaks down into the cocurrentstratified flow regime (see Figure 4.3-1).
For hot leg injection, the ECC and steam flows are countercurrent rather thancocurrent. In this case, the steam/ECC interaction involves both condensation andthe countercurrent flow limitation (CCFL). Flow in the hot legs can be stratified flowor plug flow. Plug formation occurs at high steam flows due to the reversal of theECC flow by the momentum of the steam. The plug grows toward the steamgenerator (SG) as water accumulates in the hot leg. Water which reaches the SG U-tubes is evaporated by heat transfer from the secondary side. The plug is discharged
4.3-1
into the upper plenum when either the hydrostatic head of the plug, or the pressureincrease due to the evaporation in the U-tubes exceeds the loop differential pressure.
In combined injection PWRs, the phenomena described above occur simultaneouslyin the hot legs and cold legs. Also, the steam/ECC interaction in the hot leg caninfluence behavior in the cold leg and vice versa.
Overall, the steam/ECC interaction in the loops and the resultant flow regime affectthe steam condensation rate, the steam flow in the loops, and the rate andtemperature of ECC delivery to the reactor vessel.
Importance of Issue to PWR LOCA Behavior
The steam/ECC interaction in the loops and the resultant flow regime determine thesteam condensation rate, and the temperature and rate of ECC delivery to the reactorvessel. Plug formation in the loops could block steam flow in the loops and therebyimpair venting of steam generated in the core. These phenomena affect the overallsystem LOCA response, including core flooding rate and core cooling. The plug flowregime can also result in large oscillations of steam flow, water delivery to the reactorvessel, and system and loop pressures which may impact the time that reflood initiatesand may excite downcomer-core manometer oscillations during reflood.
Tests and Analyses that Relate to Issue
The steam/ECC interaction in the loops and associated flow regimes have beeninvestigated in several tests and analyses within the 2D/3D Program and elsewhere.Table 4.3-1 lists the tests which are considered in this evaluation. Within the2D/3D Program, separate effects tests at UPTF investigated flow regime, condensationeffects and countercurrent flow effects under controlled conditions. These testscovered cold leg injection, hot leg injection, and combined injection. Also, integraltests at CCTF and UPTF provided information on steam/ECC interactions duringsimulated transients. Outside the 2D/3D Program, numerous separate effects testswere performed at small-scale facilities. The small-scale tests included tests with coldleg injection and tests with hot leg injection.
The evaluation of the UPTF separate effects with cold leg injection includingcomparisons to the applicable integral tests at CCTF and UPTF, and the separateeffects tests at small-scale facilities is provided in Reference U-458. Evaluation of theUPTF separate effects tests with hot leg injection is provided in References G-41 I andG-91 1. Reference G-411 also covers the evaluation of the combined injection integraltests. The major results of these evaluations and comparisons are discussed below.
4.3-2

Post-test TRAC calculations have been performed for several of the UPTF and CCTFtests. These analyses include TRAC-PF1/MOD1 calculations of UPTF Tests 8 and 9(References G-641 and G-642, respectively) and TRAC-PF1/MOD2 calculations ofUPTF Tests 8A, 25, 2 and 177B, and several CCTF tests (Reference U-714). Inaddition, a post-test analysis of UPTF Test 26A was performed using ATHLET(Reference G-646).
Summary of Key Results and Conclusions from Tests and Analyses
The test results indicate that the loop flow regime depends strongly on thethermodynamic ratio (RT) which is the ratio of the potential condensation rate to thesteam flow. A thermodynamic ratio of one indicates that the ECC can fully condensethe steam.
RT = - TEJMfsm (hsm - h)
In general, stratified flow occurred when the condensation potential of the ECC wasless than the steam flow (RT <1), and plug flow occurred when the condensationpotential of the ECC exceeded the steam flow (RT > 1). Whether plug flow was stableor unstable was determined by the momentum flux of the loop steam flow. Detaileddiscussions of the results are provided in Subsections 4.3.1, 4.3.2, and 4.3.3 for coldleg injection, hot leg injection, and combined injection, respectively.
4.3-3
4.3.1 Cold Leg Injection
The results of the UPTF separate effects tests with cold leg injection are plotted inFigure 4.3-2. This figure indicates that plug flow only occurred when the condensationpotential of the ECC exceeded the steam flow (i.e., thermodynamic ratio greater thanone). At low steam flows plug flow was unstable because the momentum of the steamflow was not sufficient to maintain the plug. The cyclic formation and decay of waterplugs in unstable plug flow resulted in large pressure and flow oscillations.
Figure 4.3-2 also indicates that stratified flow always occurred when the steam flowexceeded the ECC condensation potential (i.e., a thermodynamic ratio less than one).Stratified flow also occurred at thermodynamic ratios slightly greater than one. Inthese cases, thermal stratification of the water layer in the bottom of the cold leglimited condensation to less than its maximum value and prevented total consumptionof steam. The highest thermodynamic ratio for which stratified flow was observed wasabout 1.3.
For comparison, Figure 4.3-2 includes data from UPTF integral test results coveringflow conditions from end-of-blowdown through reflood. As shown in the figure, theintegral test data were consistent with the separate effects test data.
As indicated above, for stratified flow conditions, the steam was only partiallycondensed. Condensation in this case was evaluated in terms of condensationefficiency, defined as the ratio of the measured condensation rate to the condensationrate needed to heat the ECC to saturation. The condensation efficiency for the UPTFseparate effects tests was found to be 80-100% with saturated and slightlysuperheated steam as shown by the circle data on Figure 4.3-3. UPTF integral testresults, where stratified flow conditions existed (the triangle data points inFigure 4.3-3), were consistent with the separate effects test results.
The flow regime results from subscale tests were found to be consistent with the UPTFresults in that the transition from stratified flow to plug flow occurred at athermodynamic ratio somewhat greater than one. A summary of the flow regimetransition boundary vs. scale is shown in Figure 4.3-4. Scale appears to have a smallinfluence on flow regime, whereas the nozzle orientation appears to have a moresignificant influence. The flow regime transition thermodynamic ratio tended todecrease slightly towards 1.0 with increasing scale for tests with top ECC injectionnozzles. Results for tests with side ECC injection nozzles indicate that flow regimetransition occurs at thermodynamic ratios around 1.3 instead of about 1.0 for top ECCinjection. The thermodynamic ratio for the transition to plug flow was higher for sideinjection than top injection because side injection tends to result in thermal stratificationof the water layer in the cold leg which, as indicated above, limits steam condensationand prevents plug formation. The condensation efficiencies determined from thescaled tests were close to 100%.
4.3-4
Post-test runs of the TRAC-PFI/MOD2 code (Versions 5.3 and 5.4) were used toassess the code's ability to predict cold leg flow phenomena for UPTF Tests 8A, 25,2A, and 17B, and CCTF Tests C2-SH2 and C2-4 (Reference U-714). Results indicatedthat the code predicts the flow regime and the transition point between plug flow andstratified flow. For plug flow, the code predicted the frequency of the flow andpressure oscillations but slightly underpredicted the amplitude of the oscillations.Condensation during plug flow conditions was also underpredicted. For stratified flowconditions, code predictions of condensation rate and the temperature of ECCdelivered to the downcomer were in good agreement with the test results.
Typically, cold leg injection PWRs use top injection for the ECC; hence, plug flow isexpected to occur when the ECC flow is high enough to cause the thermodynamicratio to exceed 1.0. During an LBLOCA, the high ECC flow from accumulator injectionis sufficient to cause plug flow. Accumulator injection occurs during the end-of-blowdown, refill, and early reflood phases of the LBLOCA. The plug does not preventsteam flow through the cold leg as has sometimes been conservatively assumed;instead condensation on the plug interface induces a steam flow. The late refloodphase is characterized by lower ECC flow rates from the pumped low pressure coolantinjection system. For this phase, stratified flow is expected except for selectedcombinations of conditions like low steam flow coupled with flow from both lowpressure injection pumps (i.e., no-LPCI-failure case). Condensation efficiency duringthe stratified flow regime is expected to be near 100%.
4.3-5
4.3.2 Hot Leg Injection
In the UPTF tests with hot leg injection, three different flow regimes were observed;specifically, stable plug flow, unstable plug flow, and stratified flow. Each of these flowregimes is described below.
In stable plug flow, a water plug formed adjacent to the injection nozzle. The pluggrew toward the steam generator as ECC accumulated in the hot leg. For testsin which steam was injected in the steam generator simulator (SGS) to simulatevaporization of the plug in the steam generator U-tubes, the plug was dischargedinto the upper plenum when the combination of the increase in SGS pressure andthe hydrostatic head of the plug exceeded the momentum flux of the steam flow.For tests in which steam was not injected in the SGS, the plug was dischargedinto the upper plenum when the hydrostatic head of the plug exceeded themomentum flux of the steam flow into the hot leg. In both cases, ECC delivery tothe upper plenum fluctuated over time.
In unstable plug flow, water plugs alternately formed and decayed. The cyclicformation and decay of water plugs resulted in pressure and flow oscillations, andfluctuations in ECC delivery to the upper plenum.
In stratified flow, steam flowed toward the steam generator in the top portion ofthe hot leg while ECC flowed toward the upper plenum in the bottom portion ofthe hot leg. In some cases, the water layer was thermally stratified. At high steamflows, the ECC flow was partially reversed resulting in temporary wateraccumulation (or hold-up) and fluctuations in ECC delivery. However, at lowsteam flows, there was no significant hold-up and ECC delivery fluctuated onlyslightly.
Regardless of whether water delivery to the upper plenum fluctuated or was nearlysteady, almost all of the ECC injected into the hot legs was delivered to the upperplenum.
Figure 4.3-5 is a plot of the steam flow versus condensation potential of the ECCwhich indicates the flow regime established under different conditions. Included in thefigure is a line which shows the condensation potential and steam flow are equal(i.e., thermodynamic ratio, R. of one). Figure 4.3-5 shows that when thecondensation potential was less than the steam flow (i.e., RT <1), flow in the hot legwas stratified to provide a vent path for the uncondensed steam flow.
Figure 4.3-5 shows that plug flow, either stable or unstable, occurred only when thecondensation potential of the ECC exceeded the steam flow (i.e., RT >1). The UPTFdata also show that, for a given condensation potential, unstable plug flow occurredat low steam flows.
4.3-6
Siemens calculated the minimum steam flow for stable plug flow assuming that theplug does not decay when the flow force acting on the end of the plug balances orexceeds the hydrostatic pressure on the plug end and the momentum flux of the ECC(Reference G-41 1). The calculations predict that the minimum steam flow for stableplug flow in the hot legs is dependent on the pressure, the pipe diameter, and thecondensation potential of the ECC (Reference G-91 1). The results of thesecalculations are compared to the UPTF data in Figure 4.3-5 and to the Creare data inFigure 4.3-6. As shown in these figures, the calculated minimum steam flow for stableplug flow is consistent with the data.
Post-test calculations of the UPTF tests were performed using both TRAC-PFI/MOD1and ATHLET. The momentum interaction between the steam and ECC was wellpredicted by the codes. Specifically, the code predictions of flow parameters such asmass flow rates, liquid levels, entrainment, and countercurrent flow limitation were ingood agreement with the test data. However, the code predictions of interfacial heattransfer were deficient (References G-641 and G-646).
Based on the full-scale UPTF tests, the following conclusions can be made regardingLBLOCA behavior in PWRs with hot leg ECC injection.
For typical core exit steam flows (i.e., 50 kg/s to 100 kg/s) and ECC flow ratesup to 150 kg/s, the flow regime in the hot leg is stratified countercurrent flow andECC delivery to the upper plenum is steady. However, for ECC flow rates higherthan 150 kg/s, the flow regime is plug flow and delivery of subcooled ECC to theupper plenum fluctuates.
Regardless of the hot leg flow regime, almost all ECC injected into the hot legs isdelivered to the upper plenum. In the case of plug flow, a small amount of wateris evaporated if the water plug enters the SG U-tubes.
4.3-7
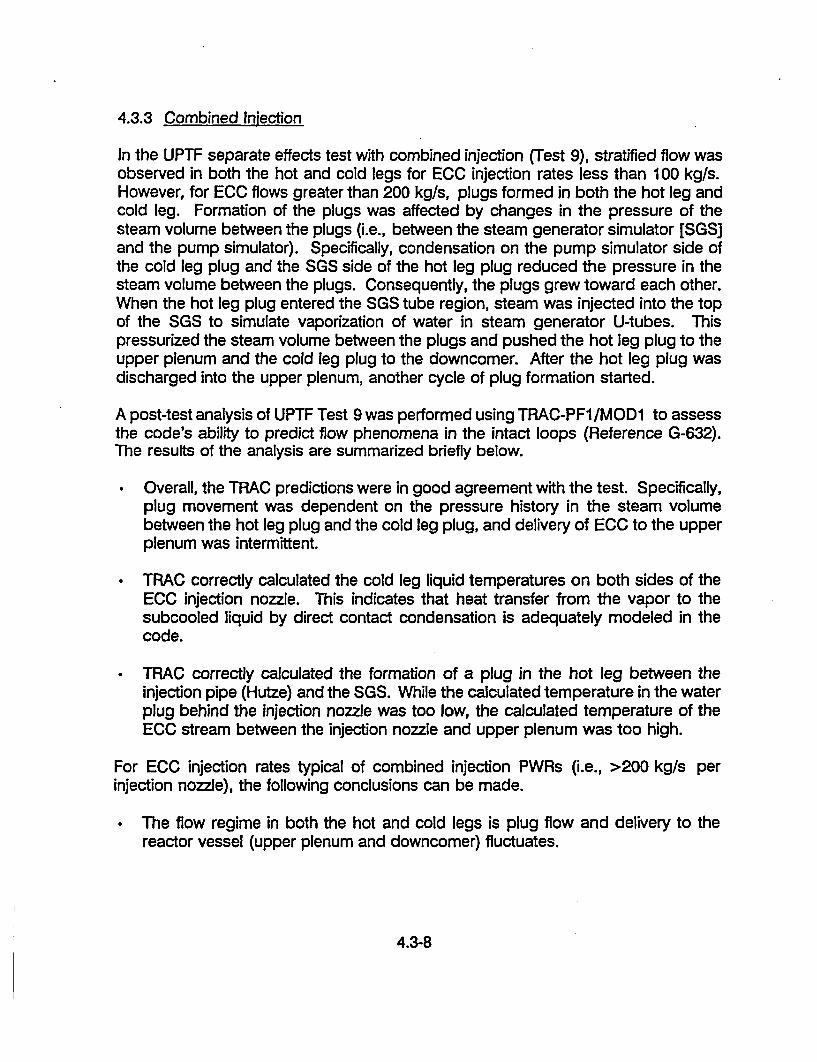
4.3.3 Combined Injection
In the UPTF separate effects test with combined injection (Test 9), stratified flow wasobserved in both the hot and cold legs for ECC injection rates less than 100 kg/s.However, for ECC flows greater than 200 kg/s, plugs formed in both the hot leg andcold leg. Formation of the plugs was affected by changes in the pressure of thesteam volume between the plugs (i.e., between the steam generator simulator [SGS]and the pump simulator). Specifically, condensation on the pump simulator side ofthe cold leg plug and the SGS side of the hot leg plug reduced the pressure in thesteam volume between the plugs. Consequently, the plugs grew toward each other.When the hot leg plug entered the SGS tube region, steam was injected into the topof the SGS to simulate vaporization of water in steam generator U-tubes. Thispressurized the steam volume between the plugs and pushed the hot leg plug to theupper plenum and the cold leg plug to the downcomer. After the hot leg plug wasdischarged into the upper plenum, another cycle of plug formation started.
A post-test analysis of UPTF Test 9 was performed using TRAC-PFI/MOD1 to assessthe code's ability to predict flow phenomena in the intact loops (Reference G-632).The results of the analysis are summarized briefly below.
Overall, the TRAC predictions were in good agreement with the test. Specifically,plug movement was dependent on the pressure history in the steam volumebetween the hot leg plug and the cold leg plug, and delivery of ECC to the upperplenum was intermittent.
TRAC correctly calculated the cold leg liquid temperatures on both sides of theECC injection nozzle. This indicates that heat transfer from the vapor to thesubcooled liquid by direct contact condensation is adequately modeled in thecode.
TRAC correctly calculated the formation of a plug in the hot leg between theinjection pipe (Hutze) and the SGS. While the calculated temperature in the waterplug behind the injection nozzle was too low, the calculated temperature of theECC stream between the injection nozzle and upper plenum was too high.
For ECC injection rates typical of combined injection PWRs (i.e., >200 kg/s perinjection nozzle), the following conclusions can be made.
* The flow regime in both the hot and cold legs is plug flow and delivery to thereactor vessel (upper plenum and downcomer) fluctuates.
4.3-8

* Essentially all ECC injected into the intact loops is delivered to the reactor vessel.
* The steam flow in the intact loops is completely condensed in the loops.
4.3-9
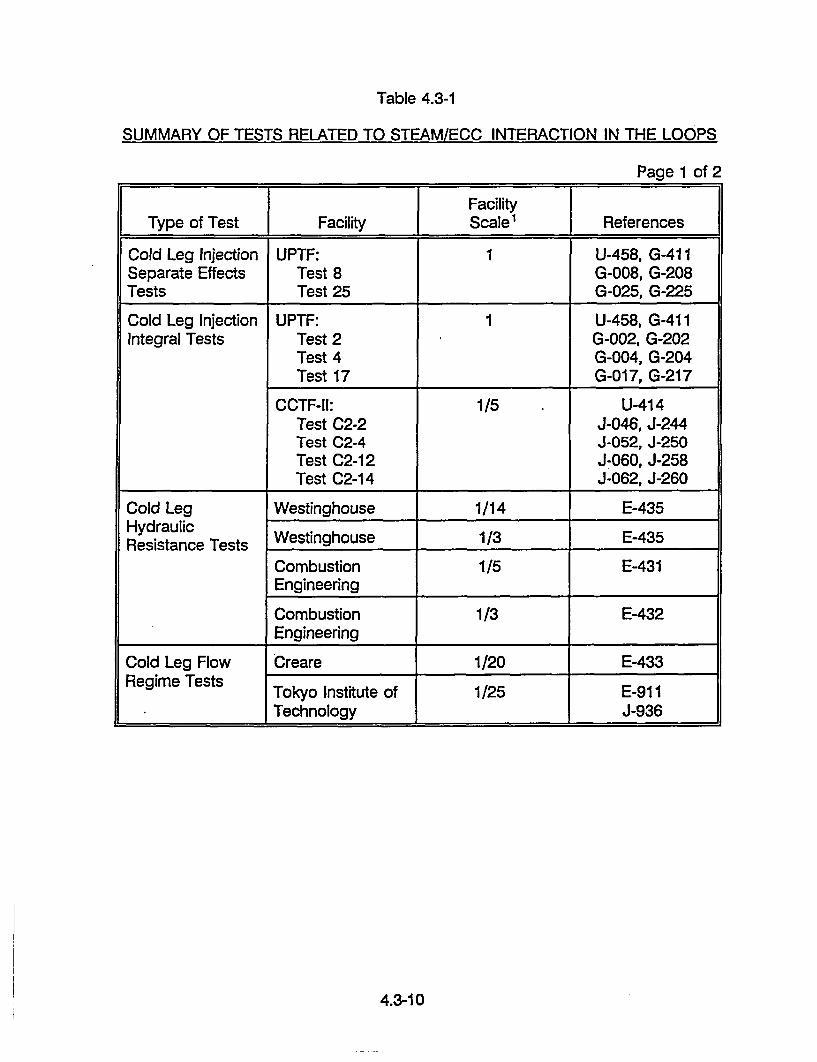
Table 4.3-1
SUMMARY OF TESTS RELATED TO STEAM/ECC INTERACTION IN THE LOOPS
Page 1 of 2
FacilityType of Test Facility Scale' References
Cold Leg Injection UPTF: 1 U-458, G-411Separate Effects Test 8 G-008, G-208Tests Test 25 G-025, G-225
Cold Leg Injection UPTF: 1 U-458, G-411Integral Tests Test 2 G-002, G-202
Test 4 G-004, G-204Test 17 G-017, G-217
CCTF-11: 1/5 U-414Test C2-2 J-046, J-244Test C2-4 J-052, J-250Test C2-12 J-060, J-258Test C2-14 J-062, J-260
Cold Leg Westinghouse 1/14 E-435HydraulicResistance Tests Westinghouse 1/3 E-435
Combustion 1/5 E-431Engineering
Combustion 1/3 E-432Engineering
Cold Leg Flow Creare 1/20 E-433Regime Tests Tokyo Institute of 1/25 E-911
Technology J-936
4.3-10

Table 4.3-1
SUMMARY OF TESTS RELATED TO STEAM/ECC INTERACTION IN THE LOOPS
Page 2 of 2
FacilityType of Test Facility Scale1 References
Hot Leg Injection UPTF: 1 G-411, G-911Separate Effects Test 8 G-008, G-208Tests Test 26 G-026, G-226
Hot Leg Flow Creare 1/5 E-434Regime Tests Creare 1/10 E-434
Combined UPTF: 1 G-411Injection Separate Test 9 G-009, G-209Effects Tests
Combined UPTF: I G-411Injection Integral Test 3 G-003, G-203Tests Test 14 G-014, G-214
Test 18 G-018, G-218Test 19 G-019, G-219
CCTF-11: 1/5Test C2-19 J-067, J-454, J-Test C2-20 455Test-C2-21 J-068, J-456
J-069, J-456
NOTE:
1. The facility scale is based on the loop diameter and is relative to a typicalPWR.
4.3-11

CondensationCold Leg
4.---
Oscillations
Downcomer
PLUG FLOW
Steam Flow toBroken Loop Cold Leg
MECC (Subcooled)
Cold Leg
4---.s
Downcomer
STRATIFIED FLOW
COLD LEG FLOW REGIMES
FIGURE 4.3-14.3-12

E
CD
x
Cd
Ecc
co
0 50 100 150 200 250 300
Potential Condensation Rate of ECC (kg/sec-m2)
COLD LEG FLOW REGIME DATAFROM UPTF COLD LEG INJECTION TESTS
(REFERENCE U-458)
FIGURE 4.3-2
r
Lu
"0a,
00 0.25 0.5 0.75 1 1.25 1.5
Thermodynamic Ratio - RT
CONDENSATIONIN
EFFICIENCY FOR STRATIFIED FLOW CONDITIONSUPTF COLD LEG INJECTION TESTS
(REFERENCE U-458)
FIGURE 4.3-34.3-13
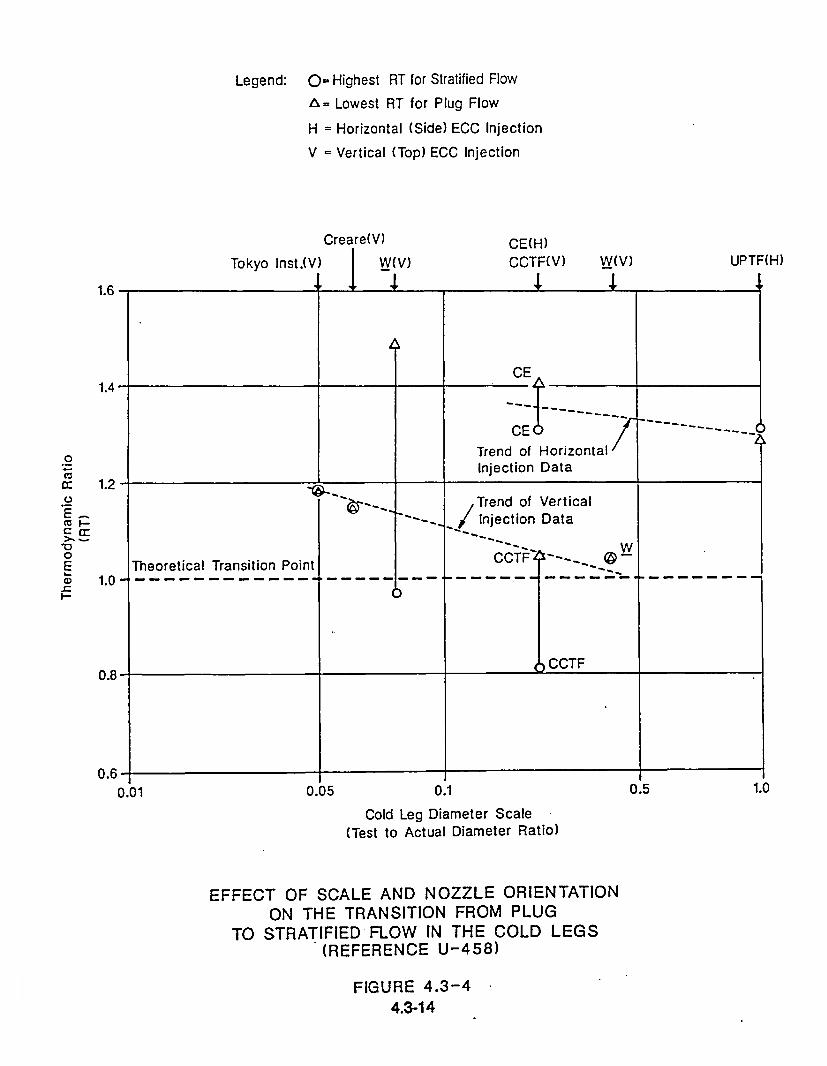
Legend: 0- Highest RT for Stratified Flow
A= Lowest RT for Plug Flow
H = Horizontal (Side) ECC Injection
V = Vertical (Top) ECC Injection
Tokyo Inst.(V
Creare(V) CE(H)CCTF(V) W(V)((V)
1UPTF(H)
,I I.1.6
1.4
I
CE
-C-E
Trend of Horizontal"Injection Data
.2
0Ea)
1.2s~. * = * -
Trend of Vertical/ Injection Data" "
s-s w
CCTF~I =Theoretical Transition Point1.0-
L)CCTF0.8
0.6 I I
0.01 0.05 0.1 0.5 1.0
Cold Leg Diameter Scale(Test to Actual Diameter Ratio)
EFFECT OF SCALE AND NOZZLE ORIENTATIONON THE TRANSITION FROM PLUG
TO STRATIFIED FLOW IN THE COLD LEGS(REFERENCE U-458)
FIGURE 4.3-44.3-14

kg/s Stable Unstable Stratified : T:RT lkg/s i~ilwater pluglwater plug flow .plug:plg . . . . . .:..'.'Stable plug flow".' ..I ° ... . .- " ....
.. .......... ......... ....... ,..
E 5Minimum steam flow
• \1 ,,for stable plug flowtj Ž...-*z (Siemens calculation)
CD,
†††" Unstable.:.:. plug flow
•°.. •l°.. .. .°. . °.,-
0 50 100 kg/s 140
Steam condensation potential of ECC-water, IMs, cond, pot
HOT LEG FLOW REGIME DATAFROM UPTF HOT LEG INJECTION TESTS
(REFERENCE G-411)
FIGURE 4.3-5
4.3-15
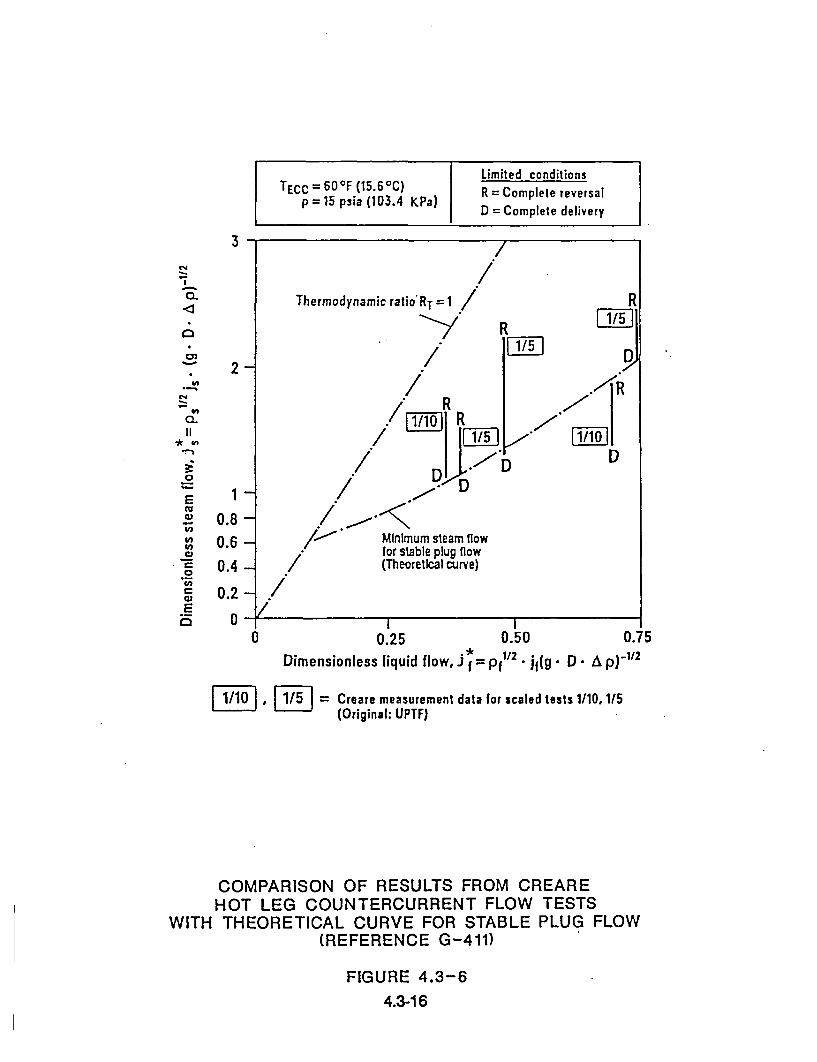
Limited conditionsTECC = 60'F (15.6 0C) R = Complete reversal
p = 15 psia (103.4 KPa) D = Complete delivery
3
C4'
C-
Eca
Cn
0co
2
1
0.80.60.4
0.2
0
Dimensionless liquid flow, i f= p •12 jf(g D. -,A P1 2
1/1 F1/51 = Creare measurement data for scaled tests 1/10, 1/5(Original: UPTF)
COMPARISON OF RESULTS FROM CREAREHOT LEG COUNTERCURRENT FLOW TESTS
WITH THEORETICAL CURVE FOR STABLE PLUG FLOW(REFERENCE G-411)
FIGURE 4.3-6
4.3-16

4.4 EFFECT OF ACCUMULATOR NITROGEN DISCHARGE
Definition of Issue and Description of Phenomena
In some PWRs, depending on accumulator design, the discharge of nitrogen fromECC accumulator tanks into the primary system occurs shortly after the start of thereflood phase of the LOCA transient. When the water in the accumulator tankattached to the cold leg of each coolant loop is depleted, the nitrogen that pressurizesthe tanks escapes through the ECC piping (see Figure 4.4-1). The nitrogen flows ata much higher volumetric rate than the preceding water because the pressure lossesin the piping are less for the lower density gas. The effects of the nitrogen flowtransient have been discussed previously in Reference U-91 1, a summary of TRACanalyses of the phenomenon.
The nitrogen quickly pushes ECC water from the intact cold legs into the reactorvessel downcomer. Also, water in the top of the downcomer and in the broken coldleg is pushed toward the break. The primary system (particularly the region into whichthe nitrogen is injected) is pressurized for a short period until the nitrogen can leavethe system.
System pressure is further increased by suppression of steam condensation. Asnitrogen mixes with or displaces steam, the rate of condensation becomes much lowerthan when pure steam was in contact with the subcooled water (see Figure 4.4-1).The accumulation of uncondensed steam contributes to the temporary pressurizationof the downcomer and cold leg regions of the primary system.
Note that just before the nitrogen discharge begins, the pressure above the coreexceeds the pressure in the downcomer due to the pressure drop of steam flowingfrom the upper plenum around the intact loops. The pressure difference keeps thewater level in the core lower than in the downcomer (see Figure 4.4-2). The nitrogenpressurization of the downcomer disrupts the existing pressure distribution and forcesa portion of the water in the downcomer into the lower plenum, displacing lowerplenum water into the core (see Figure 4.4-3). The lower plenum water is subcooled,in part due to the rise in pressure. As the water surges into the core, heat isabsorbed until, after a brief delay during which the water is heated to saturation,additional steam is produced.
The increased steam production in the core increases the pressure above the core.The pressure increase, coupled with a decreasing nitrogen discharge rate, eventuallystops the rise in core water (see Figure 4.4-4) and then forces some of the water toflow out of the core and back into the lower plenum (see Figure 4.4-5). More watermay remain in the core than was present before the nitrogen-induced surge.
4.4-1

Importance of Issue to PWR LOCA Phenomena
Proper understanding and characterization of the nitrogen discharge transient isimportant because the reflood turnaround in clad temperatures can be significantlyaffected. Specifically, the volume and duration of the water surge into the core maybe sufficient to quench some portions of the core and to temporarily arrest thetemperature rise in other portions. The ensuing reflood would begin with lower cladtemperatures.
The goals of the 2D/3D tests and analyses discussed in this section were to confirmthe occurrence of, and quantify the magnitude and duration of, the followingphenomena:
* The dilution or displacement of steam in the downcomer and cold leg regions by
nitrogen,
* The rapid increase in core water inventory,
* The subsequent drop in core water inventory, and
* The quench or cooling of the fuel rods and the reduction in clad temperatures.
Note that the issue of the effect of accumulator nitrogen discharge is not applicableto GPWRs with combined injection because the accumulators are designed not toempty completely during an LBLOCA.
Tests and Analyses that Relate to the Issue
Tests and analyses related to accumulator nitrogen discharge, which are evaluated inthis report, are listed in Table 4.4.-1. Within the 2D/3D Program, one CCTF test(Test C1 -15) and one UPTF test (Test 27A) simulated the nitrogen discharge. Outsidethe 2D/3D Program, a nitrogen discharge test was conducted at Achilles. ThreeTRAC PWR calculations included accumulator nitrogen discharge as part of theLBLOCA transient. The results of the 2D/3D tests and TRAC PWR analyses aresummarized in Tables 4.4-2 and 4.4-3, respectively.
CCTF Test C1-15 apparently was not successful in simulating the nitrogen discharge.In the test, ECC water was injected into the intact cold legs from a single accumulatortank pressurized by nitrogen. The water inventory and valve timing for the tankallowed the nitrogen to flow out of the tank for 10 seconds after the water wasdepleted. However, test measurements indicate that most or all of the nitrogenapparently was expended in clearing out the lengthy ECC piping between the tank andthe loop nozzles. Water was still passing through the cold leg injection nozzles untiljust before the accumulator tank outlet valve was closed. Observed effects on the
4.4-2

downcomer and core water levels were minimal, and no nitrogen was detected bycalculations of the steam partial pressure in the cold legs and reactor vessel.Accordingly, the test did not yield detailed insight into effects of the nitrogen dischargein the primary system.
UPTF Test 27 Phase A was successful in injecting nitrogen into the primary systemand induced measurable effects, but the duration of the nitrogen discharge was muchshorter than planned. Due to facility limitations, the test injected nitrogen directly intothe upper downcomer rather than through each cold leg ECC nozzle. Downcomerinjection was judged to have an equivalent effect on core and downcomer water levels.Unfortunately, less than one second after the nitrogen discharge initiated, automaticshutdown of the test occurred due to an excessive indicated water level rise of overfour meters in the core region. In all, about 11 m3 (40% of the downcomer volume)of nitrogen was injected before the test ended.
The three TRAC PWR analyses modelled core cooling following a large-break LOCAin four-loop reactor plants. The analyses are summarized in References U-724, U-726,and U-727. As shown in Table 4.4-3, the assumptions in one analysis varied slightlyfrom assumptions in the others, but the results were very similar. In addition to thePWR analyses, a post-test TRAC analysis of UPTF Test 27A, which simulated nitrogendischarge, was performed.
The reviews of the results of the TRAC evaluation and the analyses of the CCTF andUPTF tests are detailed in Reference U-459. The Achilles test is discussed inReference E-031.
Summary of Key Results and Conclusions from Tests and Analyses
The results of the evaluation of UPTF Test 27A are summarized in Table 4.4-2.Evaluation of the UPTF test results revealed that the large indicated core water levelincrease and downcomer water level decrease were not representative of true levelchanges. The fluid in each region was displaced so rapidly that inertial and flowvelocity pressure gradients in the fluid distorted level indications that were based ondifferential pressure. The pressure gradients and corrected water levels werecalculated using a simplified hydraulic model of the regions (Reference U-459). Thecorrected core and downcomer water levels during the transient are plotted in Figure4.4-6. The beginning of nitrogen injection and the end of the test are indicated in thefigure. In the short time that the test ran during the nitrogen injection, the correctedcore level rose by about 1.5 meters from 20% of the core height to 60% of the coreheight. The test was terminated before the peak level occurred. The UPTF test didnot simulate the peak magnitude and duration of the core level surge, the long-termeffects of the nitrogen, or the effect of the level surge on core cooling.
Evaluation of UPTF Test 27A also showed that steam in the downcomer and cold legswas significantly diluted by nitrogen. The composition of the steam/nitrogen mixturein the downcomer and one intact cold leg is plotted in Figure 4.4-7. Pressure and
4.4-3
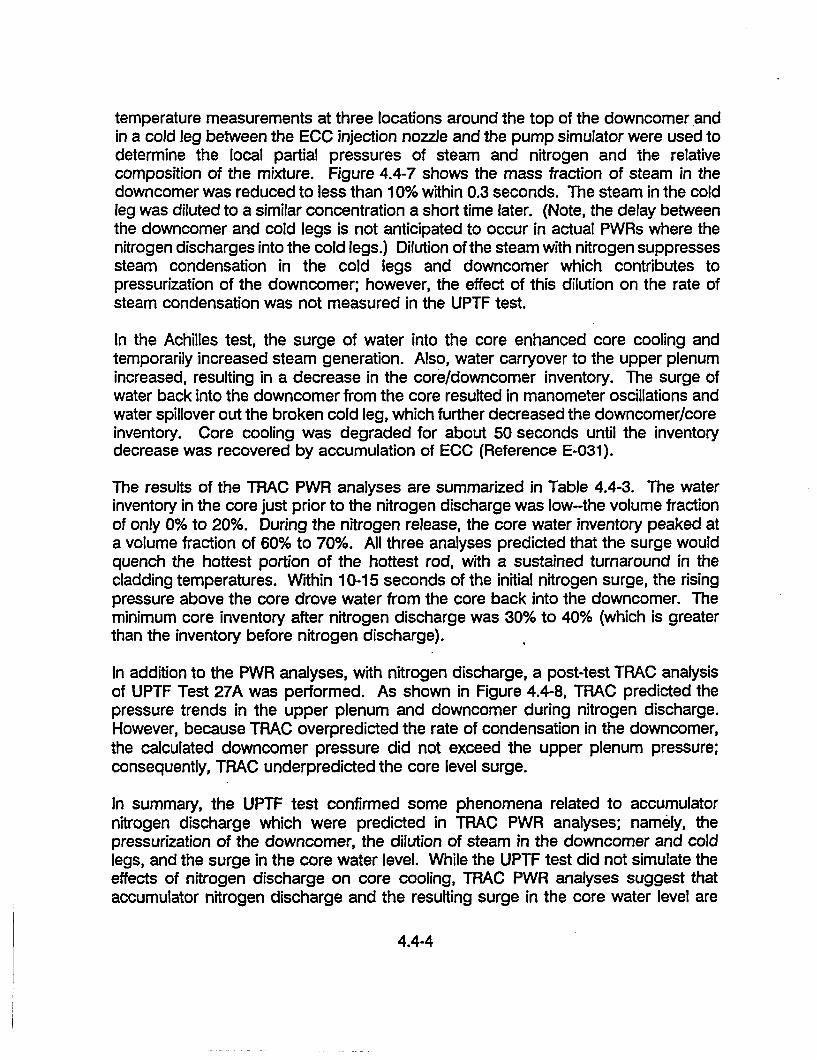
temperature measurements at three locations around the top of the downcomer andin a cold leg between the ECC injection nozzle and the pump simulator were used todetermine the local partial pressures of steam and nitrogen and the relativecomposition of the mixture. Figure 4.4-7 shows the mass fraction of steam in thedowncomer was reduced to less than 10% within 0.3 seconds. The steam in the coldleg was diluted to a similar concentration a short time later. (Note, the delay betweenthe downcomer and cold legs is not anticipated to occur in actual PWRs where thenitrogen discharges into the cold legs.) Dilution of the steam with nitrogen suppressessteam condensation in the cold legs and downcomer which contributes topressurization of the downcomer; however, the effect of this dilution on the rate ofsteam condensation was not measured in the UPTF test.
In the Achilles test, the surge of water into the core enhanced core cooling andtemporarily increased steam generation. Also, water carryover to the upper plenumincreased, resulting in a decrease in the core/downcomer inventory. The surge ofwater back into the downcomer from the core resulted in manometer oscillations andwater spillover out the broken cold leg, which further decreased the downcomer/coreinventory. Core cooling was degraded for about 50 seconds until the inventorydecrease was recovered by accumulation of ECC (Reference E-031).
The results of the TRAC PWR analyses are summarized in Table 4.4-3. The waterinventory in the core just prior to the nitrogen discharge was low-the volume fractionof only 0% to 20%. During the nitrogen release, the core water inventory peaked ata volume fraction of 60% to 70%. All three analyses predicted that the surge wouldquench the hottest portion of the hottest rod, with a sustained turnaround in thecladding temperatures. Within 10-15 seconds of the initial nitrogen surge, the risingpressure above the core drove water from the core back into the downcomer. Theminimum core inventory after nitrogen discharge was 30% to 40% (which is greaterthan the inventory before nitrogen discharge).
In addition to the PWR analyses, with nitrogen discharge, a post-test TRAC analysisof UPTF Test 27A was performed. As shown in Figure 4.4-8, TRAC predicted thepressure trends in the upper plenum and downcomer during nitrogen discharge.However, because TRAC overpredicted the rate of condensation in the downcomer,the calculated downcomer pressure did not exceed the upper plenum pressure;consequently, TRAC underpredicted the core level surge.
In summary, the UPTF test confirmed some phenomena related to accumulatornitrogen discharge which were predicted in TRAC PWR analyses; namely, thepressurization of the downcomer, the dilution of steam in the downcomer and coldlegs, and the surge in the core water level. While the UPTF test did not simulate theeffects of nitrogen discharge on core cooling, TRAC PWR analyses suggest thataccumulator nitrogen discharge and the resulting surge in the core water level are
4.4-4

beneficial to core cooling. Specifically, TRAC predicts that the hottest portion of thehottest rod is quenched by the level surge.
4.4-5

Table 4.4-1
SUMMARY OF TESTS AND ANALYSES ADDRESSINGTHE EFFECT OF NITROGEN DISCHARGED FROM ECC ACCUMULATORS
Type of Test orAnalysis Facility References
End-of Blowdown, UPTF Test 27A U-459Refill & Reflood G-027
Test G-227G-411
Refill & Reflood CCTF Test Cl-15 U-459Test J-020
J-218J-407
Reflood Test Achilles E-031
TRAC-PF1/MOD2 -- U-716Post-test Analysisof UPTF Test 27A
TRAC-PF1/MOD1 U-724PWR Analyses
U-726
U-727
4.4-6
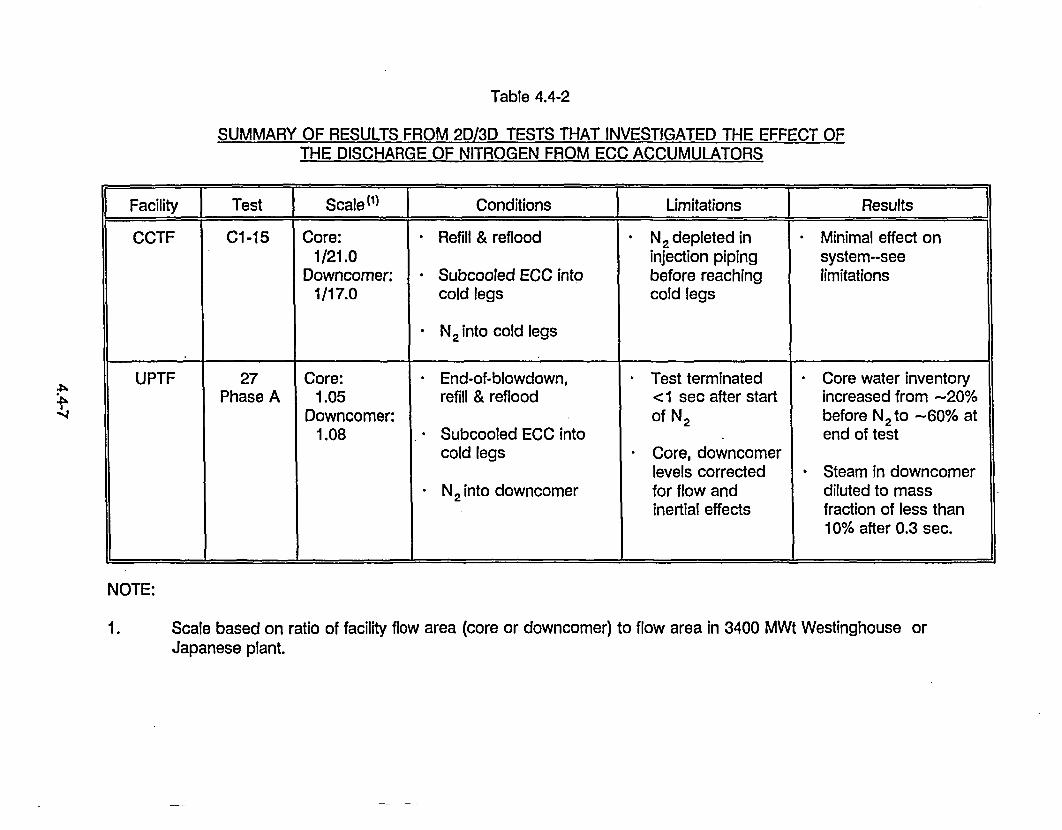
Table 4.4-2
SUMMARY OF RESULTS FROM 2D/3D TESTS THAT INVESTIGATED THE EFFECT OFTHE DISCHARGE OF NITROGEN FROM ECC ACCUMULATORS
Facility I Test Scale(1) Conditions Limitations ResultsCCTF C1-15 Core: Refill & reflood N2 depleted in Minimal effect on
1/21.0 injection piping system--seeDowncomer: Subcooled ECC into before reaching limitations
1/17.0 cold legs cold legs
N2 into cold legs
UPTF 27 Core: End-of-blowdown, Test terminated Core water inventoryPhase A 1.05 refill & reflood <1 sec after start increased from -20%Downcomer: of N2 before N2 to -60% at
1.08 Subcooled ECC into end of testcold legs Core, downcomer
levels corrected Steam in downcomerN2 into downcomer for flow and diluted to mass
inertial effects fraction of less than10% after 0.3 sec.
NOTE:
1 . Scale based on ratio of facility flow area (core or downcomer) to flow area in 3400 MWt Westinghouse orJapanese plant.
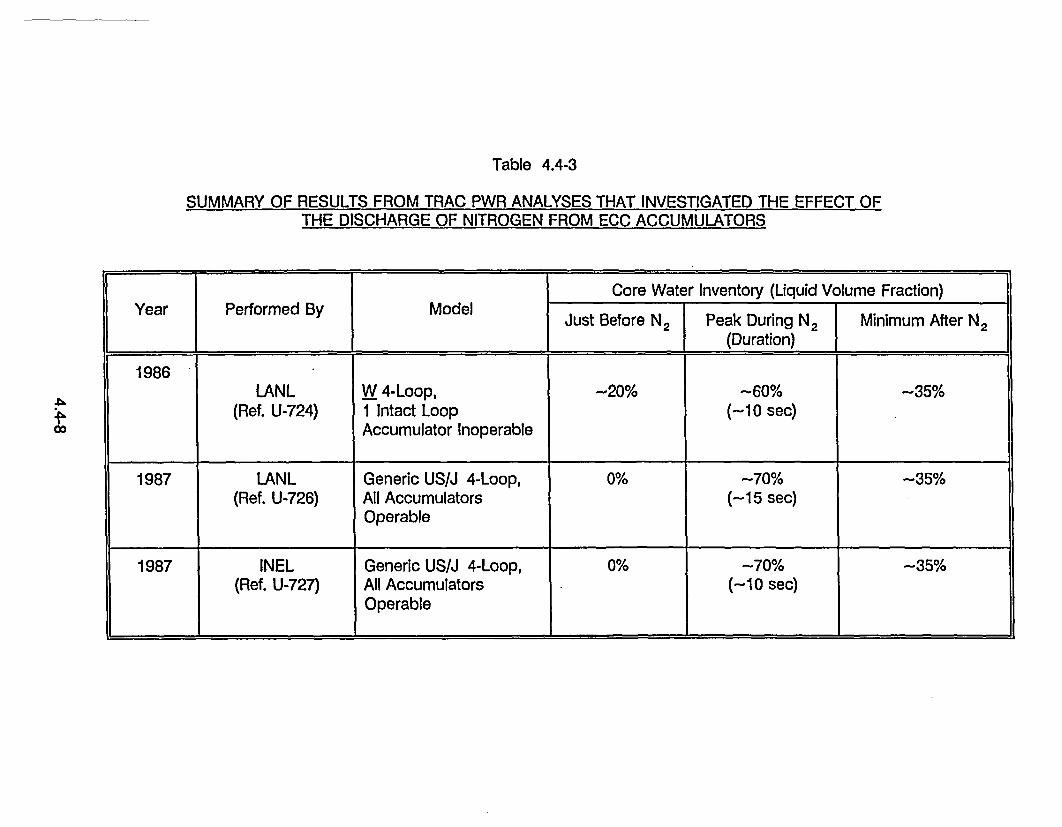
Table 4.4-3
SUMMARY OF RESULTS FROM TRAC PWR ANALYSES THAT INVESTIGATED THE EFFECT OFTHE DISCHARGE OF NITROGEN FROM ECC ACCUMULATORS
0o
Core Water Inventory (Liquid Volume Fraction)Year Performed By Model Just Before N 2 Peak During N 2 Minimum After N2
I_ I I (Duration)
1986LANL W 4-Loop, -20% -60% -35%
(Ref. U-724) 1 Intact Loop (-10 sec)Accumulator Inoperable
1987 LANL Generic US/J 4-Loop, 0% -70% -35%(Ref. U-726) All Accumulators (-15 sec)
Operable
1987 INEL Generic US/J 4-Loop, 0% -70% -35%(Ref. U-727) All Accumulators (-10 sec)
Operable

LEGEt40:
WATER
STEAM
. ACCUMULArORNITROGEN/STEAM MIXTURE
NITROGEN ACCUMULATOR
HOT
Ca
CORE LEVEL
BEFORE ACCUMULATOR WATER DEPLETION AFTER ACCUMULATOR WATER DEPLETION
INITIAL CHANGES IN CORE AND DOWNCOMER WATER LEVELSAND SUPPRESSION OF STEAM CONDENSATION DUE
TO ACCUMULATOR N2 PRESSURIZATION OF DOWNCOMER
FIGURE 4.4-1
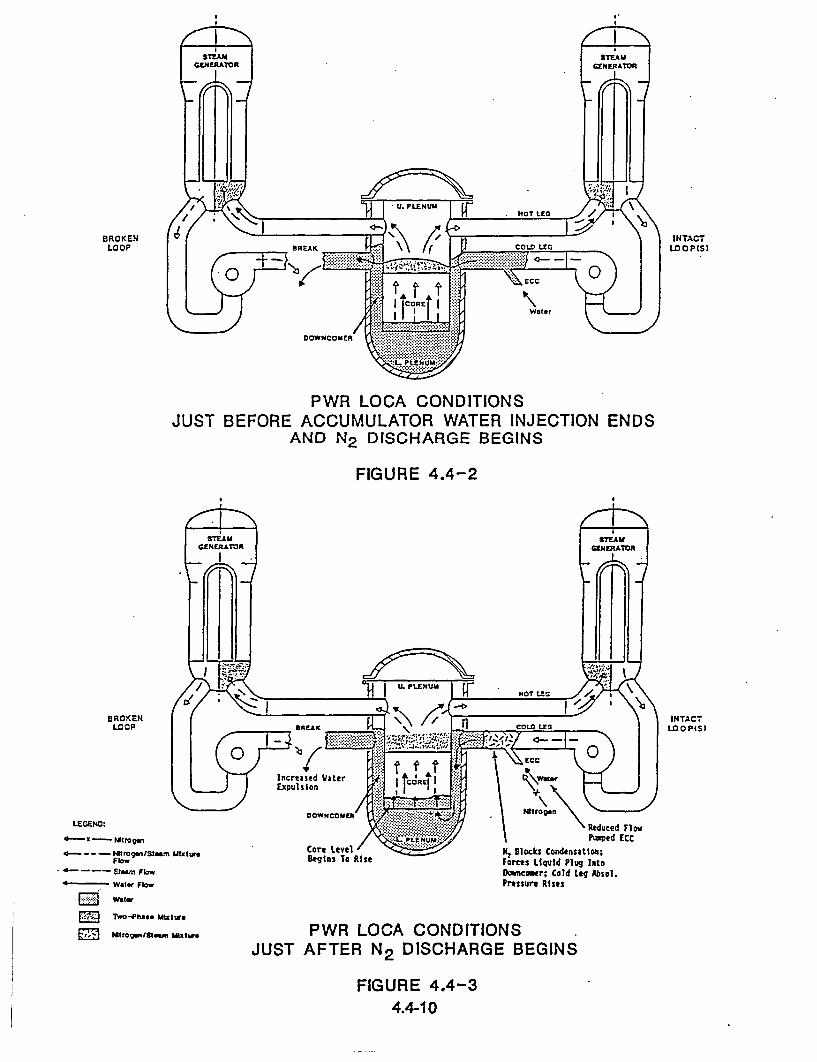
BROKENLOOP
INTACTLOOP(S)
Water
DOWNCOMER
PWR LOCA CONDITIONSJUST BEFORE ACCUMULATOR WATER INJECTION ENDS
AND N2 DISCHARGE BEGINS
FIGURE 4.4-2
BROKEN LLEGEND:
4-- mtrogenISteamn MixtureFlo.SteaM Flow
- -Water Flow
ED Water
M To-Phae. Miixture
uDetroganftseami amixue
INTACT2o00 PISM
'Reduced FlowPumped ECC
Iz Blacks Condensatiao;Forces Liquid Plug IntoDowncer; Cold Leg Absol.Pressure Rises
PWR LOCA CONDITIONSJUST AFTER N2 DISCHARGE BEGINS
FIGURE 4.4-34.4-10
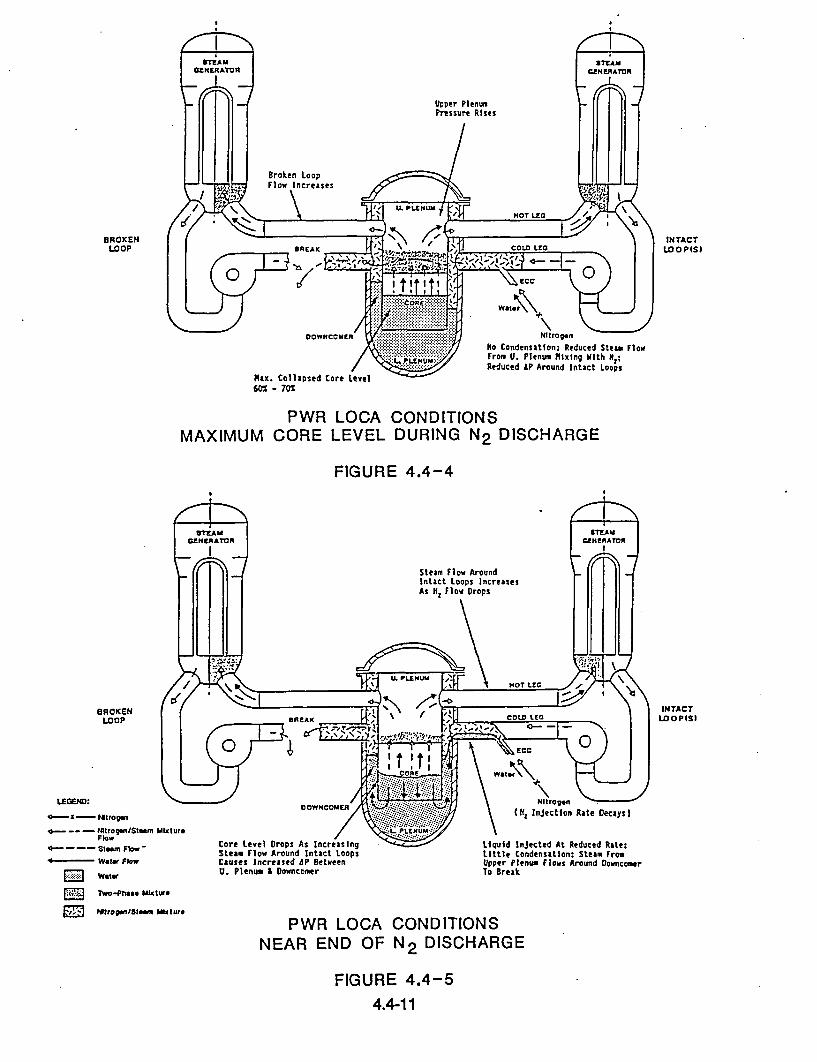
BROKENLOOP
INTACTLOOP(S)
Nitrogen
No Condensation: Reduced Steam FlowFrom U. Plenum Mixing With Na;Reduced AP Around Intact Loops
60% - 70%
PWR LOCA CONDITIONSMAXIMUM CORE LEVEL DURING N2 DISCHARGE
FIGURE 4.4-4
13ROKENLOOP
LEMOE:
*a-x- Ntrogen
--- mtrogen/Stearn MixtureFlow
4 --6e earn Flow
- Water Flow
Water
IVw-Phase mxtue
~Mrogel8ateiae fxtufe
INTACTLOOPIS)
Core Level Crops As Increasing " ' Liquid Injected At Reduced Rate:Steam Flow Around Intact Loops Little Condensation; Steam FromCauses Increased 4P Between Upper Plenum Flows Around OowncomerU. Plenum & Downcomer 'o Break
PWR LOCA CONDITIONSNEAR END OF N2 DISCHARGE
FIGURE 4.4-5
4.4-11

Topof Core
4
o
co
oC
ME
- 3-
2--
1 .
Bottom-/'of Core
73 73.5Time Since Start of Test in Seconds
CORRECTED CORE AND DOWNCOMER WATER LEVELSFOR UPTF TEST 27A(REFERENCE U-459)
FIGURE 4.4-6
74
4.4-12

* Downcomer - Above CL2
Downcomer - Above HL2
+ Downcomer - Above HL1
• -CL2
HL HL
12LLI
CO
50% . ............. .
40% - .. .... . .. . . . .. .. . . . . . . . .
30% . . . . . . . ... . . . . ." .. . ... . . . ... . . . . . . H.. . ... . ..
3o• ! ii i i iBroken Loop20 .................... .......... Broe Lo
0%I73 73.1 73.2 73.3 73.4 73.5 73.6 73.7 73 8 73.9 74 74.1
N2 Injection Begins Time Since Start of Test in Seconds Test Terminated
Composition of Steam/Nitrogen Mixture in Downcomer andCold Leg During UPTF Test 27A
(Reference U-459)Figure 4.4-7
Loop 2
CIL
) N Injection
rCL
Loop 3
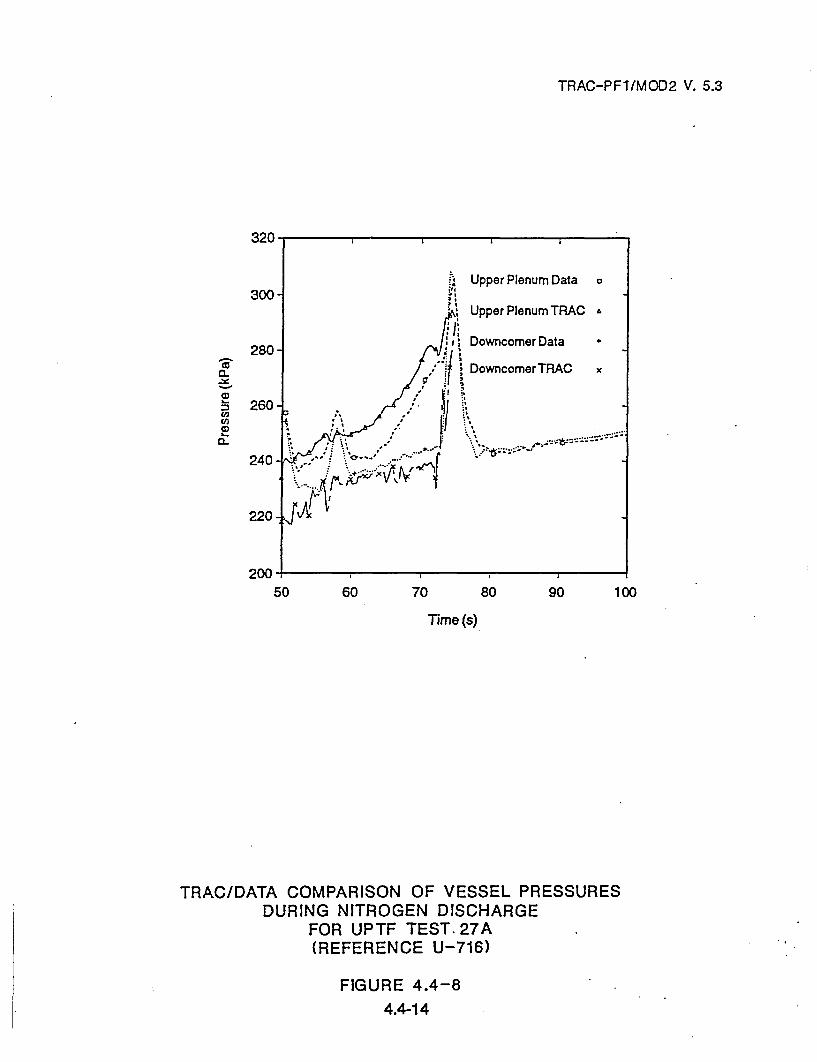
TRAC-PFI/MOD2 V. 5.3
CD
qnM~
50 60 70 80 90 100
Time (s)
TRAC/DATA COMPARISON OF VESSEL PRESSURESDURING NITROGEN DISCHARGE
FOR UPTF TEST. 27A(REFERENCE U-716)
FIGURE 4.4-84.4-14

4.5 THERMAL MIXING OF ECC AND PRIMARY COOLANT
Definition of Issue and Description of Phenomena
Thermal mixing of ECC and primary coolant refers to the mixing phenomena whichoccur in the cold legs and downcomer of a PWR as a result of high pressure coolantinjection (HPCI) into the cold legs at a time when the reactor coolant system is at anelevated temperature. This mixing relates to the overall reactor safety issue ofpressurized thermal shock (PTS). In PTS, the concern is that simultaneousoccurrence of the following conditions could result in brittle crack growth in the vesselwall and possibly even vessel failure.
" High pressure
" Sudden, localized reduction of reactor vessel wall temperature
" Reduced reactor vessel metal ductility due to prolonged irradiation
• Existing flaw in weld metal of reactor vessel
Hypothesized scenarios by which these conditions could occur simultaneously includeinadvertent HPCI actuation and an SBLOCA with HPCI. For these scenarios the keyconcern is how the ECC mixes with the primary coolant. If mixing is good, a slow anddrawn-out cooldown occurs, which provides sufficient time to prevent the developmentof significant temperature gradients in the vessel wall. However, if mixing is poor, theECC can "stream" through the cold leg and into the downcomer (see Figure 4.5-1).This stream of ECC could possibly cool local regions of the vessel wall, leading to walltemperature gradients and to a localized reduction of wall temperature.
Importance of Issue
Typically, if there is flow through the cold legs, either forced flow (i.e., reactor coolantpumps running) or natural circulation, good mixing is obtained in the cold legs.Hence, thermal mixing is of interest only in SBLOCA's where the flow in one or all coldlegs has stagnated. Thermal mixing in the cold legs and downcomer determines thetemperature transient to which the vessel wall is subjected.
Tests and Analyses that Relate to Issue
Within the 2D/3D Program, one test related to thermal mixing in the cold leg anddowncomer was performed at UPTF (Test No. 1). Test No. 1 consisted of fiveseparate test phases. In each phase, the primary system was initially filled with hotwater and cold ECC was injected into a single cold leg; the cold leg with ECC injectionwas blocked at the pump simulator. Since there was no heating during the test, each
4.5-1

phase was a gradual cooldown of the entire system. Due to facility design limitations,the initial primary system temperature was significantly lower than the primary systemtemperature in a PWR during a PTS-related transient.
Pre-test evaluation of the side-mounted ECC injection pipe in UPTF and GPWRsshowed that mixing was poor and not typical of US/J PWRs which inject ECC into thetop of the cold leg. To simulate mixing phenomena more typical of US/J PWRs, amodified ECC injection nozzle was used in UPTF. The design of the modified nozzlewas developed by the USNRC (Reference U-913).
Outside the 2D/3D Program, numerous subscale tests investigated mixing in the coldleg and downcomer. These tests were used to characterize the mixing phenomenaand develop computer codes (e.g., REMIX and NEWMIX). The results of these testsare not discussed in detail in this report. Evaluation of the UPTF and subscale tests,and comparison to REMIX and NEWMIX predictions are documented inReference U-457. The data and quick-look reports for the UPTF test are provided inReferences G-O01 and G-201, respectively. References E-441 and E-921 throughE-926 discuss the results of some of the subscale tests as well as comparisons tocode predictions.
Summary of Key Results and Conclusions from Tests and Analyses
The flow regime associated with mixing in the cold leg and downcomer werecharacterized based on the subscale tests. The phenomena are shown inFigure 4.5-1. The following description is taken from Reference U-457.
"...A 'cold stream' originates with the HPI plume at the point of injection, continuestoward both ends of the cold leg, and decays away as the resulting plumes fallinto the downcomer and pump/loop-seal regions. A 'hot stream' flows counterto this 'cold stream' as indicated, supplying the flow necessary for mixing(entrainment) at each location. This mixing is most intensive in certain locationsidentified as mixing regions (MRs). MR1 indicates the mixing associated with thehighly buoyant, nearly axisymmetric HPI plume. MR3 and MR5 are regions wheremixing occurs because of the transitions (jumps) from horizontal layers into fallingplumes. MR4 is the region of final decay of the downcomer (planar) plume. Thecold streams have special significance since they induce a global recirculating flowpattern with flow rates significantly higher than the net flow through-put (Q HP) ....."
The UPTF test results were consistent with the subscale results described above.Figure 4.5-2 shows the fluid and wall temperatures measured in the cold leg for twophases of Test 1. These measurements show that flow in the cold leg was thermallystratified between the injection nozzle and the downcomer. Specifically, a cold streamflowed along the bottom of the cold leg from the injection nozzle to the downcomerand a hot stream flowed along the top of the cold leg countercurrent to the cold
4.5-2

stream. The cooldown of fluid in the cold leg between the injection nozzle and thepump simulator followed a 'Well mixed" transient; i.e., the vertical fluid temperaturedistribution was relatively uniform.
Figure 4.5-2 also shows the temperature difference between the hot and cold streamsincreased with increasing ECC injection. Due to mixing in the cold leg, the coldstream entering the downcomer was significantly warmer than the ECC injection forall ECC flows tested.
The cold stream from the cold leg penetrated down the downcomer as a plume.Temperature measurements in the downcomer indicate that, due to mixing in the coldlegs and at the cold leg/downcomer interface, the temperature of the plume wassignificantly higher than the temperature of the ECC injection. Also, the plumedecayed within approximately four to five cold leg diameters (see Figure 4.5-3).
A post-test REMIX calculation was performed to investigate the code's ability to predictsystem behavior and decay of the downcomer plume at full-scale. The calculation ofentrainment and stratification in the cold leg was artificially altered to account for themodified ECC injection nozzle used in the UPTF test. The predicted fluid temperaturesat various locations in the downcomer were in close agreement with the measuredtemperatures; hence, REMIX can accurately predict downcomer plume decay at full-scale (Reference U-457).
Post-test calculations have also been performed for many subscale tests. Thesecalculations include REMIX calculations for tests with ECC injection into the top of thecold leg and NEWMIX calculations for tests with high Froude number injection on theside of the inclined portion of the cold leg. Both the REMIX and NEWMIX accuratelypredicted the mixing phenomena (Reference U-457).
REMIX calculations for PWRs with low Froude number top injection (i.e., CombustionEngineering PWRs and Westinghouse PWRs) indicate that a recirculation flow involvingthe lower plenum, downcomer, cold leg, and pump seal is established even thoughthe degree of stratification is small. Due to the small degree of stratification, thedowncomer plume is weak and decays rapidly (i.e., within about five cold legdiameters-Reference E-922). Similarly, NEWMIX calculations for PWRs with highFroude number side injection (i.e., Babcock & Wilcox PWRs), predict a small degreeof thermal stratification in the cold leg and a weak downcomer plume which decaysrapidly (Reference E-923).
4.5-3
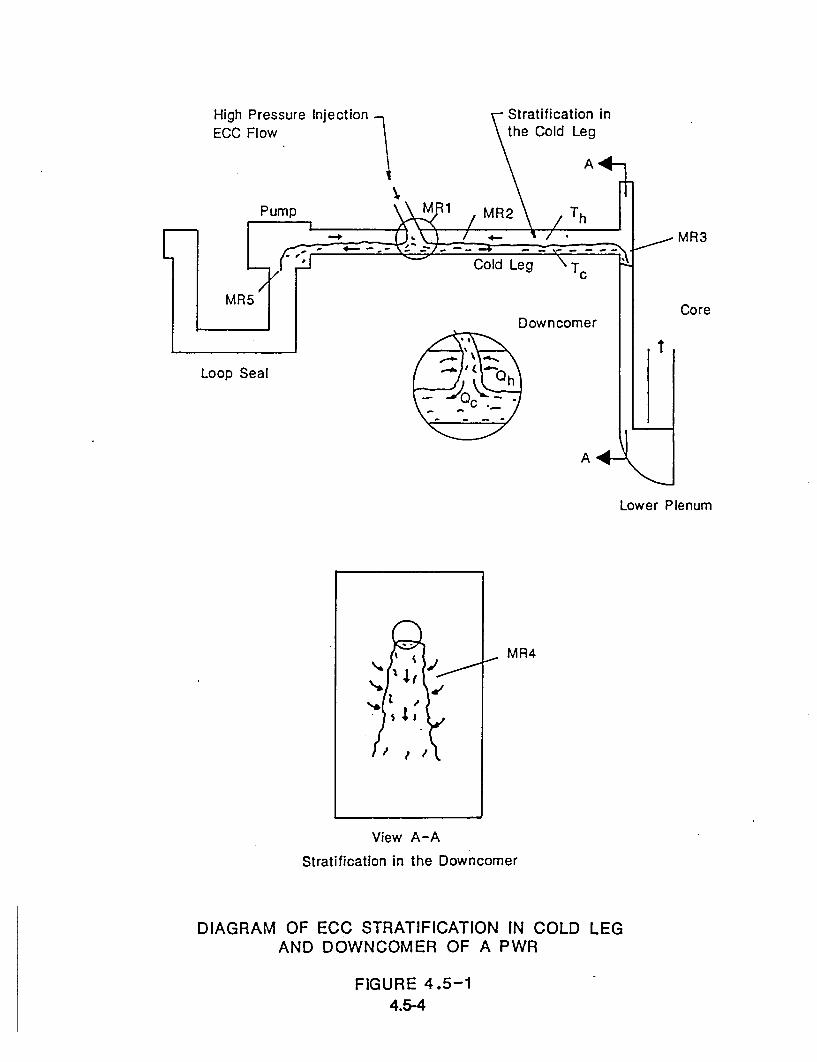
High Pressure InjectionECC Flow
Pump
Stratification inthe Cold Leg
MR3L__Xj' "_J • Cold Leg "Tc H
MR5 Core. / ~Downcomer I
Loop Seal
A
Lower Plenum
MR4
View A-A
Stratification in the Downcomer
DIAGRAM OF ECC STRATIFICATION IN COLD LEGAND DOWNCOMER OF A PWR
FIGURE 4.5-14.5-4
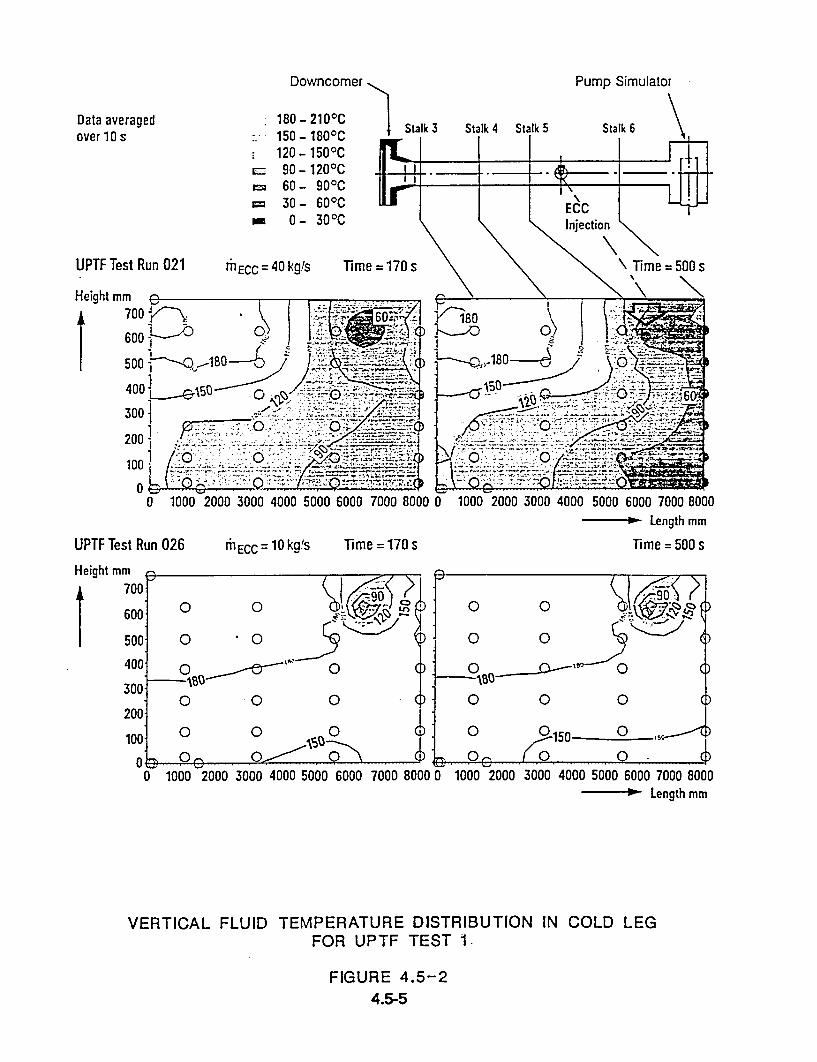
Downcomer PpmaPump Simulator
Data averagedover 10 s
UPTF Test Run 021
180 - 210 0C150- 1800C120- 1500C
990- 120'C60- 90'C
__ 30- 600C== 0- 300C
rECC =40 kgfs T
1
ime =170s
700 O I 60;w
Cý))500 1 00 800 4
400 -5
300 -
200 0
0 1000 2000 3000 4000 5000 6000 7000 8000 0
00
1000 2000 3000 4000 5000 6000 7000 8000No Length mm
UPTF Test Run 026 rT ECC = 10 kg's Time = 170 s Time = 500 s
Height mm
6i
5I
00
0
30
20
10
0 0 L
0 0 -0
0 0 0'•
0 .0 010
0 0 0 Asi0
0 1000 2000 3000 4000 5000 6000 7000 80000 1000 2000 3000 4000 5000 6000L-
VERTICAL FLUID TEMPERATURE DISTRIBUTION IN COLD LEG
FOR UPTF TEST 1
FIGURE 4.5-2
7000 8000ength mm
4.5-5
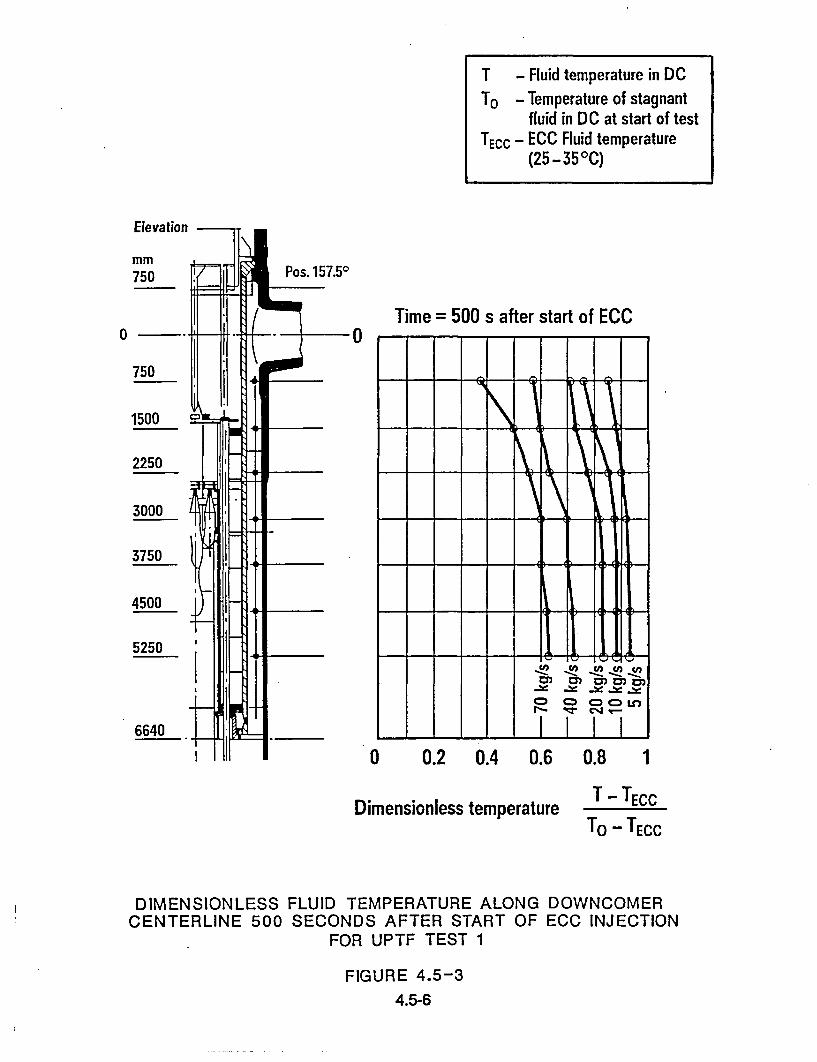
T - Fluid temperature in DC
To - Temperature of stagnantfluid in DC at start of test
TECC - ECC Fluid temperature(25 -35°C)
Elevation
0 0Time = 500 s after start of ECC
CD CD 6
P- U,
- - i
0 0.2 0.4 0.6 0.8 1
Dimensionless temperatureT- TECC
To - TECC
DIMENSIONLESS FLUID TEMPERATURE ALONG DOWNCOMERCENTERLINE 500 SECONDS AFTER START OF ECC INJECTION
FOR UPTF TEST 1
FIGURE 4.5-34.5-6

4.6 CORE THERMAL-HYDRAULIC BEHAVIOR
Definition of Issue and Description of Phenomena
During the reflood phase of a LOCA, water enters the core and can be vaporized,accumulated in the core, or transported out of the core. Water transport out of thecore can occur with the steam upflow out the top of the core or by downflow ofexcess water out the bottom of the core (for combined injection or UPI).
Water accumulation and vaporization and the resulting two-phase flow providecooling to remove stored energy and decay heat from the fuel rods. During thepost-blowdown LOCA transient, the progression of cladding temperatures and heattransfer mechanisms is typically as follows:
During the refill phase, cladding temperatures increase almost adiabatically,except for regions with water downflow due to top injection ECC (combinedinjection or UPI). Water downflow provides core cooling and can quench fuelrods in local regions.
After core reflood begins when the lower plenum water level reaches thebottom of the core, global core cooling initiates. A variety of heat transfermechanisms exist simultaneously in different parts of the core includingsteam/droplet convective cooling, film boiling, transition boiling, nucleateboiling, and convection to subcooled water. As this phase progresses, typicalcladding temperatures rise slowly, turn around and then decrease. Regionsquenched by water downflow during the refill phase continue to be cooledeffectively.
Quenching occurs when nucleate boiling initiates at a particular location and ischaracterized by the cladding temperature rapidly decreasing to near thesaturation temperature. Quenching occurs first where the liquid fraction is highand the heat flux is low.
Core thermal-hydraulic behavior is influenced by the axial and radial distributions ofstored energy and decay power within the core. These distributions can result inmultidimensional flow, void, and temperature effects.
In a PWR with cold leg or downcomer ECC injection, flooding of the reactor core isinitiated from the bottom. After core reflooding is initiated, a variety of heat transfermodes exist simultaneously. At a particular axial location, the progression is fromsteam/droplet convective cooling, through film and transition boiling to nucleateboiling as the local liquid fraction of the steam-water mixture increases. Thesemodes are illustrated on Figure 4.6-1. Quench front propagation is predominantly
4.6-1
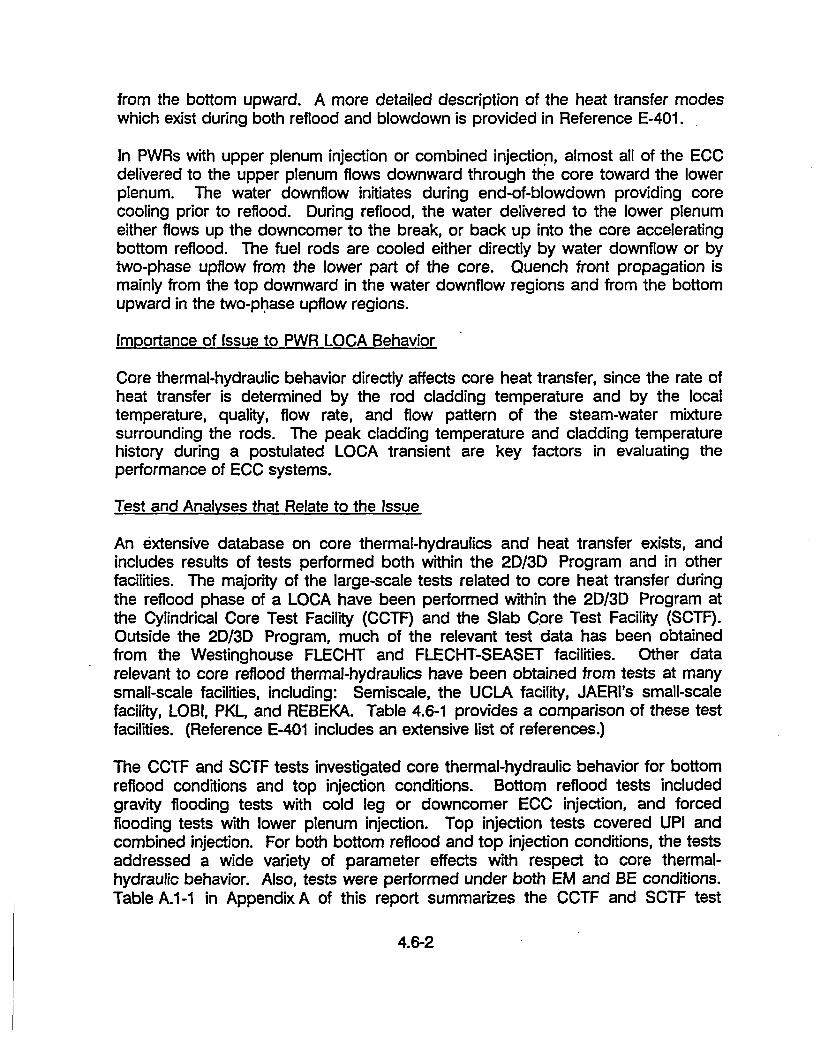
from the bottom upward. A more detailed description of the heat transfer modeswhich exist during both reflood and blowdown is provided in Reference E-401.
In PWRs with upper plenum injection or combined injection, almost all of the ECCdelivered to the upper plenum flows downward through the core toward the lowerplenum. The water downflow initiates during end-of-blowdown providing corecooling prior to reflood. During reflood, the water delivered to the lower plenumeither flows up the downcomer to the break, or back up into the core acceleratingbottom reflood. The fuel rods are cooled either directly by water downflow or bytwo-phase upflow from the lower part of the core. Quench front propagation ismainly from the top downward in the water downflow regions and from the bottomupward in the two-phase upflow regions.
Importance of Issue to PWR LOCA Behavior
Core thermal-hydraulic behavior directly affects core heat transfer, since the rate ofheat transfer is determined by the rod cladding temperature and by the localtemperature, quality, flow rate, and flow pattern of the steam-water mixturesurrounding the rods. The peak cladding temperature and cladding temperaturehistory during a postulated LOCA transient are key factors in evaluating theperformance of ECC systems.
Test and Analyses that Relate to the Issue
An extensive database on core thermal-hydraulics and heat transfer exists, andincludes results of tests performed both within the 2D/3D Program and in otherfacilities. The majority of the large-scale tests related to core heat transfer duringthe reflood phase of a LOCA have been performed within the 2D1/3D Program atthe Cylindrical Core Test Facility (CCTF) and the Slab Core Test Facility (SCTF).Outside the 2D/3D Program, much of the relevant test data has been obtainedfrom the Westinghouse FLECHT and FLECHT-SEASET facilities. Other datarelevant to core reflood thermal-hydraulics have been obtained from tests at manysmall-scale facilities, including: Semiscale, the UCLA facility, JAERI's small-scalefacility, LOBI, PKL, and REBEKA. Table 4.6-1 provides a comparison of these testfacilities. (Reference E-401 includes an extensive list of references.)
The CCTF and SCTF tests investigated core thermal-hydraulic behavior for bottomreflood conditions and top injection conditions. Bottom reflood tests includedgravity flooding tests with cold leg or downcomer ECC injection, and forcedflooding tests with lower plenum injection. Top injection tests covered UPI andcombined injection. For both bottom reflood and top injection conditions, the testsaddressed a wide variety of parameter effects with respect to core thermal-hydraulic behavior. Also, tests were performed under both EM and BE conditions.Table A.1 -1 in Appendix A of this report summarizes the CCTF and SCTF test
4.6-2

matrices according to ECCS configurations and phenomena investigated. TheJAERI data, quick look and evaluation reports for the CCTF and SCTF tests arelisted in the bibliography (Section 5) by test series.
A typical test sequence for simulating reflood conditions involved first preheatingthe core and then injecting ECC into appropriate locations (one or a combination ofcold legs, hot legs, upper plenum, downcomer, or lower plenum). Throughout thetest, the core power was controlled to simulate decay heat. Parameters whichwere varied in these tests included the ECC injection rate, ECC subcooling, systempressure, core power magnitude and distribution (axial and radial), and core initialtemperature level and distribution. System configuration parameters which havebeen varied include the pump simulator resistance, and the use of vent valves.
Predictive models for core thermal-hydraulics have been incorporated in manycomputer codes including: TRAC, RELAP, COBRA/TRAC, ATHLET, and REFLA.TRAC calculations have been completed for many of the CCTF and SCTF tests.Detailed discussions of these TRAC analyses and comparisons of measured andpredicted results are contained in References U-601, U-621, U-622, U-641, U-661and U-681. ATHLET calculations of a CCTF and an SCTF test are documented inReferences G-611 and G-622, respectively. Calculations of CCTF and SCTF testsusing REFLA are documented in References J-984 and J-995.
Summary of Key Results and Conclusions from Tests and Analyses
CCTF and SCTF are the largest scale, heated-core test facilities which have beenused to provide thermal-hydraulic and heat transfer data for reflood conditions.These facilities closely simulated the major PWR core and ECC parameters whichinfluence the core heat transfer process; such as, core height and geometry, corepower and temperature, ECC injection rate, and ECC subcooling. Accordingly, theresults are judged to be closely representative of the behavior which would result ina PWR core under reflood conditions. It should be noted that the heated rodsused in CCTF and SCTF have different thermal characteristics than nuclear fuelrods in terms of heat capacity, gap conductance, thermal conductivity, andcladding material. For example, the heated rods in CCTF and SCTF had heatcapacities 30 to 40% higher than that of nuclear fuel rods. Hence, the temperaturerise in PWR fuel rods would be expected to be slightly higher than observed inCCTF and SCTF tests. Results of the CCTF and SCTF bottom flooding tests arediscussed and evaluated in detail in References U-401, U-414, U-421, U-431, andU-441. Reference U-412 summarizes the evaluation of the CCTF Core-Il UPI tests.For combined ECC injection, the CCTF and SCTF results are evaluated inReferences G-401, J-455, J-553, J-555, and J-557.
4.6-3
The results of the tests and analyses and major conclusions related to corethermal-hydraulic behavior are summarized by ECCS type in the followingsubsections. Specifically, Section 4.6.1 covers cold leg injection/downcomerinjection with and without vent valves, Section 4.6.2 covers upper plenum injection,and Section 4.6.3 covers combined injection.
4.6-4

4.6.1 Cold LeQ Iniection/Downcomer Iniection with and without Vent Valves
One of the major findings of the CCTF and SCTF tests was that liquid whichaccumulated in the core was distributed quickly throughout the core. Figure 4.6-2shows the measured void fraction in six axial regions of the core for a typical CCTFtest. The figure indicates that some liquid was present at high elevations in thecore very soon after the beginning of reflood, and that the liquid inventory at thesehigh elevations slowly increased over time. The rapid distribution of liquid wasmeasured in both high flooding cases and low flooding cases.
Rapid distribution of liquid throughout the core was also observed in small-scalevisual tests conducted by JAERI (References J-928 and J-975). In the visual tests,the flow regime in the portion of the core above the quench front appeared to bedominated by the 'flow transition regime," as defined in Figure 4.6-1(Reference E-462). It is reasonable to assume that in the CCTF and SCTF tests,flow in portions of the core above the quench front was also dominated by the flowtransition regime.
Heat transfer began to increase shortly after reflood since film boiling occurred atall elevations. Typical CCTF tests showed that the heat transfer coefficient atmiddle elevations in the core increased from about 10 W/m 2 K to over 50 W/m 2 Konly five seconds after the beginning of reflood. Heat transfer coefficients reachedabout 200 W/m 2 K just above the quench front. The heat transfer coefficients areexpected to be typical of PWR behavior because of the realistic fuel geometrysimulation in CCTF and SCTF. The temperature rise during reflood in CCTF andSCTF tests was typically limited to about 100 K or less. (Note, the temperature risefor nuclear fuel rods is expected to be slightly higher than observed in thetests-see discussion on p. 4.6-3.)
Another important finding was that, for a given core power and initial core energy,the rate of the quench front propagation was determined by the core liquid head,the amount of cooling above the quench front by the two-phase upflow, and axialheat conduction in the fuel rods. Phenomena which reduced the core liquid head(e.g., increased steam binding) retarded the quench front propagation.Figure 4.6-3 shows the propagation of the bottom quench front for a typical CCTFtest. Also shown on the figure is the core collapsed liquid level. Note that theflooding rate was less than 0.025 m/s which was typical of most tests during theLPCI phase. Also note that although an initial offset developed between the lowpower and high power bundles, the quench front speed was nearly identical in allregions. This suggests preferential cooling of the high powered region, a resultconfirmed by SCTF tests.
Comparison of the FLECHT-SEASET tests and the CCTF and SCTF tests showedsimilar overall behavior, including similar core liquid inventories. Multidimensional
4.6-5
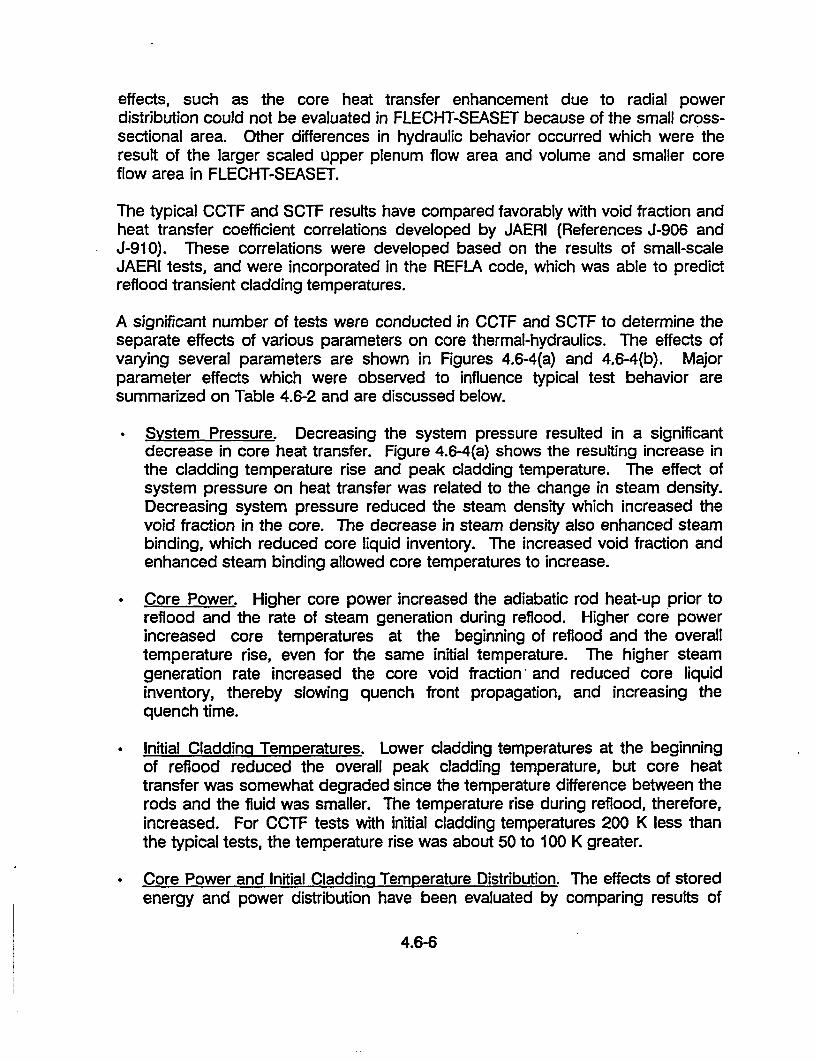
effects, such as the core heat transfer enhancement due to radial powerdistribution could not be evaluated in FLECHT-SEASET because of the small cross-sectional area. Other differences in hydraulic behavior occurred which were theresult of the larger scaled upper plenum flow area and volume and smaller coreflow area in FLECHT-SEASET.
The typical CCTF and SCTF results have compared favorably with void fraction andheat transfer coefficient correlations developed by JAERI (References J-906 andJ-910). These correlations were developed based on the results of small-scaleJAERI tests, and were incorporated in the REFLA code, which was able to predictreflood transient cladding temperatures.
A significant number of tests were conducted in CCTF and SCTF to determine theseparate effects of various parameters on core thermal-hydraulics. The effects ofvarying several parameters are shown in Figures 4.6-4(a) and 4.6-4(b). Majorparameter effects which were observed to influence typical test behavior aresummarized on Table 4.6-2 and are discussed below.
System Pressure. Decreasing the system pressure resulted in a significantdecrease in core heat transfer. Figure 4.6-4(a) shows the resulting increase inthe cladding temperature rise and peak cladding temperature. The effect ofsystem pressure on heat transfer was related to the change in steam density.Decreasing system pressure reduced the steam density which increased thevoid fraction in the core. The decrease in steam density also enhanced steambinding, which reduced core liquid inventory. The increased void fraction andenhanced steam binding allowed core temperatures to increase.
Core Power. Higher core power increased the adiabatic rod heat-up prior toreflood and the rate of steam generation during reflood. Higher core powerincreased core temperatures at the beginning of reflood and the overalltemperature rise, even for the same initial temperature. The higher steamgeneration rate increased the core void fraction* and reduced core liquidinventory, thereby slowing quench front propagation, and increasing thequench time.
" Initial Claddinq Temperatures. Lower cladding temperatures at the beginningof reflood reduced the overall peak cladding temperature, but core heattransfer was somewhat degraded since the temperature difference between therods and the fluid was smaller. The temperature rise during reflood, therefore,increased. For CCTF tests with initial cladding temperatures 200 K less thanthe typical tests, the temperature rise was about 50 to 100 K greater.
" Core Power and Initial Cladding Temperature Distribution. The effects of storedenergy and power distribution have been evaluated by comparing results of
4.6-6
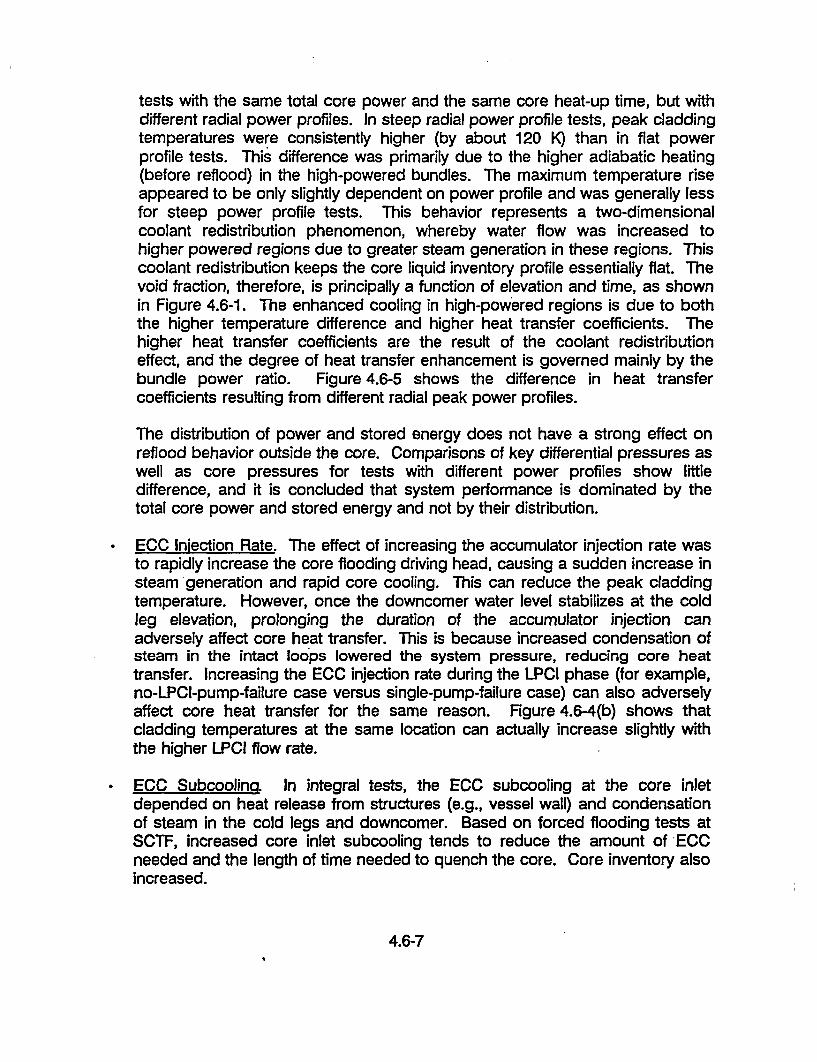
tests with the same total core power and the same core heat-up time, but withdifferent radial power profiles. In steep radial power profile tests, peak claddingtemperatures were consistently higher (by about 120 K) than in flat powerprofile tests. This difference was primarily due to the higher adiabatic heating(before reflood) in the high-powered bundles. The maximum temperature riseappeared to be only slightly dependent on power profile and was generally lessfor steep power profile tests. This behavior represents a two-dimensionalcoolant redistribution phenomenon, whereby water flow was increased tohigher powered regions due to greater steam generation in these regions. Thiscoolant redistribution keeps the core liquid inventory profile essentially flat. Thevoid fraction, therefore, is principally a function of elevation and time, as shownin Figure 4.6-1. The enhanced cooling in high-powered regions is due to boththe higher temperature difference and higher heat transfer coefficients. Thehigher heat transfer coefficients are the result of the coolant redistributioneffect, and the degree of heat transfer enhancement is governed mainly by thebundle power ratio. Figure 4.6-5 shows the difference in heat transfercoefficients resulting from different radial peak power profiles.
The distribution of power and stored energy does not have a strong effect onreflood behavior outside the core. Comparisons of key differential pressures aswell as core pressures for tests with different power profiles show littledifference, and it is concluded that system performance is dominated by thetotal core power and stored energy and not by their distribution.
ECC Injection Rate. The effect of increasing the accumulator injection rate wasto rapidly increase the core flooding driving head, causing a sudden increase insteam generation and rapid core cooling. This can reduce the peak claddingtemperature. However, once the downcomer water level stabilizes at the coldleg elevation, prolonging the duration of the accumulator injection canadversely affect core heat transfer. This is because increased condensation ofsteam in the intact loops lowered the system pressure, reducing core heattransfer. Increasing the ECC injection rate during the LPCI phase (for example,no-LPCI-pump-failure case versus single-pump-failure case) can also adverselyaffect core heat transfer for the same reason. Figure 4.6-4(b) shows thatcladding temperatures at the same location can actually increase slightly withthe higher LPCI flow rate.
ECC Subcoolin.. In integral tests, the ECC subcooling at the core inletdepended on heat release from structures (e.g., vessel wall) and condensationof steam in the cold legs and downcomer. Based on forced flooding tests atSCTF, increased core inlet subcooling tends to reduce the amount of ECCneeded and the length of time needed to quench the core. Core inventory alsoincreased.
4.6-7

Loop Flow Resistance. As shown of Figure 4.6-4(a), the net effect ofincreasing the loop resistance was to slightly increase the peak claddingtemperature and to prolong the core quench time. The higher loop resistanceincreases the loop pressure drop and reduces the core flooding rate.
Evaluation Model versus Best-Estimate Conditions. Tests conducted in CCTFand SCTF with "best-estimate" conditions had significantly lower core powerand initial cladding temperatures, and higher containment pressure and LPCIflow rates, relative to the typical (evaluation model type) tests. Because of thehigher system pressure and lower core power, core cooling was improved andthe temperature rise and quench time were reduced. In the CCTF BE test,system-wide hydraulic oscillations occurred due to intermittent water carryoverto the steam generators. A brief core re-dryout with a small heat-up prior to re-quench occurred during these oscillations. (See Reference U-413 for a detaileddiscussion of the oscillations.)
Core Blockage. Results of SCTF-l tests showed that the effect of 60% coplanarcore blockage on core heat transfer was negligible. A small effect on peakcladding temperatures was observed, and only a slight effect on quench timeswas noted (see Figure 4.6-4(b)).
Comparisons of tests with cold leg and downcomer injection revealed that theoverall differences in core thermal-hydraulics were relatively minor (seeFigure 4.6-4(b)). For downcomer injection, reduced interaction of steam and ECCoccurred; consequently, less steam was condensed and ECC subcoolingremained higher in the downcomer. The effects of vent valves were also relativelyminor. In tests with open vent valves, steam binding was reduced, allowingincreased core flooding rates, and better core cooling. The peak claddingtemperature reduction was about 20 K (3601) in CCTF tests. (Reference U-414).
Calculations of CCTF and SCTF tests using the TRAC-PF1/MOD1 code showedoverall reasonable agreement with the test results. TRAC-PF1/MOD1 used ageneralized boiling curve for heat transfer. The predicted heat transfer in the coreis closely tied to the prediction of liquid distribution in the core. In TRAC-PF1/MOD1 calculations, entrainment of liquid in the core was generallyunderpredicted, resulting in deficiencies in predicting the axial void fractiondistribution. Specifically, the liquid inventory in the core above the quench frontwas underpredicted (see Figure 4.6-6). This typically resulted in an overpredictionof core temperatures in the upper half of the core; however, as shown in Figure4.6-7, overall peak cladding temperatures were generally in reasonable agreementwith the test data. A detailed statistical evaluation comparing predicted andmeasured temperatures was carried out for eight SCTF-lll tests (see Figure 4.6-8).Turnaround temperature comparisons were made for three elevations (quarter-height, mid-height, and three-quarter height) in four bundles yielding 12
4.6-8

comparisons per test. The mean bias was -19.4 K and the standard deviation was59.8 K, which reflects the generally favorable comparison. Rod quench times andturnaround times were predicted with reasonable agreement as well.
Post-test analyses of three CCTF and SCTF tests have also been performed usingTRAC-PF1/MOD2. MOD2 has a new reflood model which is based on post-criticalheat flux flow regime descriptions developed by DeJarlais and Ishii(Reference E-455). These flow regimes are shown in Figure 4.6-1. The modelsand correlations developed for MOD2 mechanistically address the key phenomenain each flow regime. The PCT prediction accuracy of MOD2 is similar to MODi.The deficiency in core liquid distribution discussed earlier for MODM was alsoobserved for MOD2. Figure 4.6-9 shows the measured and calculated collapsedliquid levels in the core upper half for a CCTF test. The measured valueconsiderably exceeds the predicted value.
The CCTF and SCTF results confirmed that assumptions used in PWR safetysystems evaluations are generally conservative. The single-LPCI-pump-failureassumption was found to have an adverse but minor effect on core cooling. Withregard to core heat transfer, the 2D/3D results showed that, for a core floodingvelocity of 2 cm/s, core cooling was not degraded.
4.6-9
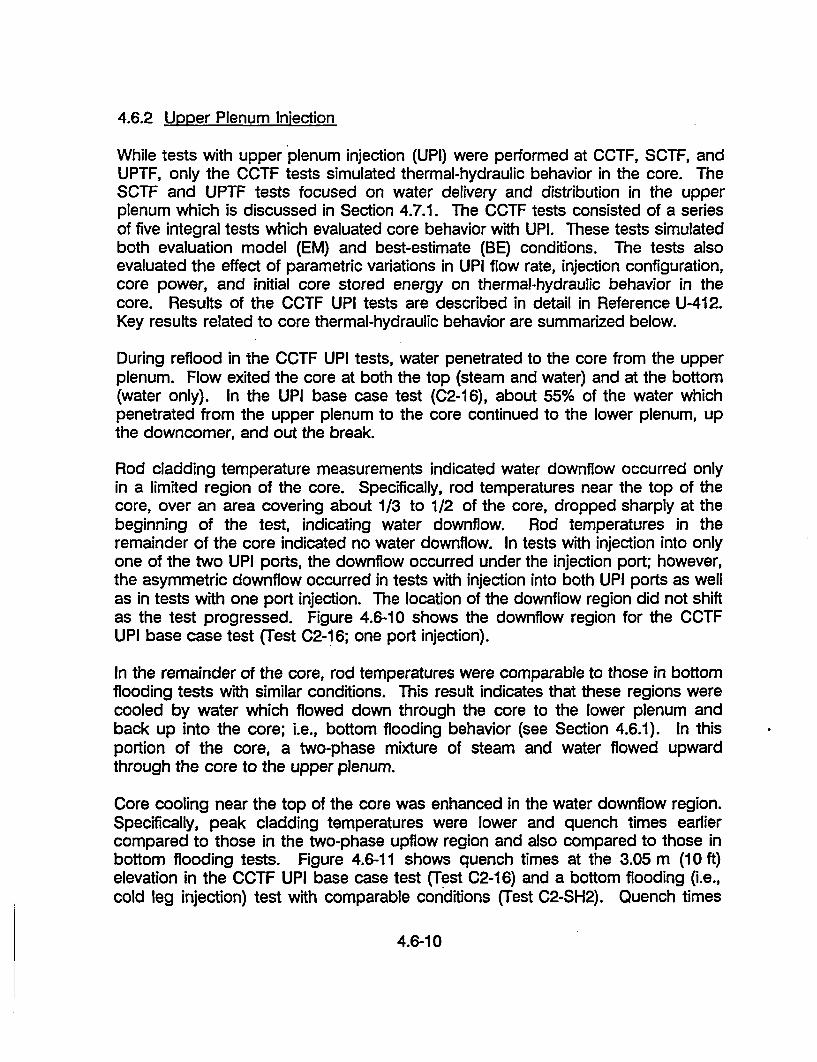
4.6.2 Upper Plenum Iniection
While tests with upper plenum injection (UPI) were performed at CCTF, SCTF, andUPTF, only the CCTF tests simulated thermal-hydraulic behavior in the core. TheSCTF and UPTF tests focused on water delivery and distribution in the upperplenum which is discussed in Section 4.7.1. The CCTF tests consisted of a seriesof five integral tests which evaluated core behavior with UPI. These tests simulatedboth evaluation model (EM) and best-estimate (BE) conditions. The tests alsoevaluated the effect of parametric variations in UPI flow rate, injection configuration,core power, and initial core stored energy on thermal-hydraulic behavior in thecore. Results of the CCTF UPI tests are described in detail in Reference U-412.Key results related to core thermal-hydraulic behavior are summarized below.
During reflood in the CCTF UPI tests, water penetrated to the core from the upperplenum. Flow exited the core at both the top (steam and water) and at the bottom(water only). In the UPI base case test (C2-16), about 55% of the water whichpenetrated from the upper plenum to the core continued to the lower plenum, upthe downcomer, and out the break.
Rod cladding temperature measurements indicated water downflow occurred onlyin a limited region of the core. Specifically, rod temperatures near the top of thecore, over an area covering about 1/3 to 1/2 of the core, dropped sharply at thebeginning of the test, indicating water downflow. Rod temperatures in theremainder of the core indicated no water downflow. In tests with injection into onlyone of the two UPI ports, the downflow occurred under the injection port; however,the asymmetric downflow occurred in tests with injection into both UPI ports as wellas in tests with one port injection. The location of the downflow region did not shiftas the test progressed. Figure 4.6-10 shows the downflow region for the CCTFUPI base case test (Test C2-16; one port injection).
In the remainder of the core, rod temperatures were comparable to those in bottomflooding tests with similar conditions. This result indicates that these regions werecooled by water which flowed down through the core to the lower plenum andback up into the core; i.e., bottom flooding behavior (see Section 4.6.1). In thisportion of the core, a two-phase mixture of steam and water flowed upwardthrough the core to the upper plenum.
Core cooling near the top of the core was enhanced in the water downflow region.Specifically, peak cladding temperatures were lower and quench times earliercompared to those in the two-phase upflow region and also compared to those inbottom flooding tests. Figure 4.6-11 shows quench times at the 3.05 m (10 ft)elevation in the CCTF UPI base case test (Test C2-16) and a bottom flooding (i.e.,cold leg injection) test with comparable conditions (Test C2-SH2). Quench times
4.6-10

are significantly shorter in the UPI test between about the 90° and 2400azimuths--the water downflow region. At lower elevations, including the mid-coreelevation where peak cladding temperatures are highest, there appeared to be verylittle direct cooling from the water downflow. This indicates the effects of localwater downflow were evened out, perhaps by cross-flow or by vaporization of thewater, before the downflow reaches the mid-core elevation. Quench times in thetwo-phase upflow region were similar to those for the bottom flooding test.
The effects of various parameters on core thermal-hydraulics were investigated inthe CCTF UPI tests. The results of these tests are discussed below.
* UPI Distribution. For comparable injection rates, injecting ECC through bothUPI nozzles versus only one nozzle had little effect on core thermal-hydraulicbehavior.
UPI Flow. Increasing the UPI flow from the single-LPCI-pump-failure case tothe no LPCI-pump-failure case significantly reduced the cladding temperaturesand quench times throughout the core. This effect was more pronounced inthe water downflow region.
Evaluation Model versus Best-Estimate Conditions. The test conducted with"best-estimate" conditions had significantly lower core power and initial claddingtemperatures, and higher containment pressure relative to the evaluation model(or base case) test; however, both tests simulated the single-LPCI-pump-failurecase. Due to the lower core power and initial cladding temperatures, the peakcladding temperatures and quench times were significantly reduced.
LANL analyzed the CCTF UPI tests using the TRAC-PFI/MOD1 computer code.Reference U-622 summarizes the results. In general, the code predictedmultidimensional core reflood conditions, negative core inlet flow, location of theliquid downflow, and average values for fuel rod temperatures. However, the codeoverpredicted the amount of UPI downflow to the core while also not predicting thecore void distribution accurately. Overall, the TRAC predictions were in reasonableagreement with the test results.
It is expected that the same core phenomena observed in CCTF will occur in thefull-size PWR. Specifically:
The delivery of UPI water to the core region should occur in an asymmetricmanner. Core cooling in the water downflow region should be enhancedrelative to a cold leg injection plant.
* Heat transfer in the two-phase upflow region should be comparable to PWRswith bottom flooding as a result of the following flow mechanisms:
4.6-11

Accumulation of water in the lower plenum and lower core region andcooling as a result of bottom reflood.
Limited interaction between water downflow and two-phase upflow in theupper portion of the core.
4.6-12

4.6.3 Combined Iniection
During tests simulating the end-of-blowdown/refill phase with combined injection,ECC entered the upper plenum and flowed downward through the tie plate to thecore in distinct regions located adjacent to the loops with ECC injection. Corecooling was initiated in these downflow regions (top quenching) while theremainder of the core heated up. Evaluation of SCTF and CCTF data reveals that,during the EOB/refill phase, heat transfer coefficients were high (200 W/m 2 K) inthe water downflow regions and low (less than 50 W/m 2 K) in the remainder of thecore. Water flowing down through the core in conjunction with ECC injected in thecold legs quickly refilled the lower plenum.
During the reflood phase, bottom flooding of the entire core initiated, and local ECCpenetration through the core to the lower plenum continued. Outside the waterdownflow regions, water was carried by steam to the upper regions of the core.This two-phase upflow enhanced heat transfer throughout the core. Most of thesteam which vented out the top of the core was condensed in the upper plenumand hot legs by the hot leg ECC injection. The condensed steam, as well as watercarried over to the upper plenum, was returned to the core with the waterdownflow; i.e., a circulation flow path was established.
In SCTF Test S3-13 (Run 717), hot leg ECC injection was simulated by continuouswater injection into the upper plenum just above two of the eight fuel assemblies.Plots of cladding temperature shown in Figure 4.6-12 clearly indicate immediatequenching of the rods in the downflow region after the start of injection. A rapidcore reflood with flooding velocities of 15 to 25 cm/s was observed.
The void fraction and heat transfer coefficients for the two-phase upflow regionwere well predicted using correlations developed for bottom flooding behavior;however, the correlations had to be modified to account for the high flooding rate(References J-970 and J-972).
The effects of various parameters on core thermal-hydraulics were investigated inthe CCTF and SCTF tests. The results of these tests are discussed below.
Power Distribution. Core thermal-hydraulic behavior with a typical GPWR radialpower profile was similar to that with a uniform power profile. Specifically,water downflow occurred only in distinct regions adjacent to the injectionlocation while two-phase upfiow occurred over the remainder of the core. Witha non-uniform power profile, core cooling in the two-phase upflow region wasslightly enhanced in the high-powered bundles and slightly degraded in thelow-powered bundles. Overall, core behavior was not sensitive to the powerprofile.
4.6-13

ECC Iniection Rate. Increasing the ECC injection rate increased the waterdownflow and core flooding rates. Consequently, core cooling in both. thewater downflow.and two-phase upflow regions was enhanced. In a CCTF testwith a 100% increase in the initial ECC injection rate into the hot legs (i.e., 5/8vs. 7/8 injection) quench times were reduced by about 100 seconds.
ECC Configuration. In SCTF tests with intermittent ECC injection above the tieplate, water downflow through the core occurred intermittently; consequently,core cooling in the downflow region temporarily increased and decreased.However, since the time averaged injection was the same for intermittentinjection and continuous injection, overall core cooling was about the same asfor continuous injection (see Figure 4.6-13).
The SCTF tests also alternated ECC injection between different injectionnozzles. In this case, water downflow alternated between local regions belowthe nozzle locations. Core cooling in the water downflow regions increasedand decreased with the water downflow. Unlike intermittent injection, overallcore cooling for alternating injection was slightly degraded relative tocontinuous injection.
ECC Downflow Area. Distributing the ECC over a larger area of the coreincreased the water downflow region and hence the area of the core whichexperienced early quenching. However, distributing ECC over a wider regionof the upper plenum, increased condensation in the upper plenum therebyincreasing the temperature of the water downfiow. As discussed below,increasing the temperature of the water downflow decreased core cooling.
ECC Temperature. Increasing the ECC temperature decreased core cooling inthe two-phase upflow region because the energy removal capacity of the waterdownflow was lower. Also, since circulation between the core and upperplenum is governed by the density difference between the two-phase upflowand the water downflow, increasing the temperature of the downflow reducedthe flow circulation.
Tests at SCTF covered a wide range of ECC temperatures which boundedexpected PWR. In all cases, the core was adequately cooled.
Evaluation Model versus Best-Estimate Conditions. Tests conducted in CCTFand SCTF with "best-estimate" conditions had significantly lower core powerand initial cladding temperatures than the evaluation model tests. Also, all fourhot leg ECC injection systems were active rather than only two (7/8 injectionversus 5/8 injection). As discussed above, increasing ECC injection above thetie plate increases water downflow through the core and the core flooding rate.Due to the higher core flooding rate, and the lower core power and initial
4.6-14

cladding temperatures, core cooling in the two-phase upflow region wassignificantly improved. In SCTF tests quench times in the two-phase upflowregion were reduced by 42 seconds at the core midplane relative to theevaluation model tests (53 seconds versus 95 seconds after reflood initiation).For both the best-estimate and evaluation model cases, portions of the core inthe downflow regions were quenched early in the transient.
UPTF integral tests with combined ECC injection provided detailed information onthermal-hydraulic boundary conditions for the core thermal-hydraulic behavior.Significant findings from UPTF tests related to combined injection phenomena aresummarized below:
" ECC delivery to the core from the upper plenum was either continuous orintermittent.
" Water downflow regions were established in portions of the core adjacent tohot legs where ECC was injected.
Up to 70 K subcooling was observed in the water downflow region (below thetie plate).
Full-scale strongly favored water breakthrough at the tie plate, which enhancescore cooling relative to small-scale.
SCTF tests investigated the core thermal-hydraulic response to the system effectsobserved in UPTF tests described above.
Results of UPTF Test 18, a combined injection integral test, show similarphenomena to that calculated by TRAC-PFI/MOD1 large break LOCA analyses,with respect to multidimensional phenomena within the core region, downcomerbehavior and loop behavior (Reference G-909). In general, good agreementbetween analysis results and findings of UPTF and SCTF/CCTF tests was obtainedfor phenomena such as: (1) entrainment to the broken cold leg, (2) precooling andearly quenching of parts of the core during end-of-blowdown, (3) formation of waterdownflow and two-phase upflow regions in the core during reflood, and(4) intermittent delivery of the injected ECC water. Accordingly, the range ofcalculated cladding temperature histories depicted in Figure 4.6-14 is considered toenvelope PWR fuel rod temperatures under licensing conditions.
For GPWRs with combined cold and hot leg ECC injection, the following behaviorduring a cold leg LBLOCA is expected based on test results and analyses:
4.6-15
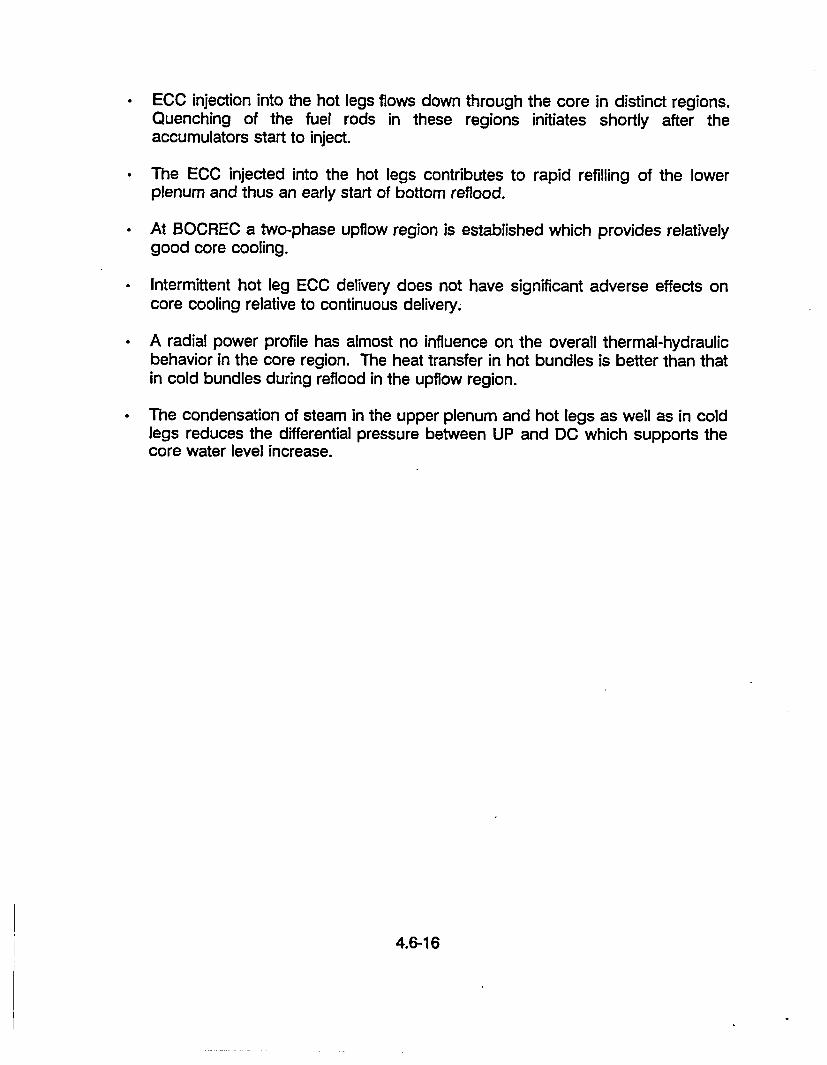
ECC injection into the hot legs flows down through the core in distinct regions.Quenching of the fuel rods in these regions initiates shortly after theaccumulators start to inject.
The ECC injected into the hot legs contributes to rapid refilling of the lowerplenum and thus an early start of bottom reflood.
At BOCREC a two-phase upflow region is established which provides relativelygood core cooling.
Intermittent hot leg ECC delivery does not have significant adverse effects oncore cooling relative to continuous delivery.
A radial power profile has almost no influence on the overall thermal-hydraulicbehavior in the core region. The heat transfer in hot bundles is better than thatin cold bundles during reflood in the upflow region.
The condensation of steam in the upper plenum and hot legs as well as in coldlegs reduces the differential pressure between UP and DC which supports thecore water level increase.
4.6-16

Table 4.6-1
SUMMARY OF TEST FACILITIES RELATED TOCORE THERMAL-HYDRAULIC BEHAVIOR
Page 1 of 2
CoreFacility Scale(2) Number of Heated Core Power Core Area Height References
Rods(3 ) (MW) (m2) (m)
SCTF 1/21 (3) 1876 (2048 Total) 9.4 0.22704) 3.66 J-521
CCTF 1/21(3) 1824 (2048 Total) 9.4 0.222 3.66 J-052
FLECHT 1/940-1/430(3' 5) 42-91 1.4 NA(6) 3.66 E-452(49-100 Total)
FLECHT-SEASET 1/370(3) 145 (161 Total) 1.8 0.013(4) 3.66 E-454
FLECHT-SEASET 1/480(3) 145 (163 Total) 1.2 0.01 3.66 E-454
FLECHT-SEASET 1/2400(3) 21 0.2 0.002 3.66 E-454
UCLA 1/95(3) 1692(7) 0(7) 0.05 0.45 E-453
JAERI 1/1200(3) 32 (36 Total) 0.2 0.004 3.66 J-587
Semiscale 1/1600(3) 23 (25 Total) 2.0 0.003 3.66 E-451
LOBI 1/700(8) 64 5.3 0.00013 3.9 E-456, E-460
PKL 1/145(8) 314(340 Total) 2.5 0.07 3.9 E-458
REBEKA 1/193(8) 25 0.1 0.0051 3.9 E-457, E-461

Table 4.6-1
SUMMARY OF TEST FACILITIES RELATED TOCORE THERMAL-HYDRAULIC BEHAVIOR
Page 2 of 2
NOTES:
1. Facility scale is based on core flow area.
2. Total number of rods includes heated and non-heated rods.
3. Reference PWR is a Westinghouse or Japanese 3400 MWt class PWR.
4. Area shown is that without any core blockage.
5. Facility scale is based on number of heated rods.
6. The core flow areas are not available in the referenced document.
7. Core rods in UCLA facility heated by external induction heaters before tests.
8. Reference PWR is a Siemens/KWU 3900 MWt PWR.
4.6-18

Table 4.6-2
SUMMARY OF PARAMETER EFFECTS ONCORE HEAT TRANSFER FOR BOTTOM FLOODING TESTS
I Effect on OverallPeak Clad Temperature
Effect on RefloodTemperature Rise
Pressure
Core Power
InitialTemperature
Power/initialTemperatureDistribution
AccumulatorInjection Rate
LPCIInjection Rate
ECC Subcooling
Flow Resistance
Evaluation Modelversus
Best-Estimate
Core Blockage
Decrease
Increase
Decrease
Increase (1)
Increase (2)
Increase
Increase
Increase
BestEstimate
Increase
Increase
Increase
Decrease
Increase
Decrease
Negligible
Slight Increase
Increase
SignificantDecrease
Negligible
Increase
Increase
Increase
Slight Decrease
Decrease
Negligible
Slight Increase
Increase
Decrease
Negligible
NOTES:
I.
2.
Increased radial power profile.
Increased ECC flow rate, not duration. Prolonging accumulator injectionafter the downcomer was filled to the cold leg elevation increased the peakclad temperature.
4.6-19

I
I Liquid
Liquid -
Quenchregion ý
Vapor
I Quenchragian
Vapor
convectionLow flooding rate High flooding rate
DOOE1B
OF
DryoutOnset of entrainmentBolling inceptionQuench front
HEAT TRANSFER AND HYDRAULIC FLOW REGIMESFOR BOTTOM REFLOOD
(REFERENCE E-459)
FIGURE 4.6-1
4.6-20

Legend:4760
1 3 (EL.6)
- .(EL.5)
X z; (EL.4)
+ ;O (EL.3)
2 1 0 EL.20o °I {EL.")
2100
- Botlom of upper core support plate- Top of healed core
- Bottom of healed coreTop of lower core support plate
0
C-,0I-
~0
0
0.9
0.6
0.3
0.00 100 200 300 400 500
Time ofler flood (s)
VOID FRACTION IN CORE
FIGURE 4.6-2
4.6-21
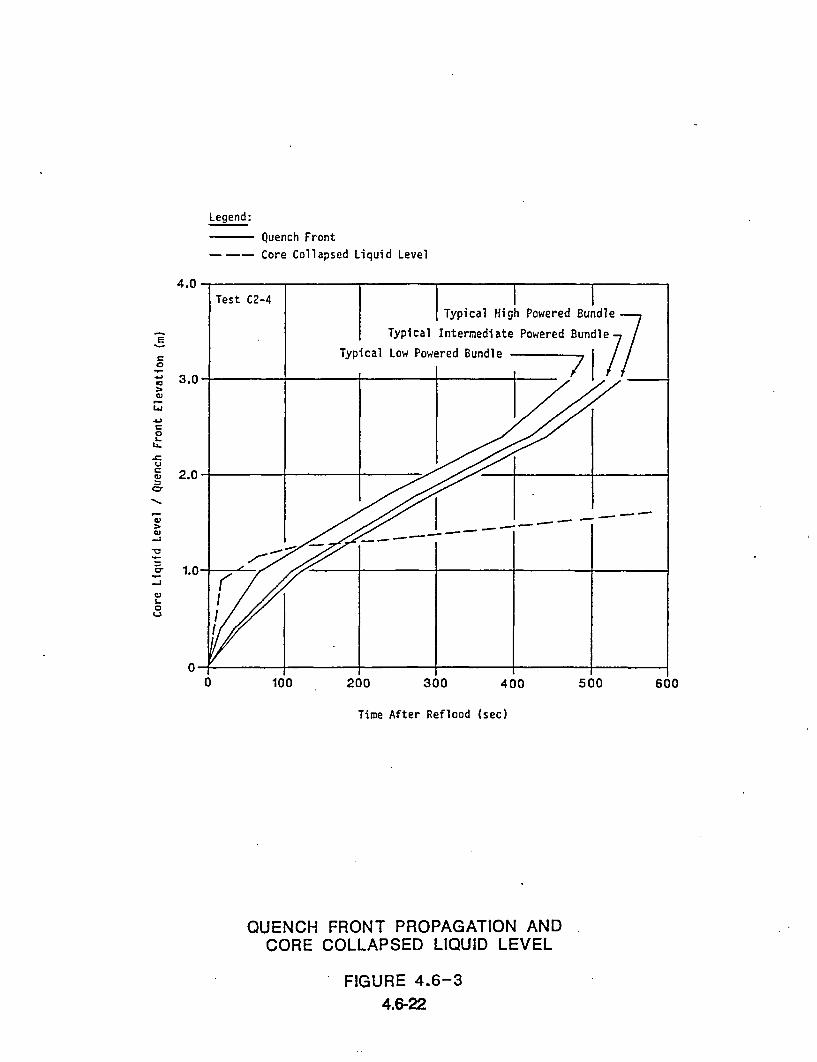
Legend:
Quench Front
Core Collapsed Liquid Level
4.0
S
CC
4-.
C
L~J
.4-.C0L.
L&.
UCC
0'
C
C-J
*0
0*
-I
C1..0
(-3
Time After Reflood (sec)
QUENCH FRONT PROPAGATION ANDCORE COLLAPSED LIQUID LEVEL
FIGURE 4.6-34.6-22
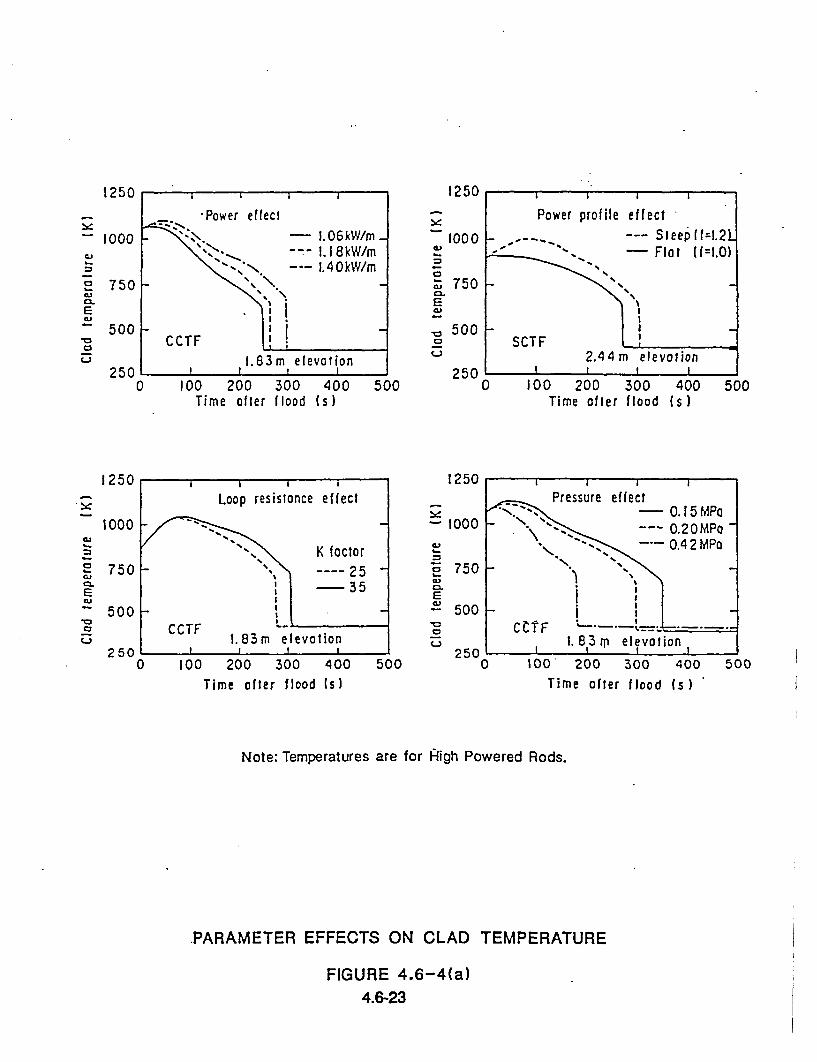
t250 1250
. Power effect Power profile effect-- I000 -.,.1.06kW/m_ -000 -- Sleepff=f42
1. 1 8kW/r Flat (f=1.0)
_, ,. -- 1.40kW/m-750 -5. 70
- 500 500CCTF SCTF
1.83m elevation CT2.44m elevation250 1 1 1 1 250 - I I I
0 100 200 300 400 500 0 100 200 300 400 500Time after flood (s) Time oafer flood (s)
1250 1250Loop resistance effect Pressure effect-- • :'•~,%;, •'.,, -- 0. 15 MPo
1000 .000 0.20MP-
750 K factor 0.2 MPo
500-50CCCTF =CC'TF -. ... .-- ý =
Cj 83m elevot 1.88m eleviontion250 ' 1 . i 250 * I I
0 100 200 300 400 500 0 100' 200 300 400 500Time after flood (s) Time oafer flood (s]
Note: Temperatures are for High Powered Rods.
PARAMETER EFFECTS ON CLAD TEMPERATURE
FIGURE 4.6-4(a)4.6-23

LPCI Flow Rate Effect1250
" 1000a,-
7500.E
5,0500
I urNo FailIure
Single •_Failure
CCTFHigh Power Rod1.83 in Elevation
I25010 100 200 300 400 500
Time After Flood (s)
-Downcomer Injection TestCold Leg Injection Test
a,1.
4'
L.
0.E
I-
'aC-,
Time After Flood (s)
Blockage Effect
S_
S_
E=
C-)
1300
1100
900
700
500 Except Rods Near:Non-Heated Rods
I I I I2nn
-100 0 100 200 300 400
Time After Reflood Initiation (s)
Test SI-09 - Forced Flooding, 4.5 cm/s; High LPCI Injection
Test Sl-22 - Gravity Flooding, 1.4 cm/s; Low LPCI Injection
PARAMETER EFFECTS ON CLAD TEMPERATURE
FIGURE 4.6-4(b)
4.6-24

4-
cn
0
ci
(3CU
CLL
0Iz
40
30
20
10I-
0 !
i I i i I I
Elevation= 1.905m Peak power ratio
1.361.2
0
/ Non-uniform power Flat power 7
x distribution test distribution test
(Peak power ratio)O S3-15 (1.36) S3-14
6 S s3-16 (1.36) S3-14A S2-18 (1.36) S2-149 S2-12 (1.2) S2-14* S2-SH1 (1.065) S2-SH2
I I I a I I
-10
-20
-30 -
-4010..7 0.8 0.9 1.0 1.1 1.2 1.3 1.4
Radial power ratio in SCTF
EFFECT OF PEAK POWER RATIOON HEAT TRANSFER COEFFICIENT IN SCTF
FIGURE 4.6-54.6-25
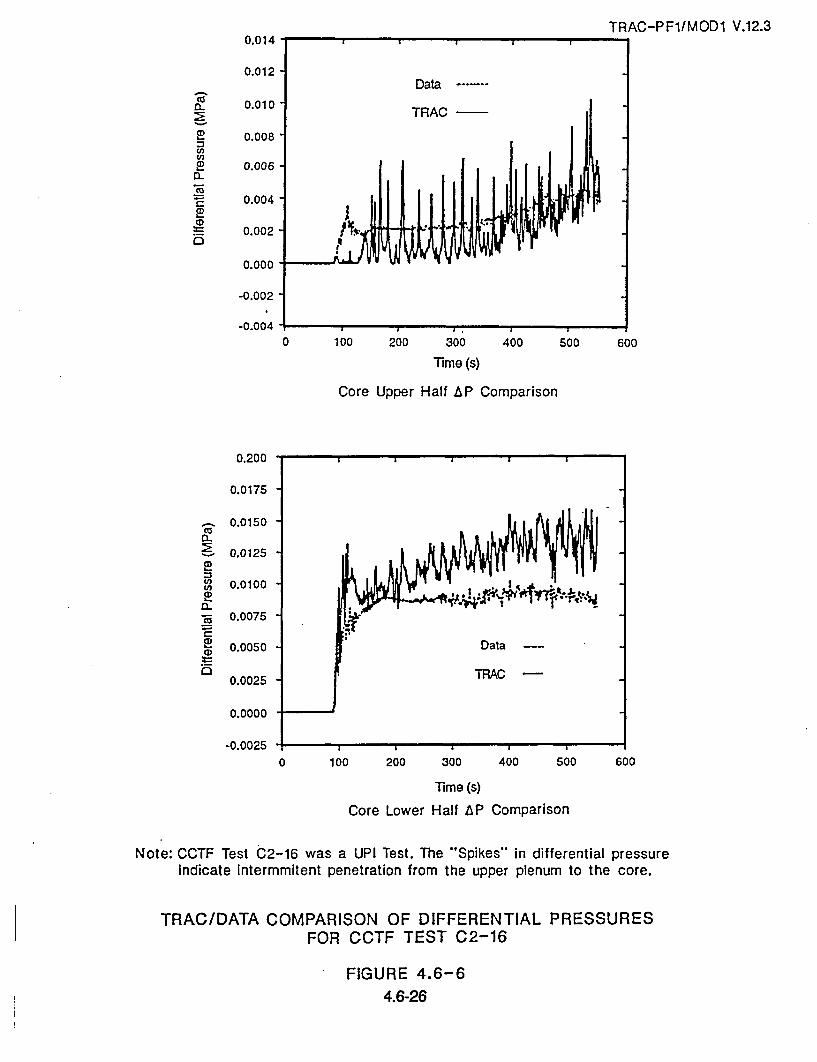
TRAC-PFI/MOD1 V.12.3
7E!D
CD,
0.014
0.012
0.010
0.008
0.006
0.004
0.002
0.000
-0.002
-0.0040 100 200 300 400 500 600
Time (s)
Core Upper Half AP Comparison
CU
V)Cl)A.D
,DCD
0.200
0.0175
0.0150
0.0125
0.0100
0.0075
0.0050
0.0025
0.0000
-0.0025
0 100 200 300 400 500
Time (s)
Core Lower Half AP Comparison
600
Note: CCTF Test C2-16 was a UPI Test. The "Spikes" in differential pressureindicate intermmitent penetration from the upper plenum to the core.
TRAC/DATA COMPARISON OF DIFFERENTIAL PRESSURESFOR CCTF TEST C2-16
FIGURE 4.6-64.6-26

TRAC-PFI/MOD1 V.11.0
2*
1! Comparison of High-PowerHeater-Rod TemperaturesCCTF Test C2-5
0 100 200 300 400 500 600 700 800
Mme (s)
TRAC-PF1/MOD1 V 11.8
gB
2,Comparison of High-PowerHeater-Rod TemperaturesCCTF Test C2-SH2
0 100 200 300 400 Soo 600
Toe (5)
TRAC-PFI/MOD1 V 14.3
g0
a20F-
Rod Temperature Comparisonsfor Bundles 1-4 forSCTF Test S2-AC1
0 100 200 300 , 400 500 600
,nme (S)
700
TRAC/DATA COMPARISON OF ROD TEMPERATURESFOR CCTF AND SCTF TESTS
FIGURE 4.6-74.6-27

Legend:
0
0
Test S3-SH1
Test S3-SH2Test S3-7Test S3-9Test S3-10Test S3-13Test S3-15Test S3-16
TRAC-PF1/MOD1V. 13.0, 13.1 and 14.3
4-JC:Q)E
xLU
1300
1200
1100
1000
900
800
700
600600 700 800 901) 1000 1100 1200 1300
TRAC Calculation (K)
Notes: 1. The tests shown in this figure include cold leg injectiontests and combined injection tests.
2. Turnaround temperature comparisons for each test are made at three heights ineach of four bundles.
TRAC/DATA COMPARISON OF TURNAROUND TEMPERATURESFOR SCTF CORE-Ill TESTS
FIGURE 4.6-84.6-28

TRAC-PF1/MOD2 V.5.3
: 6.0
5.0
• 4.0
3.0CD,
" 2.0
1.0
0.0
-1.00 100 200 300 400 500 600 700 800
Time (s)
Core Upper Half AP
C,)
CD)
0.014
0.012
0.010
0.008
0.006
0.004
0.002
0.000
-0.0020 100 200 300 400 500 600 700 . 800
Time (s)
Core Lower Half AP
TRAC/DATA COMPARISON OF CORE DIFFERENTIAL PRESSURESFOR CCTF TEST C2-4
FIGURE 4.6-94.6-29
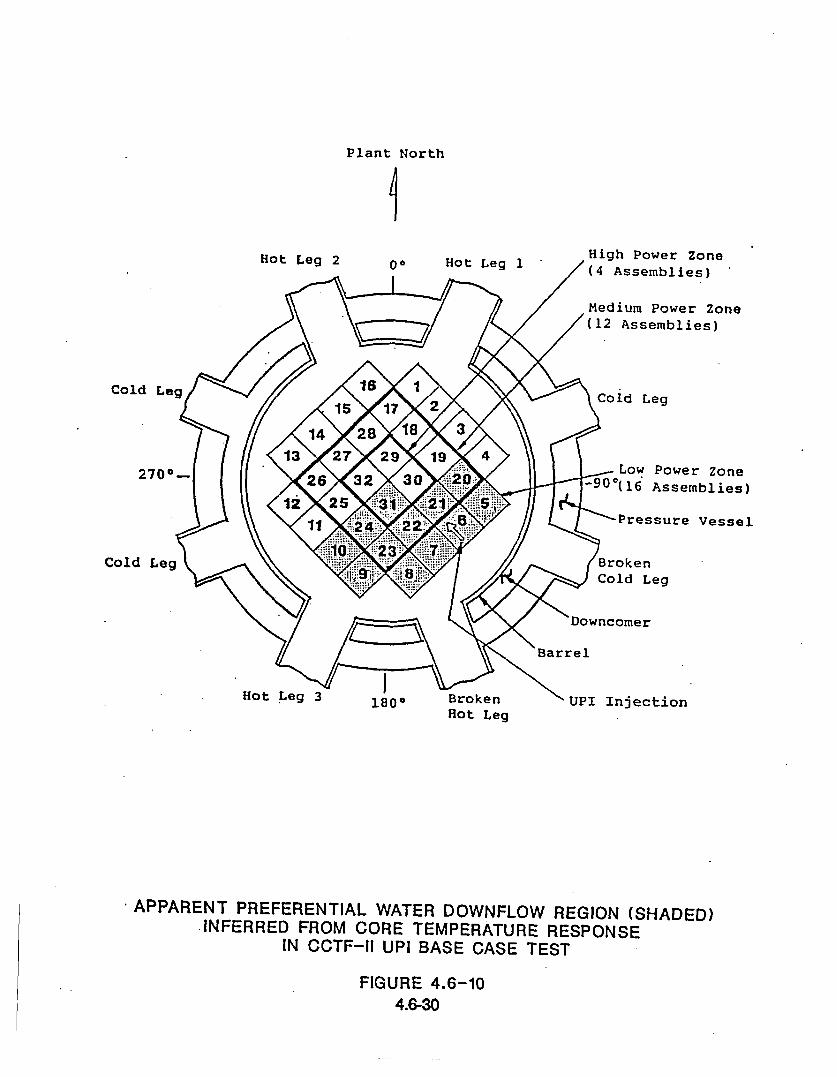
Plant North
'IHot Leg 2
High Power Zone(4 Assemblies)
Medium Power Zone(12 Assemblies)
Cold Leg
270--
Cold Legi
)
BrokenHot Leg
• APPARENT PREFERENTIAL WATER DOWNFLOW REGION (SHADED).INFERRED FROM CORE TEMPERATURE RESPONSE
IN CCTF-II UPI BASE CASE TEST
FIGURE 4.6-104.6-30
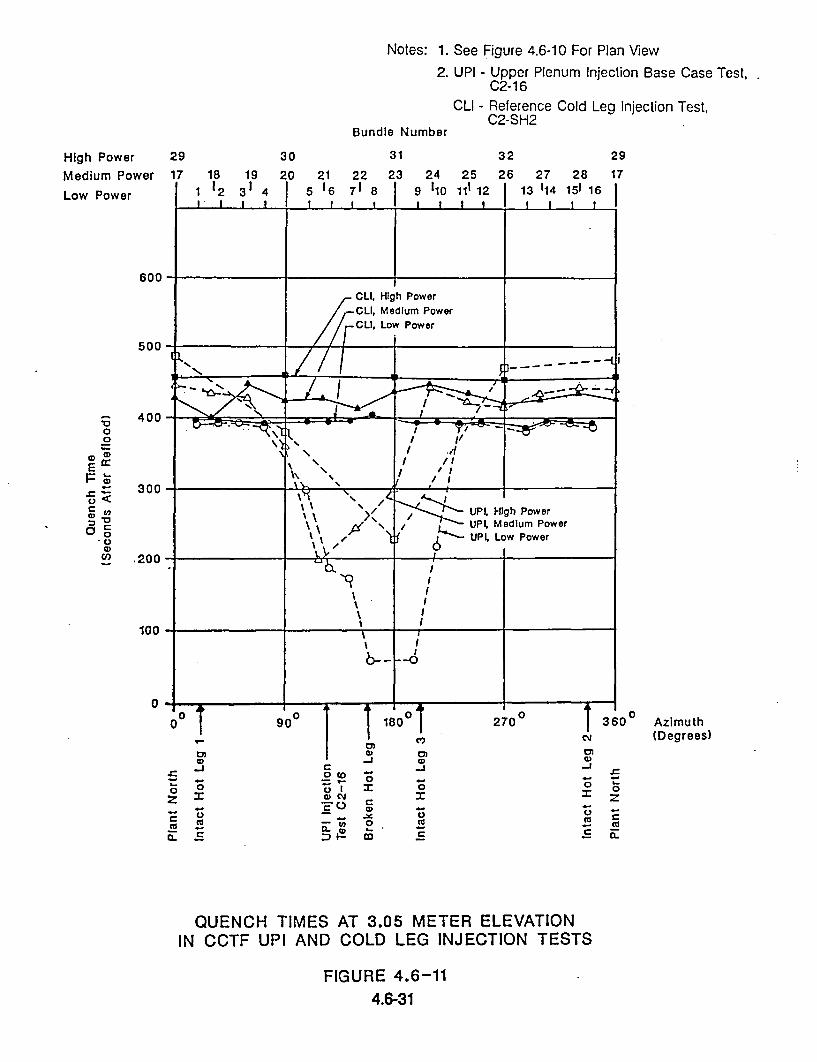
Notes: 1. See Figure 4.6-10 For Plan View
2. UPI - Upper Plenum Injection Base Case Test,C2-16
CLI - Reference Cold Leg Injection Test,C2-SH2
Bundle Number
High PowerMedium Power
Low Power
29 30 31 32 29
600
500
:G0
0<.11CD
og
400
300
200
100
03600 Azimuth
(Degrees)
QUENCH TIMES AT 3.05 METER ELEVATIONIN CCTF UPI AND COLD LEG INJECTION TESTS
FIGURE 4.6-114.6-31
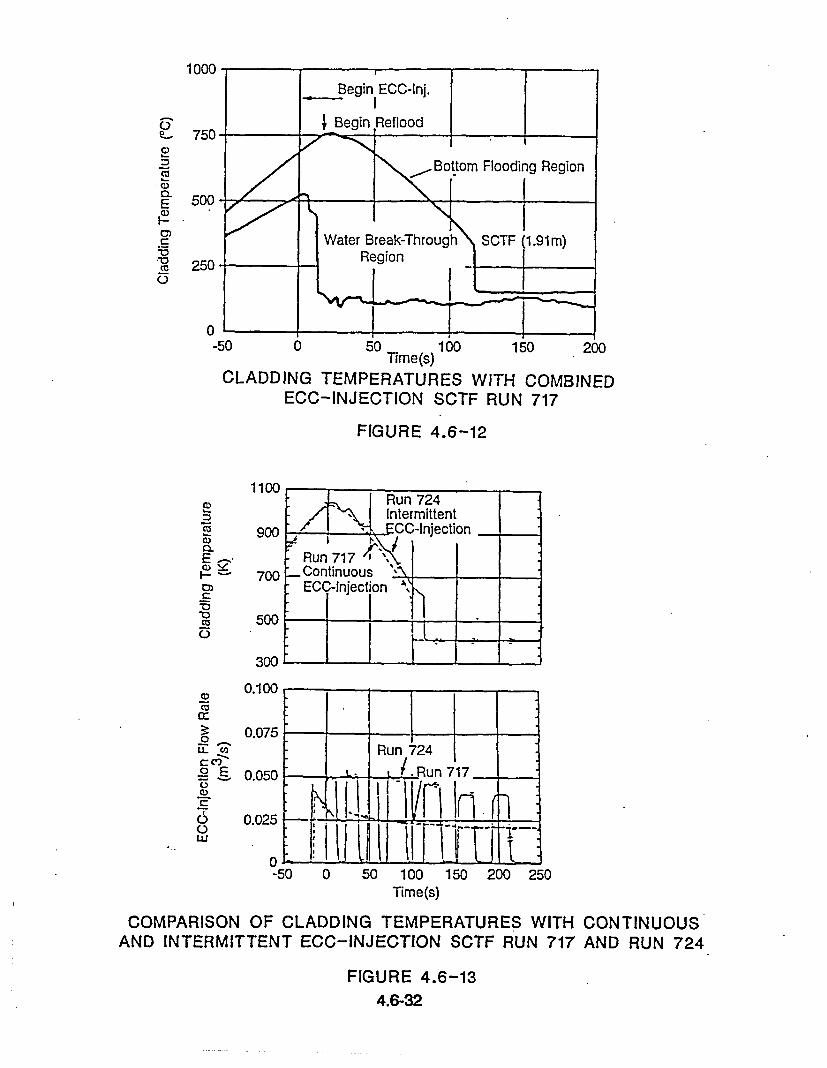
1000
c,
CL
ECD
0
50 0 50 100 150 200Time(s)
CLADDING TEMPERATURES WITH COMBINEDECC-INJECTION SCTF RUN 717
FIGURE 4.6-12
C)
Cl
E
C1*0
1100
900
700
500
300
U-0
LLUS
0.100
0.075
0.050
0.025
0-5
Run 724
717
Ji2T L-=1'.II!lIK LI
50 0 50 100 150 200Time(s)
250
COMPARISON OF CLADDING TEMPERATURES WITH CONTINUOUSAND INTERMITTENT ECC-INJECTION SCTF RUN 717 AND RUN 724
FIGURE 4.6-13
4.6-32

100099 C880C Conservative Licensing
80 , • Calculation
Peak Clade720mC Temperature
600"
E400 •
c 4Licensing Calculation
0
0 30 60 90 120 150 180 210 240 270 30C
Time(s)
RANGE OF CLADDING TEMPERATURE HISTORIESCALCULATED WITH TRAC USING LICENSING ASSUMPTIONSCOMPARED TO A CONSERVATIVE LICENSING CALCULATION
FIGURE 4.6-14
)
4.6-33


4.7 WATER DELIVERY TO AND DISTRIBUTION IN THE UPPER PLENUM
Definition of Issue and Description of Phenomena
Some PWRs have ECC systems which deliver subcooled ECC to the reactor vesselupper plenum. These include upper plenum injection (UPI) plants and combinedinjection plants (where ECC injected in the hot legs enters the upper plenum). Duringa large-break LOCA, steam or two-phase upflow from the core interacts withsubcooled ECC in the upper plenum. The interaction influences ECC delivery to thecore and subsequently core cooling.
Key phenomena in the upper plenum include the following:
* Steam condensation in the upper plenum by subcooled ECC, which improvescore venting (i.e., decreases steam binding).
• Water accumulation, which stores water in the upper plenum and creates ahydrostatic head which contributes to the core-to-downcomer pressure drop.
* Water distribution in the upper plenum, which can influence the location of waterdownflow.
* Saturated/subcooled water mixing, which "dilutes" the subcooling and caninfluence the amount of water penetration to the core.
L Liquid entrainment and carryover into the hot legs, which removes liquid from thereactor vessel and may contribute to steam binding.
iquid delivery to the core, which is directly related to core cooling.
Tests in the 2D/3D Program provided improved insight on these phenomena for bothUPI and combined injection.
In a UPI plant, low pressure coolant injection (LPCI) water is injected into the upperplenum. This injection is the principal source of ECC during the reflood phase of alarge-break LOCA (LBLOCA). Prediction of the disposition of UPI water and, inparticular, the ECC delivery to the core, is the major issue associated with this ECCsystem. Phenomena associated with UPI are shown in Figure 4.7-1. UPI downflowto the core may be limited by overall system behavior or the countercurrent flowlimitation (CCFL) at the tie plate. This situation contributes to accumulation of UPIwater in the upper plenum in the form of a two-phase mixture. Within this mixture,steam condensation is promoted. Uncondensed steam potentially carries some UPIwater out of the upper plenum into the hot legs where the water either de-entrains orcarries into the steam generators.
4.7-1

In a combined injection plant, both accumulator and pumped ECC are injected intothe cold legs and hot legs of the primary loop. The hot leg injection is throughnozzles (Hutze) at the bottom of the hot leg pipes aimed into the upper plenum. Inthis case, water delivery to the upper plenum is influenced by the steam/ECCinteraction in the hot legs (i.e., countercurrent flow and condensation--seeSection 4.3). Figure 4.7-2 illustrates phenomena in the upper plenum with hot leginjection. Subcooled water delivered to the upper plenum condenses steam in theupper plenum and flows down through the tie plate to the core. Condensation in theupper plenum and delivery to the core are strongly affected by the rate of ECCdelivery to the upper plenum and water distribution in the upper plenum. Waterdelivery to the core is also affected by countercurrent flow phenomena at the tie plate.
The phenomena described above for PWRs with combined injection can also occurduring a small-break LOCA (SBLOCA) in which the core uncovers at elevatedpressures. However, in this case only the high pressure injection system .is activated.
Importance of Issue to PWR LOCA Behavior
The pattern, flow rate, and subcooling of water delivery from the upper plenum to thecore affect local core cooling in the water downflow region. Global core cooling andpeak cladding temperature (PCT) are affected by the rate of reflood. Wateraccumulation in the upper plenum, hot legs, and steam generator inlet plena, as wellas steam produced from water carried into the steam generators, increases the looppressure drop and can potentially impede core flooding; however, steam condensationin the upper plenum improves core cooling by improving core venting capability.
Tests and Analyses that Relate to the Issue
Tests which addressed upper plenum water delivery and distribution were performedat each of the three major 2D/3D Program facilities as well as some of the ancillaryfacilities (ORNL, Karlstein, etc.). The tests at the ancillary facilities were performed aspart of the development/calibration of the advanced instrumentation for thecore/upper plenum interface. Tests outside the 2D/3D Program provided additionalinformation, generally at small-scale. In addition, many of the 2D/3D tests wereanalyzed using the TRAC and ATHLET computer codes. Tests and analyses relevantfor UPI and hot leg injection are listed in Tables 4.7-1 and 4.7-2, respectively.
As shown in Table 4.7-1, UPI-related separate effects tests were performed at UPTF,SCTF, the ORNL Instrument Development Loop (IDL), and Dartmouth. Integral testswere performed at both CCTF and Semiscale. Post-test analyses of each of the CCTFtests were performed using TRAC-PF1/MOD1. The UPTF test was analyzed usingboth TRAC-PF1/MOD2 and ATHLET.
4.7-2
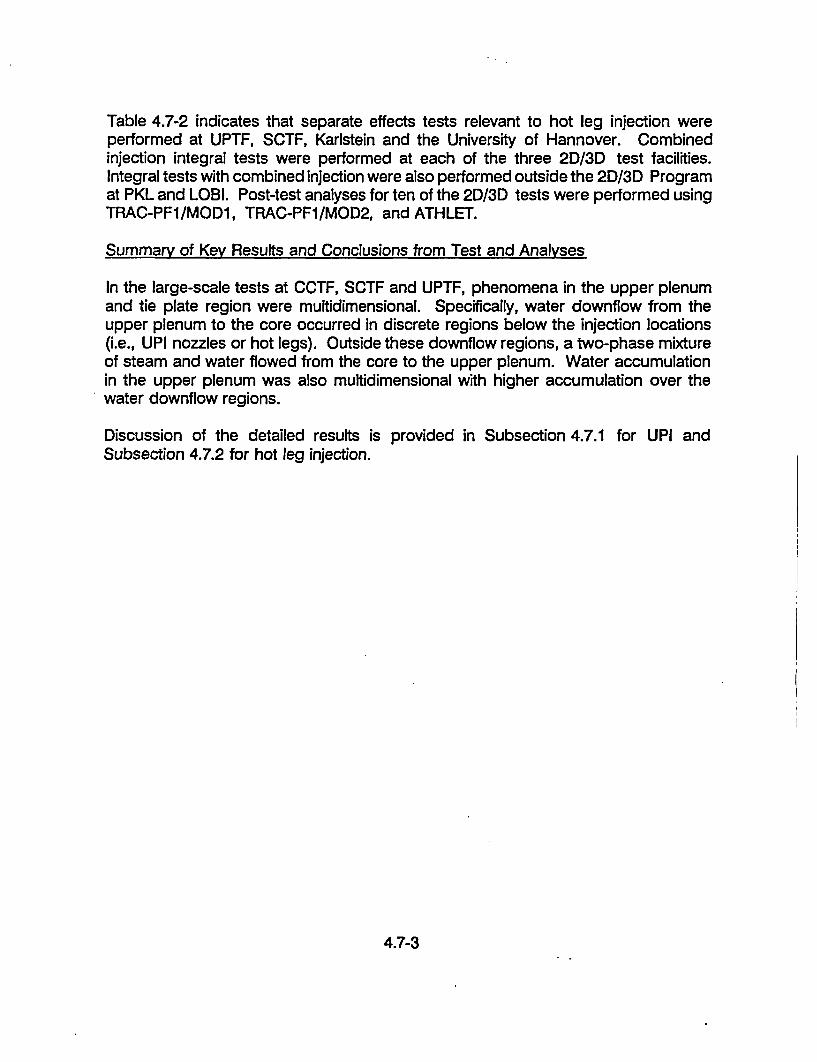
Table 4.7-2 indicates that separate effects tests relevant to hot leg injection wereperformed at UPTF, SCTF, Karlstein and the University of Hannover. Combinedinjection integral tests were performed at each of the three 2D/3D test facilities.Integral tests with combined injection were also performed outside the 2D/3D Programat PKL and LOBI. Post-test analyses for ten of the 2D/3D tests were performed usingTRAC-PFI/MOD1, TRAC-PF1/MOD2, and ATHLET.
Summary of Key Results and Conclusions from Test and Analyses
In the large-scale tests at CCTF, SCTF and UPTF, phenomena in the upper plenumand tie plate region were multidimensional. Specifically, water downflow from theupper plenum to the core occurred in discrete regions below the injection locations(i.e., UPI nozzles or hot legs). Outside these downflow regions, a two-phase mixtureof steam and water flowed from the core to the upper plenum. Water accumulationin the upper plenum was also multidimensional with higher accumulation over thewater downflow regions.
Discussion of the detailed results is provided in Subsection 4.7.1 for UPI andSubsection 4.7.2 for hot leg injection.
4.7-3

4.7.1 Upoer Plenum Injection
As previously discussed, 2D/3D tests with UPI showed that delivery of water to thecore occurred in a single, stable region in front of the ECC injection nozzle whileoutside this region a two-phase mixture of steam and water flowed upward from thecore to the upper plenum. Steam and subcooled ECC mixed in the upper regions ofthe core and the upper plenum resulting in extensive condensation; uncondensedsteam was vented out the hot legs. The lack of subcooling in the lower plenum or thehot legs during the CCTF and UPTF tests, indicated that the maximum amount ofcondensation took place in the upper plenum and core regions. For CCTF, virtuallyno subcooling was found in the core indicating that all of the condensation occurredin the upper plenum.. About 80% of the condensation at UPTF occurred in the upperplenum and the remainder occurred in the core region.
The following discussion compares results from UPI and UPI-related tests at differentfacilities and evaluates the effect of scale. For this discussion, scale is defined relativeto the core flow area; however, it should be noted that the test vessel radius mayaffect how readily the multidimensional phenomena are established. It should also benoted that, in integral tests with a heated core at CCTF and Semiscale, upper plenumbehavior may have been influenced by system effects; the separate effects tests atUPTF, SCTF, IDL, and Dartmouth did not simulate overall system behavior.
The size of the downflow region was predominantly a function of the facility scale.The area of the downflow region relative to the core flow area was found todecrease with increasing scale, as shown in Figure 4.7-3 (Reference U-454).
The rate of downflow was found to be dependent upon ECC subcooling and scalefor comparable (i.e., appropriately scaled) ECC injection rates. With moresubcooling, the rate of water downflow constituted a larger fraction of the availablewater (i.e., ECC injection rate plus steam condensation rate). Subcooling abovethe tie plate appears to aid in downflow to the core. Scale affected downflow inthat the larger scale facilities had larger downflow fractions relative to the availablewater as shown in Figure 4.7-4. Note that, in the CCTF tests, system effects witha heated core influenced downflow; these effects were not simulated at UPTF.However, at both CCTF and UPTF, almost all of the ECC injected in the upperplenum penetrated to the core (Reference U-454).
Water carryover to the hot legs, and hence the potential for steam binding due tovaporization in the steam generators, was found to be influenced by scale. Anincrease in scale resulted in a decrease in carryover rate for similar core steammomentum fluxes as shown in Figure 4.7-5. Further, water accumulation in thehot legs occurred to a greater extent at the large-scale UPTF than at the small-scale CCTF; consequently, the portion of water carried over to the loops which
4.7-4

reached the steam generators was smaller at UPTF than at CCTF (ReferenceU-454).
For similar gas momentum fluxes at the tie plate and ECC injection rates, theupper plenum liquid fraction was found to decrease with increasing scale asshown on Figure 4.7-6. However, it should be noted that system effects with aheated core, which were not simulated in the UPTF and ORNL tests, may affectthe trend shown in Figure 4.7-6. The amount of water stored in the upper plenumat steady-state was small, ranging from about 3 seconds worth of UPI flow atUPTF to 25 seconds worth of UPI flow at SCTF. Upper plenum accumulation wasalso affected by the ECC injection rate. Specifically, the "no-failure" (high ECOflow) test at CCTF had an inventory that was twice that in the "single-failure" tests;however, the condensing capacity of the UPI flow exceeded the core steam flowso that the additional inventory did not hinder core venting. The water distributionacross the flow area tended to be uniform except over the downflow region wheremore water accumulated. Overall, the differential pressure resulting from the wateraccumulation was a small fraction of the total loop differential pressure (ReferenceU-454).
The five CCTF tests were analyzed by the TRAC-PFI/MODI computer code at LANL(Reference U-622). In addition, LANL analyzed the UPTF test using the TRAC-PF1/MOD2 computer code (Reference U-710). For four of the five CCTF tests, thecode had reasonable overall agreement with the test results, predictingmultidimensional core reflood conditions, negative core-inlet flow, location of the liquiddownflow, and average values for fuel rod temperatures. However, the codeoverpredicted the amount of UPI downflow to the core while also not predicting thecore void distribution accurately. The analysis of one CCTF test (C2-AA1) did nothave good overall agreement with the test, but the test conditions were not similar toa UPI plant. The TRAC analysis of the UPTF test predicted UPI downflow to the core,overall condensation of steam, and the overall break mass flow, but overpredictedliquid accumulation in the upper plenum and underpredicted the loop mass flows.Overall, the two TRAC code versions were able to predict the major trends reasonably.
With regard to expected behavior in a UPI PWR, the test results indicate waterdownflow from the upper plenum to the core will occur steadily and the rate ofdownflow will be essentially the same as the UPI flow rate. Also, most of the steamwhich enters the upper plenum from the core will be condensed in the upper plenum.This tends to negate the possibly detrimental effects of hot leg carryover and upperplenum accumulation.
4.7-5
4.7.2 Hot Leg Injection
With hot leg injection, ECC delivery to the upper plenum is influenced by thesteam/ECC interaction in the hot legs. As discussed in Section 4.3.2, ECC deliveryis either continuous or fluctuating. Fluctuating delivery results from periodic wateraccumulation in the hot legs.
In UPTF tests, water downflow to the core initiated almost immediately and only arelatively small amount of water accumulated in the upper plenum. Water downflowoccurred in local regions adjacent to the hot legs where ECC was injected. Wateraccumulation in the upper plenum exhibited similar multidimensionality in thataccumulation was higher over the downflow regions. The corresponding increase inlocal hydrostatic head provided the necessary driving head for water downflow. Thewater downflow into the core was observed to be subcooled.
Figure 4.7-7 shows the size of the downflow region for four of the UPTF separateeffects tests. The figure indicates that the size of the downflow region was about 10fuel assemblies per injection nozzle in the high pressure, SBLOCA test (Test 30); and18-23 fuel assemblies per injection nozzle for the low pressure, LBLOCA tests(Tests 12, 20 and 26). Figure 4.7-7 also indicates that the size of the downflow regionincreases with increasing ECC injection rate. This trend may be attributable to anincrease in injection velocity. Fluctuations in ECC delivery to the upper plenum did notaffect the size or location of the downflow regions.
For the high ECC and core exit steam flows typical of an LBLOCA, 80% of the coreexit steam flow was condensed in the hot legs and upper plenum by the hot leg ECCinjection. Even though condensation was extensive, the water downflow to the corewas substantially subcooled (-70 K); however, for conditions simulating HPI duringan SBLOCA, only a portion of the core exit steam flow was condensed and the waterdownflow was saturated. The lack of subcooling below the tie plate indicates that thecondensation efficiency in the hot legs and upper plenum was about 100%.
Finally, UPTF test results indicated ECC penetration through the tie plate at full-scalewas not limited (no CCFL) over the range of expected PWR flow conditions.
Countercurrent flow phenomena at the tie plate were extensively investigated in thepast, using small-scale test facilities and perforated plates up to the size of one fuelassembly (References E-931, E-932, E-471, E-933, G-901, and G-803). Typically,small-scale facilities showed behavior that was relatively homogeneous and one-dimensional, and water downflow was inhibited by CCFL even at moderate steamflows.
4.7-6
In the larger CCTF (1/24-scale), behavior was different. After a brief period of wateraccumulation following ECC initiation, water downflow to the core in a stable channelwas established. There was significant upper plenum water accumulation in CCTF.The location where water downflow occurred was not precisely predictable(References J-453 through J-456).
Comparison of the UPTF results to CCFL correlations from the small-scale facilitiesindicates that downflow was significantly higher at the full-scale UPTF than at small-scale. This beneficial effect at large-scale is explained by the multidimensional waterdistribution and flow patterns; i.e., distinct breakthrough zones.
Since assessment of existing flooding correlations from literature using UPTFexperimental results revealed that extrapolation to full-scale is not appropriate, a newequation was developed to correlate the tie plate countercurrent flow observed inUPTF. This new correlation is an addition to the well-known Wallis-type andKutateladze type correlations (References G-415, G-906, and G-915). Each of thethree correlations is valid for experimental facilities of a certain scale. Figure 4.7-8shows the dimensionless gas velocity at the onset of penetration across the full rangeof facility scales.
An analytical model to determine water downflow rates and areas was developed bySiemens based on analyzing the pressure balance at the tie plate in the waterdownflow and two-phase upflow regions. This model is described in detail inReference G-925.
Post-test analyses for several of the UPTF tests were performed usingTRAC-PFI/MODI. Review of the calculations indicates that TRAC correctly predictedfluctuating delivery from the hot legs but overpredicted the subcooling of the waterdelivered to the upper plenum. TRAC also did not correctly account for the horizontalmomentum of the water flow into the upper plenum. Specifically, water downflow tothe core and significant water accumulation in the upper plenum were predicted tooccur directly below the hot legs in the TRAC calculations rather than 1 m in front ofthe hot legs as observed in the tests. Finally, TRAC predicted the onset of waterdownflow but underpredicted the rate of downflow by 20%.
For a PWR with ECC injection into hot legs it can be concluded:
* Water downflow occurs in front of the hot legs with ECC injection. Fluctuationsin ECC delivery to the upper plenum result in fluctuations in water downflow to thecore.
For both the LBLOCA and SBLOCA cases, ECC injected in the hot legspenetrates through the tie plate into the core without limitation.
4.7-7
In the case of an LBLOCA, more than 80% of the core exit steam flow iscondensed in the upper plenum and the hot legs by the ECC injected into the hotleg and the water downflow through the tie plate is substantially subcooled.
* In the case of an SBLOCA in which the core uncovers, the condensation efficiencyin the upper plenum and hot legs is close to 100% and the water downflow issaturated.
4.7-8
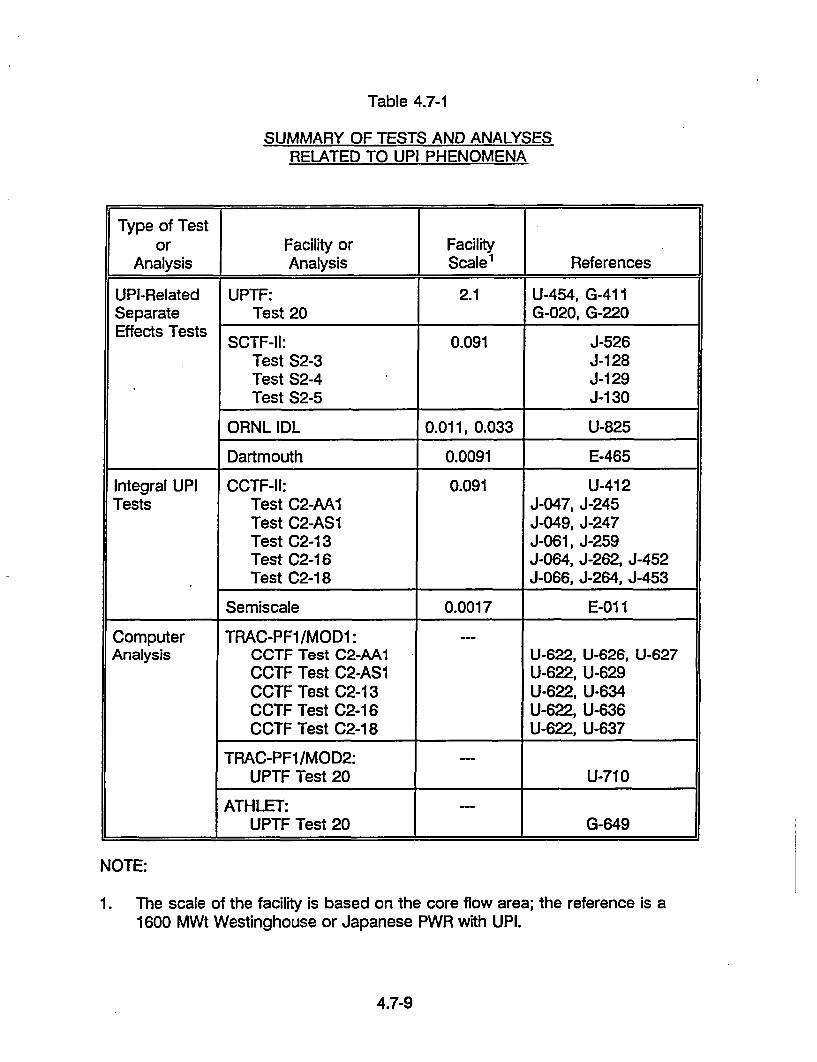
Table 4.7-1
SUMMARY OF TESTS AND ANALYSESRELATED TO UPI PHENOMENA
Type of Testor Facility or Facility
Analysis Analysis Scale References
UPI-Related UPTF: 2.1 U-454, G-411Separate Test 20 G-020, G-220Effects Tests SCTF-11: 0.091 J-526
Test S2-3 J-128Test S2-4 J-129Test S2-5 J-130
ORNL IDL 0.011, 0.033 U-825
Dartmouth 0.0091 E-465
Integral UPI CCTF-I1: 0.091 U-412Tests Test C2-AA1 J-047, J-245
Test C2-AS1 J-049, J-247Test C2-13 J-061, J-259Test C2-16 J-064, J-262, J-452Test C2-18 J-066, J-264, J-453
Semiscale 0.0017 E-01 1
Computer TRAC-PFI/MOD1: ---Analysis CCTF Test C2-AA1 U-622, U-626, U-627
CCTF Test C2-AS1 U-622, U-629CCTF Test C2-13 U-622, U-634CCTF Test C2-16 U-622, U-636CCTF Test C2-18 U-622, U-637
TRAC-PF1/MOD2: ---UPTF Test 20 U-710
ATHLET: ---UPTF Test 20 G-649
NOTE:
1 . The scale of the facility is based on the core flow area; the reference is a1600 MWt Westinghouse or Japanese PWR with UPI.
4.7-9
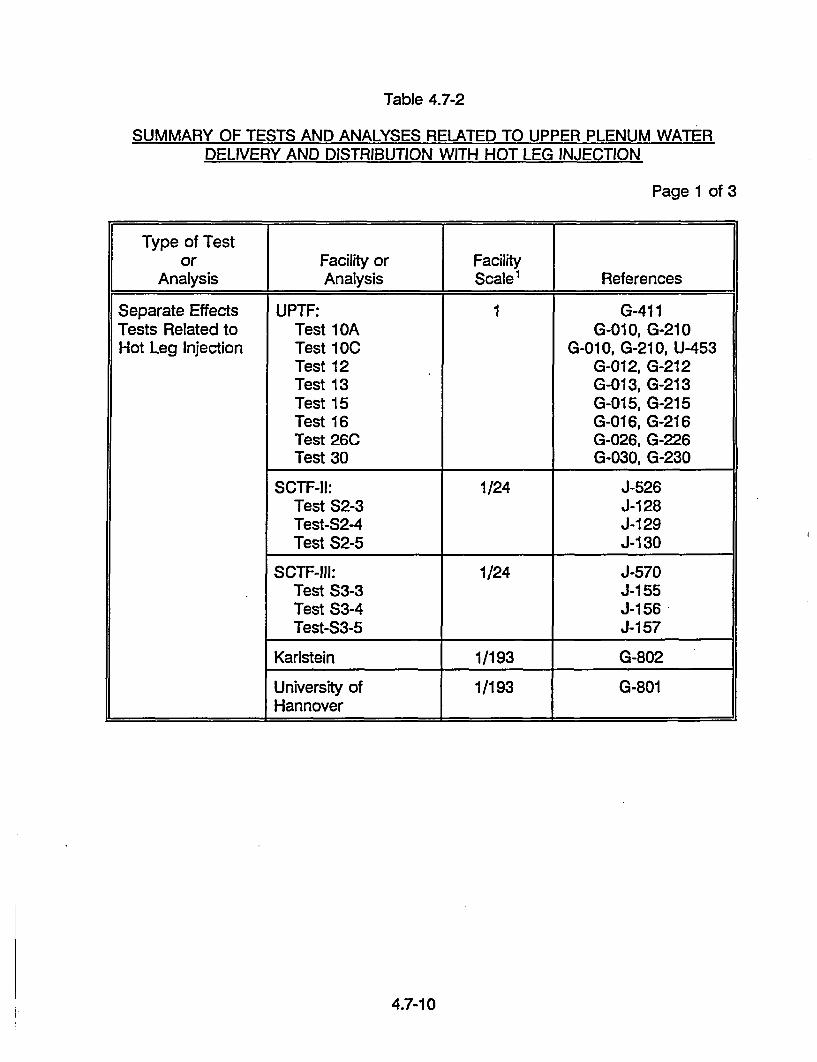
Table 4.7-2
SUMMARY OF TESTS AND ANALYSES RELATED TO UPPER PLENUM WATERDELIVERY AND DISTRIBUTION WITH HOT LEG INJECTION
Page 1 of 3
Type of Testor Facility or Facility
Analysis Analysis Scale 1 References
Separate Effects UPTF: 1 G-411Tests Related to Test 1 OA G-010, G-210Hot Leg Injection Test 10C G-010, G-210, U-453
Test 12 G-012, G-212Test 13 G-013, G-213Test 15 G-015, G-215Test 16 G-016, G-216Test 26C G-026, G-226Test 30 G-030, G-230
SCTF-I1: 1/24 J-526Test S2-3 J-128Test-S2-4 J-129Test S2-5 J-130
SCTF-lII: 1/24 J-570Test S3-3 J-155Test S3-4 J-156Test-S3-5 J-157
Karistein 1/193 G-802
University of 1/193 G-801Hannover
4.7-10

Table 4.7-2
SUMMARY OF TESTS AND ANALYSES RELATED TO UPPER PLENUM WATERDELIVERY AND DISTRIBUTION WITH HOT LEG INJECTION
Page 2 of 3
Type of Testor Facility or Facility
Analysis Analysis Scale' References
Integral Tests withCombinedInjection
UPTF:Test 3Test 14Test 18Test 19Test 28
1 G-411G-003, G-203G-014, G-214G-018, G-218G-019, G-219G-028, G-228
CCTF-I: 1/24Test C1-SH5 J-005, J-401
CCTF-I1: 1/24Test C2-19 J-067, J-454, J-455Test C2-20 J-068, J-456, J-557Test C2-21 J-069, J-456
SCTF-I: 1/24Test S1-SH3 J-102Test SI-SH4 J-103
SCTF-III: 1/24Test S3-AC1Test $3-SH2 J-152Test S3-11 J-163, J-557Test S3-13 J-165Test S3-18 J-170, J-564Test S3-19Test S3-20 J-171, J-565Test S3-21 J-172, J-577Test S3-22 J-173, J-572
PKL: 1/145 E-456, E-458
LOBI: 1/700 E-460
4.7-11
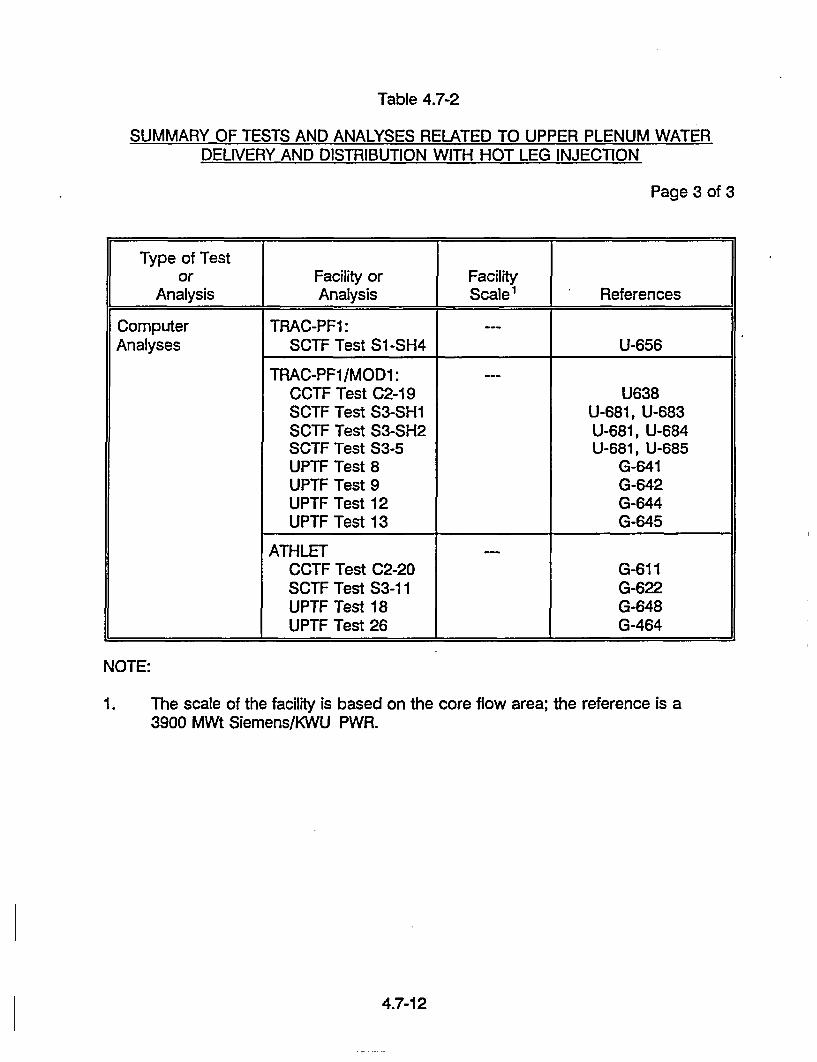
Table 4.7-2
SUMMARY OF TESTS AND ANALYSES RELATED TO UPPER PLENUM WATERDELIVERY AND DISTRIBUTION WITH HOT LEG INJECTION
Page 3 of 3
Type of Testor Facility or Facility
Analysis Analysis Scale1 ReferencesComputer TRAC-PF1: ---
Analyses SCTF Test S1-SH4 U-656
TRAC-PF1/MOD1: ---CCTF Test C2-19 U638SCTF Test S3-SH1 U-681, U-683SCTF Test S3-SH2 U-681, U-684SCTF Test S3-5 U-681, U-685UPTF Test 8 G-641UPTF Test 9 G-642UPTF Test 12 G-644UPTF Test 13 G-645
ATHLETCCTF Test C2-20 G-611SCTF Test S3-11 G-622UPTF Test 18 G-648UPTF Test 26 G-464
NOTE:
1. The scale of the facility is based on the core flow area; the reference is a3900 MWt Siemens/KWU PWR.
4.7-12

Legend: - Water Flow
--- Steam Flow
:~:*:::::: Water
' Two-Phase Mixture
UpperPlenum
Water Entrainment intoHot Legs
Steam and EntrainedWater Upflow Dueto Core Cooling
Water Accumulationin Upper Plenum(Two-Phase Mixture)
UPPER PLENUM PHENOMENADURING REFLOOD IN A UPI PWR
FIGURE 4.7-1
4.7-13
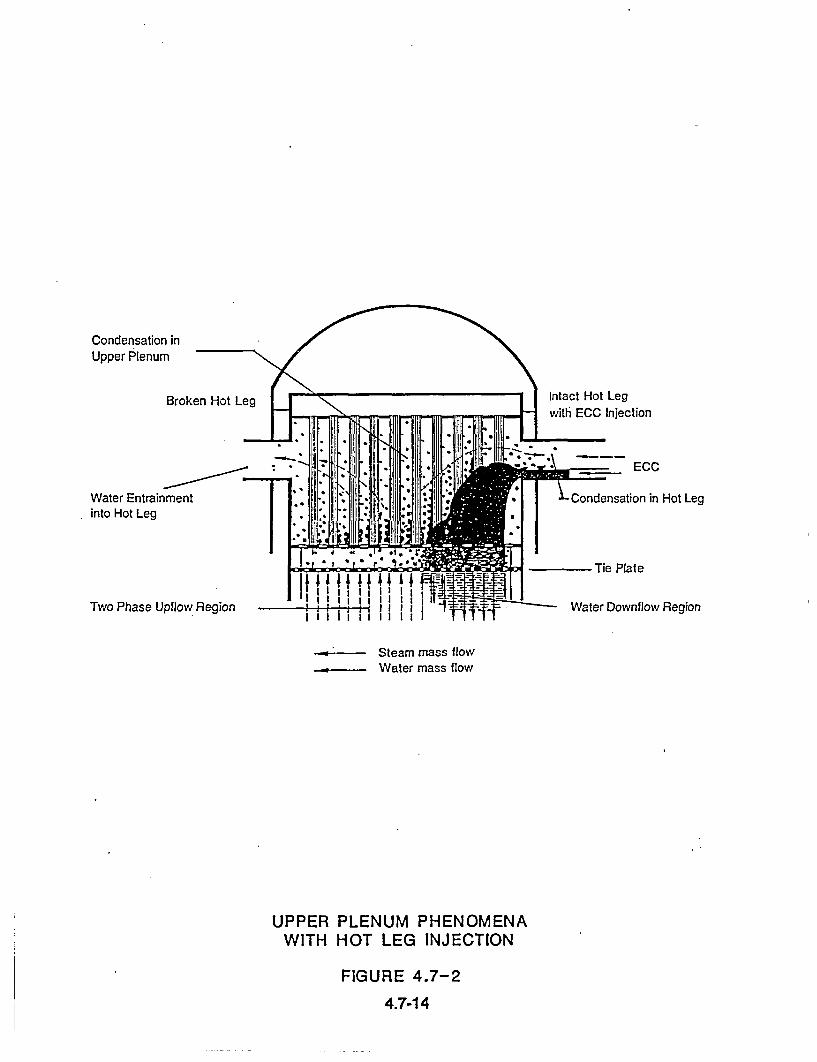
Condensation inUpper Plenum
Broken Hot I
Water Entrainmentinto Hot Leg
Two Phase Upflow Region
Intact Hot Legwithi ECC Injection
-ECC
LCondensation in Hot Leg
Tie Plate
Water Downflow Region
-.------ Steam mass flow-., Water mass flow
UPPER PLENUM PHENOMENA
WITH HOT LEG INJECTION
FIGURE 4.7-2
4.7-14

Note: See Reference U-454 for specific test runs evaluated.
Semiscale D Dartmouth XCCrF VSCTF A UPI Plant UPTF 0
100
(0
Co,
(0(0
C,
C/)<
CUC)
80
60
40
20
0
Scale Factor
BREAKTHROUGH FLOW AREA VERSUS SCALE FACTOR(REFERENCE U-454)
FIGURE 4.7-3
Note: See Reference U-454 for specific test runs evaluated.All results shown are for similar upper plenum steam momentum flux.
ORNL* OML *Dartmouth X I Module 3 Module
ccTF VscTFAZ UPI Plant UPTF 0100
CC--C
00
>0
- o
0- coUCn cCo~
o .0.=C:
00La w
0.001 0.01 0.1 1.0
Scale Factor
DOWNFLOW VERSUS SCALE FACTOR(REFERENCE U-454)
FIGURE 4.7-4
4.7-15
10.0
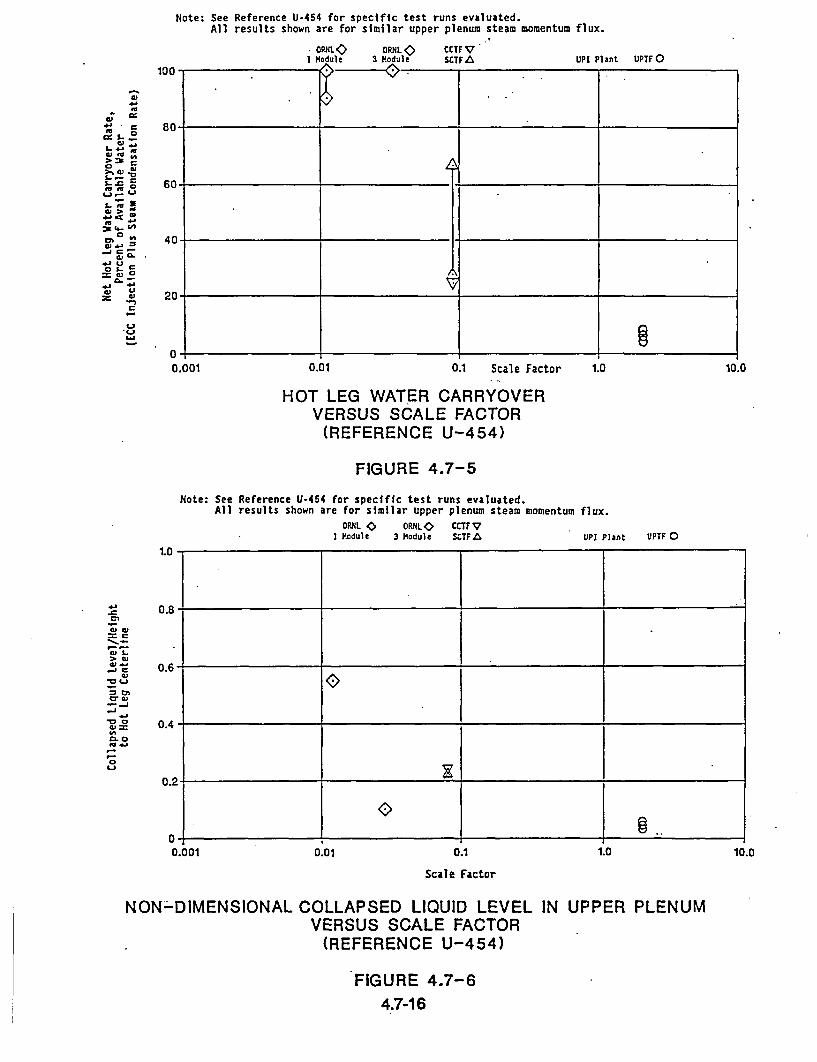
Note: See Reference U-454 for specific test runs evaluated.All results shown are for similar upper plenum steam
CRNLot ORNL cCIFvI Hodule 3 Module SCTF A
momentum flux.
UPI Plant UPTFO
41 U
0 01
> WJ
L0
CL
M- 41
0
0,0.
100.
80.
60
40
20-
00.001 0.01 0.1 Scale Factor 1.0 10.0
HOT LEG WATER CARRYOVERVERSUS SCALE FACTOR
(REFERENCE U-454)
FIGURE 4.7-5
Note: See Reference U-454 for specific test runs evaluated.All results shown are for similar upper plenum steam momentum flux.
ORNL * ORNL * CCTF VI Module 3 Module SCTFZ UPI Plant UPTF 0
0.8
0.6-
0.4
0.2-
0O
0.001 0.01 0.1
Scale Factor
1.0 10.0
NON-DIMENSIONAL COLLAPSED LIQUID LEVEL INVERSUS SCALE FACTOR
(REFERENCE U-454)
FIGURE 4.7-6
4.7-16
UPPER PLENUM

0
0*
CZ
W
ca
CC,
a-
0N High PressureSBLOCA Test
..........
Test 30
Low Pressure Test 26
LBLOCA Tests
S ............. ...
Test 12"" "Test 20
Test 26
I Total of 193 Fuel Assemblies in UPTF
0 100 2•0. 360 460 500
ECC - Injection Rate per Nozzle (kg/s)
DOWNFLOW AREA VERSUS ECC-INJECTION RATEFOR UPTF HOT LEG INJECTION TESTS
FIGURE 4.7-7
TIE PLATE (ONSET OF PENETRATION)
0a0)
co.C/).2Ci,
E.6
I II I
j* Correlation I K Correlation I Glaeser
Kadstein
1/14 I
K =1.0Boi12 K =3.2g I
S:.(0.027)2 g21Vg9
I 0
0BoilO.O0glr'i .4400
Bo de g(Pl'Pg)- Bo- de
0 1/90
V g I"
I 2V3 1)31 Re -9_I
113
I. d(6= 1801)
1
p.400 kPa I Tie Plate Equivalent Diameter Scale
DIMENSIONLESS GAS VELOCITY VERSUS FACILITY SCALEFOR TIE PLATE CCFL WITH HOT LEG INJECTION
FIGURE 4.7-84.7-17


4.8 WATER CARRYOVER AND STEAM BINDING WITH COLD LEG INJECTION
Definition of Issue and Description of Phenomena
Steam binding is defined as the increase in upper plenum pressure during the refloodportion of a large-break LOCA (LBLOCA) due to core steam generation and watercarryover. Vaporization of liquid carryover in the reactor coolant loops (principally thesteam generators) further adds to steam binding. This increase in pressure fromsteam binding reduces the core flooding rate and, therefore, core cooling. Thephenomena associated with water carryover and steam binding are shown inFigure 4.8-1 and described below.
During the reflood phase of an LBLOCA, part of the ECC injected into the cold legsflows down the downcomer to the lower plenum and into the core. A portion of thisflow is vaporized by decay heat and stored energy release in the core; the steam isvented to containment via the upper plenum and reactor coolant loops. Theremainder of the core inlet water flow is either accumulated in the core or carried bythe steam flow out of the core. Water carried over from the core is either de-entrainedin the upper plenum, or carried over with the steam to the hot legs and steamgenerators.
In the upper plenum, water de-entrains due to the decrease in steam velocitycorresponding to the increase in flow area relative to the core. The water which de-entrains either accumulates in the upper plenum, falls back to the core, or is re-entrained by the steam flow. Water accumulation in the upper plenum results in a two-phase mixture of steam and water. As shown in Figure 4.8-1, water which falls backto the core can be re-entrained and carried back to the upper plenum; i.e., arecirculation flow between the upper plenum and core can be established. There canalso be recirculation within the upper plenum as some of the water which de-entrainedin the upper plenum is re-entrained in the upper plenum.
The water carried over to the loops is either de-entrained and accumulated in the hotlegs and steam generator inlet plena, or carried over to the steam generator tubes(see Figure 4.8-1). The de-entrained water accumulates in the inlet plena resulting ina two-phase mixture or drains into the hot legs where it accumulates in a stratifiedlayer and potentially flows toward the reactor vessel (i.e., countercurrent to the two-phase flow from the upper plenum). Delivery to the upper plenum is controlled by thehot leg CCFL relationship (see Section 4.9). The water which is delivered to the upperplenum can increase the upper plenum liquid accumulation or be entrained by thesteam flow back toward the steam generator inlet plena; i.e., a recirculation path canbe created.
4.8-1
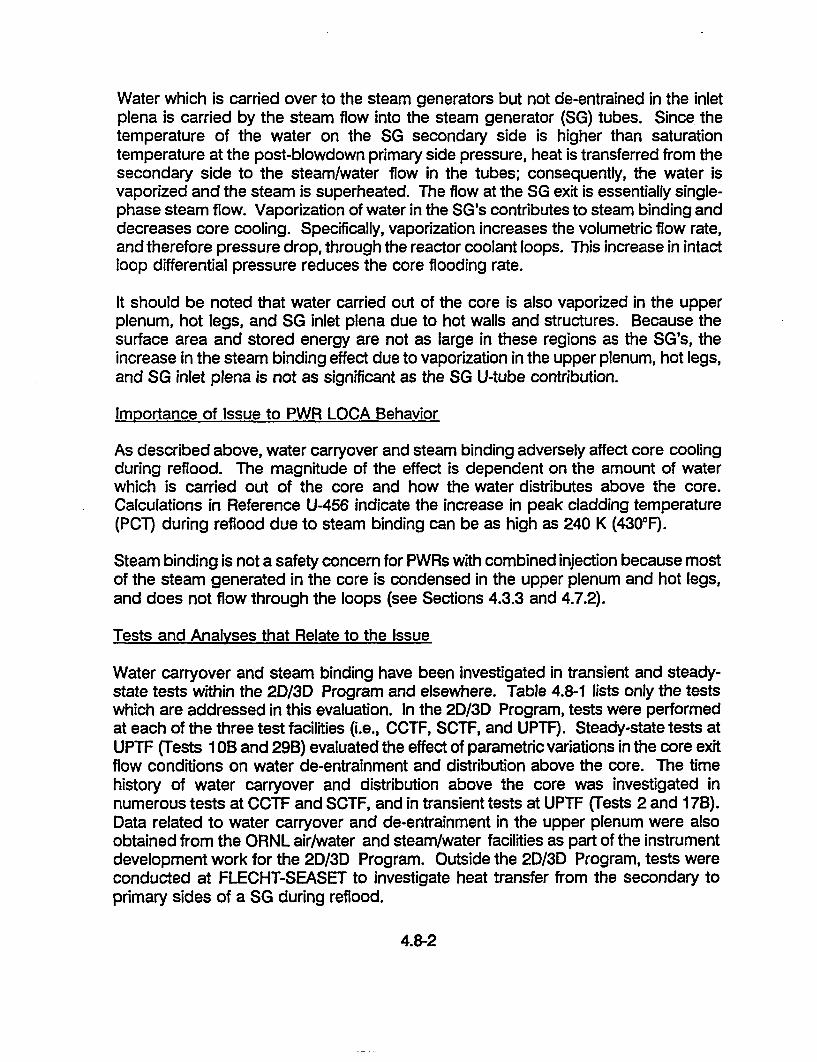
Water which is carried over to the steam generators but not de-entrained in the inletplena is carried by the steam flow into the steam generator (SG) tubes. Since thetemperature of the water on the SG secondary side is higher than saturationtemperature at the post-blowdown primary side pressure, heat is transferred from thesecondary side to the steam/water flow in the tubes; consequently, the water isvaporized and the steam is superheated. The flow at the SG exit is essentially single-phase steam flow. Vaporization of water in the SG's contributes to steam binding anddecreases core cooling. Specifically, vaporization increases the volumetric flow rate,and therefore pressure drop, through the reactor coolant loops. This increase in intactloop differential pressure reduces the core flooding rate.
It should be noted that water carried out of the core is also vaporized in the upperplenum, hot legs, and SG inlet plena due to hot walls and structures. Because thesurface area and stored energy are not as large in these regions as the SG's, theincrease in the steam binding effect due to vaporization in the upper plenum, hot legs,and SG inlet plena is not as significant as the SG U-tube contribution.
Importance of Issue to PWR LOCA Behavior
As described above, water carryover and steam binding adversely affect core coolingduring reflood. The magnitude of the effect is dependent on the amount of waterwhich is carried out of the core and how the water distributes above the core.Calculations in Reference U-456 indicate the increase in peak cladding temperature(PCT) during reflood due to steam binding can be as high as 240 K (4300F).
Steam binding is not a safety concern for PWRs with combined injection because mostof the steam generated in the core is condensed in the upper plenum and hot legs,and does not flow through the loops (see Sections 4.3.3 and 4.7.2).
Tests and Analyses that Relate to the Issue
Water carryover and steam binding have been investigated in transient and steady-state tests within the 2D/3D Program and elsewhere. Table 4.8-1 lists only the testswhich are addressed in this evaluation. In the 2D/3D Program, tests were performedat each of the three test facilities (i.e., CCTF, SCTF, and UPTF). Steady-state tests atUPTF (Tests 101B and 29B) evaluated the effect of parametric variations in the core exitflow conditions on water de-entrainment and distribution above the core. The timehistory of water carryover and distribution above the core was investigated innumerous tests at CCTF and SCTF, and in transient tests at UPTF (Tests 2 and 17B).Data related to water carryover and de-entrainment in the upper plenum were alsoobtained from the ORNL air/water and steam/water facilities as part of the instrumentdevelopment work for the 2D/3D Program. Outside the 2D/3D Program, tests wereconducted at FLECHT-SEASET to investigate heat transfer from the secondary toprimary sides of a SG during reflood.
4.8-2
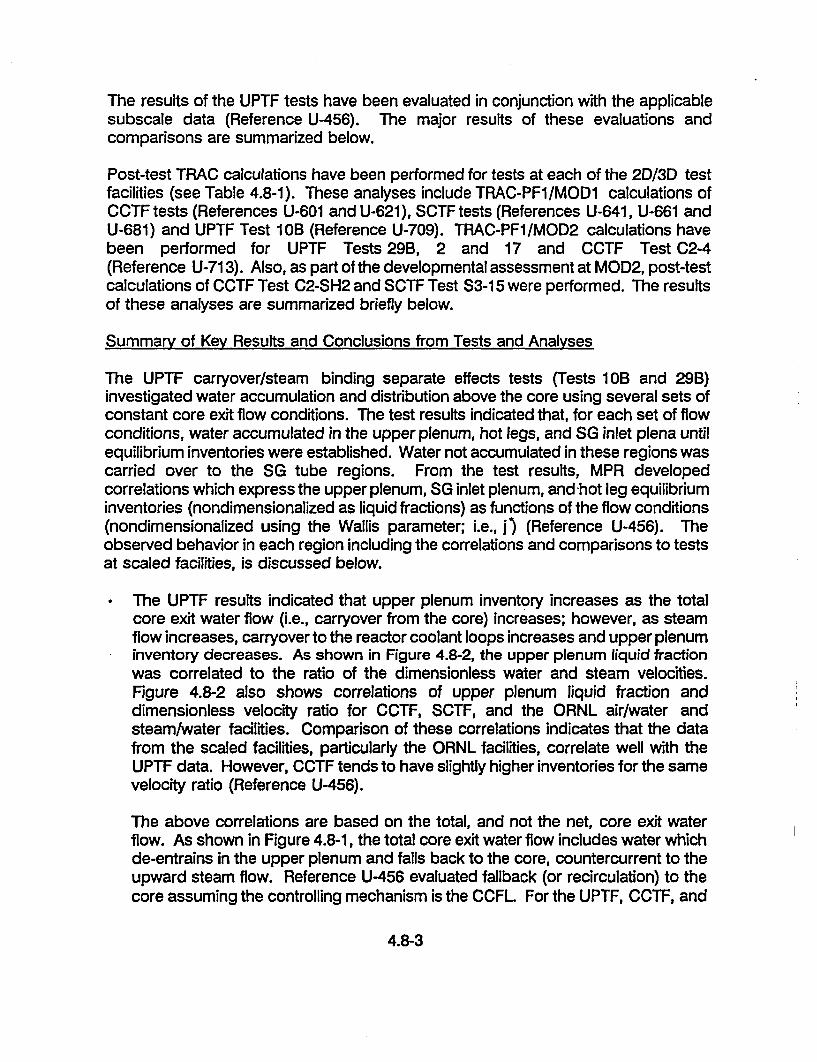
The results of the UPTF tests have been evaluated in conjunction with the applicablesubscale data (Reference U-456). The major results of these evaluations andcomparisons are summarized below.
Post-test TRAC calculations have been performed for tests at each of the 2D/3D testfacilities (see Table 4.8-1). These analyses include TRAC-PF1/MOD1 calculations ofCCTF tests (References U-601 and U-621), SCTF tests (References U-641, U-661 andU-681) and UPTF Test 1 OB (Reference U-709). TRAC-PF1 /MOD2 calculations havebeen performed for UPTF Tests 29B, 2 and 17 and CCTF Test C2-4(Reference U-713). Also, as part of the developmental assessment at MOD2, post-testcalculations of CCTF Test C2-SH2 and SCTF Test S3-15 were performed. The resultsof these analyses are summarized briefly below.
Summary of Key Results and Conclusions from Tests and Analyses
The UPTF carryover/steam binding separate effects tests (Tests 1 OB and 29B)investigated water accumulation and distribution above the core using several sets ofconstant core exit flow conditions. The test results indicated that, for each set of flowconditions, water accumulated in the upper plenum, hot legs, and SG inlet plena untilequilibrium inventories were established. Water not accumulated in these regions wascarried over to the SG tube regions. From the test results, MPR developedcorrelations which express the upper plenum, SG inlet plenum, and hot leg equilibriuminventories (nondimensionalized as liquid fractions) as functions of the flow conditions(nondimensionalized using the Wallis parameter; i.e., j) (Reference U-456). Theobserved behavior in each region including the correlations and comparisons to testsat scaled facilities, is discussed below.
The UPTF results indicated that upper plenum inventory increases as the totalcore exit water flow (i.e., carryover from the core) increases; however, as steamflow increases, carryover to the reactor coolant loops increases and upper plenuminventory decreases. As shown in Figure 4.8-2, the upper plenum liquid fractionwas correlated to the ratio of the dimensionless water and steam velocities.Figure 4.8-2 also shows correlations of upper plenum liquid fraction anddimensionless velocity ratio for CCTF, SCTF, and the ORNL air/water andsteam/water facilities. Comparison of these correlations indicates that the datafrom the scaled facilities, particularly the ORNL facilities, correlate well with theUPTF data. However, CCTF tends to have slightly higher inventories for the samevelocity ratio (Reference U-456).
The above correlations are based on the total, and not the net, core exit waterflow. As shown in Figure 4.8-1, the total core exit water flow includes water whichde-entrains in the upper plenum and falls back to the core, countercurrent to theupward steam flow. Reference U-456 evaluated fallback (or recirculation) to thecore assuming the controlling mechanism is the CCFL For the UPTF, CCTF, and
4.8-3
SCTF tests, the fallback/recirculation rates were estimated using the UPTF tieplate CCFL correlation for uniform steam flow and uniform fallback. (Note, fallbackwas measured in the ORNL tests.) As indicated in Reference U-456, the estimatedrecirculation rates were higher for the CCTF-11 and SCTF-11 data than for the UPTFand ORNL data because the tie plate steam velocities were lower. The low steamvelocities at CCTF-II and SCTF-Il resulted, in part, from less restrictive (i.e., moreopen) tie plates. This suggests that upper plenum accumulation is influenced bythe tie plate geometry (Reference U-456). Recirculation of liquid from the upperplenum to the core in CCTF and SCTF might also have been enhanced byhorizontal density differences in the core causing differences in buoyancy forces.Since the simulated decay power was higher toward the center, steam generationwas higher toward the center of the core and thus the fluid density was lowertoward the center of the core (Reference J-536).
The results of UPTF Tests 1 OB and 29B indicated that the equilibrium hot leginventory decreases as the steam and water flows increase. Comparison of hotleg flow conditions during UPTF Tests 1 OB and 29B with the hot leg CCFLrelationship (see Section 4.9) indicates that the two-phase velocities were abovethe CCFL boundary; i.e., flow to the upper plenum was prevented. Themomentum interaction between the two-phase flow and the water layer in the hotleg limited the water level which could be attained. The hot leg equilibriuminventory correlation plotted the liquid fraction near the hot leg bend versus thedimensionless two-phase velocity in the hot legs (see Figure 4.8-3). (Note, thetwo-phase density was calculated assuming a slip ratio of two.) The correlationbased on Tests 1 OB and 29B, which had two-phase flow from the upper plenuminto the hot legs is similar to a correlation based on Test 11 which had single-phase steam flow into the hot legs. The close similarity of the relationshipssuggests the hot leg inventory correlation is applicable to both two-phase andsteam-only flow entering the hot leg from the upper plenum (Reference U-456).
Hot leg water accumulation at UPTF is compared to CCTF and SCTF on the basisof the liquid fraction-dimensionless two-phase velocity relationship. The CCTFtests with scaled diameter hot legs had essentially no hot leg accumulation, whichis consistent with the UPTF results because the dimensionless steam velocitieswere very high in CCTF due to the small diameter of the pipes. The SCTF testswith a full-height, scaled-width hot leg showed stratified flow and water storage.Comparison of the results indicates that the SCTF hot leg liquid fraction increasesmore rapidly as the two-phase flow decreases (see Figure 4.8-3). The differencein facility behavior is consistent with the differences in hot leg cross section(Reference U-456).
Results of the UPTF tests showed that SG inlet plenum inventory increases withboth increasing steam and water flow. The water which accumulates in the inletplenum is supported by the momentum of the two-phase flow in the inlet plenum;
4.8-4

hence, increasing the flows increases the momentum flux in the inlet plena andtherefore the mass of water which can be supported. The equilibrium inventorycorrelation for the inlet plena plotted the liquid fraction versus the square of thedimensionless two-phase velocity calculated assuming homogeneous flow (seeFigure 4.8-4).
SG inlet plenum accumulation at UPTF is compared to only CCTF. The SCTF inletplenum was inadequately instrumented to allow two-phase flow behavior to beanalyzed. Comparison of inlet plenum accumulation at CCTF to the UPTFcorrelation (see Figure 4.8-4) showed that the two appeared to be in a differentregime of behavior. Specifically, the CCTF velocities are higher than the UPTFvelocities. The CCTF data suggest the inlet plenum liquid fraction remainsconstant or decreases slightly as the dimensionless two-phase velocity increasessubstantially. It appears the CCTF inlet plena may be in a high steam flow regimewhere the inventory is determined by carryover from the inlet plena to the tuberegions. The UPTF inlet plena, on the other hand, appear to be in a low steamflow regime where inventory is determined by fallback from the inlet plena to thehot legs (Reference U-456).
Transient tests at CCTF and SCTF investigated overall system behavior during refloodincluding thermal-hydraulic phenomena in the core and water carryover out of thecore. In both facilities, water was entrained to the upper regions of the coreessentially immediately after BOCREC (References U-401, U-414, U-421, U-431, andU-441). Some of the water entrained to the upper regions of the core is carried outof the core to the upper plenum and reactor coolant loops; i.e., contributes to thesteam binding effect.
The CCTF and SCTF tests showed that water carryover from the core depended onthe conditions at the beginning of reflood and the flooding rate. Typically, carryoverwas highest during the initial stages of reflood when the core flooding rate was high.When the core flooding rate decreased just prior to termination of accumulatorinjection, water carryover decreased significantly. Carryover increased later in refloodas the quench front progressed to the upper regions of the core. For EM conditions,the net core exit quality averaged about 90% over the duration of the transient. ForBE conditions, however, the net quality at the core exit averaged about 60% indicatingsignificant carryover (References U-414 and U-441). See Section 4.6.1 for a moredetailed discussion of thermal-hydraulic behavior in the core during a LOCA.
UPTF Test 17B simulated a BE reflood transient to evaluate the time history of wateraccumulation above the core at full-scale. The test conditions were based on anSCTF test (Test S3-10). The net core exit steam and water flows, and a summarymass balance plot are provided in Figure 4.8-5. The mass balance plot indicates thatinitially the upper plenum and SG inlet plena accumulated almost all of the core exitwater flow. The hot legs and SG tube regions did not accumulate appreciable
4.8-5
amounts of water during approximately the first 25 seconds of the transient. When thecore exit water flows decreased dramatically after about 25 seconds, the upperplenum and SG inlet plenum inventories decreased, resulting in increases in the hotleg and SG tube region accumulations. During the later portion of the transient, thecore exit steam flow decreased while the core exit water flow increased. The upperplenum, SG inlet plenum and hot leg inventories reflected the changes in core exitflows. At the end of the transient, the SG tube regions had accumulated about 65%of the water which exited core (Reference U-456).
Vaporization of entrained water in the SG U-tubes was investigated in tests at CCTFand FLECHT-SEASET. At both facilities, steam entered the U-tubes saturated andexited the U-tubes superheated to close to the secondary side temperature(References U-401, U-414, and E-481). This suggests all of the water was vaporized;however, at FLECHT-SEASET, measurements of the flow quality in the outlet plenumindicated that the flow in the outlet plenum was actually a non-equilibrium mixture ofsuperheated steam and entrained water. The quality in the outlet plenum was about97% (Reference E-481).
Post-test calculations of numerous CCTF and SCTF tests were performed usingTRAC-PF1/MOD1. In CCTF analyses, water carryover from the upper plenum to theloops was generally well predicted in high power tests which had high steam flows andwater carryover rates, and in low power tests which had low steam flows andnegligible carryover; however, in SCTF analyses, water carryover from the upperplenum was generally underpredicted, even for tests with high steam flows. A limitednumber of CCTF and SCTF tests have also been analyzed using TRAC-PF1/MOD2.With the new reflood model in MOD2, more water was carried out of the core to theupper plenum; consequently, predicted carryover from the upper plenum to the loopswas higher with MOD2 than MOD1. Carryover to the loops was well predicted in theSCTF calculation and overpredicted in the CCTF calculations (Reference U-713).
The ability of TRAC-PF1 /MODI to predict water carryover/steam binding phenomenawas evaluated outside the 2D/3D Program as part of the USNRC's Code Scaling,Applicability and Uncertainty (CSAU) Study. The evaluation was based on analysesof SCTF tests. The study showed that water carryover from the upper plenum to theloops was improved by increasing entrainment and interfacial shear in the core, notthe upper plenum; consequently, it was concluded that prediction of carryover to theloops is dependent on calculating the flow conditions above the quench front andbelow the tie plate. (It should be noted that MOD2 has a new coreentrainment/interfacial shear model which predicts flow conditions below the tie platebetter than the old model in MOD1.) Finally, the CSAU Study estimated that TRAC-PF1/MOD1 underpredicts the reflood PCT in a four-loop Westinghouse PWR by asmuch as 59 K due to underprediction of steam binding (Reference U-713).
4.8-6

As part of the 2D/3D Program, UPTF tests have been analyzed usingTRAC-PF1/MOD1 and TRAC-PF1/MOD2. Both the MOD1 and MOD2 calculationsunderpredicted water carryover from the core to the upper plenum. The poorprediction of carryover from the core impacted the prediction of water carryover fromthe upper plenum to the hot legs and SGs; specifically, carryover from the upperplenum was underpredicted. Interestingly, the upper plenum water level was, in somecases, overpredicted because the underprediction of carryover to the loops wasgreater than the underprediction of carryover from the core. The poor prediction ofcarryover from the core was attributed to the inability of the computer model of theUPTF core simulator to accurately predict flow conditions below the tie plate. Sinceflow conditions below the tie plate in PWR calculations are determined by the corereflood model, the results of the UPTF analyses are not considered indicative of theability of TRAC to predict PWR LOCA behavior (Reference U-713).
A methodology for predicting transient water accumulation above the core wasdeveloped from the results of the UPTF carryover/steam binding separate effects testsand verified with UPTF transient tests (Reference U-456). This methodology wasadapted for predicting transient water accumulation in US/J PWRs with cold leginjection. The predicted accumulation and distribution above the core for a 3400 MWtClass Westinghouse OMJ PWR and a Combustion Engineering (CE) System 80 PWRare shown in Figure 4.8-6. The predictions are based on the core exit flow conditionsof UPTF Test 17B, a BE reflood transient. Differences in water distribution above thecore for UPTF Test 17B (see Figure 4.8-5) and the PWRs reflect geometrical andconfigurational differences (Reference U-456).
The effect of steam binding on the reflood PCT was estimated in Reference U-456from the predicted carryover to the SG U-tubes for each of the PWRs assumingcomplete vaporization. A summary of this analysis which shows the maximum impactof steam binding on PCT as a function of the fraction of water carried over to the SGU-tubes is presented in Figure 4.8-7. The figure shows that, if all of the water carriedout of the core reaches the SG U-tubes, the increase in PCT is about 240 K (430*F)relative to no carryover to the U-tubes. Based on the predicted carryover to the SGtube regions for US/J PWRs, the increase in the reflood PCT due to water carryoverand steam binding is between 55 K and 65 K (1000 F and 12001).
4.8-7
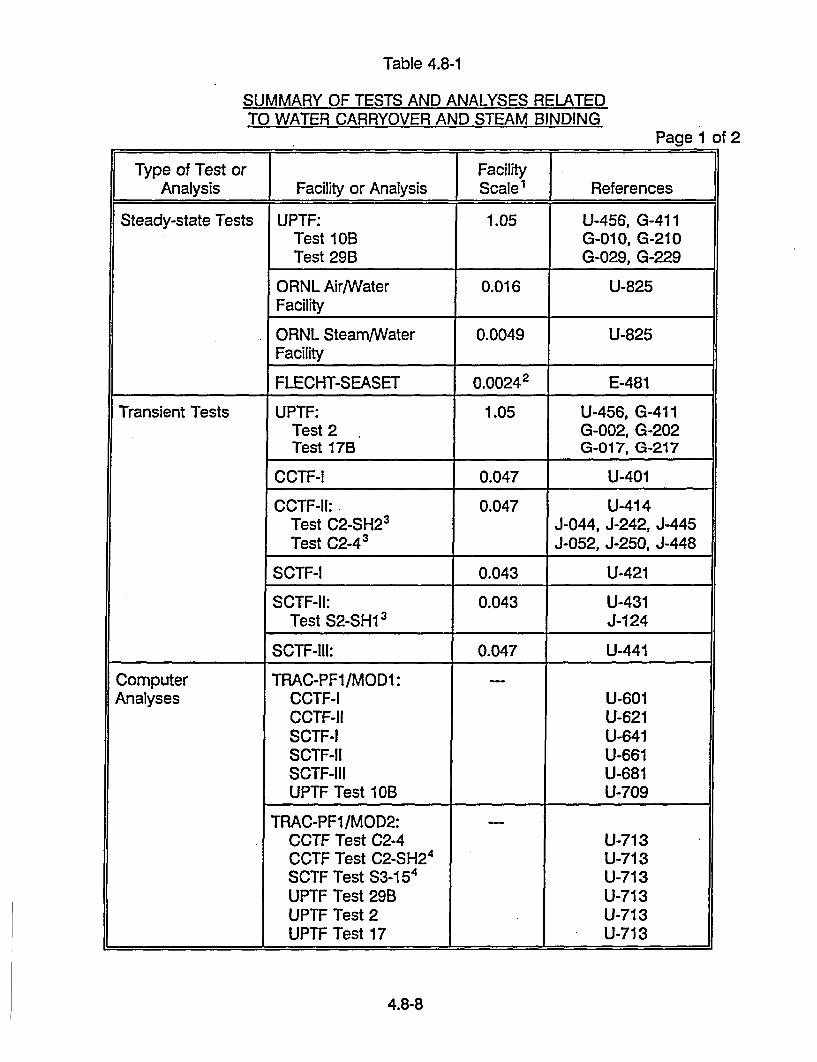
Table 4.8-1
SUMMARY OF TESTS AND ANALYSES RELATEDTO WATER CARRYOVER AND STEAM BINDING
Page 1 of 2
Type of Test or FacilityAnalysis Facility or Analysis Scale1 References
Steady-state Tests UPTF: 1.05 U-456, G-411Test IOB G-010, G-210Test 29B G-029, G-229
ORNL Air/Water 0.016 U-825Facility
ORNL Steam/Water 0.0049 U-825Facility
FLECHT-SEASET 0.00242 E-481
Transient Tests UPTF: 1.05 U-456, G-411Test 2 G-002, G-202Test 17B G-017, G-217
CCTF-l 0.047 U-401
CCTF-11: 0.047 U-414Test C2-SH23 J-044, J-242, J-445Test C2-4 3 J-052, J-250, J-448
SCTF-R 0.043 U-421
SCTF-11: 0.043 U-431Test $2-SHI 3 J-124
SCTF-III: 0.047 U-441
Computer TRAC-PF1/MOD1: -
Analyses CCTF-l U-601CCTF-II U-621SCTF-! U-641SCTF-11 U-661SCTF-I1 U-681UPTF Test lOB U-709
TRAC-PF1/MOD2:CCTF Test C2-4 U-713CCTF Test C2-SH2 4 U-713SCTF Test S3-154 U-713UPTF Test 29B U-713UPTF Test 2 U-713UPTF Test 17 U-713
4.8-8
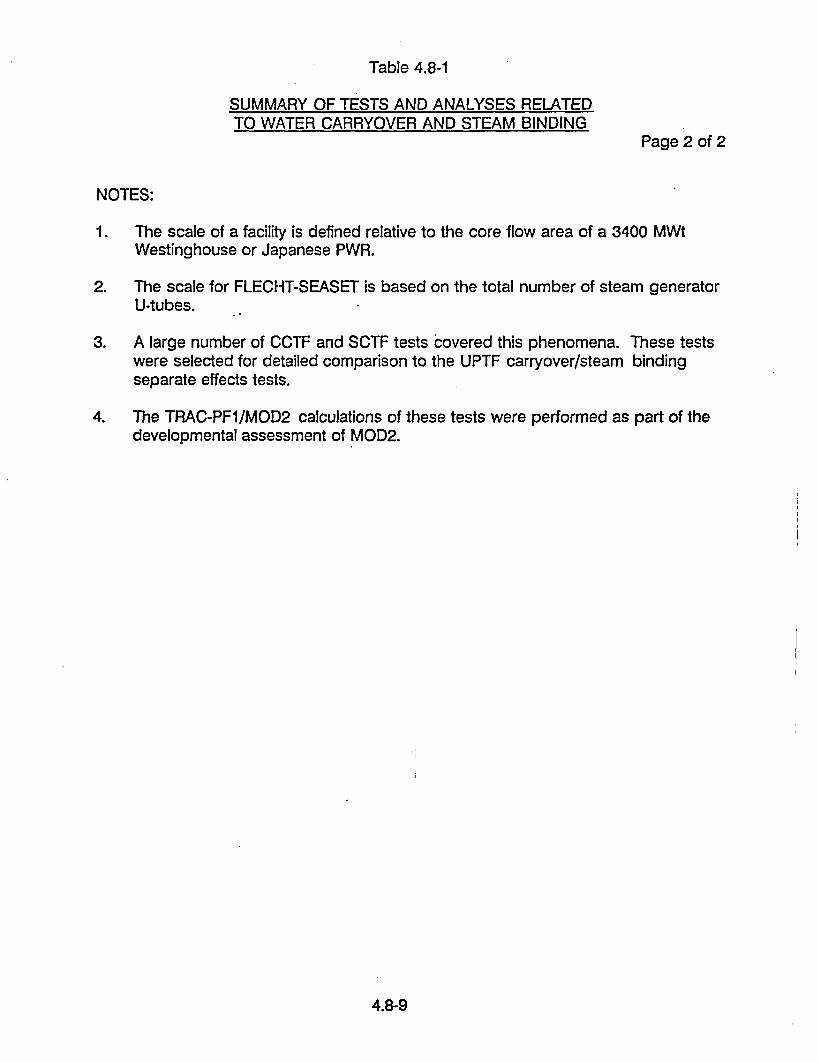
Table 4.8-1
SUMMARY OF TESTS AND ANALYSES RELATEDTO WATER CARRYOVER AND STEAM BINDING
Page 2 of 2
NOTES:
1. The scale of a facility is defined relative to the core flow area of a 3400 MWtWestinghouse or Japanese PWR.
2. The scale for FLECHT-SEASET is based on the total number of steam generatorU-tubes.
3. A large number of CCTF and SCTF tests covered this phenomena. These testswere selected for detailed comparison to the UPTF carryover/steam bindingseparate effects tests.
4. The TRAC-PF1/MOD2 calculations of these tests were performed as part of thedevelopmental assessment of MOD2.
4.8-9
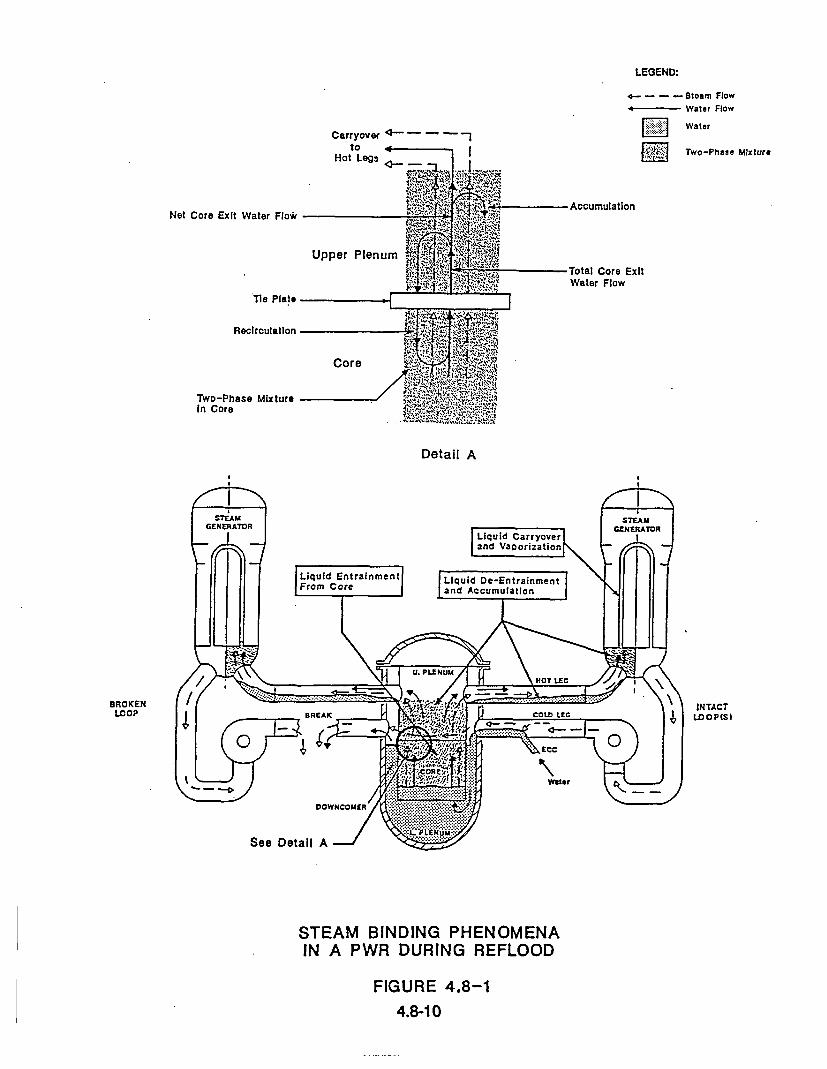
LEGEND:
4--. - -- •8toam Flow
4 - Water Flow
Water
_ Two-Phase Mixture
Carryover <-- - •._to
Hot Legs
Net Core Exit Water Flow
Tie Plate
Recirculation
Two-Phase MixtureIn Core
Detail A
BROKENLOOP
INTACTLOOP(S1
STEAM BINDING PHENOMENAIN A PWR DURING REFLOOD
FIGURE 4.8-1
4.8-10

C
0.06.
4ý
0.04.CL
CL.
O,
0.02
0 0.02 0.04 0.06 0.08 0.O 0
j 1*/Jg*
DATA FROM UPTF CARRYOVER/STEAM BINDING SEPARATE EFFECTS TESTS(10B AND 29B)
FACILITY
UPTF0RNL $1W0RUL A/WCCTF-11SCTF-11
Equations of Least Squares Fit Lines
-up " 0.007036 + 1.013 (je*/jg*)TUP . 0.03128 + 0.8477 (je*/Jgo)
-u - 0.06470 + 0.8461 (jt*/jg*)-ý - 0.02411 + 1.855 (jt*/jg*)
up - 0.00289 + 1.321 (jt*/jg*)
0.35
0.30
C
4-'U
0.20
0.10
0
(jt*/Jg*)
COMPARISON TO SCALED FACILITIESNotes:
1. The liquid fraction is based on the upper-plenum volume from thetie plate to the hot leg centerline.
2. The dimensionless velocities are based on the total core exit waterand steam flows (see Figure 4.8-1).
UPPER PLENUM EQUILIBRIUM LIQUID INVENTORYCORRELATION FOR UPTF SEPARATE EFFECTS TESTS
AND COMPARISON TO SCALED FACILITIES(REFERENCE U-456)
FIGURE 4.8-2
4.8-11
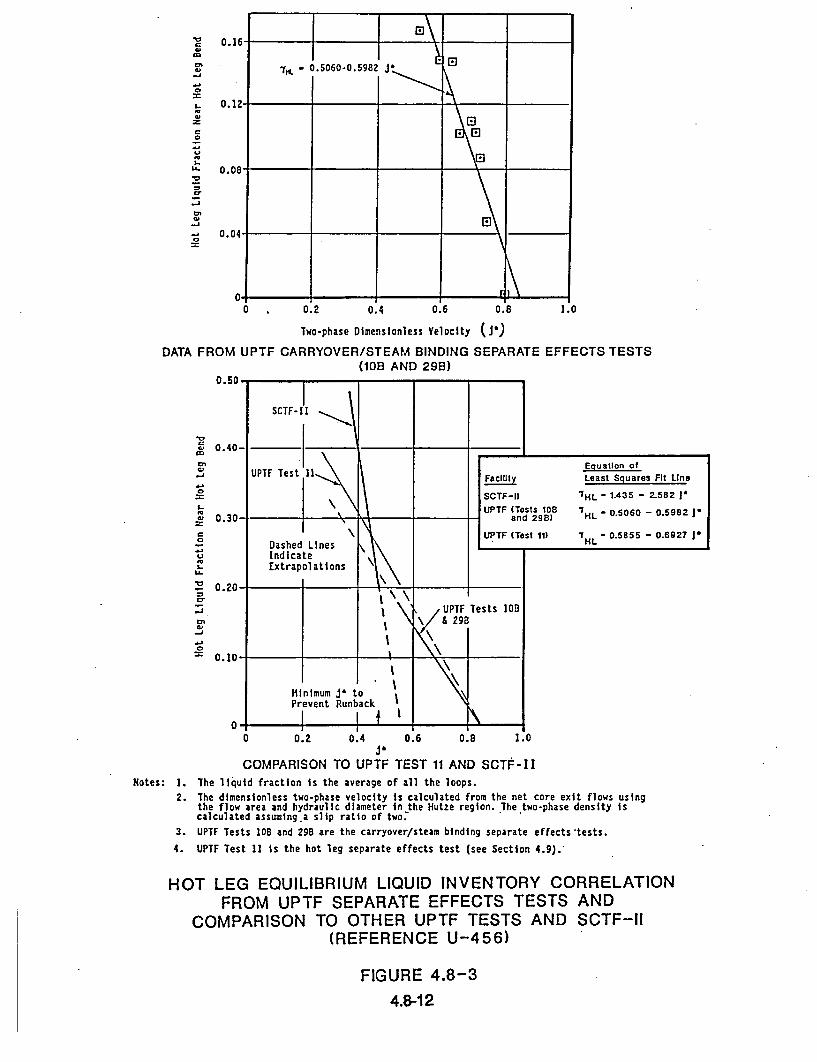
x 0.
0.
U
O.
L
0J
-r
DT 0.
DATA FRO~
.16 __ _'__ __ ___
'(H. - 0.5060-0.5982 J 0
12
08
04
0 0.2 0.4 0.6 0.8 1.00
A
Two-phase Dimensionless Velocity (09)
UPTF CARRYOVER/STEAM BINDING SEPARATE EFFECTS TESTS(00B AND 29B)
M ~II
SCTF-II
0.40- 1
a,C,
-J
a
1~'aC,zC0
-aU
1.La..
*0
0~
-J
a,C,
-J
-a0
UPTF Test 11 Facillty
SCTF-II
UPTF (Tests 10Band 298)
UPTF (Test 11)
Equation ofLeast Squares Fit Line
"1HL - 1.43S - 2.582 I*
I HL - 0.5060 - 0.5982 J
"H - 0.5855 - 0.6927 1HL
0.30I N ,
Dashed LinesIndicateExtrapolations
I
UPTF Tests 10B& 29B
0.°-in * 4- -. -.---6v
Minimum J* toPrevent Runback
I I I
II
N0.j-
0I i
0.2 0.4 0.600.8 1.0
J*
COMPARISON TO UPTF TEST 11 AND SCTF-IINotes: 1. The liquid fraction is the average of all the loops.
2. The dimensionless two-phase velocity Is calculated from the net core exit flows usingthe flow area and hydraulic diameter In the Hutze region. The.two-phase density iscalculated assuming.a slip ratio of two.
3. UPTF Tests lOB and 29B are the carryover/steam binding separate effects tests.
4. UPTF Test 11 is the hot leg separate effects test (see Section 4.9).
HOT LEG EQUILIBRIUM LIQUID INVENTORY CORRELATIONFROM UPTF SEPARATE EFFECTS TESTS AND
COMPARISON TO OTHER UPTF TESTS AND SCTF-II(REFERENCE U-456)
FIGURE 4.8-3
4.8-12

0
0.15 • Legend:
6jp - -0.07889+ 144.1j* El UPTF DataEPoint
t.
- /0.10A
0.05"
L/
101 / El E
0 0.00S 0.0010 0.0015 0.0020
Two-phase Dimensionless Velocity Squared (J.I
DATA FROM UPTF CARRYOVER/STEAM BINDING SEPARATE EFFECTS TESTS(10B AND 29B)
Legend:
El CCTF-II DataPoint
C0
Li*0I.
0~
-J
CC,
a.
C,
C
C,
C..UC,
Li
0.006 0.008 C(j*,?
TO CCTF-11 DATACOMPARISONNotes: 1. The liquid fraction is based on the collective inlet plenum
Inventory and the total volume of all four SG Inlet plena.
2. The dimensionless two-phase velocities are calculated fromthe net core exit flows using the flow area and hydraulicdiameter at the top of the inlet plenum. The two-phasedensity is calculated assuming homogeneous flow.
SG INLET PLENUM EQUILIBRIUM LIQUID INVENTORY CORRELATIONFROM UPTF SEPARATE EFFECTS TESTS
AND COMPARISON TO CCTF-11 DATA(REFERENCE U-456)
FIGURE 4.8-4
4.8-13

LLWco
z
200-
150 '
100"
50-
Legend:
El steam
w water
435 460 485 510Time (Seconds)
535 560
CORE EXIT FLOW CONDITIONS FOR UPTF TEST 17B
R'Legend:
-Total InJection
- - - Total Accumulation
0 Upper Plenum Inventory
A SC Inlet Plenum InventoryEl flot Leg Accumulation
E SG lube Region Accumulation
485 51s
Time (Seconds)
SUMMARY OF MASS BALANCE ABOVE THE COREUPTF TEST 17B
Note: The core exit flow conditions for UPTF Test 17B wee based on SCTF Test 83-10.which simulated a best-estimate reflood transient.
BEHAVIOR FOR A BEST-ESTIMATE TRANSIENTFOR UPTF TEST 17B(REFERENCE U-456)
FIGURE 4.8-54.8-14

D...-e. . %1in L-D
It
6500. . - _.... ___
6000-
5000
4000-
3000-
2000-
1000 -2
0-00 25 50 75 100 125
Time (Seconds)
CE SYSTEM 80 PWR
Pressure - 310 kPa6000
4000'
8
3000'6
2000
0 ,4.
12,000
10,000
8000
6000
000
•000
Legend:
Integral of the Net Core ExitWater Flow
0 Upper Plenum Inventory
& SG Inlet Plenum Inventory
El Hot Leg Inventory
O Carryover to SG Tube Region
14,000
2,000
0,000
000
000
000
20
1000
Li?- 2UUU
0 a " -" U0 25 50 75 125
Time (Seconds)WESTINGHOUSE 3400 MWT PWR
Note: Time 0 corresponds to the beginning of core simulator waterinjection for UPTF Test 179 (I.e., 437 seconds) which isequivalent to BOCREC (see Figure 4.8.5)-
PREDICTED WATER ACCUMULATION IN US/J PWRSFOR A BEST-ESTIMATE TRANSIENT
(REFERENCE U-456)
FIGURE 4.8-64.8-15

250
200
150
100I-0.}
Range of US)J Cold LegInjection PWRs
i I
400
-300
200
-100
0
C
50
00 20 40 60 80 100
Percent Carryover to Steam Generator U-Tubes 2
Notes: 1. Defined as the increase in peak clad temperature (PCT)relative to the PCT for no water carryover to the steamgenerator U-tubes.
2. Defined as the percent of water carryover from the corewhich reaches the steam generator U-tubes.
3. This figure shows the maximum effect of water carryover andsteam binding on PCT.
4. Best-estimate behavior is based on the predicted wateraccumulation and distribution above the core shown inFigure 4.8-6.
EFFECT OF STEAM BINDING ON PEAK CLAD TEMPERATURE
FIGURE 4.8-74.8-16

4.9 HOT LEG COUNTERCURRENT FLOW
Definition of Issue and Description of Phenomena
The reactor safety issue associated with hot leg countercurrent flow is thecharacterization of the natural circulation processes which provide core cooling duringa small-break LOCA (SBLOCA). In an SBLOCA heat generated in the core istransferred to water in the secondary side of the steam generators by naturalcirculation within the primary system. As primary system inventory decreases, naturalcirculation changes from single-phase (water) to two-phase (cocurrent, with water asthe continuous phase) and finally to reflux condensation (Reference E-401). Hot legcountercurrent flow is applicable to the reflux condensation mode of core cooling inan SBLOCA.
Reflux condensation is the cooling mode in which steam is the continuous phase inthe upper plenum and reactor coolant loops (i.e., above the core). Decay heat isremoved by steam generation in the core and steam condensation in the steamgenerator U-tubes. As shown in Figure 4.9-1, steam condensed in the upflow leg ofthe U-tubes returns to the reactor vessel by flowing countercurrent to the steam flowin the hot leg. The primary system pressure during reflux condensation can be ashigh as 8,000 kPa (1160 psia) (Reference U-452).
Countercurrent flow can also occur in the hot legs during the reflood portion of a largebreak LOCA (LBLOCA). As described in Section 4.8, water de-entrained in the steamgenerator inlet plena drains into the hot legs. This water either accumulates in the hotlegs or flows toward the reactor vessel (i.e., countercurrent to the two-phase flow fromthe upper plenum). The water which is delivered to the upper plenum can increasethe upper plenum liquid accumulation or can be entrained by the steam flow backtoward the steam generator inlet plena; i.e., a recirculation path is created. Thisrecirculation flow of entrained water to the inlet plena mitigates the countercurrent flowand the buildup of hot leg inventory; further, it contributes to increasing the inletplenum inventory. The net effect of countercurrent flow in the hot legs is to reducecarryover to the steam generator U-tubes, and hence reduce the steam binding effect(see Section 4.8).
Hot leg countercurrent flow is characterized by a countercurrent flow limitation (CCFL)curve, or flooding curve. The CCFL curve defines the maximum countercurrent waterflow which can be achieved for a given steam flow toward the steam generator inletplena. The countercurrent water flow can be less than the value indicated by theCCFL curve for a given steam flow if the water delivery to the hot leg from the inletplenum is less than the maximum countercurrent flow which can be achieved;however, the countercurrent water flow cannot be greater than the value indicated bythe CCFL curve.
4.9-1
Importance of Issue to PWR LOCA Phenomena
As indicated above, hot leg countercurrent flow is of interest primarily forcharacterizing natural circulation cooling processes during an SBLOCA. A principalmotivation for characterizing the natural circulation cooling modes during an SBLOCAwas the 1979 accident at Three Mile Island, which involved significant primary coolantinventory depletion (Reference E-401).
With regard to LBLOCA, hot leg countercurrent flow is beneficial in that it reduces PCTby reducing carryover to the steam generator U-tubes (i.e., steam binding). Asdiscussed in Section 4.8, reduction in carryover to the U-tubes due to hot legcountercurrent flow is expected to be small, especially early in reflood; hence, theimpact on reflood PCT should, likewise, be small.
Tests and Analyses that Relate to the Issue
The UPTF hot leg separate effects test (Test 11) was conducted specifically toinvestigate hot leg countercurrent flow at full-scale. The data from UPTF Test 11 wereused to determine a CCFL correlation. This correlation is .compared to CCFL curvesdeveloped from tests at other facilities, to theoretical models, and to computeranalyses of UPTF Test 11. Also, the CCFL curve determined from Test 11 data iscompared to the flow conditions in scaled integral tests which simulated refluxcondensation. Since hot leg countercurrent flow during reflood relates to the steambinding issue, comparisons of the hot leg CCFL correlation to tests which simulatedreflood are discussed in Section 4.8.
The tests and analyses considered in this evaluation of hot leg countercurrent flow andits implications for the reflux condensation mode of core cooling are listed inTable 4.9-1. A detailed comparison of the tests which investigated hot legcountercurrent flow is presented in Table 4.9-2. As shown in Table 4.9-2, while thesetests encompass a wide range of pipe diameters and configurations, the UPTF dataare the only data obtained at full-scale.
Summary of Key Results and Conclusions from Tests and Analyses
As previously indicated, the evaluation of the UPTF hot leg separate effects test dataconsisted primarily of the determination of a CCFL curve. Figure 4.9-2 presents a plotof the UPTF steam flow versus countercurrent water flow. Steam and water flow inFigure 4.9-2 are expressed as dimensionless, superficial velocity 0*, defined inFigure 4.9-2) which is typical of countercurrent flow analyses. The data shown in thefigure include only conditions with complete turnaround of water (i.e., no delivery) andpartial delivery. The CCFL correlation was determined from a least squares fit of thedata points with partial turnaround of the water flow; the complete turnaround pointswere not used because they fall above the CCFL boundary. As shown in Figure 4.9-2
4.9-2

the scatter of the data about the CCFL correlation is small. Also, the agreementbetween the 300 kPa and 1,500 kPa data is extremely good. The correlation predictscomplete turnaround at j-, = 0.47.
The CCFL correlation determined from the UPTF data is compared to correlationsdeveloped from tests at subscale facilities in Figure 4.9-3. Countercurrent flowpredictions calculated from these correlations are compared to the UPTF data at1,500 kPa in Figure 4.9-4. As shown in Figure 4.9-3, the slopes of the CCFLcorrelations for the subscale facilities are similar to the UPTF correlation, but they-intercepts are different. (Note that Ohnuki determined that the y-intercept of theCCFL curve depends on the length of the horizontal pipe, pipe diameter, and lengthof the inclined riser. The dimensions of the UPTF hot leg were used in the Ohnukiformulation to determine the y-intercept of the Ohnuki CCFL curve plotted inFigure 4.9-3.) The best agreement between the UPTF and the subscale facilities iswith the Richter correlation. As shown in Figure 4.9-3, the facility used by Richter wasthe largest of the subscale facilities. Also, the configuration of Richter's facility andUPTF are similar.
Figure 4.9-3 also shows the CCFL curves determined using the Gardner model forpressures of 300 kPa and 1,500 kPa, the system pressures used in the UPTF testing.The Gardner model is a theoretical model in which the flooding mechanism isassumed to be unstable stationary disturbance (Reference E-941). As shown in thefigure, the CCFL curves determined using the Gardner model do not comparefavorably with the UPTF correlation or the correlations for the subscale facilities;hence, it appears that the assumed flooding mechanism does not reflect truecountercurrent flow behavior in horizontal pipes (Reference U-904).
A previous study on modeling SBLOCA phenomena evaluated hot leg CCFL using acorrelation developed by Wallis for wave instability in horizontal stratified flow(Reference E-496). The Wallis correlation relates the void fraction in the pipe with thegas velocity at which waves "break' and are propelled down the pipe(Reference E-495). Figure 4.9-5 compares the Wallis correlation to UPTF data. Forthe UPTF data the void fraction is based on the "hutze" region of the hot leg. Asshown in Figure 4.9-5, there is reasonable agreement between the UPTF data and theWallis correlation. This suggests that the basic approach of this correlation appearscorrect for scaling.
The UPTF countercurrent flow data at a pressure of 1,500 kPa (218 psia) arecompared to computer analyses of UPTF Test 11 (see Figure 4.9-6). The computeranalyses were performed by LANL using TRAC, by Winfrith Technology Centre usingRELAP5/MOD2, and by GRS using ATHLET. Countercurrent flow behavior predictedwith TRAC-PF1/MOD1 version 14.3 exhibits a "bi-stable"-type of behavior. Specifically,the code predicted either complete turnaround or complete delivery rather than agradual CCFL boundary. MODI generally overpredicted the countercurrent water
4.9-3

flow. The analysis was repeated using different interfacial drag correlations in a pre-release version of TRAC-PF1/MOD2. The best results were obtained using a dragcorrelation developed by Ohnuki. As shown in Figure 4.9-6, the interfacial frictionfactors calculated with the Ohnuki correlation result in an improvement in the TRACpredictions. Specifically, the complete turnaround point is better predicted and theCCFL boundary is more gradual than the MODI predictions; however, thecountercurrent water flow is still significantly overpredicted. LANL concluded thatfurther improvements to TRAC are required to accurately predict countercurrent flow(Reference U-708).
As shown in Figure 4.9-6, RELAP5/MOD2 cycle 36.05 underpredicted the completeturnaround point by about a factor of three. This is attributed to the flow regime mapused in the code. Specifically, the flow regime map does not permit stratified flow inthe hot leg riser. Modification of RELAP5/MOD2 to allow stratified flow in the riserresulted in a better prediction of the test data; however, the code tended to predicteither complete turnaround or complete delivery, and generally overpredictedcountercurrent water flow (like TRAC-PF1/MOD1). Winfrith concluded that themodified version of RELAP5 overpredicted the countercurrent water flow because thecalculated water levels were incorrect (Reference E-621). To support this conclusion,Winfrith developed an experimental computer program which uses the samecorrelations as RELAP5/MOD2 but "integrates the momentum equations backwardsalong the hot leg from the pressure vessel to the riser" (Reference E-621). Thecalculated hot leg water levels were more realistic than those calculated with themodified version of RELAP5/MOD2. As shown in Figure 4.9-6, the resultingcountercurrent flow curve exhibits the same character as the UPTF data (i.e., agradual CCFL boundary). This suggests that RELAP5 could predict countercurrentflow more accurately if the code calculated more realistic liquid levels in the hot leg.
Figure 4.9-6 includes the countercurrent flow behavior predicted using a full-range drift-flux model incorporated in the ATHLET computer code. GRS developed the modelfrom the drift-flux and envelope theories (Reference G-924). As shown in Figure 4.9-6,the countercurrent flow behavior predicted by the code for the UPTF Test 11 is inclose agreement with the actual test data.
In addition to the comparisons described above, the UPTF results are compared totests at subscale facilities which simulated SBLOCAs. The facilities considered andtheir scales are listed in Table 4.9-1. These facilities demonstrated reflux condensationoccurs without apparent hold-up due to hot leg CCFL The conditions achieved inreflux condensation tests in the four subscale SBLOCA facilities are plotted inFigure 4.9-7. Figure 4.9-7 also shows the UPTF correlation and the data point for theUPTF conditions which simulated reflux condensation. This figure shows that althoughthe scaled facility conditions tend to be scattered about the graph, they are all wellwithin the CCFL boundary. The major conclusions, though, are that for all of thefacilities, the observation of reflux condensation without hold-up from hot leg CCFL
4.9-4
is consistent with the full-scale UPTF data, and that the subscale facilities did notdistort PWR hot leg behavior in a major phenomenological way (Reference U-904).
Also shown in Figure 4.9-7 is a band of "PWR conditions" which roughly envelopeSBLOCA reflux condensation conditions. This figure shows that the expected PWRconditions are well within the CCFL boundary. Accordingly, uninhibited water runbackto the reactor vessel is expected in a PWR during the reflux condensation portion ofan SBLOCA.
4.9-5
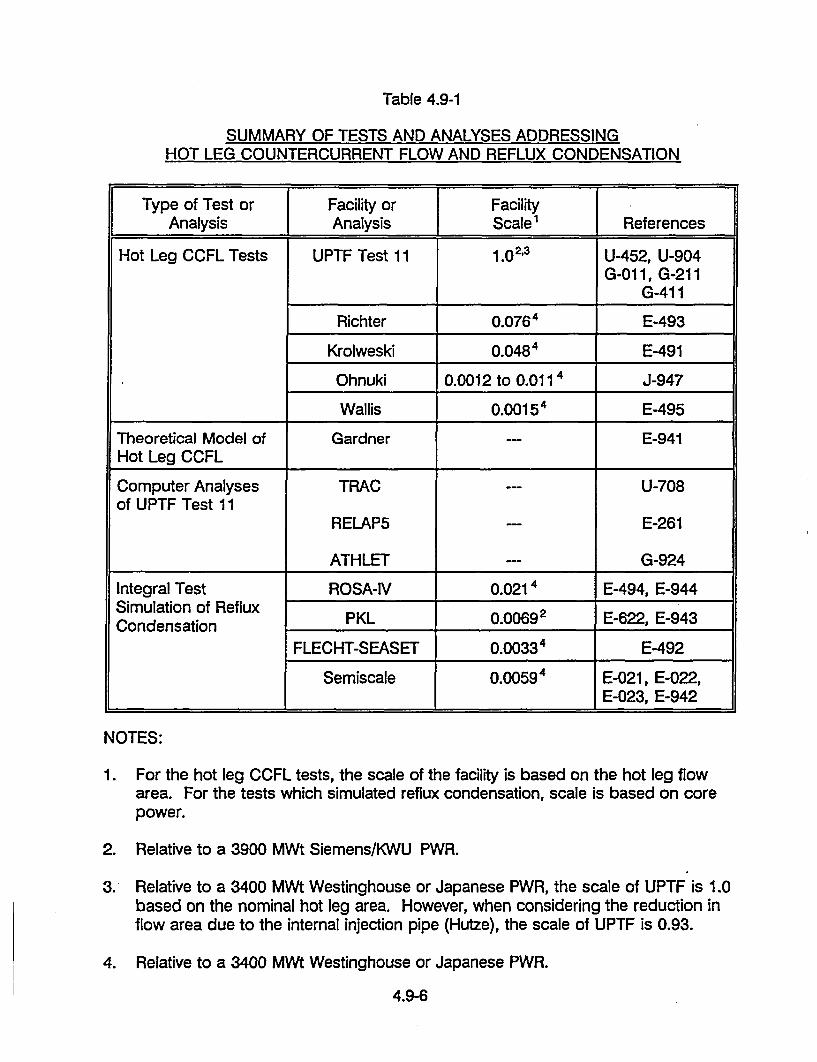
Table 4.9-1
SUMMARY OF TESTS AND ANALYSES ADDRESSINGHOT LEG COUNTERCURRENT FLOW AND REFLUX CONDENSATION
Type of Test or Facility or FacilityAnalysis Analysis Scale' References
Hot Leg CCFL Tests UPTF Test 11 1.02,3 U-452, U-904G-011, G-211
G-411
Richter 0.0764 E-493
Krolweski 0.0484 E-491
Ohnuki 0.0012 to 0.0114 J-947
Wallis 0.0015" E-495
Theoretical Model of Gardner E-941Hot Leg CCFL
Computer Analyses TRAC --- U-708of UPTF Test 11
RELAP5 E-261
ATHLET -- G-924
Integral Test ROSA-IV 0.0214 E-494, E-944Simulation of Reflux PKL 0.00692 E-622, E-943Condensation
FLECHT-SEASET 0.00334 E-492
Semiscale 0.00594 E-021, E-022,E-023, E-942
NOTES:
1. For the hot leg CCFL tests, the scale of the facility is based on the hot leg flowarea. For the tests which simulated reflux condensation, scale is based on corepower.
2. Relative to a 3900 MWt Siemens/KWU PWR.
3. Relative to a 3400 MWt Westinghouse or Japanese PWR, the scale of UPTF is 1.0based on the nominal hot leg area. However, when considering the reduction inflow area due to the internal injection pipe (Hutze), the scale of UPTF is 0.93.
4. Relative to a 3400 MWt Westinghouse or Japanese PWR.
4.9-6

Table 4.9-2
COMPARISON OF HOT LEG CCFL TESTS
Page 1 of 2
Facility Facility Pipe Diameter Test Conditions Comments ReferenceScale1 MM (inch) Pressure Gas
I A kPa (psia) Phase
UPTF Test 11 1.02'3 750 (29.5) 300 (44), Steam The UPTF hot leg U-4521,500 (218) contains an internal ECC U-904
injection pipe which G-011reduces the flow area by G-211about 10%. G-411
Richter 0.0764 203 (8) 100 (15) Air E-493to
110 (16)
Krolewski 0.00484 50.8 (2) Not Air Five different pipe E-491Available configurations were
used. The data used inthis analysis are from theexperiment with theclosest geometricsimulation of an actualhot leg.
Ohnuki 0.0012 25.4 (1.0) Not Air These experiments J-947to to Available Steam varied the length and
0.0114 76.2 (3.0) diameter of the horizontalpipe as well as the lengthof the inclined riser.

Table 4.9-2
COMPARISON OF HOT LEG CCFL TESTSPage 2 of 2
Facility Facility Pipe Diameter Test Conditions Comments
ScaleI MM (inch) Pressure Gas
kPa (psia) Phase
Wallis 0.00154 25.4 (1.0) NotAvailable
Air The pipe in theseexperiments is a 1"x1"rectangular pipe.
NOTES:
1. The scale of the facility is based on the hot leg flow area..Pip 2. Relative to a 3900 MWt Siemens/KWU PWR.
3. Relative to 3400 MWt Westinghouse or Japanese PWRS, the scale of UPTF is 1.0 based on the nominal hot leg area.However, when considering the reduction in flow area due to the internal injection pipe (Hutze), the scale of UPTF is0.93.
4. Relative to a 3400 MWt Westinghouse or Japanese PWR.
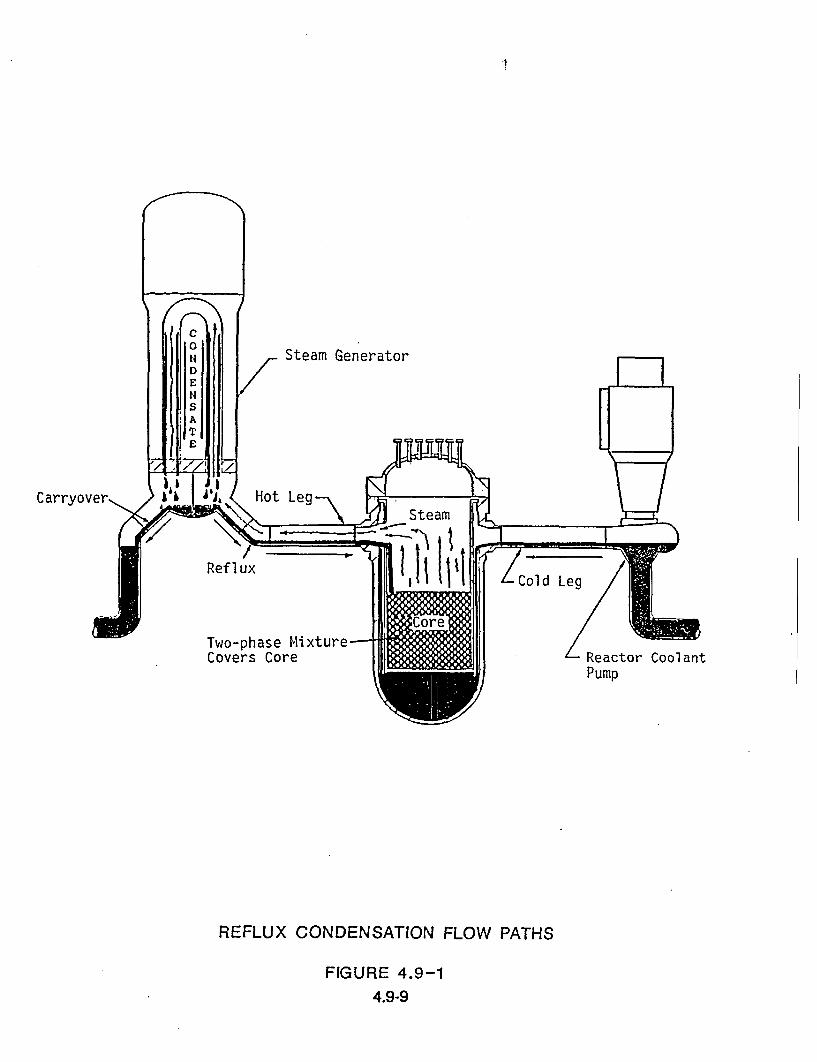
Steam Generator
Carryover,
Ref lux
Two-phase MixtureCovers Core
I Reactor CoolantPump
REFLUX CONDENSATION FLOW PATHS
FIGURE 4.9-1
4.9-9

0.6-
-O6
0.
0.5 0.7955- 1.1564 VJ
-Least Squares Fit to CCFL Data
0.4-
4! xS0.3. Data Point
~for Typical~PWR SBLOCA
Conditions
0.2-
0.1.
0.00.00 0.'05 0.'10 0.'15 0.'20
(Dimensionless Superficial Countercurrent Water Velocity) ý, jf*
Notes: I. The dimensionless superficial velocity, or Wallis'parameter,is defined as:
2. The flow area and hydraulic diameter used.to calculate thedimensionless superficial velocities are based on the "hutze"region of the hot leg. [A - 0.397m2 (616 in2); D - 639mm (25.2 in)]
STEAM/WATER FLOW RELATIONSHIPFROM UPTF HOT LEG SEPARATE EFFECTS TEST
(REFERENCE U-452)
FIGURE 4.9-2
4.9-10

U PTFD- 750 mm F
a-.50 I ISaturated i-*awale r ~
Steam -4 ---DI-
Richter et al.D - 203 min
4 5 0 D • a _•. - W a t e r
Air -- ----
OlmnukiD = 26/51/76 mmInclination anglecc = 4 50
Water
a
Water
alr
IV JfW Air
COMPARISON OF UPTF DATA TO THEORETICAL MODELSAND CORRELATIONS FROM SMALL-SCALE TESTS
FIGURE 4.9-3
4.9-11
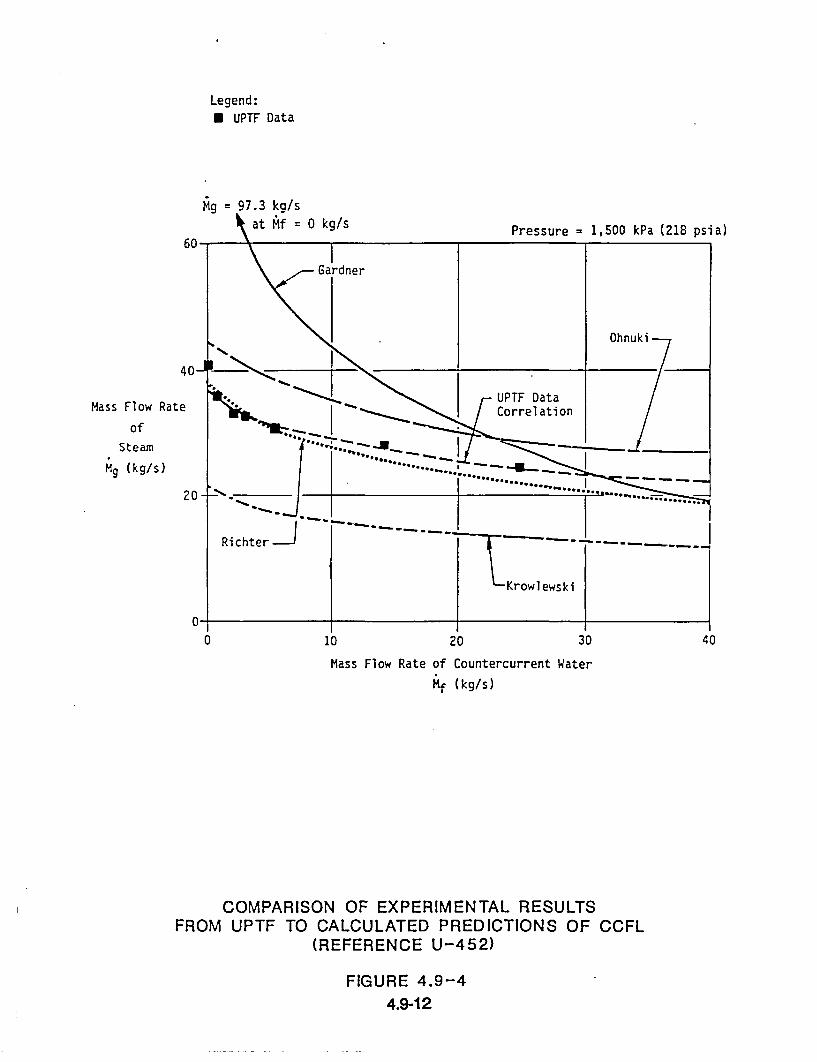
Legend:U UPTF Data
Pressure - 1,500 kPa (218 psia)
40
Mass Flow Rate
of
Steam
Mg (kg/s)
40
Mass Flow Rate of Countercurrent Water
Mf (kg/s)
COMPARISON OF EXPERIMENTAL RESULTSFROM UPTF TO CALCULATED PREDICTIONS OF CCFL
(REFERENCE U-452)
FIGURE 4.9-44.9-12

'-Location of Void Fractionat Hutze
UPTF LOOP 4 HOT LEG
Typical PWR SBLOCA RefluxSCondensation Point
0.6- Trend of UPTFCCFL DataLend I Legend:
0.5 -I X- 1,500 kPa UPI
1 0.4 - 300 kPa UPT"0.
0.3
0.2
0.1
0.0- I I I
0.0 0.1 0.2 0.3 0.4 0.5 0.6
Dimensionless Superficial Steam Velocity, jg*
COMPARISON OF UPTF VOID FRACTION MEASUREMENTSTO WALLIS FLOODING CORRELATION
(REFERENCE U-452)
FIGURE 4.9-54.9-13
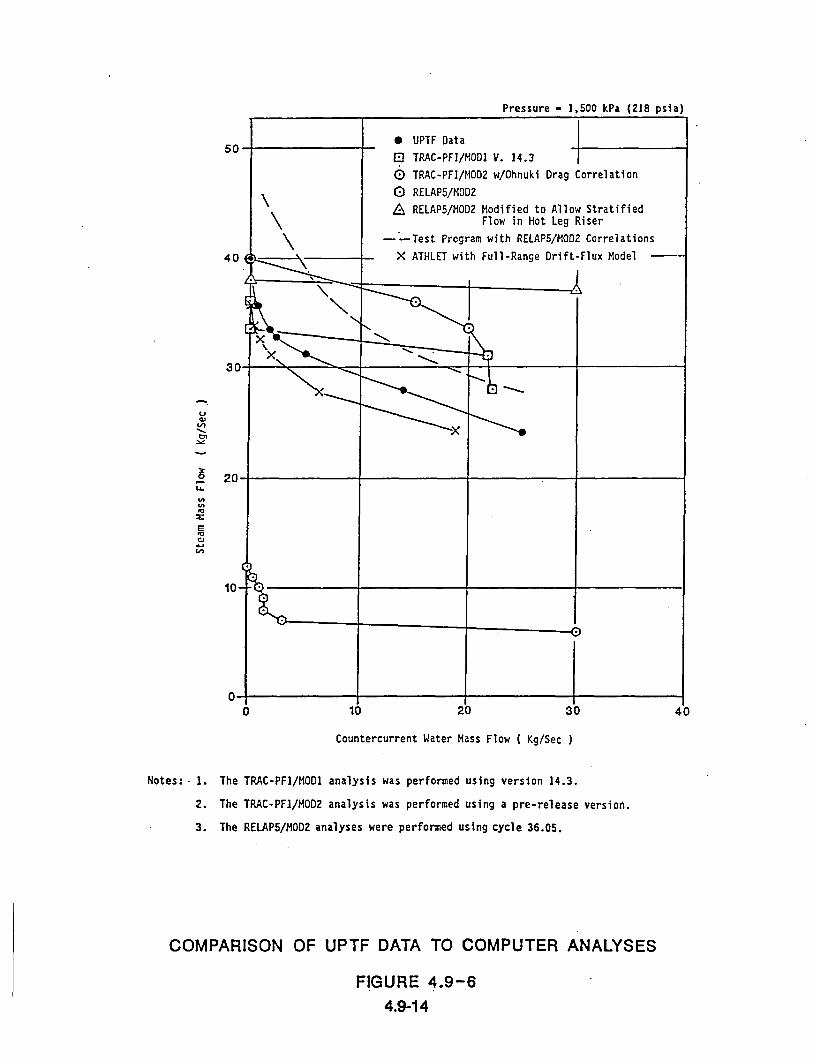
Pressure - 1,500 kPa (218 psia)
tn
Z4
Countercurrent Water Mass Flow ( Kg/Sec
Notes:- 1. The TRAC-PFI/MOD1 analysis was performed using version 14.3.
2. The TRAC-PFM/MOD2 analysis was performed using a pre-release version.
3. The RELAP5/MOD2 analyses were performed using cycle 36.05.
COMPARISON OF UPTF DATA TO COMPUTER ANALYSES
FIGURE 4.9-64.9-14

Reflux Condensation Datafrom UPTF and Scaled Facilities
x
UPTFFlecht-SeasetSemiscale
+ PKLA Rosa-IV LSTF
0.7
E
cc
U
C.
&n
In
Countercurrent Flow-(CCFL) Curve from-UPTF Full-Scale Test
00 0.1 0.2 0.3 0.4
Velocity) /2,Dimensionless Superficial Countercurent Water
COMPARISON OF SMALL-SCALE FACILITYREFLUX CONDENSATION EXPERIMENTAL RESULTS
TO UPTF TEST RESULTS(REFERENCE U-452)
FIGURE 4.9-74.9-15


Section 5
BIBLIOGRAPHY
This bibliography provides a comprehensive listing of reports prepared within the2D/3D Program and references to supporting material generated outside the2D/3D Program. Each document is assigned a four character code consisting of aletter and a three-digit number (i.e., A-###). The letter designates the origin of thedocument and the number indicates the type of document. These codes are definedbelow.
Letter PrefixesG Published by FRG within the 2D/3D ProgramJ Published by Japan within the 2D/3D ProgramU Published by US within the 2D/3D ProgramE External to 2D/3D Program
Numbers001201401601801901
- 200- 400- 600- 800- 900- 999
Data ReportsQuick Look ReportsEvaluation ReportsCode Analysis ReportsAdvanced Instrumentation ReportsPapers, Presentations, and Correspondence
NOTICE: Data generated in the 2D/3D International Program are only for use byauthorized users within the restrictions of the 2D/3D Program;consequently, distribution of reports which contain 2D/3D Program testdata (i.e., many of the reports listed in this bibliography) is restricted.
5-1
REPORTS AND PAPERS PUBLISHED BY FRG WITHIN 2D/3D PROGRAM
DATA REPORTS
UPTF
G-001 2D/3D Program Upper Plenum Test Facility Experimental Data Report,'Test No. 1 Fluid-Fluid Mixing Test," prepared by KWU, R 515/87/09, April1987.
G-002 2D/3D Program Upper Plenum Test Facility Experimental Data Report,'rTest No. 2 US/J PWR Integral Test with Cold Leg ECC Injection," preparedby Siemens/KWU, U9 316/88/5, April 1988.
G-003 2D/3D Program Upper Plenum Test Facility Experimental Data Report,'Test No. 3 GPWR Integral Test 5/8 Combined ECC Injection," prepared byKWU, R 515/87/14, August 1987.
G-004 2D/3D Program Upper Plenum Test Facility Experimental Data Report,'Test No. 4 US/J PWR Integral Test With Cold Leg ECC Injection,"prepared by Siemens/KWU, E314/90/004, April 1990.
G-005 2D/3D Program Upper Plenum Test Facility Experimental Data Report,'Test No. 5 Downcomer Separate Effect Test," prepared by KWU,R 515/87/16, September 1987.
G-006 2D/3D Program Upper Plenum Test Facility Experimental Data Report,'Test No. 6 Downcomer Countercurrent Flow Test," prepared bySiemens/KWU, U9 316/88/18, December 1988.
G-007 2D/3D Program Upper Plenum Test Facility Experimental Data Report,'Test No. 7 Downcomer Countercurrent Flow Test," prepared bySiemens/KWU, U9 316/89/14, 1989.
G-008 2D/3D Program Upper Plenum Test Facility Experimental Data Report,'Test No. 8 Cold/Hot Leg Flow Pattern Test," prepared by Siemens/KWU,U9 316/88/12, September 1988.
G-009 2D/3D Program Upper Plenum Test Facility Experimental Data Report,'Test No. 9 Cold/Hot Leg Flow Pattern Test," prepared by Siemens/KWU,U9 316/89/5, February 1989.
5-2
G-01 0 2D/3D Program Upper Plenum Test Facility Experimental Data Report,'Test No. 10 Tie Plate Countercurrent Flow Test," prepared. bySiemens/KWU, U9 316/88/1, February 1988.
G-01 1 2D/3D Program Upper Plenum Test Facility Experimental Data Report,'Test No. 11 Countercurrent Flow in PWR Hot Leg Test," prepared by KWU,R 515/87/10, May 1987.
G-012 2D/3D Program Upper Plenum Test Facility Experimental Data Report,'Test No. 12 Tie Plate Countercurrent Flow Test," prepared by KWU,R 515/86/14, November 1986.
G-01 3 2D/3D Program Upper Plenum Test Facility Experimental Data Report,'Test No. 13 Tie Plate Countercurrent Flow Test," prepared by KWU,U9 316/87/21, November 1987.
G-014 2D/3D Program Upper Plenum Test Facility Experimental Data Report,'Test No. 14 GPWR Integral Test with 5/8 Combined ECC Injection,"prepared by Siemens/KWU, E314/90/15, September 1990.
G-015 2D/3D Program Upper Plenum Test Facility Experimental Data Report,'Test No. 15 Tie Plate Countercurrent Flow Test," prepared bySiemens/KWU, U9 316/88/17, December 1988.
G-016 2D/3D Program Upper Plenum Test Facility Experimental Data Report,'Test No. 16 Tie Plate Countercurrent Flow Test," prepared bySiemens/KWU, E314/89/21, December 1989.
G-017 2D/3D Program Upper Plenum Test Facility Experimental Data Report,'Test No. 17 US/J-PWR Integral Test with Cold Leg ECC Injection,"prepared by Siemens/KWU, E314/89/18, November 1989.
G-01 8 2D/3D Program Upper Plenum Test Facility Experimental Data Report,'Tests No. 18 GPWR Integral Test with 5/8 Combined ECC Injection,"prepared by Siemens/KWU, U9 316/89/10, June 1989.
G-01 9 2D/3D Program Upper Plenum Test Facility Experimental Data Report,'Test No. 19 GPWR Integral Test with 5/8 Combined ECC Injection,"prepared by Siemens/KWU, U9 316/89/16, 1989.
G-020 2D/3D Program Upper Plenum Test Facility Experimental Data Report,'Test No. 20 Upper Plenum Injection Simulation Test," prepared bySiemens/KWU, U9 316/88/08, June 1988.
5-3
G-021 2D/3D Program Upper Plenum Test Facility Experimental Data Report,'Test No. 21 Downcomer Injection Test," prepared by Siemens/KWU,E314/90/17, October 1990.
G-022 2D/3D Program Upper Plenum Test Facility Experimental Data Report,'Test No. 22 Downcomer Injection Test with Vent Valves," prepared bySiemens/KWU, E314/91/007, March 1991.
G-023 2D/3D Program Upper Plenum Test Facility Experimental Data Report,'Test No. 23 Downcomer Injection Test with Vent Valves," prepared bySiemens/KWU, E314/91/001, January 1991.
G-024 2D/3D Program Upper Plenum Test Facility Experimental Data Report,'Test No. 24 Integral Test with Vent Valves," prepared by Siemens/KWU,E314/90/21, November 1990.
G-025 2D/3D Program Upper Plenum Test Facility Experimental Data Report,'Test No. 25 Downcomer/Cold Leg Steam/Water Interaction Test,"prepared by Siemens/KWU, E314/90/11, August 1990.
G-026 2D/3D Program Upper Plenum Test Facility Experimental Data Report,'Test No. 26 Hot Leg Flow Pattern Test," prepared by Siemens/KWU,E314/91/005, February 1991.
G-027 2D/3D Program Upper Plenum Test Facility Experimental Data Report,'Test No. 27 Integral Test with Cold Leg Injection," prepared bySiemens/KWU, E314/90/24, September 1990.
G-028 2D/3D Program Upper Plenum Test Facility Experimental Data Report,'Test No. 28 GPWR Integral Test with 7/8 Combined ECC Injection,"prepared by Siemens/KWU, E314/90/07, July 1990.
G-029 2D/3D Program Upper Plenum Test Facility Experimental Data Report,'Test No. 29 Entrainment/De-entrainment Test," prepared bySiemens/KWU, E314/90/05, June 1990.
G-030 2D/3D Program Upper Plenum Test Facility Experimental Data Report,'Test No. 30 Tie Plate Countercurrent Flow Test H-P Injection," prepared bySiemens/KWU, U9 316/89/9, April 1989.
5-4
QUICK LOOK REPORTS
G-201 2D/3D Program Upper Plenum Test Facility Quick Look Report, 'Test No.1 Fluid-Fluid Mixing Test," prepared by KWU, R 515/87/1, January 1987.
G-202 2D/3D Program Upper Plenum Test Facility Quick Look Report, 'Test No.2 US/J PWR Integral Test with Cold Leg ECC Injection," prepared bySiemens/KWU, U9 316/88/2, March 1988.
G-203 2D/3D Program Upper Plenum Test Facility Quick Look Report, 'Test No.3 GPWR Integral Test with 5/8 Combined ECC Injection," prepared byKWU, R 515/87/15, September 1987.
G-204 2D/3D Program Upper Plenum Test Facility Quick Look Report, 'Test No.4 US/J PWR Integral Test with Cold Leg ECC Injection," prepared bySiemens/KWU, E314/90/06, July 1990.
G-205 2D/3D Program Upper Plenum Test Facility Quick Look Report, 'Test No.5 Downcomer Separate Effect Test," prepared by KWU, U9 316/87/17,October 1987.
G-206 2D/3D Program Upper Plenum Test Facility Quick Look Report, 'Test No.6 Downcomer Countercurrent Flow Test," prepared by Siemens/KWU,U9 316/89/2, March 1989.
G-207 2D/3D Program Upper Plenum Test Facility Quick Look Report, 'T'est No.7 Downcomer Countercurrent Flow Test," prepared by Siemens/KWU,E314/90/003, March 1990.
G-208 2D/3D Program Upper Plenum Test Facility Quick Look Report, 'Test No.8 Cold/Hot Leg Flow Pattern Test," prepared by Siemens/KWU,U9 316/88/11, September 1988.
G-209 2D/3D Program Upper Plenum Test Facility Quick Look Report, 'Test No.9 Cold/Hot Leg Flow Pattern Test," prepared by Siemens/KWU,U9 316/89/6, March 1989.
G-21 0 2D/3D Program Upper Plenum Test Facility Quick Look Report, 'Test No.10 Tie Plate Countercurrent Flow Test," prepared by Siemens/KWU,U9 316/88/3, 1988.
5-5

G-211 2D/3D Program Upper Plenum Test Facility Quick Look Report, 'Test No.11 Countercurrent Flow in PWR Hot Leg Test," prepared by KWU,R 515/87/08, March 1987.
G-212 2D/3D Program Upper Plenum Test Facility Quick Look Report, 'Test No.12 Tie Plate Countercurrent Flow Test," prepared by KWU, R 515/86/13,October 1986.
G-213 2D/3D Program Upper Plenum Test Facility Quick Look Report, 'Test No.13 Tie Plate Countercurrent Flow Test," prepared by KWU, U9 316/87/22,December 1987.
G-214 2D/3D Program Upper Plenum Test Facility Quick Look Report, 'Test No.14 GPWR Integral Test with 5/8 Combined ECC Injection," prepared bySiemens/KWU, E314/90/14, September 1990.
G-215 2D/3D Program Upper Plenum Test Facility Quick Look Report, 'Test No.15 Tie Plate Countercurrent Flow Test," prepared by Siemens/KWU,U9 316/89/01, February 1989.
G-216 2D/3D Program Upper Plenum Test Facility Quick Look Report, 'Test No.16 Tie Plate Countercurrent Flow Test," prepared by Siemens/KWU,E314/89/22, December 1989.
G-217 2D/3D Program Upper Plenum Test Facility Quick Look Report, 'Test No.17 US/J PWR Integral Test with Cold Leg ECC Injection," prepared bySiemens/KWU, E314/89/20, December 1989.
G-218 2D/3D Program Upper Plenum Test Facility Quick Look Report, 'Test No.18 GPWR Integral Test with 5/8 Combined ECC Injection," prepared bySiemens/KWU, U9 316/89/11, June 1989.
G-219 2D/3D Program Upper Plenum Test Facility Quick Look Report, 'Test No.19 GPWR Integral Test with 5/8 Combined ECC Injection," prepared bySiemens/KWU, U9 316/89/16, October 1989.
G-220 2D/3D Program Upper Plenum Test Facility Quick Look Report, 'Test No.20 Upper Plenum Injection Simulation Test," prepared by Siemens/KWU,U9 316/88/07, June 1988.
G-221 2D/3D Program Upper Plenum Test Facility Quick Look Report, 'Test No.21 Downcomer Injection Test," prepared by Siemens/KWU, E314/90/16,September 1990.
5-6

G-222 2D/3D Program Upper Plenum Test Facility Quick Look Report, 'Test No.22 Downcomer Injection Test with Vent Valves," prepared bySiemens/KWU, E314/91/008, March 1991.
G-223 2D/3D Program Upper Plenum Test Facility Quick Look Report, 'Test No.23 Downcomer Injection Test with Vent Valves," prepared bySiemens/KWU, E314/90/25, December 1990.
G-224 2D/3D Program Upper Plenum Test Facility Quick Look Report, 'Test No.24 Integral Test with Vent Valves," prepared by Siemens/KWU,E314/90/22, September 1990.
G-225 2D/3D Program Upper Plenum Test Facility Quick Look Report, 'Test No.25 Downcomer/Cold Leg Steam/Water Interaction Test," prepared bySiemens/KWU, E314/90/13, September 1990.
G-226 2D/3D Program Upper Plenum Test Facility Quick Look Report, 'Test No.26 Hot Leg Flow Pattern Test," prepared by Siemens/KWU, E314/91/003,February 1991.
G-227 2D/3D Program Upper Plenum Test Facility Quick Look Report, 'Test No.27 US/J PWR Integral Test with Cold Leg ECC Injection," prepared bySiemens/KWU, E314/90/26, December 1990.
G-228 2D/3D Program Upper Plenum Test Facility Quick Look Report, 'Test No.28 GPWR Integral Test with 7/8 Combined ECC Injection," prepared bySiemens/KWU, E314/90/08, September 1990.
G-229 2D/3D Program Upper Plenum Test Facility Quick Look Report, 'Test No.29 Entrainment/De-entrainment Test," prepared by Siemens/KWU,E3114/90/19, November 1990.
G-230 2D/3D Program Upper Plenum Test Facility Quick Look Report, 'Test No.30 Tie Plate Countercurrent Flow Test HP-Injection," prepared bySiemens/KWU, E314/89/22, December 1989.
5-7

EVALUATION REPORTS
SCTF
G-401 Pointner, W., "Empirical Equation for the Entrainment in SCTF-Ill,"Gesellschaft fuer Reaktorsicherheit, GRS-A-1 404, January 1988.
UPTF
G-411 UPTF Summary Report (to be published).
G-412 2D/3D Program Upper Plenum Test Facility, "UPTF: Program and SystemDescription," prepared by Siemens/KWU, U9 414/88/023, November 1988.
G-413 2D/3D Program Upper Plenum Test Facility, 'Work Report: UPTF TestInstrumentation," prepared by KWU, R 515/85/23, September 1985.
G-414 Gehrmann, R., "Input to Test Objectives and Conditions for the UPTF VentValve Test No. 24 (Integral Test)," ASEA-Brown Boveri, ABB TechnicalReport No. GBRA 012023, June 6, 1989.
G-415 Glaeser, H., "Downcomer and Upper Tie Plate Countercurrent Flow in theUpper Plenum Test Facility," Gesellschaft fuer Reaktorsicherheit, GRS-A-1726, November 1990.
CODE ANALYSIS REPORTS
Karlstein Tests
G-601 Glaeser, H., and Schertel, H., "Analyses Der Karlstein-Dampf-Wasser-Gegenstromungsexperimente Mit TRAC-PF1 (11.1)," Gesellschaft fuerReaktorsicherheit, GRS-A-1 179, January 1986.
G-602 Glaeser, H., "Analysis of the Karlstein Saturated Water Tests on Steam-Water-Countercurrent Flow Using the Computer Code TRAC-PF1 (11.1,12.5)," Gesellschaft fuer Reaktorsicherheit, GRS-A-1249, July 1986.
CCTF Tests
G-611 Krey, L.,"Post Test Calculation of CCTF Test C2-20, Run 80 with the CodeSystem ATHLET/FLUT No. 8A," Technischer Ueberwachungs-VereinBayern e.V., Muenchen, October 1991.
5-8

SCTF Tests
G-621 Schwarz, S., "SCTF Vent Valve Test S3-17 (Run 721) BBR Coupling TestComparison to the TRAC Reactor Analysis," Gesellschaft fuerReaktorsicherheit, GRS-A-1471, July 1988.
G-622 Thiele, T.H., "Post Test Calculation of SCTF S3-11 (715) using FLUTNo. 6A," Pitscheider Report No. 9027, April 1990.
UPTF Tests - Pre-test Conditioning Calculations
G-631 Schwarz, S., "UPTF - Konditionierungsrechung Fuer ABB Vent Valve TestsDatensatz, Erfahrung und Endergebnis," Gesellschaft fuerReaktorsicherheit, GRS-A-1621, October 1989.
UPTF Test -- Post-test Analyses
G-641 Riegel, B., "Post Test Calculation of UPTF Test 8 with the AdvancedComputer Code TRAC-PF1/MODI," Gesellschaft fuer Reaktorsicherheit,GRS-A-1666, May 1990.
G-642 Riegel, B., "Post Test Calculation of UPTF Test 9 with the AdvancedComputer Code TRAC-PF1/MOD1," Gesellschaft fuer Reaktorsicherheit,GRS-A-1738, December 1990.
G-643 Sonnenburg, H.G., "Analysis of UPTF 11 (Hot Leg CCF) with a Full-RangeDrift Flux Model," Gesellschaft fuer Reaktorsicherheit, GRS-A-1681,June 1990.
G-644 Glaeser, H., "Post Test Calculations of UPTF Test 12 with the AdvancedComputer Code TRAC-PFI/MODI," Gesellschaft fuer Reaktorsicherheit,GRS-A-1727, November 1990.
G-645 Glaeser, H., "Post Test Calculation of UPTF Test 13 with the AdvancedComputer Code TRAC-PF1/MODI," Gesellschaft fuer Reaktorsicherheit,GRS-A-1728, November 1990.
G-646 Sonnenburg, H.G., "Analysis of UPTF - Test 26 Run 230 by ATHLET Codewith Full-Range Drift Flux Model," Gesellschaft fuer Reaktorsicherheit, GRS-A-1723, October 1990.
G-647 Hora, A., and Teschendorff, V., "Post Test Calculation of UPTF Test 5B withthe Computer Code FLUT," Gesellschaft fuer Reaktorsicherheit,GRS-A-1798, June 1991.
5-9
G-648 Gasteiger, H., "Post Test Calculation of UPTF Test 18 with the CodeSystem ATHLET/FLUT," Teschnischer Ueberwachungs-Verein Bayern e.V.,Muenchen, June 1991.
G-649 Thiele, T.H., "Post Test Calculation of UTPF Test No. 20 using CodeSystem ATHLET/MOD 1.0-Cycle C," Pitscheider Report No. 9058,December 18, 1990.
G-650 Thiele, T.H., "Post Test Calculation of UPTF Test 29A using Code SystemATHLET-FLUT, Version No. 8," Pitscheider Report No. 9055, November 13,1990.
GPWR Analyses
G-661 Riegel, B., "Calculation of a Double Ended Break in the Cold Leg of thePrimary Coolant Loop of a German Pressurized Water Reactor with a 5/8Emergency Cooling Injection (Calculated with TRAC-PF1/MOD1 (Version12.5))," Gesellschaft fuer Reaktorsicherheit, GRS-A-1322, February 1987.
G-662 Schwarz,S., "GPWR Analysis with TRAC PF1/MOD1 Version 12.5 BBR TypeReactor, 200% Cold Leg Pump Discharge Break EM-Conditions,"Gesellschaft fuer Reaktorsicherheit, GRS-A-1403, January 1988.
G-663 Hrubisko, M., "Calculation of a Double Ended Break in the Hot Leg of thePrimary Coolant Loop of a German Pressurized Water Reactor with a 5/8Emergency Coolant Injection (Calculated with TRAC-PF1I/MOD1Version 12.5)," Gesellschaftfuer Reaktorsicherheit, GRS-A-1 771, April 1991.
G-664 Gasteiger, H., "Calculation of a Double Ended Break in the Cold Leg of thePrimary Coolant Loop of a German Pressurized Water Reactor (GPWR) withthe Code System ATHLET/FLUT," Technischer Ueberwachungs-VereinBayern e.V., Muechen, December 1990.
ADVANCED INSTRUMENTATION REPORTS
G-801 Mewes, D., Laake, H.J., and Spatz, R., "Fluid Dynamic Effects in the Areaof the Tie Plate and the Spacer of the Fuel Elements Installed inPressurized Water Reactors," Institute for Process Technology, Universityof Hanover, March 1985.
G-802 "Calibration of the UPTF Tie Plate Flow Module with 'AdvancedInstrumentation' and Investigation of the Function from the Core SimulatorFeed Back Control System with Break-Thru-Detectors," prepared by KWU,R 917/86/002, April 1986.
5-10
G-803 Hampel, G., et. al., "Final Report on the 'Advanced Instrumentation' Study-2D/3D Project," Battelle-Frankfurt Institute, BF-R-64.525.2.
G-804 "UPTF-Instrumentation Control Document," Revision 1, prepared by KWU,April 1984.
G-805 Emmerling R., "Proposal for UPTF Tie-plate Mass Flow Algorithm,"KWU/R152, May 1984.
G-806 Emmerling, R., "Computer Program for the Determination of Steam/WaterMass Flow Rates through the Tie Plate," KWU, R115-85-el021,December 1985.
G-807 Gaul, H.P., "Status of UPTF Advanced Instrumentation and Systems FailureTime History," KWU Work-Report R515/86/10, July 30, 1986.
G-808 Gaul, H.P., and Hein, K.H., "UPTF Experiment: US AdvancedInstrumentation und Datenerfassungsanlage; Zusammenfassung derbearbeiteten Probleme fuer den Zeitraum- Februar 1985 - Januar 1986,"Arbeits-Bericht R515/86/6, March 5, 1986.
G-809 Gaul, H.P., and Wandzilak, L., "Ueberpruefung des PFM Algorithmus mitDummy Daten und Versuchsrechnungen," Arbeits-Bericht U9 316/88/16,September 27, 1988.
G-81 0 Gaul, H.P., and Schulz, N., Beschreibung der beim UPTF Pipe Flow Meteraufgetretenen Hardwareprobleme und durchgefuehrte Modifikationen ander Hardware," Arbeits-Bericht U9 316/88/10, June 20, 1988.
PAPERS, PRESENTATIONS, AND CORRESPONDENCE
Papers - Data Evaluation
G-901 Kroening, H., Hawighorst, A., and Mayinger, F., 'The Influence of FlowRestrictions on the Countercurrent Flow Behavior in the Fuel-Element TopNozzle Area," European Two-phase Flow Group Meeting, Paris-La-Defence,June 2-4, 1982.
G-902 Weiss, P., Sawitzki, M., and Winkler, F., "UPTF, a Full-scale PWR Loss-of-Coolant Accident Experiment Program," Atomkernenergie KerntechnikVol. 49 (1986), No. 1/2.
5-11
G-903 Hertlein, P.J., and Weiss, P.A., "UPTF Test Results - First Downcomer CCFTest," Proceedings of the Fifteenth Water Reactor Safety InformationMeeting, October 26-29, 1987, NUREG/CP-0091, Volume 4, pp. 533-547.
G-904 Weiss, P.A., "UPTF Experiment - Principal Experimental Results to be usedfor Improved LB LOCA Understanding," Proceedings of the Sixteenth WaterReactor Safety Research Information Meeting, October 24-28, 1988,NUREG/CP-0097, Volume 4, pp. 543-555.
G-905 Weiss, P., Watzinger, H., and Hertlein, R., "UPTF Experiment - A Synopsisof Full-Scale Test Results," presented at The Third International TopicalMeeting on Nuclear Power Plant Thermal-Hydraulics and Operations, Seoul,Korea, November 14-17, 1988.
G-906 Glaeser, H., "Analysis of Downcomer and Tie Plate Countercurrent Flow inthe Upper Plenum Test Facility (UPTF)," presented at the FourthInternational Topical Meeting on Nuclear Reactor Thermal-Hydraulics,Karlsruhe, FRG, October 10-13, 1989.
G-907 Liebert, J., and Weiss, P., "UPTF-Experiment - Effect of Full-Scale Geometryon Countercurrent Flow Behaviors in PWR Downcomer," presented at theFourth International Topical Meeting on Nuclear Reactor Thermal-Hydraulics, Karlsruhe, FRG, October 10-13, 1989.
G-908 Weiss, P., "UPTF-Experiment - Principal Full-Scale Test Results forEnhanced Knowledge of Large Break LOCA Scenarios in PWRs," presentedat the Fourth International Topical Meeting on Nuclear Reactor Thermal-Hydraulics, Karlsruhe, FRG, October 10-13, 1989.
G-909 Winkler, F., and Krebs, W., "Impact of 2D1/3D Project on LOCA LicensingAnalysis and Reactor Safety of PWRs," presented at the Fourth InternationalTopical Meeting on Nuclear Reactor Thermal-Hydraulics, Karlsruhe, FRG,October 10-13, 1989.
G-91 0 Weiss, P., "UPTF-Experiment - Full-Scale Test on Large Break LOCAThermal-Hydraulic Scenarios in PWR: Status & Findings," Proceedings ofthe Seventeenth Water Reactor Safety Research Information Meeting,October 22-25, 1989.
G-911 Emmerling, R., and Weiss, P., "UPTF-Experiment - Analysis of Flow Patternin Pipes of Large Diameter with Subcooled Water Injection," presented atthe European Two-Phase Flow Group Meeting, Paris, France, May 29-June 1, 1989.
5-12

G-912 "PWRs with Cold Leg or Combined ECC Injection -- Synopsis of TestResults," Handout G-2 from 2D/3D Coordination Meeting, Tokai-Mura,Japan, May 21-25, 1990.
G-913 Weiss, P.A., and Hertlein, R.J., "UPTF Test Results: First Three SeparateEffects Tests," Nuclear Engineering and Design Vol. 108, No. 1/2,pp. 249-263 (1988).
G-914 Weiss, P., Watzinger, H., and Hertlein, R., "UPTF Experiment: A Synopsisof Full Scale Test Results," Nuclear Engineering and Design, Vol. 122,No. 1, pp. 219-234 (1990). (Also see G-905.)
G-915 Glaeser, H., "Downcomer and Tie Plate Countercurrent Flow in the UpperPlenum Test Facility (UPTF)," Nuclear Engineering and Design, Vol. 133,pp. 259-283 (1992).
Papers - Code Analysis
G-921 Puetter, B., "50% Cold Leg Break in KWU Plant," presented at 2D/3DCoordination Meeting, Mannheim, FRG, June 18, 1985.
G-922 Plank, H., "Analyses of a Double-Ended Cold Leg Break of a 1300 MWKWU-PWR with TRAC-PFI/MOD1 (12.5)," presented at 2D/3D AnalysisMeeting, Erlangen, FRG, June 5-13, 1986.
G-923 Riegel, B., Plank, H., Uesch, K, "Multidimensional Representation of GPWRPrimary System in 200% LOCA Calculation," Proceedings of the FourteenthWater Reactor Safety Information Meeting, October 27-30, 1986,NUREG/CP-0082, Volume 4, pp. 499-521.
G-924 Sonnenburg, H.G., "Analysis of UPTF Test 11 (Hot Leg CCF) with Full-Range Drift-Flux Model," Proceedings of the Fifteenth Water Reactor SafetyInformation Meeting, October26-29, 1987, NUREG/CP-0091, Volume 4, pp.585-607.
G-925 Hertlein, R., and Herr, W., "A New Model for Countercurrent Flow in theUpper Part of a PWR Core," presented at the Fourth International TopicalMeeting on Nuclear Reactor Thermal-Hydraulics, Karlsruhe, FRG,October 10-13, 1989.
5-13
REPORTS AND PAPERS PUBLISHED BY JAERI WITHIN 2D/3D PROGRAM
DATA REPORTS
CCTF Core-I
J-001 "Data Report on Large Scale Reflood Test-1 -- CCTF Shakedown Test Cl -SHI (Run 005)," prepared by Japan Atomic Energy Research Institute,JAERI-Memo-8795, February 1980.
J-002 "Data Report on Large Scale Reflood Test-2 -- CCTF Shakedown Test C1-SH2 (Run 006)," prepared by Japan Atomic Energy Research Institute,JAERI-Memo-8797, February 1980.
J-003 "Data Report on Large Scale Reflood Test-3 -- CCTF Shakedown Test Cl -SH3 (Run 007)," prepared by Japan Atomic Energy Research Institute,JAERI-Memo-8931, June 1980.
J-004 "Data Report on Large Scale Reflood Test-4 -- CCTF Shakedown Test Cl -SH4 (Run 008)," prepared by Japan Atomic Energy Research Institute,JAERI-Memo-8932, June 1980.
J-005 "Data Report on Large Scale Reflood Test-5 - CCTF Shakedown Test C1-SH5 (Run 009)," prepared by Japan Atomic Energy Research Institute,JAERI-Memo-8933, June 1980.
J-006 "Data Report on Large Scale Reflood Test-10 -- CCTF C1-1 (Run 010),"prepared by Japan Atomic Energy Research Institute, JAERI-Memo-9997,March 1982.
J-007 "Data Report on Large Scale Reflood Test-11 -- CCTF Test C1-2(Run 011)," prepared by Japan Atomic Energy Research Institute, JAERI-Memo-57-156, July 1982.
J-008 "Data Report on Large Scale Reflood Test-12 -- CCTF Test C1-3(Run 012)," prepared by Japan Atomic Energy Research Institute, JAERI-Memo-57-175, July 1982.
J-009 "Data Report on Large Scale Reflood Test-13 -- CCTF Test C1-4(Run 013)," prepared by Japan Atomic Energy Research Institute, JAERI-Memo-57-210, August 1982.
5-14

J-01 0 "Data Report on Large Scale Reflood Test-14 - CCTF Test C1-5(Run 014)," prepared by Japan Atomic Energy Research Institute, JAERI-Memo-57-214, August 1982.
J-01 1 "Data Report on Large Scale Reflood Test-15 -- CCTF Test C1-6(Run 015)," prepared by Japan Atomic Energy Research Institute, JAERI-Memo-57-239, September 1982.
J-012 "Data Report on Large Scale Reflood Test-19 -- CCTF Test C1-7(Run 016)," prepared by Japan Atomic Energy Research Institute, JAERI-Memo-57-343, November 1982.
J-01 3 "Data Report on Large Scale Reflood Test-20 -- CCTF Test C1-8(Run 017)," prepared by Japan Atomic Energy Research Institute, JAERI-Memo-57-349, November 1982.
J-01 4 "Data Report on Large Scale Reflood Test-27 -- CCTF Test C1-9(Run 018)," prepared by Japan Atomic Energy Research Institute, JAERI-Memo-57-373, July 1982.
J-015 "Data Report on Large Scale Reflood Test-36 -- CCTF Test C1-10(Run 019)," prepared by Japan Atomic Energy Research Institute, JAERI-Memo-58-063, March 1983.
J-01 6 "Data Report on Large Scale Reflood Test-37 -- CCTF Test C1-11(Run 020)," prepared by Japan Atomic Energy Research Institute, JAERI-Memo-58-064, March 1983.
J-01 7 "Data Report on Large Scale Reflood Test-38 - CCTF Test C1-12(Run 021)," prepared by Japan Atomic Energy Research Institute, JAERI-Memo-58-065, March 1983.
J-01 8 "Data Report on Large Scale Reflood Test-53 -- CCTF Test C1-13(Run 022)," prepared by Japan Atomic Energy Research Institute, JAERI-Memo-59-031, February 1984.
J-01 9 "Data Report on Large Scale Reflood Test-54 - CCTF Test C1-14(Run 023)," prepared by Japan Atomic Energy Research Institute, JAERI-Memo-59-032, February 1984.
J-020 "Data Report on Large Scale Reflood Test 55 - CCTF Test C1-15(Run 024)," prepared by Japan Atomic Energy Research Institute, JAERI-Memo-59-033, February 1984.
5-15

J-021 "Data Report on Large Scale Reflood Test-56 -- CCTF Test Cl-16(Run 025)," prepared by Japan Atomic Energy Research Institute, JAERI-Memo-59-034, February 1984.
J-022 "Data Report on Large Scale Reflood Test-57 -- CCTF Test C1-17(Run 036)," prepared by Japan Atomic Energy Research Institute, JAERI-Memo-59-035, February 1984.
J-023 "Data Report on Large Scale Reflood Test-58 -- CCTF Test C1-18(Run 037)," prepared by Japan Atomic Energy Research Institute, JAERI-Memo-59-036, February 1984.
J-024 "Data Report on Large Scale Reflood Test-59 -- CCTF Test C1-19(Run 038)," prepared by Japan Atomic Energy Research Institute, JAERI-Memo-59-037, February 1984.
J-025 "Data Report on Large Scale Reflood Test-60 -- CCTF Test Cl-20(Run 039)," prepared by Japan Atomic Energy Research Institute, JAERI-Memo-59-038, February 1984.
J-026 "Data Report on Large Scale Reflood Test-61 -- CCTF Test C1-21(Run 040)," prepared by Japan Atomic Energy Research Institute, JAERI-Memo-59-039, February 1984.
J-027 "Data of CCTF Test C1-11 (Run 20), C1-19 (Run 38), and C1-20 (Run 039):Spool Piece Data," prepared by Japan Atomic Energy Research Institute,January 17, 1983.
J-028 "Data Report on Large Scale Reflood Test-62 -- CCTF Test Cl-22(Run 041)," prepared by Japan Atomic Energy Research Institute, JAERI-Memo-59-040, March 1984.
CCTF Core-Il
J-041 "Data Report on Large Scale Reflood Test-40 - CCTF Core-II Test C2-ACl(Run 051)," prepared by Japan Atomic Energy Research Institute, JAERI-Memo-58-150 May 1983.
J-042 "Data Report on Large Scale Reflood Test-41 - CCTF Core-Il Test C2-AC2(Run 052)," prepared by Japan Atomic Energy Research Institute, JAERI-Memo-58-154, May 1983.
5-16

J-043 "Data Report on Large Scale Reflood Test-42 -- CCTF Core-Il ShakedownTest C2-SH1 (Run 053)," prepared by Japan Atomic Energy ResearchInstitute, JAERI-Memo-58-166, May 1983.
J-044 "Data Report on Large Scale Reflood Test-43 -- CCTF Core-li ShakedownTest C2-SH2 (Run 054)," prepared by Japan Atomic Energy ResearchInstitute, JAERI-Memo-58-155, May 1983.
J-045 "Data Report on Large Scale Reflood Test-44 -- CCTF Test C2-1(Run 055)," prepared by Japan Atomic Energy Research Institute, JAERI-Memo-58-156, May 1983.
J-046 "Data Report on Large Scale Reflood Test-45 - CCTF Core-Il Test C2-2(Run 056)," prepared by.Japan Atomic Energy Research Institute, JAERI-Memo-58-157, May 1983.
J-047 "Data Report on Large Scale Reflood Test-77 -- CCTF Core-Il Test C2-AA1(Run 057)," prepared by Japan Atomic Energy Research Institute, JAERI-Memo-59-445, February 1985.
J-048 "Data Report on Large Scale Reflood Test-78 - CCTF Core-Il Test C2-AA2(Run 058)," prepared by Japan Atomic Energy Research Institute, JAERI-Memo-59-446, February 1985.
J-049 "Data Report on Large Scale Reflood Test-79 - CCTF Core-Il Test C2-AS1(Run 059)," prepared by Japan Atomic Energy Research Institute, JAERI-Memo-59-447, February 1985.
J-050 "Data Report on Large Scale Reflood Test-80 - CCTF Core-Il Test C2-AS2(Run 060)," prepared by Japan Atomic Energy Research Institute, JAERI-Memo-59-448, February 1985.
J-051 "Data Report on Large Scale Reflood Test-81 - CCTF Core-Il Test C2-3(Run 061)," prepared by Japan Atomic Energy Research Institute, JAERI-Memo-59-449, February 1985.
J-052 "Data Report on Large Scale Reflood Test-82 -- CCTF Core-Il Test C2-4(Run 062)," prepared by Japan Atomic Energy Research Institute, JAERI-Memo-59-450, February 1985.
J-053 "Data Report on Large Scale Reflood Test-83 -- CCTF Core-Il Test C2-5(Run 063)," prepared by Japan Atomic Energy Research Institute, JAERI-Memo-59-451, February 1985.
5-17
J-054 "Data Report on Large Scale Reflood Test-84 -- CCTF Core-Il Test C2-6(Run 064)," prepared by Japan Atomic Energy Research Institute, JAERI-Memo-59-452, February 1985.
J-055 "Data Report on Large Scale Reflood Test-85 -- CCTF Core-Il Test C2-7(Run 065)," prepared by Japan Atomic Energy Research Institute, JAERI-Memo-59-467, February 1985.
J-056 "Data Report on Large Scale Reflood Test-86 - CCTF Core-Il Test C2-8(Run 067)," prepared by Japan Atomic Energy Research Institute, JAERI-Memo-59-453, February 1985.
J-057 "Data Report on Large Scale Reflood Test-87 - CCTF Core-Il Test C2-9(Run 068)," prepared by Japan Atomic Energy Research Institute, JAERI-Memo-59-454, February 1985.
J-058 "Data Report on Large Scale Reflood Test-88 -- CCTF Core-Il Test C2-10(Run 069)," prepared by Japan Atomic Energy Research Institute, JAERI-Memo-59-455, February 1985.
J-059 "Data Report on Large Scale Reflood Test-89 -- CCTF Core-Il Test C2-11(Run 070)," prepared by Japan Atomic Energy Research Institute, JAERI-Memo-60-011, February 1985.
J-060 "Data Report on Large Scale Reflood Test-95 - CCTF Core-Il Test C2-12(Run 071)," prepared by Japan Atomic Energy Research Institute, JAERI-Memo-60-172, July 1985.
J-061 "Data Report on Large Scale Reflood Test-96 -- CCTF Core-Il Test C2-13(Run 072)," prepared by Japan Atomic Energy Research Institute, JAERI-Memo-60-157, July 1985.
J-062 "Data Report on Large Scale Reflood Test-97 - CCTF Core-Il Test C2-14(Run 074)," prepared by Japan Atomic Energy Research Institute, JAERI-Memo-60-173, July 1985.
J-063 "Data Report on Large Scale Reflood Test-98 - CCTF Core-Il Test C2-15(Run 075)," prepared by Japan Atomic Energy Research Institute, JAERI-Memo-60-191, August 1985.
J-064 "Data Report on Large Scale Reflood Test-99 - CCTF Core-Il Test C2-16(Run 076)," prepared by Japan Atomic Energy Research Institute, JAERI-Memo-60-158, February 1985.
5-18

J-065 "Data Report on Large Scale Reflood Test-1 00 -- CCTF Core-Il Test C2-17(Run 077)," prepared by Japan Atomic Energy Research Institute, JAERI-Memo-61-143, April 1986.
J-066 "Data Report on Large Scale Reflood Test-101 -- CCTF Core-Il Test C2-18(Run 078)," prepared by Japan Atomic Energy Research Institute, JAERI-Memo-60-223, August 1985.
J-067 "Data Report on Large Scale Reflood Test-128 - CCTF Core-Il Test C2-19(Run 079)," prepared by Japan Atomic Energy Research Institute, JAERI-Memo-63-081, March 1988.
J-068 "Data Report on Large Scale Reflood Test-1 29 -- CCTF Core-Il Test C2-20(Run 080)," prepared by Japan Atomic Energy Research Institute, JAERI-Memo-63-082, March 1988.
J-069 "Data Report on Large Scale Reflood Test-1 30 -- CCTF Core-Il Test C2-21(Run 081)," prepared by Japan Atomic Energy Research Institute, JAERI-Meremb-63-083, March 1988.
J-070 "Data Report on Major Experimental Results from CCTF Tests," preparedby Japan Atomic Energy Research Institute, JAERI-Memo-01-014.
SCTF Core-I
J-081 "Data Report on Large Scale Reflood Test-6 -- SCTF Test S1-SH1(Run 505)," prepared by Japan Atomic Energy Research Institute, JAERI-Memo-9939, February 1982.
J-082 "Data Report on Large Scale Reflood Test-7 -- SCTF Test S1-SH2(Run 506)," prepared by Japan Atomic Energy Research Institute, JAERI-Memo-9975, March 1982.
J-083 "Data Report on Large Scale Reflood Test-8 - SCTF Test S1-01 (Run 507),"prepared by Japan Atomic Energy Research Institute, JAERI-Memo-9976,March 1982.
J-084 "Data Report on Large Scale Reflood Test-9 - SCTF Test S1-02 (Run 508),"* prepared by Japan Atomic Energy Research Institute, JAERI-Memo-9977,
March 1982.
J-085 "Data Report on Large Scale Reflood Test-16 - SCTF Test S1-03(Run 509)," prepared by Japan Atomic Energy Research Institute, JAERI-Memo-57-318, November 1982.
5-19
J-086 "Data Report on Large Scale Reflood Test-17 - SCTF Test Si-04(Run 510)," prepared by Japan Atomic Energy Research Institute, JAERI-Memo-57-319, November 1982.
J-087 "Data Report on Large Scale Reflood Test-18 -- SCTF Test Si-05(Run 511)," prepared by Japan Atomic Energy Research Institute, JAERI-Memo-57-320, November 1982.
J-088 "Data Report on Large Scale Reflood Test-21 - SCTF Test S1-06 (Run512)," prepared by Japan Atomic Energy Research Institute, JAERI-Memo-57-350, November 1982.
J-089 "Data Report on Large Scale Reflood Test-22 - SCTF Test S1-07 (Run513)," prepared by Japan Atomic Energy Research Institute, JAERI-Memo-57-351, November 1982.
J-090 "Data Report on Large Scale Reflood Test-23 -- SCTF Test S1-08 (Run514)," prepared by Japan Atomic Energy Research Institute, JAERI-Memo-57-354, November 1982.
J-091 "Data Report on Large Scale Reflood Test-24 - SCTF Test S1-09 (Run515)," prepared by Japan Atomic Energy Research Institute, JAERI-Memo-57-355, November 1982.
J-092 "Data Report on Large Scale Reflood Test-25 -- SCTF Test Si-10 (Run516)," prepared by Japan Atomic Energy Research Institute, JAERI-Memo-57-365, December 1982.
J-093 "Data Report on Large Scale Reflood Test-26 - SCTF Test S1-11 (Run517)," prepared by Japan Atomic Energy Research Institute, JAERI-Memo-57-372, December 1982.
J-094 "Data Report on Large Scale Reflood Test-28 - SCTF Test S1-12 (Run518)," prepared by Japan Atomic Energy Research Institute, JAERI-Memo-57-380, December 1982.
J-095 "Data Report on Large Scale Reflood Test-33 - SCTF Test S1-13 (Run519)," prepared by Japan Atomic Energy Research Institute, JAERI-Memo-57-401, December 1982.
J-096 "Data Report on Large Scale Reflood Test-29 - SCTF Test S1-14 (Run520)," prepared by Japan Atomic Energy Research Institute, JAERI-Memo-57-381, December 1982.
5-20

J-097 "Data Report on Large Scale Reflood Test-30 -- SCTF Test S1-15 (Run521)," prepared by Japan Atomic Energy Research Institute, JAERI-Memo-57-382, December 1982.
J-098 "Data Report on Large Scale Reflood Test-31 -- SCTF Test Si-16 (Run522)," prepared by Japan Atomic Energy Research, Institute, JAERI-Memo-57-384, December 1982.
J-099 "Data Report on Large Scale Reflood Test-32 -- SCTF Test S1-17 (Run523)," prepared by Japan Atomic Energy Research Institute, JAERI-Memo-57-385, December 1982.
J-1 00 "Data Report on Large Scale Reflood Test-34 -- SCTF Test S1-18 (Run524)," prepared by Japan Atomic Energy Research Institute, JAERI-Memo-57-402, December 1982.
J-101 "Data Report on Large Scale Reflood Test-35 -- SCTF Test S1-19(Run 525)," prepared by Japan Atomic Energy Research Institute, JAERI-Memo-57-403, December 1982.
J-1 02 "Data Report on Large Scale Reflood Test-46 -- SCTF Test S1-SH3 (Run528)," prepared by Japan Atomic Energy Research Institute, JAERI-Memo-58-296, September 1983.
J-1 03 "Data Report on Large Scale Reflood Test-47 -- SCTF Test S1-SH4 (Run529)," prepared by Japan Atomic Energy Research Institute, JAERI-Memo-58-297, September 1983.
J-1 04 "Data Report on Large Scale Reflood Test-48 -- SCTF Test SI-20 (Run530)," prepared by Japan Atomic Energy Research Institute, JAERI-Memo-58-298, September 1983.
J-1 05 "Data Report on Large Scale Reflood Test-49 - SCTF Test SI-21 (Run531)," prepared by Japan Atomic Energy Research Institute, JAERI-Memo-58-311, September 1983.
J-1 06 "Data Report on Large Scale Reflood Test-50 -- SCTF Test Sl-22 (Run532)," prepared by Japan Atomic Energy Research Institute, JAERI-Memo-58-299, September 1983.
J-107 "Data Report on Large Scale Reflood Test-51 - SCTF Test S1-23 (Run536)," prepared by Japan Atomic Energy Research Institute, JAERI-Memo-58-300, September 1983.
5-21

J-108 "Data Report on Large Scale Reflood Test-52 - SCTF Test S1-24 (Run537)," prepared by Japan Atomic Energy Research Institute, JAERI-Memo-58-301, September 1983.
SCTF Core-Il
J-1 21 "Data Report on Large Scale Reflood Test-63 -- SCTF Test S2-AC1 (Run601)," prepared by Japan Atomic Energy Research Institute, JAERI-Memo-59-280, September 1984.
J-1 22 "Data Report on Large Scale Reflood Test-64 -- SCTF Test $2-AC2 (Run602)," prepared by Japan Atomic Energy Research Institute, JAERI-Memo-59-281, September 1984.
J-123 "Data Report on Large Scale Reflood Test-65 -- SCTF Test $2-AC3 (Run603)," prepared by Japan Atomic Energy Research Institute, JAERI-Memo-59-286, September 1984.
J-1 24 "Data Report on Large Scale Reflood Test-66 - SCTF Test S2-SHI (Run604)," prepared by Japan Atomic Energy Research Institute, JAERI-Memo-59-282, September 1984.
J-1 25 "Data Report on Large Scale Reflood Test-67 - SCTF Test $2-SH2 (Run605)," prepared by Japan Atomic Energy Research Institute, JAERI-Memo-59-287, September 1984.
J-1 26 "Data Report on Large Scale Reflood Test-68 - SCTF Test S2-01 (Run606)," prepared by Japan Atomic Energy Research Institute, JAERI-Memo-59-288, September 1984.
J-127 "Data Report on Large Scale Reflood Test-69 - SCTF Test S2-02 (Run607)," prepared by Japan Atomic Energy Research Institute, JAERI-Memo-59-283, September 1984.
J-1 28 "Data Report on Large Scale Reflood Test-70 -- SCTF Test S2-03 (Run608)," prepared by Japan Atomic Energy Research Institute, JAERI-Memo-59-432, January 1985.
J-1 29 "Data Report on Large Scale Reflood Test-71 - SCTF Test S2-04 (Run609)," prepared by Japan Atomic Energy Research Institute, JAERI-Memo-59-433, January 1985.
5-22

J-1 30 "Data Report on Large Scale Reflood Test-72 - SCTF Test S2-05 (Run610)," prepared by Japan Atomic Energy Research Institute, JAERI-Memo-59-434, February 1985.
J-1 31 "Data Report on Large Scale Reflood Test-73 - SCTF Test S2-06 (Run611)," prepared by Japan Atomic Energy Research Institute, JAERI-Memo-59-435, February 1985.
J-1 32 "Data Report on Large Scale Reflood Test-74 - SCTF Test S2-07 (Run612)," prepared by Japan Atomic Energy Research Institute, JAERI-Memo-59-436, February 1985.
J-1 33 "Data Report on Large Scale Reflood Test-75 -- SCTF Test S2-08 (Run613)," prepared by Japan Atomic Energy Research Institute, JAERI-Memo-59-437, February 1985.
J-1 34 "Data Report on Large Scale Reflood Test-76 -- SCTF Test S2-09 (Run614)," prepared by Japan Atomic Energy Research Institute, JAERI-Memo-59-438, February 1985.
J-135 "Data Report on Large Scale Reflood Test-90 - SCTF Test S2-10 (Run615)," prepared by Japan Atomic Energy Research Institute, JAERI-Memo-60-110, May 1985.
J-1 36 "Data Report on Large Scale Reflood Test-91 - SCTF Test S2-11 (Run616)," prepared by Japan Atomic Energy Research Institute, JAERI-Memo-60-111, May 1985.
J-1 37 "Data Report on Large Scale Reflood Test-92 -- SCTF Test S2-12 (Run617)," prepared by Japan Atomic Energy Research Institute, JAERI-Memo-60-112, May 1985.
J-1 38 "Data Report on Large Scale Reflood Test-93 -- SCTF Test S2-13 (Run618)," prepared by Japan Atomic Energy Research Institute, JAERI-Memo-60-113, May 1985.
J-1 39 "Data Report on Large Scale Reflood Test-94 - SCTF Test S2-14 (Run619)," prepared by Japan Atomic Energy Research Institute, JAERI-Memo-60-114, May 1985.
J-1 40 "Data Report on Large Scale Reflood Test-99 - SCTF Test S2-15 (Run620)," prepared by Japan Atomic Energy Research Institute, JAERI-Memo-60-258, October 1985.
5-23
J-141 "Data Report On .Large Scale Reflood Test-1l00 -. SCTF Test S2-16 (Run621)," prepared by Japan Atomic Energy Research Institute, JAERI-Memo-60-259, October 1985.
J-142 "Data Report on Large Scale'Reflood-Test'101 --:SCTF Test S2-17 (Run622)," prepared by Japan Atomic Energy Research Institute, JAERI-Memo-60-260, October 1985.
J-143:- "Data Report on Large Scale Reflood Test-102 - SCTF Test 82-18 (Run
" 623)," prepared by Japan Atomic Energy Research Institute, JAERI-Memo-60-268, October 1985.
J-1 44 .. "Data Report on Large Scale Reflood Test-103 ' SCTF Test S2-19 (Run
S.`624)," prepared by Japan Atomic Energy Research Institute, JAERI-Memo-60-269, October 1985.
J-1 45 "Data Report on Large Scale Reflood Test-104 - SCTF Test S2-21 (Run
626)," prepared by Japan Atomic Energy Research Institute,'JAERI-Memo-60-270, October 1985.
SCTF Core-Ill
J-1 51 "Data Report on Large Scale Reflood Test-105 - SCTF Test S3-SHI (Run
703)," prepared by Japan Atomic Energy Research Institute, JAERI-Memo-62-115, March 1987. . .
J-152 "Data Report on Large Scale Reflood Test-1 06 - SCTF, Test S3-SH2 (Run
704)," prepared by Japan Atomic Energy Research Institute, JAERI-Memo-62-116, March 1987. -.
J-1 53 "Data Report on Large Scale Reflood Test-107 -,SCTFTest S3-01 (Run
705)," prepared by Japan Atomic Energy Research Institute, JAERI-Memo-•. 62-117, March 1987. , ? ,, -
J-1 54 "Data Report on Large Scale Reflood Test-108 - SCTF Test S3-02 (Run
706)," prepared by Japan Atomic Energy Research Institute, JAERI-Memo-62-118,,March 1987.
J-1 55 "Data Report on Large Scale Reflood Test-1 09 " SCTF Test S3-03 (Run
707)," prepared by Japan Atomic Energy Research Institute, JAERI-Memo-62-119, March'1987. ."
5-24

J-1 56 "Data Report on Large Scale Reflood Test-1 10 -- SCTF Test S3-04 (Run708)," prepared by Japan Atomic Energy Research Institute, JAERI-Memo-62-120, March 1987.
J-1 57 "Data Report on Large Scale Reflood Test-1 11 -- SCTF Test S3-05 (Run709)," prepared by Japan Atomic Energy Research Institute, JAERI-Memo-62-121, March 1987.
J-1 58 "Data Report on Large Scale Reflood Test-1 12 - SCTF Test S3-06 (Run710)," prepared by Japan Atomic Energy Research Institute, JAERI-Memo-62-122, March 1987.
J-1 59 "Data Report on Large Scale Reflood Test-1 13 - SCTF Test S3-07 (Run711)," prepared by Japan Atomic Energy Research Institute, JAERI-Memo-62-123, March 1987.
J-1 60 "Data Report on Large Scale Reflood Test-1 14 - SCTF Test S3-08 (Run712)," prepared by Japan Atomic Energy Research Institute, JAERI-Memo-62-124, March 1987.
J-1 61 "Data Report on Large Scale Reflood Test-1 15 -- SCTF Test S3-09 (Run713)," prepared by Japan Atomic Energy Research Institute, JAERI-Memo-62-125, March 1987.
J-1 62 "Data Report on Large Scale Reflood Test-1 16 -- SCTF Test S3-10 (Run714)," prepared by Japan Atomic Energy Research Institute, JAERI-Memo-62-126, March 1987.
J-1 63 "Data Report on Large Scale Reflood Test-1 17 - SCTF Test S3-11 (Run715)," prepared by Japan Atomic Energy Research Institute, JAERI-Memo-63-076, March 1988.
J-1 64 "Data Report on Large Scale Reflood Test-1 18 - SCTF Test S3-12 (Run716)," prepared by Japan Atomic Energy Research Institute, JAERI-Memo-63-233, June 1988.
J-1 65 "Data Report on Large Scale Reflood Test-1 19 - SCTF Test S3-13 (Run717)," prepared by Japan Atomic Energy Research Institute, JAERI-Memo-63-077, March 1988.
J-1 66 "Data Report on Large Scale Reflood Test-120 - SCTF Test S3-14 (Run718)," prepared by Japan Atomic Energy Research Institute, JAERI-Memo-62-335, September 1987.
5-25
J-1 67 "Data Report on Large Scale Reflood Test-121 -- SCTF Test S3-15 (Run719)," prepared by Japan Atomic Energy Research Institute, JAERI-Memo-62-330, September 1987.
J-1 68 "Data Report on Large Scale Reflood Test-122 -- SCTF Test S3-16 (Run720)," prepared by Japan Atomic Energy Research Institute, JAERI-Memo-63-078, March 1988.
J-1 69 "Data Report on Large Scale Reflood Test-123 -- SCTF Test S3-17 (Run721)," prepared by Japan Atomic Energy Research Institute, JAERI-Memo-63-079, March 1988.
J-1 70 "Data Report on Large Scale Reflood Test-124 -- SCTF Test S3-18 (Run722)," prepared by Japan Atomic Energy Research Institute, JAERI-Memo-63-234, June 1988.
J-171 "Data Report on Large Scale Reflood Test-126 -- SCTF Test S3-20 (Run724)," prepared by Japan Atomic Energy Research Institute, JAERI-Memo-63-080, March 1988.
J-1 72 "Data Report on Large Scale Reflood Test-127 -- SCTF Test S3-21 (Run725)," prepared by Japan Atomic Energy Research Institute, JAERI-Memo-01-397, November 1989.
J-1 73 "Data Report on Large Scale Reflood Test-128 - SCTF Test S3-22 (Run726)," prepared by Japan Atomic Energy Research Institute, JAERI-Memo-01-065, March 1989.
QUICK LOOK REPORTS
CCTF Core-I
J-201 "Quick Look Report on Large Scale Reflood Test, Shakedown Test 1 --CCTF Test Ci-SH1 (Run 005)," prepared by Japan Atomic EnergyResearch Institute, JAERI-Memo-8641, January 1979.
J-202 "Quick Look Report on Large Scale Reflood Test, Shakedown Test 3 --CCTF Test C1-SH3 (Run 007)," prepared by Japan Atomic EnergyResearch Institute, JAERI-Memo-8930, June 1980.
J-203 "Quick Look Report on Large Scale Reflood Test, Shakedown Test 4 -CCTF Test CI-SH4 (Run 008)," prepared by Japan Atomic EnergyResearch Institute, JAERI-Memo-9149, October 1980.
5-26
J-204 "Quick Look Report on Large Scale Reflood Test-1 - CCTF Test Cl-i(Run 010)," prepared by Japan Atomic Energy Research Institute, JAERI-Memo-8453, August, 1979.
J-205 "Quick Look Report on Large Scale Reflood Test-2 - CCTF Test C1-2(Run 011)," prepared by Japan Atomic Energy Research Institute, JAERI-Memo-8530, October 1979.
J-206 "Quick Look Report on Large Scale Reflood Test-3 -- CCTF Test C1-3(Run 012)," prepared by Japan Atomic Energy Research Institute, JAERI-Memo-8538, November 1979.
J-207 "Quick Look Report on Large Scale Reflood Test-4 -- CCTF Test C1-4 (Run013)," prepared by Japan Atomic Energy Research Institute, JAERI-Memo-8685, February 1980.
J-208 "Quick Look Report on Large Scale Reflood Test-5 - CCTF Test C1-5(Run 014)," prepared by Japan Atomic Energy Research Institute, JAERI-Memo-8696, February 1980.
J-209 "Quick Look Report on Large Scale Reflood Test-6 -- CCTF Test C1-6(Run 015)," prepared by Japan Atomic Energy Research Institute, JAERI-Memo-8990, July 1980.
J-21 0 "Quick Look Report on Large Scale Reflood Test-7 -- CCTF Test C1-7 (Run016)," prepared by Japan Atomic Energy Research Institute, JAERI-Memo-8991, July 1980.
J-211 "Quick Look Report on Large Scale Reflood Test-8 -- CCTF Test C1-8 (Run017)," prepared by Japan Atomic Energy Research Institute, JAERI-Memo-8992, July 1980.
J-212 "Quick Look Report on Large Scale Refiood Test-9 - CCTF Test C1-9 (Run018)," prepared by Japan Atomic Energy Research Institute, JAERI-Memo-9125, September 1980.
J-213 "Quick Look Report on Large Scale Reflood Test-I0 -- CCTF Test 01-10(Run 019)," prepared by Japan Atomic Energy Research Institute, JAERI-Memo-9207, November 1980.
J-214 "Quick Look Report on Large Scale Reflood Test-1 1 -- CCTF Test C1-11(Run 020)," prepared by Japan Atomic Energy Research Institute, JAERI-Memo-9208, November 1980.
5-27

J-215 "Quick Look Report on Large Scale Reflood Test-12 -- CCTF Test C1-12(Run 021)," prepared by Japan Atomic Energy Research Institute, JAERI-Memo-9270, January 1981.
J-216 "Quick Look Report on Large Scale Reflood Test-13 -- CCTF Test Cl-13(Run 022)," prepared by Japan Atomic Energy Research Institute, JAERI-Memo-9282, January 1981.
J-217 "Quick Look Report on Large Scale Reflood Test-14 -- CCTF Test 01-14(Run 023)," prepared by Japan Atomic Energy Research Institute, JAERI-Memo-9305, February 1981.
J-21 8 "Quick Look Report on Large Scale Reflood Test-15 -- CCTF Test C1-15(Run 024)," prepared by Japan Atomic Energy Research Institute, JAERI-Memo-9329, February 1981.
J-219 "Quick Look Report on Large Scale Reflood Test-1 6 -- CCTF Test C1-16(Run 025)," prepared by Japan Atomic Energy Research Institute, JAERI-Memo-9349, March 1981.
J-220 "Quick Look Report on Large Scale Reflood Test-18 -- CCTF Test C1-17(Run 036)," prepared by Japan Atomic Energy Research Institute, JAERI-Memo-9712, October 1981.
J-221 "Quick Look Report on Large Scale Reflood Test-19 -- CCTF Test Cl-18(Run 037)," prepared by Japan Atomic Energy Research Institute, JAERI-Memo-9713, October 1981.
J-222 "Quick Look Report on Large Scale Reflood Test-23 -- CCTF Test Cl-19(Run 038)," prepared by Japan Atomic Energy Research Institute, JAERI-Memo- 9767, November 1981.
J-223 "Quick Look Report on Large Scale Reflood Test-24 -- CCTF Test- Cl -20(Run 039)," prepared by Japan Atomic Energy Research Institute, JAERI-Memo-9768, November 1981.
J-224 "Quick Look Report on Large Scale Reflood Test-29 -- CCTF Test Cl-21(Run 040)," prepared by Japan Atomic Energy Research Institute, JAERI-Memo-9903, January 1982.
J-225 "Quick Look Report on Large Scale Reflood Test-30 -- CCTF Test Cl-22(Run 041)," prepared by Japan Atomic Energy Research Institute, JAERIMemo 9904, February 1982.
5-28

CCTF Core-Il
J-241 "Quick Look Report on Large Scale Core-Il Reflood Test, First ShakedownTest C2-SH1 (Run 53)," prepared by Japan Atomic Energy ResearchInstitute, JAERI-Memo-57-397, December 1982.
J-242 "Quick Look Report on CCTF Core-Il Reflood Test, Second ShakedownTest, C2-SH2 (Run 54)," prepared by Japan Atomic Energy ResearchInstitute, JAERI-Memo-57-391, December 1982.
J-243 "Quick Look Report on CCTF Core-li Reflood Test C2-1 (Run 55),"prepared by Japan Atomic Energy Research Institute, JAERI-Memo-57-392,December 1982.
J-244 "Quick Look Report on CCTF Core-Il Reflood Test C2-2 (Run 56),"prepared by Japan Atomic Energy Research Institute, JAERI-Memo-57-393,December 1982.
J-245 "Quick Look Report on CCTF Core-If Reflood Test C2-AA1 (Run 57) --Investigation of the Reflood Phenomena Under Upper Plenum InjectionCondition," prepared by Japan Atomic Energy Research Institute, JAERI-Memo-58-415, November, 1983.
J-246 "Quick Look Report on CCTF Core-Il Reflood Test C2-AA2 (Run 58) --Investigation of Downcomer Injection Effects," prepared by Japan AtomicEnergy Research Institute, JAERI-Memo-58-386, October 1983.
J-247 "Quick Look Report on CCTF Core-Il Reflood Test, C2-ASi (Run 59) --Investigation on the Reflood Phenomena Under Upper Plenum InjectionCondition," prepared by Japan Atomic Energy Research Institute, JAERI-Memo-58-416, November 1983.
J-248 "Quick Look Report on CCTF Core-Il Reflood Test C2-AS2 (Run 60) --Effect of Vent Valve Type ECCS.1," prepared by Japan Atomic EnergyResearch Institute, JAERI-Memo-58-459, January 1984.
J-249 "Quick Look Report on CCTF Core-li Reflood Test C2-3 (Run 61) -Investigation of Initial Downcomer Water Accumulation Rate Effects,"prepared by Japan Atomic Energy Research Institute, JAERI-Memo-58-460,January 1984.
J-250 "Quick Look Report on CCTF Core-Il Reflood Test C2-4 (Run 62) --Investigation of Reproducibility," prepared by Japan Atomic EnergyResearch Institute, JAERI-Memo-58-479, January 1984.
5-29
J-251 "Quick Look Report on CCTF Core-Il Reflood Test, C2-5 (Run 63) --Investigation of the Reflood Phenomena Under Low Power Condition,"prepared by Japan Atomic Energy Research Institute, JAERI-Memo-59-046,February 1984.
J-252 "Quick Look Report on CCTF Core-Il Reflood Test, C2-6 (Run 64) -- Effectof Radial Power Profile," prepared by Japan Atomic Energy ResearchInstitute, JAERI-Memo-59-012, February 1984.
J-253 "Quick Look Report on CCTF Core-Il Reflood Test, C2-7 (Run 65) --Calibration Test," prepared by Japan Atomic Energy Research Institute,JAERI-Memo-59-047, February 1984.
J-254 "Quick Look Report on CCTF Core-Il Reflood Test, C2-8 (Run 67) --Effectof Systems Pressure," prepared by Japan Atomic Energy ResearchInstitute, JAERI-Memo-59-028, February 1984.
J-255 "Quick Look Report on CCTF Core-Il Reflood Test C2-9 (Run 68) - Effectof LPCI Flow Rate," prepared by Japan Atomic Energy Research Institute,JAERI-Memo-59-048, February 1984.
J-256 "Quick Look Report on CCTF Core-Il Reflood Test C2-1 0 (Run 69) -- Effectof Vent Valve Type ECCS 2," prepared by Japan Atomic Energy ResearchInstitute, JAERI-Memo-59-029, February 1984.
J-257 "Quick Look Report on CCTF Core-li Reflood Test C2-11 (Run 70) --Investigation of the End-of-Bypass and Refill Phenomena Under theCondition of Loop Isolations," prepared by Japan Atomic Energy ResearchInstitute, JAERI Memo-59-013, February 1984.
J-258 "Quick Look Report on CCTF Core-Il Reflood Test C2-12 (Run 71) -- BestEstimate Reflood Experiment," prepared by Japan Atomic Energy ResearchInstitute, JAERI Memo-59-326, October 1984.
J-259 "Quick Look Report on CCTF Core-Il Reflood Test, C2-13(Run 72) - Investigation of the Reflood Phenomena for No LPCI PumpFailure Simulation Upper Plenum Injection Test," prepared by Japan AtomicEnergy Research Institute, JAERI-Memo-59-416, January 1985.
J-260 "Quick Look Report on CCTF Core-II Reflood Test C2-14 (Run 74) --Investigation of the Refill Phenomena and Its Effect on the RefloodingBehavior," prepared by Japan Atomic Energy Research Institute, JAERI-Memo-59-352, October 1984.
5-30
J-261 "Quick Look Report on CCTF Core-Il Reflood Test C2-15 (Run 75) --Investigation of FLECHT-SET Coupling Test Results," prepared by JapanAtomic Energy Research Institute, JAERI-Memo-60-255, September 1985.
J-262 "Quick Look Report on CCTF Core-li Reflood Test C2-16 (Run 76) - Effectof Asymmetric Upper Plenum Injection on Reflood Phenomena," preparedby Japan Atomic Energy Research Institute, JAERI-Memo-60-142, June1985.
J-263 "Quick Look Report on CCTF Core-Il Reflood Test C2-17 (Run 77) --Investigation of the Refill Phenomena with Core Reversal Steam Flow,"prepared by Japan Atomic Energy Research Institute, JAERI- Memo-61-136, May 1986.
J-264 "Quick Look Report on CCTF Core-Il Reflood Test C2-18 (Run 78) -- BestEstimated Refill/Reflood Upper Plenum Injection Test," prepared by JapanAtomic Energy Research Institute, JAERI-Memo-60-372, December 1985.
SCTF Core-I
J-281 "Quick Look Report on Large Scale Reflood Test-17 -- SCTF Test SI-SHI(Run 505)," prepared by Japan Atomic Energy Research Institute, JAERI-Memo-9702, September 1981.
J-282 "Quick Look Report on Large Scale Reflood Test-20 -- SCTF Test S1-SH2(Run 506)," prepared by Japan Atomic Energy Research Institute, JAERI-Memo-9732, October 1981.
J-283 "Quick Look Report on Large Scale Reflood Test-22 - SCTF Test S1-02(Run 508)," prepared by Japan Atomic Energy Research Institute, JAERI-Memo-9734, November 1981.
J-284 "Quick Look Report on Large Scale Reflood Test-25 - SCTF Test Si-03(Run 509)," prepared by Japan Atomic Energy Research Institute, JAERI-Memo-9803, November 1981.
J-285 "Quick Look Report on Large Scale Reflood Test-26 - SCTF Test SI-04(Run 510), prepared by Japan Atomic Energy Research Institute, JAERI-Memo-9804, November 1981.
J-286 "Quick Look Report on Large Scale Reflood Test-27 -- SCTF Test S1-05(Run 511)," prepared by Japan Atomic Energy Research Institute, JAERI-Memo-9805, November 1981.
5-31

J-287 "Quick Look Report on Large Scale Reflood Test-28 -- SCTF Test S1-06(Run 512)," prepared by Japan Atomic Energy Research Institute, JAERI-Memo-9806, November 1981.
J-288 "Quick Look Report on Large Scale Reflood Test-31 -- SCTF Test S1-07(Run 513)," prepared by Japan Atomic Energy Research Institute, JAERI-Memo-57-176, July 1982.
J-289 "Quick Look Report on Large Scale Reflood Test-32 -- SCTF Test Sl-08(Run 514)," prepared by Japan Atomic Energy Research Institute, JAERI-Memo-57-177, July 1982.
J-290 "Quick Look Report on Large Scale Reflood Test-33 -- SCTF Test S1-09(Run 515)," prepared by Japan Atomic Energy Research Institute, JAERI-Memo-57-178, July 1982.
J-291 "Quick Look Report on Large Scale Reflood Test 34 -- SCTF Test S1-10(Run 516)," prepared by Japan Atomic Energy Research Institute, JAERI-Memo-57-179, July 1982.
J-292 "Quick Look Report on Large Scale Reflood Test-35 -- SCTF Test S1-11(Run 517)," prepared by Japan Atomic Energy Research Institute, JAERI-Memo-57-180, July 1982.
EVALUATION REPORTS
CCTF Core-I
J-401 "Evaluation Report on CCTF Core-I Reflood Test Cl-SH5 (Run 009) --Investigation of the PKL Coupling Test," prepared by Japan Atomic EnergyResearch Institute, JAERI-Memo-9965, February 1982.
J-402 "Evaluation Report on CCTF Core-I Reflood Test Cl-i (Run 010)Investigation of the Loop Flow Resistance Effect," prepared by JapanAtomic Energy Research Institute, JAERI-Memo-9966, February 1982(publicly released as JAERI-M-83-140, September 1983).
J-403 "Evaluation Report on CCTF Core-I Reflood Tests Cl -2 (Run 11) and C1-11(Run 20) - Reproducibility Test," prepared by Japan Atomic EnergyResearch Institute, JAERI-Memo-57-048, March 1982.
5-32

J-404 "Evaluation Report on CCTF Core-I Reflood Tests C1-2 (Run 11) and C1-11(Run 20) - Effect of the Installment of the Baffle Plates in the Control RodGuide Tubes and the Spool Piece in the Primary Loops," prepared byJapan Atomic Energy Research Institute, JAERI-M-83-094, June 1983.
J-405 "Evaluation Report on CCTF Core-I Reflood Tests C1-2 (Run 11) and C1-3(Run 12) - Effects of Initial Downcomer Wall Temperature on SystemBehavior of a PWR during Reflood Phase of a Loss-Of-Coolant Accident,"prepared by Japan Atomic Energy Research Institute, JAERI-Memo-9925,January 1982.
J-406 "Evaluation Report on CCTF Core-I Reflood Tests C1-2 (Run 11) and C1-3(Run 12) -- Effects of Initial Superheat of the Downcomer Wall," preparedby Japan Atomic Energy Research Institute, JAERI-M-83-090, June 1983.
J-407 "Evaluation Report on CCTF Core-I Reflood Test C1-4 (Run 13) and C1-15(Run 24) -- Investigation of the Refill Simulation and the Nitrogen InjectionEffects," prepared by Japan Atomic Energy Research Institute, JAERI-Memo-9967, February 1982 (publicly released as JAERI-M-83-121, August1983).
J-408 "Evaluation Report on CCTF Core-I Reflood Test C1-5 (Run 14) -- OverallSystem Thermo-Hydrodynamic Behavior Observed in the Base Case Test,"prepared by Japan Atomic Energy Research Institute, JAERI-Memo-57-051,March, 1982 (publicly released as JAERI-M-83-207, February 1983).
J-409 "Evaluation Report on CCTF Core-I Reflood Tests C1-5 (Run 14), C1-10(Run 19) and C1-12 (Run 21) - Effects of Containment Pressure on SystemBehaviors During Reflood Phase of a LOCA," prepared by Japan AtomicEnergy Research Institute, JAERI-Memo-57-013, February 1982 (publiclyreleased as JAERI-M-83-091, June 1983).
J-410 "Evaluation Report on CCTF Core-I Reflood Tests C1-5 (Run 14), C1-17(Run 36) and Cl-20 (Run 39) - Core Thermo-Hydrodynamics andThermally Multidimensional Effects On It," prepared by Japan AtomicEnergy Research Institute, JAERI-Memo-57-052, March 1982.
J-411 "Evaluation Report on CCTF Core-I Reflood Tests C1-6 (Run 15), C1-9 (Run18), C1-11 (Run 20) and C1-13 (Run 22) - Effects of ECC Water InjectionRate," prepared by Japan Atomic Energy Research Institute, JAERI-Memo-57-018, March 1982 (publicly released as JAERI-M-83-044).
5-33
J-412 "Evaluation Report on CCTF Core-I Reflood Tests C1-7 (Run 16) and C1-14(Run 23) -- Effects of Initial Clad Temperature," prepared by Japan AtomicEnergy Research Institute, JAERI-Memo-9953, February 1982 (publiclyreleased as JAERI-M-83-026).
J-413 "Evaluation Report on CCTF Core-I Reflood Tests C1-18 (Run 37) and C1-8(Run 17) -- Investigation of the Effect of Water Remaining in the Loop SealSection on Reflood Behavior," prepared by Japan Atomic Energy ResearchInstitute, JAERI-Memo-9996, February 1982 (publicly released as JAERI-M-83-115, July 1983).
J-414 "Evaluation Report on CCTF Core-I Reflood Tests C1-16 (Run 25), C0-21(Run 40) and C0-22 (Run 41) -- Comparison of the FLECHT-SET TestResults With The FLECHT Coupling Test Results," prepared by JapanAtomic Energy Research Institute, JAERI-Memo-57-014, March 1982(publicly released as JAERI-M-83-065, May 1983).
J-415 "Evaluation Report on CCTF Core-I Reflood Tests C1-17 (Run 36) andC1-20 (Run 39)," prepared by Japan Atomic Energy Research Institute,JAERI-M-83-028, February 1983.
J-416 "Evaluation Report on CCTF Core-I Reflood Test C1-19 (Run 38) --Experimental Assessment of the Evaluation Model For the Safety Analysison the Reflood Phase of a PWR LOCA," prepared by Japan Atomic EnergyResearch Institute, JAERI-Memo-57-053, March, 1982 (publicly released asJAERI-M-83-029, February 1983).
J-417 "Development of the Model for the Mass Balance Calculation of the CCTFTest - The Estimation of the Core Inlet Mass Flow Rate," prepared byJapan Atomic Energy Research Institute, JAERI-Memo-9936, January 1982.
J-41 8 "Analysis Report on CCTF Core-I Reflood Tests," prepared by JapanAtomic Energy Research Institute, JAERI-Memo-57-057, March 1982.
J-419 "Large Scale Reflood Test With Cylindrical Core Test Facility (CCTF) -Core-I FY 1979 Tests," prepared by Japan Atomic Energy ResearchInstitute, JAERI-Memo-82-002, March 1982.
J-420 "CCTF Core-I Test Results," prepared by Japan Atomic Energy ResearchInstitute, JAERI-M-82-073, July 1982.
J-421 "Findings in CCTF Core-I Test," prepared by Japan Atomic EnergyResearch Institute, JAERI-Memo-58-050, February 1983.
5-34

J-422 "Results of Downcomer CCFL Experiment," prepared by Japan AtomicEnergy Research Institute, JAERI-Memo-59-245, August 1984.
CCTF Core-Il
J-441 "Evaluation of CCTF Core-Il Acceptance Test-1 (Run 051)," prepared byJapan Atomic Energy Research Institute, JAERI-Memo-57-275, October1982.
J-442 "Evaluation Report on CCTF Core-Il Reflood Tests C2-ACl (Run 51) andC2-4 (Run 62) -- Effect of Initial Clad Temperature," prepared by JapanAtomic Energy Research Institute, JAERI-M-84-026, February 1984.
J-443 "Evaluation of CCTF Core-Il Acceptance Test 2 (Run 052)," prepared byJapan Atomic Energy Research Institute, JAERI-Memo-57-375, November1982.
J-444 "Evaluation of CCTF Core-Il Second Acceptance Test C2-AC2 (Run 052) -- Investigation of Difference in Reflooding Behaviors Between Core-I andCore-Il Facilities," prepared by Japan Atomic Energy Research Institute,JAERI-M-84-036, March 1984.
J-445 "Evaluation Report on CCTF Core-Il Reflood Test Second Shakedown TestC2-SH2 (Run 54) -- Effect of Core Supplied Power on Reflood Phenomena,"prepared by Japan Atomic Energy Research Institute, JAERI-M-85-025,March 1985.
J-446 "Evaluation Report on CCTF Core-Il Reflood Test C2-AA2 (Run 58) -
Investigation of Downcomer Injection Effects," prepared by Japan AtomicEnergy Research Institute, JAERI-M-89-227, January 1990.
J-447 "Evaluation Report on CCTF Core-Il Reflood Test C2-3 (Run 61) --Investigation of Initial Downcomer Water Accumulation Velocity Effects,"prepared by Japan Atomic Energy Research Institute, JAERI-M-86-185,January 1987.
J-448 "Evaluation Report on CCTF Core-Il Reflood Test C2-4 (Run 62) -Investigation of Reproducibility," prepared by Japan Atomic EnergyResearch Institute, JAERI-M-85-026, March 1985.
J-449 "Evaluation Report on CCTF Core-Il Reflood Test C2-6 (Run 64) - Effectof Radial Power Profile," prepared by Japan Atomic Energy ResearchInstitute, JAERI-M-85-027, March 1985.
5-35
J-450 "Evaluation Report on CCTF Core-Il Reflood Test C2-8 (Run 67) - EffectSystem Pressure," prepared by Japan Atomic Energy Research Institute,JAERI-M-87-001, January 1987.
J-451 "Evaluation Report on CCTF Core-Il Reflood Test C2-9 (Run 68) -- Effect ofLPCI Flow Rate," prepared by Japan Atomic Energy Research Institute,JAERI-M-87-002, February 1987.
J-452 "Evaluation Report on CCTF Core-Il Reflood Test C2-16 (Run 76) -- Effectof Asymmetric Upper Plenum Injection on Reflood Phenomena," preparedby Japan Atomic Energy Research, JAERI-M-87-051, March 1987.
J-453 "Evaluation Report on CCTF Core-Il Reflood Test C2-18 (Run 78) --BestEstimate Refill/Reflood Upper Plenum Injection Test," prepared by JapanAtomic Energy Research Institute, JAERI-M-87-052, March 1987.
J-454 "Evaluation Report on CCTF Core-Il Reflood Test C2-19 (Run 79) --Combined Injection Mode Under EM Condition," prepared by Japan AtomicEnergy Research Institute, JAERI-Memo-62-334, September 1987.
J-455 Pointner, W., "Study on Effects of Combined Injection (EM Conditions) onReflood Phenomena (Test C2-19/Run 79)," Japan Atomic Energy ResearchInstitute, JAERI-Memo-62-294, August 1987.
J-456 "Evaluation Report on CCTF Core-Il Reflood Tests C2-20 (Run 80) and C2-21 (Run 81) - BE Condition & Effect of Hot Leg ECC Flow Rate UnderCombined Injection Mode," prepared by Japan Atomic Energy ResearchInstitute, JAERI-Memo-63-267, July 1988.
J-457 "Analysis Report on Large Scale Reflood Tests with Cylindrical Core TestFacility - Tests in FY 1983," prepared by Japan Atomic Energy ResearchInstitute, JAERI-Memo-60-108.
J-458 "Analysis Report on Large Scale Reflood Tests with Cylindrical Core TestFacility - Tests in FY 1984," prepared by Japan Atomic Energy ResearchInstitute, JAERI-Memo-60-403.
J-459 "Analysis Report on CCTF Reflood Test," prepared by Japan Atomic EnergyResearch Institute, JAERI-Memo-61-059.
5-36
SCTF Core-I
J-481 "Design of Slab Core Test Facility (SCTF) in Large Scale Reflood TestProgram. Part 1: Core-I," prepared by Japan Atomic Energy ResearchInstitute, JAERI-Memo-9701, September 1981 (publicly released as JAERI-M-83-080, June 1983).
J-482 "System Pressure Effects on Reflooding Phenomena Observed in the SCTFCore-I Forced Flooding Effects," prepared by Japan Atomic EnergyResearch Institute, JAERI-Memo-9729, October 1981 (publicly released asJAERI-M-83-079, June 1983).
J-483 "Dispersed Flow and Corresponding Phenomena in SCTF Observed withHigh-Speed Camera," prepared by Japan Atomic Energy Research Institute,JAERI-M-9971, February 1982.
J-484 "Effects of Core Inlet Water Subcooling on Reflooding PhenomenaUnder Forced Flooding in SCTF Core-I Tests," prepared by Japan AtomicEnergy Research Institute, JAERI-Memo-9972, February 1982 (publiclyreleased as JAERI-M-83-122, August 1983).
J-485 "Effect of Upper Plenum Water Accumulation on Reflooding PhenomenaUnder Forced Flooding in SCTF Core-I Tests," prepared by Japan AtomicEnergy Research Institute, JAERI-Memo-9973, February 1982 (publiclyreleased as JAERI-M-83-114, July 1983).
J-486 "SCTF Core-I Tests Results: System Pressure Effects on RefloodingPhenomena," prepared by Japan Atomic Energy Research Institute, JAERI-M-82-075, July 1982.
J-487 "Examination of Repeatability in Reflood Phenomena Under ForcedFlooding in SCTF Core-I Tests," prepared by Japan Atomic EnergyResearch Institute, JAERI-Memo-57-251, September 1982 (publicly releasedas JAERI-M-083-237, January 1984).
J-488 "Core Thermal Behavior Under Forced Feed Flooding in SCTF Core-ITests," prepared by Japan Atomic Energy Research Institute, JAERI-Memo-57-270, October 1982.
J-489 "Heat Transfer Enhancement Due to Chimney Effect in Reflood Phase,"prepared by Japan Atomic Energy Research Institute, JAERI-Memo-57-297,October 1982.
5-37
J-490 "Effect of LPCI Water Injection Rate on Carryover Characteristics DuringReflood," prepared by Japan Atomic Energy Research Institute, JAERI-Memo-58-035, February 1983.
J-491 "Droplets Flow and Heat Transfer at Top Region of Core In Reflood Phase,"prepared by Japan Atomic Energy Research Institute, JAERI-M-83-022,February 1983.
J-492 "Evaluation of Cross Flow Velocity Across Rod Bundles During RefloodPhase in SCTF Core-I Forced Feed Flooding Tests," prepared by JapanAtomic Energy Research Institute, JAERI-Memo-58-443, December 1983.
J-493 "Effects of Upper Plenum Injection on Thermo-Hydrodynamic BehaviorUnder Refill and Reflood Phases of a PWR-LOCA," prepared by JapanAtomic Energy Research Institute, JAERI-Memo-59-052, February 1984(publicly released as JAERI-M-84-221, December 1984).
J-494 "Cold Leg Injection Reflood Test Results in the SCTF Core-I UnderConstant System Pressure," prepared by Japan Atomic Energy ResearchInstitute, JAERI-Memo-59-053, February 1984 (publicly released as JAERI-M-90-129, August 1990).
J-495 "Characteristics of Lower Plenum Injection Reflood Tests in SCTF Core-I,"prepared by Japan Atomic Energy Research Institute, JAERI-Memo-59-051,March 1984 (publicly released as JAERI-M-84-223, December 1984).
J-496 "Examination of Refill Simulation Test Results in SCTF Core-I," prepared byJapan Atomic Energy Research Institute, JAERI-Memo-60-098, April 1985.
J-497 "Effects of Core Inlet Water Mass Flow Rate on Reflooding Phenomena inthe Forced Feed SCTF Core-I Tests," prepared by Japan Atomic EnergyResearch Institute, JAERI-Memo-61-024, February 1986 (publicly releasedas JAERI-M-88-166, September 1988).
J-498 "Effects of Radial Core Power Profile on Core Thermo-Hydraulic Behaviorduring Reflood Phase in SCTF Core-I Forced Feed Tests," prepared byJapan Atomic Energy Research Institute, JAERI-M-91-093, June 1991.
5-38

SCTF Core-Il
J-521 "Design of Slab Core Test Facility (SCTF) in Large Scale Reflood TestProgram, Part I1: Core-Il," prepared by Japan Atomic Energy ResearchInstitute, JAERI-Memo-59-396, December 1984.
J-522 "Effects of Radial Power Profile on Two-Dimensional Thermal-HydraulicBehavior in Core in SCTF Core-Il Cold Leg Injection Tests," prepared byJapan Atomic Energy Research Institute, JAERI-Memo-59-415, January1985.
J-523 "Study on ECC Injection Modes in Reflood Tests with SCTF Core-IlComparison between Gravity and Forced Feeds," prepared by JapanAtomic Energy Research Institute, JAERI-Memo-61-115, March 1985(publicly released as JAERI-M-91-001, February 1991).
J-524 "Development of SCTF Cold Leg Injection Test Method for Eliminating U-Tube Oscillation During the Initial Period," prepared by Japan AtomicEnergy Research Institute, JAERI-Memo-60-145, June 1984 (publiclyreleased as JAERI-M-90-107, July 1990).
J-525 'Two Dimensional Thermal-Hydraulic Behavior in Core in SCTF Core-Il ColdLeg Injection Tests (Radial Power Profile Test Results)," prepared by JapanAtomic Energy Research Institute, JAERI-M-85-106, July 1985.
J-526 "Evaluation of SCTF Core-Il Tests with Upward Steam Flow and UpperPlenum Water Injection," prepared by Japan Atomic Energy ResearchInstitute, JAERI-Memo-60-287, October 1985.
J-527 "Data Reduction and Analysis Procedures in SCTF Core-Il," prepared byJapan Atomic Energy Research Institute, JAERI-Memo-60-393, January1986.
J-528 'Two-Dimensional Thermal-Hydraulic Behavior in Core in SCTF Core-IlForced Feed Reflood Tests (Effects of Radial Power and TemperatureDistributions)," prepared by Japan Atomic Energy Research Institute,JAERI, Memo-60-395, January 1986 (publicly released as JAERI-M-86-195,January 1987).
J-529 "Comparison of Facility Characteristics Between SCTF Core-I and Core-Il,"prepared by Japan Atomic Energy Research Institute, JAERI-Memo-61-018,February 1986 (publicly released as JAERI-M-90-130, August 1990).
5-39

J-530 "Large Scale Reflood Test Results with Slab Core Test Facility (SCTF):Core-Il Tests in FY 1984," prepared by Japan Atomic Energy ResearchInstitute, JAERI-Memo-61-058.
J-531 "Reflood Behavior at Low Initial Clad Temperature in Slab Core Test FacilityCore-Il," prepared by Japan Atomic Energy Research Institute, JAERI-Memo-61-066, March, 1986 (publicly released as JAERI-M-90-106, July1990).
J-532 "Analysis of SCTF/CCTF Counterpart Test Results," prepared by JapanAtomic Energy Research Institute, JAERI-Memo-61-114, March 1986(publicly released as JAERI-M-90-083, June 1990).
J-533 "Effects of System Pressure on Two-Dimensional Thermal-HydraulicBehavior in Core in SCTF Core-Il Reflood Tests." prepared by JapanAtomic Energy Research Institute, JAERI-Memo-61-265, August 1986.
J-534 "Evaluation Report on SCTF Core-Il Test S2-19 (Effect of LPCI Flow Rateon Core Thermal Hydraulic Behavior During Reflood in a PWR)," preparedby Japan Atomic Energy Research Institute, JAERI-Memo-01-078, March1989.
J-535 "Evaluation Report on SCTF Core-Il Test S2-08 (Effect of Core InletSubcooling on Thermal-Hydraulic Behavior Including Two-DimensionalBehavior in Pressure Vessel during Reflood in a PWR)," prepared by JapanAtomic Energy Research Institute, JAERI-Memo-01 -058, March 1989(publicly released as JAERI-M-90-236, January 1991).
J-536 "Analysis Report on SCTF Core-I and II Reflood Test," prepared by JapanAtomic Energy Research Institute, JAERI-Memo-01-348.
J-537 "Evaluation Report on SCTF Core-Il Test S2-19 (Quantitative Evaluation ofRelation Between Degree of Heat Transfer Enhancement Due to RadialPower Distribution and Amount of Increase of Upward Liquid Flow RateDuring Reflood in PWR-LOCA)," prepared by Japan Atomic EnergyResearch Institute, JAERI-M-91-033, March 1991.
5-40
SCTF Core-Ill
J-551 "Design of Slab Core Test Facility (SCTF) in Large Scale Reflood TestProgram, Part III: Core-Ill," prepared by Japan Atomic Energy ResearchInstitute, JAERI-Memo-62-110, March 1987.
J-552 "Analysis Report on Large Scale Reflood Tests with Core-Ill of the SlabCore Test Facility -- Test in FY 1985," prepared by Japan Atomic EnergyResearch Institute, JAERI-Memo-61-197.
J-553 "Evaluation Report on SCTF Core-Ill Test S3-SH1 (Overall Thermal-Hydraulic Characteristics Under Combined Injection Mode for German-TypePWR)," prepared by Japan Atomic Energy Research Institute, JAERI-Memo-62-093, March 1987.
J-554 "Evaluation Report on SCTF Core-Ill Test S3-06 (Effect of Radial PowerDistribution on Thermal-Hydraulic Characteristics Under Combined InjectionMode German PWR)," prepared by Japan Atomic Energy ResearchInstitute, JAERI-Memo-62-1 11, March 1987 (publicly released as JAERI-M-88-213, October 1988).
J-555 Pointner, W., "Method for the Determination of the Steam Injection Ratesto the UPTF Core Simulator for SCTF/UPTF Coupling Tests," Japan AtomicEnergy Research Institute, JAERI-Memo-62-293, August 1987.
J-556 "Analysis Report on Large Scale Reflood Tests with Core-Ill of Slab CoreTest Facility -- Test in FY 1986," prepared by Japan Atomic EnergyResearch Institute, JAERI-Memo-62-295.
J-557 Pointner, W., "System Behavior for the Refill/Reflood Phase During aCombined Injection Test With Conditions in SCTF and CCTF - Comparisonbetween SCTF Test S3-11 (Run 715) and CCTF Test C2-20 (Run 80),"Japan Atomic Energy Research Institute, JAERI-Memo-62-296, August1987.
J-558 "Evaluation Report on SCTF Core-Ill Tests S3-14, S3-15 and S3-16 (Effectof Radial Power Profile Shape on Two Dimensional Thermal HydraulicBehavior)," prepared by Japan Atomic Energy Research Institute, JAERI-Memo-62-329, September 1987 (publicly released as JAERI-M-88-060,March 1988).
5-41

J-559 "Evaluation Report on SCTF-IIl Test S3-SH2 (Observed Reflood Phenomenain S3-SH2 Test Under Combined Injection Mode for German Type PWR),"prepared by Japan Atomic Energy Research Institute, JAERI-Memo-62-344,October 1987.
J-560 Pointner, W., "Empirical Core Model for CCTF and SCTF," Japan AtomicEnergy Research Institute, JAERI-Memo-63-068, March 1988.
J-561 "Evaluation Report on SCTF Core-Ill Tests S3-7 and S3-8 (Investigation ofTie Plate Water Temperature Distribution Effects on Water Break-throughand Core Cooling During Reflooding)," prepared by Japan Atomic EnergyResearch Institute, JAERI-Memo-63-070, March 1988 (publicly released asJAERI-M-90-035, March 1990).
J-562 "Evaluation Report on SCTF-Il1 Test S3-12 (Observed Reflood Phenomenain Test S3-12 Under Combined Injection Mode for German-Type PWR,"prepared by Japan Atomic Energy Research Institute, JAERI-Memo-63-071,March 1988.
J-563 "Evaluation Report on SCTF-III Test S3-13 (Observed Reflood Phenomenain Test S3-13 Under Combined Injection Mode For German-Type PWR),"prepared by Japan Atomic Energy Research Institute, JAERI-Memo-63-072,March 1988.
J-564 "Evaluation Report on the SCTF-l1l Test S3-18 (Observed RefloodPhenomena in Test S3-18 Under Combined Injection Mode for German-Type PWR)," prepared by Japan Atomic Energy Research Institute, JAERI-Memo-63-073, March 1988.
J-565 "Evaluation Report on SCTF Core-Ill Test S3-20 (Investigation of WaterBreak Through and Core Cooling Behaviors Under Intermittent ECC WaterDelivery," prepared by Japan Atomic Energy Research Institute, JAERI-Memo-63-074, March 1988 (publicly released as JAERI-M-90-080, May1990).
J-566 "Evaluation Report on SCTF Core-Ill Test S3-01 (Effect of Water Sealing atBottom of Downcomer on Thermal-Hydraulic Behavior in Pressure Vesselin a PWR with Combined Injection Type ECCS)," prepared by Japan AtomicEnergy Research Institute, JAERI-Memo-63-230, June 1988.
5-42

J-567 "Evaluation Report on SCTF Core-Ill Test S3-02 (Effect of WaterTemperature Falling Into Core on Core Thermal-Hydraulic Behavior in aPWR With Combined Injection Type ECCS)," prepared by Japan AtomicEnergy Research Institute, JAERI, Memo-63-231, June 1988.
J-568 "Evaluation Report on SCTF Core-Ill Test S3-17 (Investigation of Thermo-Hydrodynamic Behavior During Reflood Phase of LOCA in a PWR with VentValves)," prepared by Japan Atomic Energy Research Institute, JAERI-Memo-63-232, June 1988 (publicly released as JAERI-M-90-036, March1990).
J-569 "Evaluation Report on SCTF Core-Ill Test S3-SH1 (Effect of Hot LegInjection on Core Thermal-Hydraulics With Combined Injection TypeECCS)," prepared by Japan Atomic Energy Research Institute, JAERI-M-88-125, July 1988.
J-570 "Evaluation Report on SCTF-III Test S3-3, S3-4 and S3-5 CountercurrentFlow Limitation Phenomenon in Full-Radius Core," prepared by JapanAtomic Energy Research Institute, JAERI-Memo-01-028, January 1989.
J-571 "Study on Flow Circulation Phenomena in Pressure Vessel During RefloodPhase of PWR with Combined-Injection Type ECCS Under Cold-Leg-Large-Break LOCA," prepared by Japan Atomic Energy Research Institute, JAERI-Memo-01-015, February 1989.
J-572 "Evaluation Report on SCTF Core-Ill Test S3-22 (Investigation of WaterBreak-through and Core Cooling Behaviors under Alternate ECC WaterDelivery from Hot Legs to Upper Plenum during Reflooding in PWRs withCombined-Injection Type ECCS," prepared by Japan Atomic EnergyInstitute, JAERI-Memo-01-077 (publicly released as JAERI-M-91-104,July 1991).
J-573 "Evaluation Report on SCTF-III Test S3-10: Reflood Phenomena UnderBest Estimate Conditions," prepared by Japan Atomic Energy ResearchInstitute, JAERI-Memo-01-086, March 1989.
J-574 "Experimental Study on In-Core Reflood Behavior Under CombinedInjection of ECC Water," prepared by Japan Atomic Energy ResearchInstitute, JAERI-Memo-63-467, January 1989.
5-43

J-575 "Evaluation Report on SCTF Core-Ill Test S3-9: Investigation of RefloodingBehavior Under An Evaluation Model Condition in PWRs with Cold-Leg-Injection-Type ECCS," prepared by Japan Atomic Energy ResearchInstitute, JAERI-Memo-01 -251, July 1989 (publicly released as JAERI-M-90-046).
J-576 "Evaluation Report on SCTF-111 Test S3-11: Observed Reflood PhenomenaUnder BE Condition of Combined ECC Injection Mode For German TypePWR," prepared by Japan Atomic Energy Research Institute, JAERI-Memo-01-263, August 1989.
J-577 "Evaluation Report on SCTF-lll Test S3-21: Observed Reflood Phenomenain Test S3-21 Under Combined ECC Injection Mode," prepared by JapanAtomic Energy Research Institute, JAERI-Memo-02-069, March 1990.
J-578 "Evaluation Report on SCTF Core-Ill Test S3-9 (Investigation of CCTFCoupling Test Results Under An Evaluation Model Condition in PWRs WithCold-Leg-Injection-Type ECCS)," prepared by Japan Atomic EnergyResearch Institute, JAERI-M-90-046, March 1990.
Other JAERI Facilities
J-581 "Evaluation of the Pressure Difference across the Core during PWR-LOCAReflood Phase," prepared by Japan Atomic Energy Research Institute,JAERI-M-8168, March 1979.
J-582 "Experimental Results of the Effective Water Head in Downcomer duringReflood Phase of a PWR LOCA," prepared by Japan Atomic EnergyResearch Institute, JAERI-M-8978, August 1980.
J-583 "Preliminary Analysis of the Effect of the Grid Spacers on the Reflood HeatTransfer," prepared by Japan Atomic Energy Research Institute, JAERI-M-9992, February 1982.
J-584 "Quench Model for Lower Temperature than Thermo-HydrodynamicMaximum Uquid Superheat," prepared by Japan Atomic Energy ResearchInstitute, JAERI-M-10000, March 1982.
J-585 'The Characteristics of Cross Flow in a Rod Bundle," prepared by JapanAtomic Energy Research Institute, JAERI-M-82-003, March 1982.
5-44

J-586 "Study of the Thermo-Hydrodynamic Phenomena in the Nuclear Coreduring Reflood Phase," prepared by Japan Atomic Energy ResearchInstitute, JAERI-M-83-032, March 1983.
J-587 "Report on Reflood Experiment of Grid Spacer Effect," prepared by JapanAtomic Energy Research Institute, JAERI-M-84-131, July 1984.
J-588 'Thermal-Hydraulic Evaluation Study of the Effectiveness of EmergencyCore Cooling System for Light Water Reactors," prepared by Japan AtomicEnergy Research Institute, JAERI-M-85-122, August 1985.
J-589 "Cross Flow Resistance in Air-Water Two-Phase Flow in Rod Bundle,"prepared by Japan Atomic Energy Research Institute, JAERI-M-86-184,January 1987.
J-590 "Study on Thermo-Hydraulic Behavior during Reflood Phase of a PWR-LOCA," prepared by Japan Atomic Energy Research Institute, JAERI-M-88-262, January 1989.
J-591 "Estimation of Shear Stress in Counter-Current Gas-liquid Annular Two-Phase Flow," prepared by Japan Atomic Energy Research Institute, JAERI-M-90-215, January 1991.
CODE ANALYSIS REPORTS
CCTF
J-601 "Assessment of TRAC-PD2 Reflood Core Thermal-Hydraulic Model byCCTF Test C1 -16," prepared by Japan Atomic Energy Research Institute,JAERI-M-82-166, November 1982.
J-602 "Assessment of Core Thermo-Hydrodynamic Models of REFLA-1 D withCCTF Data," prepared by Japan Atomic Energy Research Institute, JAERI-M-83-103, June 1983.
J-603 "Analysis of TRAC-PD2 Prediction for the Cylindrical Core Test FacilityEvaluation-Model Test C1 -19 (Run 38)," prepared by Japan Atomic EnergyResearch Institute, JAERI-M-84-041, March 1979.
J-604 "Assessment of TRAC-PF1 Predictive Capability for the Thermal-HydraulicBehaviors along a Primary Loop during the Reflood Phase of a PWR-LOCA," prepared by Japan Atomic Energy Research Institute, JAERI-M-84-042, March 1984.
5-45

J-605 "Assessment of REFLA Local Power Effect Model with CCTF Data,"prepared by Japan Atomic Energy Research Institute, JAERI-M-84-246,February 1985.
J-606 "Analysis of TRAC-PF1 Calculated Core Heat Transfer for CCTF Test C1-5(Run 14)," prepared by Japan Atomic Energy Research Institute, JAERI-M-85-117, August 1985.
J-607 "Assessment of TRAC-PF1/MOD1 Code for Cylindrical Core Test FacilityBase Case Test C2-4," prepared by Japan Atomic Energy ResearchInstitute, JAERI-Memo-01-007, February 1989.
J-608 Pointner, W., "Comparison Between a TRAC GPWR Calculation and aCCTF Test With Combined Injection and EM Boundary Conditions for theReflood Phase of a German PWR-LOCA," Japan Atomic Energy ResearchInstitute, JAERI-Memo-62-292, August 1987.
J-609 "Assessment of TRAC-PF1/MOD1 Code for Core Thermal HydraulicBehavior during Reflood with CCTF and SCTF Data," prepared by JapanAtomic Energy Research Institute, JAERI-Memo-01-009, February 1989.
SCTF
J-611 "Computer Codes HeatT and HeatQ for Heat Transfer Analysis in SCTF,"prepared by Japan Atomic Energy Research Institute, JAERI-Memo-9867,January 1982.
J-612 "Comparison Between SCTF Tests S1 -SH2, S1-01, S1 -02, and S1-04 andthe TRAC Post-Test Predictions," prepared by Japan Atomic EnergyResearch Institute, JAERI-Memo-58-339, September 1983.
J-613 "COBRA/TRAC Analysis of Two-Dimensional Thermal-Hydraulic Behaviorin SCTF Reflood Tests," prepared by Japan Atomic Energy ResearchInstitute, JAERI-Memo-60-219, August, 1985 (publicly released as JAERI-M-86-196, January 1987).
J-614 "Predictability of REFLA Core Model for SCTF Data," prepared by JapanAtomic Energy Research Institute, JAERI-87-163, October 1987.
J-615 "Assessment of TRAC-PFI/MOD1 Code for Thermal Hydraulic BehaviorIncluding Two-Dimensional Behavior In Pressure Vessel During Reflood inSlab Core Test Facility," prepared by Japan Atomic Energy ResearchInstitute, JAERI-Memo-01-006, February 1989.
5-46

Other
J-621 "REFLA-1 D/MODE 1: A Computer Program for Reflood Thermo-Hydrodynamic Analysis during PWR-LOCA User's Manual," prepared byJapan Atomic Energy Research Institute, JAERI-M-9286, January 1981.
J-622 "REFLAP/REFLA (Mod 0): A System Reflooding Analysis ComputerProgram," prepared by Japan Atomic Energy Research Institute, JAERI-M-9397, March 1981.
J-623 "One-dimensional System Analysis Code for Reflood Phase during LOCA,"prepared by Japan Atomic Energy Research Institute, JAERI-M-9780,November 1981.
J-624 "Improvement of Core Mass Balance Calculation in REFLA-1D/MODEI,"prepared by Japan Atomic Energy Research Institute, JAERI-M-82-099,August 1982.
J-625 "Investigation of Reflood Models by Coupling REFLA-1D and Multi-loopSystem Model," prepared by Japan Atomic Energy Research Institute,JAERI-M-83-147, September 1983.
J-626 "REFLA-1 D/MODE3: A Computer Code for Reflood Thermo-HydrodynamicAnalysis during PWR-LOCA. User's Manual," prepared by Japan AtomicEnergy Research Institute, JAERI-M-84-243, February 1985.
J-627 "Updating of Best Evaluation Codes Fiscal Year 1984 Work Report,"prepared by Japan Atomic Energy Research Institute, JAERI-Memo-60-394,December 1985.
J-628 "User's Manual of the REFLA-1 D/MODE4 Reflood Thermo-HydrodynamicAnalysis Code: Incorporation of Local Power Effect Model and FuelTemperature Profile Effect Model into REFLA-11D," prepared by JapanAtomic Energy Research Institute, JAERI-M-85-210, January 1986.
J-629 "Assessment of TRAC-PF1 /MOD1 for Countercurrent, Annular and StratifiedFlows," prepared by Japan Atomic Energy Research Institute, JAERI-M-85-219, January 1986 (this is the public release of a LANL 2D/3D TechnicalNote - see U-704).
J-630 "Improvement of TRAC-PF1 Code with JAERI's Reflood Model of REFLA-1 DCode, prepared by Japan Atomic Energy Research Institute, JAERI-Memo-02-009 February 1990.
5-47

J-631 "Implementation of an Implicit Method Into Heat Conduction Calculation ofTRAC-PF1/MOD1 Code," prepared by Japan Atomic Energy ResearchInstitute, JAERI-Memo-01 -008, February 1989 (publicly released as JAERI-M-90-122, August 1990).
ADVANCED INSTRUMENTATION REPORTS
J-801 "Data Processing of Advanced Two-Phase Flow Instrumentation In SlabCore Test Facility (SCTF) Core-I," prepared by Japan Atomic EnergyResearch Institute, JAERI-Memo-9802, November 1981.
J-802 "Evaluation of Advanced Two-Phase Flow Instrumentation In SCTF Core-I,"prepared by Japan Atomic Energy Research Institute, JAERI-Memo-57-206,August 1982 (publicly released as JAERI-M-84-065, March 1984).
PAPERS, PRESENTATIONS, AND CORRESPONDENCE
Papers - Data Evaluation
J-901 Murao, Y., Sudo, Y., and Iguchi, T., 'Topics on Hydrodynamic Models ofPWR Reflood Phenomena," presented at the Japan - US Seminar on Two-Phase Flow Dynamics, Kobe, Japan, July 31 - August 3, 1979.
J-902 Sudo, Y., "Estimation of Average Void Fraction in Vertical Two-Phase FlowChannel Under Low Liquid Velocity," Journal of Nuclear Science &Technology Vol. 17, No. 1 (January 1980).
J-903 Sudo, U., "Film Boiling Heat Transfer during Reflood Phase in PostulatedPWR Loss-of-Coolant Accident," Journal of Nuclear Science andTechnology Vol. 17, No. 7, pp. 516-530 (July 1980).
J-904 Murao, Y., Sudoh, T., and Sugimoto, J., "Experimental and AnalyticalModeling of the Reflood-Phase during PWR-LOCA," presented at theNineteenth National Heat Transfer Conference, Orlando, FL, USA, July 27-30, 1980.
J-905 Hirano, K, Murao, Y.,"Large Scale Reflood Test," Nippon GenshiryokuGakkai-Shi Vol. 22, No. 10, pp. 681-686 (October 1980).
J-906 Murao, Y., and Sugimoto, J., "Correlation of Heat Transfer Coefficient forSaturated Film Boiling During Reflood Phase Prior to Quenching," Journalof Nuclear Science and Technoloav. Vol. 18, No. 4, pp. 275-284(April 1981).
5-48
J-907 Sudo, Y., and Akimoto, H., "Downcomer Effective Water Head duringReflood in Postulated PWR LOCA," Journal of Nuclear Science andTechnolay. Vol. 19, No. 1 (January 1982).
J-908 Osakabe, M., and Adachi, H., "Characteristic of Two-Phase Slanting Flowin Rod Bundle," Journal of Nuclear Science and Technology, Vol. 19, No. 6,pp. 504-506 (June 1982).
J-909 Okubo, T., and Murao, Y., "Effects of ECC Water Injection Rate on RefloodPhase during LOCA," Journal of Nuclear Science and Technology, Vol. 19,No. 7, pp. 593-595 (July 1982).
J-91 0 Murao, Y., and Iguchi, T., "Experimental Modeling of Core Hydrodynamicsduring Reflood Phase of LOCA," Journal of Nuclear Science andTechnology, Vol. 19, No. 8, pp. 613-627, (August 1982).
J-911 Murao, Y., Akimoto, H., Sudoh, T., and Okubo, T., "Experimental Study ofSystem Behavior during Reflood Phase of PWR-LOCA using CCTF," Journalof Nuclear Science and Technology, Vol. 19, No. 9, pp. 705-719(September 1982).
J-912 Murao, Y., Sudoh, T., Iguchi, T., et al, "Findings in CCTF Core-I Test,"Proceedings of the Tenth Water Reactor Safety Information Meeting,October 12-15, 1982, NUREG/CP-0041, Vol. 1, pp. 275-286.
J-913 Adachi, H., Sudo, Y., Sobajima, M., et al, "SCTF Core-I Reflood TestResults," presented at the Tenth Water Reactor Safety Information Meeting,October 12-15, 1982, NUREG/CP-0041, Vol. 1, pp. 287-306.
J-914 Sobajima, M., and Ohnuki, A., "Carryover Characteristic during RefloodProcess in Large Scale Separate Effects Tests," Nuclear Engineering andDesign. Vol. 74, No. 2, pp. 165-171 (February 1983).
J-915 Ohnuki, A., and Sobajima, M., "Mass Effluent Rate Out of Core duringReflood," Journal of Nuclear Science and Technologqy, Vol. 20, No. 3,pp. 267-269 (March 1983).
J-916 Sudo, Y., and Osakabe, M., "Effects of Partial Flow Blockage on Core HeatTransfer in Forced-Feed Reflood Tests," Journal of Nuclear Science andTechnology. Vol. 20, No. 4, pp. 322-332 (April 1983).
5-49

J-917 Iguchi, T., and Murao, Y., 'Water Accumulation Phenomena in UpperPlenum during Reflood Phase of PWR-LOCA by Using CCTF Data," Journalof Nuclear Science and Technology, Vol. 20, No. 6, pp. 453-466(June 1983).
J-918 Osakabe, M., and Sudo, Y., "Heat Transfer Calculation of Simulated HeaterRods throughout Reflood Phase in Postulated PWR-LOCA Experiments,"Journal of Nuclear Science and Technology. Vol. 20, No. 7, pp. 559-570(July 1983).
J-919 Abe, Y., Sudo, Y., and Osakabe, M., "Experimental Study of Upper CoreQuench in PWR Reflood Phase," Journal of Nuclear Science andTechnology. Vol. 20, No. 7, pp. 571-583 (July 1983).
J-920 Sugimoto, J., and Murao, Y., "Experimental Study of Effect of Initial CladTemperature on Reflood Phenomena during PWR-LOCA," Journal ofNuclear Science and Technology Vol. 20, No. 8, pp. 645-657(August 1983).
J-921 Iguchi, T., Okubo, T., and Murao, Y., 'Visual Study of Flow Behavior inUpper Plenum during Simulated Reflood Phase of PWR-LOCA," Journal ofNuclear Science and Technology Vol. 20, No. 8, pp. 698-700(August 1983).
J-922 Sudo, Y., and Ohnuki, A., "Mechanism of Falling Water Umitation in Two-Phase Counter Flow through Single Hole Vertical Channel," Nippon KikaiGakkai Ronbunshu, B. Hen, Vol. 49, No. 444, pp. 1685-1694 (August 1983).
J-923 Iwamura, T., Osakabe, M., and Sudo, Y., "Effects of Radial Core PowerProfile on Core Thermo-Hydraulic Behavior during Reflood Phase in PWR-LOCAs," Journal of Nuclear Science and Technology. Vol. 20, No. 9,pp. 743-751 (September 1983).
J-924 Adachi, H., Sobajima, M., Iwamura, T., et al, "SCTF Core-I Reflood TestResults," Proceedings of the Eleventh Water Reactor Safety ResearchInformation Meeting, October 14-24, 1983, NUREG/CP-0048, Vol. 2, pp.277-296.
J-925 Murao, Y., Iguchi, T., Sugimoto, J., et al, "Status of CCTF Test Program,"Proceedings of the Eleventh Water Reactor Safety Research InformationMeeting, October 14-24, 1983, NUREG/CP-0048, Vol. 2, pp. 257-276.
5-50
J-926 Sudo, Y., "Parameter Effects on Downcomer Penetration of ECC Water inPWR-LOCA," Journal of Nuclear Science and Technology, Vol. 21, No. 1,pp. 32-41 (January 1984).
J-927 Osakabe, M., and Sudo, Y., "Analysis of Saturated Film Boiling HeatTransfer in Reflood Phase of PWR-LOCA: Turbulent Boundary LayerModel," Journal of Nuclear Science and Technoloav Vol. 21, No. 2,pp. 115-125 (February 1984).
J-928 Sugimoto, J., and Murao, Y., "Effect of Grid Spacers on Reflood HeatTransfer in PWR-LOCA," Journal of Nuclear Science and Technology. Vol.21, No.?2, pp. 103-114 (February 1984).
J-929 Akimoto, H., Iguchi, T., and Murao', Y., "Pressure Drop Through BrokenCold Leg during Reflood Phase of Loss-of-Coolant Accident of PressurizedWater Reactor," Journal of Nuclear Science and Technology. Vol. 21, No.6, pp. 450-465 (June 1984).
J-930 Murao, Y., "Quench Front Movement during Reflood Phase," Proceedingsof the First International Workshop on Fundamental Aspects of Post-DryoutHeat Transfer, April 2-4, 1984, Salt Lake City, UT, USA, NUREG/CP-0060,pp. 103-117.
J-931 Sudo, Y., and Ohnuki, A., "Mechanism of Falling Water Limitation underCounter-Current Flow through a Vertical Flow Path," Bull, JSME, Vol. 27,No. 226, pp. 708-715 (April 1984).
J-932 Murao, Y., Adachi, H., and Iguchi, T., "Status of CCTF/SCTF TestProgram," Proceedings of the Twelfth Water Reactor Safety ResearchInformation Meeting, October 23-26, 1984, NUREG/CP-0058, Vol. 2, pp.342-372.
J-933 Murao, T., Iguchi, T., Okabe, K., et .al, "Results of CCTF Upper PlenumInjection Tests," Proceedings of the Twelfth Water Reactor Safety ResearchInformation Meeting, October 23-26, 1984, NUREG/CP-0058, Vol. 2, pp.306-341.
J-934 Okabe, K., and Murao, Y., "Swelling Model of Two-Phase Mixture in LowerPlenum at End of Blowdown Phase of PWR-LOCA," Journal of NuclearScience and Technology Vol. 21, No. 12, pp. 919-930 (December 1984).
5-51

J-935 Okubo, T., and Murao, Y., "Experimental Study of ECC Water Injection RateEffects on Reflood Phase of PWR-LOCA," Journal of Nuclear Science andTechnology Vol. 22, No. 2, pp. 93-108 (February 1985).
J-936 Akimoto, H., Tanaka, Y., Kozawa, Y., et al., "Oscillatory Flows Induced byDirect Contact Condensation of Flowing Steam with Injected Water,"Journal of Nuclear Science and Technology. Vol. 22, 1985, pp. 269-283(April 1985).
J-937 Sobajima, M., and Adachi, H., "Coolability Study on Two-Bundle Scale FlowBlockage in the Reflood Process," Nuclear Engineering and Design. Vol. 86,No. 3, pp. 345-355 (June 1985).
J-938 Iwamura, T., and Adachi, H., "Initial Thermal-Hydraulic Behaviors underSimultaneous ECC Water Injection into Cold Leg and Upper Plenum in aPWR LOCA," Journal of Nuclear Science and Technology, Vol. 22, No. 6,pp. 451-460 (June 1985).
J-939 Akimoto, H., Iguchi, T., and Murao, Y., "Core Radial Power Profile Effect onSystem and Core Cooling Behavior during Reflood Phase of PWR-LOCAwith CCTF Data," Journal of Nuclear Science and Technology, Vol. 22, No.7, pp. 538-550 (July 1985).
J-940 Iguchi, T., and Murao, Y., "Experimental Study on Reflood Behavior in PWRwith Upper Plenum Injection Type ECCS by Using CCTF," Journal ofNuclear Science and Technology. Vol. 22, No. 8, pp. 637-652 (August1985).
J-941 Sobajima, M., "Experimental Modeling of Steam-Water Countercurrent FlowUmit for Perforated Plates," Journal of Nuclear Science and Technology.Vol. 22, No. 9, pp. 723-732, (September 1985).
J-942 Murao, Y., Iguchi, T., Sugimoto, J., et al, "Results of CCTF Tests,"Proceedings of the Thirteenth Water Reactor Safety Research InformationMeeting, October 22-25, 1985, NUREG/CP-0072, Vol. 4, pp. 289-314.
J-943 Iwamura, T., Sobajima, M., Adachi, H., et al, "Results of SCTF RefloodTests," Proceedings of the Thirteenth Water Reactor Safety ResearchInformation Meeting, October 22-25, 1985, NUREG/CP-0072, Vol. 4, pp.315-330.
5-52

J-944 Sugimoto, J., Okubo, T., and Murao, Y., "Heat Transfer Enhancement dueto Water Accumulation near Grid Spacers during Reflood," Proceedings ofthe Third International Topical Meeting on Reactor Thermal Hydraulics,Newport, RI, USA, October 15-18, 1985.
J-945 Murao, Y., Fujiki, K., and Akimoto, H., "Experimental Assessment ofEvaluation Model for Safety Analysis on Reflood Phase of PWR-LOCA,"Journal of Nuclear Science and Technology. Vol. 22, No. 11, pp. 890-902(November 1985).
J-946 Iwamura, T., Adachi, H., and Sobajima, M., "Experimental Study of Two-Dimensional Thermal-Hydraulic Behavior in Core during Reflood Phase ofPWR LOCA," Journal of Nuclear Science and Technol-goy, Vol. 23, No. 2,pp. 123-135 (February 1986).
J-947 Ohnuki, A., "Experimental Study of Countercurrent Two-Phase Flow inHorizontal Tube Connected to Inclined Riser," Journal of Nuclear Scienceand Technology. Vol. 23, No. 3, pp. 219-232 (March 1986).
J-948 Adachi, H., Iwamura, T., Ohnuki, A., et al, "Recent Study on Two-Dimensional Thermal-Hydraulic Behavior in PWR Core During the RefloodPhase of LOCA with the Slab Core Test Facility (SCTF)," Proceedings of theSecond International Topical Meeting on Nuclear Power Plant ThermalHydraulics and Operations, Tokyo, Japan, April 15-17, 1986.
J-949 Sobajima, M., Adachi, H., Iwamura, T., and Ohnuki, A., 'Two DimensionalFall Back Flow and Core Cooling in the Slab Core Test Facility (SCTF),"Proceedings of the Second International Topical Meeting on Nuclear PowerPlant Thermal Hydraulics and Operations, Tokyo, Japan, April 15-17, 1986.
J-950 Iguchi, T., Murao, Y., Akimoto, H., et al, "Assessment of Current SafetyEvaluation Analysis on the Reflood Phase during a LOCA in a PWR with theCold Leg Injection Type ECCS: 1) System Behavior, and 2) Thermal-hydraulic Behavior in the Core," Proceedings of the Second InternationalTopical Meeting on Nuclear Power Plant Thermal Hydraulics andOperations, Tokyo, Japan, April 15-17, 1986.
J-951 Abe, Y., Sobajima, M. and Murao, Y., "Experimental Study of Effects ofUpward Steam Flow Rate on Quench Propagation by Falling Water Film,"Journal of Nuclear Science and Technology Vol. 23, No. 5, pp. 415-432(May 1986).
5-53

J-952 Iwamura, T., Adachi, H., and Sobajima, M., "Air-Water Two-Phase CrossFlow Resistance in Rod Bundle," Journal of Nuclear Science andTechnology. Vol. 23, No. 7, pp. 658-660 (July 1986).
J-953 Iwamura, T., Adachi, H., Sobajima, M. et al, "Heat Transfer Enhancementin SCTF Tests," Proceedings of the Fourteenth Water Reactor SafetyResearch Information Meeting, October27-31,1986, NUREG/CP-0082, Vol.4, pp. 429-444.
J-954 Iguchi, T., Murao, T., Sugimoto, J., et al, "Summary of CCTF Test Results,"Proceedings of the Fourteenth Water Reactor Safety Research InformationMeeting, .ctober 27-31, 1986, NUREG/CP-0082, Vol. 4, pp. 387-406.
J-955 Akimoto, H., Iguchi, T., and Murao, Y., "System Pressure Effect on Systemand Core Cooling Behavior during Reflood Phase of PWR LOCA," Journalof Nuclear Science and Technology, Vol. 24, No. 4, pp. 276-288(April 1987).
J-956 Ohnuki, A., and Adachi, H., "Limitation of Countercurrent Gas-Liquid Flowin a Horizontal Flow Path Connected to an Inclined Flow Path: Predictionof Gas Velocity on Initiation of Liquid Penetration," Nippon Kikai GakkaiRonbunshu. B. Hen, Vol. 53, No. 490, pp. 1685-1690 (June 1987).
J-957 Okubo, T., Iguchi, T., and Murao, Y., "Experimental Study of InitialDowncomer Water Accumulation Velocity Effects on Reflood Phase ofPWR-LOCA," Journal of Nuclear Science and Technologvy Vol. 24, No. 7,pp. 573-579 (July 1987).
J-958 Ohnuki, A., Adachi, H., and Murao, Y., "Scale Effects on CountercurrentGas-Liquid Flow in Horizontal Tube Connected to Inclined Riser,"Proceedings from ANS National Heat Transfer Conference, Pittsburgh, PA,USA, August 9-12, 1987. (Also see J-966.)
J-959 Adachi, H., Iguchi, T., Iwamura, T., et al, "Multi-dimensional Effect Foundin SCTF Reflood Tests for US/J PWR," Proceedings of the Fifteenth WaterReactor Safety Information Research Meeting, October 26-30, 1987,NUREG/CP-0091, Vol. 4, pp. 549-558.
J-960 Murao, Y., Iguchi, T., Sugimoto, J., et al, "Reflooding Phenomena ofGerman PWR Estimated from CCTF (Cylindrical Core Test Facility), SCTF(Slab Core Test Facility), and UPTF (Upper Plenum Test Facility) Results,"Proceedings of the Fifteenth Water Reactor Safety Research InformationMeeting, October 26-30, 1987, Vol. 4 Addenda.
5-54

J-961 Okabe, K., and Murao, Y., "Hydrodynamics of ECC Water Bypass and Refillof Lower Plenum at PWR-LOCA," Journal of Nuclear Science andTechnologyH Vol. 24, No. 10, pp. 785-797 (October 1987).
J-962 Iguchi, T., and Murao, Y., "Effect of Decay Heat Level on RefloodPhenomena during PWR-LOCA," Journal of Nuclear Science andTechnologg. Vol. 24, No. 10, pp. 821-831 (October 1987).
J-963 Iguchi, T., Murao, Y., Akimoto, H., et al, "Assessment of Current SafetyEvaluation Analysis on Reflood Behavior during PWR-LOCA by Using CCTFData," Journal of Nuclear Science and Technology Vol. 24, No. 11,pp. 887-896 (November 1987).
J-964 Akimoto, H., Iguchi, T., and Murao, Y., "Effect of Pressure Drop throughBroken Cold Leg on Thermal Hydraulic Behavior during Reflood Phase ofPWR-LOCA," Journal of Nuclear Science and Technology., Vol. 25, No. 1,pp. 45-55 (January 1988).
J-965 Iguchi, T., and Murao, Y., "Effect of Asymmetric Upper Plenum Injection onReflood Behavior," Journal of Nuclear Science and Technology. Vol. 25,No. 4, pp. 350-358 (April 1988).
J-966 Ohnuki, A., Adachi, H., and Murao, Y., "Scale Effects on CountercurrentGas-Uquid Flow in a Horizontal Tube Connected to an Inclined Riser,"Nuclear Engineering and Design, Vol. 107. No. 3, pp. 283-294 (May 1988).(Also see J-958.)
J-967 Iguchi, T., Iwamura, T., Akimoto, H., et al, "SCTF-lll Test Plan and RecentSCTF-111 Test Results," Nuclear Engineerinq and Design Vol. 108, No. 1/2,pp. 241-247 (June 1988).
J-968 Iguchi, T., Murao, Y., and Sugimoto, J., "Summary of CCTF Test Results -- Assessment of Current Safety Evaluation Analysis on Reflood Behaviorduring a LOCA in a PWR with Cold-Leg-Injection-Type ECCS," NuclearEngineering and Design Vol. 108, No. 1/2, pp. 233-239 (June 1988).
J-969 Iguchi, T., Okubo, T., and Murao, Y., "Effect of Loop Seal on RefloodPhenomena in PWR," Journal of Nuclear Science and Technology. Vol. 25,No. 6, pp. 520-527 (June 1988).
5-55

J-970 Iguchi, T., Adachi, H., Sugimoto, J., et al, "Recent Results of AnalyticalStudy on SCTF-IlI Tests for Reflood Phenomena of PWR with Combined-Injection-Type ECCS under Cold-Leg-Large-Break LOCA," Proceedings ofthe Sixteenth Water Reactor Safety Research Information Meeting, October24-27, 1988, NUREG/CP-0097, Vol. 4, pp. 557-581.
J-971 Iwamura, T., Iguchi, T., Adachi, H., and Murao, Y., "Quantitative Evaluationof Heat Transfer Enhancement due to Radial Power Distribution duringReflood Phase of PWR-LOCA," Journal of Nuclear Science and Technology.Vol. 26, No. 4, pp. 428-440 (April 1989).
J-972 Murao, Y., Iguchi, T., Adachi, H., et al, "Multi-Dimensional Thermal-Hydraulics in Pressure Vessel during Reflood Phase of a PWR-LOCA,"Proceedings of the Fourth International Topical Meeting on Nuclear ReactorThermal-Hydraulics (NURETH-4), Karlsruhe, FRG, October 1989.
J-973 Okubo, T., Iguchi, T., and Murao, Y., "Experimental Study of RefloodingBehavior in PWRs under Downcomer Injection," Journal of Nuclear Scienceand Technology. Vol. 27, No. 1, pp. 30-44 (January 1990).
J-974 Ohnuki, A., Akimoto, H., and Murao, Y., "Effect of Liquid Flow Rate on FilmBoiling Heat Transfer during Reflood in Rod Bundle," Journal of NuclearScience and Technology. Vol. 27, No. 6, pp. 535-546 (June 1990).
J-975 Iguchi, T., 'Void Fraction in Simulated PWR Fuel Bundle during RefloodPhase," Journal of Nuclear Science and Technoloav Vol. 18, No. 12,pp. 957-968 (December 1981).
Papers - Code Analysis
J-981 Murao, Y., "Analytical Study of Thermo-Hydrodynamic Behavior of Reflood-Phase during LOCA," Journal of Nuclear Science and Technology. Vol. 16,No. 11, pp. 802-817 (November 1979).
J-982 Murao, Y., Sugimoto, J., Okubo, T., et al, "Reflood Code DevelopmentWork in JAERI," Proceedings of the Eleventh Water Reactor SafetyResearch Information Meeting, October 11-24, 1983, NUREG/CP-0048,Vol. 1, pp. 137-149.
J-983 Murao, Y., "Reflood Analysis Code REFLA," Proceedings of the FirstInternational Workshop on Fundamental Aspects of Post-Dryout HeatTransfer, Salt Lake City, UT, USA, April 2-4, 1984, NUREG/CP-0060, pp.56-67.
5-56
J-984 Okubo, T., and Murao, Y., "Assessment of Core Thermo-HydrodynamicModels of REFLA-1D0 Code with CCTF Data for Reflood Phase of PWR-LOCA," Journal of Nuclear Science and Technology, Vol. 22, No. 12, pp.983-994 (December 1985).
J-985 Akimoto, H., "Analysis of TRAC-PF1 Calculated Core Heat Transfer forCCTF Test C1-5 (Run 14)," Nuclear Engineering and Design Vol. 88, pp.215-227 (1985).
J-986 Sugimoto, J., Sudoh, T., and Murao, Y., "Analytical Study of ThermalResponse Similarity between Simulated Fuel Rods and Nuclear Fuel Rodsduring Reflood Phase of PWR-LOCA," Journal of Nuclear Science andTechnology, Vol. 23, No. 4, pp. 315-325 (April 1986).
J-987 Murao, Y., Iguchi, T., Adachi, H., et al, "Development of Reflood Model atJAERI," Proceedings of the Fourteenth Water Reactor Safety ResearchInformation Meeting, October 27-31, 1986, NUREG/CP-0082, Vol. 4, pp.445-458.
J-988 Akimoto, H., Iwamura, T., Ohnuki, A., et al, "Status of J-TRAC CodeDevelopment," Proceedings of the Fourteenth Water Reactor SafetyResearch Information Meeting, October 27-31, 1986, NUREG/CP-0082, Vol.5, pp. 381-394.
J-989 Iguchi, T., Murao, Y., and Akimoto, H., "Assessment of Core Radial ProfileEffect Model for REFLA Code by Using CCTF Data," Journal of NuclearScience and Technology. Vol. 24, No. 7, pp. 536-546 (July 1987).
J-990 Murao, Y., "Status of Development of Thermal-Hydraulic Reactor TransientAnalysis Code J-TRAC and Future Plan," Proceedings of the FourthSeminar on Software Development in Nuclear Energy Research," Tokai,Ibaraki, Japan, September 9-10, 1987, JAERI-M-87-199, pp. 18-48.
J-991 Murao, Y., and Hojo, T., "Numerical Simulation of Reflooding Behavior inTight-Lattice Rod Bundles," Nuclear Technology Vol. 80, No. 1, pp. 83-92(January 1988).
J-992 Hojo, T., Iguchi, T., and Murao, Y., "Application of REFLA Core Model toSafety Evaluation Code," Journal of Nuclear Science and Technology.Vol. 25, No. 2, pp. 190-197 (February 1988).
5-57

J-993 Murao, Y., "Status of ICAP Activities in Japan," Proceedings of the SixteenthWater Reactor Safety Research Information Meeting, October 24-27, 1988,NUREG/CP-0097, Vol. 4, pp. 199-218.
J-994 Akimoto, J., Ohnuki, A., Kikuta, M., et al, "Assessment of J-TRAC Code withCCTF/SCTF Test Data," Proceedings of the Sixteenth Water Reactor SafetyResearch Information Meeting, October24-27, 1988, NUREG/CP-0097, Vol.4, pp. 583-606.
J-995 Okubo, T., Sugimoto, J., Iguchi, T., and Murao, Y., "DevelopmentalAssessment of REFLA-1 DS Code with Data from CCTF Tests for RefloodPhase of LOCA in PWRs with Cold-Leg-Injection Type ECCS," Proceedingsof the Fourth International Topical Meeting on Nuclear Reactor ThermalHydraulics (NURETH-4), Karlsruhe, FRG, October 10-13, 1989, Vol. 1, pp.190-195.
J-996 Murao, Y., Akimoto, H., Iguchi, T., et al, "Code Improvements Based onResults from the 2D/3D and ICAP Activities," Proceedings of theSeventeenth Water Reactor Safety Research Information Meeting, October23-25, 1989, NUREG/CP-0105, Vol. 3, pp. 159-186.
J-997 Asaka, H., Murao, Y., and Kukita, Y., "Assessment of TRAC-PF1Condensation Heat Transfer Model for Analysis of ECC Water InjectionTransients," Journal of Nuclear Science and Technoloav. Vol. 26, No. 11,pp. 1045-1057 (November 1989).
5-58

REPORTS AND PAPERS PUBLISHED BY US WITHIN 2D/3D PROGRAM
EVALUATION REPORTS
CCTF Core-I
U-401 "Research Information Report on the Results of the Core-I Test Series atthe Japan Atomic Energy Research Institute Cylindrical Core Test Facility,"prepared by MPR Associates, MPR-863, Revision 1, October 1985.
CCTF Core-Il
U-411 "Literature Survey of Emergency Core Cooling Tests Related to UpperPlenum Injection," prepared by MPR Associates, Revision 1, December 18,1985.
U-412 "CCTF-ll Research Information Report for Tests Related to Upper PlenumInjection (UPI)," prepared by MPR Associates, MPR-933, March 1987.
U-413 "Evaluation of Thermal Hydraulic Behavior in the CCTF-11 Best EstimateReflood Test," prepared by MPR Associates, Revision 1, April 20, 1987.
U-414 "Research Information Report for the Cylindrical Core Test Facility (CCTF)Core-Il Test Series (Excluding Tests Involving Upper Plenum Injection),"prepared by MPR Associates, MPR-934, April 1988.
SCTF Core-I
U-421 "Research Information Report on the Results of the Core-I Test Series atthe Japan Atomic Energy Research Institute Slab Core Test Facility,"prepared by MPR Associates, MPR-918, April 1988.
SCTF Core-Il
U-431 "Research Information Report on the Slab Core Test Facility (SCTF) Core-IlTest Series," prepared by MPR Associates, MPR-1 115, July 1989.
5-59
SCTF Core-Ill
U-441 "Research Information Report on the Slab Core Test Facility (SCTF) Core-IllTest Series," prepared by MPR Associates, MPR-1263, September 1992.
UPTF
U-451 "Upper Plenum Injection (UPI) of Emergency Core Coolant (ECC) --Previous Tests and Analyses, and Capabilities of the Upper Plenum TestFacility (UPTF) to Perform UPI Tests," prepared by MPR Associates,September 13, 1985.
U-452 "Summary of Results from the UPTF Hot Leg Separate Effects Test,Comparison to Scaled Tests and Application to U.S. Pressurized WaterReactors," prepared by MPR Associates, MPR-1024, Revision 1,December 1987.
U-453 "Evaluation of the UPTF Entrainment/De-entrainment Test," Revision 1,prepared by MPR Associates, April 1, 1988.
U-454 "Summary of Results from the UPTF Upper Plenum Injection (UPI) SeparateEffects Test, Comparison to Previous Scaled Tests and Application to U.S.Pressurized Water Reactors," prepared jointly by MPR Associates andSiemens (UB KWU) December 1988.
U-455 "Summary of Results from the UPTF Downcomer Separate Effects Tests,Comparison to Previous Scaled Tests and Application to U.S. PressurizedWater Reactors," prepared by MPR Associates, MPR-1 163, July 1990.
U-456 "Summary of Results from the UPTF Carryover/Steam Binding SeparateEffects Tests, Comparison to Previous Scaled Tests and Application to U.S.Pressurized Water Reactors," prepared by MPR Associates, MPR-1213,October 1990.
U-457 Theofanous, T.G., and Yan, H., "A Unified Interpretation of One- Fifth to FullScale Thermal Mixing Experiments Related to Pressurized Thermal Shock,"University of California at Santa Barbara, NUREG/CR-5677, April 1991.
U-458 "Summary of Results from the UPTF Cold Leg Flow Regime SeparateEffects Tests, Comparison to Previous Scaled Tests and Application to U.S.Pressurized Water Reactors," prepared by MPR Associates, MPR-1208,October 1992.
5-60

U-459 "Evaluation of Accumulator Nitrogen Discharge During a PWR Large BreakLOCA," prepared by MPR Associates, MPR-1 331, September 1992.
U-460 "Summary of Results from the UPTF Downcomer Injection/Vent ValveSeparate Effects Tests, Comparison to Previous Scaled Tests andApplication to U.S. Pressurized Water Reactors," prepared byMPR Associates, MPR-1329, September 1992.
CODE ANALYSIS REPORTS
CCTF Core-I
U-601 Motley, F., "Research Information Report Results From TRAC Analysis OfCylindrical Core Test Facility Core-I Test Series," Los Alamos NationalLaboratory, LA-2D/3D-TN-86-10, July 1986.
U-602 Okubo, T., and Fujita, R.K., "Summary of Analysis of TRAC-PD2 Post TestCalculations for CCTF Core-I Parametric Effects Test," Los Alamos NationalLaboratory, LA-2D/3D-TN-82-5, February 1982.
U-603 Ireland, J.R., "Cylindrical Core Test Facility (CCTF) Posttest SensitivityAnalysis of Test C1-1 (Run 10) Using TRAC-PD2," Los Alamos NationalLaboratory, LA-UR-80-1999, July 1980.
U-604 Motley, F., 'TRAC Analysis of CCTF Base Case Cl-5 (Run 14) with aMultidimensional Model," Los Alamos National Laboratory, LA-2D/3D-TN-81-29, September 1981.
U-605 Okubo, T., "Analysis of a TRAC-PD2 Post-test Calculation of CCTF Test Cl -5 (Run 14)," Los Alamos National Laboratory, LA-2D/3D-TN-81-26,October 1981.
U-606 Fujita, R.K, 'TRAC-PD2 Post-Test Analysis of CCTF Test Cl-5 (Run 14),"Los Alamos National Laboratory, LA-2D/3D-TN-81-27, October 1981.
U-607 Okubo, T., "An Analysis of a TRAC-PD2 Post-Test Calculation of CCTFTest C1 -6 (Run 15)," Los Alamos National Laboratory, LA-2D/3D-TN-81-34,October 1981.
U-608 Okubo, T., "An Analysis of a TRAC-PD2 Code Calculation for CCTF TestC1-6 (Run 15)," Los Alamos National Laboratory, LA-2D/3D-TN-82-8,March 1982.
5-61

U-609 Fujita, R.K., 'TRAC-PD2 Post Test Analysis of CCTF Test C1 -10 (Run 19),"Los Alamos National Laboratory, LA-2D/3D-TN-81-30, October 1981.
U-61 0 Brown, T., and Williams, K.A., 'TRAC-PD2 Post Test Analysis of CCTF TestC1-11 (Run 20)," Los Alamos National Laboratory, LA-2D/3D-TN-81-11,January 1981.
U-611 Fujita, R.K., "Analysis of CCTF Core-I Test Cl-11 (Run 20)," Los AlamosNational Laboratory, LA-2D/3D-TN-81-13, April 1981.
U-612 Fujita, R.K., 'TRAC-PD2 Post Test Analysis of CCTF Test C1-12 (Run 21),"
Los Alamos National Laboratory, LA-2D/3D-TN-81-31, October 1981.
U-613 Sugimoto, J., 'T'RAC-PD2 Reflood Code Assessment for CCTF Test C1 -16,"Los Alamos National Laboratory, LA-2D/3D-TN-81-9, February 1981.
U-614 Motley, F., 'T'RAC-PD2 Post Test Analysis of the CCTF Evaluation ModelTest 01-19 (Run 38)," Los Alamos National Laboratory, LA-2D/3D-TN-82-7,March 1982.
U-615 Akimoto, H., "Analysis of TRAC-PD2 and CCTF Results for the CylindricalCore Test Facility Evaluation Model Test C1-19 (Run 38)," Los AlamosNational Laboratory, LA-2D/3D-TN-82-9, September 1982.
U-616 Motley, F., 'TRAC-PD2 Analysis of CCTF Multidimensional Test 11 (Cl -20,Run 39)," Los Alamos National Laboratory, LA-2D/3D-TN-81-28, October1981.
U-617 Fujita, R.K., "Data Analysis of CCTF Core-I Base Case and SelectedParametric Effects Tests," Los Alamos National Laboratory, LA-2D/3D-TN-81-16, April 1981.
U-618 Williams, KA., "Double Blind Pretest Prediction of the CCTF Core-IEvaluation Model Test Using TRAC-PD2," Los Alamos National LaboratoryLA-2D/3D-TN-81-12, March 1981.
5-62

CCTF Core-Il
U-621 Crowley, C.J., Cappiello, M.W., and Boyack, B.E., "Summary Report ofTRAC-PF1 Assessment Against the CCTF Core-Il Data," Los AlamosNational Laboratory, LA-CP-89-17, February 1989.
U-622 Cappiello, M.W., Stumpf, H.J., and Boyack, B.E., "CCTF Core-Il UpperPlenum Injection Summary," Los Alamos National Laboratory, LA-2D/3D-TN-86-16, March 1987.
U-623 Kotas, J.F., 'T'RAC-PF1 Calculation of CCTF Core-Il Acceptance Test-1(C2-ACl, Run 51)," Los Alamos National Laboratory, LA-2D/3D-TN-83-1 0,September 1983.
U-624 Motley, F., 'rTRAC-PF1 Calculation of CCTF Core-Il Base Case (C2-SH1,Run 53)," prepared by Los Alamos National Laboratory, LA-2D/3D-TN-83-12, September 1983.
U-625 Crowley, C.J. and Rothe, P.H., 'TRAC-PF1 Calculation of CCTF Core-IlReflood Test 54 (C2-SH2)," Los Alamos National Laboratory, LA-2D/3D-TN-86-2, March 1986.
U-626 Boyack, B.E., 'TRAC-PF1/MOD1 Analysis of CCTF UPI Test C2-AA1(Run 57)," Los Alamos National Laboratory, LA-2D/3D-TN-86-6, April 1986.
U-627 Roberts, M., 'rTRAC-PF1/MOD1 Upper Plenum Nodalization Studies ofCCTF UPI Test C2-AA1 (Run 57)," Los Alamos National Laboratory,LA-2D/3D-TN-86-14, March 1986.
U-628 Siebe, D.A. and Boyer, B., 'The Analysis of CCTF Run 58 with TRACPF1/MOD1," Los Alamos National Laboratory, LA-2D/3D-TN-86-19.
U-629 Cappiello, M., "CCTF Run 59 TRAC-PF1/MOD1 Analysis," Los AlamosNational Laboratory, LA-2D/3D-TN-85-1, January 1985.
U-630 Kotas, J.F., 'The Effect of the Radial Power Upon the Reflood Phase of aLoss-of-Coolant Accident: A TRAC Analysis of CCTF Test C2-5 (Run 63)and CCTF Test C2-6 (Run 64)," Los Alamos National Laboratory,LA-2D/3D-TN-84-6, September 1984.
5-63

U-631 Slater, C.E., 'TRAC-PF1 Calculation of CCTF Core-Il Reflood Test C2-10(Run 69)," Los Alamos National Laboratory, LA-2D/3D-TN-85-7,September 1984.
U-632 Crowley, C.J., Fanning, M.W., and Rothe, P.H., 'TRAC-PF1 Calculation ofCCTF Core-Il Refill Test 70," Los Alamos National Laboratory, LA-2D/3D-TN-85-14, December 1985.
U-633 Stumpf, H.J. and Wiilcutt, G.J., "CCTF Run 71 TRAC-PFI/MOD1 Analysis,"Los Alamos National Laboratory, LA-2D/3D-TN-86-8, May 1986.
U-634 Cappiello, M.W., 'TRAC-PF1/MOD1 Analysis of CCTF No-Failure UPI TestC2-13 (Run-72)," Los Alamos National Laboratory, LA-2D/3D-TN-86-7,July 1986.
U-635 Crowley, C.J. and Rothe, P.H., 'TRAC-PF1 Calculation of CCTF Core-liReflood Test 75 (C2-15)," Los Alamos National Laboratory, LA-2D/3D-TN-86-1, April 1986.
U-636 Stumpf, H.J., "CCTF Run 76 TRAC-PFI/MOD1 Analysis," Los AlamosNational Laboratory, LA-2D/3D-TN-86-6, April 1986.
U-637 Stumpf, H.J., "CCTF Run 78 TRAC-PFI/MOD1 Analysis," Los AlamosNational Laboratory, LA-2D/3D-TN-86-5, May 1986.
U-638 Cappiello, M.W., 'TRAC-PFI/MOD1 Analysis of CCTF Combined InjectionTest Run 79," Los Alamos National Laboratory, LA-2D/3D-TN-86-20.
SCTF Core-I
U-641 Williams, K.A., "Research Information Report on the TRAC Analysis andExperimental Results of the Core-I Test Series at the Japan Atomic EnergyResearch Institute Slab Core Test Facility," prepared by Los AlamosNational Laboratory, LA-CP-88-52,March 1988.
U-642 Smith, S., "SCTF Steam Supply Design Analysis with TRAC," Los AlamosNational Laboratory, NUREG/CR-1946, May 1981.
U-643 Smith, S., "A Parametric Study of the Effect of Material Properties on theCalculated Rod Heatup Rate for the SCTF," Los Alamos NationalLaboratory, LA-2D/3D-TN-81-21, June 1981.
5-64

U-644 Smith, S., "Revision of the TRAC Calculational Model for the SCTF," LosAlamos National Laboratory, LA-2D/3D-TN-81-17, October 1981.
U-645 Smith, S., 'TRAC Analysis of the SCTF High Pressure Shakedown Test:Run 506," Los Alamos National Laboratory, LA-2D/3D-TN-81-22,October 1981.
U-646 Smith, S., 'TRAC Analysis of the SCTF Base Case Test Run 507," LosAlamos National Laboratory, LA-2D/3D-TN-81-23, October 1981.
U-647 Smith, S., 'TRAC Analysis of the SCTF Low Pressure Test: Run 508," LosAlamos National Laboratory, LA-2D/3D-TN-81-24, October 1981.
U-648 Smith, S., 'TRAC Analysis of the SCTF High Subcooling Test:Run 510," Los Alamos National Laboratory, LA-2D/3D-TN-81-25,December 1981.
U-649 Fujita, R.K., 'TrRAC-PD2 Analysis of SCTF Power-Effects Tests," Los AlamosNational Laboratory, LA-2D/3D-TN-82-3, March 1982.
U-650 Fujita, R.K., '1TRAC-PD2 Analysis of SCTF Peak Core Power-Effects Tests,"Los Alamos National Laboratory, LA-2D/3D-TN-82-5, March 1982.
U-651 Sudo, Y., "Analysis of TRAC and SCTF Results for System Pressure EffectsTests Under Forced Flooding: Runs 506, 507 and 508," Los AlamosNational Laboratory, NUREG/CR-2622 (LA-2D/3D-TN-81-33; LA-9258-MS)March 1982.
U-652 Smith, S., 'TRAC Analysis of the SCTF Forced Flooding ECC Injection RateTests: Runs 507, 511 and 515," Los Alamos National Laboratory,LA-2D/3D-TN-82-04, September 1982.
U-653 Smith, S., "Analysis of the SCTF FLECHT Counterpart Test Using TRAC-PF1 ," Los Alamos National Laboratory, LA-2D/3D-TN-83-02, January 1983.
U-654 Gilbert, J.S. and Williams, KA., "Rod Bundle Cross-Flow Study," LosAlamos National Laboratory, LA-2D/3D-TN-83-13, September 1983.
U-655 Osakabe, M., Gilbert, J.S., and Fujita, R.K., 'T'RAC-PD2 Analysis of RadialCore Pressure Loss During Reflood for Test S1-08," Los Alamos NationalLaboratory, LA-2D/3D-TN-83-16, December 1983.
5-65

U-656 Un, J.C., 'TRAC-PF1 Calculation of SCTF Core-I Combined Injection Test:Run 529," Los Alamos National Laboratory, LA-2D/3D-TN-84-7,November 1984.
SCTF Core-II
U-661 Shire, P.R., Gilbert, J.S., and Un, J.C., "SCTF Core-Il TRAC-PFI/MOD1Analysis Summary," Los Alamos National Laboratory, LA-CP-89-113,May 1, 1989.
U-662 Gilbert, J.S., ''RAC-PF1/MOD1 Calculation of SCTF Core-II Test S2-SH1(Run 604)," Los Alamos National Laboratory, LA-2D/3D-TN-85-6,March 1985.
U-663 Shire, P.R. and Boyack, B.E, "Upper-Plenum Studies of SCTF Run 605,"Los Alamos National Laboratory, LA-2D/3D-TN-86-15, August 1986.
U-664 Shire, P.R., 'TrRAC-PF1/MOD1 Re-Analysis of SCTF Core-Il Test S2-SH2(Run 605)," Los Alamos National Laboratory,LA-CP-87-103, December 1986.
U-665 Un, J.C., 'TRAC-PF1/MOD1 Calculation of SCTF Core-Il SupplyTest S2-03(Run 608)," Los Alamos National Laboratory, LA-2D/3D-TN-85-13, July1985.
U-666 Abe, Y., Lin, J.C., and Gilbert, J., 'TRAC-PF1/MOD1 Calculation of SCTFCore-Il Steam Supply Test S2-05 (Run 610)," Los Alamos NationalLaboratory, LA-2D/3D-TN-85-9, July 1985.
U-667 Gilbert, J.S., 'TRAC-PF1/MOD1 Calculation of SCTF Core-ll Test S2-06(Run 611)," Los Alamos National Laboratory, LA-2D/3D-TN-86-9,March 1986.
U-668 Lin, J.C., 'TRAC-PF1/MOD1 Calculation of SCTF Core-Il FLECHT-SETCoupling Test S2-08 (Run 613)," Los Alamos National Laboratory,LA-2D/3D-TN-85-2, February 1985.
U-669 Gilbert, J.S., 'TRAC-PF1/MOD1 Calculation of SCTF Core-Il Test S2-09(Run 614)," Los Alamos National "Laboratory, LA-2D/3D-TN-85-4,March 1985.
5-66
U-670 Gilbert, J.S., 'TRAC-PF1/MOD1 Calculation of SCTF Core-Il Test S2-12(Run 617)," Los Alamos National Laboratory, LA-2D/3D-TN-86-13,March 1987.
SCTF Core-Ill
U-681 Boyack, B.E., Shire, P.R., and Harmony, S.C., '1TRAC-PF1/MOD1 CodeAssessment Summary Report for SCTF Core-Ill," by Los Alamos NationalLaboratory, LA-CP-90-71, February 1990.
U-682 Gilbert, J.S., 'TRAC-PF1/MOD1 Calculation of Operational Study No. 1,"Los Alamos National Laboratory, LA-CP-87-112.
U-683 Harmony, S.C. and Boyack, B.E., "A Posttest Analysis of SCTF Run 703Using TRAC-PF1/MOD1," Los Alamos National Laboratory, (to be issued).
U-684 Mascheroni, P.L and Boyack, B.E., A Posttest Analysis of SCTF Run 704Using TRAC-PFI/MOD1 ," Los Alamos National Laboratory, LA-CP-88-131,June 1988.
U-685 Harmony, S.C., 'TRAC-PFI/MOD1 Analysis of SCTF Test S3-5 (Run 709),"Los Alamos National Laboratory, (to be issued).
U-686 Shire, P.R., 'TRAC-PF1/MOD1 Analysis of SCTF Core-Ill Test S3-9(Run 713)," Los Alamos National Laboratory, LA-CP-88-1 1, January 1988.
U-687 Harmony, S.C. and Boyack, B.E., "A Posttest Analysis of SCTF Run 714Using TRAC-PF1/MOD1 ," Los Alamos National Laboratory, LA-CP-88-234,September 1988.
U-688 Boyack, B.E., "A Posttest Assessment of TRAC-PFI/MODI andTRAC-PFI/MOD2 Using SCTF Core-Ill Run 719 (Test S3-15)," Los AlamosNational Laboratory, LA-CP-90-27, January 1990.
U-689 Rhee, G., "A Posttest Analysis of SCTF Run 720 Using TRAC-PF1/MOD1 ,"Los Alamos National Laboratory, (to be issued).
5-67

UPTF
U-701 Cappiello, M.W., 'TRAC-PF1 Calculations of a UPTF Intact Loop duringECC Injection," Los Alamos National Laboratory, LA-2D/3D-TN-81-20,May 1981.
U-702 Cappiello, M. "GPWR and UPTF Intact Loop Calculations - Assessment ofUPTF Alternative Loop Configurations," Los Alamos National Laboratory,LA-2D/3D-TN-82-2, January 1982.
U-703 Cappiello, M. "An Analysis of the UPTF Base Case with TRAC-PF1/MOD1 ,"Los Alamos National Laboratory, LA-2D/3D-TN-85-8, July 1985.
U-704 Ohnuki, A. and Cappiello, M.W., "Assessment of TRAC-PF1/MOD1 forCountercurrent-Annular and Stratified Flows," Los Alamos NationalLaboratory, LA-2D/3D-TN-85-3, September 1985 (publicly released as aJAERI-M Report - see J-629).
U-705 Dotson, P., "UPTF Downcomer Pretest Analysis," Los Alamos NationalLaboratory, LA-2D/3D-TN-85-1 0, October 1985.
U-706 Dotson, P., "Small-Break LOCA TRAC Pretest Calculation," Los AlamosNational Laboratory, LA-2D/3D-TN-86-4, December 1986.
U-707 Hedstrom, J., and Cappiello, M.W., "Results of a Pretest Analysis of theUPTF US/Japanese Integral Test," Los Alamos National Laboratory,LA-2D/3D-TN-86-17, March 1987.
U-708 Cappiello, M., "Posttest Analysis of the Upper Plenum Test Facility Small-Break Loss-of-Coolant Accident Test with TRAC-PF1/MOD1 and MOD2,"Los Alamos National Laboratory, LA-CP-88-154, July 1988.
U-709 Stumpf, H.J., "Posttest Analysis of UPTF Test 10B UsingTRAC-PFI/MODI," Los Alamos National Laboratory, LA-CP-90-1,January 1990.
U-710 Shire, P.R., 'TRAC-PF1/MOD2 Analysis of UPTF Test 20 Upper PlenumInjection in a Two-Loop PWR," Los Alamos National Laboratory,LA-CP-90-2, January 1990.
U-711 Siebe, D.A., and Stumpf, H.J., "Posttest Analysis of the Upper Plenum TestFacility Downcomer Separate Effects Tests with TRAC- PFI/MOD2," LosAlamos National Laboratory, LA-CP-90-299, July 1990.
5-68

U-712 Stumpf, H.J., "Posttest Analysis of UPTF Test 08 Using TRAC-PF1/MOD2,"Los Alamos National Laboratory, LA-CP-90-373, September 6, 1990.
U-713 Siebe, D.A., and Stumpf, H.J., "Assessment of the Ability of TRAC-PF1/MOD1 and TRAC-PF1/MOD2 to Predict Phenomena Related to SteamBinding," Los Alamos National Laboratory, LA-CP-92-79, March 1992.
U-714 Mullen, E. M., Stumpf, H. J. and Siebe, D. A., "Summary of Cold-Leg FlowPhenomena Observed in UPTF and CCTF Tests and TRAC PosttestAnalyses," Los Alamos National Laboratory, LA-CP-91-332,September 1991.
U-715 Mullen, E. M., Stumpf, H. J., and Siebe, D. A., "Summary of DowncomerInjection Phenomena for UPTF and TRAC Post-test Analysis," Los AlamosNational Laboratory, LA-CP-92-188, May 1992.
U-716 Siebe, D.A., and Stumpf, H.J., "An Assessment of TRAC-PF1/MOD2against Data from the Upper Plenum Test Facility for Accumulator NitrogenSurge," Los Alamos National Laboratory, LA-CP-92-408, November 1992.
US/J PWRs
U-721 Ireland, J. and Ules, D., "A TRAC-PD2 Analysis of a Large-Break Loss-of-Coolant Accident in a Reference US PWR, "Los Alamos NationalLaboratory, LA-2D/3D-TN-81-10, March 1981.
U-722 Fujita, R.K, Motely, F., and Williams, KA., 'TRAC-PF1 Analysis of a Best-Estimate Large-Break LOCA in Westinghouse PWR with Four Loops and17 x 17 Fuel," Los Alamos National Laboratory, LA-2D/3D-TN-83-4,September 1983.
U-723 Spore, J.W. and Cappiello, M.W., 'TRAC-PF1/MOD1 Analysis of a 200%Cold-Leg Break in a US/Japanese PWR with Four Loops and 15x1 5 Fuel,"Los Alamos National Laboratory, LA-2D/3D-TN-85-1 1, November 1985.
U-724 Coddington, P. and Motely, F., 'T'RAC-PF1/MOD1 Analysis of a MinimumSafeguards Large Break Loss-of-Coolant Accident in a 4-Loop PWR with17 x 17 Fuel," Los Alamos National Laboratory, LA-2D/3D-TN-86-3,August 1986.
U-725 Gido, R.G. and Cappiello, M.W., 'TRAC-PF1/MOD1 Analysis of a 200%Cold-Leg Break in a Babcock & Wilcox Lowered Loop Plant," Los AlamosNational Laboratory, LA-2D/3D-TN-86-12, October 1986.
5-69

U-726 Shire, P.R and Spore, J.W., 'TRAC-PFI/MOD1 Analysis of a MinimumSafeguards Large-Break LOCA in a US/Japanese PWR with Four Loopsand 15 x 15 Fuel," Los Alamos National Laboratory, LA-CP-87-61,April 1987.
U-727 Gruen, G.E. and Fisher, J.E., 'TRAC PF1/MOD1 US/Japanese PWRConservative LOCA Prediction," EGG Idaho, NUREG/CR-4965 (EGG-2513),November 1987.
GPWRs
U-741 Motley, F. and Cappiello, M., 'TRAC-PD2 Hot Leg Sensitivity Study," LosAlamos National Laboratory, LA-2D/3D-TN-81-1, February 1981.
U-742 Motley, F., "Review of the TRAC Calculated GPWR Upper Plenum/CoreFlow Conditions to Aid in the Design of UPTF," Los Alamos NationalLaboratory, LA-2D/3D-TN-81-19, May 1981.
U-743 Motley, F., and Williams KA., 'TRAC-PD2 Calculation of a Double-EndedCold-Leg Break in a Reference German PWR," Los Alamos NationalLaboratory, LA-2D/3D-TN-81-32, January 1981.
U-744 Motley, F., '1TRAC-PF1 Calculation of a Reference German PWR at theInitiation of ECC Injection," Los Alamos National Laboratory,LA-2D/3D-TN-81-8, February 1981.
U-745 Cappiello, M.W., 'rTRAC-PF1 Sensitivity Studies of a GPWR Intact LoopDuring ECC Injection," Los Alamos National Laboratory,LA-2D/3D-TN-81-18, May 1981.
U-746 Cappiello, M.W., and Hrubisko, M., "GPWR-1982 TRAC-PF1 Input DeckDescription," Los Alamos National Laboratory, LA-2D/3D-TN-82-10,December 1982.
U-747 Cappiello, M.W., "GPWR-1 982 TRAC-PF1 Base Case Results," Los AlamosNational Laboratory, LA-2D/3D-TN-83-6, February 1983.
U-748 Cappiello, M.W., and Vojtek, I., 'TRAC-PF1 Analysis of a 200% Hot LegBreak in a German PWR," Los Alamos National Laboratory, LA-2D/3D-TN-83-8, August 1983.
5-70

ADVANCED INSTRUMENTATION REPORTS
Evaluation of Instrument Performance
U-801 "Program Plan for Correction of US Instrument Degradation or Failure in theUpper Plenum Test Facility (UPTF) in the Federal Republic of Germany,"prepared by the Nuclear Regulatory Commission, NUREG-1 284, July 1987.
U-802 "Insights Derived from USNRC Advanced Instrumentation in CCTF andSCTF," prepared by MPR Associates, MPR-1035, December 1987.
U-803 Fuilmer, K.S., "Review of INEL SCTF Instrumentation," EGG Idaho,EGG-3D-6370, November 1983.
U-804 Fullmer, K.S., "Review of INEL CCTF Instrumentation," EGG Idaho,EGG-3D-6544, April 1984.
U-805 Fullmer, K.S., "Review of INEL CCTF-II Instrumentation," EGG Idaho,EGG-3D-6981, September 1985.
U-806 Fullmer, K.S., "Review of INEL SCTF Core-Il Instrumentation," EGG Idaho,EGG-3D-6982, September 1985.
U-807 Hardy, J.E. and Herskovitz, M.B., "Assessment of the Adequacy of ORNLInstrumentation in Reflood Test Facilities," Oak Ridge National Laboratory,NUREG/CR-3651, (ORNL/TM-9067), April 1985.
U-808 Hardy, J.E., et.al., "ORNL Instrumentation Performance for Slab Core TestFacility (SCTF) - Core 1 Reflood Test Facility," Oak Ridge NationalLaboratory, NUREG/CR-3286 (ORNI/TM-8762), November 1983.
U-809 "ORNL Instrumentation Performance for Slab Core Test Facility Runs 604,608 and 613," prepared by Oak Ridge National Laboratory,ORNL/NRC/LTR-85/19, June 1985.
U-81 0 "Performance of ORNL Instrumentation in Cylindrical Core Test Facility -Core-Il (CCTF-II) for Runs 075, 076 and 079," prepared by Oak RidgeNational Laboratory, ORNL/NRC/LTR-85/18, June 1985.
U-811 Morgan, K.A., "SCTF I Uncertainty Analysis," EGG Idaho, EGG-CAAD-5398,September 1981.
5-71

U-812 Morgan, K.A., "CCTF I Uncertainty Analysis," EGG Idaho, EGG-CAAD-5704,December 1981.
U-813 Lassahn, G.D., "BMFT UPTF Advanced Instrumentation UncertaintyAnalysis Report," EGG Idaho, EGG-3D-6751, February 1985.
Instrument Interpretation in Two-Phase Flow
U-821 "Review and Evaluation of ORNL Instrument Development Loop Data andFormulation of a Mass Flow Rate Calculation Scheme," prepared byMPR Associates, March 1983.
U-822 "A Study of Special Effects Around a Tie Plate Turbine Meter in Two-PhaseUpflow," prepared by MPR Associates, MPR-826, June 1984.
U-823 "Evaluation of a Steady State Mass Flow Rate Calculation Method UsingORNL Instrument Development Loop Transient Data," prepared byMPR Associates, MPR-859, January 1985.
U-824 Hardy, J.E., "Mass Flow Measurements Under PWR Reflood Conditions ina Downcomer and at a Core Barrel Vent Valve Location," Oak RidgeNational Laboratory, NUREG/CR-2710 (ORNL/TM-8331), 1982.
U-825 Thomas, D.G. and Combs, S.K., "Measurement of Two-Phase Flow at theCore/Upper Plenum Interface for a PWR Geometry Under SimulatedReflood Conditions, Oak Ridge National Laboratory, NUREG/CR-3138(ORNLITM-8204), 1983.
U-826 Lassahn, G.D., "Mass Flow Estimation Using Subroutines DRPOF4 andEMDOT4," EGG Idaho, EGG-3D-6305, July 1983.
Film and Impedance Probes
U-831 Eads, B.G., et.al., "Advanced Instrumentation for Reflood Studies ProgramQuarterly Progress Report (October-December 1977)," Oak Ridge NationalLaboratory, ORNL/NUREG/TM-202, 1977.
U-832 Moorhead, A.J., et.al., "Fabrication of Sensors for High-Temperature SteamInstrumentation Systems," Oak Ridge National Laboratory,NUREG/CR-1359 (ORNL/NUREG-65), 1980.
5-72

U-833 Hardy, J.E., et.al., 'Transient Testing of an In-core Impedance Flow Sensorin a 9-Rod Heated Bundle," Oak Ridge National Laboratory,ORNLJNUREG/TM-389, 1981
U-834 Hardy, J.E and Hylton, J.O., "Electrical Impedance String Probes for Two-Phase Void and Velocity Measurements," Oak Ridge National Laboratory,ORNI/NUREG/TM-8172, 1982.
Turbine Meters
U-841 "CCTF-lI Operation and Maintenance Manual - Turbine FlowmeterMeasurement System," Measurements Incorporated OM-236-1, July 1981.
U-842 Jensen, M.F., 'Turbine Flowmeter System Tests," EGG Idaho,EGG-3D-5372, March 1981.
Drag Discs
U-846 "CCTF Operation and Maintenance Manual-Instrumented Spool Piece andDowncomer Drag Disk Flow Measurement Systems," prepared by EGGIdaho, EGG-3D-5105, March 1980.
U-847 "UPTF Drag Disk Transducer Test Report," EGG Idaho, EGG-3D-6980,
July 1985.
Gamma Densitometers
U-851 "SCTF Operation and Maintenance Manual Single-Beam DensityMeasurement Systems," prepared by EGG Idaho, EGG-3D-5179,January 1981.
U-852 Rohrdanz, R.F., "Prototype Test Report for the SCTF Single Beam DensityMeasuring Systems," EGG Idaho, EGG-3D-5457, June 1981.
U-853 Grimesey, R.A. and Tomberlin, T.A., "Radiation Shielding Calculations forUPTF Gammaray Densitometer," EGG Idaho, EGG-PHYS-6201,March 1983.
U-854 Menkhaus, D.E., "BMFT UPTF Densitometer System Test Report,"EGG Idaho, EGG-RTH-7075, November 1985.
5-73

Liquid Level Detectors/Fluid Distribution Grid
U-861 "CCTF Operation and Maintenance Manual -- Conductivity Liquid LevelMeasurement System (CLLMS)," EGG Idaho, EGG-3D-5046,December 1979.
U-862 "Optical Liquid-Level Detector Two-Phase Flow Test Report," EGG Idaho,EGG-3D-4523, May 1981.
Spool Pieces and Pipe Flowmeters
U-866 "SCTF Operation and Maintenance Manual - Cold Leg and Vent PipeInstrumented Spool Pieces and Downcomer Drag Disk Flow MeasurementSystems," prepared by EGG Idaho, EGG-3D-5177, March 1981.
U-867 "SCTF Operation and Maintenance Manual - Hot Leg Spool Piece FlowMeasurement System," prepared by EGG Idaho, EGG-3D-5178,March 1981.
U-868 Cornell, J.A., 'Two-Phase Flow Testing of SCTF Hot Leg Spool Piece DataAnalysis Report," EGG Idaho, EGG-3D-5416, April 1981.
Velocimeters
U-871 "CCTF-ll Operation and Maintenance Manual -- Cooled Velocimeter FlowMeasurement System," prepared by EGG Idaho, EGG-3D-5809, April 1982.
U-872 Menkhaus, D.E., "CCTF-ll Cooled Velocimeter Probe Performance TestReport," EGG Idaho, EGG-3D-551 1, December 1981.
Video Probes
U-876 "CCTF-lI Operation and Maintenance Manual - Video Probe Systems,"prepared by EGG Idaho, EGG-3D-5772, April 1982.
5-74
PAPERS, PRESENTATIONS, AND CORRESPONDENCE
Papers - Data Evaluation
U-901 Zuber, N., "Proposed UPTF Thermal Mixing Experiments," presented at the2D/3D Coordination Meeting, Mannheim, FRG, June 1985.
U-902 Theofanous, T.G., Iyer, K., Nourbakhsh, H.P., and Shabana, E., "Scaling ofThermal Mixing Phenomena from 1/5 to Full-Scale Test Facilities,"Proceedings of the Fourteenth Water Reactor Safety Information Meeting,October 27 - 31, 1986, Vol. 4, pp. 363-386.
U-903 Naff, S.A., "UPTF-Experiment Core Simulator Entrainment/De-entrainmentTest 1 OC," Handout G-5 from 2D/3D Coordination Meeting, Mannheim,FRG, May 1987.
U-904 Damerell, P.S., Ehrich, N.E., and Wolfe, KA., "Use of Full-Scale UPTF Datato Evaluate Scaling of Downcomer (ECC Bypass) and Hot Leg Two-PhaseFlow Phenomena," Proceedings of the Fifteenth Water Reactor SafetyResearch Information Meeting, October 26-29, 1987, NUREG/CP-0091,Vol. 4, pp. 143-165.
U-905 Rhee, G., Damerell, P., and Simons, J., "Use of 2D/3D Data to Scale UpLiquid Carryover/De-entrainment (Steam Binding) Behavior to a PWR,"Proceedings of the Sixteenth Water Reactor Safety Research InformationMeeting, October 24-27, 1988, NUREG/CP-0097, Vol, 4, pp. 485-509.
U-906 Russell, A., Damerell, P., Ahrens, G., and Weiss, P., "UPTF Upper PlenumInjection (UPI) Test Results and Application to PWR," Proceedings of theSixteenth Water Reactor Safety Research Information Meeting, October 24-27, 1988, NUREG/CP-0097, Vol. 4, pp. 511-531.
Papers - Code Analysis
U-911 Coddington, P., 'The Effect of Accumulator Nitrogen on the Reflood of aPWR Core during a Large Break LOCA," presented at the IAEA SpecialistsMeeting on Fuel Behavior under Accident Conditions and AcceptanceCriteria, Warsaw, Poland, September 30 - October 4, 1985.
5-75

Papers - Instrumentation
U-921 Eads, G.B., et al., "Development of In-Vessel Reflood Instrumentation atORNL," Meeting of the Japanese Nuclear Society, Osaka, Japan,March 26-28, 1979.
U-922 Combs, S.K, and Hardy, J.E., "An Experimental Investigation of FlowMonitoring Instrument in the Upper Plenum of an Air-Water Reflood TestFacility," Symposium on Polyphase Flow and Transport Technology, ASMECentennial Meeting, San Francisco, CA, August 12-15, 1980.
U-923 Zabriskie, W.L., et al., "Instrumentation Development for Low Range, LongLine Differential Pressure Measurements," ISA Transactions Vol. 20, No. 4,pp. 61-75 (1981).
U-924 Hardy, J.E., and Hylton, J.O., "Electrical Impedance String Probes for Two-Phase Void and Velocity Measurements," International Journal ofMultiphase Flow. October 1984.
U-925 Hardy, J.E., et al., "Measurement of Two-Phase Flow Momentum with ForceTransducers," presented at International Symposium on Gas-Liquid Two-Phase Flows, ASME Winter Annual Meeting, Dallas, Texas, November 1990,CONF-901109-1.
Correspondence
U-931 "US Input to Definition of Test Objectives and Conditions for UPTF Fluid-Fluid Mixing Test (Test No. 1 in Matrix and Sequence)," enclosure to MPRletter from P. Damerell to L Shotkin (USNRC), February 14, 1986.
U-932 "US Input to Definition of Test Objectives and Conditions for the Third UPTFCold Leg Injection Integral Test No. 27," enclosure to MPR letter fromP. Damerell to G. Rhee (USNRC), February 3, 1989.
5-76
REPORTS AND PAPERS EXTERNAL TO 2D/3D PROGRAM
DATA REPORTS
ECC Delivery Depressurization
E-001 Crowley, C.J., et al., "1/5 Scale Countercurrent Flow Data Presentation andDiscussion," Creare, NUREG/CR-2106 (Creare TN-333), November 1981.
E-002 Crowley C.,J., et al., "Downcomer Effects in a 1/15 Scale PWR Geometry -Experimental Data Report," Creare, NUREG-0281, May 1977.
E-003 Crowley, C.J., and Sam, R.G., "Experimental Data Report for FlashingTransients," Creare, NUREG/CR-2060 (Creare TN-330), February 1982.
E-004 Cudnik, R.A., et al., 'T'opical Report on Penetration Behavior in a1/15 Scale Model of a Four-Loop Pressurized Water Reactor," BattelleColumbus Labs, BMI-NUREG-1973, June 1977.
Upper Plenum Injection
E-01 1 "Experimental Data Report for Semiscale Mod-1 Tests S-05-6 and S-05-7(Alternate ECC Injection Tests)," prepared by EGG Idaho,TREE-NUREG-1055, June 1977.
Hot Lea Countercurrent Flow/Reflux Condenser Mode
E-021 "Experiment Data Report for Semiscale Mod-2A Natural CirculationTests S-NC-2B, S-NC-3 and S-NC-4B," prepared by EGG Idaho,NUREG/CR-2454, December 1981
E-022 "Experiment Data Report for Semiscale Mod-2A Natural CirculationTests S-NC-5 and S-NC-6," prepared by EGG Idaho, NUREG/CR-2501,January 1982.
E-023 "Experimental Operating Specification, Natural Circulation Test Series,Semiscale Mod-2A," prepared by EGG Idaho, EGG-SEMI-5427, April 1981.
Accumulator Nitroaen Discharge
E-031 Denham, M.K and Dore, P., "ISP-25, Boundary Conditions andExperimental Procedure for ACHILLES Run Al BI 05," AEEW, SESDNote 495, September 1988.
5-77
EVALUATION REPORTS
General
E-401 "Compendium of ECCS Research for Realistic LOCA Analysis,"NUREG-1230, December 1988.
ECC Delivery during Depressurization
E-411 Beckner, W.D. et al., "Analysis of ECC Bypass Data," USNRC,NUREG-0573, July 1979.
E-412 Beckner, W.D., et al., "PWR Lower Plenum Refill Research Results," USNRCResearch Information Letter No. 128, December 8, 1981.
E-413 "A Preliminary Study of Annulus ECC Flow Oscillations," Creare, NP-839,Research Project 347-1, August 1978.
E-414 Crowley, C.J., et al., "An Evaluation of ECC Penetration Using Two ScalingParameters," Creare, Creare TN-233, September 1976.
E-415 Rothe, P.H., 'Technical Summary Attachment to ECC Bypass RIL Volume I:Review of Findings," Creare, NUREG/CR-0885, Vol. 1 (Creare TN-296,Vol. 1), July 1979.
E-416 Crowley, C.J., Wei, S., Murrary, J.G., Rothe, P.H., and McKenna, S.A.,'Technical Summary Attachment to ECC Bypass RIL Volume II: TechnicalAppendices," Creare, NUREG/CR-0885, Vol. 2 (Creare TN-296, Vol. 2),July 1979.
E-417 Crowley, C.J., and Sam, R.G., "Experimental Facility and Preliminary Resultsfor Flashing Transients at 1/5 Scale," Creare, Creare TM-707, July 1980.
E-418 Crowley, C.J., Wei, S. and Rothe, P.H., "Analysis of Flashing TransientEffects During Refill," Creare, NUREG/CR-1765, March 1981.
E-419 Crowley, C.J., "Summary of Refill Effects Studies with Flashing and ECCInteractions," Creare, NUREG/CR-2058, November 1981.
E-420 Carbiener, W.A., et al., "Steam-Water Mixing an System HydrodynamicsProgram; Task 4; Quarterly Progress Report; January 1, 1977 - March 31,1977," Battelle Columbus Labs, BMI-NUREG-1972, May 1977.
5-78

E-421 Segev, A. and Collier, R.P., "Development of a Mechanistic Model for ECCPenetration in a PWR Downcomer," Battelle Columbus Labs,NUREG/CR-1426, June 1980.
E-422 Segev, A. and Collier, R.P., "Application of Battelle's Mechanistic Model toLower Plenum Refill," Battelle Columbus Labs, NUREG/CR-2030,March 1981.
Loop Behavior
E-431 Brodrick, J.R., Burchill, W.E., and Lowe, P.A., "1/5 Scale Intact Loop Post-LOCA Steam Relief Tests," Combustion Engineering, CENPD-63,Revision 1, March 1973.
E-432 Burchill, W.E., Lowe, P.A., and Brodrick, J.R., "Steam-Water Mixing TestProgram Task D: Formal Report for Task B and Final Report for the SteamRelief Phases of the Test Program," Combustion Engineering,AEC-COO-2244-1 (CENPD-101), October 1973.
E-433 Rothe, P.H., Wallis, G.B., and Thrall, D.E., "Cold Leg Flow Oscillations,"Creare Inc., EPRI NP-282, November 1976.
E-434 Crowley, C.J., Sam, R.G. and Rothe, P.H., "Summary Report: Hot LegECC Flow Reversal Experiments," Creare R & D, Creare TM-870, 1982.
E-435 Lilly, G.P., Stephens, A.G. and Hochreiter, LE., "Mixing of Emergency CoreCooling Water with Steam: 1/14 Scale Testing Phase," WestinghouseElectric Corporation, WCAP-8307 (EPRI Program 294-2), January 1975.
E-436 Lilly, G.P. and Hochreiter, LE., "Mixing of Emergency Core Cooling Waterwith Steam: 1/3 Scale Test and Summary," Westinghouse ElectricCorporation, WCAP-8423 (EPRI Program 294-2), June 1975.
Fluid/Fluid Mixing
E-441 Theofanous, T., et. al, "Decay of Buoyancy Driven Stratified Layers withApplication to PTS," Purdue University, NUREG/CR-3700, February 1984.
Core Thermal-Hydraulic Behavior
E-451 Bruestle, H.R., et. al., 'Thermal-Hydraulic Analysis of the Semiscale Mod-1Reflood Test Series (Gravity Feed Tests)," Idaho National EngineeringLaboratory, TREE-NUREG-1010, January 1977.
5-79

E-452 Cadek, F.F., et. al., "PWR FLECHT Final Report Supplement,"Westinghouse Electric Corporation, WCAP-7931, October 1972.
E-453 Catton, I., and Toman, W.I., "Multidimensional Thermal-Hydraulic RefloodPhenomena in a 1692-Rod Slab Core," EPRI-NP-2392, 1982.
E-454 Conway, C.E., et. al., "PWR FLECHT Separate Effects and Systems EffectsTest (SEASET), Program Plan," Westinghouse Electric Corporation,WCAP-9183, November 1977.
E-455 DeJarlais, G. and Ishii, M., "Inverted Annular Flow Experimental Study,"Argonne National Laboratory, NUREG/CR-4277.
E-456 Addobo, C., Piplies, L and Riebold, W. L, "LOBI-MOD 2: FacilityDescription and Specification for OECD-CNI International Standard ProblemNo. 18 (ISP-1 8): Volume 1 - Geometrical Configuration of the Test Facility,"CEC Communication No. 4010, July 1983.
E-457 Erbacher, F. J., Neltzel, H. J., and Wiehr, K., "Cladding Deformation andEmergency Core Cooling of a Pressurized Water Reactor in a LOCA,"Summary Description of the REBEKA Program, KfK-4781, August 1990.
E-458 Kremin, H., et. al., 'Transientenuntersuchungen in der PKL-Anlage(PKL III A) Abschlussbericht, Band 2: Beschreibung der Versuchsanlage,"Siemens/KWU, U9 414/89/018, September 1989.
E-459 Arrieta, L and Yadigaroglu, G., "Analytical Model for Bottom RefloodingHeat Transfer in Ught Water Reactors (The UCFLOOD Code)," Universityof California, EPRI NP-756, August 1978.
E-460 "LOBI-MOD2: Research Program A Final Report," CEC CommunicationNo. 4333, October 1990.
E-461 Wiehr, K., "REBEKA-Buendelversuche: Untersuchungen zurWechselwirkung Zwischen aufblaehenden Zirkaloy-Huellen undeinsetzender Notkuehlung," Abschlussbericht, KfK-4407, May 1988.
E-462 Costigan, G., 'Visualization of Single Tube Reflooding Experiments byDynamic Neutron Radiography," Harwell Report, AERE-R1 2118, 1986.
5-80
Upper Plenum Indection
E-465 Barathan, D., et. al., "An Investigation of the Distribution and Entrainmentof ECC Water Injection into the Upper Plenum," Thayer School ofEngineering, Dartmouth College, NUREG/CR-1078, January 1980.
Tie Plate Countercurrent Flow
E-471 Jones, D.D., "Subcooled Countercurrent Flow Umiting Characteristics of theUpper Region of a BWR Fuel Bundle," General Electric Company, NuclearSystems Products Division, NEDG-NUREG-23549, 1977.
Steam BindinQ
E-481 Howard, R.C. and Hochreiter, LE., "PWR FLECHT SEASET SteamGenerator Separate Effects Task Data Analysis and Evaluation Report:NRC/EPRI/Westinghouse Report No. 9," Westinghouse ElectricCorporation, NUREG/CR-1534 (EPRI NP-1461; WCAP-9724),February 1982.
Hot Leg Countercurrent Flow/Reflux Condenser Mode
E-491 Krolewski, S.M., "Flooding Umits in a Simulated Nuclear Reactor Hot Leg,"Massachusetts Institute of Technology, Submission as Part of Requirementfor a B.Sc., 1980.
E-492 "PWR FLECHT-SEASET Systems Effects, Natural Circulation and RefluxCondensation," prepared by Westinghouse Electric Corporation,NUREG/CR-3654 (EPRI NP-3497; WCAP-10415), August 1984.
E-493 Richter, H.J., Wallis, G.B., Carter, K.H. and Murphy, S.L, "Deentrainmentand Countercurrent Air-water Flow in a Model PWR Hot Leg," ThayerSchool of Engineering, September 1978.
E-494 "ROSA-IV Large Scale Test Facility (LSTF) System Description,"JAERI-M 84-237, January 1985.
E-495 Wallis, G.B., "Flooding in Stratified Gas-Uquid Flow," Dartmouth CollegeReport No. 27327-9, August 1970.
E-496 Zuber, N., "Problems in Modeling of Small Break LOCA," US NuclearRegulatory Commission, NUREG-0724, October 1980.
5-81

Vent Valves
E-501 "Ueberstromvorrichtungen, Funktionssicherheit in der ersten Blowdown-Phase," FE-report Nr. 902-J 32 A (83), BMFT Research Program 150 376.
PWRs
E-511 Combustion Engineering System 80 Preliminary Safety Analysis Report(CESSAR), Docket STN-50-470.
E-512 Trojan Nuclear Plant Final Safety Analysis Report, Docket 50344-38.
E-513 Crystal River Unit 3 Final Safety Analysis Report, Docket 50-302.
E-514 Genkai Nuclear Plant Units 3 and 4 Final Safety Analysis Report.
E-515 Tomari Nuclear Plant Units 1 and 2 Safety Analysis Report.
CODE ANALYSIS REPORTS
General
E-601 Taylor, D.D., Shamway, R.W., and Singer, G.L, 'TRAC-BD1/MODI: AnAdvanced Best Estimate Computer Program for Boiling Water ReactorTransient Analysis," EG&G Idaho, NUREG/CR-3633 (EGG-2294),April 1984.
E-602 Boyack, B.E., Stumpf, H.J. and Ume, J.F., 'TRAC User's Guide,"Los Alamos National Laboratory NUREG/CR-4442 (LA-10590-M),November 1985.
E-603 'TRAC-PF1/MOD1: An Advanced Best-Estimate Computer Program forPressurized Water Reactor Thermal-Hydraulic Analysis," Los AlamosNational Laboratory, NUREG/CR-3858, July 1986.
E-604 'TRAC-PF1/MOD1 Correlations and Models," prepared by Los AlamosNational Laboratory, NUREG/CR-5069 (LA-1 1208-MS), December 1988.
E-605 'TRAC-PF1/MOD2 Code Manual: User's Guide," prepared by Los AlamosNational Laboratory, NUREG/CR-5673, Vol. 2, July 1992.
5-82

E-606 'TRAC-PF1/MOD2 Code Manual: Theory," prepared by Los AlamosNational Laboratory, NUREG/CR-5673, Vol. 1, (to be published).
E-607 'TRAC-PF1/MOD2 Code Manual: Programmer's Guide," prepared by LosAlamos National Laboratory, NUREG/CR-5673, Vol. 3, July 1992.
E-608 'TRAC-PF1/MOD2 Code Manual: Developmental Assessments," preparedby Los Alamos National Laboratory, NUREG/CR-5673, Vol. 4, (to bepublished).
E-609 "Quantifying Reactor Safety Margins: Application of Code Scaling,Applicability, and Uncertainty Evaluation Methodology to a Large-Break,Loss-of-Coolant," Idaho National Engineering Laboratory, NUREG/CR-5249,December 1989.
ECC Delivery During Depressurization
E-611 Rohatgi, U.S., et al., "Bias in Peak Clad Temperature Predictions Due toUncertainties in Modeling of ECC Bypass and Dissolved Non-condensibleGas Phenomena," Brookhaven National Laboratory, NUREG/CR-5254,September 1990.
Hot Leg Countercurrent Flow/Reflux Condenser Mode
E-621 Dillistone, M.J., "Analysis of the UPTF Separate Effects Test 11 (Steam-Water Countercurrent Flow in the Broken Loop Hot Leg) UsingRELAP5/MOD2," Winfrith Technology Centre, AEEW-M2555, August 1989(also published as NUREG/IA-0071, June 1992).
E-622 Thompson, S.L. and Kmetyk, LN., "RELAP5 Assessment: PKL NaturalCirculation Tests," Sandia National Laboratories, NUREG/CR-3100(SAND82-2902), January 1983.
PAPERS, PRESENTATIONS, AND CORRESPONDENCE
ECC Delivery During Depressurization
E-901 AIb, G.P., and Chambre, P.L, "Correlations for the Penetration of ECCWater in a Model of a PWR Downcomer Annulus," Nuclear Engineerinq andDesign. 53, pp. 237-248 (1979).
5-83
E-902 Bankoff, S.G. and Lee, S.C., "A Brief Review of Countercurrent FloodingModels Applicable to PWR Geometries," Nuclear Safety. 26, 139-152 (1985).
E-903 Segev, A.; Flanigan, L.J.; Kurth, R.E. and Collier, R.P., "CountercurrentSteam Condensation and its Application to ECC Penetration," presented atthe 19th National Heat Transfer Conference, Orlando, Florida, July 1980.
E-904 Simpson, H.C. and Rooney, D.H., "Further Studies of Non-EquilibriumDuring Refilling a PWR," University of Strathclyde Glasgow, Scotland, UK,presented at European Two-Phase Flow Group Meeting, Zurich,Switzerland, June 1983.
Loop Behavior
E-911 Aoki, S., Inoue, A., Kozawa, Y., and Akimoto, H., "Direct ContactCondensation of Flowing Steam onto Injected Water," Proceedings of theSixth International Heat and Mass Transfer Conference, Toronto, OntarioAugust 1978, Volume 6, pp. 107-112.
E-912 Aya, L and Nariai, H., 'Threshold of Pressure and Fluid OscillationsInduced by Injection of Subcooled Water into Steam Flow in HorizontalPipe," Proceedings of ASME-JSME Thermal Engineering Joint Conference,Vol. 3, pp. 417-424, 1983.
E-913 Block, J.A., "Condensation-Driven Fluid Motions," International Journal ofMultiphase Flow. Volume 6, pp. 113-129 (1980).
E-914 Daly, B.J. and Harlow, F.H., "A Model of Countercurrent Steam-Water Flowin Large Horizontal Pipes," Nuclear Science and Engineering. Vol. 77, pp.273-284 (1981).
E-915 Nariai, H. and Aya, I., "Fluid and Pressure Oscillations Occurring at DirectContact Condensation of Steam Flow with Cold Water," NuclearEngineering and Design Vol. 95, pp. 35-45 (1986).
E-916 Rothe, P.H.; Wallis, G.B. and Block J.A., "Cold Leg ECC Flow Oscillations,"presented at Symposium on Thermal and Hydraulic Aspects of NuclearReactor Safety, Vol. 1: Light Water Reactors, pp. 133-150, 1977.
5-84

Fluid/Fluid Mixinq
E-921 lyer, K., Gherson, P. and Theofanous, T.G., "Purdue's One-half Scale HPIMixing Test Program," Proceedings of the Second Nuclear Thermal-Hydraulics Meeting of the Annual ANS Meeting, New Orleans, LA, USA,June 3 - 7, 1984, pp. 859 - 861.
E-922 lyer, K. and Theofanous, T.G., "Decay of Buoyancy Driven Stratified Layerswith Applications to PTS: Reactor Predictions," Proceedings from theNational Heat Transfer Conference, Denver, CO, USA, August 4 - 7, 1985.
E-923 lyer, K. and Theofanous, T.G., "Flooding-Limited Thermal Mixing: The Caseof High-Fr Injection," presented at the Third International Topical Meetingon Reactor Thermal Hydraulics, Newport, RI, USA, October 15 - 18, 1985.
E-925 Theofanous, T. and lyer, K, "Mixing Phenomena of Interest to SBLOCA's,"presented at Specialists Meeting on Small-break LOCA Analyses in LWRs,Pisa, Italy, June 23-27, 1985.
E-926 Theofanous, T.G. and Nourbakhsh, "PWR Downcomer Fluid TemperatureTransients due to High Pressure Injection at Stagnated Loop Flow,"Proceedings of the Joint NRC/ANS Meeting on Basic Thermal HydraulicMechanisms in LWR Analysis, September 14 - 15, 1982, Bethesda, MD,USA, NUREG/CP-0043, pp. 583 - 612.
Tie Plate Countercurrent Flow
E-931 Bankoff, S.G., Tankin, R.S., Yuen, M.C. and Hsieh, C.L., "CountercurrentFlow of Air/Water and Steam/Water through a Horizontal Perforated Plate,"International Journal of Heat Mass Transfer, Vol. 24, No. 8, pp. 1381-1395(1981).
E-932 Dilber, I. and Bankoff, S.G., "Countercurrent Flow Limits for Steam and ColdWater through a Horizontal Perforated Plate with Vertical Jet Injection,"International Journal of Heat Mass Transfer, Vol. 28, No. 12, pp. 2382-2385(1985).
E-933 Kutateladze, SS., "Elements of the Hydrodynamics of Gas-Liquid Systems,Fluid Mechanics," Soviet Research. Vol. 1, No. 4 (1972).
5-85
E-934 Naitoh, M., Chino, K and Kawabe, R., "Restrictive Effect of AscendingSteam on Falling Water during Top Spray Emergency Core Cooling,"Journal of Nuclear Science and Technology. Vol. 15, No. 11, pp. 806-815(November 1978).
Hot Leg Countercurrent Flow/Reflux Condenser Mode
E-941 Gardner, G.C., "Flooded Countercurrent Two-Phase Flow in HorizontalTubes and Channels," International Journal of Multiphase Flow Vol. 9,No. 4, pp. 367-382 (1983).
E-942 Larson, T.K, et. al., "Scaling Criteria and an Assessment of SemiscaleMod-3 Scaling for Small-Break Loss-of-Coolant Transients," presented atthe Joint NRC/ANS Meeting on Basic Thermal-Hydraulic Mechanisms inLWR Analysis, Bethesda, MD, September 14-15, 1982.
E-943 Mandl, R.M. and Weiss, P.A., "PKL Tests on Energy Transfer Mechanismsduring Small-Break LOCAs," Nuclear Safety. Vol. 23, No. 2(March-April 1982).
E-944 Tasaka, K., et. al., 'The Results of 5% Small-Break LOCA Tests and NaturalCirculation Tests at the ROSA-IV LSTF," Proceedings of the FourteenthWater Reactor Safety Research Information Meeting, October 27-31, 1986,NUREG/CP-0082, Vol. 4, pp. 177-197.
5-86
Section 6
ABBREVIATIONS AND ACRONYMS
ABB
ACC
ATHLET
B&W
BBR
BCL
BE
BMFT
- ASEA Brown Boveri
- Accumulators
- Code for Analysis of Thermal-Hydraulics of Leaks andTransients
- Babcock & Wilcox
- Brown Boveri Reaktor (now ASEA Brown Boveri orABB)
- Broken Cold Leg
- Best-estimate
- Bundesministerium fuer Forschung und Technologie(Federal Ministry for Research and Technology)
- Bottom of Core Recovery
- Breakthrough Detector
- Countercurrent Flow Umitation
- Cylindrical Core Test Facility
- Combustion Engineering (now ABB-CE)
- Combined Injection
- Cold Leg
- Cold Leg Injection
- Core Simulator (UPTF)
BOCREC
BTD
CCFL
CCTF
CE
Cl
CL
CLI
CS
6-1
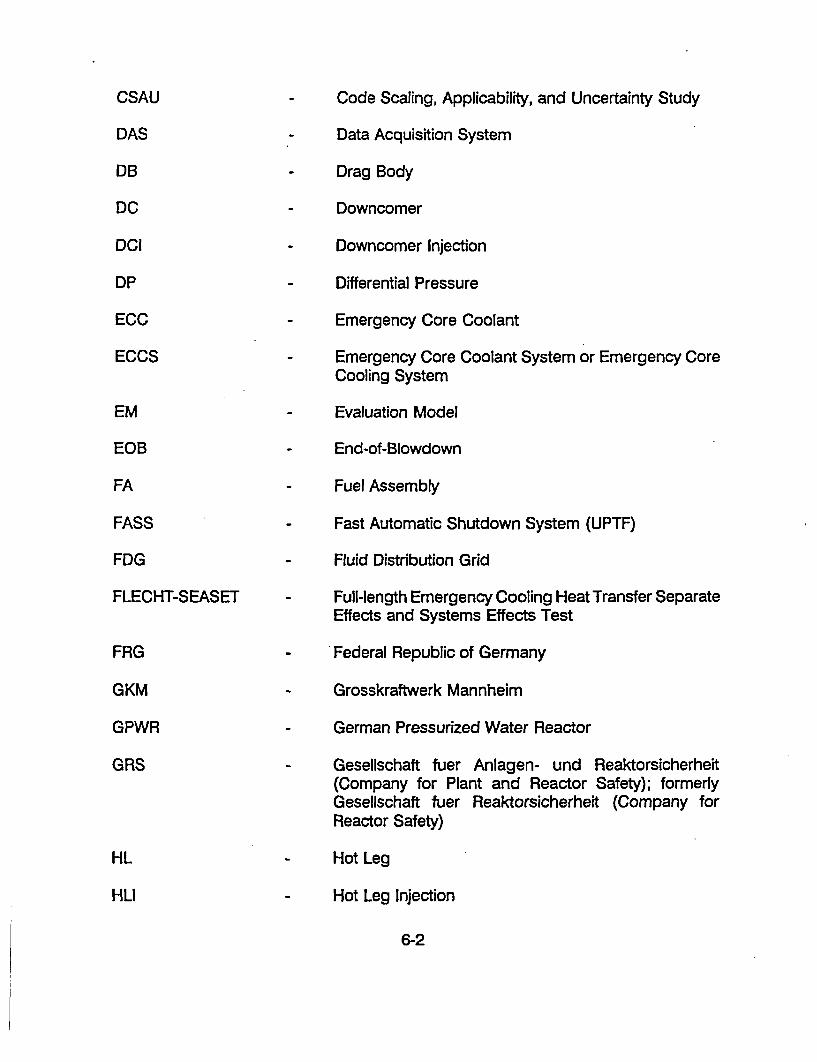
CSAU
DAS
DB
DC
DCI
DP
ECC
ECCS
EM
EOB
FA
FASS
FDG
FLECHT-SEASET
FRG
GKM
GPWR
GRS
HL
HLI
Code Scaling, Applicability, and Uncertainty Study
- Data Acquisition System
- Drag Body
- Downcomer
- Downcomer Injection
- Differential Pressure
- Emergency Core Coolant
- Emergency Core Coolant System or Emergency CoreCooling System
- Evaluation Model
- End-of-Blowdown
- Fuel Assembly
- Fast Automatic Shutdown System (UPTF)
- Fluid Distribution Grid
- Full-length Emergency Cooling Heat Transfer SeparateEffects and Systems Effects Test
Federal Republic of Germany
Grosskraftwerk Mannheim
German Pressurized Water Reactor
Gesellschaft fuer Anlagen- und Reaktorsicherheit(Company for Plant and Reactor Safety); formerlyGesellschaft fuer Reaktorsicherheit (Company forReactor Safety)
Hot Leg
Hot Leg Injection
6-2

HPCI High Pressure Coolant Injection
HPI - High Pressure Injection
HPIS - High Pressure Injection System
HPSI - High Pressure Safety Injection
IDL - Instrument Development Loop
INEL - Idaho National Engineering Laboratory
J - Japan
JAERI - Japan Atomic Energy Research Institute
KWU - Kraftwerk Union (now a division of Siemens)
LANL - Los Alamos National Laboratory
LBLOCA - Large Break Loss-of-Coolant Accident
LLD Liquid Level Detector
LOBI - Loop of Blowdown Investigation
LOCA - Loss-of-Coolant Accident
LOFT - Loss of Fluid Test
LPCI - Low Pressure Coolant injection
LPI - Low Pressure Injection
LPIS - Low Pressure Injection System
MK - Muehlheim Kaerlich PWR
MPR - MPR Associates
ORNL - Oak Ridge National Laboratory
PCT - Peak Cladding Temperature
6-3

PKL
PTS
PWR
REFLA
RELAP
ROSA
SBLOCA
SCTF
SG
SGIP
SGS
SGTR
TRAC
TUM
Primarkreislaufe (Primary Coolant Loop - KWU TestFacility)
- Pressurized Thermal Shock
- Pressurized Water Reactor
- Reflood Analysis (Code)
- Reactor Leak and Analysis Program (Code)
- Rig of Safety Assessment
- Small Break Loss-of-Coolant Accident
- Slab Core Test Facility
- Steam Generator
- Steam Generator Simulator Inlet Plena
- Steam Generator Simulator
- Steam Generator Simulator Tube Regions
- Transient Reactor Analysis Code
- Technische Universitaet Muenchen (TechnicalUniversity of Munich)
- Test Vessel
- Upper Core Support Plate
- United Kingdom
- Upper Plenum
- Upper Plenum Injection
- Upper Plenum Test Facility
- United States
TV
UCSP
UK
UP
UPI
UPTF
US
6-4

USNRC United States Nuclear Regulatory Commission
W Vent Valve
W Westinghouse Electric Corporation
W/S Ratio of Core Simulator Water and Steam InjectionRates (UPTF)
6-5


Section 7
NOMENCLATURE
A Flow Area
CP Heat Capacity
D Diameter
DH Hydraulic Diameter
DH = 4 (flow area/wetted perimeter)
Fr Froude Number
Fr = VW (gD) 1/2
g Gravitational Acceleration
h Enthalpy
Hvtop Downcomer Top Void Height (Level Reduction Below Cold Leg due toEntrainment)
Velocity
j* Wallis Parameter (or Dimensionless Velocity)
* P - '] 12 for single-phase flowA .p (PL - Po.)gD]
(PL -TP 1D/. for two-phase flow
7-1
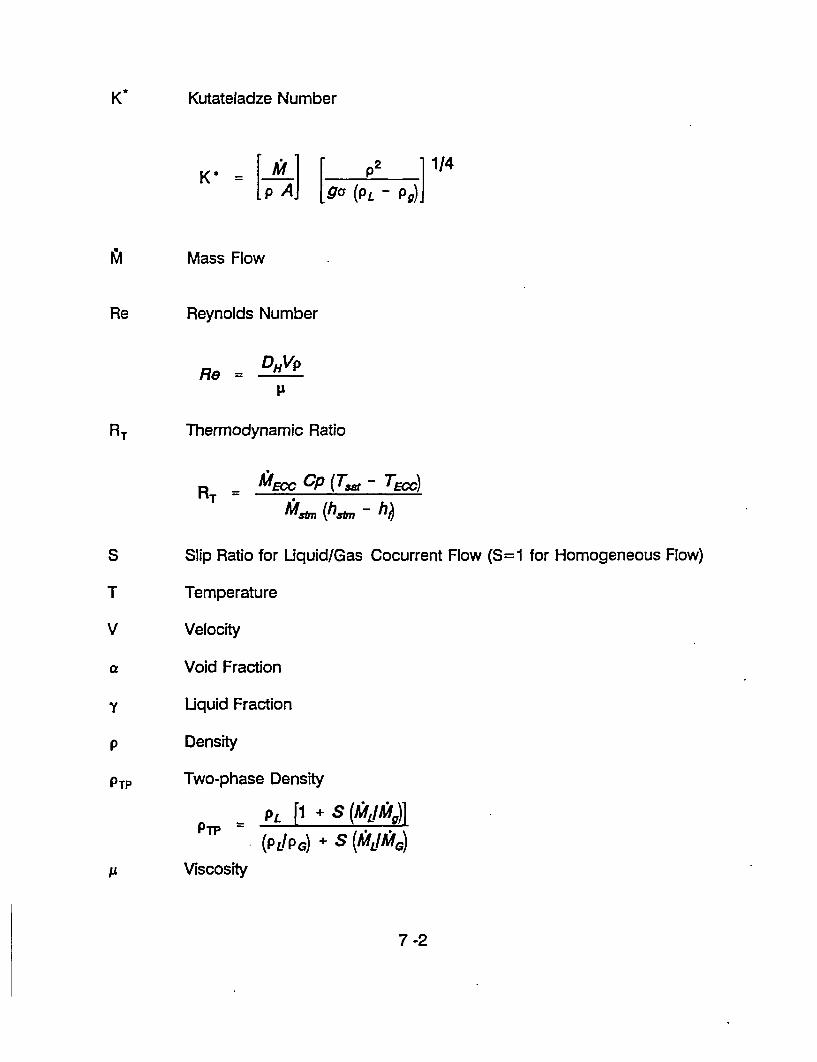
K * Kutateladze Number
= [KI] [gc (PL - Pg)]
!94 Mass Flow
Re Reynolds Number
Re = DHVP
RT Thermodynamic Ratio
,, Cp (T. - TEcc)RT = _ _ _ _ _ _R T ft st (h s" - h,)
S Slip Ratio for Uquid/Gas Cocurrent Flow (S=1 for Homogeneous Flow)
T Temperature
V Velocity
,-, Void Fraction
y Uquid Fraction
p Density
PTP Two-phase Density
PTP PL [1 + S (KILIKtg)]'rP (LIP G) + s AIG)
p Viscosity
7-2

Subscripts
ECC Emergency Core Coolant
f Liquid Phase
g Gas Phase
G Gas Phase
HL Hot Leg
IP Inlet Plenum
I Liquid Phase
L Liquid Phase
S Steam
Sat Saturated
STM Steam
UP Upper Plenum
W Water
7-3


Appendix A
BRIEF DESCRIPTION OF TEST FACILITIES,INSTRUMENTATION AND TESTS CONDUCTED
A.1 CYLINDRICAL CORE TEST FACILITY (CCTF)
A.1.1 Facility Description
CCTF was a full-height, 1/21-scale model of the primary coolant system of an1,100 MWe four-loop PWR. The facility simulated the overall primary system responseand the in-core thermal hydraulic behavior during the refill and reflood phases of alarge cold leg break LOCA. The reference reactors for CCTF were the Trojan reactorin the USA (4-loop PWR with cold leg injection ECCS, 1,130 MWe) for major parts andthe Ohi-1 reactor in Japan (4-loop PWR with cold leg injection ECCS, 1,175 MWe) forcertain other aspects.
Facility Layout
Figures A.1-1 and A.1-2 depict the major components of the facility. They included apressure vessel with simulated core, four primary piping loops (three intact and onebroken) with steam generators and pump simulators, and two tanks attached to theends of the broken loop to simulate containment. Vertical dimensions and locationsof system components were as close as practicable to the corresponding dimensionsand locations in the reference reactor. Flow areas were typically scaled based on thenominal core flow area scaling ratio (1/21). The maximum operating pressure ofmajor components of CCTF was 600 kPa.
Electrically-heated rods were used in the core to simulate nuclear fuel rods. A totalof 1,824 heated rods were installed. The maximum electrical power supplied to theheated rods was 10 MW. This power could simulate the decay heat during the refilland reflood phases of an LBLOCA.
In CCTF, ECC injection nozzles were located in the cold legs, hot legs, upper plenum,downcomer, and lower plenum to simulate ECC systems of cold leg injection,combined injection, upper plenum injection, and downcomer injection PWRs. Also,vent valves were installed in the core barrel to simulate B&W PWRs with vent valves.
Auxiliary systems included the drain system from pressure vessel and containmenttanks, and the steam injection system to upper plenum.
A.1-1
Main Components
The main components and subsystems of CCTF are discussed briefly below.
Pressure Vessel - Figure A.1-3 shows the CCTF pressure vessel. The cylindricalpressure vessel was full-height (about 10 m) with a scaled diameter (1.3 m). Thepressure vessel housed the downcomer annulus, lower plenum, core, and upperplenum. The core barrel separated the core and upper plenum from the downcomer.The pressure vessel wall was made of carbon steel clad with stainless steel. Thepressure vessel wall thickness was 90 mm. Electrical resistance heaters were usedon the outer surface of the pressure vessel wall to preheat the wall before a test, toaccurately simulate transient heat release from the pressure vessel wall which occursduring a PWR LOCA. Except for the addition of an upper ring containing an upperplenum injection header and additional instrumentation nozzles, the CCTF-11 vesselwas the same as that used in CCTF-l.
The CCTF core contained 32, 8 x 8 bundles (see Figure A.1 -4), each containing 57heated rods and seven nonheated rods (total of 1,824 heated rods and 224 nonheatedrods). As shown in Figure A.1-5, the heated rods were fabricated with an Inconelcladding, Nichrome heater element, and boron nitride or magnesium oxide insulators.All heated rods had an outer diameter of 10.7 mm, a heated length of 3.66 m, andchopped-cosine axial power profile. These dimensions were identical to thecorresponding dimensions of PWR fuel rods. The clad thickness, 1 mm, was thickerthan that of fuel rods, because of the requirement for thermocouple attachment. Theheat capacity of the heated rods was approximately 40% larger than that of nuclearfuel rods.
The nonheated rods simulated the guide thimble tubes and instrument thimble tubesin PWR fuel assemblies. They were either stainless steel pipes or solid bars with anouter diameter of 13.8 mm. The heated rods and nonheated rods were held in theirradial positions by grid spacers located at six elevations. A grid spacer was a latticestructure of stainless steel plates 0.4 mm and 0.8 mm thick, and 40 mm high. Nospecial device (e.g., mixing promoter) was attached on the grid spacer. The rod pitchwas 14.3 mm which is identical to the reference PWR.
Figure A.1 -4 shows the three (high, medium, and low) power zones of the electrically-heated core. The radial power distribution of the core was controlled by setting thepower supplied to each zone. In CCTF-I, each bundle included rods with threedifferent power densities. In CCTF-lI, all heated rods in each bundle were providedwith the same power density. The axial power profile was the same in all rods withan axial peaking factor (ratio of maximum to average power) of 1.49 for CCTF-I and1.40 for CCTF-1I.
A.1-2
As shown in Figure A.1-3, the core/upper plenum boundary included an upper coresupport plate and end box tie plate. These plates were perforated plates withappropriately-scaled flow areas. Plugging devices were installed on the tie plate inCCTF-11 to better simulate the reference PWR geometry.
The upper plenum internals modeled those used in the reference Westinghouse plant;in particular, control rod drive structures and support columns. Although the CCTFupper plenum internals were full height, the horizontal dimensions were 8/15 of thoseof the Westinghouse plant to allow individual upper plenum internal structures to beplaced over the individual 8 x 8 heated rod bundles in the CCTF core. This approachcreated a more uniform and realistic flow distribution than using reactor-typical, largersize upper plenum internal structures. The detailed shape and arrangement of theupper plenum internals were different between CCTF-I and CCTF-II. The arrangementof the upper plenum internals for CCTF-11 is shown in Figure A.1-4. The arrangementwas determined to simulate the horizontal flow resistance distribution in the referencePWRs. Baffle plates were inserted into the control rod guide tubes to increase theflow resistance.
In CCTF-ll, four vent valves, located in the barrel between the upper plenum anddowncomer annulus, modeled the vent valves in a B&W reactor vessel. These ventvalves simulated the flow area, flow resistance, and opening and closing differentialpressures of actual vent valves. For CCTF-11 tests simulating B&W reactors, thesevent valves were free to open; for all other tests the valves were locked shut.
The downcomer annulus surrounded the core barrel. The flow area of the downcomerwas scaled larger than the 1/21-scaling ratio to avoid excessive hot wall effects whichwould lead to an unrealistically low effective downcomer driving head. To simulate theeffective downcomer driving head more realistically, the baffle area of the PWR wasincluded in the CCTF downcomer. The possible deficiencies of the enlargeddowncomer annulus are reduction in the rate of increase of the downcomer waterlevel, reduction of heat release from the downcomer wall per unit flow area, andreduction of the azimuthal steam flow velocity in comparison to that in PWR. Theeffect of the reduction in the rate of increase of the downcomer water level on thereflood behavior was investigated with a special purpose test, and confirmed to beminimal. The heat release from the downcomer wall was simulated as discussedabove. The effect of the reduced azimuthal steam velocity on the reflood behaviorwas not investigated experimentally; however, using CCTF and UPTF data, it wasanalyzed as shown in Section 3.1.2.1.
Primary Loops and Containment Tanks - Four full-length primary loops wereconnected to the central pressure vessel (see Figures A.1 -1 and A.1 -2). Three of theloops were intact; that is, they allowed flow from the pressure vessel upper plenum,through the hot leg, steam generator, crossover leg, pump simulator, and cold leg to
A.1-3
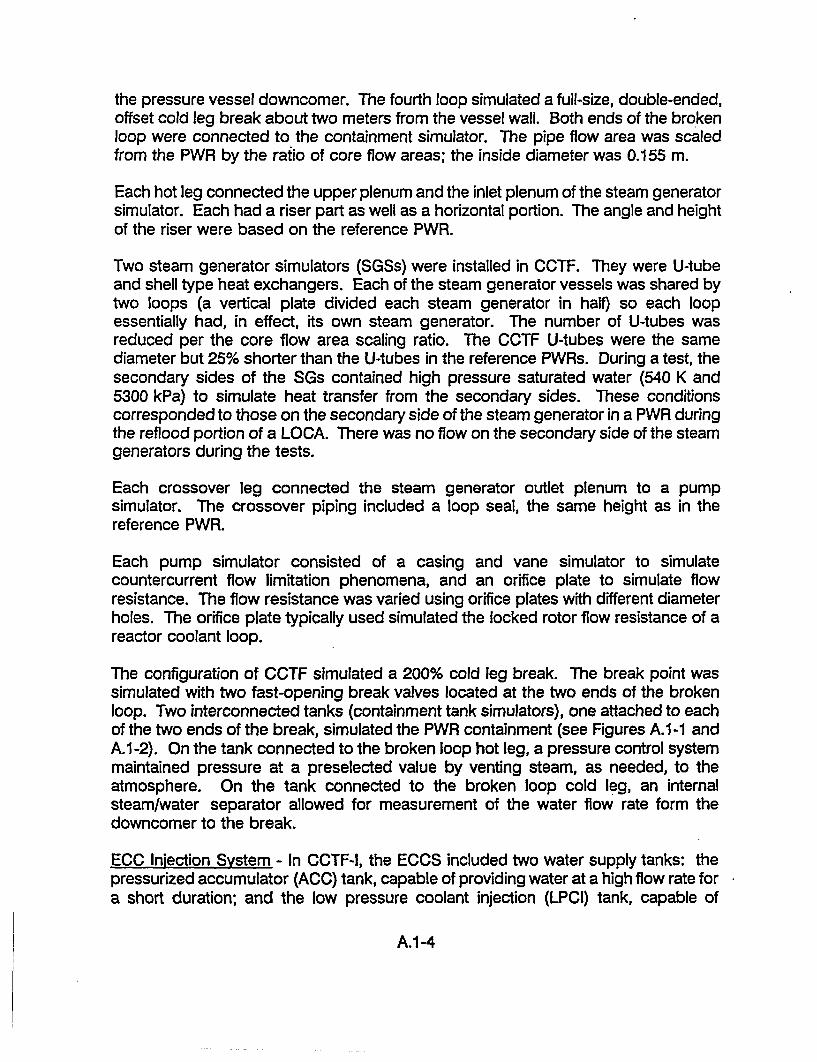
the pressure vessel downcomer. The fourth loop simulated a full-size, double-ended,offset cold leg break about two meters from the vessel wall. Both ends of the brokenloop were connected to the containment simulator. The pipe flow area was scaledfrom the PWR by the ratio of core flow areas; the inside diameter was 0.155 m.
Each hot leg connected the upper plenum and the inlet plenum of the steam generatorsimulator. Each had a riser part as well as a horizontal portion. The angle and heightof the riser were based on the reference PWR.
Two steam generator simulators (SGSs) were installed in CCTF. They were U-tubeand shell type heat exchangers. Each of the steam generator vessels was shared bytwo loops (a vertical plate divided each steam generator in half) so each loopessentially had, in effect, its own steam generator. The number of U-tubes wasreduced per the core flow area scaling ratio. The CCTF U-tubes were the samediameter but 25% shorter than the U-tubes in the reference PWRs. During a test, thesecondary sides of the SGs contained high pressure saturated water (540 K and5300 kPa) to simulate heat transfer from the secondary sides. These conditionscorresponded to those on the secondary side of the steam generator in a PWR duringthe reflood portion of a LOCA. There was no flow on the secondary side of the steamgenerators during the tests.
Each crossover leg connected the steam generator outlet plenum to a pumpsimulator. The crossover piping included a loop seal, the same height as in thereference PWR.
Each pump simulator consisted of a casing and vane simulator to simulatecountercurrent flow limitation phenomena, and an orifice plate to simulate flowresistance. The flow resistance was varied using orifice plates with different diameterholes. The orifice plate typically used simulated the locked rotor flow resistance of areactor coolant loop.
The configuration of CCTF simulated a 200% cold leg break. The break point wassimulated with two fast-opening break valves located at the two ends of the brokenloop. Two interconnected tanks (containment tank simulators), one attached to eachof the two ends of the break, simulated the PWR containment (see Figures A.1 -1 andA.1-2). On the tank connected to the broken loop hot leg, a pressure control systemmaintained pressure at a preselected value by venting steam, as needed, to theatmosphere. On the tank connected to the broken loop cold leg, an internalsteam/water separator allowed for measurement of the water flow rate form thedowncomer to the break.
ECC Iniection System - In CCTF-I, the ECCS included two water supply tanks: thepressurized accumulator (ACC) tank, capable of providing water at a high flow rate fora short duration; and the low pressure coolant injection (LPCI) tank, capable of
A.1-4
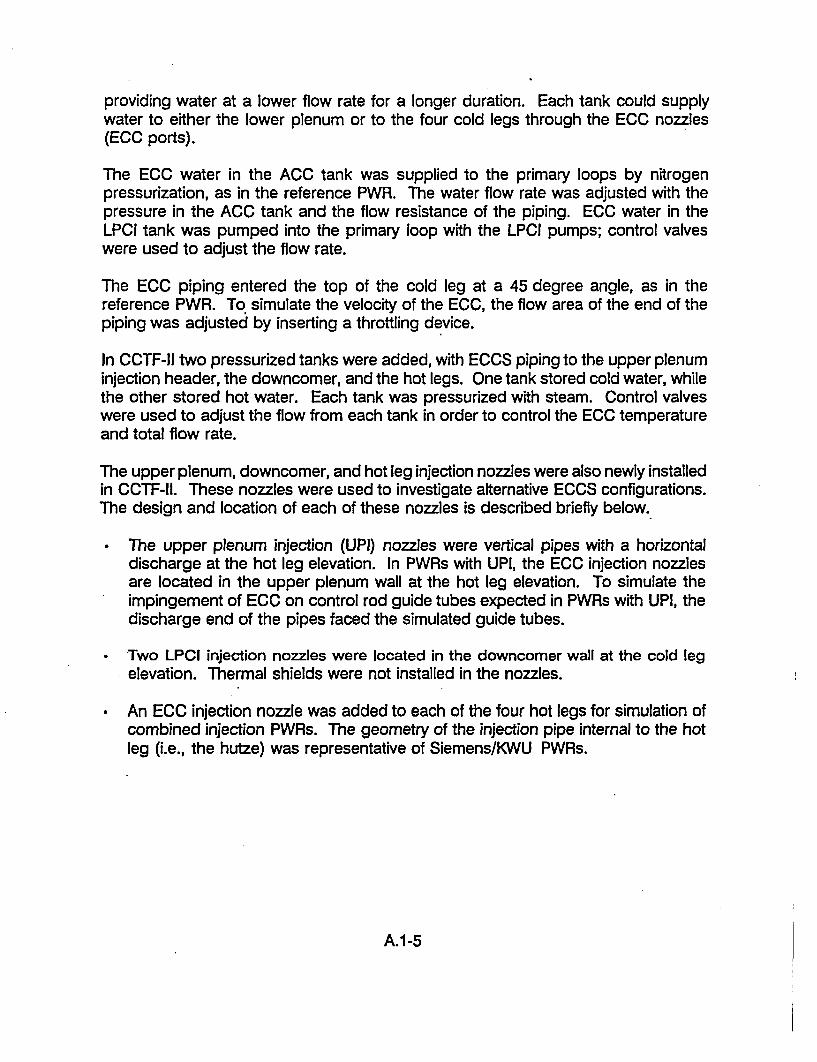
providing water at a lower flow rate for a longer duration. Each tank could supplywater to either the lower plenum or to the four cold legs through the ECC nozzles(ECC ports).
The ECC water in the ACC tank was supplied to the primary loops by nitrogenpressurization, as in the reference PWR. The water flow rate was adjusted with thepressure in the ACC tank and the flow resistance of the piping. ECC water in theLPCI tank was pumped into the primary loop with the LPCI pumps; control valveswere used to adjust the flow rate.
The ECC piping entered the top of the cold leg at a 45 degree angle, as in thereference PWR. To simulate the velocity of the ECC, the flow area of the end of thepiping was adjusted by inserting a throttling device.
In CCTF-I1 two pressurized tanks were added, with ECCS piping to the upper plenuminjection header, the downcomer, and the hot legs. One tank stored cold water, whilethe other stored hot water. Each tank was pressurized with steam. Control valveswere used to adjust the flow from each tank in order to control the ECC temperatureand total flow rate.
The upper plenum, downcomer, and hot leg injection nozzles were also newly installedin CCTF-lI. These nozzles were used to investigate alternative ECCS configurations.The design and location of each of these nozzles is described briefly below.
The upper plenum injection (UPI) nozzles were vertical pipes with a horizontaldischarge at the hot leg elevation. In PWRs with UPI, the ECC injection nozzlesare located in the upper plenum wall at the hot leg elevation. To simulate theimpingement of ECC on control rod guide tubes expected in PWRs with UPI, thedischarge end of the pipes faced the simulated guide tubes.
* Two LPCI injection nozzles were located in the downcomer wall at the cold legelevation. Thermal shields were not installed in the nozzles.
An ECC injection nozzle was added to each of the four hot legs for simulation ofcombined injection PWRs. The geometry of the injection pipe internal to the hotleg (i.e., the hutze) was representative of Siemens/KWU PWRs.
A.1-5

Control and Instrumentation
Process Control System - The time-dependent variables were controlled with acomputer during a typical CCTF test; these included power supplied to heated rods,ECC flow rate, and ECC temperature. Pressure in Containment Tank-2 wasmaintained constant. The test initiation time and the sequence of events (e.g., powerdecay initiation and ECC injection initiation) were also controlled with the computer.
To ensure the integrity of the heated rods, the maximum clad temperature wasmonitored during the tests. If the temperature exceeded the maximum allowable,power was reduced to 80%. If the clad temperature continued to increase after thepower reduction, power was shut off. This procedure and the test terminationprocedure were also performed by the computer.
Instrumentation - CCTF instrumentation consisted of over 1,600 sensors, includingboth conventional devices (e.g., pressure transducers and thermocouples) providedby JAERI, and advanced two-phase flow instrumentation developed by the USNRCand their contractors for the 2D/3D Program.
Conventional instrumentation provided by JAERI included approximately 700 thermo-couples attached to rod clad surfaces throughout the core, and an additional100 thermocouples which measured fluid, steam, and wall temperatures near and inthe core. Other thermocouples, flow meters, and pressure and differential pressuresensors, located throughout the test facility, provided information on fluid conditions,flow rates, liquid levels, and pressure distribution. In addition to these instruments,JAERI provided television cameras and film cameras (both moving and still) mountedat viewing windows in the hot and cold legs. These cameras provided visual data toaid in interpretation of the test results.
Advanced instrumentation provided by USNRC primarily monitored local two-phasefluid conditions. The advanced instrumentation included fluid distribution grid/liquidlevel detectors (FDG/LLD), turbine meters, impedance probes, film probes, and spoolpieces.
A.1-6

A.1.2 Cataloq of Tests
CCTF testing was performed in two phases:
• CCTF-I, 1979 - 1981
" CCTF-lI, 1982 - 1985
Table A.1-1 lists the CCTF tests, classified first by the injection configuration beingsimulated (cold leg injection, combined injection, downcomer injection, or upperplenum injection) and then further classified by test objective.
The base case tests for cold leg injection were conducted under the typical testconditions which were chosen from the safety evaluation analysis of the referencereactor. It was intended through the test results to investigate and understand thebasic overall reflood behavior with cold leg injection. Parameter effect tests for coldleg injection were performed to investigate the effect of various parameters(i.e., pressure, power, ECC flow rate, etc.) on reflood behavior. The range ofparameters tested covered the conditions at reflood initiation expected in the safetyevaluation analysis and the conditions expected in a best-estimate analysis. Specialpurpose tests for cold leg injection were performed to investigate the reflood behaviorunder EM and BE conditions, the refill behavior, and loop seal effect.
For combined injection ECCS, the refill-reflood tests were performed under EM andBE conditions; only one parameter test for ECC flow was performed. For upperplenum injection, four reflood tests and one refill-reflood test were performed.Parameter effect tests included: ECC injection location, ECC flow and core power.For downcomer injection, three reflood tests were performed with closed and openvent valves.
A.1-7

Table A.1-1
CCTF AND SCTF TESTS Page 1 of 7
Group Test Objective Test/Run Description (2) CommentsI I ~Number(')II
Cold Leg InjectionParameterEffects
Base Case C1-5/14 CCTF-I Base Case
C2-SH1/53 CCTF-11 Base Case Same as CCTF-l EM test(C1-19)
C2-4/62(3) CCTF-11 Base Case/Repeatability
S1-1/507 SCTF-I Forced Feed BaseCase
S$-10/516(3J) SCTF-I Forced Feed BaseCase/Repeatability
Sl-12/518 SCTF-I Gravity Feed Base Lower plenum injectionCase
S1-14/520 SCTF-I Gravity Feed Base Cold leg injectionCase
S2-10/615
$2-SH1/604
SCTF-11 Forced Feed BaseCase
SCTF-11 Gravity Feed BaseCase
Cold leg injection
Effect of C1-10/19 Low pressure Compare to C1-5Pressure C1-12/21 High Pressure Compare to C1-5
C2-8/67 Low Pressure Compare to C2-4C2-1/55 High Pressure Compare to C2-4
S1-2/508 Forced Feed, Low Pressure Compare to $1-1SI-SH2/506 Forced Feed, High Pressure Compare to Si-1
S2-2/607 ) Gravity Feed, Low Pressure Compare to S2-SH1S2-1/606(/ Gravity Feed, High Pressure, Compare to S2-6
Steep 0, Steep T
Effect of Core C2-SH2/54 Low Power Initial Power = 7.9 MW;Power compare to C2-4
C2-5/63 Low Power Initial Power = 7.1 MW;I__ Icompare to C2-4
S1-6/512 Forced Feed, High Power Compare to Si-1
Effect of InitialCladTemperature
Cl-7/16
Cl-14/23
High Clad Temperature
High Clad Temperature
Maximum clad temperature= 973 K at beginning ofcore recovery-, compare toC1-5
Maximum clad temperature= 1073 K at beginning ofcore recovery-, compare toC1-5
C2-AC1/52 Low Clad Temperature J Compare to C2-4
S2-AC3/603( 3) Gravity Feed, BE, Low CladTemperature
Compare to S2-9 for effectof clad temperature at BEconditions
A.1-B

Table A.1-1
CCTF AND SCTF TESTS Page 2 of 7
Group Test Objective Test/Run) Description (2) Comments
Cold Leg Injection Effect of Power/ C2-5/63 Steep 0Parameter Effects Temperature C2-6/64 Rat 0(Continued) Distribution 1Si-7/513 Forced Feed, Flat 0 Test terminated due to
computer failure;repeated as S1-11
SI-11/517 Forced Feed, Rat 0 Repeat of S1-7S1-8/514 Forced Feed, Steep 0
S2-17/622 Forced Feed, Flat 0, Flat TS2-16/621 Forced Feed. Steep 0.
Steep T$2-SH2/605 Gravity Feed, Flat 0, Flat TS2-1,606(3) Gravity Feed, High Pressure,
Steep 0, Steep TS2-6/611 Gravity Feed, Steep 0,
Steep TS2-7/612(3) Radial Power Distribution
Uke CCTF Test C2-5
S3-14/718 Flat 0S3-15/719 Slant 0S3-16/720 Steep a
Combined S2-14/619(3) Forced Feed, Flat 0, Flat T, Counterpart to CCTF-I1 TestEffects of Power/ Flat Liquid Level C2-6; Compare to S2-17Temperature for liquid levelDistribution and distributionUCSP Uquid S2-12/617 Forced Feed, Steep 0, Compare to S2-16 for liquidLevel Distribution Steep T. Flat Liquid Level level distribution
$2-15/620 Forced Feed, Steep 0,Flat T. Flat Liquid Level
S2-21/626 Forced Feed, Flat 0,Steep T, Flat Liquid Level
A.1-9
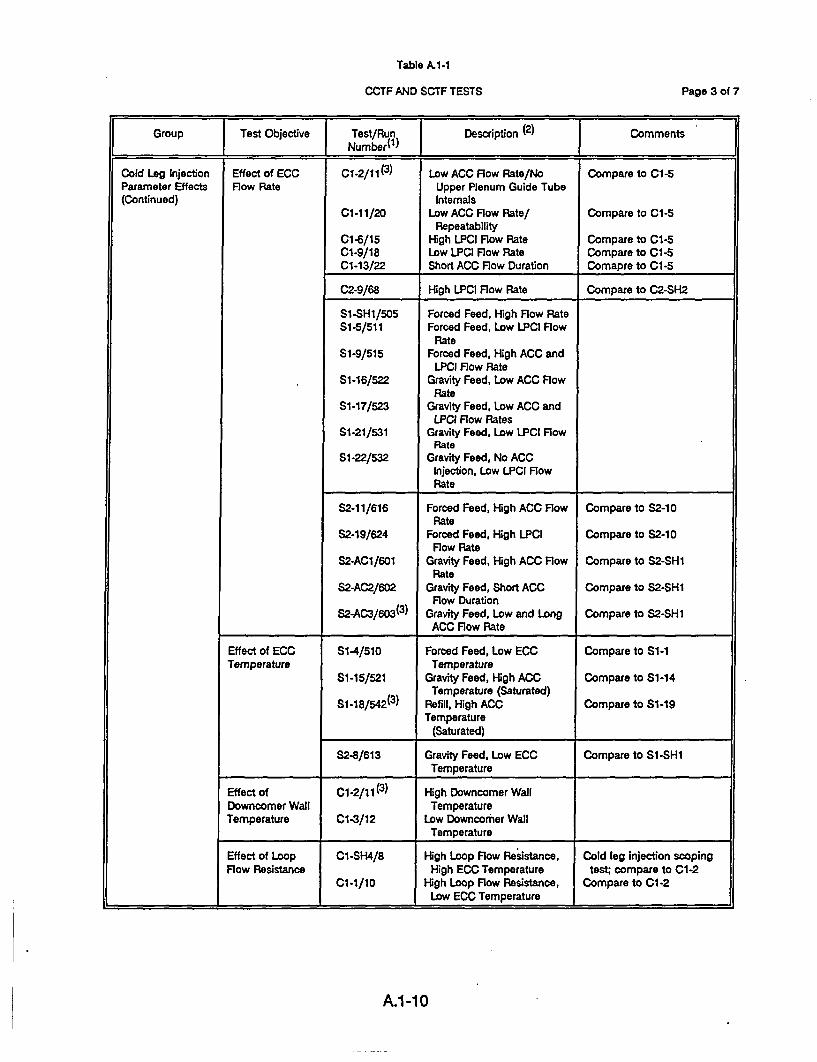
Table A.1-1
CCTF AND SCTF TESTS Page 3 of 7
Group Test Objective Test/Run Description (2) CommentsI I NumberM I)
Cold Log InjectionParameter Effects(Continued)
Effect of ECCFlow Rate
Cl.2/11(3)
C1-11/20
Cl-6/15Cl-9/18Cl-13/22
Low ACC Flow Rate/NoUpper Plenum Guide TubeInternals
Low ACC Flow Rate/Repeatability
High LPCI Flow RateLow LPCI Flow RateShort ACC Flow Duration
Compare to Cl-s
Compare to C1-5
Compare to C1-5Compare to Cl-sComapre to C1-5
C2-9/68 High LPCI Flow Rate Compare to C2-SH2
S-SHI/505 Forced Feed, High Flow RateS1-5/511 Forced Feed, Low LPCI Flow
RateS-9/515 Forced Feed, High ACC and
LPCI Flow RateSl-16/522 Gravity Feed, Low ACC Flow
RateSl-17/523 Gravity Feed, Low ACC and
LPCI Flow RatesSl-21/531 Gravity Feed, Low LPCI Flow
RateSI-22/532 Gravity Feed, No ACC
Injection, Low LPCI FlowRate
S2-11/616
S2-19/624
S2-ACI/601
S2-AC2/602
S2-Ac3/603(3)
Forced Feed, High ACC FlowRate
Forced Feed, High LPCIFlow Rate
Gravity Feed, High ACC FlowRate
Gravity Feed, Short ACCFlow Duration
Gravity Feed, Low and LongACC Flow Rate
Compare to S2-10
Compare to S2-10
Compare to S2-SH1
Compare to S2-SH1
Compare to S2-SH1
Effect of ECC SI-4/510 Forced Feed, Low ECC Compare to S-iTemperature Temperature
SI-15/521 Gravity Feed, High ACC Compare to S1-14Temperature (Saturated)
S1-18/542(3) Refill, High ACC Compare to SI-19Temperature
(Saturated)
S2-8/613 Gravity Feed, Low ECC Compare to S1-SH1Temperature
Effect of Cl-2/11 (3) High Downcomer WallDowncomer Wall TemperatureTemperature C1-3/12 Low Downcomer Wall
Temperature
Effect of LoopFlow Resistance
Cl-SH4/8
Cl-1/10
High Loop Flow Reaistance,High ECC Temperature
High Loop Flow Resistance,Low ECC Temperature
Cold leg injection scopingtest; compare to C1-2
Compare to CI-2
__________________ L & I _________________________
A.1-10

Table A.1.1
CCTF AND SCTF TESTS Page 4 of 7
Group Test Objective Test/Run Description (2) CommentsI Number(') II
Cold Leg Injection Effect of C2-3/61 High Rate of Downcomer Compare to C2-4Parameter Effects Downcomer Water Accumulation(Continued) Water Accumu-
lation Rate
Effect of UCSP S1-3/509 Low UCSP Uquid Level Compare to Si-iiUquid Level II
Cold Leg InjectionSpecial PurposeTests
Evaluation Model(EM) Tests
Cl-19/38 Evaluation Model Same as CCTF-11 base case(C2-SH1); compare toC1-5
I.
S3-9/713 Evaluation Model IntegralTest
Compare to S3-10
Best Estimate C2-12/71 Best Estimate Compare to C2-4(BE) Tests S2-9/614 Gravity Feed, Best Estimate Compare to S2-SH1
S3-10/714 Best Estimate Integral Test Compare to S3-9
Refill Tests C1-SH1/5 Refill, No Core PowerC1-4/13 Refill/RefloodC1-15/24 Refill/Reflood Nitrogen
Injection
C2-2/56 Refill No reflood simulationC2-14/74 Refill/RefloodC2-17/77 Refill/Reflood, Steam
InjectionC2-11/70 Refill, Blocked Loops
S1-19/525 RefillS1-18/524(3) Refill, High ACC
Temperature(Saturated)
Effect of C1-17/36 Asymmetric Core Power Compare to C1-5Asymmetric C1-20/39 Asymmetric CorePower/Tempera- Temperatureture Distribution
Effect of Water In C1-8/17 Loop Seal Filling Test terminated early dueLoop Seal to high clad temperature;
repeated as C1-18.
C1-18/37 Loop Seal Filling Repeat of C1-8; compare toC1 -5
Effect of Forced Sl-12/518 Gravity Feed, Lower Plenum Compare to S1-14vs. Gravity Feed Injection
Evaluation ofSCTF GravityFeed Oscillations
SI-23/536
SI-24/537
Low ACC Flow Rate, LongACC Duration
Gradual Reduction from ACCFlow Rate to LPCI FlowRate
A.1-11

Table A.1-1
CCTF AND SCTF TESTS Page 5 of 7
Group }Test Objective Test/Run) T Description (2) TCommentsjCold Leg Injection Facility Coupling Cl-16/25 Counterpart to FLECHT-SETSpecial Purpose Tests Test 3105BTest (Continued) C1-21/40 Counterpart to FLECHT-SET
Test 2714BC1-22/41 Counterpart to FLECHT-SET
Test 3420B
C2-AC2/52 Counterpart to FLECHT-SETTest 2714B and CCTF-ITest CI-21
C2-15/75 Counterpart to FLECHT-SETTest 2714B
Sl-13/519 Counterpart of FLECHT-SEASET Test 43716C
S2-7/612(3) Radial Power Distribution Cold leg injectionUke CCTF Test C2-5
S2-14/619(3) Forced Feed, Flat 0, Flat T,Flat Uquid Level;Counterpart to CCTF-11Test C2-6.
S2-18/623 Counterpart to CCTF-11 Forced feedTest C2-5
Other Cold Leg Repeatability Cl-11/20(3) Low ACC FlowInjection Tests Tests Rate/Repeatability
C2-4/62(3) CCTF-I1 Base Compare to C2-SH1Case/Repeatability
S1-10/516(3) SCTF-I Forced Feed Base Compare to S1-1Case/Repeatability
S2-13/618 SCTF-l/ll Repeatability Compare to S1-i
Miscellaneous C1-SH2/6 Low Power, Flat Power Low power and LP injectionProfile, High Pressure, LP scoping testInjection
C1-SH3/7 Low Power, Non-Flat Power Steep 0 and LP injectionProfile, High Pressure, LP scoping testInjection
S1-20/530 Effect of Closed Vent Valve Vent valve line wasUne inadvertently left open
on previous SCTF-l tests(1.1I-4/520 to Si-17/523)
__________________________ $S1-14/520(3) Effect of Open Vent Uine ____________
A. 1-12

Table A.1-1
CCTF AND SCTF TESTS Page 6 of 7
Group Test Objective Test/Run Description (2) CommentsNumber(1)-
Combined CCFL Evaluation S2-3/608 Steam Injection, Saturated Water injected into upperInjection Separate ECC, No Core Power plenumEffects Tests S2-4/609 Steam Injection, Saturated Water injected into upper
ECC, Core Power On plenumS2-5/610 Steam Injection, Subcooled Water injected into upper
ECC, Core Power On plenum
S3-3/707 Uniform Subcooled WaterS3-4/708 Local Subcooled WaterS3-5/709 Distributed Subcooled Water
Core Cooling $3-SH1/703 Core Cooling Base CaseEvaluation S3-1/705 Lower Plenum Water Level
EffectS3-2/706 Subcooling EffectS3-6/710 Power Distribution EffectS3-7/711 ECC Location EffectS3-8/712 ECC Location Changing
EffectS3-12/716 High Power, High Clad
Temperature$3-AC2/702 Core Cooling BE
Combined Effect of C2-21/81 7/8 Injection (4 Hot Legs, Compare to C2-19 (5/8Injection Integral Injection 3 Cold Legs) Injection: 2HL, 3CL) forTests Configuration effect of ECC flow rate
to hot legs
S3-13/717(3) Continuous UP InjectionS3-20/724 Intermittent UP InjectionS3-22/726 Alternate UP Injection
Effect of ECC S1-SH3/528 Saturated ECCTemperature S1-SH4/529 Subcooled ECC
S3-18/722 High Injection Temperature Compare to S3-13
Effect of Core S3-19/723 Low Pressure, High Power, Failed testPower and Clad High Clad TemperatureTemperature S3-21/725 Low Pressure. High Power, Compare to S3-13
High Injection Temperature
Evaluation Model C2-19/79 5/8 Injection (2 Hot Legs,(EM) Tests 3 Cold Legs)
S3-SH2/704 EM OrientationS3-13/717(3) EM Compare to S3-11
Best Estimate C2-20/80 (3) BE Compare to C2-19(BE) Tests
$3-ACl/701 BE OrientationS3-11/715 BE Compare to S3-13
;A.1-13

Table A.1-1
CCTF AND SCTF TESTS Page 7 of 7
Group Test Objective Test/Run j Description (2) j Comments
Combined Facility Coupling C1-SH5/9 Counterpart to PKL Test KTAInjection Special TestsPurpose Tests C2-20/80 (3) Counterpart to PKL
Upper Plenum Base Case C2-16/76 Asymmetric (One Port)Injection Tests Injection
Parameter C2-AS1/59 Symmetric (Two Port)Effects Injection
C2-13/72 Symmetric (Two Port)Injection, High UPI RowRate
C2-AA1/57 Symmetric (Two Port)Injection, High Power, VeryHigh HPI Flow Rate
C2-18/78 UPI Best Estimate/Refill
Downcomer Parameter C2-AA2/58 Vent Valves ClosedInjection Tests Effects C2-AS2/60 Vent Valves Open
C2-10/69 Vent Valves Open, LoopsBlocked
S3-17/721 Vent Valve Test
Mass Balance Verification of C2-7/65 Mass Balance CalibrationCalibration Test Mass Flow
Measurements
NOTES:
1. Test number identifies facility and test series:
C1 = CCTF Core-IC2 = CCTF Core-IlS1 = SCTF Core-IS2 = SCTF Core-IlS3 = SCTF Core-Ill
2. The following abbreviations are used in the test descriptions:
BE = Best estimateEM = Evaluation modelIT = Integral testFlat 0 = Flat power profileSlant 0 = Slant power profileSteep 0 = Steep power profileFlat T = Flat initial clad temperature profileSteep T = Steep Initial clad temperature profileACC = AccumulatorECC = Emergency core coolant
3. Test is listed twice in the table because it can be used to evaluate more than one effect.
A.1-14

ci'
Contai nment ContainmentTank-2 Tank-i
CYLINDRICAL CORE TEST FACILITY(CCTF)
FIGURE A.1-1

Broken loop -tl Intact loopI,
Pressure vessel Steamgenerator
Upper plenum
ECC water(AccHPCIILPCI/
ECC waterAccHPCILPCI
leg
Downcomersystem
Containmenttank 2
Only one intact- loop is showninstead of 3 intact loops.
Containment 1
SCHEMATIC DIAGRAM OF CCTF MAIN PARTS
FIGURE A.1-2
A.1-16

Upper Support Plate
Upper Ring--(Core-Il Only)
Vent Valve
Core FloodingNozzle
Upper CoreSupport Plate
Bottom ofSupport Plate
Baffle
Lower CoreSupport Plate
ofSection
Bottom Plate
Unit: mm
VERTICAL CROSS SECTION OFCCTF CORE-Il PRESSURE VESSEL
FIGURE A.1-3A.1-17

PN
IHot Leg
DowncomerInjection Nozzle(Core-Il only)
Cold Leg
Cold Leg
D3 Guide Tube
OR Support Column
9g fI1 Open Hole
Cold Leg
Broken Cold Leg
DowncomerInjection Nozzle(Core-II.only)
Hot Leg BrokenHot Leg
UPPER PLENUM
Plant North
High Power Zone(4 Assemblies)
Medium Power Zone(12 Assemblies)
Cold Leg 2
Cold Leg 3
Note:
Primary loop nozzles areat the upper plenumelevation, but are shownon the core cross sectionfor reference.
Power ZoneAssemblies)
PressureVessel
Hot Leg 4
CORE (See Note)
CCTF PRESSURE VESSEL HORIZONTAL CROSS SECTIONS
FIGURE A.1-4A.1-18

.C
CD
Thermocouple(CA. 0.5 )-
Core -
(Al2 03)
-Heater
Insulator (MgO and BN)Clad
Section A-A
Unit: mm
CCTF HEATER ROD GEOMETRY
FIGURE A.1-5


A.2 SLAB CORE TEST FACILITY (SCTF)
A.2.1 Facility Description
SCTF was a full-height, full radius, 1/21-scale model of a sector of an 1,100 MWe four-loop PWR pressure vessel. The primary objective of the SCTF test program was tostudy two-dimensional thermal-hydraulic behavior within the reactor vessel during therefill and reflood phase of a large break LOCA in a PWR. While the pressure vesselwas simulated in detail, only a crude loop simulation was used. The most significantfeature of SCTF was that it contained a full-height heated core with realistic roddiameters and spacing and a core lateral extent of over 1.8 m (the core radius of thelargest PWRs). This large core lateral extent provided the capability to examine multi-dimensional effects.
Facility Layout
Figure A.2-1 depicts the major components in the facility. They included a pressurevessel with a simulated core, a hot leg, a steam/water separator, an intact cold legwith a pump simulator, a broken cold leg, and two tanks attached to the ends of thebroken loop to simulate containment. Vertical dimensions of system components wereclose to the corresponding dimensions in the reference PWR. Typically flow areaswere based on the nominal core flow area scaling ratio (1/21). Maximum operatingpressure of major components of SCTF was 600 kPa.
Electrically-heated rods were used in the simulated core to simulate nuclear fuel rods.A total of 1,872 heated rods were installed. The maximum electrical power suppliedto the heated rods was 10 MW. This power could simulate the decay heat during therefill and reflood phases of an LBLOCA.
In SCTF, ECC injection nozzles were located in the cold leg,. hot leg, upper plenum,and lower plenum to simulate core boundary conditions under ECC systems of coldleg injection, combined injection, upper plenum injection, and downcomer injectionPWRs. Also, a special loop which connected the upper plenum and downcomer wasused to simulate PWRs with vent valves in the core barrel.
Auxiliary systems included drain system from the pressure vessel and containmenttanks, steam injection system to the upper plenum and steam/water separator, andwater extraction system from the upper plenum.
Main Components
Pressure Vessel - Figure A.2-2 shows the SCTF pressure vessel. The vessel houseda downcomer, lower plenum, core, and upper plenum. The vessel simulated a radialslice of a PWR from the center (Bundle 1 in Figure A.2-2) to the periphery
A.2-1

(downcomer). Heights of components within the pressure vessel were about thesame as those in the reference PWR.
As shown in Figure A.2-3, the core consisted of eight simulated fuel bundles arrangedin a row (i.e., a slab geometry). For SCTF-I and II, each bundle contained 234electrically-heated rods and 22 nonheated rods arranged in a 16 x 16 array (a total of1,872 heated rods and 176 nonheated rods). In SCTF-Ill, the number of heated rodsper bundle was increased from 234 to 236. All heated rods had an outer diameter of10.7 mm, and a heated length of 3.6 m. These dimensions were identical to thecorresponding dimensions of PWR fuel rods. The clad thickness, 1 mm, was thickerthan that of fuel rods because of requirement for thermocouple attachment. The heatcapacity of the heated rods was approximately 30% higher than that of nuclear fuelrods (to be filled in by JAERI; note, basis should be consistent with page 4.6-3).
The nonheated rods simulated the guide thimble tubes and instrument thimble tubesin PWR fuel assemblies. They were either stainless steel pipes or solid bars with anouter diameter of 13.8 mm. The heated rods and nonheated rods were held in theirradial positions by grid spacers located at six elevations. The rod pitch was 14.3 mmwhich is identical to the reference PWR. In SCTF-I only, two of the fuel bundles(Bundles 3 and 4) contained flow blockage sleeves (60% blockage) at the mid-elevation to simulate the effect of ballooned fuel cladding.
Power to each bundle was individually adjustable to permit simulation of a radial powerdistribution. The axial power profile in all rods was a chopped cosine with an axialpeaking factor (ratio of maximum to average power) of 1.4.
Honeycomb insulator panels surrounded the core, the upper plenum and the upperpart of the lower plenum, to reduce the heat release from the SCTF vessel wall, whichwould not occur in PWRs (see Figure A.2-2). In SCTF-I, the surface next to the corewas discontinuous as there were numerous panels. In SCTF-11 and SCTF-lII, thepanels were covered by a continuous plate to provide a smooth surface facing thecore and upper plenum.
Located above the core were the end boxes and the upper core support plate.Appropriate hydraulic resistance simulators were included to model the cross-flowresistance of the fuel rod tips at the top of the core and the axial flow resistance of thecontrol rods when they are inserted.
A full-height core baffle region simulated the volume between the core and the corebarrel in the reference reactor (see Figure A.2-2). In SCTF-II, the flow path at thebottom of the core baffle region was blocked to prevent water from flowing up into thecore baffle region. In SCTF-IlI, the flow paths at the side of the core baffle region werealso blocked.
A.2-2
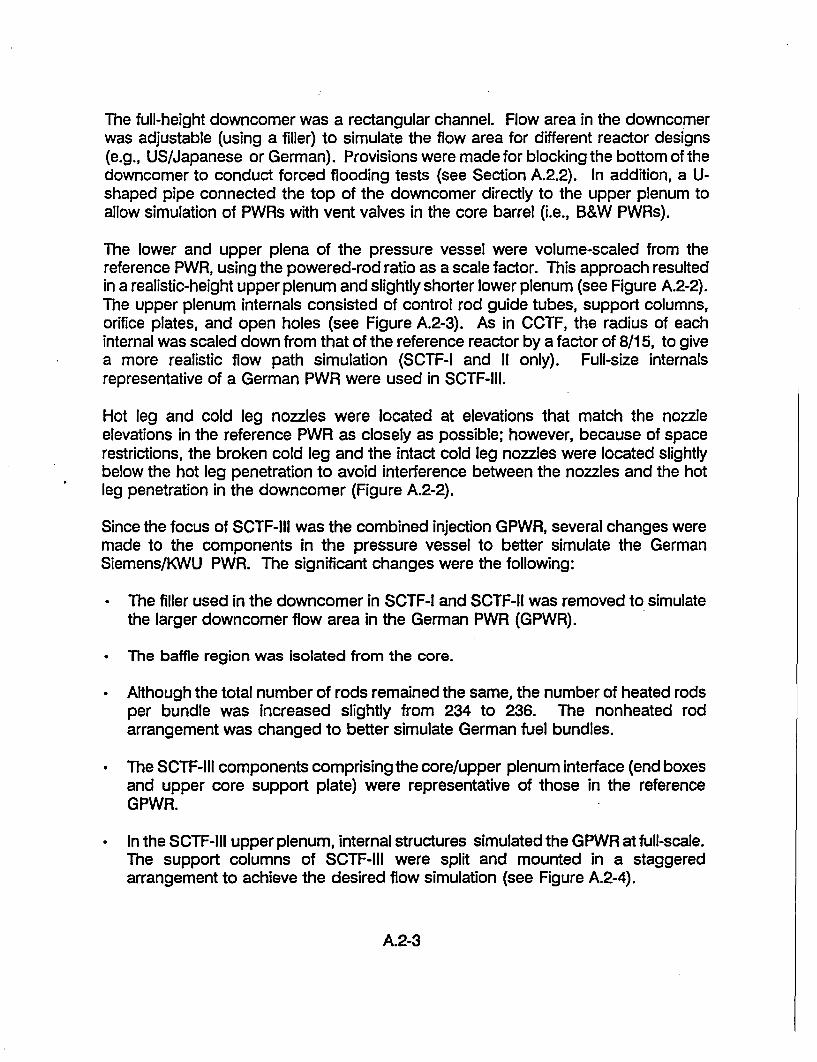
The full-height downcomer was a rectangular channel. Flow area in the downcomerwas adjustable (using a filler) to simulate the flow area for different reactor designs(e.g., US/Japanese or German). Provisions were made for blocking the bottom of thedowncomer to conduct forced flooding tests (see Section A.2.2). In addition, a U-shaped pipe connected the top of the downcomer directly to the upper plenum toallow simulation of PWRs with vent valves in the core barrel (i.e., B&W PWRs).
The lower and upper plena of the pressure vessel were volume-scaled from thereference PWR, using the powered-rod ratio as a scale factor. This approach resultedin a realistic-height upper plenum and slightly shorter lower plenum (see Figure A.2-2).The upper plenum internals consisted of control rod guide tubes, support columns,orifice plates, and open holes (see Figure A.2-3). As in CCTF, the radius of eachinternal was scaled down from that of the reference reactor by a factor of 8/15, to givea more realistic flow path simulation (SCTF-I and II only). Full-size internalsrepresentative of a German PWR were used in SCTF-lII.
Hot leg and cold leg nozzles were located at elevations that match the nozzleelevations in the reference PWR as closely as possible; however, because of spacerestrictions, the broken cold leg and the intact cold leg nozzles were located slightlybelow the hot leg penetration to avoid interference between the nozzles and the hotleg penetration in the downcomer (Figure A.2-2).
Since the focus of SCTF-111 was the combined injection GPWR, several changes weremade to the components in the pressure vessel to better simulate the GermanSiemens/KWU PWR. The significant changes were the following:
" The filler used in the downcomer in SCTF-I and SCTF-11 was removed to simulatethe larger downcomer flow area in the German PWR (GPWR).
" The baffle region was isolated from the core.
Although the total number of rods remained the same, the number of heated rodsper bundle was increased slightly from 234 to 236. The nonheated rodarrangement was changed to better simulate German fuel bundles.
* The SCTF-111 components comprising the core/upper plenum interface (end boxesand upper core support plate) were representative of those in the referenceGPWR.
In the SCTF-111 upper plenum, internal structures simulated the GPWR at full-scale.The support columns of SCTF-111 were split and mounted in a staggeredarrangement to achieve the desired flow simulation (see Figure A.2-4).
A.2-3

Primary Loops and Containment Tanks - The primary flow loops were simulated usinga simplified system consisting of a single hot leg, a steam/water separator, an intactcold leg, and a broken cold leg.
The hot leg connected the upper plenum to the steam/water separator. The SCTFhot leg included a riser part like PWR hot legs. Hot leg flow area was scaled from thetotal flow area of four PWR hot legs, but the length was shortened. The cross sectionof the hot leg was an elongated circle of full height.
A steam/water separator located at the end of the hot leg simulated the hydraulicbehavior of a steam generator. It housed a simulated inlet plenum and a tank forsteam/water separation (see Figure A.2-2). Between the inlet plenum and the tankwas a perforated plate which simulated the tubesheet of a steam generator. In theseparation tank, entrained water was separated from the steam flow and measured.Steam could be injected into the separation tank to simulate vaporization of water inthe U-tubes of a steam generator.
The intact cold leg connected the steam/water separator with the upper portion of thedowncomer. The flow area was scaled from the flow area for three PWR cold legs; thecross section was circular. A pump simulator and loop seal were provided in theintact cold leg. An orifice plate was used to obtain proper flow resistance in the pumpsimulator.
The broken cold leg was simulated with two pipes, which connected the downcomerto Containment Tank-I and the steam/water separator to Containment Tank-Il. Thetwo containment tanks were the same tanks used for CCTF.
ECC Iniection System - The SCTF ECCS consisted of an accumulator and a lowpressure injection system. The injection ports for these systems were located in thelower plenum, downcomer, broken cold leg, hot leg, and intact cold leg between thepump simulator and pressure vessel. Additionally, injection and extraction systemsprovided and/or removed ECC using special nozzles located just above the uppercore support plate.
Control and Instrumentation
Process Control System - The time-dependent variables were controlled with acomputer during a typical SCTF test; these included power supplied to heated rods,ECC flow rate, and ECC temperature. Pressure in Containment Tank-Il wasmaintained constant. The test initiation time and the sequence of events (e.g., powerdecay initiation and ECC injection initiation) were also controlled with the computer.
A.2-4
Instrumentation - SCTF was instrumented with over 1,500 sensors which included bothconventional devices (e.g., pressure transducers, thermocouples) and advanced two-phase flow instrumentation. JAERI provided most of the conventional instruments,including approximately 700 thermocouples attached to rod clad surfaces throughoutthe core to measure the clad temperatures of heated rods. An additional 192thermocouples were used to measure fluid, steam, and wall temperatures near andin the core. Other thermocouples, flow meters, pressure, and differential pressuresensors were located throughout the test facility and provided data which was usedto determine fluid conditions, flow rates, liquid levels, and pressure distributions. Inaddition, viewing windows in the pressure vessel and loops permitted the use oftelevision cameras and film cameras (both moving and still) to provide visual datawhich assisted in interpreting the test results.
A variety of advanced two-phase instrumentation was supplied to SCTF by theUSNRC. The advanced instrumentation included fluid distribution grid/liquid leveldetectors (FDG/LLD), turbine meters, impedance probes, film probes, and spoolpieces.
A.2.2 Catalog of Tests
SCTF testing was performed in three phases:
" SCTF-I, 1981 - 1983
" SCTF-lI, 1983 - 1985
" SCTF-111 1986 - 1987
Table A.1-1 lists the SCTF tests, classified first by the injection configuration beingsimulated (cold leg injection, combined injection, downcomer injection, or upperplenum injection) and then by test objective.
The base case tests for cold leg injection were performed to investigate the two-dimensional thermal-hydraulics in the pressure vessel during reflood. Parametereffects tests for cold leg injection were performed to investigate the effect of variousparameters (e.g., power distribution, rod temperature distribution, upper plenum liquidlevel, etc.) on two-dimensional thermal-hydraulics. Special purpose tests for cold leginjection were performed to investigate the two-dimensional thermal-hydraulic behaviorunder both evaluation model (EM) and best-estimate (BE) conditions. Two-dimensional thermal-hydraulics during the refill phase were also investigated.
For combined injection PWRs, the refill-reflood tests were performed under both EMand BE conditions. Additionally, seven integral tests simulating the refill-reflood phasesand eight separate effect tests simulating the reflood phase were performed to study
A.2-5
parametric effects. In the CCFL evaluation tests, steam upflow was established in thecore and water was injected into the upper plenum to investigate the CCFLcharacteristics at the tie plate with a full-scale radius.
SCTF tests for cold leg injection were performed using two modes of ECC injection:gravity feed and forced feed. In the gravity feed mode, ECC injected into the cold legflowed, by gravity, down the downcomer and into the core. In the forced feed mode,the ECC was injected directly into the lower plenum by isolating the downcomer fromthe lower plenum; i.e., the water was forced into the core. The forced feed testsinvestigated core cooling behavior using defined boundary conditions at the core inlet.The gravity feed tests included the effect of downcomer water head on the two-dimensional core cooling behavior. By comparing the results of gravity feed andforced feed tests with similar flooding rates, it was concluded that there was no majordifference between experimental results in both modes.
In the SCTF tests with gravity feed mode for cold leg injection ECCS, the amplitudeof U-tube oscillations between the core and the downcomer was atypically large andthe flooding rate was atypically high during the early transient, when the ECC injectionflow rate was scaled proportional to the core flow area. This oscillatory behaviorobscured the two-dimensional thermal-hydraulic behavior, which was the focus of theSCTF tests. However, by reducing the ECC injection rate early in the transient, theoscillatory behavior was suppressed, the core flooding rate was more typical, and two-dimensional thermal-hydraulic behavior could be readily discerned; consequently, mostSCTF gravity feed tests were performed with a reduced ECC flow.
A.2-6

Cold Leg
Pressure L b Inj. PotVessel
k•\ Broken Cold Le
Honeycomb•
Simulated/Fuel Assembly ECInj. Ports
Si miReinforcement
SaturatedLower Plenum Water Supply
ECC Inj. Port
OVERVIEW OF SLAB CORE TEST FACILITY
FIGURE A.2-1
To ContainmentTank - II
ator
To ContainmentTank - I
A.2-7

Honey-comb
Unit: mm
VERTICAL CROSS SECTIONOF SCTF CORE-il PRESSURE VESSEL
FIGURE A.2-2
A.2-8

ThroughUpperHead
ThroughUpper
Plenum
h
2288Hot Leg
RA I I
Wo
1900
70pen Hole V GuideTu be Support Colur Ir
i OqOo_9 D En
o- I/
-=-- ýSorre I -Thermal Insulator Orifice
Support Barrel Core Baffle Insulator Suppor Barrel Simulated Fuel
ThroughCore
I I1 I
I ) 12111 484 W1 28:3 II 521 hA 4401840540 25 403751
Support Barrel Support Barrel. Insulator
ThroughLower
Plenum I,
/
r'3
U.
0 dU~Z~g;n 7 I 17 k 440
650 2 117
14535 40 4
Unit: mm
HORIZONTAL CROSS SECTIONS OF THE SCTF CORE-I AND -II
PRESSURE VESSEL AT FOUR ELEVATIONS
FIGURE A.2-3
A.2-9


A.3 UPPER PLENUM TEST FACILITY (UPTF)
A.3.1 Facility Description
The UPTF was originally designed to investigate multidimensional behavior of waterand steam during the end-of-blowdown, refill, and reflood phases of an LBLOCA in aPWR. The areas of investigation were defined to be the upper plenum, thedowncomer, and the reactor coolant pipes connected to the test vessel.
Based on the results of risk assessment studies performed in the seventies and earlyeighties, additional provisions were made to investigate safety issues related to smallbreak scenarios. Valuable data could be generated regarding these issues althoughthe operational pressure of UPTF was limited to about 1900 kPa and the componentsimulators, as described below, were optimized for LBLOCA conditions.
The UPTF was built on the site of the large coal-fired power plant GKM in Mannheim,FRG. This location was chosen to readily supply the substantial demands for steam,water, and electricity for UPTF testing. The UPTF was integrated in the supply anddisposal systems of the power plant.
Facility Layout
The UPTF represented a typical pressurized water reactor of 1300 MWe power class(GPWR) as designed by Siemens/KWU. The reference plant was the power plantGrafenrheinfeld located in southern Germany. The primary system of theGrafenrheinfeld plant consists of a reactor pressure vessel and four primary coolantloops each containing an U-tube steam generator and a primary coolant pump.
The UPTF was a mockup of the primary coolant system at full-scale (see Figures A.3-1and A.3-2). In an early phase of 2D13D Program definition it became obvious that afull-scale core would not be representable with electrically-heated fuel rods fortechnical and economical reasons. It therefore was decided to replace the core bya core simulator which produced flow conditions at the core/upper plenum interfacesimilar to those generated by a heated core. The core simulator injected steam andwater below the tie plate to simulate steam generation and liquid entrainment in aheated core. The overall mass balance was maintained by extraction of water fromthe bottom of the test vessel.
Steam generators and main reactor coolant pumps were also replaced by simulators.Both of the simulators were designed to preserve the volumes, flow resistances, andkey elevations of the reference plant. The steam generator simulators were equippedwith feedback systems to simulate evaporation of water carried to the steam generator
A.3-1
tubes during the reflood portion of an LBLOCA. The pump simulators were adjustablethrottle valves and could simulate the flow resistance of spinning or locked reactorcoolant pumps in the low pressure phases of LOCA.
The break of a main coolant pipe was simulated by large fast-opening valves. Thebreak location could be varied from hot leg to cold leg. Break size could be variedfrom full offset break (200% of the loop flow area) to 25% of loop flow area. Smallerbreak sizes for SBLOCA conditions could be simulated as needed by bypassing thelarge break valves.
The break was connected to a containment simulator. The back pressure could becontrolled in the range of 250 kPa to 600 kPa, which covers the conditions ofcontainment designs relevant for reactor systems evaluated in the 2D/3D Program.
The ECC systems were replaced by large accumulators connected to the ECCinjection ports. ECC injection was performed using control valves and was adjustableto simulate the ECC injection characteristics of the system designs used in the threeparticipating countries.
In some system areas, provisions were made to account for reactor designs otherthan the reference plant; these are noted separately in the component descriptionsbelow.
Main Components
The main components and subsystems of UPTF are briefly discussed below. Thediscussion covers both configuration and function.
Test Vessel - The UPTF test vessel (see Figure A.3-3) was a full-scale representationof the reference plant reactor pressure vessel. The main dimensions were identicalto those of the reference plant except for the vessel wall thickness which was reducedaccording to the lower design pressure of UPTF.
The upper plenum structures consisting of upper core support columns, and uppercore support plate, as well as control rod guide tubes were identical to those in thereference plant.
To facilitate instrument line routing from the upper plenum out of the test vessel, a ringwas installed between the upper flange of the test vessel and the upper head. Thering was equipped with penetration nozzles for the instrumentation lines of upperplenum instruments. For the instruments installed in the lower part of the test vesseland downcomer, penetration nozzles were provided over the length of the test vessel.
A.3-2

The downcomer width was compromised between US/J and German design. *TheUPTF downcomer width was 250 mm compared to 315 mm for the reference PWR.The lower core structure consisting of core barrel, core shroud, intermediate coresupport, and core was identical to the reference reactor except for the core, which isreplaced by the core simulator, and the vent valves installed in the core barrel tosimulate ABB (BBR)/B&W design. Also, for ABB (BBR)/B&W plant simulation, twoECC injection ports were provided for downcomer ECC injection.
The steam/water supply lines for the 17 individual core simulator injection zonespenetrate through the lower head of the test vessel.
Core Simulator - The core simulator was designed to create steam/water flowconditions at the core/upper plenum interface (i.e., the tie plate area) similar to thoseexpected for the low pressure phases of a LOCA. This was achieved by controlledinjection of water and steam according to preprogrammed values or to algorithmsproviding feedback from measured conditions.
The upper part of the core simulator consisted of 193 dummy fuel assemblies, about1 m in length, geometrically simulating fuel assemblies in the reference plant. Thedummy fuel assemblies were not heated and severed as flow conditioners for the two-phase flow at core exit.
Below each of the dummy fuel assemblies was a nozzle capable of injecting steamand water flow (see Figure A.3-4). The core cross section was divided into 17injection zones (see Figure A.3-5) which could be individually controlled to produceflow distributions. Different power profiles could be simulated as well as coreresponses to water breakthrough caused by hot leg ECC injection.
For separate effects tests, preprogrammed steam and water mass flow rates wereinjected into the test vessel via the core simulator creating clearly-defined boundaryconditions. In integral tests, baseline injection mass flow rates for steam and waterwere based on PWR LOCA analyses and subscale tests. Feedback control systemsprovided realistic system response for these cases when the boundary conditionssignificantly deviated from the reference values. The boundary conditions relevant forcore thermal-hydraulic behavior were the core bottom flooding rate and, in case of hotleg ECC injection, local water breakthrough from the upper plenum into the core. Thealgorithms applied for feedback flow condition were derived from a large number ofSCTF and CCTF tests. For proper feedback from rapid changes of boundaryconditions, the control valves of the core simulator injection systems have a specifiedtravel time of 0.7 s for 100% stroke.
Two-phase flow exiting the core in a reactor would be produced by boiling andentrainment in the core. In UPTF this process is simulated by controlled injection of
A.3-3

water and steam from external sources, and the mass injected has to be extractedfrom the system to keep the correct mass balance. The injection mass flow rateswere measured, and the same amount of water mass was drained from the lowerplenum of the test vessel by the controlled drainage system.
Steam Generator Simulators and Water Separators - In the low pressure phases of anLBLOCA the steam generators act as flow resistances for the steam flowing from theupper plenum to the downcomer via the intact loops. In addition, the hot fluid on thesecondary side of the steam generator is a heat source. Steam production due towater entering the tubes on the primary side can significantly affect the differentialpressure between upper plenum and downcomer. Steam generator simulators wereinstalled in the three intact coolant loops of UPTF to simulate the behavior of realsteam generators during refill and reflood phases of an LBLOCA.
Proper inflow conditions were obtained by maintaining inflow orientation as well ascross section and height of the reference steam generator inlet plenum. The U-tubebundle was replaced by an assembly of two-stage, cyclone steam/water separatorswhich had a similar flow area and the flow resistance (see Figure A.3-6). The overallvolume and overflow height were retained by the loop configuration.
The evaporation of water entering the heat exchange area was simulated by steaminjection into the dome of the steam generator simulator. This could be performed ina preprogrammed way (transient or constant) or automatically controlled by afeedback system based on measured conditions. In separate effects tests,preprogrammed steam generator simulator steam injection was used as a clearly-defined boundary condition. In integral tests, the feedback system was used to obtaina simulation of the real steam generator, to evaluate the system effects on theemergency core cooling process. Two different modes of operation are distinguishedby the steam generator simulator feedback system:
" Dispersed water flow entering the steam generator tube regions.
" Water plug flow entering the steam generator tube regions.
Water droplets carried by steam flow to the steam generator simulators wereseparated by the cyclone separators, measured and drained from the system. Thesame amount of steam as the water separated was injected to the dome of the steamgenerator simulator.
If a water plug entering the steam generator simulator was detected by themeasurement systems, large quantities of steam were injected according to algorithmsdeveloped at the Technical University of Munich. The resulting pressure increase inthe loop drove the water plug back to the hot leg and into the upper plenum.
A.3-4

Steam/water separators were installed close to the break valves. Break mass flowrates entering the separators were split into single-phase water and steam flows.Water was separated by two-stage cyclones, measured and drained to the watercollecting tank (see Figure A.3-6). Steam flow was measured by orifices and ventedto the containment simulator where it was condensed.
The steam/water separator on the hot leg side could be used as a steam generatorsimulator for tests simulating LOCAs with break sizes smaller than 200% of the loopflow area. The overall design was similar to that of the steam generator simulators butthe number of cyclones was increased according to higher mass flow rates expectedin the broken loop in case of a full offset break of a main coolant pipe.
Pump Simulators - In UPTF, pump simulators, which model the volume, and keyinternal heights of the reactor coolant pump for the reference reactor, were installedin the intact loops as well as the broken loop. The flow resistance of the pumpsimulators was adjustable and was preset according to the test requirements (seeFigure A.3-7). The pressure drop coefficient could be varied over a wide range. Forseparate effects tests requiring no flow in the primary coolant piping, the loops werecompletely blocked by the pump simulators.
Containment Simulator - The containment simulator was designed as a pressuresuppression/control system simulating large, dry containment conditions.
The containment simulator consisted of a large vessel (1500 mn) which was dividedinto a dry well (500 mn) and a wet well (1000 m3). The steam flow from the primarysystem entered the containment simulator at the top of the dry well and flowed via 14downcomers into the water inventory of the wet well where it condensed (seeFigure A.3-8).
Nitrogen was mixed with steam in the downcomers to reduce dynamic effects ofsteam condensation in the wet well, so that the overall pressure oscillations werelimited to 20 kPa.
When pressure in the primary coolant system dropped below the specifiedcontainment pressure, a backflow of steam was provided. An auxiliary steam supplysystem provided controlled injection of up to 300 kgs/s to maintain the containmentpressure at its specified value. In case of rapid transients, a set of safety valvesprevented excessive pressure spikes and overpressurization of the containmentsimulator.
Containment pressure was controlled by the central computer where the desiredconditions were programmed. The range of simulated containment pressures wasfrom 250 kPa to 600 kPa, which covered US/J and FRG PWR containment designsto be simulated in the 2D/3D Program.
A.3-5

ECC Injection System - Accumulator and low pressure ECC injection systems of actualPWRs were replaced in UPTF by large accumulators and control systems able tosimulate the characteristics of various ECC system designs. Eight ECC injection portswere provided in the primary loop piping: four in the hot legs and four in the coldlegs. In addition, two downcomer injection ports were provided for simulation of ECCconcepts as used, for instance, by B&W or ABB (BBR).
The ECC water in UPTF was contained in four large storage tanks pressurized bysteam. During discharge of water, the pressure in the storage tanks was maintainedby steam from the steam supply system. Two of the ECC storage tanks could alsobe used for nitrogen storage for simulation of nitrogen discharge from theaccumulators at the end of accumulator injection typical for US/J PWR designs.
ECC was fed from the storage tanks to a common header and distributed to theinjection ports. Flow to each injection port was individually controlled (seeFigure A.3-9). To simulate dissolved nitrogen in accumulator ECC, nitrogen could beadded to the ECC water close to the injection ports.
For proper flow conditioning, the ECC piping within one meter of the injection port wasidentical to that in the reference plant. The cold leg ECC port cross section wasadjusted by inserts to consider the different cross sections of the injection ports ofUS/J PWRs and GPWRs. ECC water in the tanks and piping could be preheated to1200C using steam nozzles in the tanks and a Tecirculation system. For simulation ofstructural heat, the water and ECC piping close to the injection could be heated upto 1600C.
Control and Instrumentation
Process Control System - The process control system consisted of several computersand control loops to establish time-dependent test boundary conditions and providefeedback to active test facility subsystems.
The overall process was controlled by control computer P1 (SIEMENS microcomputerSMP). Test initiation, time-dependent boundary conditions, as well as the shutdownprocedure, were stored in, and controlled by, the P1 computer.
For test initiation, the opening times and opening sequence of the break valves, andthe start of core simulator steam and water injection, steam generator simulatorinjection and ECC injection were controlled in a preprogrammed way. During the test,time-dependent boundary conditions such as core simulator steam and water injectionrates, ECC injection rates, steam generator simulator steam injection rates, andcontainment pressure were also controlled by control computer P1. Core simulatorand steam generator simulator injection rates could be automatically controlled byfeedback systems as described below.
A.3-6

For integral tests which were to simulate realistic PWR system behavior, the basicsteam and water injection rates were predetermined and stored in control computerP1. If, during the test, certain measured conditions deviated from pre-calculatedvalues, the injection rates could be adjusted. Algorithms for the variation of coreresponse to different bottom flooding rates or local water breakthrough from the upperplenum (in the case of hot leg ECC injection), which were developed based on SCTFand CCTF tests, were stored in control computer P2 (SIEMENS microcomputer MMC).
In addition, P2 controlled the fast, automatic shutdown system (FASS) which wouldterminate tests if test conditions exceeded design limits.
Steam generatorfeedback systems were controlled by computer (SIEMENS PC 16-20)for each of the intact loop steam generator simulators. The on-line simulation ofsteam production considered the amount of water entering the heat transfer area aswell as the flow pattern, as previously discussed.
Instrumentation and Data Acquisition Systems (DAS) - UPTF instrumentation wasdivided into operation instrumentation and test instrumentation. Operationinstrumentation was used to control boundary conditions for test operation. Testinstrumentation was used to measure processes and phenomena investigated in thetests. Test instrumentation such as thermocouples and pressure transducers werecalled conventional instrumentation. In addition, specialized and complex two-phaseflow instrumentation (called advanced instrumentation) was developed and suppliedto UPTF by USNRC. These instruments are:
* Tie plate flow modules to specially determine mass flow rates at the core/upperplenum interface.
* Breakthrough detectors to measure water downflow from upper plenum to core.
* Pipe flowmeters to determine hot leg and broken cold leg mass flow rates.
* Purged DP transducers to measure upper plenum water inventory at severallocations.
* FDG/LLD optical sensors to distinguish water- and steam-filled volumes.
* Turbine meters to measure velocities.
The signals from the instrument sensors were conditioned and stored by the dataacquisition systems, which also was provided by USNRC. There were twoindependent systems in UPTF. The stand-alone DAS (HP-A600 computer) collectedand stored the digital data from the 705 channels of the FDG/LLD systems. The mainDAS was based on a VAX 11/750 computer. A total of 938 analog channels, 15
A.3-7

channels for the y-densitometers of the pipe flowmeters, and 210 analog auxiliary andspare channels were installed in the main DAS.
According to the band width desired (5 Hz), the general data sampling rate for UPTFinstrumentation was 25 Hz. For pipe flowmeter absolute pressure, pipe flowmeterdrag rake force, and tie plate drag body force a sampling rate of 150 Hz was chosen.
Facility Load Monitoring System - To record the load history of critical test facilitycomponents, an independent monitoring system was installed. In tests whereextraordinary loads were expected, the system also was used to supervise the testperformance and, if necessary, terminate the test before the integrity of facilitycomponents was jeopardized.
The monitoring system consisted of a data acquisition system which collected andstored the data from the various sensors. The following instruments are installed onselected facility components or supports.
* Four pressure taps
* Thirteen force meters
* Thirty strain gages
* Eight acceleration meters
* Nine displacement meters
A.3.2 Cataioq of Tests
The UPTF test program was designed to cover a wide range of phenomena,parameters, and PWR ECC system designs. The UPTF test matrix is summarizedbelow by region of the primary system and phenomena of interest. The basic testconditions are summarized in Table A.3-1.
Downcomer Behavior during End-of-Blowdown Tests - This group of testsinvestigated countercurrent flow in the downcomer during the end-of-blowdownphase of an LBLOCA; ECC systems simulated included cold leg injection anddowncomer injection.
Downcomer Behavior during Reflood Tests - These tests evaluated waterentrainment from the downcomer during the reflood phase of an LBLOCA; bothcold leg and downcomer ECC injection systems were simulated.
A.3-8

Tie Plate and Upper Plenum Behavior Tests - This test group investigated full-scalecountercurrent flow at the tie plate for ECC delivered to the upper plenum andsteam or two-phase upflow from the core. Upper plenum water accumulation wasalso investigated in these tests.
Upper Plenum/Hot Leg De-entrainment Tests - These tests investigatedentrainment/de-entrainment and accumulation of water upstream of the steamgenerator tubes (i.e., in the upper plenum, hot legs, and steam generator inletplena) during reflood.
Loop Behavior Tests - This group of tests investigated the development of flowpatterns, particularly stratified flow and plug flow, for various ECC and steam ortwo-phase mass flow rates.
Separate Effects Tests with Vent Valves - The test group evaluated the effect ofvent valves on downcomer countercurrent flow during EOB, and water entrainmentfrom the downcomer during reflood.
Small Break LOCA Separate Effects Tests - These tests investigated the followingphenomena related to SBLOCAs.
Fluid-fluid mixing in the cold leg and downcomer at elevated temperature(i.e., pressurized thermal shock).
Steam/water countercurrent flow in the hot legs for the reflux-condensermode of core cooling during an SBLOCA.
Steam/water countercurrent flow at the tie plate with high pressure ECCinjection into the hot legs when the system is at an elevated pressure.
Integral Tests - Integral tests simulated overall system behavior during the EOB,refill, and reflood phases of an LBLOCA. Specific ECCS concepts simulatedincluded:
Cold leg injection.
Combined injection.
Cold leg/downcomer injection with vent valves.
A.3-9

Table A.3-1
UPTF TESTSPage 1 of 4
0>
[Test I Test f1Group Objective Numbers Run Numbers Baslc Test Conditions(1 )
Downcomer Behavior Downcomer CCFL and 4A 174 CLI; transient depressurization from 1200 kPa; loops openduring End-of- ECC Bypass 5A 063 CLI; transient depressurization from 1800 kPa; loops blockedBlowdown 5B 062 CLI; steady-state CS steam Injection; loops blocked
6 131, 132, 133, 135, 136 CLI; ECC saturated; steady-state CS steam Injection; loops blocked7 200, 201,202, 203 CLI; ECC saturated; steady-state CS steam Injection; loops blocked
21A 272 DCI; ECC subcooled; steady-state CS steam Injection; loops blocked21B 274 DCI; ECC saturated; steady.state CS steam Injection; loops blocked
Downcomer Behavior Downcomer 25A 242 CLI; DC wall superheated; steady-state SGS steam Injection; loops openduring Reflood Entrainment 25B 241 CLI; DC wall saturated; steady-state SGS steam Injection; loops open
21D 171 DCI; DC wall saturated; steady-state SGS steam Injection; loops open
Tie Plate and Upper Simultaneous Two- 20 090 UPI; ECC subcooled; CS steam and water Injection; no SGS steam InjectionPlenum Behavior Phase Upflow and 10A 080 HLI; ECC saturated; CS steam Injection; no SGS steam injectionTests Water Downflow; 12 014 HLI; ECC subcooled; CS steam Injection; no SGS steam injection
Breakthrough at Tie 13 071 HLI; ECC subcooled; CS steam and water injection (W/S=4); no SGS steam injectionPlate; Upper Plenum 26C 232 HLI; ECC subcooled; CS steam and water Injection (W/S= 10); no SGS steamPool Formation Injection
15A 123 HLI; ECC subcooled; CS steam and water Injection (hysteresis); no SGS steaminjection
15B 127 HLI; ECC •ubcooled; CS steam and water Injection (W/S=4); auto SGS steamInjectionm2)
16A 181 HLI; ECC ubcooled; CS steam and water Injection (W/S= 1.7); auto SGS steamInjectionf2u)
16B 184 HLI; ECC subcooled; CS steam and water Injection (W/S=2.7); auto SGS steamInjection( 2)
Upper Plenum/Hot Tie Plate CCFL; 10C 082 Steady-state CS steam and water Injection; loops blockedLeg De-entrainment Entrainment to Upper 108 081 Steady-state CS steam and water Injection; loops openTests Plenum, Hot Legs and 29 210, 211,212 Steady-state CS steam and water Injection; loops open
SG

Table A.3-1
UPTF TESTS
Page 2 of 4
Test TestGroup Objective Numbers Run Numbers Basic Test Conditions(1 )
Loop Behavior Tests Flow Pattern In Hot 8A 112 (2nd portion) HLI; ECC suboooled; CS steam Injection; auto SGS steam Injection( 2); low loop flowLegs resistance8B 111 HLI; ECC suboocled; CS steam Injection; auto SGS steam injection(2); high loop flow
resistance26B 231 HLI; ECC subcooled; CS steam Injection; no SGS steam Injection26A 230 HLI; ECC saturated; CS steam Injection; no SGS steam Injection
Flow Pattern In Cold 8A 112 (1st portion) CLI; ECC subcooled; CS steam Injection; no SG simulation; low loop flow resistanceLegs 8B 111 CLI; ECC subcooled; CS steam Injection; no SG simulation; high loop flow resistanceFlow Pattern In Hot and 9A 056 Cl; ECC suboooled; CS steam and water Injection; auto SGS steam Injection(2); lowCold Legs loop flow resistance
9B 059 CI; ECC subcooled; CS steam and water Injection; auto SGS steam Injectlon(2); highloop flow resistance
Vent Valve Separate Downcomer CCFL and 22A 280 (1st portion) DCI; ECC subcooled; steady-state CS steam Injection; loops blocked; W freeEffects Tests ECC Bypass during 22B 281,283 DCI; ECC saturated; steady-state CS steam Injection; loops blocked; W freeEnd-of-Blowdown 22Bs 285 DCI; ECC saturated; steady-state CS steam Injection; loops blocked; W free; TS22C 282 DCI; ECC saturated; steady-state CS steam Injection; loops blocked; W free22Cs 284 DCI; ECC saturated; steady-state CS steam Injection; loops blocked; W free; TS
Flow Phenomena In 21C 273, 275 DCI; ECC suboocled; steady-state CS steam and water Injection; loops open; WDownoomer, Loops blockedand Upper Plenum 22A 280 (2nd portion) DCI; ECC subcooled; steady-state CS steam and water Injection; loops blocked; Wduring Reflood free
23B 290 DCI; ECC subcooled; steady-state SGS steam Injection; loops blocked; W free; TS23A 291 DCI; ECC subcooled; steady-state CS steam and water Injection; loops open; W free;
TS
.>

Table A.3-1
UPTF TESTS
Page 3 of 4
Test TestGroup Objective Numbers Run Numbers Basic Test CondItlons(1)
SBLOCA Separate Fluid-Fluid Mixing In 1 020, 021,023, 025, 026 CLI; ECC subcooled; primary system filled with warm waterEffects Tests Cold Leg and
Downcomer
Hot Leg CCFL 11 030-034, 036-045 Steady-state CS steam Injection; water Injection Into inlet plenum of broken hot legsteam/water separator; Intact loops blocked
Behavior In Hot Leg 30 141,142 HLI; ECC subcooled; system pressure - 1500 kPaand Upper Plenum withHPI
Cold Leg ECC System Behavior 27A 256 CLI; BE refill/reflood simulation; nitrogen discharge from ACCInjection Integral Test during a Simulated 27B 255 CLI; BE reflood simulation; high loop flow resistance
LOCA Transient 2 101 CLI; EM reflood simulation4B 177 CLI; BE reflood simulation; moderate loop flow resistance
17B 151 CLI; BE reflood simulation; low loop flow resistance17A 151 No ECC Injection; BE reflood simulation; low loop flow resistance
Combined ECC System Behavior 3 C5 Cl; cold leg break - break size = 2A; EM refill/reflood simulationInjection integral during a Simulated 18 169 Cl; cold leg break - break size - 2A; EM refill/reflood simulationTests (3) LOCA Transient 28 262 CI; cold leg break - break size = 2A; BE reflill/reflood simulation
19 192 CI; cold leg break - break size = 0.5.A EM refill/reflood simulation14 221 CI; hot leg break - break size = 2A; EM refill/reflood simulation
Downcomer/ System Behavior 24 302, 304 DCI and CLI; cold leg break; EM refill/reflood simulation; TSCold Leg ECC during a SimulatedInjection with Vent LOCA TransientValves Integral Test
.>ro

Table A.3-1
UPTF TESTSPage 4 of 4
NOTES:
1. The following abbreviations are used in the test conditions:
Cl Combined ECC injectionCLI Cold leg ECC injectionDCI Downcomer ECC injectionHLI Hot leg ECC injectionUPI Upper plenum ECC injection
ACC AccumulatorsBE Best estimateCS Core simulatorEM Evaluation modelSGS Steam generator simulatorTS Thermal sleeves installed in downcomer ECC injection nozzlesW Vent valvesW/S Ratio of core simulator water and steam injection rates
2. "Auto SGS steam injection" indicates that the SGS feedback control system wasactivated to automatically inject steam based on the water flow into the SGS.
3. Break size is defined relative to the cross-sectional area of the reactor coolantpiping (A).
A.3-13
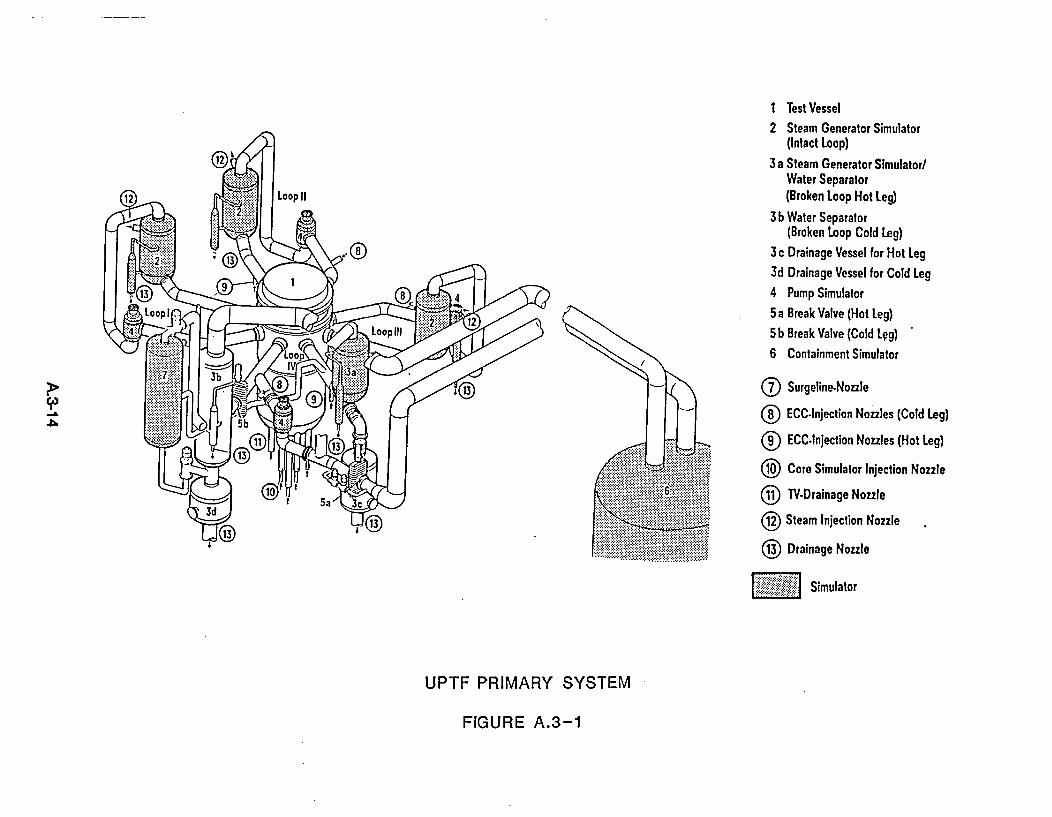
1 Test Vessel2 Steam Generator Simulator
(Intact Loop)3 a Steam Generator Simulator/
Water Separator(Broken Loop Hot Leg)
3 b Water Separator(Broken Loop Cold Leg)
3 c Drainage Vessel for Hot Leg3d Drainage Vessel for Cold Leg
4 4 Pump Simulator
5 a Break Valve (Hot Leg)2. 12 5b Break Valve (Cold Lqg)
6 Containment Simulator
(7) Surgeline.Nozzle
( ECC.Injection Nozzles (Cold Leg)
( ECC.Injection Nozzles (Hot Leg)
Core Simulator Injection Nozzle
I TV.Drainage Nozzle
@ Steam Injection Nozzle
@ Drainage Nozzle
WSimulator
UPTF PRIMARY SYSTEM
FIGURE A.3-1

2000 kPa, 212*C
3d3cCA M
MM
7
1 Test Vessel 3c Drainage Vesselfor Hot Leg 7 Ste2 Steam Generator Simulator (Intact Loop) 3d Drainage Vessel for Cold Leg 8 Wa3a Steam Generator Simulator/Water Separator 4 Hot Water Storage Tank 9 Ste
(Broken Loop Hot Leg) 5 Accumulator 10 Pui3b Water Separator (Broken Loop Cold Leg) 6 Containment Simulator 11 N2'
UPTF FLOW DIAGRAM
eam Storage Tank 0 Sampleater Collecting Tankeam Coolermp Simulator-Tank
FIGURE A.3-2

UPTF TEST VESSEL
FIGURE A.3-3
A.3-16

Upper End Box
Spacer Grid
Zone Barrier
Steam Injectedinto Water Line
Steam from'Steam Storage Tank
UPTF CORE SIMULATOR INJECTION SYSTEM
FIGURE A.3-4
A.3-17
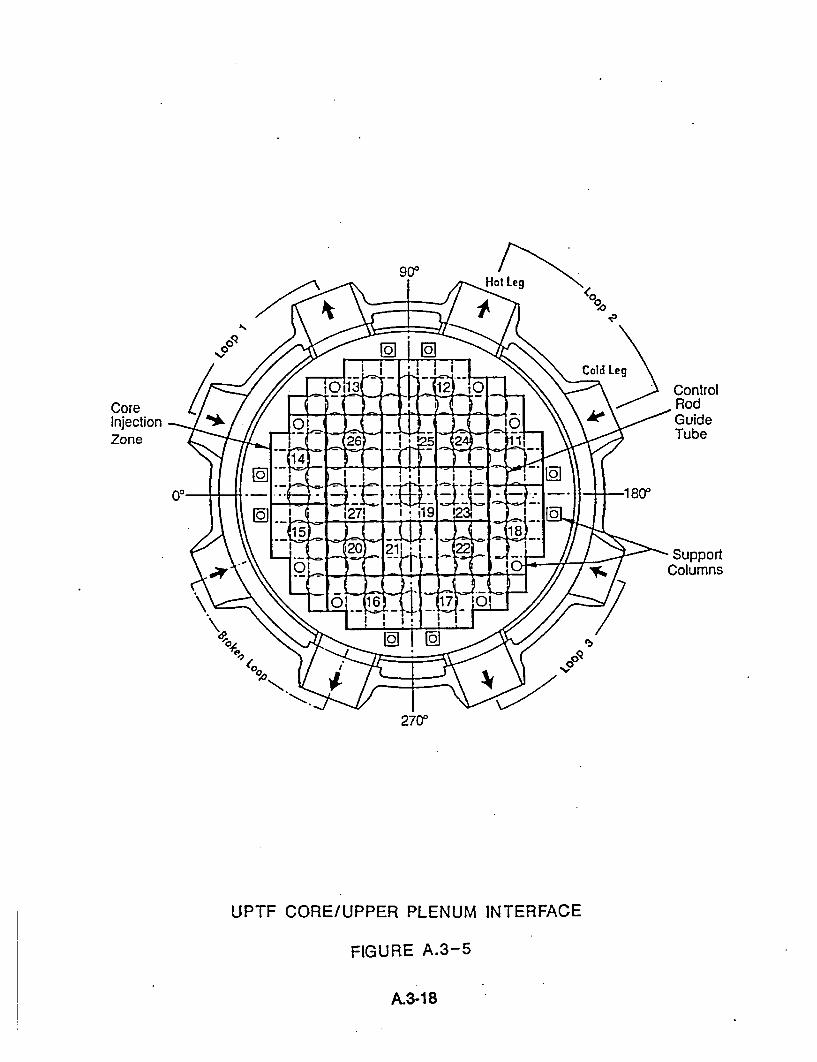
A! Leg
04
Core CRodInjection 0- ,0 GuideZone Tube
_IT OR/PE PLEUMNTEFAs
FIGURE A.3-5
A.3-18
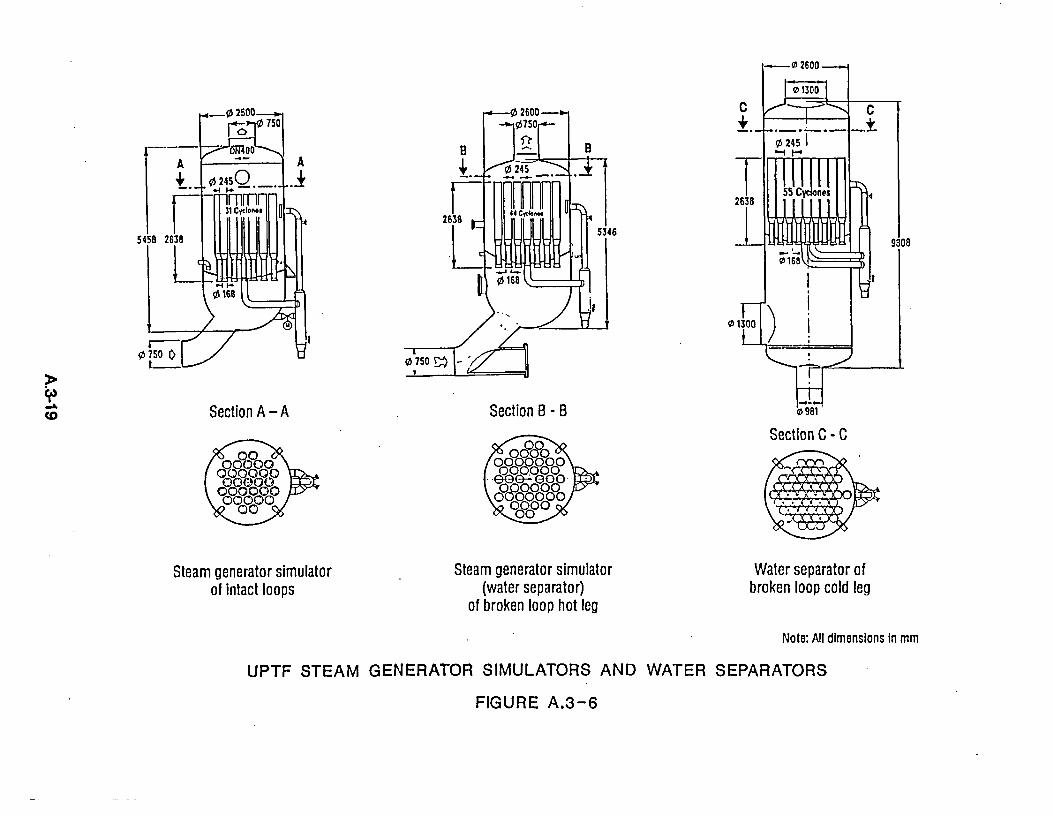
0
.>
Section A - A
0000000
00000000000
0000000 %0o0o000~~oo
Section B - B
0000o000000
0000000 0000
U02600
Section C - C
Steam generator simulatorof intact loops
Steam generator simulator(water separator)
of broken loop hot leg
Water separator ofbroken loop cold leg
Note: All dimensions in mm
UPTF STEAM GENERATOR SIMULATORS AND WATER SEPARATORS
FIGURE A.3-6

UPTF PUMP SIMULATOR
FIGURE A.3-7
A.3-20

Steam Storage Tank Broken Hot Leg
Back-Up Steam Broken Cold Leg
S"--- Rupture Disc
Line
011300
TotalDry WellWet WellWater
1500 m3
500 m31000 m3500 m3
Note: All dimensions in mm
UPTF CONTAINMENT SIMULATOR
FIGURE A.3-8
A.3-21

F = Flow Rate MeasurementT = Temperature Measurement
P = Pressure MeasurementL = Water Level Measurement
UPTF ECC INJECTION SYSTEM FLOW DIAGRAM
FIGURE A.3-9

Appendix B
TRAC COMPUTER CODE DESCRIPTION AND LIST OF ANALYSES
As part of the USNRC contribution to the 2D/3D Program, the Transient ReactorAnalysis Code (TRAC), developed by Los Alamos National Laboratory (LANL), wasprovided to the other participants in the program. In addition, LANL carried out ananalytical support program using TRAC under the direction of the USNRC. SelectedTRAC calculations were also carried out by the other program participants.
The objectives of the analytical support program were to utilize TRAC to: supportdesign of the test facilities, determine prototypical initial and boundary conditions tobe used in tests, and to evaluate the predictive capability of TRAC by comparing codepredictions to test data.
In an effort (Reference E-609) separate from the 2D/3D Program, the USNRCdeveloped a methodology to evaluate thermal-hydraulic code scaling, applicability anduncertainty. This methodology was demonstrated by applying it to the use ofTRAC-PF1 /MOD1 v 14.3 for a cold-leg LBLOCA in a Westinghouse 4-loop PWR. Datafrom the 2D/3D Program were used extensively in evaluating reflood heat transfer,ECC delivery/bypass during the end-of-blowdown, and water carryover/steam binding.
B-1


B.1 EVOLUTION OF TRAC AND DESCRIPTION OF TRAC-PF1/MOD1 ANDTRAC-PFI/MOD2
At the beginning of the 2D/3D Program, TRAC was an experimental code for reactorsafety analysis. Concurrent with the 2D/3D Program, TRAC was developed into asophisticated and mature computer code for the analysis of thermal-hydraulictransients in reactor systems. The use of TRAC as a part of the 2D1/3D Programcontributed significantly to its development as code experience and data from the2D/3D Program were continually fed back to the code developers. The2D/3D Program provided the best and most complete set of experimental data forassessing TRAC against large-break LOCA (LBLOCA) phenomena. TRAC has gonethrough several major releases with a number of versions of each release. The lastcode version used as part of the 2D/3D Program was TRAC-PF1/MOD2, v 5.3, whichwas released in June 1990.
TRAC has been developed at LANL under the sponsorship of the USNRC. Apreliminary TRAC version consisting of only one-dimensional components wascompleted in December 1976. Although this version was not released publicly nordocumented formally, it was used in TRAC-P1 development and formed the basis forthe one-dimensional loop component modules. The first publicly-released version,TRAC-P1, was completed in December 1977.
TRAC-P1 was designed primarily for analysis of LBLOCAs in PWRs. It could beapplied directly to many analyses ranging from blowdowns in simple pipes to integralLOCA tests in multiloop facilities. A refined version, TRAC-P1A, was released to theNational Energy Software Center in May 1979. Although it treated the same class ofproblems, TRAC-P1A was more efficient than TRAC-P1 and incorporated improvedhydrodynamic and heat transfer models. TRAC-PD2 (released in April, 1981)contained improvements in reflood heat transfer models and numerical solutionmethods. Although TRAC-PD2 was an LBLOCA code, it was applied successfully tosmall-break problems and to the Three Mile Island transient.
TRAC-PF1 was designed to improve the ability of TRAC-PD2 to handle small-breakLOCAs and other transients. TRAC-PF1 used a full two-fluid model with two-stepnumerics in the one-dimensional components. The two-fluid model, in conjunctionwith a stratified-flow regime, handled countercurrent flow better than the drift-fluxmodel used previously. The two-step numerics allowed large time steps for slowtransients. A one-dimensional core component permitted simpler calculations,although the three-dimensional vessel option was retained. A non-condensible gasfield was added to the one- and the three-dimensional hydrodynamics. Significantimprovements were also made to the trip logic and the input. TRAC-PFI was releasedpublicly in July 1981.
B.1-1
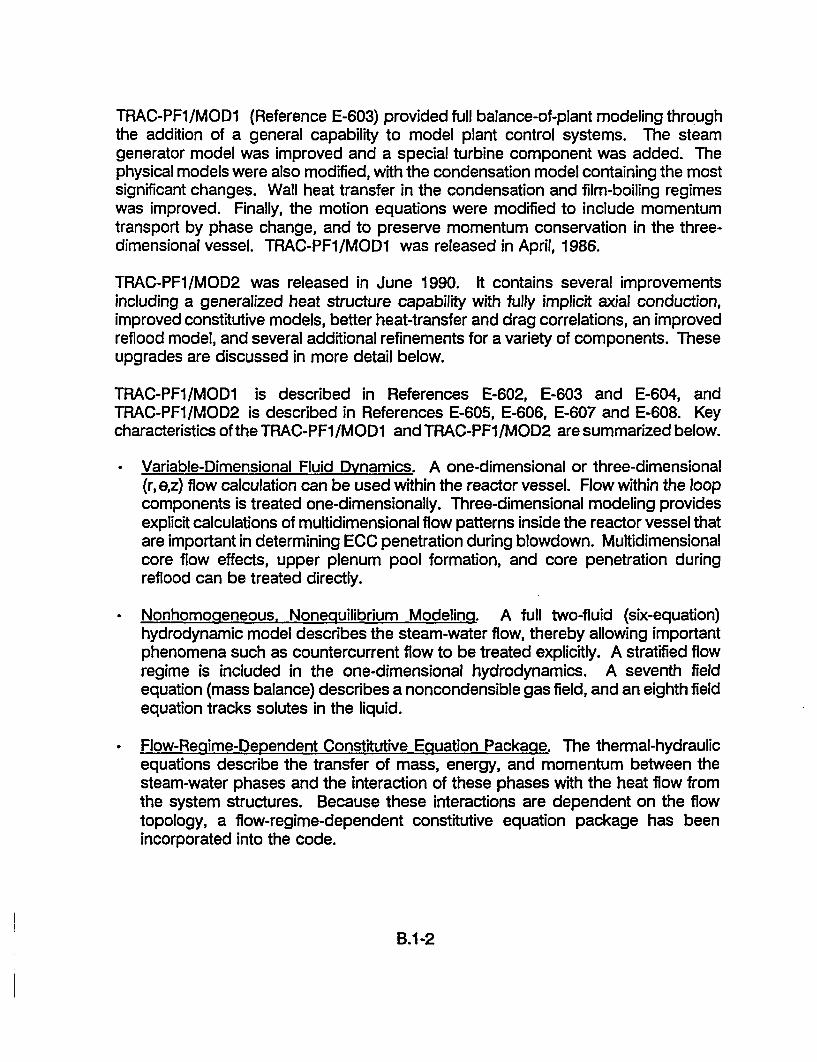
TRAC-PF1/MOD1 (Reference E-603) provided full balance-of-plant modeling throughthe addition of a general capability to model plant control systems. The steamgenerator model was improved and a special turbine component was added. Thephysical models were also modified, with the condensation model containing the mostsignificant changes. Wall heat transfer in the condensation and film-boiling regimeswas improved. Finally, the motion equations were modified to include momentumtransport by phase change, and to preserve momentum conservation in the three-dimensional vessel. TRAC-PF1/MOD1 was released in April, 1986.
TRAC-PF1/MOD2 was released in June 1990. It contains several improvementsincluding a generalized heat structure capability with fully implicit axial conduction,improved constitutive models, better heat-transfer and drag correlations, an improvedreflood model, and several additional refinements for a variety of components. Theseupgrades are discussed in more detail below.
TRAC-PF1/MOD1 is described in References E-602, E-603 and E-604, andTRAC-PF1/MOD2 is described in References E-605, E-606, E-607 and E-608. Keycharacteristics of the TRAC-PF1 /MOD1 and TRAC-PF1 /MOD2 are summarized below.
Variable-Dimensional Fluid Dynamics. A one-dimensional or three-dimensional(r, ez) flow calculation can be used within the reactor vessel. Flow within the loopcomponents is treated one-dimensionally. Three-dimensional modeling providesexplicit calculations of multidimensional flow patterns inside the reactor vessel thatare important in determining ECC penetration during blowdown. Multidimensionalcore flow effects, upper plenum pool formation, and core penetration duringreflood can be treated directly.
Nonhomogeneous, Nonequilibrium Modeling. A full two-fluid (six-equation)hydrodynamic model describes the steam-water flow, thereby allowing importantphenomena such as countercurrent flow to be treated explicitly. A stratified flowregime is included in the one-dimensional hydrodynamics. A seventh fieldequation (mass balance) describes a noncondensible gas field, and an eighth fieldequation tracks solutes in the liquid.
Flow-Regime-Dependent Constitutive Eguation Package. The thermal-hydraulicequations describe the transfer of mass, energy, and momentum between thesteam-water phases and the interaction of these phases with the heat flow fromthe system structures. Because these interactions are dependent on the flowtopology, a flow-regime-dependent constitutive equation package has beenincorporated into the code.
B.1-2
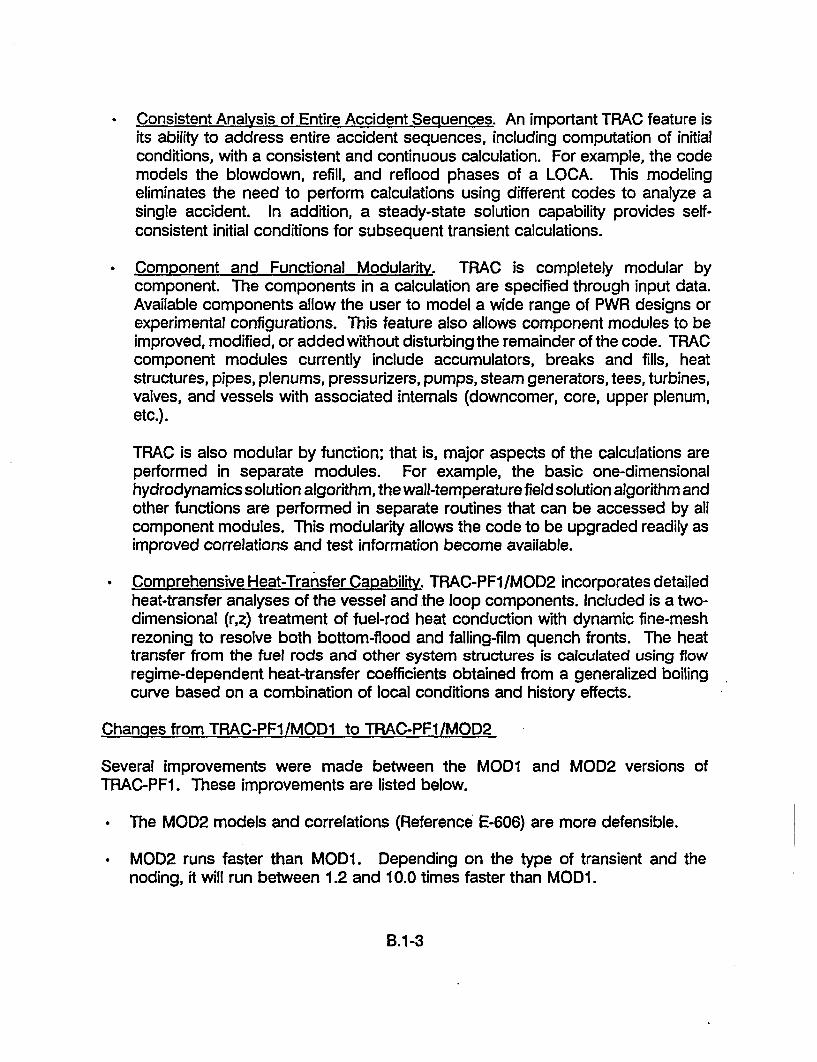
Consistent Analysis of Entire Accident Sequences. An important TRAC feature isits ability to address entire accident sequences, including computation of initialconditions, with a consistent and continuous calculation. For example, the codemodels the blowdown, refill, and reflood phases of a LOCA. This modelingeliminates the need to perform calculations using different codes to analyze asingle accident. In addition, a steady-state solution capability provides self-consistent initial conditions for subsequent transient calculations.
.Component and Functional Modularity. TRAC is completely modular bycomponent. The components in a calculation are specified through input data.Available components allow the user to model a wide range of PWR designs orexperimental configurations. This feature also allows component modules to beimproved, modified, or added without disturbing the remainder of the code. TRACcomponent modules currently include accumulators, breaks and fills, heatstructures, pipes, plenums, pressurizers, pumps, steam generators, tees, turbines,valves, and vessels with associated internals (downcomer, core, upper plenum,etc.).
TRAC is also modular by function; that is, major aspects of the calculations areperformed in separate modules. For example, the basic one-dimensionalhydrodynamics solution algorithm, the wall-temperature field solution algorithm andother functions are performed in separate routines that can be accessed by allcomponent modules. This modularity allows the code to be upgraded readily asimproved correlations and test information become available.
.Comprehensive Heat-Transfer Capability. TRAC-PF1/MOD2 incorporates detailedheat-transfer analyses of the vessel and the loop components. Included is a two-dimensional (r,z) treatment of fuel-rod heat conduction with dynamic fine-meshrezoning to resolve both bottom-flood and falling-film quench fronts. The heattransfer from the fuel rods and other system structures is calculated using flowregime-dependent heat-transfer coefficients obtained from a generalized boilingcurve based on a combination of local conditions and history effects.
Changes from TRAC-PF1/MOD1 to TRAC-PF1/MOD2
Several improvements were made between the MODI and MOD2 versions ofTRAC-PF1. These improvements are listed below.
" The MOD2 models and correlations (Reference E-606) are more defensible.
" MOD2 runs faster than MODI. Depending on the type of transient and thenoding, it will run between 1.2 and 10.0 times faster than MODI.
B.1-3

The improved post-CHF heat transfer and interfacial models in MOD2 accuratelysimulate separate-effects tests.
MOD2 has an improved reflood model based on mechanistic and defensiblemodels.
There are improved constitutive models in MOD2 for downcomer penetration,upper plenum de-entrainment, hot/cold leg ECC injection, vertical stratification inthe vessel component, and condensation and evaporation in the presence ofnoncondensibles.
* Generalized heat structure capability in MOD2 allows the user to accurately modelcomplicated configurations.
* An improved valve model based on experimental data for partially closed valveswas implemented in MOD2.
Improved vessel numerics that eliminate mass errors even at large time step sizesthat can occur in small breaks or operational transients were included in MOD2.
* An offtake model is available in MOD2 to accurately represent small breaks in thebottom, top, or side of a pipe.
• The American Nuclear Society (ANS) 1979 Decay Heat Standard was implementedas a default model in MOD2.
• A countercurrent flow limitation (CCFL) model was implemented in both the one-dimensional and three-dimensional components in MOD2.
* An improved subcooled boiling model based on published correlations was
implemented in MOD2.
* The momentum solution was forced to be conserving in MOD2.
The external thermocouple model developed by the United Kingdom AtomicEnergy Authority (UKAEA) was implemented in MOD2.
* The fully implicit axial conduction solution developed by the Japan Atomic EnergyResearch Institute (JAERI) was implemented in MOD2.
B.1-4

B.2 CATALOG OF ANALYSES
Within the 2D/3D Program, an extensive code analysis program was performed usingTRAC. The analyses are listed in the following subsections according to the facility(i.e., PWR or test facility).
B.2.1 PWR Analyses
A total of 18 PWR and related calculations were performed in the 2D/3D Program.These calculations included both evaluation model (EM) and best-estimate (BE)analyses of US/J type PWRs and GPWRs. The analyses are listed in Table B.2-1.
B.2.2 CCTF Analyses
TRAC analyses of CCTF tests included nine tests from Core-I and 20 tests fromCore-lI. The tests analyzed covered several different ECCS configurations includingcold leg injection, downcomer injection, combined injection and upper plenuminjection. The analyses are listed in Tables B.2-2 (Core-I) and B.2-3 (Core-Il).
B.2.3 SCTF Analyses
Calculations of SCTF tests included tests from each of the three test series;specifically, 13 tests from Core-I, 12 tests from Core-Il, and 10 tests from Core-Ill.The tests analyzed included both integral and separate effects tests, as well as severaldifferent ECCS configurations. The analyses are listed in Tables B.2-4 (Core-I), B.2-5(Core-Il), and B.2-6 (Core-Ill).
B.2.4 UPTF Analyses
A total of 19 UPTF tests were analyzed using TRAC. The tests analyzed includedseparate effects tests which focused on thermal-hydraulic behavior in specific regionsof the primary system (i.e., upper plenum, hot legs, cold legs or downcomer), as wellas several integral tests. The analyses are listed in Table B.2-7.
B.2-1

Table B.2-1
TRAC PWR AND RELATED CALCULATIONS
(Note: The most recent calculations are listed first for each PWR type.)
Page 1 of 4
PWR Report Title Source Reference TRAC VersionType __I I 1
US/J TRAC-PF1/MOD1 INEL U-727 PF1/MOD1 v. 14.3US/Japanese PWRConservative LOCAPrediction
USJJ TRAC-PFI/MOD1 LANL U-726 PF1/MOD1 v. 12.2Analysis of aMinimum-SafeguardsLarge-Break LOCA ina US/Japanese PWRwith Four Loops and15x15 Fuel
US/J TRAC-PFI/MOD1 LANL U-723 PFI/MOD1IAnalysis of a 200%Cold Leg Break in aUS/Japanese PWRwith Four Loops and15x15 Fuel
US/J TRAC-PFI/MOD1 LANL U-724 PFI/MOD1Analysis of aMinimum-safeguardsLarge-break Loss-of-Coolant Accident in a4-loop PWR with17xl 7 Fuel
B.2-2
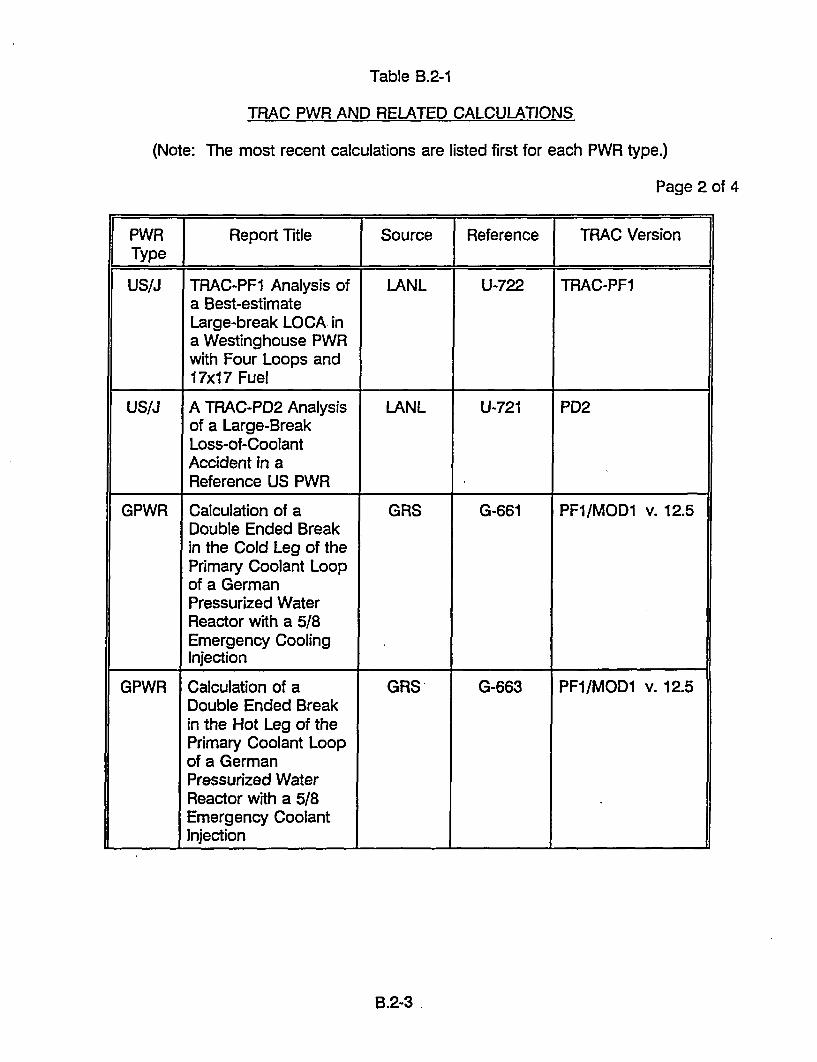
Table B.2-1
TRAC PWR AND RELATED CALCULATIONS
(Note: The most recent calculations are listed first for each PWR type.)
Page 2 of 4
PWR Report Title Source Reference TRAC VersionType ___ I IUS/J TRAC-PF1 Analysis of LANL U-722 TRAC-PF1
a Best-estimateLarge-break LOCA ina Westinghouse PWRwith Four Loops and17x17 Fuel
US/J A TRAC-PD2 Analysis LANL U-721 PD2of a Large-BreakLoss-of-CoolantAccident in aReference US PWR
GPWR Calculation of a GRS G-661 PF1/MOD1 v. 12.5Double Ended Breakin the Cold Leg of thePrimary Coolant Loopof a GermanPressurized WaterReactor with a 5/8Emergency Cooling
I Injection
GPWR Calculation of a GRS G-663 PFI/MOD1 v. 12.5Double Ended Breakin the Hot Leg of thePrimary Coolant Loopof a GermanPressurized WaterReactor with a 5/8Emergency CoolantInjection
B.2-3

Table B.2-1
TRAC PWR AND RELATED CALCULATIONS
(Note: The most recent calculations are listed first for each PWR type.)
Page 3 of 4
PWR Report Title Source Reference TRAC Version
Type I I I I
GPWR TRAC-PF1 Analysis of LANL U-748 PF1/MOD1 v. 8.2a 200% Hot-leg Breakin a German PWR
GPWR Comparison Between JAERI J-608 PF1/MOD1 1a TRAC GPWRCalculation and aCCTF Test withCombined Injectionand EM BoundaryConditions for theReflood Phase of aGerman PWR-LOCA
GPWR GPWR-1 982 TRAC- LANL U-747 PF1, PF1/MOD1PF1 Base CaseResults
GPWR A TRAC-PF1 LANL U-744 PF1Calculation of aReference GermanPWR at the Initiationof ECC Injection
GPWR GPWR-1 982 TRAC- LANL U-746 PF1PF1 Input DeckDescription
GPWR TRAC-PD2 LANL U-743 PD2Calculation of aDouble-Ended Cold-Leg Break in aReference GermanPWR
B.2-4.
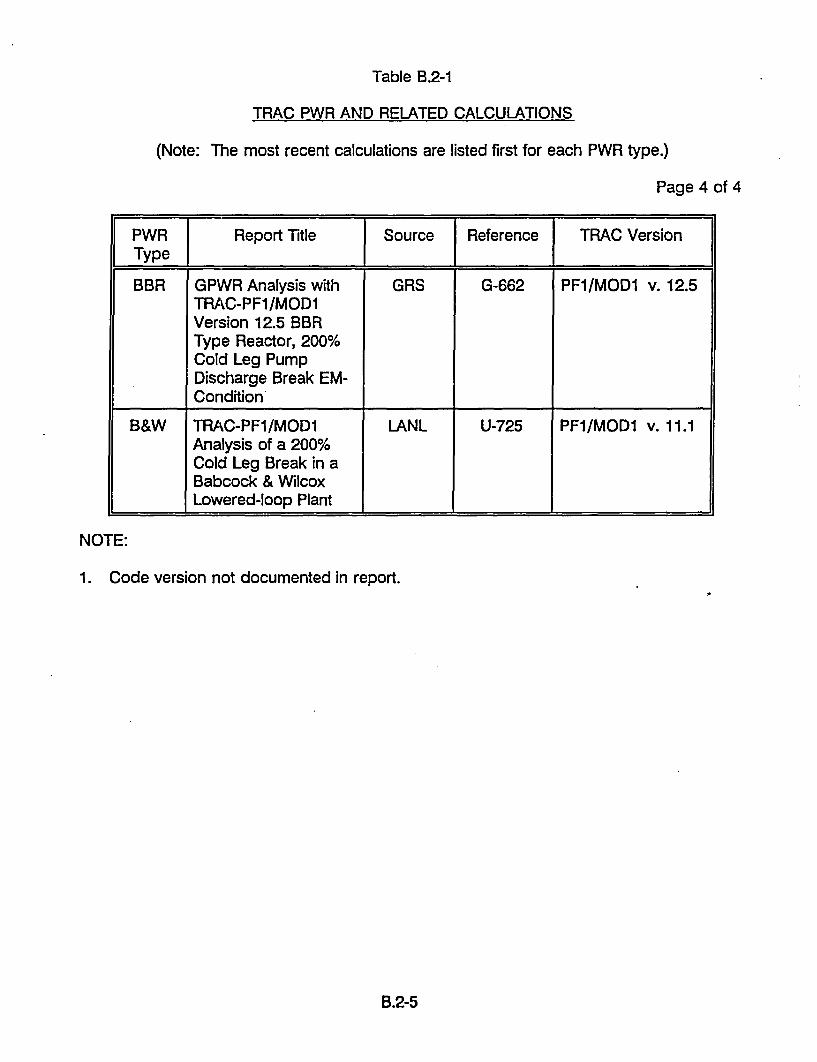
Table B.2-1
TRAC PWR AND RELATED CALCULATIONS
(Note: The most recent calculations are listed first for each PWR type.)
Page 4 of 4
PWR Report Title Source Reference TRAC VersionType I I I I
BBR GPWR Analysis with GRS G-662 PF1/MOD1 v. 12.5TRAC-PF1/MOD1Version 12.5 BBRType Reactor, 200%Cold Leg PumpDischarge Break EM-Condition'
B&W TRAC-PF1/MOD1 LANL U-725 PF1/MOD1 v. 11.1Analysis of a 200%Cold Leg Break in aBabcock & WilcoxLowered-loop Plant
NOTE:
1. Code version not documented in report.
B.2-5

Table B.2-2
TRAC ANALYSES OF CCTF CORE-I TESTS
Test/Run Description Reference TRAC
Number I Version
Cl-01/10 Loop K-factor U-603 PD2
C1-05/14 Base case U-602 PD2U-604U-605U-606U-617
C1-05/14 Base case J-985 PF1/MOD1v. 8.2
C1 -06/15 ECC flow U-602 PD2U-607U-617
C1-10/19 System pressure U-602 PD2U-609U-617
C1-11/20 Reproducibility U-610 PD2U-611
C1-12/21 System effect U-602 PD2U-612U-617
CI -16/25 FLECHT coupling U-613 PD2
C1l-16/25 FLECHT coupling J-601 PD2
C1-19/38 EM U-614 PD2U-615U-618
C-1 -19/38 EM J-603 PD2J-604
Cl -20/39 Multidimensional effect U-616. PD2
Summary U-601
B.2-6
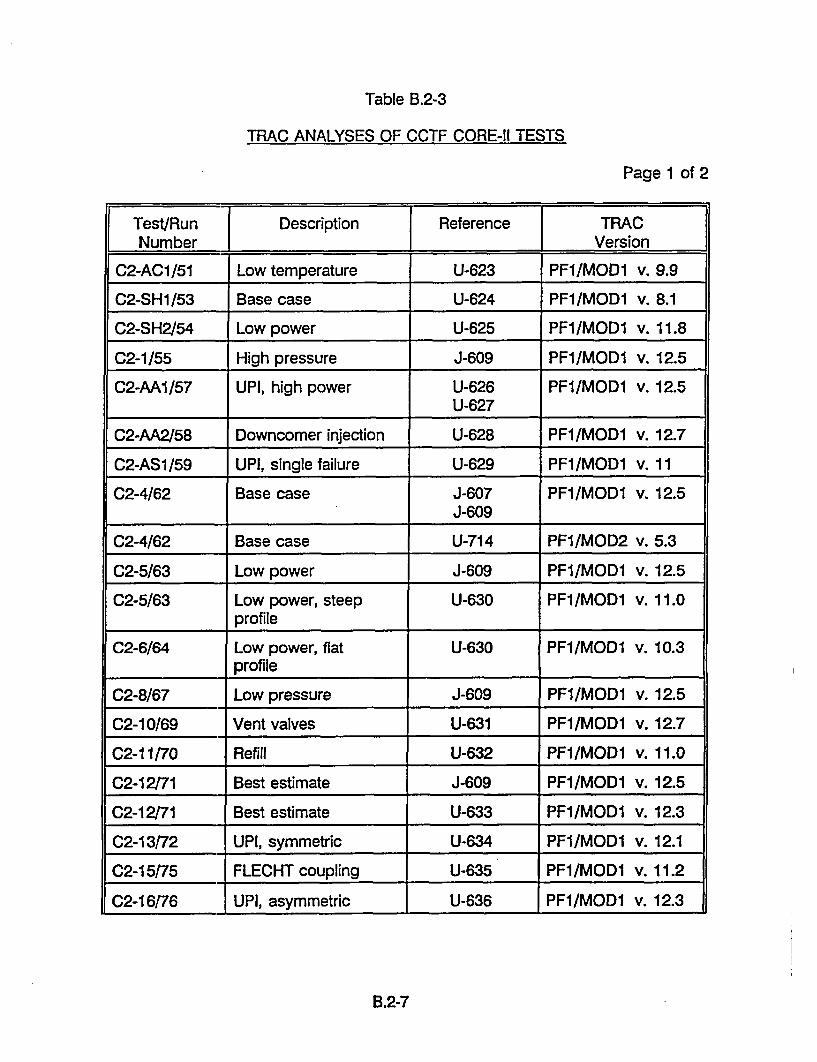
Table B.2-3
TRAC ANALYSES OF CCTF CORE-I1 TESTS
Page 1 of 2
Test/Run Description Reference TRAC
Number I I Version
C2-ACl/51 Low temperature U-623 PF1/MOD1 v. 9.9
C2-SH1/53 Base case U-624 PF1/MOD1 v. 8.1
C2-SH2/54 Low power U-625 PF1/MOD1 v. 11.8
C2-1/55 High pressure J-609 PF1/MOD1 v. 12.5
C2-AA1/57 UPI, high power U-626 PF1/MOD1 v. 12.5U-627
C2-AA2/58 Downcomer injection U-628 PF1/MOD1 v. 12.7
C2-AS1/59 UPI, single failure U-629 PF1/MOD1 v. 11
C2-4/62 Base case J-607 PF1/MOD1 v. 12.5J-609
C2-4/62 Base case U-714 PF1/MOD2 v. 5.3
C2-5/63 Low power J-609 PF1/MOD1 v. 12.5
C2-5/63 Low power, steep U-630 PF1/MOD1 v. 11.0profile
C2-6/64 Low power, flat U-630 PF1/MOD1 v. 10.3profile
C2-8/67 Low pressure J-609 PF1/MOD1 v. 12.5
C2-10/69 Vent valves U-631 PF1/MOD1 v. 12.7
C2-11/70 Refill U-632 PF1/MOD1 v. 11.0
C2-12/71 Best estimate J-609 PF1/MOD1 v. 12.5
C2-12/71 Best estimate U-633 PF1/MOD1 v. 12.3
C2-13/72 UPI, symmetric U-634 PF1/MOD1 v. 12.1
02-15/75 FLECHT coupling U-635 PF1/MOD1 v. 11.2
C2-16176 UPI, asymmetric U-636 PF1/MOD1 v. 12.3
B.2-7
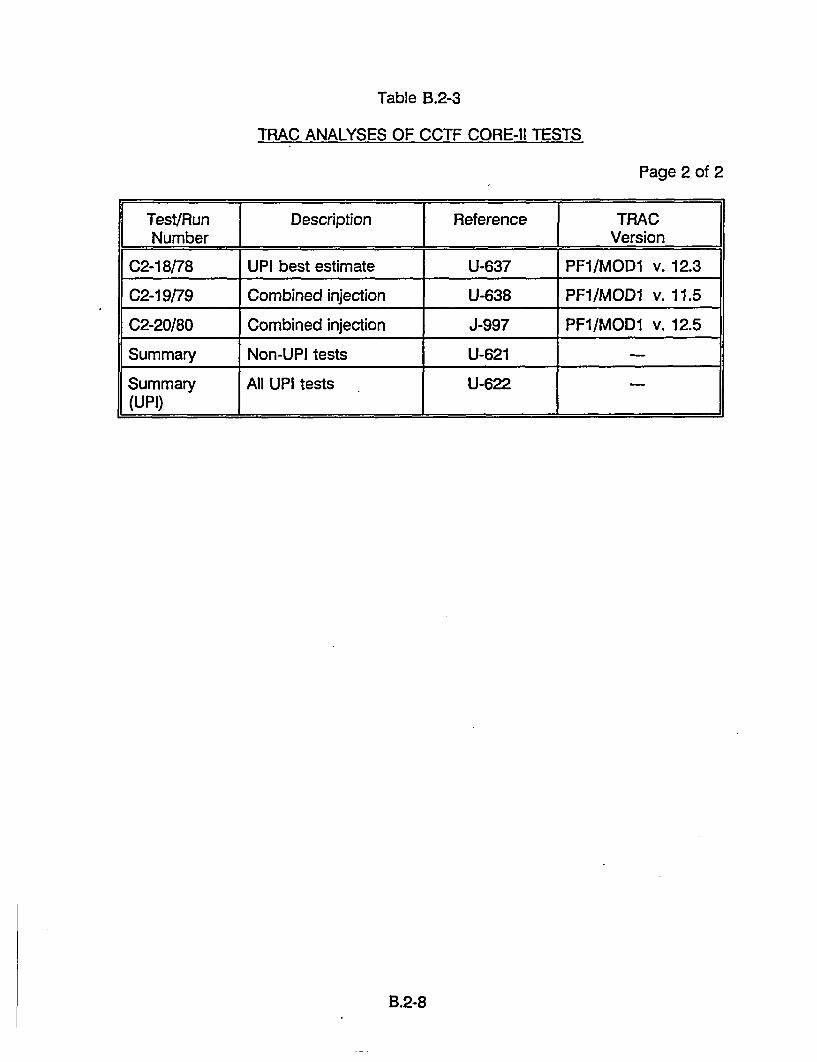
Table B.2-3
TRAC ANALYSES OF CCTF CORE-Il TESTS
Page 2 of 2
Test/Run Description Reference TRACNumber I I I Version
C2-18/78 UPI best estimate U-637 PF1/MOD1 v. 12.3
C2-19/79 Combined injection U-638 PF1/MOD1 v. 11.5
C2-20/80 Combined injection J-997 PF1I/MOD1 v. 12.5
Summary Non-UPI tests U-621
Summary All UPI tests U-622(UPI) I I
B.2-8

Table B.2-4
TRAC ANALYSES OF SCTF CORE-I TESTS
Test/Run Description Reference TRACNumber Version
$1-SH2/506 High pressure U-645 PD2U-651J-612
S1-01/507 Base-case U-646 PD2U-651U-649U-652J-612
Si-02/508 Low pressure U-647 PD2U-651J-612
SI-04/510 High subcooling U-648 PD2J-612
Sl-05/511 Low LPCI U-652 PD2
S1-06/512 High power PD2
S1-07/513 Flat power U-649 PD2
S1-08/514 Steep power U-649 PD2U-655
S1-09/515 High ECC U-652 PD2
Si-10/516 Base case U-648 PD2
Sl-11/517 Flat power PD2
S1-13/519 SCTF/CCTF/FLECHT- U-653 PD2, PFISEASET coupling
S1 -SH4/529 Combined injection U-656 PF1
Summary U-641
B.2-9
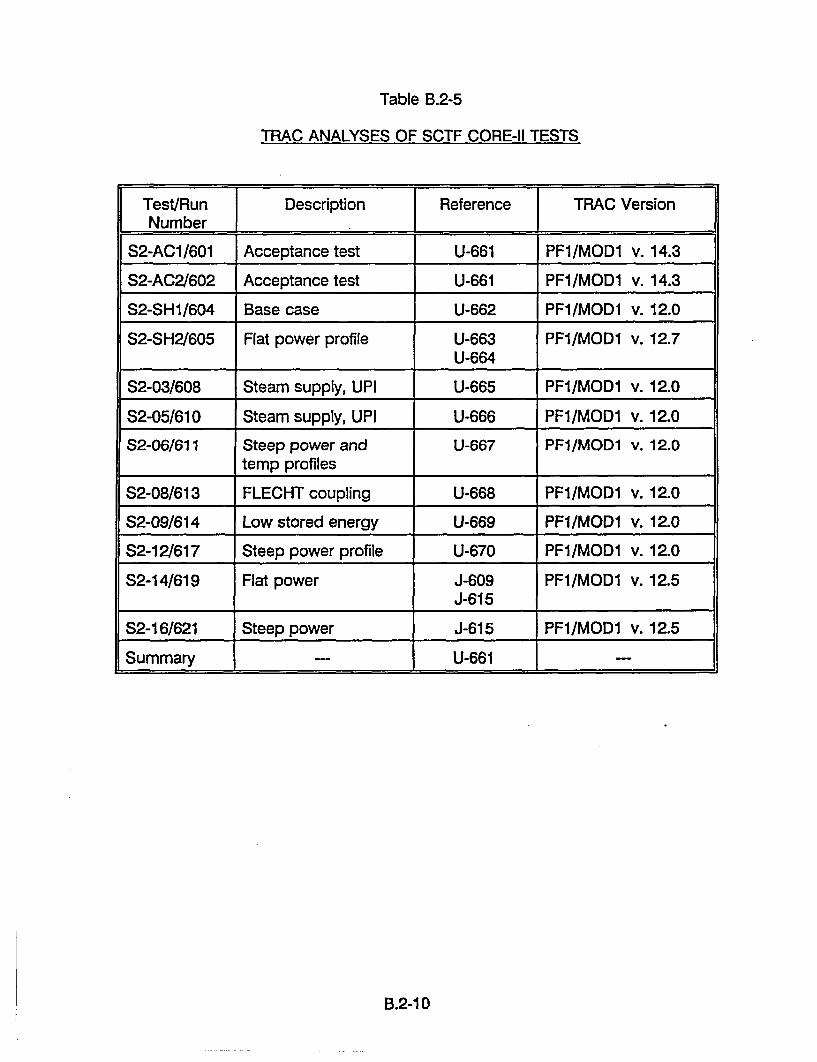
Table B.2-5
TRAC ANALYSES OF SCTF CORE-Il TESTS
Test/Run Description Reference TRAC VersionNumber I - I I
$2-AC1/601 Acceptance test U-661 PF1/MOD1 v. 14.3
S2-AC2/602 Acceptance test U-661 PFI/MOD1 v. 14.3
S2-SH1/604 Base case U-662 PFI/MOD1 v. 12.0
$2-SH2/605 Flat power profile U-663 PF1I/MOD1 v. 12.7U-664
S2-03/608 Steam supply, UPI U-665 PFI/MOD1 v. 12.0
S2-05/610 Steam supply, UPI U-666 PF1/MOD1 v. 12.0
S2-06/611 Steep power and U-667 PFI/MOD1 v. 12.0temp profiles
S2-08/613 FLECHT coupling U-668 PFI/MOD1 v. 12.0
S2-09/614 Low stored energy U-669 PF1/MOD1 v. 12.0
S2-12/617 Steep power profile U-670 PF1/MOD1 v. 12.0
S2-14/619 Flat power J-609 PF1/MOD1 v. 12.5J-615
S2-16/621 Steep power J-615 PF1/MOD1 v. 12.5
Summary _f U-661 _
B.2-10
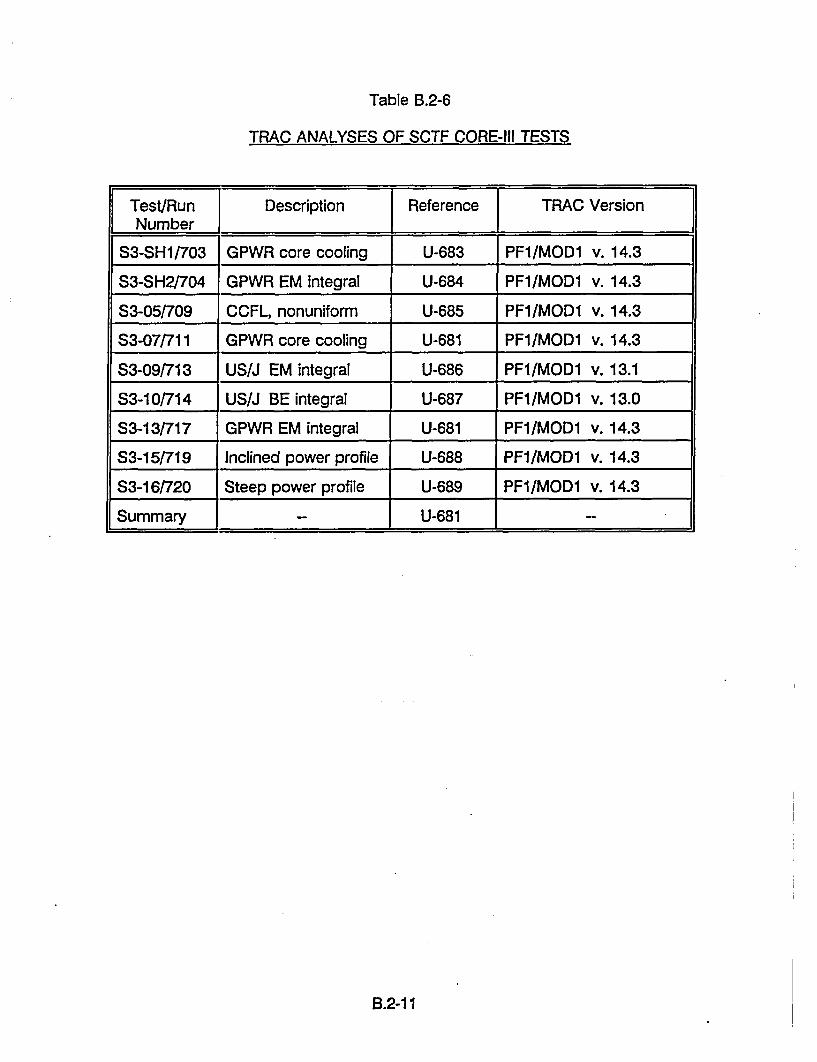
Table B.2-6
TRAC ANALYSES OF SCTF CORE-Ill TESTS
Test/Run Description Reference TRAC VersionNumberI
S3-SH1/703 GPWR core cooling U-683 PF1/MOD1 v. 14.3
$3-SH2/704 GPWR EM integral U-684 PF1/MOD1 v. 14.3
S3-05/709 CCFL, nonuniform U-685 PF1/MOD1 v. 14.3
S3-07/711 GPWR core cooling U-681 PFI/MOD1 v. 14.3
S3-09/713 USIJ EM integral U-686 PFI/MOD1 v. 13.1
S3-10/714 US/J BE integral U-687 PF1/MOD1 v. 13.0
S3-13/717 GPWR EM integral U-681 PF1/MOD1 v. 14.3
S3-15[719 Inclined power profile U-688 PF1/MOD1 v. 14.3
S3-16/720 Steep power profile U-689 PF1/MODI v. 14.3
Summary -- U-681 --
B.2-11

Table B.2-7
TRAC ANALYSES OF UPTF TESTS
Page 1 of 2
Test Number Description Reference TRAC Version(Run No. or Phase) I 1 _
2 US/J PWR integral U-713 PF1/MOD1 v. 5.3reflood U-714
4 (Phase A) US/J PWR integral U-711 PF1/MOD1 v. 5.3refill
5 (Phase A) Downcomer transient U-711 PFI/MOD1 v. 5.3refill
6 (Run 133) Downcomer E-611 PF1/MOD1 v. 12.5countercurrent flow U-711 PF1/MOD2 v. 5.3
7 (Runs 200 & 201) Downcomer U-711 PF1/MOD2 v. 5.3countercurrent flow
8 (Phases A & B) Cold/Hot leg flow G-641 PFI/MOD1pattern U-712 v. 13.0, 14.3
U-714 PF1/MOD2 v. 5.3
9 (Phase A) Cold/Hot leg flow G-642 PF1/MOD1 v. 13.0pattern
10 (Phase B) Entrainment/De- U-709 PF1/MOD1 v. 14.3entrainment
11 Hot leg countercurrent U-708 PF1/MODI v. 14.3flow PF1/MOD2 prelim.
12 (Run 014) Tie plate G-644 PF1/MOD1countercurrent flow v. 12.5, 12.8, 14.4
13 (Run 071) Tie plate G-645 PF1/MOD1countercurrent flow v. 12.5, 12.8, 14.3
17 (Phase B) US/J PWR integral U-713 PFI/MOD2 v. 5.3reflood U-714
20 Upper Plenum U-710 PF1/MOD2 prelim.Injection
21 (Phases A &B) Downcomer injection U-715 PF1/MOD2 v. 5.3
B.2-12
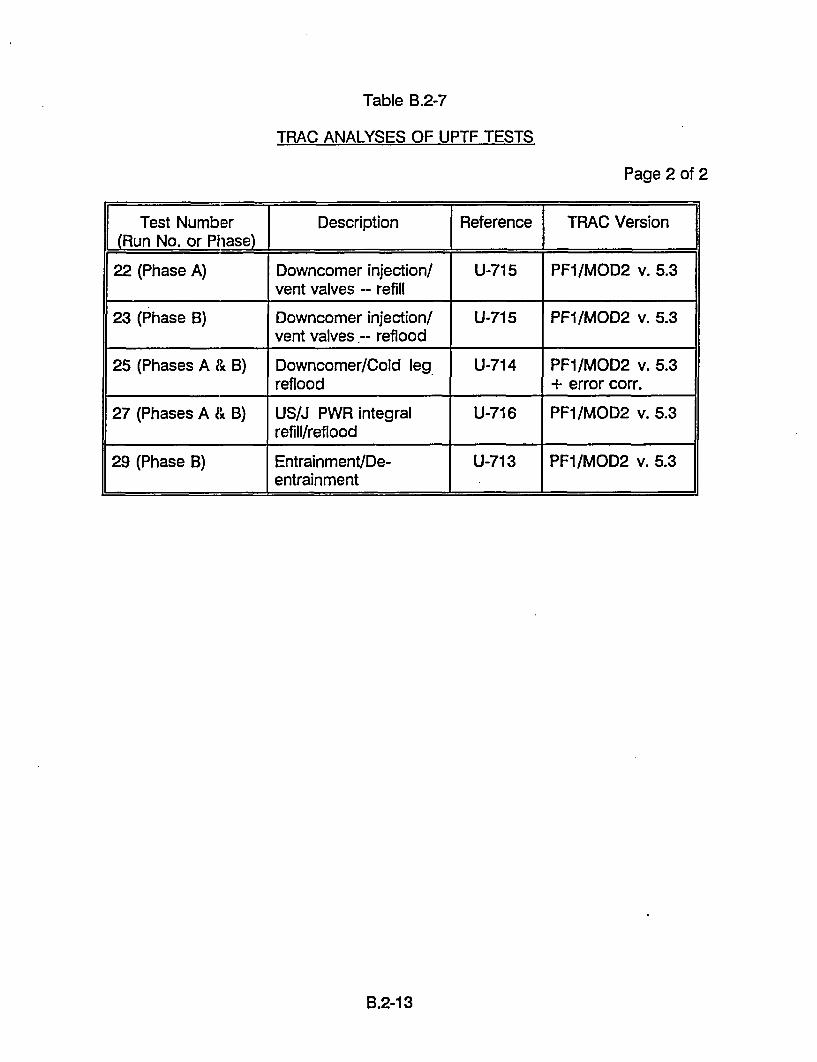
Table B.2-7
TRAC ANALYSES OF UPTF TESTS
Page 2 of 2
Test Number Description Reference TRAC Version(Run No. or Phase) I I 1 _1
22 (Phase A) Downcomer injection/ U-715 PF1/MOD2 v. 5.3vent valves -- refill
23 (Phase B) Downcomer injection/ U-715 PF1/MOD2 v. 5.3vent valves-- reflood
25 (Phases A & B) Downcomer/Cold leg U-714 PF1/MOD2 v. 5.3reflood + error corr.
27 (Phases A & B) US/J PWR integral U-716 PF1/MOD2 v. 5.3refill/reflood _
29 (Phase B) Entrainment/De- U-713 PF1/MOD2 v. 5.3entrainment
B.2-13

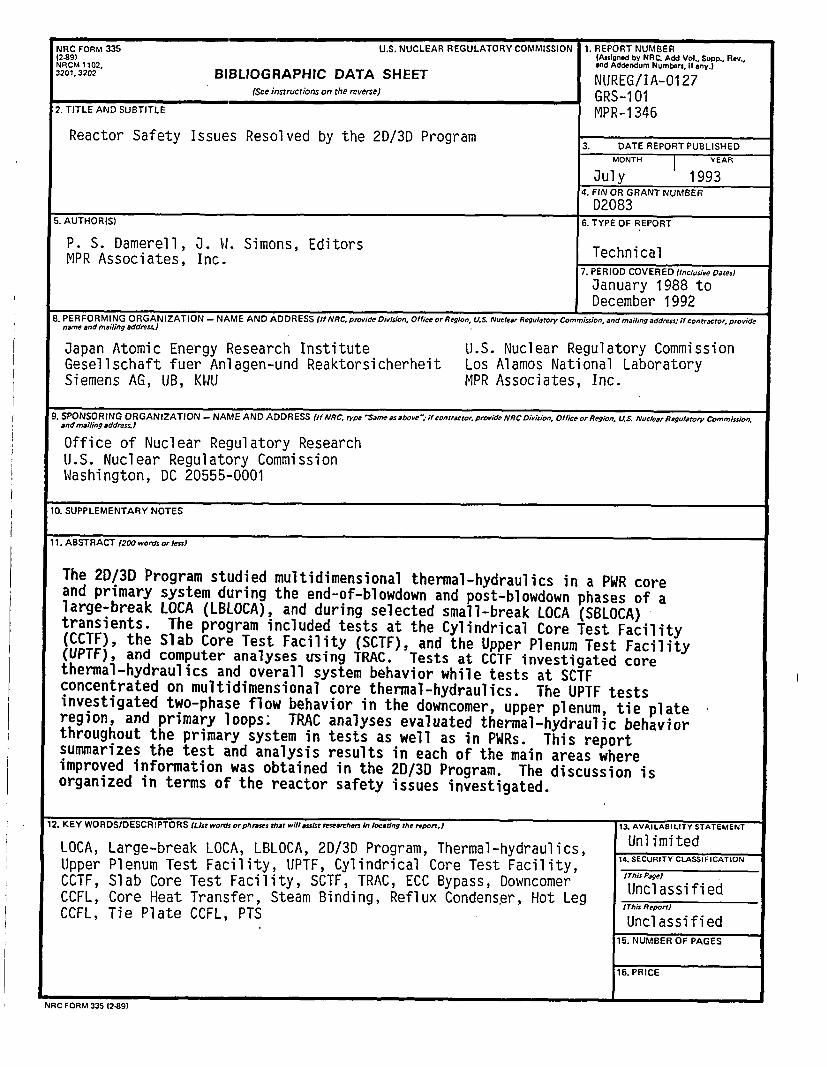
NRC FORM 335 U.S. NUCLEAR REGULATORY COMMISSION 1. REPORT NUMBER(2-89) (Assigned by NRC. Add Vol., Supp., Rev.,NRCM 1102, and Addendum Numbers, If any.)3201 ,202 BIBLIOGRAPHIC DATA SHEET NUREG/IA-0127
(See instructions on the reverse) GRS-1012. TITLE AND SUBTITLE MPR-1346
Reactor Safety Issues Resolved by the 2D/3D Program 3. DATEREPORTPUBLISHED
MONTH j YEAR
Jul y 19934. FIN OR GRANT NUMBER
D20835. AUTHOR(S) 6. TYPE OF REPORT
P. S. Damerell, J. W.. Simons, Editors TechnicalMPR Associates, Inc.
7. PERIOD COVERED (Inclusive Dates)
January 1988 toDecember 1992
B. PEIi- UFOMI NG UORLANIZAT ION - NAME AND ADDRESS (If NRC. provide Division, Office or Region, U.S. Nuclear Regulatory Commission, and mailing address: if contractor, providename and mailing addres&)
Japan Atomic Energy Research InstituteGesellschaft fuer Anlagen-und ReaktorsicherheitSiemens AG, UB, KilU
U.S. Nuclear Regulatory CommissionLos Alamos National LaboratoryMPR Associates, Inc.
9. SPONSORING ORGANIZATION - NAME AND ADDRESS (if AIRC. type 'Same as above'~if contractor. provide NRCDivision, Office or Region. 1)5. AluclearRegolarory Commission.
9. SPONSORING ORGANIZATION - NAME AND ADDRESS Hf NR, typ "San os above".-if contractor provide NRC Diviol Office or Reqn US Nuclear Reulaor Commisson.
and mailing addres)
Office of Nuclear Regulatory ResearchU.S. Nuclear Regulatory CommissionWashington, DC 20555-0001
=10. SUPPLEMENTARY NOTES
11. ABSTRACT 1200 words or la)
The 2D/3D Program studied multidimensional thermal-hydraulics in a PWR coreand primary system during the end-of-blowdown and post-blowdown phases of alarge-break LOCA (LBLOCA), and during selected small-break LOCA (SBLOCA)transients. The program included tests at the Cylindrical Core Test Facility(CCTF), the Slab Core Test Facility (SCTF), and the Upper Plenum Test Facility(UPTF), and computer analyses using TRAC. Tests at CCTF investigated corethermal-hydraulics and overall system behavior while tests at SCTFconcentrated on multidimensional core thermal-hydraulics. The UPTF testsinvestigated two-phase flow behavior in the downcomer, upper plenum, tie plateregion, and primary loops: TRAC analyses evaluated thermal-hydraulic behaviorthroughout the primary system in tests as well as in PWRs. This reportsummarizes the test and analysis results in each of the main areas whereimproved information was obtained in the 2D/3D Program. The discussion isorganized in terms of the reactor safety issues investigated.
12. KEY WORDS/DESCRIPTORS [List words or phrases that will assisr researchers In locating the report.) 13. AVAILABILITY STATEMENT
LOCA, Large-break LOCA, LBLOCA, 2D/3D Program, Thermal-hydraulics, Unlimited
Upper Plenum Test Facility, UPTF, Cylindrical Core Test Facility, IT.SECUR)TYCLAICATONCCTF, Slab Core Test Facility, SCTF, TRAC, ECC Bypass, Downcomer UniclssPifieCCFL, Core Heat Transfer, Steam Binding, Reflux Condenser, Hot Leg UnclssifiedCCFL, Tie Plate CCFL, PTS UThis RepifiUncl assi fi ed
15. NUMBER OF PAGES
16. PRICE
NRC FORM 335 (2-89)


Federal Recycling Program

UNITED STATESNUCLEAR REGULATORY COMMISSION
WASHINGTON, D.C. 20555-0001
SPECIAL FOURTH-CLASS RATEPOSTAGE AND FEES PAID
USNRCPERMIT NO. G-67
OFFICIAL BUSINESSPENALTY FOR PRIVATE USE, $300
Copyright © 2022 FDOKUMEN