NUREG-1189, Vol. 2, "Assessment of the Public Health Impact ...
460
NUREG-1 189 Vol. 2 Assessment of the Public Health Impact From the Accidental Release of U1F 6 at the Sequoyah Fuels Corporation Facility at Gore, Oklahoma Docket No. 40-8027 License No. SUB-1010 Appendices Manuscript Completed: March 1986 Manuscript Completed: March 1986 Date Published: March 1986 Ad Hoc Interagency Public Health Assessment Task Force U.S. Nuclear Regulatory Commission Washington, D.C. 20555
-
Upload
khangminh22 -
Category
Documents
-
view
4 -
download
0
Transcript of NUREG-1189, Vol. 2, "Assessment of the Public Health Impact ...
NUREG-1 189Vol. 2
Assessment of the Public HealthImpact From the AccidentalRelease of U1F6 at the SequoyahFuels Corporation Facility atGore, OklahomaDocket No. 40-8027License No. SUB-1010
Appendices
Manuscript Completed: March 1986
Manuscript Completed: March 1986Date Published: March 1986
Ad Hoc Interagency Public Health Assessment Task Force
U.S. Nuclear Regulatory CommissionWashington, D.C. 20555

ABSTRACT
Following the accidental release of UF6 from the Sequoyah Fuels Facility onJanuary 4, 1986, an Ad Hoc Interagency Public Health Assessment Task Force wasestablished. The Task Force consists of technical staff members from variousagencies who have prepared this assessment of the public health impactassociated with the accidental release.
The assessment consists of two volumes and is based on data from the accidentavailable as of February 14, 1986.
Volume 1 of the report describes the effects from the intake of uranium andfluoride and summarizes the findings and recommendations of the Task Force.
Volume 2 of the report contains Appendices which provide more detailedinformation used in the assessment and support the discussion in Volume 1.
iii

TABLE OF CONTENTS
Appendix Page
2.2 Description of SFC's Facility Operation ...................... 1
3.1.1 Photos Showing the Location of the 14-Ton Cyclinderand the Rupture ............................................ 11
3.3.1 NRC's Preliminary Notifications of Event or UnusualOccurrence Following the Accident Occurring onJanuary 4, 1986 ............................................. 19
4.1.2 Meteorology and Atmospheric Dispersion ..................... 37
4.1.4.2 SFC's Investigation Report of the Effects on Cattle andAnimals in the Potentially Affected Areas After theAccident ................................................... 77
5.1.1 Air Sample Analysis by SFC and ORNL ........................ 131
5.2.1 Interorganizational Comparison Results ..................... 143
5.2.2 K-M Technical Center Laboratory Analysis Procedures ........ 147
5.2.3 ORNL's Analytical Procedure ................................ 221
5.2.4 OSDH Sampling Procedure .................................... 247
5.2.5 SFC Sampling Procedure (2 Documents) ....................... 251
5.2.6 OSDH Laboratory Analysis Procedures ........................ 259
5.2.7 Environmental Sampling: Vegetation and Soil ............... 265
5.3.1 Raw Surface Water Data ..................................... 373
5.4.1 An-Aerial Radiological Survey of the Kerr-McGee Facilityand Surrounding Area ....................................... 383
5.5.1 Results of HPGE In Situ Measurements ....................... 397
5.6.1 Medical Examination and Diagnosis for Onsite Workers ........ 403
5.6.2 Uranium Bioassay Results for SFC Workers and OffsiteIndividuals ................................................. 407
5.6.3 Intake Calculation Models and Assumptions ................... 423
5.6.4 Chemical Bioassay Results for SFC Workers ................... 431
5.6.5 Creatinine Correction Methodology and Factors ............... 435
6.1.2.1 Summary of Dose Conversion Factors and Intake ParametersUsed for Radiological Dose Calculation ..................... 443
v

ACKNOWLEDGEMENTS
The Ad Hoc Task*Force acknowledges the assistance of the following individualsin providing data and analysis used in this assessment:
U. S. Nuclear Regulatory Commission - J. Everett•C. JierreeB. Spitzberg
Department of Energy & EG&G - R. BlauensteinZ. Burson
Oak Ridge National Laboratory - K. EckermanR. LeggettJ. Stewart
State of Oklahoma Department of Health - R. CraigD. MorrisF. Walker
Battelle Pacific Northwest Laboratory - D. Fisher
Brookhaven National Laboratory - E. Lessard
We also acknowledge the contributions of the following individuals:
U. S. Nuclear Regulatory Commission - F. CongelF. Sturz
U. S. Environmental Protection Agency - W. FarlandC. GazdaJ. Makris
vii

APPENDIX 2.2
DESCRIPTION OF SFC'S FACILITY OPERATION
1

APPENDIX 2.2 Description of SFC's Facility Operation
2.2.1 Receiving and sampling
Uranium feed material is delivered to the SFC facility in three forms: dryyellowcake (ore concentrate), wet yellowcake slurry, and wet UF4 slurry.Processing of wet yellowcake slurry and UF4 slurry will be discussed in Sec-tion 2.2.2.
The dry concentrate (yellowcake) is received from uranium mills in 55-gal steeldrums. Each drum has an identifying number so that an accurate record may bemaintained of the contents and analysis for purposes of uranium accountabilityand for billing or payment to customers. The drums are stored four to a palletand up to three pallets high on an outside storage pad. The drums and palletsare strapped down for storm protection.
After weighing, each drum is emptied through a falling stream sampling unit.This unit consists of two samplers in series, each taking a small cut. Thefirst cut provides an initial sample weight of about 1 percent or less of thecontents of a drum. The sample is split down again by a factor of about 50 andis collected in trays. The material collected in the trays is processed to afinal sample pulp by the operations of drying, pulverizing, riffling, sieving,and blending as needed.
The remaining ore concentrate from each drum can be fed directly into the twodigester feed hoppers or can be redrummed for later use. The hoppers have acombined capacity of about 50 tons, which is one day's output of the samplingsystem.
All operations in the dry yellowcake sampling area of the main building involvingopen drums or uncontained yellowcake powders are performed under dust collectionhoods.
2.2.2 Dry Yellowcake Digestion
Dry yellowcake digestion is the primary digestion process in the SFC facility.This is a batch process where the concentrate is reacted with preheated nitricacid in one of three 4000-gal digestion tanks to convert the uranium, presentin the form of oxides or diuranates, to uranyl nitrate solution.
Initially, about 1400 gal of nitric acid of up to 60 percent concentration ispumped from the tank farm to a digester tank. Steam coils in the digester tankare used to raise the acid temperature to between 190 and 2200 F. When theproper temperature is attained, dry concentrate is fed from the digester feedhoppers into the digester tank using screw-type feeders. About 12,000 lb ofconcentrate is added to the nitric acid. The normal batch volume is about 3100gal. An agitator is operated continuously to promote both thorough mixing ofthe concentrate in the acid and thermal equilibrium. The reaction of theconcentrate with nitric acid is exothermic, and water-cooled coils are used toremove excess heat to control the solution temperature. The reaction is alsoaccompanied by evolution of nitrogen oxides.
3
When digestion is complete, the slurry is transferred to an adjustment tank andthe digester tank and transfer lines are flushed with water. The adjustmenttank provides a holdup period for cooling of the slurry, for adjustment of thechemistry of the slurry to prevent uranium loss as precipitates, and to improveuranium recovery in the subsequent solvent extraction process. Compositionadjustment may involve modifying the acidity of the uranyl nitrate slurry orthe addition of special feed solutions from other digestion processes discussedbelow.
Wet yellowcake slurry containing approximately 38 wt percent of water isdelivered from some uranium mills in stainless steel cargo tanks. The cargotank arrives at the plant about 60 percent full. Pumps and piping enabletransfer of the slurry to plant receiving tanks and recycle to the cargo tank.
In batch quantities, 60 percent HNO 3 is fed into the cargo tank until the solidsin the yellowcake slurry are completely dissolved. This uranyl nitrate solu-tion is then pumped to a receiving tank where the contents are weighed, sampled,and transferred to a 10,000-gal storage tank. Subsequently, this solution ispumped to the uranyl nitrate feed preparation tanks for final adjustment ofsolution chemistry before entering the solvent extraction operation (Fig. 2.2.1).
Tanks, pumps, and piping for processing the wet yellowcake slurry and the uranylnitrate solutions are mostly enclosed in a separate building surrounded by curbsthat can contain the total volume of the tanks in case of tank rupture. Theparking area for the cargo tank is also curbed to contain the entire tank volume.
The UF4 slurry with about 50 percent water is received in 55-gal drums withpolyethylene liners. These drums are stored in a building with a curbedfoundation that is adjacent to the west wall of the yellowcake slurry receivingbuilding. The drums are emptied into a 4500-gal digester tank containing anHN03-Al(N03 )3 solution. The resulting uranyl nitrate solution can be stored orpumped to the feed preparation tanks for final adjustment before entering thesolvent extraction operation (Fig. 2.2.1). Nitrogen oxide and hydrogen fluoridegases evolve during this digestion process.
A miscellaneous batch digester 1500 gal is used to recover uranium fromfluorination ash and dusts collected in dust control systems by dissolution ina HNO 3 -AI(N0 3 ) 3 solution. Fluorination ash is derived from the exit filters ofthe fluorination reactors which are blown down periodically into ash receiversbelow the filters. Batch weight in the miscellaneous digester is approximately2000 lb of ash [approximately 750 lb of uranium], and the resulting solution isblended with the primary digestion product from yellowcake digestion and fed tothe solvent extraction system. Again, nitrogen oxides and hydrogen fluorideare produced.
The liquids of all digester tanks discussed above are eventually pumped intothe solvent extraction system for purification of the uranium. There are nosolid wastes from the digestion operations. Off-gases from the digester tanksare cooled with dilute HNO 3 and treated to remove most of the acid fumes, watervapor, and noxious nitrogen oxides. Condensed vapors are returned to the
4

ES 6077
(n'
iHNU RECCLE)WATER
DGSIN SOJLVENT E.XTRACTION-" RE EXTRACT'ION
,HNU3 E YCH E
-,FIAT
TOAPRTI
LATERID U71 SNIPIN
CYL INER
SQ DISOSS
ORAI SAUAE WITHR URN _fJ
IIIU r4LY~ I -1
frmy"ock U0) • inld g process•w inCputsR
and w e pUOdNuCtt ENTRATIONt
AMMONIUM[ N
-,- -URN~O - - -- EAPRTO
GASLEINDER N7 IRCK
P r o c e s s d i g a f o Crn u e a l O Li e O ~ s r d u t ofrom ~ ~ T PSlwc k (UU) in l d n TRPr c Ss i p t
and Fat rd c ram n
Figure 2.2.1
digestion tanks, caustic chemical-waste-containing fluoride is collected fordisposal, and the remaining off-gases are piped to the HNQ 3 recovery plant forrecycle of remaining HN03 vapors.
The primary and miscellaneous digester tanks have spill curbs to contain anyaccidental leakage. Drainage from these curbed areas can be pumped into otherdigester tanks for processing.
2.2.3 Solvent Extraction
The uranyl nitrate slurry is fed from the adjustment tanks to the solventextraction system. The uranyl nitrate is processed by countercurrent extrac-tion in a series of pumper-decanters using 30 percent vol tributyl phosphate(TBP) in hexane solvent. Two control criteria have been established for thesolvent extraction process. First, the digester slurry feed rate is adjustedat constant solvent flow to assure anlacceptably low uranium loss in theraffinate waste stream. Second, a high uranium saturation level is maintainedin the organic extraction product to obtain satisfactory separation of uraniumfrom the impurities.
There are two liquid streams flowing from the series of pumper-decanters: theraffinate waste stream with very low uranium content and the organic extractionproduct that includes most of the uranium. The raffinate stream passes fromthe solvent extraction system to a raffinate decanter vessel where it is washedwith hexane. The raffinate is then discharged to one of the four settlingbasins of clarifier for treatment and disposal.
The organic extraction product containing the uranium is then washed in a two-stage mixer-settler scrub system using 0.01 M HNO3 . The aqueous phase withimpurities from the first-stage wash is recycled to the solvent extraction tanks,and the washed organic product is again contacted with 0.01 M HNO 3 in there-extraction column where the uranium is stripped from the organic phase andtransferred to an aqueous solution. The aqueous uranyl nitrate containing 80to 100 g of uranium per liter is washed. with hexane to remove TBP andtransferred to the evaporation system feed tank.
The hexane from the raffinate wash, re-extraction column, and the aqueousuranium product wash is processed in the solvent rework system for recycle tothe solvent extraction system.
2.2.4 Solvent Rework
The impure hexane solvent waste stream from the solvent extraction system isprocessed in the solvent rework (purification) system. Most of the residualuranium is recovered by washing the hexane with 25 percent ammonium sulfate.The TBP hydrolysis products, dibutyl phosphate and monobutyl phosphate, andremaining uranium are then removed as sodium salts by scrubbing the hexane with5 percent sodium hydroxide (NaOH). The purified hexane is then adjusted forrecycle to the solvent extraction system by addition of new hexane and/or TBP.
6
2.2.5 Evaporation and Boildown
From the evaporation-system feed tank, the aqueous uranyl nitrate liquor flowsthrough a feed condensate heat exchanger to a combination evaporator-condenser.In this equipment, the uranium concentration is increased to about 500 g/L aswater and HN0 3 are evaporated. These vapors are compressed, recycled throughthe evaporator condenser to assist in the evaporation of the liquor, andcondensed. The condensate collects in the recovered acidic condensate tank andis then pumped through the feed condensate heat exchanger to heat the incominguranyl nitrate liquor. The acidic condensate tank is vented tortmosphere todispose of small amounts of saturated steam, traces of hexane, and noncon-densable gases. The acidic condensate is then stored for reprocessing andrecovery of the HNO3 .
The concentrated uranyl nitrate liquor (-500 g/L) is collected in a 2000-galsurge tank and held at 200OF until transferred to the boildown system.
The boildown system consists of three tanks in which batches of product fromthe evaporation system are heated using steam coils to boil off additionalwater and nitric acid, which increases the uranium concentration in the aqueoussolution to about 1200 g/L. Vapor from the boildown tanks is condensed and theacidic condensate (0.1 M nitric acid) is transferred to a storage tank forsubsequent recovery and recycle of the acid. The concentrated uranium productis pumped from the bottom of the boildown tanks into a recirculation pipingsystem that permits feed to the denitration system.
2.2.6 Denitration
The concentrated product, uranyl nitrate hexahydrate (UNH), is bled from theboildown recirculation loop to the denitration system at the rate of 1.1 gpm.The UNH is heated in enclosed denitrator trays to a temperature of about 5500 Fwith a slight negative pressure. The UNH is decomposed according to thefollowing approximate reaction:
U02 (NO3) 2 (n H2 0) -) U03 + NO + NO2 + 02 + n H20.
The uranium trioxide (U03 ) produced in the denitrator trays consists of a freeflowing, minus 8 mesh material that is discharged over an internal well andthrough seal legs to an enclosed screw-type system conveyor. The granularmaterial is then ground in a pulverizer to a powder finer than 60 mesh (250 pm)and discharged into the U03 storage bin.
The off-gases from the denitrator trays are scrubbed with 40 percent HNO 3 forremoval of particulates and a portion of the nitrogen oxides and water vapor.The scrubbing fluid is cooled to 100°F and recirculated to the off-gas scrubbers.Excess nitric and scrubbing fluids are returned to the HNO 3 storage tank.
The conveyor system, pulverizer, and storage bins are vented through a bin ventbaghouse. Fine particulates of U03 trapped in the baghouse are periodicallyblown back into the storage bin by reverse air flow.
7
2.2.7 Reduction
The U03 is transferred by screw conveyor to the U03 feed bin which is slightlypressurized with nitrogen. The U03 is then moved by screw conveyor and chargedinto a two-stage fluid-bed reactor at about 2000 lb/h. Cracked ammonia (hydrogenand nitrogen) from an ammonia dissociator is introduced at the bottom of bothstages. The reduction of U03 with hydrogen proceeds according to the followingreaction:
U03 + H2 - U02 + H2 0 (vapor) + heat.
Sufficient cracked ammonia is introduced to assure complete reduction. Thethermal energy (heat) released in the reaction is used to help maintain thereaction temperature of 950-11000 F. Electrical furnaces are used to attaininitial operation of the reactors and air-cooled coils are used to maintaintemperature control.
Excess gas and U02 product from the reduction reactors are discharged to a U02filter bin where the U02 is filtered from the gas by porous stainless steelfilter elements that can remove 98 percent of all particles larger than 0.7 pm.The filters are periodically cleansed by a reverse flow of nitrogen.
Solids collected in the filter bin are discharged to a screw conveyor andsubsequently transported to the HF recovery reactor or directly to the U02 sealbin for storage.
Exit gases from the filter bin are discharged through another stainless steelfilter element to remove final traces of U02 product. The filtered off-gases,consisting of ammonia, nitrogen, water vapor, hydrogen, and hydrogen sulfide,are piped to a reduction hydrogen burner before disposal to the atmosphere.
The HF recovery reactor is a screw-type conveyor where contact between U02powder and unreacted HF from the filter bin of the subsequent hydrofluorinationstage can reduce loss of fluoride to the environment. The off-gas from the HFrecovery reactor is filtered to remove particulates and cooled to condense theHF. The HF condensate and noncondensable gases are routed to the HF scrubberin the gaseous waste disposal system. The U02 powder partially reacted withHF is discharged into the U02 seal bin'.
2.2.8 Hydrofluorination
Uranium dioxide is screw-fed from the U02 seal bin to the first stage of thehydrofluorination system where the powder is contacted with a countercurrentflow of HF in a stirred fluid-bed reactor. The reactor wall temperature ismaintained at about 400-650'F using electrical heaters and air blowers. Amixture of U02 , UF4 product, excess HF, and water vapor are discharged from thefirst-stage reactor at a temperature of about 600-700OF into the U02 -UF4 filterbin where the solids are separated from the gases using porous carbon filterelements. These filters remove 98 percent of all particles larger than 0.7 pmand are periodically cleaned by back-flushing with hot nitrogen gas. Gasesdischarged from the U02 -UF4 filter bin are routed to the HF recovery reactor
'discussed in the previous section. The solids in the U02-UF 4 filter bins aretransferred by screw conveyor to the second-stage hydrofluorinator for contactwith anhydrous HF vapor heated to about 10000 F. The second-stage reactor is
8
maintained at about 900'F with an electrical furnace and a cooling air blower.The UF4 product, excess HF vapor, water vapor, and other gases are dischargedfrom the second-stage reactor into the UF4 seal bin where most of the UF4 solidsare collected and most of the gases and entrained fine particles are piped tothe first-stage fluorinator.
The UF4 powder is transferred from the UF4 seal bin by screw conveyor to a UF4nitrogen lift chamber where gaseous nitrogen is used to purge entrained HF vaporfrom the UF4 powder. The UF4 and all the gases then enter the UF4 filter sealbin where the gases are separated and piped to the HF scrubber in the gaseouswaste disposal system. The UF4 powders are transferred by screw conveyor toUF4 storage bins.
2.2.9 Fluorination
The UF4 is transferred to a two-stage fluorination system by enclosed conveyors.The UF4 , charged into the first stage at a temperature of 100'F, is convertedto UF6 by reaction with elemental fluorine at a temperature of 850'F accordingto the following reaction:
UF4 + F2 ÷ UF6 + thermal energy.
Excess reaction heat is removed from the reaction vessels using steam-cooledcoils. About 15 percent excess fluorine over the stoichiometric conversionrequirement is introduced into the first-stage reactor to maximize conversionof UF4 to UF6 . Approximately 1 percent of the feed material is collected asunreacted UF4 or intermediate fluorides in ash containers at the bottom of thefirst-stage reactors. Each first-stage reactor is periodically shut down, andthe ash is ground and returned to the UF4 storage bin.
The outlet gases from the first-stage fluorination reactors are cooled to about3000 F, and entrained solids are removed in a cyclone separator and by porousMonel filter elements in the F2 reactor filters. The filters remove 98 percentof all particles greater than 0.7 pm and are periodically cleaned using a back-flow of air. The particulates are returned to the miscellaneous digester forreprocessing.
The filtered gas, containing UF6 , F2 , HF, 02, and N2 , is passed through theprimary cold traps at 30OF where approximately 90 percent of the UF6 is condensedas a solid. The noncondensed gases are heated to 800OF and forced into thesecond-stage fluorinators (cleanup reactors) for reaction with an excess of thestoichiometric requirement of UF4 at a temperature above 750'F. About 10 percentof the UF4 will be unreacted and is removed from the bottom of the cleanupreactor by screw conveyor where the product is cooled to 4000 F. The excessUF4 is subsequently returned to the UF4 storage bin for feed to the fluorinators.The system is designed, monitored, and controlled so that the excess F2 fromthe primary fluorinator will be completely consumed by the reactions with UF4and any U02 or U02 F2 in the feed material.
The gases and entrained solids from the cleanup reactor enter the cleanuF reactorfilter where 98 percent of the particles greater than 0.7 pm are removed byporous Monel filters (primary and backup). These filters are also periodicallycleaned using a backflow of air.
9
The filtered gas is passed through the secondary cold traps for condensation ofUF6 as a solid at -65 to -75 0 F. The noncondensable gases are pumped to the HFscrubber in the gaseous waste disposal system. Fluorine is monitored in thenoncondensable gas discharge as an element in the process control.
2.2.10 UFr handling and shipping
When any primary or secondary cold trap is full, the UF6 is melted and drainedby gravity through porous Monel filters into evacuated 10-ton or 14-ton shippingcylinders where it slowly solidifies at ambient temperature. The piping fromthe cold traps to the cylinders consists of a 2-in.-diam sloped, steam-tracedtransfer header. The transfer header and filter are connected to the cylindervalve through a 3/4-in.-diam copper tubing pigtail.
Two transfer headers and filling stations are in use. The headers are manifoldedso that each filling station can handle UF6 from either the primary or thesecondary cold traps. The primary cold traps have a nominal capacity of 10tons. After filling, the cylinders are weighed and transferred to the cylinderstorage area in the yard. The cylinders are cooled for a minimum of 5 daysbefore shipment.
10
APPENDIX 3.1.1
PHOTOS SHOWING THE LOCATION OF THE 14-TON CYLINDERAND THE RUPTURE
11

PHOTOS FOR APPENDIX 3.1.1
Figure 3.1.1.1A
Figure 3.1.1.2A
Figure 3.1.1.3A
The Sequoyah Facility's Process Buildings Viewed from theSouth. The sod has been stripped from the lawn in frontof the building. Route 10 is at the upper.right.
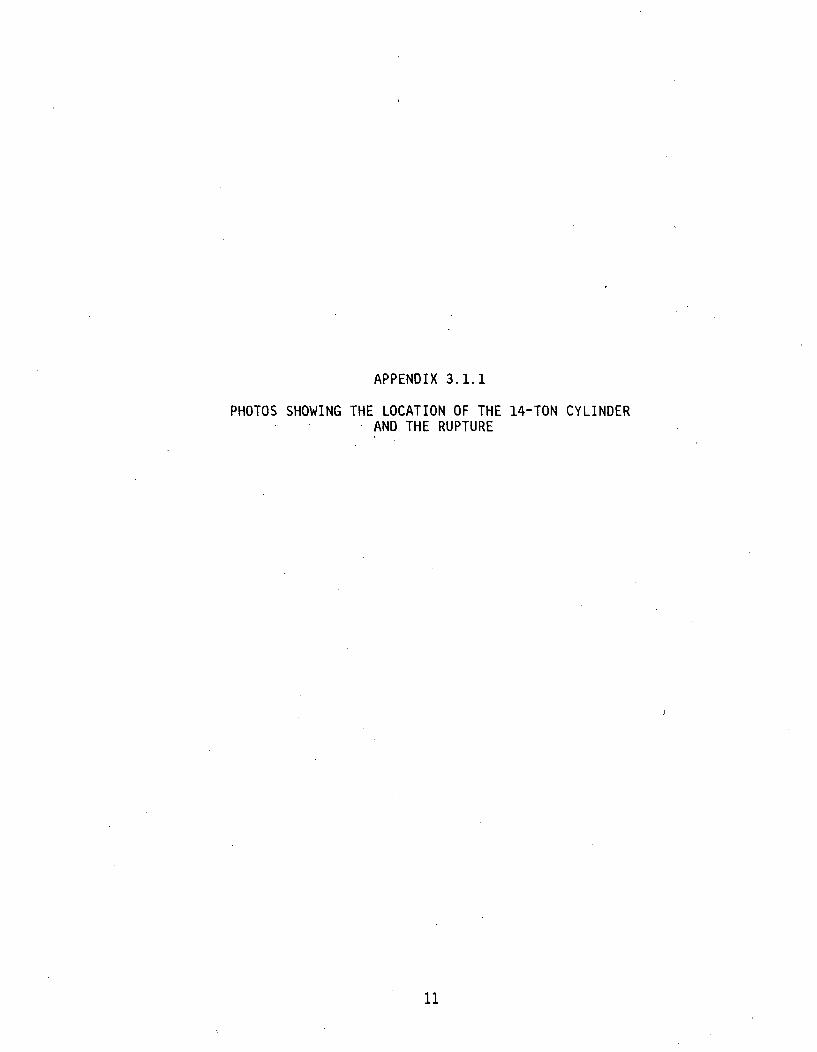
The Sequoyah Facility, Viewed from the North-Northwest.The self-propelled crane is preparing to lift away thedamaged steam chest from over the ruptured cylinder.
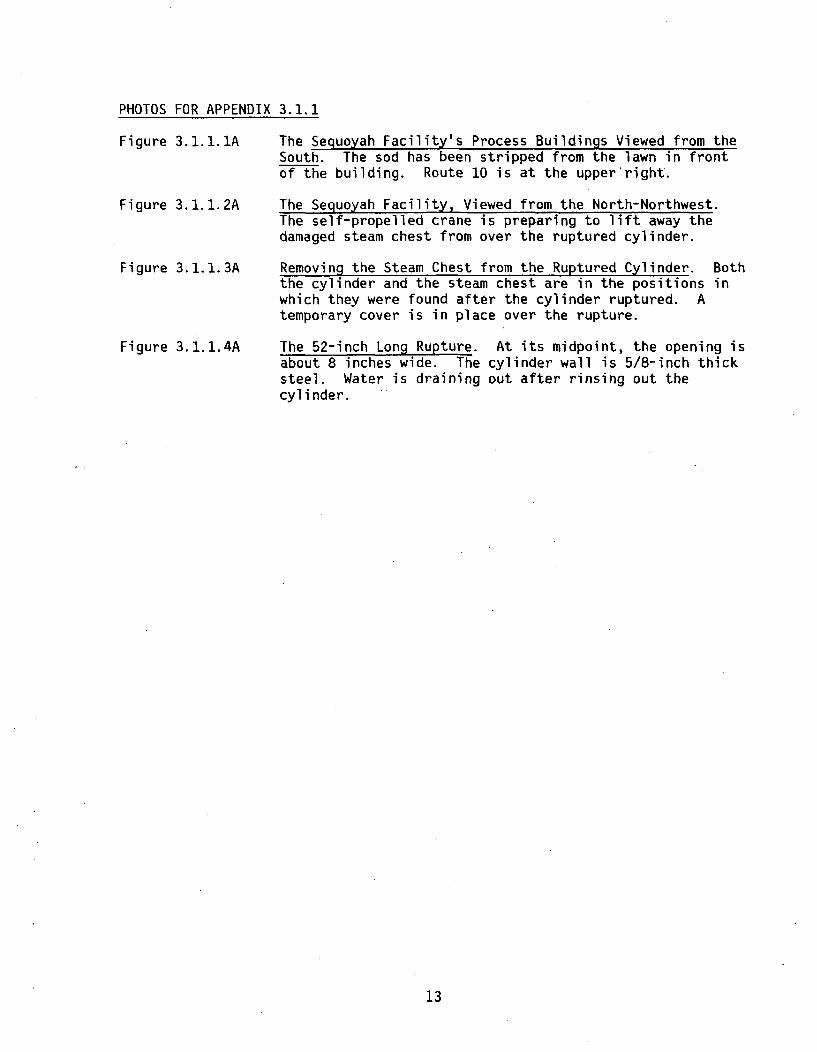
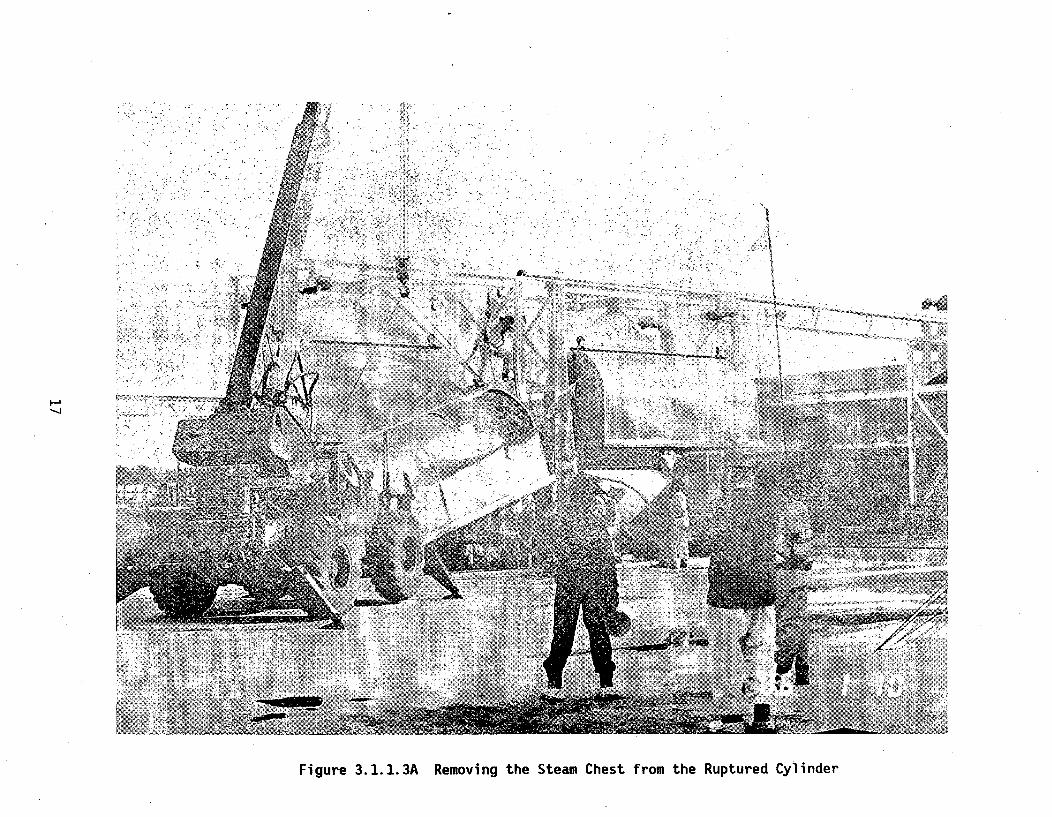
Removing the Steam Chest from the Ruptured Cylinder. Boththe cylinder and the steam chest are in the positions inwhich they were found after the cylinder ruptured. Atemporary cover is in place over the rupture.
Figure 3.1.1.4A The 52-inch Long Rupture.about 8 inches wide. Thesteel. Water is drainingcylinder.
At its midpoint, the opening iscylinder wall is 5/8-inch thickout after rinsing out the
13


Figure 3.1.1.1A The Sequoyah Facility's Process Buildings Viewed from the South
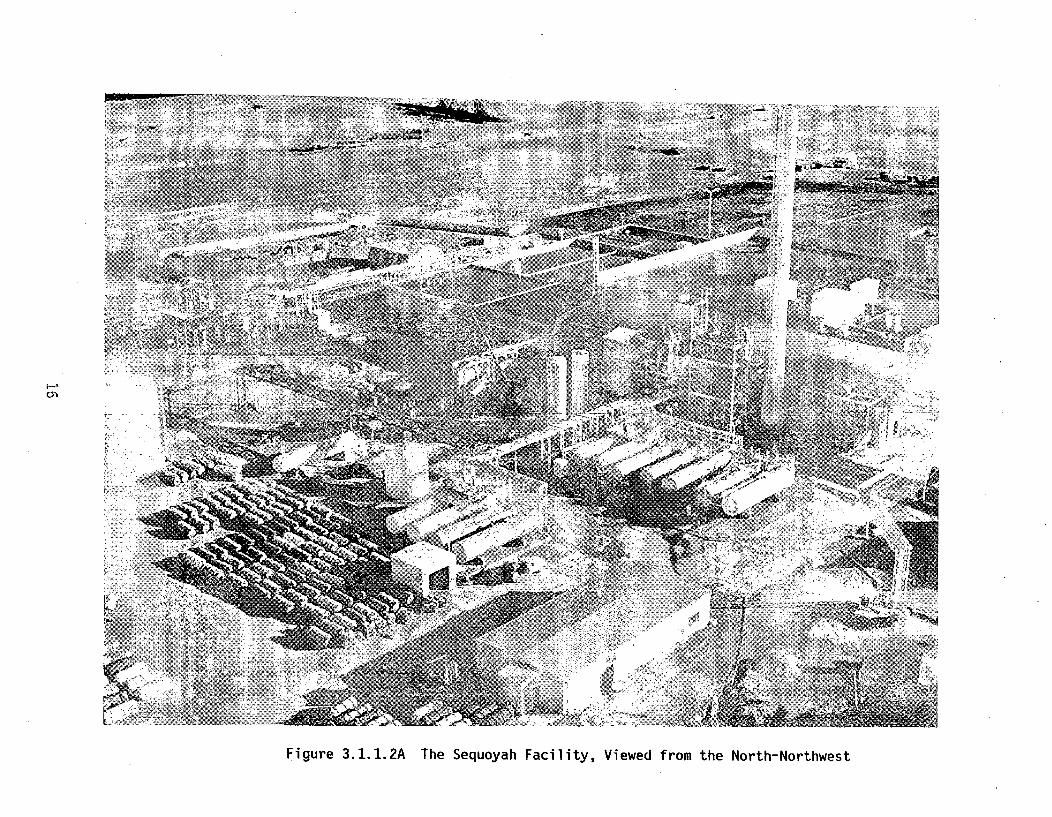
Figure 3.1.1.2A The Sequoyah Facility, Viewed from the North-Northwest
AL
>1I:
I-h
Figure 3.1.1.3A Removing the Steam Chest from the Ruptured Cylinder

1 4' -
v w4
¾-
p
0 I;> -•
aS•
I-.
Figure 3.1.1.4A The 52-inch Long Rupture

APPENDIX 3.3.1
NRC'S PRELIMINARY NOTIFICATIONS OF EVENT OR UNUSUAL OCCURRENCEFOLLOWING THE ACCIDENT OCCURRING ON JANUARY 4, 1986
19

January 5, 1986
PRELIMINARY NOTIFICATION OF EVENT OR UNUSUAL OCCURRENCE -- PNO-IV-86-02
This preliminary notification constitutes EARLY notice of events of POSSIBLEsafety or public interest significance. The information is as initiallyreceived without verification or evaluation, and is basically all that is knownby the Region IV staff on this date.
FACILITY: Licensee Emergency Classification:Sequoyah Facility Notification of Unusual EventSequoyah Fuels Corporation Alert(formerly Kerr-McGee Nuclear Corp.) Site Area EmergencyGore, Oklahoma General EmergencyLicense No. SUB-1010 X Not Applicable
,SUBJECT: RUPTURED URANIUM HEXAFLUORIDE CYLINDER
At approximately 11:30 a.m. on January 4, 1986, a cylinder containingapproximately 29,500 pounds of uranium hexafluoride (UF6) ruptured, releasingits contents into the atmosphere and resulting in the death of one companyemployee from the inhalation of hydrogen fluoride (HF). As a result of thisincident, the NRC has established an emergency response organization at thesite to examine the resultant health and environmental impacts and an AugmentedInvestigation Team (AIT) to investigate the circumstances of the cylinderrupture.
According to statements from company officials, plant employees had overfilledthe cylinder (maximum limit is 27,560 pounds) and were in the process ofheating the cylinder to facilitate removing the excess uranium hexafluoridewhen the rupture occurred. An approximate three foot-long split occurred inthe wall of the cylinder, allowing the contents of the cylinder to be releasedto the atmosphere in gaseous form. Company officials estimate that thecontents of the cylinder emptied in about 30 to 40 minutes.
Contact with the air resulted in the formation of hydrogen fluoride (HF) anduranyl fluoride. Although it is believed, based on radiation surveys andsample results to date, that most of the uranyl fluoride was deposited in theimmediate vicinity of the plant, the hydrogen fluoride, a toxic and corrosivechemical, formed a plume that was visible at more than a mile from the plantsite before it was dispersed. Interstate 40, which runs east-west about a milesouth of the plant, was closed for a short period of time after the incident bythe Oklahoma Highway Patrol.
About 25 people, mostly company employees, were hospitalized as a result of theincident, but only a few were diagnosed as suffering from respiratory problemsrelated to inhalation of hydrogen fluoride. Those exhibiting actualrespiratory problems were transferred to a medical facility in Fort Smith,Arkansas, from a hospital in Sallisaw, Oklahoma. One person, a companyemployee, died enroute to Fort Smith. No additional deaths have been reported.Numerous company employees and local residents have reported to the Sallisaw
21

PNO-IV-86-02 -2-
hospital at the company's urging for initial screening. Many have been askedfor urine samples which the company will analyze at its Technical Center inOklahoma City.
The Company continues to perform radiation surveys at the plant and to performsurveys and take samples from the environment in the areas that the plume isbelieved to have traversed.
Although the rupture took place in a steam-heating facility outside the mainprocess buildings, contamination was spread through most plant buildings by thebuilding ventilation systems. The company continues to decontaminate thoseareas needed to manage its recovery activities.
Region IV's emergency response activities are being conducted in parallel withthose of the Augmented Investigation Team. Both are headed by Region IV'sDirector of the Division of Radiation Safety and Safeguards. The complement ofNRC personnel presently at the site include six technical staff Region IV (twofrom the Uranium Recovery Field Office), one each from NMSS and IE, andRegion IV's Public Affairs Officer. The team is focusing on the events thatled to the cylinder rupture, the resultant health and environmental impacts andthe recovery activities that are currently taking place. Region IV's IncidentResponse Center and the Headquarters Operations Center were activated andstaffed promptly after receiving notification of this incident. The companyhas agreed to leave the equipment and facilities related to this incidentuntouched and not to resume facility operations without NRC concurrence. Theteam is making arrangements to interview all plant employees who were at thefacility at the time of the incident and to have those interviews transcribed.
Arrangements have been made through the Department of Energy for an aerialradiation survey. Both the state of Oklahoma and the state of Arkansas havebeen contacted regarding this event. The Oklahoma Department of Healthdispatched two individuals to the plant site on Saturday. The NRC's responseteam has been coordinating its activities with representatives of the state ofOklahoma and the licensee.
National and local news media have run stories on this incident. The companyand NRC have been responding to media inquiries since shortly after theincident. The company issued a news announcement at about 2:00 p.m. Saturday.A press conference was arranged by Congressman Mike Synar of Oklahoma and tookplace at about 2:00 p.m. Sunday in Muskogee. The NRC's response team leaderand Oklahoma state officials took part in the press conference. The responseteam leader also briefed Congressman Synar separately on Sunday morning.
A hearing on a license amendment for this facility that was to have taken placeon January 7 and 8 in Fort Smith, Arkansas, has been indefinitely postponed bythe presiding Atomic Safety and Licensing Board Judge.
22
PNO-IV-86-02
-3-Region IV was notified
of this incident at about noon January
4 by the
Headquarters Operations
Officer. This information
is current as of 7:00 a.m.
on Monday, January
6. This PN will be updated periodically.
CONTACT: E. F. Bates,
FTS: 728-8100
23
January 7, 1986
2L!MINARY NOTIFICATION OF EVENT OR UNUSUAL OCCURRENCE -- PNO-.IV-86-.O2A
This preliminary notification constitutes EARLY notice of events of POSSIBLE safetyor public interest significance. The information is as initially received withoutverification or evaluation, and is basically all that Is known by the Region IVstaff on this date.
FACILITY: Sequoyah Facility Licensee Emergency Classificatinn:Sequoyah Fuels Corporation Notification of Unusual Fvent(formerly Kerr-McGee Nuclear Corp.) AlertGore, Oklahoma Site Area EmergencyLicense No. SUB-O10 General Emergency
Not Applicabale
SUBJECT: RUPTURED URANIUM HEXAFLUORIDE CYLINDER (UPDATE)
The NRC's Augmented Investigation Team (AilT) nd other response personnel continue toinvestigate the circumstances of the January 4 1986, rupture of a cylinder containingapproximately 15 tons of uranium hexafluoride JUF6) at the Sequoyah Fuels CorporationUF6 production facility near Gore, Oklahoma. The NRC team is evaluating both theevents leading to the rupture and the radiolo;ical impact of the incident. Thecompany has agreed not to resume processing operations without NRC concurrence.Nonradiological effluent processing systems are continuing to operate. This is anactivity unrelated to the incident.
The Investigation team began interviewing plant personnel on Monday, January 6, andhas begun compiling a chronology of events, The team believes it is close toIdentifying the fundamental cause of the cylinder rupture. At a news briefingTuesday, the company acknowledged that the plant's operating procedures prohibitheating a UF6 cylinder that has been overfilled.
i
An additional wisp of hydrogen fluoride gas was observed evolving from the residualUF6 in the ruptured cylinder but control measures by plant personnel have beensuccessful in stopping it. No health or safety importance is attached to thisrelease.
The company has formulated plans for cleaning up the processing portions of thefacility and has already begun cleanup of the plant property itself, Including theremoval of sod from the lawn at the south end of the plant. The NRC team is reviewingthe company's cleanup plans to ensure adequate protection of workers and ensure thatno equipment essential to the Investigation is disturbed. The team has asked thecompany to consider alternative methods of collecting fluids that will result from thewashdown operations at the plant, rather than sending them through the plant's normalprocessing system and to the Illinois River.
Aerial radiation monitoring by EG&G, arranged through the Department of Energy, isexpected to begin Wednesday. The survey, which will be conducted using a red, whiteand blue helicopter flying at an elevation of 150 feet, will cover an approximate
A/RAP/SChe1/7/8,6 •
24
-I V-86-02A ,,,2-
12-square-mile area surrounding the plant. The company is taking steps to inform thepublic about the nature and purpose of these flights. The results of the aerialsurvey will be use4 to confirm ground survey data that appears to indicate that nosignificant amounts of uranium were deposited off the plant site. Initial review ofenvironmental data available to the team at this time confirms early prediction thatno significant offslte radiological impacts are expected.
The company reported today that all individuals hospitalized as a result of thisincident have been released with the exception of one who remains hospitalized forreasons unrelated to the event.
The NRC team, now totaling 15 people at the site, is requesting additional personnelwith expertise In instrument maintenance and surveillance, QA/QC and laboratoryanalytical procedures. These technicians are expected to arrive at the site tomorrow(January 8).
News briefings are being conducted daily In the vicinity of the facility. NRC, thecompany and the state of Oklahoma are represented at these briefings. The NRC teamcontinues to work in cooperation with the conpany and the state of Oklahoma and tokeep the state of Arkansas informed of the status of the recovery operations.
This information is current as of 1:00 p.m. on Tuesday, January 7, 1986. The team
plans to update the information in this PN daily.
CONTACT: J. B. Baird (FTS: 728-8100)
25
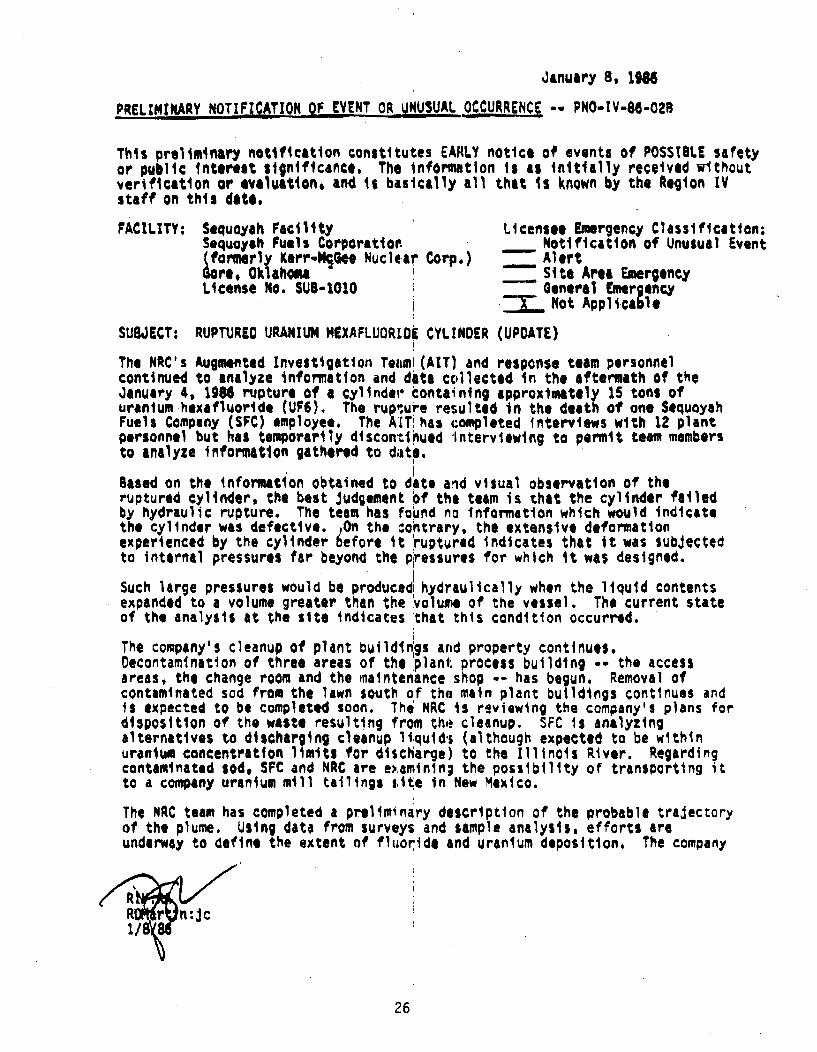
January 8, 19I6
PREL1MINARY NOTIFICATION OF EVENT OR UNUSUAL OCCURRENCq -- PNO-IV-86-028
This preliminary notification constitutes EARLY notice of events of POSSTBLE safetyor public interest significance, The information is as initially received withoutverification or evaluatlion and is basically all that is knQwn by the Region IVstaff on this date,
FACILITY: Sequoyah Facility Licensee Emergency Classification;Sequoyah Fuels Corporatior Notification of Unusual Event(formerly Kerr-ISGe Nuclear Corp.) -- Alertlore, Oklahoma -- Site Area EmergencyLicense No. SUB-1010 General Eerg ency
im Hot Applilcable
SUBJECT: RUPTURED URANIUM MEXAFLUOR10I CYLINDER (UPDATE)
The NRC's Augmented Investigation Teazm!(AIT) and response team personnelcontinued to analyze information and data collected in the aftermath of theJanuary 4, 1986 rupture of a cylinder containing approximately 15 tons ofuranium hexafluoride (UF6). The rupnure resulted in the death of one SequoyahFuels Company (SFC) employee. The AIT! has completed Intervitws with 12 plantpersonnel but has temporarily discontinued interviewing to permit team membersto analyze information gathered to d~ate.
Based on the information obtained to date a!1d visual observation of theruptured cylinder, the best judgement of ths team is that the cylinder failedby hydraulic rupture. The team has found no information which would Indicatethe cylinder was defective On the :ontrary, the extensive deformationexperienced by the cylinder before it ruptured indicates that it was subjectedto internal pressures far beyond the pressures for which it was designed.
Such large pressures would be produced hydraulically when the liquid contentsexpanded to a volume greater than the voluue of the vessel. The current stateof the analysis at the site indicates 'hat this condition occurred.
The company's cleanup of plant buildings and property continues.Decontamination of three areas of the plant process building -w the accessareas, the change room and the maintenance shop -- has begun. Removal ofcontaminated sod from the lawn South of tho main plant buildings continues andis expected to be completed soon. The NRC is reviewing the company's plans fordisposition of the waste resulting from the• cleanup. SFC is analyzingalternatives to discharging cleanup liquids (although expected to be withinuranium concentration limits for discharge) to the Illinois River. Regardingcontaminated sod# SFC and NRC are examinin; the possibility of transporting itto a company uranium mill tailings itle in New Mexico.
The NRC team has completed a preliminary description of the probable trajectoryof the plume. Using data from surveys and sample analysis, efforts areunderway to define the extent of fluoride and uranium deposition, The company
A:jc
26

PNO-JIV-86-O2B -2-
continues to analyze the fluoride impact on animals In the path of the plume,but has fewt no observable effects. Scme fluoride damage to cedars has beenobserved by a Specialist employed by the company. The NRC plans to produce adetailed report examinlng the radiological consequences of this incident.There is no data at this time to indicate any significant offsite radiologicalimpacts.
The aerial radiation survey of the ares surrounding the plant did not begintoday as expected because of an FAA airworthiness directive that kept thehelicopter grounded. This issue is expected to be resolved promptly.
The company reports today that all employees were were hospitalized as a resultof this Incident have been released from the liospital. Medical consultants tothe company continue to monitor affected empl,)yees for evidence of kidneydamage from uranium ingestion. Funeral services for the employee who died as aresult of inhaling toxiC hydrogen fluaride vapors took place today in Vian,Oklahoma.
News media interest In the Incident has remained steady. Another briefing washeld at 11:00 a.m. today in Gore, Oklahoma. The NRC team continues to workwith the state of Oklahoma representatives at the site and to keep the ArkansasDepartment of Health informed of the sitatus of the recovery operations. Theteam continues to brief Congressman Synar's sitaff daily. NRC, Oklahoma andcompany representatives have been requested ':o attend this evening's specialmeeting of the Gore Public Schools Board of "iducation to address concerns aboutlocation of Carlile School about one mile east of the plant site.
This information is current as of 1:00 p.m. on Wednesday, January 8, 1986.
CONTACT: J. 8. Baird (FT5: 728-8100)
27

january-ý, ig8b
PRELIMIMAQY NOTIFICATION OF EVENT OR UNUSUAL OCCURRENCE -- PNO-IV-86-02C
This preliminary notification constitutes EARLY notice of events .of POSSIBLE safetyor public interest significance. The information is as initially received withoutverification or evaluation, and is basically all that is known by the Region IVstaff on this date.
FACILITY: Sequoyah Facility Licensee Emergency Classification:Sequoyah Fuels Corporation Notification of Unusual Event(formerly Kerr-McGee Nuclear Corp.) AlertGore, Oklahoma Site Area EmergencyLicense No. SUB-1010 General Emergency
X_ Not Applicable
SUBJECT: RUPTURED URANIUM HEXAFLUORIDE CYLINDER (UPDATE)
The NRC's Augmented Investigation Team (AIT) is nearing the completion of itsfact-finding activities and continues to evaluate the information that has beengathered to date. The site team leader announced to the press today the AIT'spreliminary conclusion on the cause of the UF6 cylinder rupture. It appearsthat early next week the team can present estimates of the size andconcentrations associated with the release and some conclusions at to thehealth and environmental impact of the incident.
The aerial surveys to monitor the vicinity of the plant for the presence of uraniumand for any indication of fluoride damage to vegetation (using infrared photography)began today. The company announced that damage to offsite cedars previously reportedto have been caused by fluoride was actually caused by a power company spraying adefoliant beneath its power lines.
The company continues to make progress in cleaning up the process areas and the plantproperty. Plans have been made to decontaminate the ruptured cylinder prior to itsremoval to an offsite location for a metallurgical examination. Arrangements arebeing made to obtain a complete inspection and test of the scale that was to weigh thecylinder.
Plant buildings were evacuated this morning when a fire alarm sounded. The companydetermined that the alarm was caused by low nitrogen pressure in the automatic firesuppression system in the solvent extraction building. The NRC is assisting thecompany in making arrangements to obtain necessary nitrogen supplies because thenitrogen must be delivered to an area of the facility that remains contaminated.
J
Senator Don Nickles (R-Oklahoma) visited the plant site this morning and was briefedby the NRC team leader and company officials. Senator Nickles, the NRC team leader,company and Oklahoma representatives then briefed the news media at an 11:00 a.m. newsconference in Gore, Oklahoma. Last night in Gore, the NRC team leader appeared beforea special meeting of the Gore Public Schools Board of Education that was called toassess the long-term safety of students in the Carlile elementary school, which is
RIV:RAROMartin:jc1/9/86
28
PN4O- TY-86-02C -z-
located auout a mile east of the plant. The school was not in the direction of theplume from this incident and was surveyed in detail to confirm that no radioactivityfrom the incident had been deposited there. The school board delayed until Monday,January 13, a decision on whether to shut down the Carlile school and move students toother facilities.
This information is current as of 1:00 p.m. on Thursday, January 9, 1986.
CONTACT: J. B. Baird (FTS: 728-8100)
29
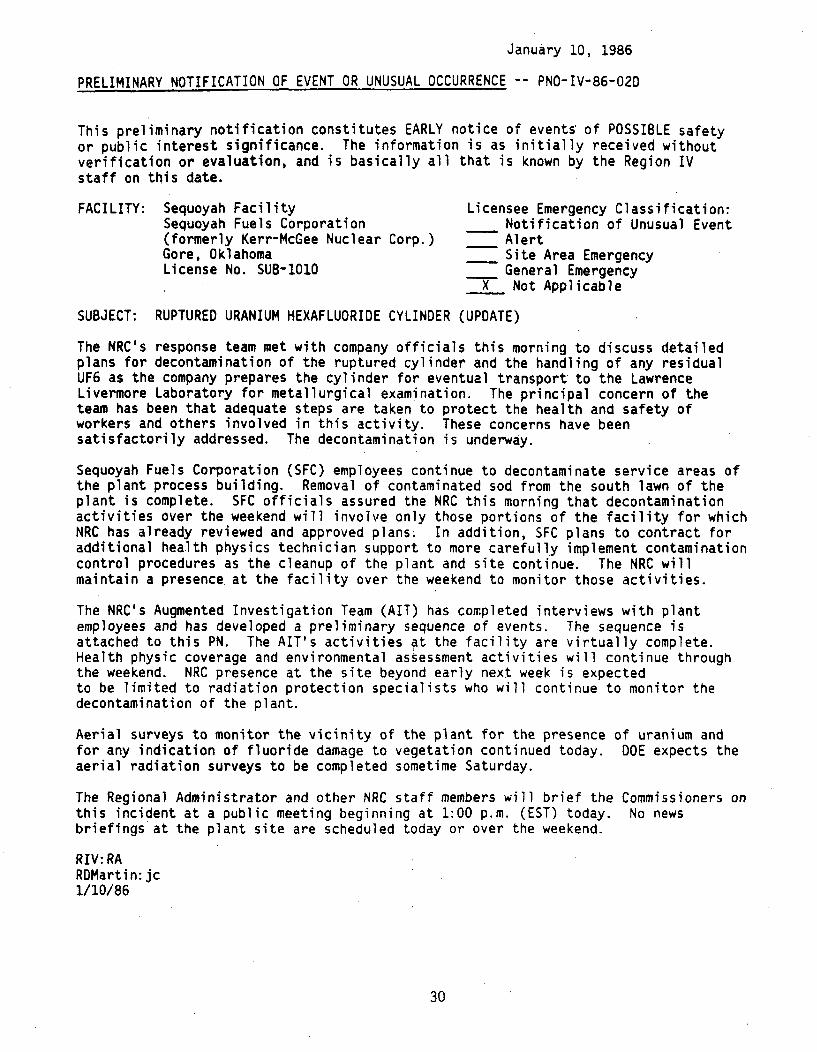
January 10, 1986
PRELIMINARY NOTIFICATION OF EVENT OR UNUSUAL OCCURRENCE -- PNO-IV-86-02D
This preliminary notification constitutes EARLY notice of events of POSSIBLE safetyor public interest significance. The information is as initially received withoutverification or evaluation, and is basically all that is known by the Region IVstaff on this date.
FACILITY: Sequoyah Facility Licensee Emergency Classification:Sequoyah Fuels Corporation _ Notification of Unusual Event(formerly Kerr-McGee Nuclear Corp.) _ AlertGore, Oklahoma _ Site Area EmergencyLicense No. SUB-1010 General Emergency
X Not Applicable
SUBJECT: RUPTURED URANIUM HEXAFLUORIDE CYLINDER (UPDATE)
The NRC's response team met with company officials this morning to discuss detailedplans for decontamination of the ruptured cylinder and the handling of any residualUF6 as the company prepares the cylinder for eventual transport to the LawrenceLivermore Laboratory for metallurgical examination. The principal concern of theteam has been that adequate steps are taken to protect the health and safety ofworkers and others involved in this activity. These concerns have beensatisfactorily addressed. The decontamination is underway.
Sequoyah Fuels Corporation (SFC) employees continue to decontaminate service areas ofthe plant process building. Removal of contaminated sod from the south lawn of theplant is complete. SFC officials assured the NRC this morning that decontaminationactivities over the weekend will involve only those portions of the facility for whichNRC has already reviewed and approved plans. In addition, SFC plans to contract foradditional health physics technician support to more carefully implement contaminationcontrol procedures as the cleanup of the plant and site continue. The NRC willmaintain a presence at the facility over the weekend to monitor those activities.
The NRC's Augmented Investigation Team (AIT) has completed interviews with plantemployees and has developed a preliminary sequence of events. The sequence isattached to this PN. The AIT's activities at the facility are virtually complete.Health physic coverage and environmental assessment activities will continue throughthe weekend. NRC presence at the site beyond early next week is expectedto be limited to radiation protection specialists who will continue to monitor thedecontamination of the plant.
Aerial surveys to monitor the vicinity of the plant for the presence of uranium andfor any indication of fluoride damage to vegetation continued today. DOE expects theaerial radiation surveys to be completed sometime Saturday.
The Regional Administrator and other NRC staff members will brief the Commissioners onthis incident at a public meeting beginning at 1:00 p.m. (EST) today. No newsbriefings at the plant site are scheduled today or over the weekend.
RIV:RARDMartin:jc1/10/86
30
PNC-IV-86-02D -2-
The NRC response team continues to work in close cooperation with the state ofOklahoma Department of Health representatives at the plant site and to keep ArkansasDepartment of Health officials and Congressman Synar's staff informed of the statusof recovery activities.
This information is current as of 1:00 p.m. on Friday, January 10, 1986.PNs will be issued as necessary.
Additional
ATTACHMENT: Sequence of Events
CONTACT: J. B. Baird (FTS: 728-8100)
31
9/20/85
9/27/85
1/3/86 (10:00 am)
(3:30 pm)
(11:30 pm)
1/4/86 (2:15 am)
Sequoyah Facility, Sequoyah FuelsCorporation (formerly Kerr-McGeeNuclear Corp.), Gore, Oklahoma,License No. SUB-1010
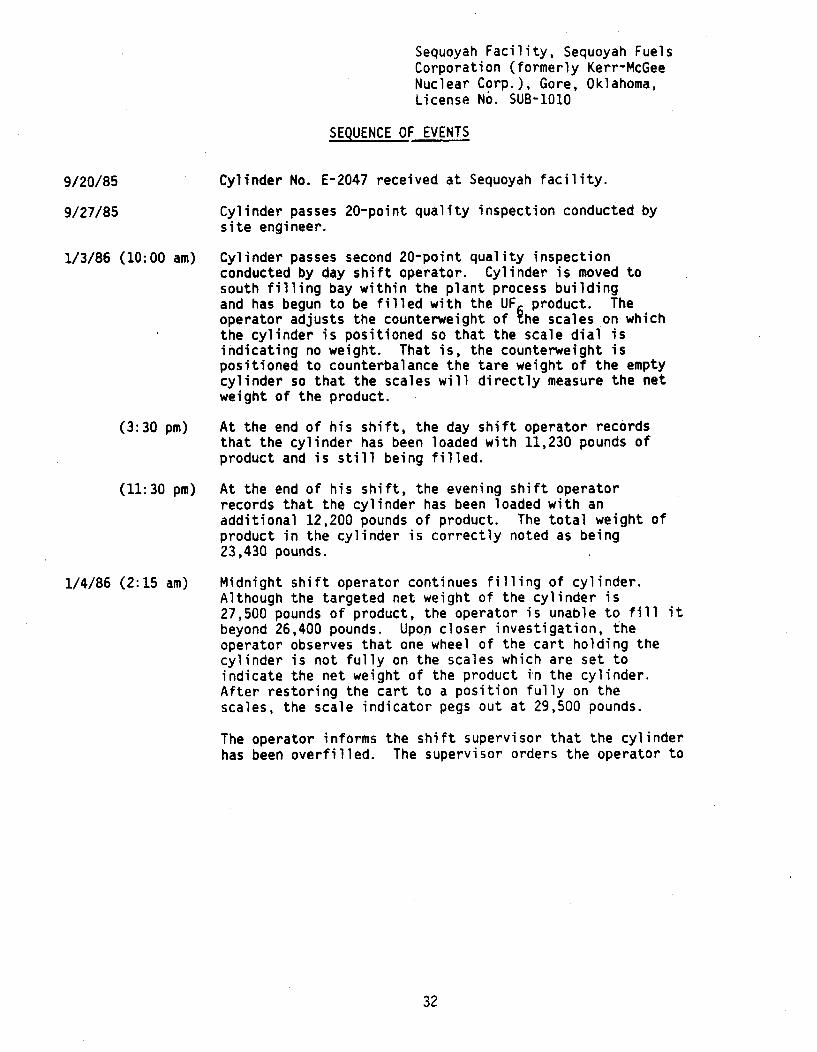
SEQUENCE OF EVENTS
Cylinder No. E-2047 received at Sequoyah facility.
Cylinder passes 20-point quality inspection conducted bysite engineer.
Cylinder passes second 20-point quality inspectionconducted by day shift operator. Cylinder is moved tosouth filling bay within the plant process buildingand has begun to be filled with the UF product. Theoperator adjusts the counterweight of ýhe scales on whichthe cylinder is positioned so that the scale dial isindicating no weight. That is, the counterweight ispositioned to counterbalance the tare weight of the emptycylinder so that the scales will directly measure the netweight of the product.
At the end of his shift, the day shift operator recordsthat the cylinder has been loaded with 11,230 pounds ofproduct and is still being filled.
At the end of his shift, the evening shift operatorrecords that the cylinder has been loaded with anadditional 12,200 pounds of product. The total weight ofproduct in the cylinder is correctly noted as being23,430 pounds.
Midnight shift operator continues filling of cylinder.Although the targeted net weight of the cylinder is27,500 pounds of product, the operator is unable to fill itbeyond 26,400 pounds. Upon closer investigation, theoperator observes that one wheel of the cart holding thecylinder is not fully on the scales which are set toindicate the net weight of the product in the cylinder.After restoring the cart to a position fully on thescales, the scale indicator pegs out at 29,500 pounds.
The operator informs the shift supervisor that the cylinderhas been overfilled. The supervisor orders the operator to
32
-2-
1/4/86 (6:00 am)
(6:15 am)
(7:45 am)
(8:45 am)
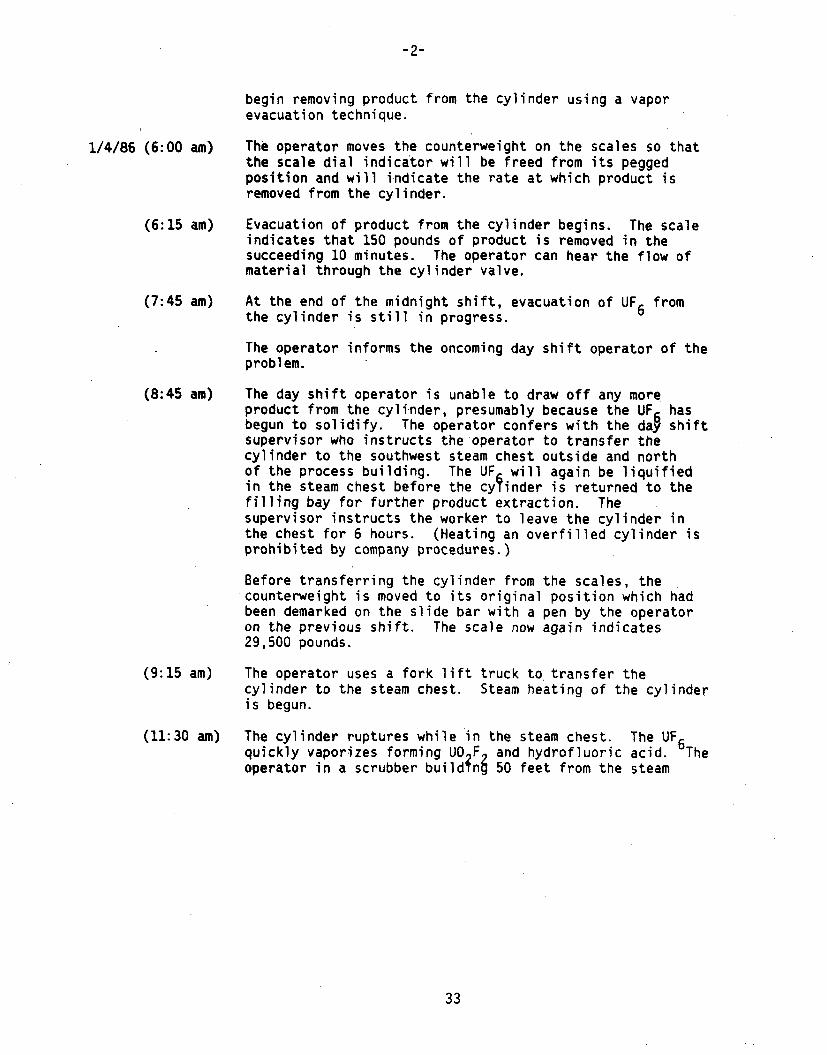
begin removing product from the cylinder using a vaporevacuation technique.
The operator moves the counterweight on the scales so thatthe scale dial indicator will be freed from its peggedposition and will indicate the rate at which product isremoved from the cylinder.
Evacuation of product from the cylinder begins. The scaleindicates that 150 pounds of product is removed in thesucceeding 10 minutes. The operator can hear the flow ofmaterial through the cylinder valve.
At the end of the midnight shift, evacuation of UF6 fromthe cylinder is still in progress.
The operator informs the oncoming day shift operator of theproblem.
The day shift operator is unable to draw off any moreproduct from the cylinder, presumably because the UF6 hasbegun to solidify. The operator confers with the day shiftsupervisor who instructs the operator to transfer thecylinder to the southwest steam chest outside and northof the process building. The UF will again be liquifiedin the steam chest before the cyfinder is returned to thefilling bay for further product extraction. Thesupervisor instructs the worker to leave the cylinder inthe chest for 6 hours. (Heating an overfilled cylinder isprohibited by company procedures.)
Before transferring the cylinder from the scales, thecounterweight is moved to its original position which hadbeen demarked on the slide bar with a pen by the operatoron the previous shift. The scale now again indicates29,500 pounds.
The operator uses a fork lift truck to transfer thecylinder to the steam chest. Steam heating of the cylinderis begun.
The cylinder ruptures while in the steam chest. The UF6quickly vaporizes forming UO F and hydrofluoric acid. Theoperator in a scrubber build~nj 50 feet from the steam
(9:15 am)
(11:30 am)
33

-3-
chest sustai-ns lethal injuries caused by the acid fumes.Workers further away sustain less serious injuries. Theplant is evacuated of approximately 40 workers.
The vapor release which continues for approximately 40minutes is carried south by south-east by a gusting25 mph wind.
34

January 13, 1986
PRELIMINARY NOTIFICATION OF EVENT OR UNUSUAL OCCURRENCE -- PNO-IV-86-02E
This preliminary notification constitutes EARLY notice of events of POSSIBLEsafety or public interest significance. The information is as initiallyreceived without verification or evaluation, and is basically all that isknown by NRC staff on this date.
FACILITY: Sequoyah Facility Licensee Emergency Classification:Sequoyah Fuels Corporation Notification of Unusual Event(formerly Kerr-McGee Nuclear Corp.)- AlertGore, Oklahoma Site Area EmergencyLicense No. SUB-1010 General Emergency
X_ Not Applicable
SUBJECT: RUPTURED URANIUM HEXAFLUORIDE CYLINDER (FINAL UPDATE)
The NRC's response team has begun to receive results of soil and vegetationsamples taken from more than 100 locations in a broad area extending as far as10 miles south of the facility (in the direction of the plume). Samples arebeing analyzed by the Kerr-McGee Technical Center, the state of OklahomaDepartment of Health and the Oak Ridge National Laboratory (on behalf ofNRC). Sample results to date indicate no deposition of uranium in detectablequantities beyond property owned by the licensee.
Preliminary results of aerial radiation surveys in a 25-square-mile areaconfirm the absence of uranium in concentrations above background except inthe immediate areas of the facility. NRC and state of Oklahoma officialscontinue to analyze soil and vegetation samples for uranium and fluorinecontent. Company medical consultants also continue to analyze the results ofuranium analyses done on the urine of both plant employees and members of thepublic.
The initial decontamination of the raptured cylinder was completed withoutincident on Friday, January 10. As expected, a small amount of hydrogenfluoride vapor was released to the air during the operation of flushingresidual materials from the UF6 cylinder. As a precaution, the state ofOklahoma Department of Health notified local officials prior to thisactivity. Other decontamination activities performed over the weekend focusedon returning plant office space and the main gate area to normal conditions.The company plans to develop a program to periodically resurvey areas thathave been cleaned to ensure that contamination is not spread during cleanupoperations.
RD
1/13/86 35
PNO-TV-86-02E -2-
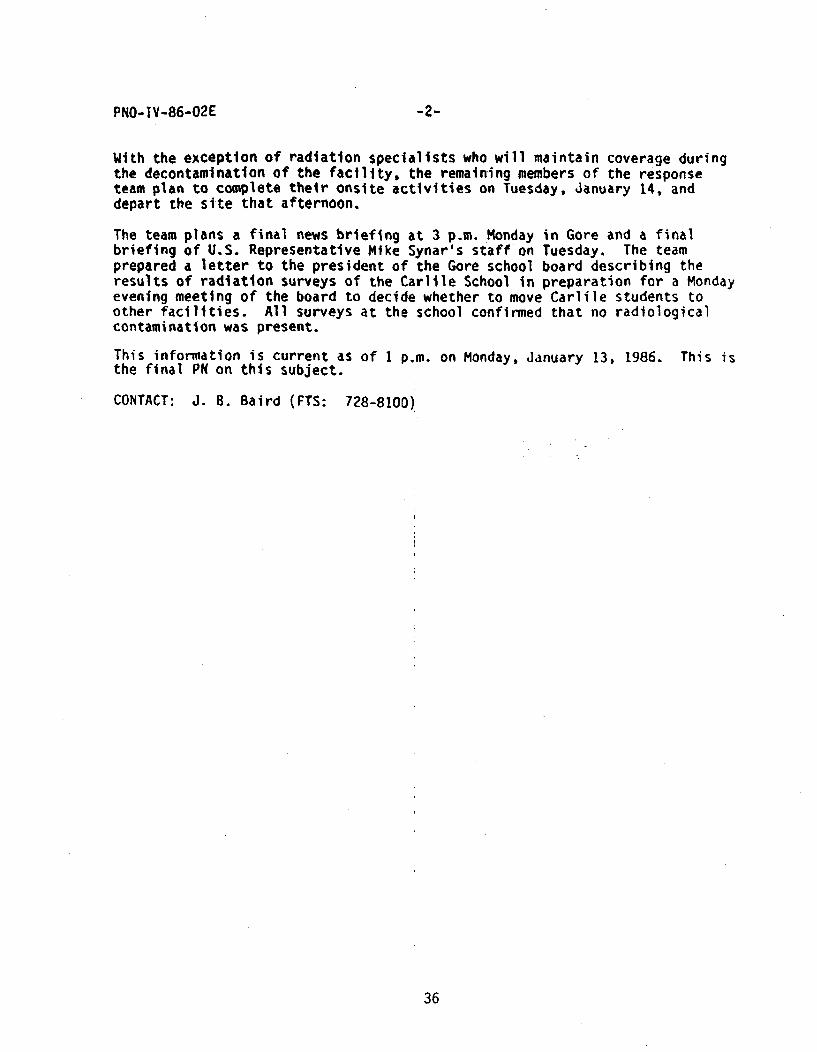
With the exception of radiation specialists who will maintain coverage duringthe decontamination of the facility, the remaining members of the responseteam plan to complete their onsite activities on Tuesday, January 14, anddepart the site that afternoon.
The team plans a final news briefing at 3 p.m. Monday in Gore and a finalbriefing of U.S. Representative Mike Synar's staff on Tuesday. The teamprepared a letter to the president of the Gore school board describing theresults of radiation surveys of the Carlile School in preparation for a Mondayevening meeting of the board to decide whether to move Carlile students toother facilities. All surveys at the school confirmed that no radiologicalcontamination was present.
This information is current as of I p.m. on Monday, January 13, 1986. This isthe final PN on this subject.
CONTACT: J. B. Baird (FTS: 728-8100)
36
APPENDIX 4.1.2
METEOROLOGY AND ATMOSPHERIC DISPERSION
37


APPENDIX 4.1.2
ATMOSPHERIC DISPERSION AND METEOROLOGY
4.1.2.1 Atmospheric Dispersion Modeling
The atmospheric transport, diffusion, and deposition models used for assessingthe impacts of the atmospheric releases are part of the Atmospheric ReleaseAdvisory Capability (ARAC) operated by the Lawrence Livermore NationalLaboratory under the auspices of the Department of Energy. The models 7 ' 8 usedwere the Mass-Adjusted Three Dimensional Wind Field (MATHEW) model and theAtmospheric Diffusion Particle-In-Cell (ADPIC) model. These models are fullydescribed in References 7 and 8. The regional wind field was developed frominformation compiled from National Weather Service stations within 200 km,although data from the site dominated the wind field and consequently plumemovement close to the faiclity. Data from two other stations affected themovement of the plume well-away from the facility. These stations are locatedin Fort Smith Arkansas (approximately 70 km east-southeast), and Page, Oklahoma(approximately 100 km south of the facility).
The influence of terrain and airflow trajectory is considered in determiningthe 3-dimensional wind field, with horizontal resolution of terrain of one-twentieth of the overall grid size and vertical resolution of terrain of50 meters independent of grid size. Calculations of atmospheric dispersionwere performed for three grid sizes: 10 km, 40 km, and 80 km. The totalvertical depth modeled was 700 meters. Because of different terrain cell sizesand varying grid cell volumes close to the facility, contours of air concentra-tion and deposition differ slightly in magnitude and location close to thefacility for each computational grid used.
The ADPIC Model is based on a particle-in-cell technique with concentrationrepresented by Lagrangian-marker particles inside a fixed Eulerian grid. Fromobservations at the facility during the accident, the initial cloud was assumedto be an ellipsoidal volume 21 meters high (in the vertical direction), 76 meterswide (in the cross-wind direction), and 4 meters long (in the along wind direc-tion). Uranyl fluoride was modeled as particles with a log-normal size distribu-tion, a median diameter of one micron, and a standard geometric deviation of1.5 microns. A deposition velocity of 1 cm/sec was assumed. Hydrogen fluoridewas modeled as a vapor with a deposition velocity of 1 cm/sec. The assumptionsregarding the character and behavior of uranyl fluoride and hydrogen fluoridewere developed to simplify for modeling purposes the complex chemical transforma-tions and atmospheric processes related to condensation, precipitation, andsublimation. The assumptions appear reasonable given the nature of the releaseand meteorological conditions at the time of the accident; however, the relativelysimple characterization of such complex processes is a major source of uncertaintyin the atmospheric dispersion models used for this evaluation.
For example, when the cylinder ruptured in the steam chest, it released UF6 inthree physical states, i.e., some was a gas, some liquid, and some solid. Itwas reported that small pieces of solid UF6 were scattered widely around thesteam chest area. Some of the UF6 reacted immediately with the steam andother water in the steam chest and in the surrounding air, but there was not
39
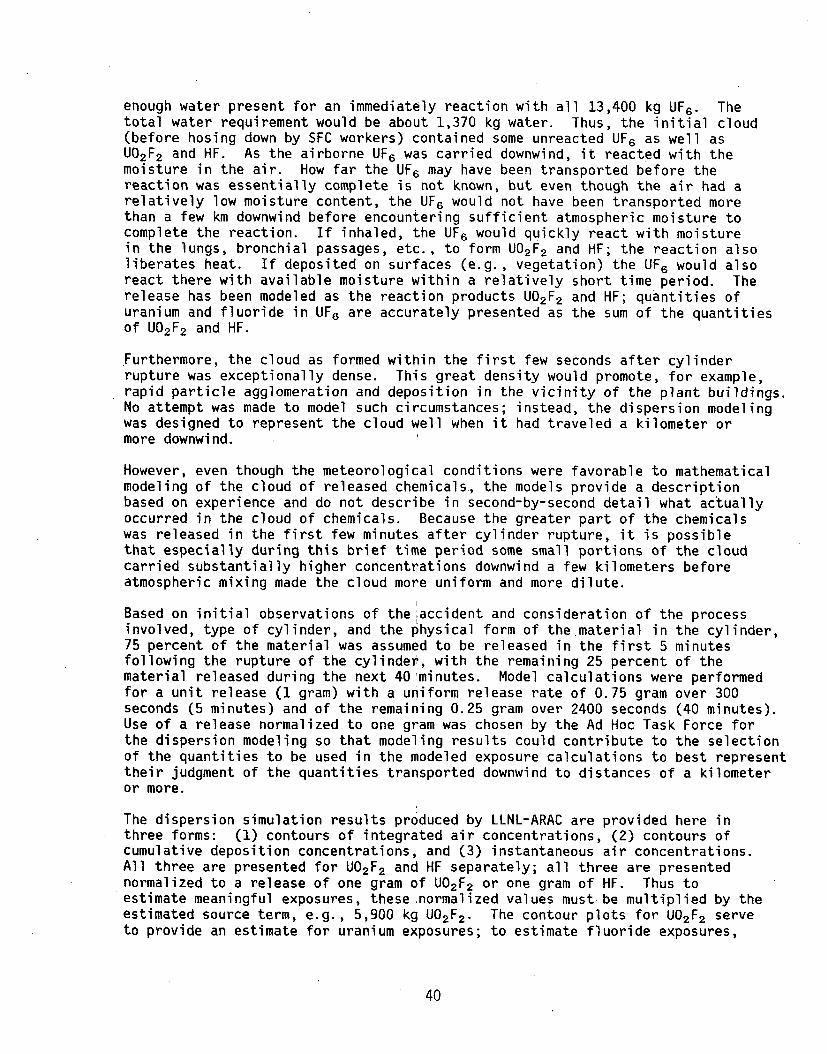
enough water present for an immediately reaction with all 13,400 kg UF6 . Thetotal water requirement would be about 1,370 kg water. Thus, the initial cloud(before hosing down by SFC workers) contained some unreacted UF6 as well asU02 F2 and HF. As the airborne UF6 was carried downwind, it reacted with themoisture in the air. How far the UF6 may have been transported before thereaction was essentially complete is not known, but even though the air had arelatively low moisture content, the UF6 would not have been transported morethan a few km downwind before encountering sufficient atmospheric moisture tocomplete the reaction. If inhaled, the UF6 would quickly react with moisturein the lungs, bronchial passages, etc., to form U02 F2 and HF; the reaction alsoliberates heat. If deposited on surfaces (e.g., vegetation) the UF6 would alsoreact there with available moisture within a relatively short time period. Therelease has been modeled as the reaction products U02 F2 and HF; quantities ofuranium and fluoride in UF6 are accurately presented as the sum of the quantitiesof U02 F2 and HF.
Furthermore, the cloud as formed within the first few seconds after cylinderrupture was exceptionally dense. This great density would promote, for example,rapid particle agglomeration and deposition in the vicinity of the plant buildings.No attempt was made to model such circumstances; instead, the dispersion modelingwas designed to represent the cloud well when it had traveled a kilometer ormore downwind.
However, even though the meteorological conditions were favorable to mathematicalmodeling of the cloud of released chemicals, the models provide a descriptionbased on experience and do not describe in second-by-second detail what actuallyoccurred in the cloud of chemicals. Because the greater part of the chemicalswas released in the first few minutes after cylinder rupture, it is possiblethat especially during this brief time period some small portions of the cloudcarried substantially higher concentrations downwind a few kilometers beforeatmospheric mixing made the cloud more uniform and more dilute.
Based on initial observations of the accident and consideration of the processinvolved, type of cylinder, and the physical form of the material in the cylinder,75 percent of the material was assumed to be released in the first 5 minutesfollowing the rupture of the cylinder, with the remaining 25 percent of thematerial released during the next 40 minutes. Model calculations were performedfor a unit release (1 gram) with a uniform release rate of 0.75 gram over 300seconds (5 minutes) and of the remaining 0.25 gram over 2400 seconds (40 minutes).Use of a release normalized to one gram was chosen by the Ad Hoc Task Force forthe dispersion modeling so that modeling results could contribute to the selectionof the quantities to be used in the modeled exposure calculations to best representtheir judgment of the quantities transported downwind to distances of a kilometeror more.
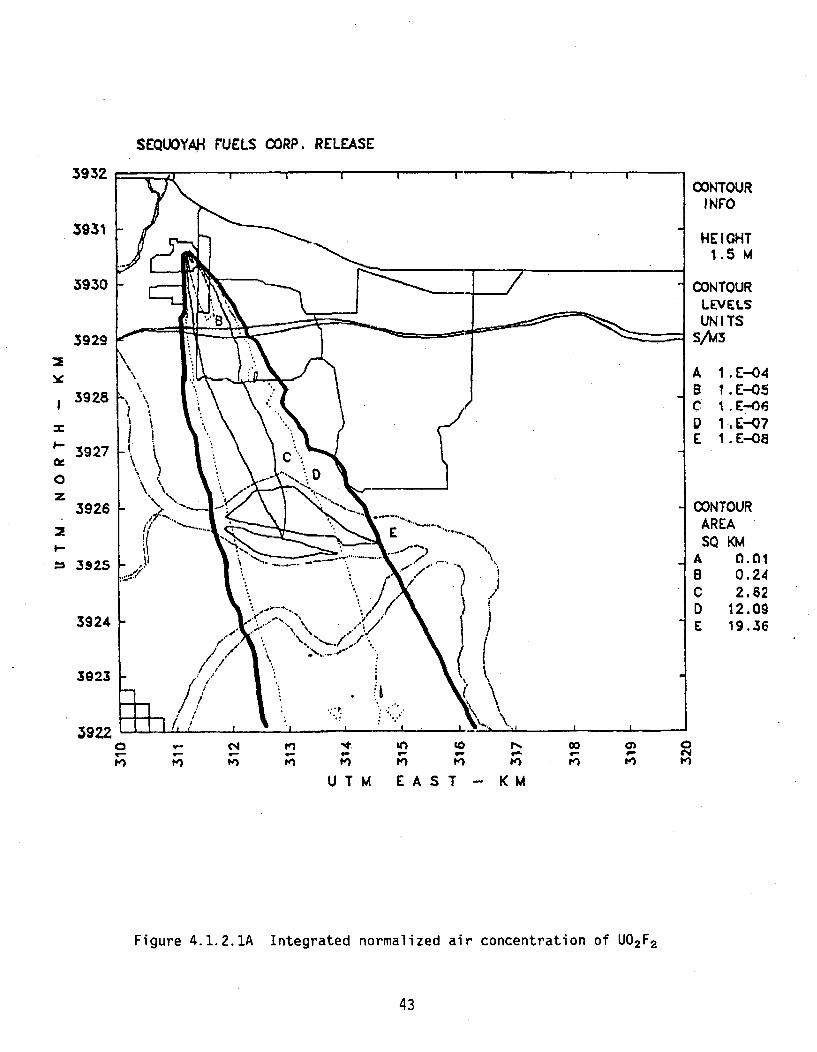
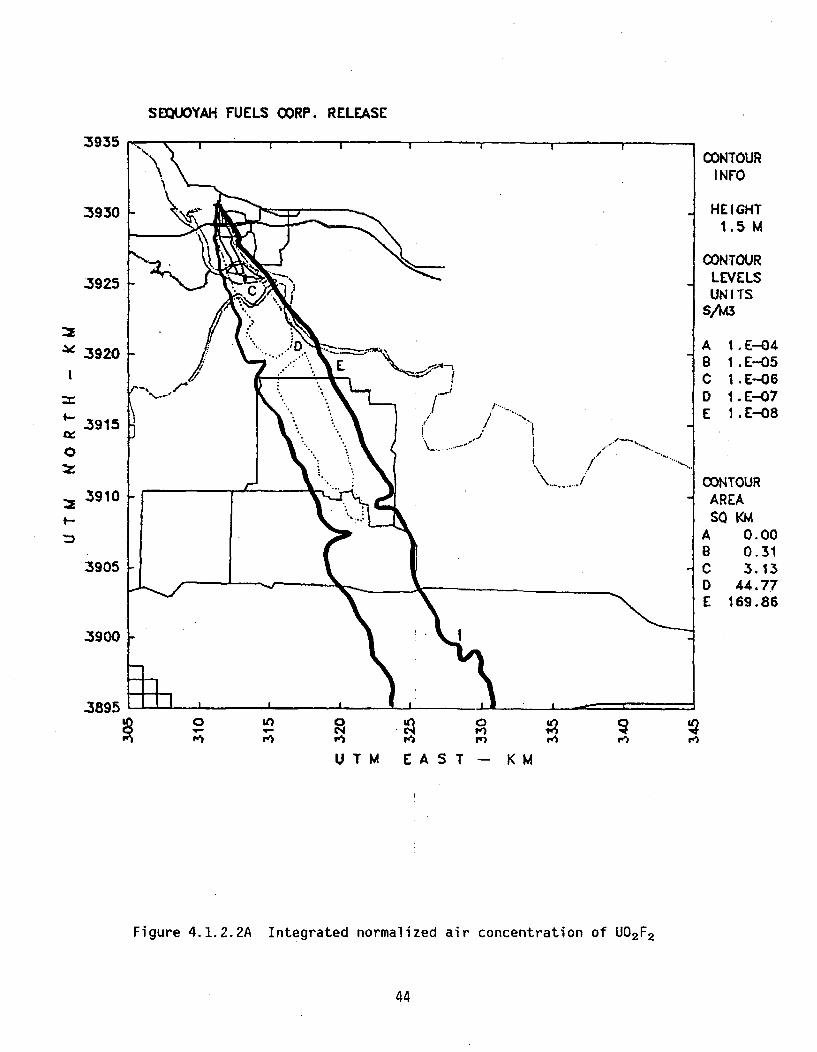
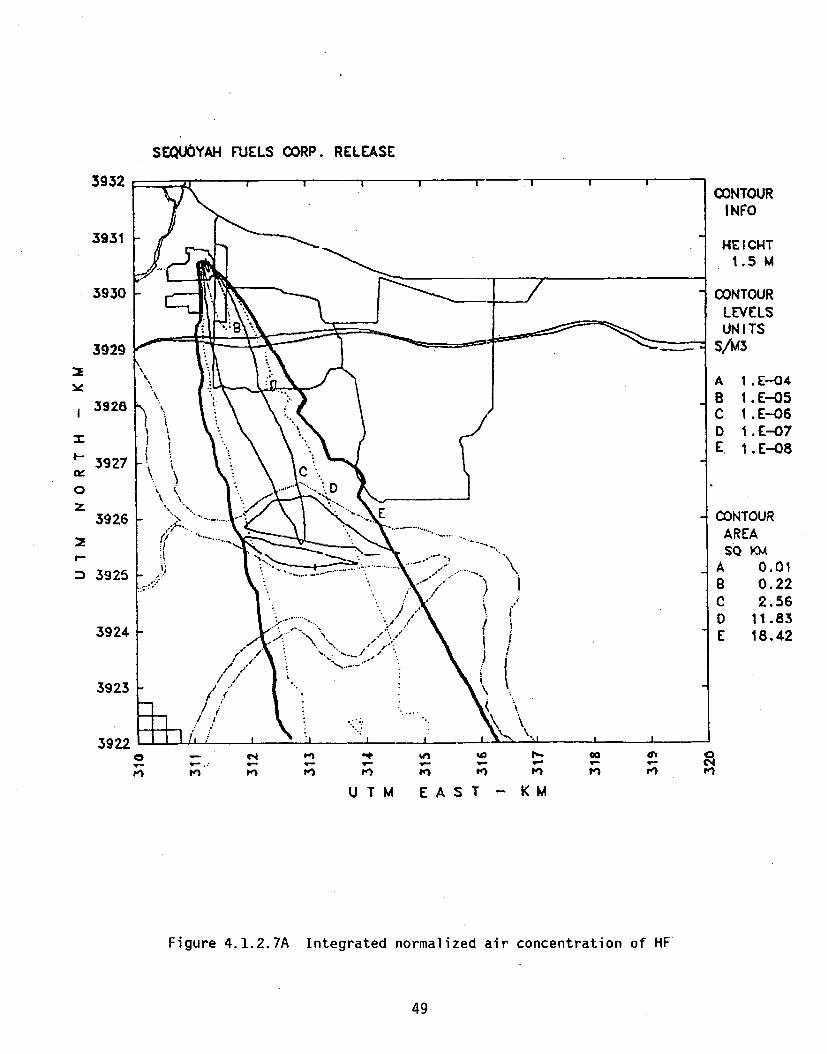
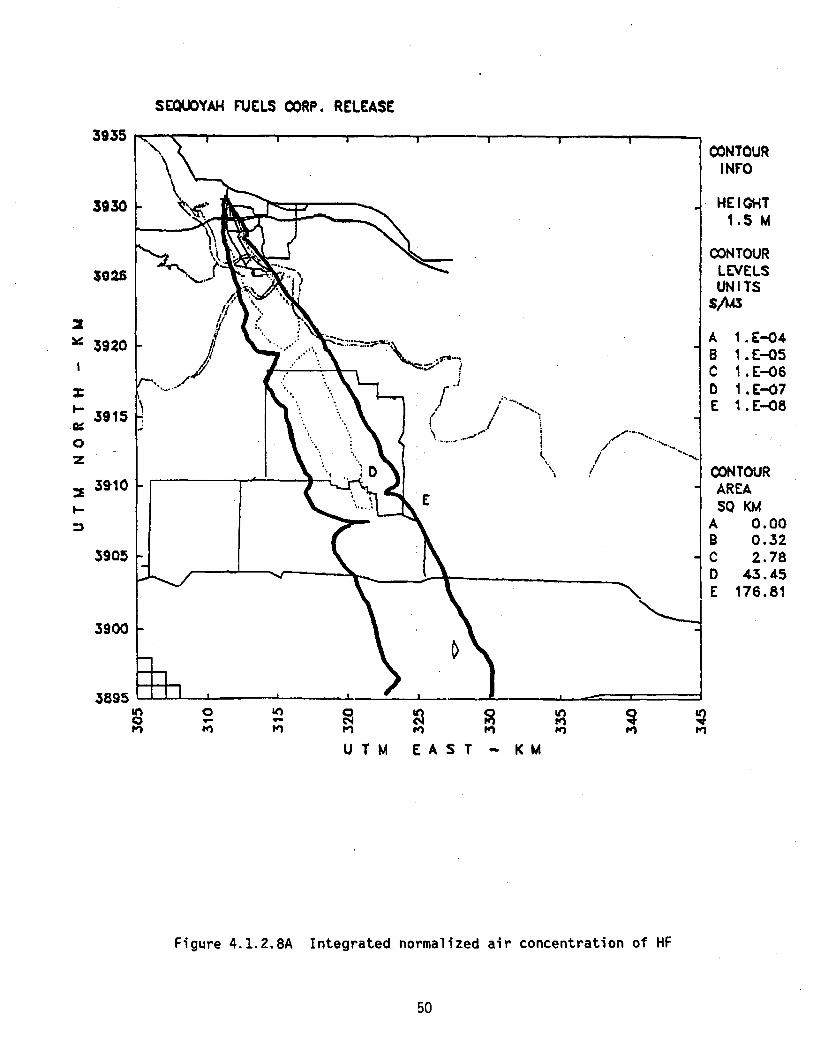
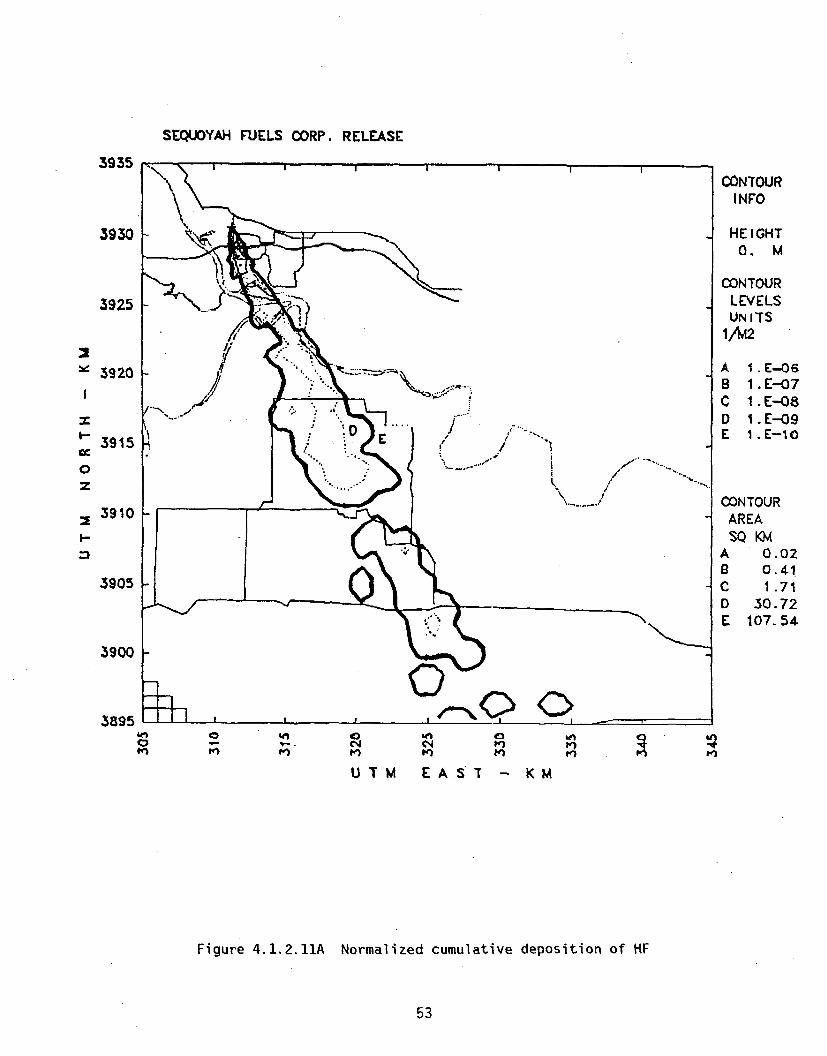
The dispersion simulation results produced by LLNL-ARAC are provided here inthree forms: (1) contours of integrated air concentrations, (2) contours ofcumulative deposition concentrations, and (3) instantaneous air concentrations.All three are presented for U02 F2 and HF separately; all three are presentednormalized to a release of one gram of U02 F2 or one gram of HF. Thus toestimate meaningful exposures, these normalized values must be multiplied by theestimated source term, e.g., 5,900 kg U02 F2 . The contour plots for U02 F2 serveto provide an estimate for uranium exposures; to estimate fluoride exposures,
40
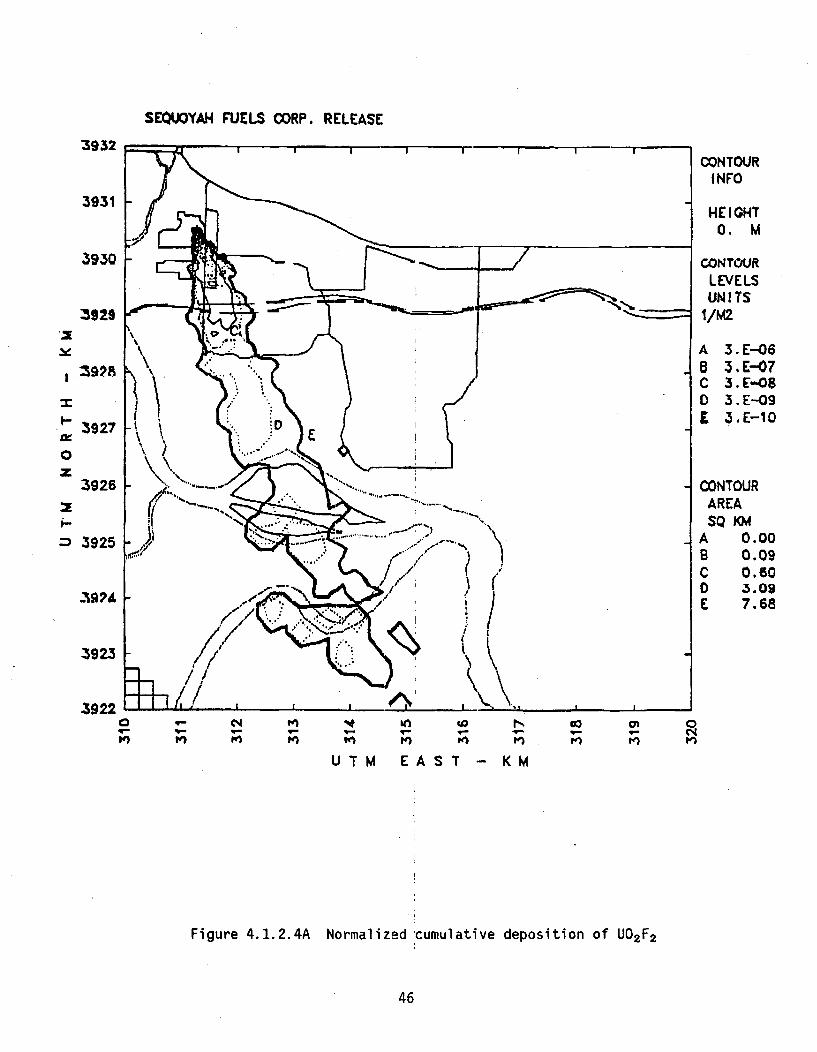
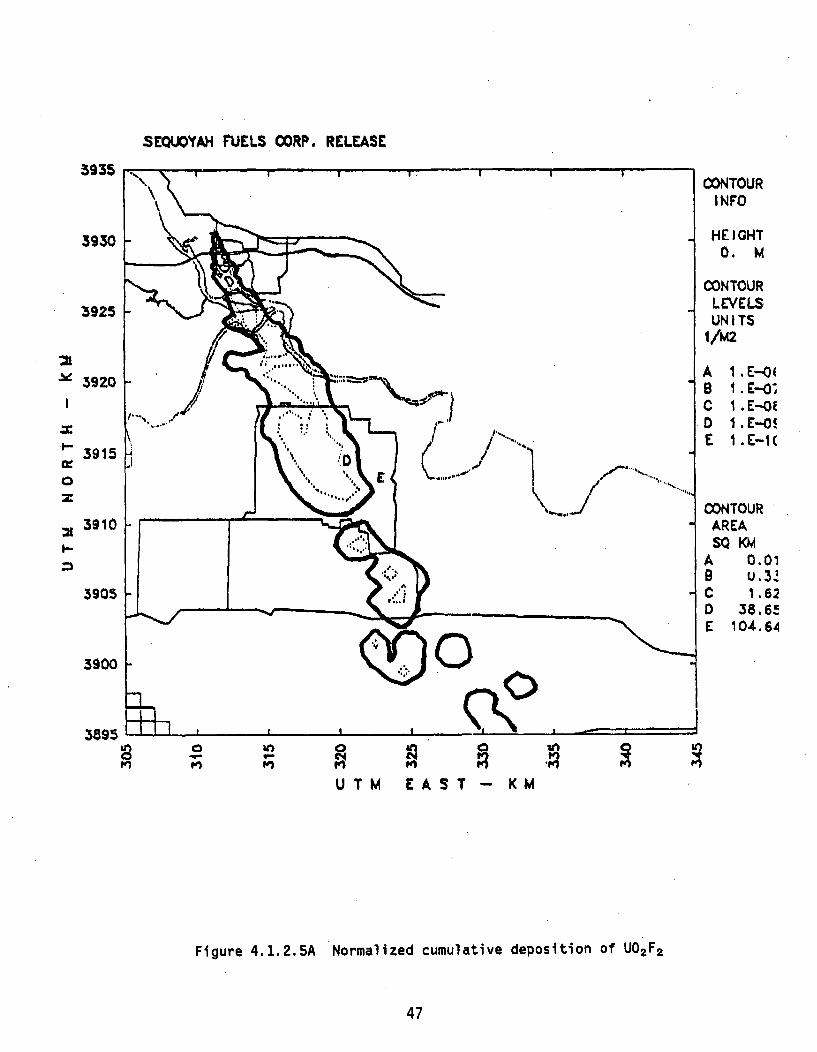
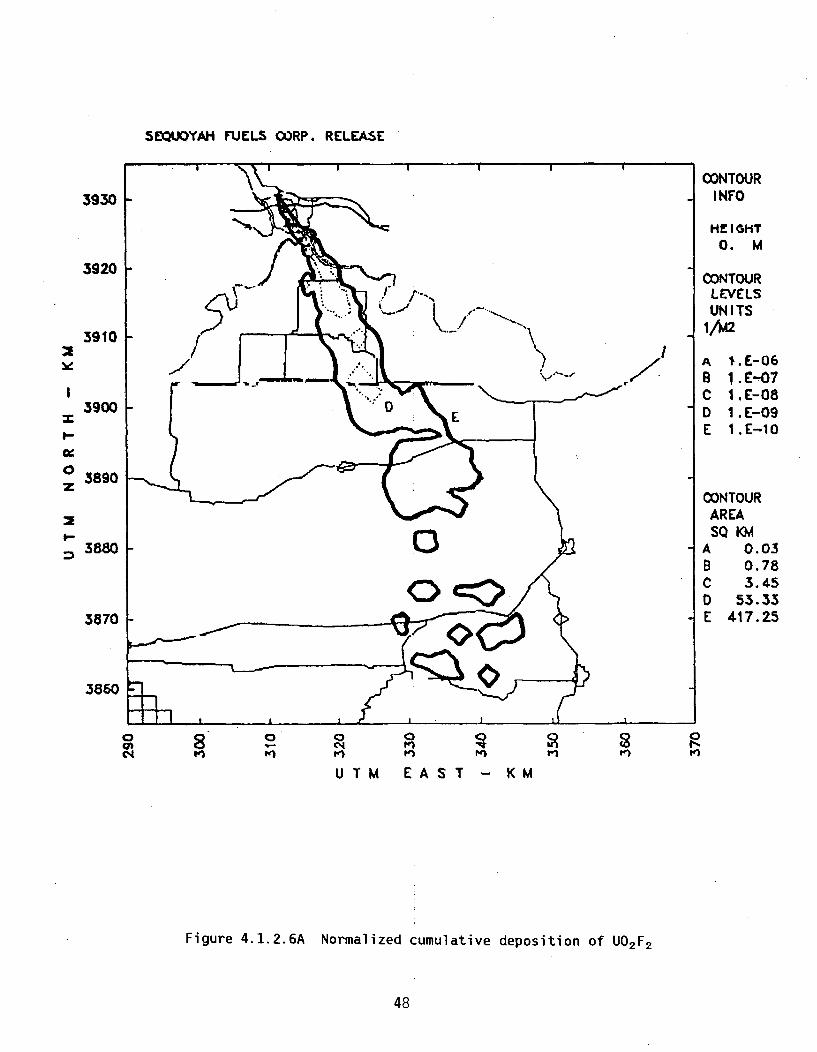
some combination of the results for both HF and U02 F2 must be used; the TaskForce chose to use the sum of 1,500 kg HF and 5,900 kg U02 F2 . Results in theform of normalized quantities deposited per square meter are also provided; thesame considerations apply. Figures 4.1.2.1A through 4.1.2.3A represent (inunits of seconds per cubic meter) the ARAC-simulated normalized air concentra-tions for uranyl fluoride integrated over the total time of passage of thecloud. Figures 4.1.2.4A through 4.1.2.6A present the simulated normalizedcumulative deposition (in units of inverse square meter). Figures 4.1.2.7Athrough 4.1.2.12A represent the same simulations for HF.
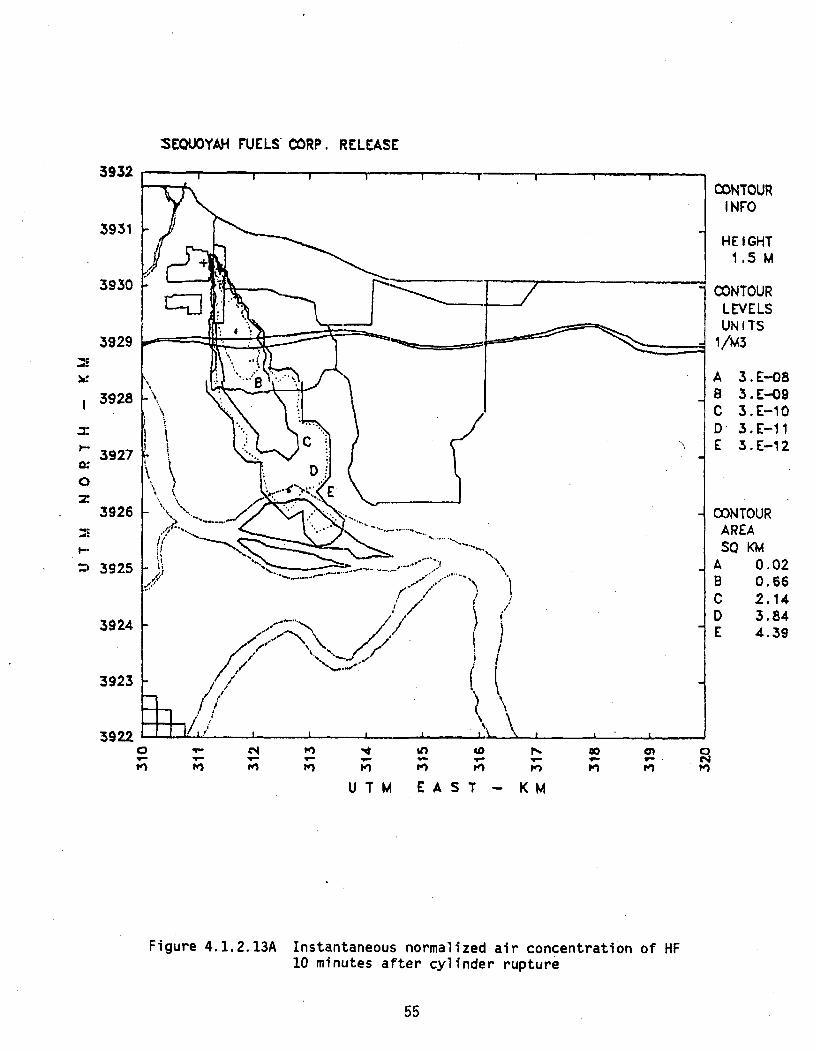
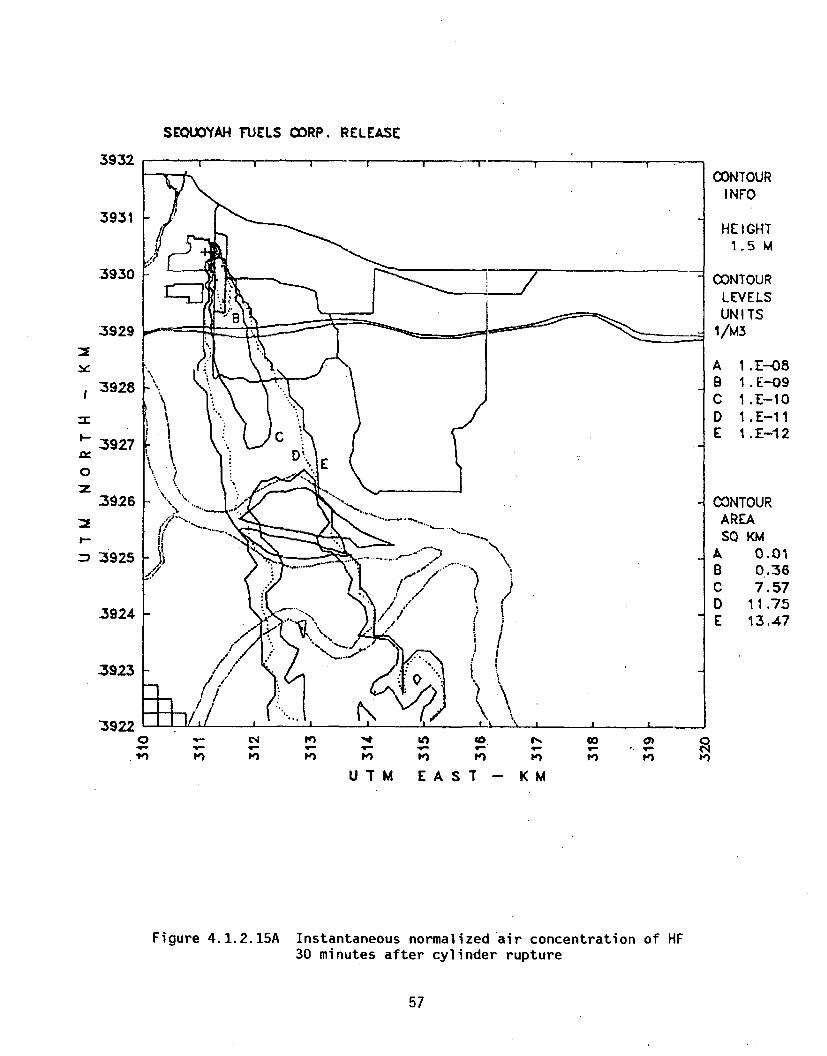
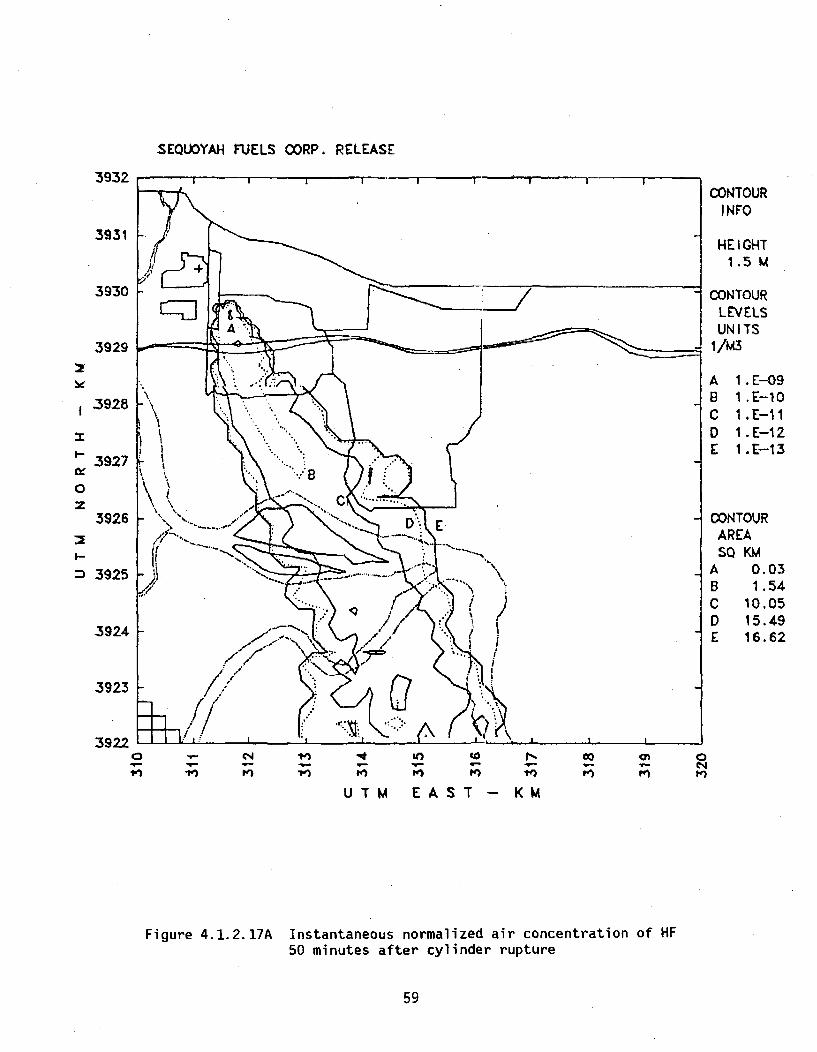
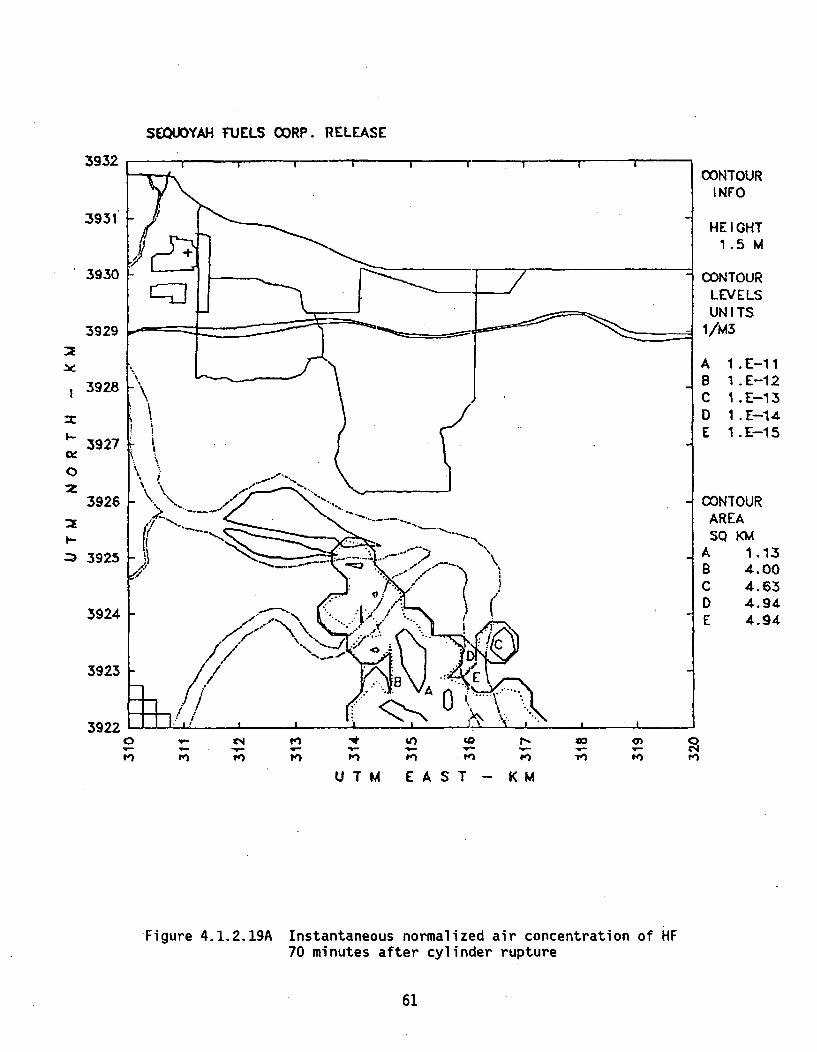
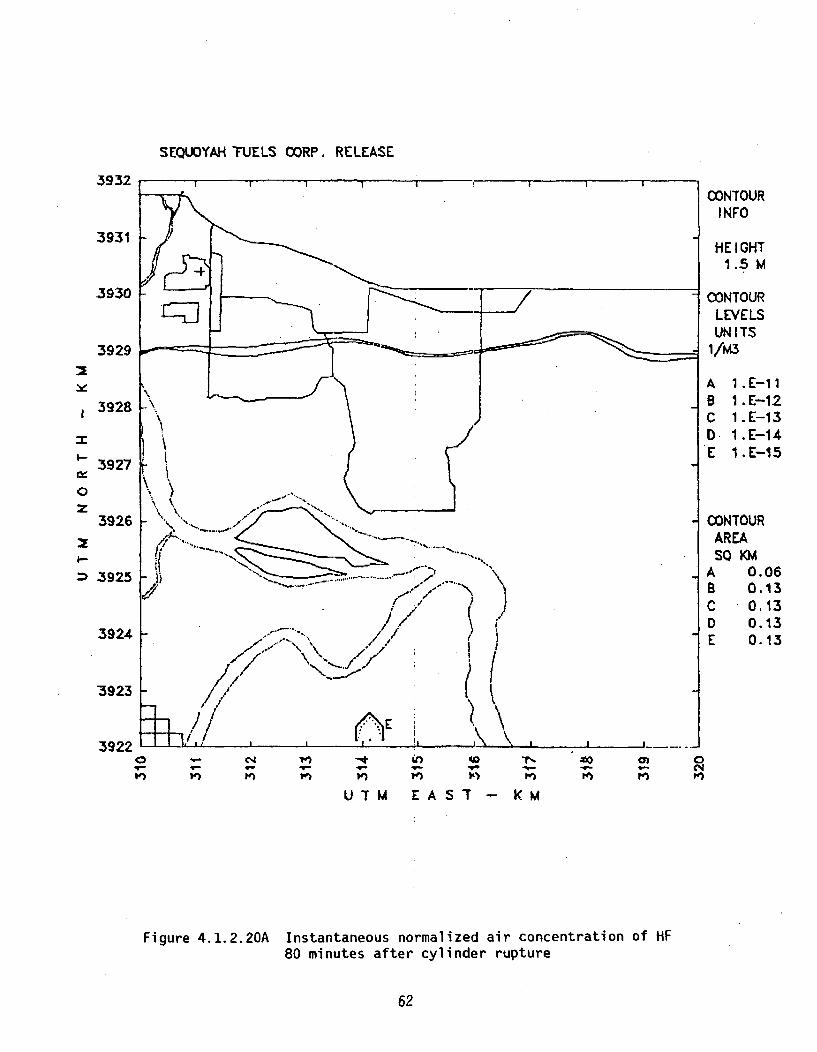
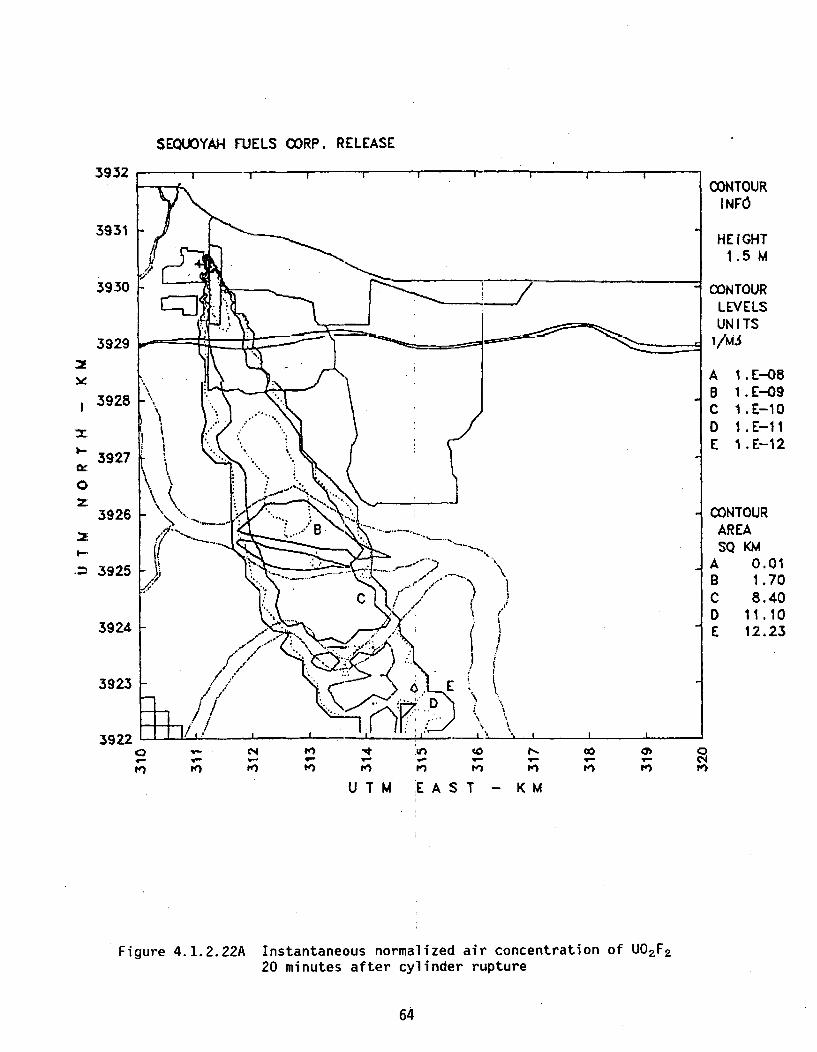
Figures 4.1.2.13A through 4.1.2.20A present contours of the simulatedinstantaneous normalized concentration of hydrogen fluoride at 10 minuteintervals; Figure 4.1.2.13A begins the sequence at 11:40 a.m. local time,10 minutes after the release began. The sequence illustrates the progressionof the cloud and its transport and diffusion downwind. Figures 4.1.2.21Athrough 4.1.2.27A are the corresponding series for uranyl fluoride until thewind has blown the airborne material off the grid.
In addition, LLNL-ARAC has provided numerical results at selected points. Pointsselected are residences and sample locations near residences in the cloud path,towns downwind, and an array of other points downwind to 72 km. Figures 4.1.2.28Aand 4.1.2.29A show the location of these points. The numerical values of theintegrated normalized air concentrations and normalized cumulative depositionsare presented in Tables 4.1.2.1A and 4.1.2.2A. Table 4.1.2.3A presents normalizedair concentrations approximating the peak 10-minute exposure period at selectedpoints in the affected area north of the Robert S. Kerr Reservoir.
4.1.2.2 Meteorology
Meteorological conditions in the vicinity of the site at the time of the accident,with strong, gusty winds generally from the north-northwest and clear skies,reflected the passage of a cold front through the area approximately 6 hoursearlier. At the time of the accident, onsite meteorological measurements indicatedwinds flowing from the north-northwest (resulting in transport to the south-southeast) at about 18 mph with gusts up to about 30 mph. Because of therelatively high wind speeds and somewhat unsteady wind direction, atmosphericstability was considered to be neutral (Pasquill type "D"), which is typical ofpost-cold-front situations. This is also supported by analysis of the temperaturestructure in the planetary boundary layer from the nearest atmospheric soundingstation at Monett, Missouri. Temperatures in the area were in the upper 40's('F) and relative humidity was approximately 40 percent.
There is no official National Weather Service station in the immediate plantvicinity. The nearest station having similar topographic and climatologicalcharacteristics as the plant site is at Fort Smith, Arkansas, approximately70 km (40 miles) east-southeast. The Sequoyah Fuels Corporation (SFC) maintainscontinuously recording wind speed and direction instrumentation at the plant.Although the onsite meteorological measurement system is located atop a sign onthe roof of the process building and would likely be affected by airflow overthe building and sign, the measurements at the time of the accident are consistentwith the synoptic weather pattern and other measurements and observations inthe region and, therefore, have been used for the assessments of atmospherictransport, diffusion, and deposition.
41
The general transport direction away from the site was south-southeast, whichis consistent with site and regional meteorological information. Near thefacility, plume transport probably was influenced by the presence of buildingsand initial release characteristics such as buoyancy and other release energetics.
Figure 4.1.2.30A is the surface weather map for Oklahoma and adjacent regionsfor 12:00 noon (18Z), Saturday, January 4, 1986, (from the U.S. Department ofCommerce, NOAA/NWS/NMC Washington). It shows, among other things, the winddirection in east-central Oklahoma, and the cold front which by then had movedout of Oklahoma. Figure 4.1.2.31A is the 850 millibar weather map of the areaat 6:00 a.m. (12Z), Saturday, January 4, 1986.
42
SEQUOYAH FUELS CORP. RELEASE
3932
3931
3930
3929
3928
P 39270vz
CONTOURI NFO
HEIGHT1.5 M
CONTOURLEVELSUNITS
S/M3
AB
DE
1 .E-04I .E-QO1 .E-0f51 E--071 .E-ý08
I--
3926
3925
CONTOURAREASO KM
A 0.018 0.24C 2.82D 12.09E 19.363924
3023
3922C
r)qe- 4-
I- I0 4-1~~
p.)I-t4.)
C
UTM EAST - KM
Figure 4.1.2.1A Integrated normalized air concentration of U02 F2
43
SEQUOYAH FUELS CORP. RELEASE
3935
:3930
-3925
-3920
.3915
0
CONTOURI NFO
HEIGHT1.5 M
CONTOURLEVELSUN ITS
SAA3
A I.E-048 1.E-05C 1•E-06D 1.E-07E 1.E-08
3910M-
OONTOURAREASO KM
A 0.00a 0.31C 3.13D 44.77E 169.86
3905
-3900
3895
U 0
UTM EAST
0pr)
r'
KM
Figure 4.1.2.2A Integrated normalized air concentration of U02 F2
44

SEQUOYAH FUELS CORP. RELEASE
3930
3920
CONTOURINFO
HEIGHT1.5 M
CONTOURLEVELSUN ITSs/A5
Z
3910
.5900
3890
3880
3870
3860
ABCDE
3. E-053. E-063. E-073. E-083. E--09
CONTOURAREASQ KM
A 0.098 2.05C 30.31D 190.56E 836.27
0
C,.'
04 4
(0I"-
UTM EAST KM
Figure 4.1.2.3A Integrated normalized air concentration of U02 F2
45
SEQUOYAH FUELS CORP. RELEASE
3932
3931
3930
3929
=:
- 3927
0z
CONTOURI NFO
HEIGHT0. M
CONTOURLEVELSUN ITS
1/M2
ABCDE
3.E-063, E-073. E-083. E-093. E-1O
2-
3926
3925
3923
3922
CONTOURAREASQ KM
A 0.00B 0.09C 0.600 .. 09E 7.68
0 *1~ 9oatq.
UTM EAST - KM
Figure 4.1.2.4A Normalized cumulative deposition of U02F2
46
SEQUOYAH FUELS CORP. RELEASE
3935
3930
3925
v 3970
'" 3915a2:
CONTOURINFO
HEIGHT0. M
CONTOURLEVELSUNITS
I/M2
AaCDE
1
11
E--O(
, E-1 O
3910I-.
CONTOURAREASQ KM
A 0.018 u.3.C 1.62D 38.6-E 104.64
3905
3900
38950
0 Inq
UTM EAST - KM
Figure 4.1.2.5A Normalized cumulative deposition of U02 F 2
47
SEQU=YAH FUELS CORP. RELEASE
3930
3920
3910
CONTOURINFO
HEIGHT
0. M
CONTOURLEVELSUNITS
3900
I-
3890Z
A
BCDE
I.E-061 . E-07I. E-081. E-09I .E-1O
D
3880
CONTOURAREASQ KM
A 0.03B 0.78C 3.45D 53.33E 417.253870
3860
0 0 0• a11
I..,
0F%.
UTM EAST - KM
Figure 4.1.2.6A Normalized cumulative deposition of U0 2 F 2
48
SE YAH FUELS CORP. RELEASE
3932
3931
3930
3929
CONTOURINFO
HEICHT1.5 M
CONTOURLEVELSUN ITS
s/M3
ABCDE
11I11
*E-04.E-05.E-06*E-07*E-08
3927
0z 3926
i--
D 3925
3924
3923
3922
CONTOURAREASQ Kym
A 0.01a 0.22C 2.56D 11.83E 18.42
o - q~j .,. 14')Go 0
C-1pq)
UTM EAST - KM
Figure 4.1.2.7A Integrated normalized air concentration of HF
49
SEQUOYAH FUELS CORP. RELEASE
3935
3930
3025
CONTOURI NFO
HEIGHT1.5 M
OONTOURLEVELSUN ITS
s/432
3920I
ABCDE
I E-04I .E-051 .E-06I .E-07I .E-08
0Z
:E
3915
3910
3905
3900
3895
CONTOURAREASQ KM
A 0.00a 0.32C 2.78D 43.45E 176.81
€0
UTM EAST - KM
ine•
Figure 4.1.2.8A Integrated normalized air concentration of HF
50

SEQUOYAH FUELS CORP. RELEASE
3930
3920
3910
CONTOURI NWO
HEIGHT1.5 M
CONTOURLEVELSUN ITS
S/'M3
A 3.--05B 3.E-06C 3.E-07D 3.E-08E 3. E-09
ha
0
I--
I.-)
3900
3090
3880
CONTOURAREASQ KM
/A 0.00
B 1.80C 30.06D 200.05E 804.503870
3860
0'-4
U0T-- 0E A T "
UTM EAST - KM
0 0tN
Figure 4.1.2.9A Integrated normalized air concentration of HF
51

SEQUOYAH FUELS CORP. RELEASE
3932
3931
3930
3929
3928
CONTOURINFO
HEIGHT0. M
CONTOURLEVELSUNITS1/M2
I
ABCDE
1. E-05I E-061 E-07I .E-081. E--09
3927
0-Z
3926
3925
3924
3923
CONTOURAREASQ KM
A 0.00B 0.02C 0.23D 1.05E 5.28
3922 L.0 C.14 'I) I,'V C0 0
UTM EAST - KM
Figure 4.1.2. IOA Normalized cumulative deposition of HF
52
SEQUOYAH FUELS CORP. RELEASE
3935
3930
3925
CONTOURINFO
HEIGHT0. M
CONTOURLEVELSUNITS
1IA2I
3920AB
DE
I. E-061 E-071 .E-08I E-09I . E-1-O
z
3915
0z
3910
I-
CONTOURAREASQ KM
A 0.02B 0.41C 1.71D 30.72, 107.54
3905
3900
3895
tn
U T'M EAST - KM
Figure 4.1.2.11A Normalized cumulative deposition of HF
53

SEQUOYAH FUELS CORP. RELEASE
3930
3920
3910
CONTOURINFO
HEIGHT0. M
CONTOURLEVELSUNITS1/kc
3900
-rI.-
.3890Z
3880
3870
3860
ABCDE
1 E--.061 E-07I E-081. E-09I .E-IO
CONTOURAREASQ KM
A 0.02a 0.78C 2.81D 56.22E 404.08
o 0 0uE4
U 'TM E A ST K KM
*,30(D 0
Figure 4.1.2.12A Normalized cumulative deposition of HF
54
SEQUOYAH FUELS CORP. RELEASE
3932
3931
3930
3929
3928
?" 3927
02:
CONTOURINFO
HEIGHT1.5 M
CONTOURLEVELSUNITS
ABCDE
3 . E-083 -E-093. E-1 03. E-1 13 -E-12
D-
3926
3925
3924
3923
3922
CONTOURAREASQ KM
A 0.02B 0.66C 2.14D 3.84E 4.39
0 &0 I.- V.- 0tn
UTM EAST - KM
Figure 4.1.2.13A Instantaneous normalized air concentration of HF10 minutes after cylinder rupture
55

SEQUOYAH FUELS CORP. RELEASE
3932
3931
3930
3929
3928
CONTOURI NFO
HEIGHT1.5 M
CONTOURLEVELSUNITS
1A13
I
ABCDE
1 E-08I E-09I .E-10I .E-1i
1 E-123927
0.'z
3926
3925
23924
3923
3922
CONTOURAREASQ KM
A 0.01B 1.43C 8.31D 11.69E 12.45
0t.q p..)
U T M EA S T - KM
0CJ
Figure 4.1.2.14A Instantaneous normalized air concentration of HF20 minutes after cylinder rupture
56
SEQUOYAH FUELS CORP. RELEASE
3932
3931
3930
3929
3928
CONTOURI NFO
HEIGHT1.5 M
CONTOURLEVELSUNITS
I/M3
:2
I
ABCDE
1 ---08I. E--091 .E-1O1 .E-111 .F-12
'- 3927
0
3926
S3925
-3924
3923
ý3922
CONTOURAREASQ KM
A 0.01B 0.36C 7.57D 11.75E 13.47
0 C4 It)'0?r'- 4- 0
UTl"M E A S T - KM
Figure 4.1.2.15A Instantaneous normalized air concentration of HF30 minutes after cylinder rupture
57

SEQUOYAH T"UELS CORP. RELEASE
3932
3931
3930
3929
"3928
39270
-3926
-:3925
3924
.3923
3922
CONTOURINFO
HEIGHT1.5 M
CONTOURLEVELSUNITS1/M3
A6CDE
1 .1--08I .1-09*1 .*-1O1 .£-111 .1•-12
CONTOURAREASQ KM
A 0.01B 0.22C 2.65D 10.21E 14.55
40 C 4 In'I-
ICqP,1 Pd)
10 0)Pd)
104tq
U I M EAST - K M
Figure 4.1.2.16A Instantaneous normalized air concentration of HF40 minutes after cylinder rupture
58
SEQUOYAH FUELS CORP. RELEASE
3932
3931
3930
3929
-3928
CONTOURI NFO
HE I GHT1.5 M
CONTOURLEVELSUNITS
1/M3
I
ABCDE
111I1
* E-09.E-1 0.E-1 1.E-1 2.E-1 3
.- 3927
0Z
3926
D 3925
-3924
3923
3922
CONTOURAREASO KM
A 0.03B 1.54C 10.05D 15.49E 16.62
0
r)1~)V.,
In toIf,
do 0if,
UTM EAST - KM
Figure 4.1.2.17A Instantaneous normalized air concentration of HF50 minutes after cylinder rupture
59

SEQUOYAH FUELS OORP. RELEASE
'3932
3931
-3930
:3929
23928
CONTOURINFO
HEIGHT1.5 M
CONTOURLEVELSUNITS
1/IM3
--2
I
ABCDE
3. E-1 13 . E-12
3. E-1 33. E-143. E-1 5
.- 3927
0z
3926
i--
D.3925
-3924
3923
3922
CONTOURAREASQ KM
A 1.69B 9.78C 11.84D 12.69E 12.88
o~C-4
U 7M E AS ' - K M
0C04te)
Figure 4.1.2.18A Instantaneous normalized air concentration of HF60 minutes after cylinder rupture
60
SEQUVYAH FUELS CORP. RELEASE
3932
3931
3930
3929
3928
CONTOURI NFO
HEIGHT1.5 M
CONTOURLEVELSUN ITS1/M3
A I.E-11B I.E-12C 1.E-13D 1.E-14E I.E-15
I
3927
3926
3925
3924
3923
3922
CONTOURAREASQ KM
A 1.13B 4.00C 4.63D 4.94E 4.94
0 v))
V.)
tvn
M 1 9-q e'
UTM EAST - KM
Figure 4.1.2.19A Instantaneous normalized air concentration of HF70 minutes after cylinder rupture
61
SEQUOYAH TUELS CORP. RELEASE
3932
3931
13930
3929
3928
CONTOURI NFO
HE I GHT1.5 M
CONTOURLEVELSUN ITSI/M3
I
ABCDE
1.E-1 11. E-121 .E-131 .E-14I .E-15
3927
0z
3926
3925
3924
3923
3922
CONTOURAREASQ KM
A 0.06a 0.13C 0.130 0.13E 0.13
0'I)"
en14)
0,) 0'.4
UT M E A S-T - KM
Figure 4.1.2.20A Instantaneous normalized air concentration of HF80 minutes after cylinder rupture
62

SEQUOYAH FUELS CORP. RELEASE
3932
3931
3930
3929
3928
CONTOURINFO
HE I GHT1.5 M
CONTOURLEVELSUN ITS
'Ad32
ABCDE
S. E-083. E-093. E-1O3.E-113. E-1 2
'- 3927
0z
3926
I--
: 3925
3924
3923
CONTOURAREASQ KM
A 0.00B 0.73C 2.29D 3.34E 4.25
39220C
U TM E AS T - K M
co 0c~JI-)
Figure 4.1.2.21A Instantaneous normalized air concentration of U02 F210 minutes after cylinder rupture
63
SEQUOYAH FUELS CORP. RELEASE
3932
3931
3930
3929
3928
CONTOURINF6
HEIGHT1.5 M
CONTOURLEVELSUNITS
1 /M3
2d
I
ABCDE
11111
*E-08*E-09.E-1 0
.E-12
'" 3927
0z
S,-.,
3926
3925
3924
3923
3922
CONTOURAREASQ KM
A 0.01B 1.70C 8.40D 11.10E 12.23
0 -
UTM EAST -
C40
KM
Figure 4.1.2.22A Instantaneous normalized air concentration of U02F1220 minutes after cylinder rupture
64

SEQUOYAH FUELS CORP. RELEASE
3932
3931
3930
3929
3928
CONTOURINFO
HE I GHT1.5M
CONTOURLEVELSUNITS1/M3
A 1. E--OkB I. E-0OC 1.E-1CD I.E-11E 1.E-I",
:2
I-
I-
3927
3926
3925
3924
3923
3922
CONTOURAREASQ KM
A 0.0'B O. 6C 7.2#o 11.5'E 13.1I
0 1"~ (%4-~ p*.
91- toineP) t0 Q) 0
UTM EAST - KM
Figure 4.1.2.23A Instantaneous normalized air concentration of U02 F230 minutes after cylinder rupture
65

SEQUOYAH FUELS CORP. RELEASE
3932
3931
3930
3929
3928
3927
0z
3q26
I--
- 3925
3924
3923
3922
CONTOURI NFO
HEIGHT1.5 M
CONTOURLEVELSUNITS
A8C0E
1 .E-081 . E-091 ,E-1O1 .E-11I .F-12
CONTOURAREASQ KM
A 0.01B 0.21C 3.41D 10.21E 14.02
0 NI-
?4~)
9-) 10t--
0) 0N9~)
UT M EAST - KM
IFigure 4.1.2.24A Instantaneous normalized air concentration of U02 F240 minutes after cylinder rupture
66

SEQUOYAH FUELS CORP. RELEASE
3932
3931
3930
3929
3928
CONTOURINFO
HE I GHT1.5 M
CONTOURLEVELSUN I TS
I
A
D
E
1111
. E-09
.E-10
.E-11* E-1 2.E-13
." 3927
0Z
3926
i-.
3925
3924
3923
.3922
CONTOURAREASoQ*
A 0.06B 1.48C 9.82D 14.99E 16.21
09- F
U T
E A S T KM
0cpI
Figure 4.1.2.25A Instantaneous normalized air concentration of U02 F250 minutes after cylinder rupture
67

SEQUOYAH FUELS CORP. RELEASE
02:
I-
3932
3931
3930
3929
3928
3927
3926
3925
3924
3923
3922
ABCDE
3.E-113.E-123.E-133. E-143.E-15
CONTOURI NFO
HEIGHT1.5 M
CONTOURLEVELSUN ITS
1/M3
CONTOURAREASQ KM
A 2.06B 10.03C 13.17D 14.34E 14.44
03,I--
(0 N 00U--) T -M, E' A ST - K
U TMI E A ST - KM
04143
Figure 4.1.2.26A Instantaneous normalized air concentration of U02 F260 minutes after cylinder rupture
68
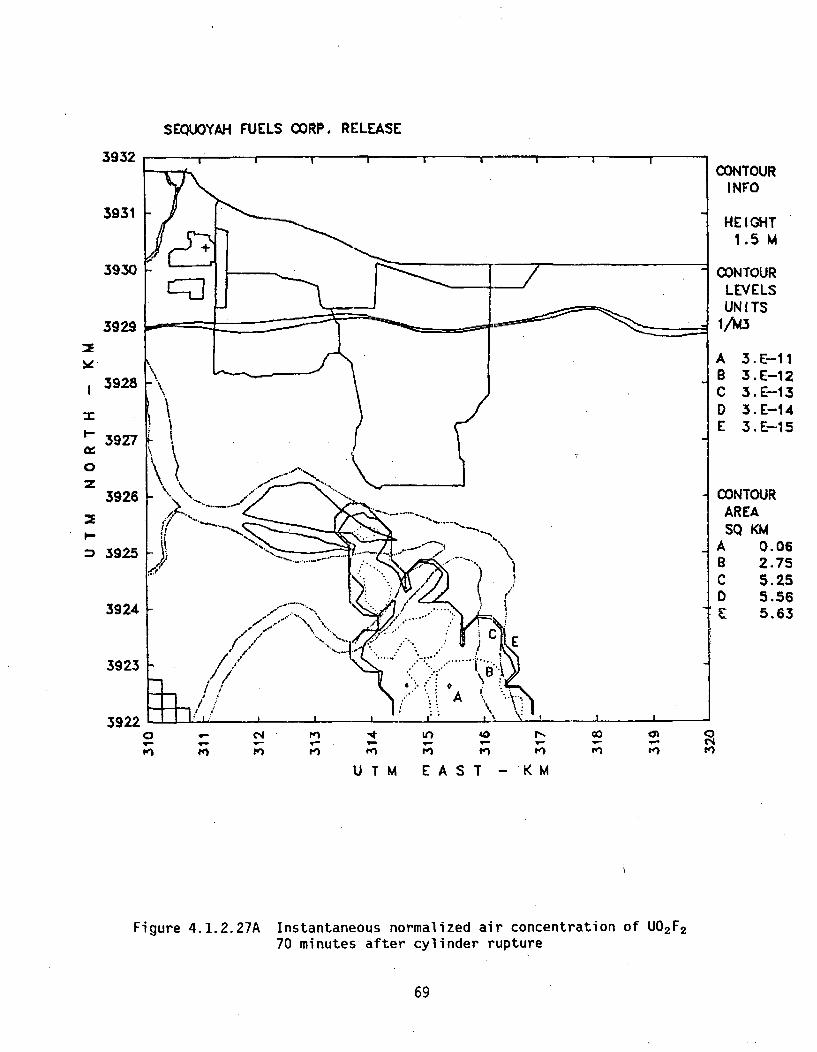
SEQUOYAH FUELS CORP. RELEASE
3932
3931
3930
3929
3928
CONTOURI NFO
HEIGHT1.5 M
CONTOURLEVELSUN ITS
1/M3
I2 ABCD
3. E-1 13.-E-1 23. E-1 33. E-1 43. E-1 5
~39Z7
0Z
I-
3926
3925
3924
3923
3922
CONTOURAREASQ KM
A 0.068 2.75C 5.25D 5.56E 5.63
0 C14
K.)
",,t ut) '-, i,,
UTM EAST - KM
Figure 4. 1. 2. 27A Instantaneous normalized air concentration of U02 F270 minutes after cylinder rupture
69

SEQUOYAH FUELS CORP. RELEASE
2
I.-
0
z
D-
3932
3931
3930
3929
3928
3927
3926
3925
3924
3923
3922c-I u•
e•0)
C
U T M . E A S T - K M
Figure 4.1.2.28A Locations, to 8 km downwind, of points for whichnumerical concentrations were calculated
70

3930
3920
3910
I
0
z
3900
3890
TIMN
TIIN
TION
T9N
T8N
T7N
T6N
T5N
3880
5870
3860
0) 0 0t.%4'El
0tPl 1") :2 0)
'")
UTM EAST - KM
Figure 4.1.2.29A Locations, to 72 km downwind, of points for whichnumerical concentrations were calculated
71
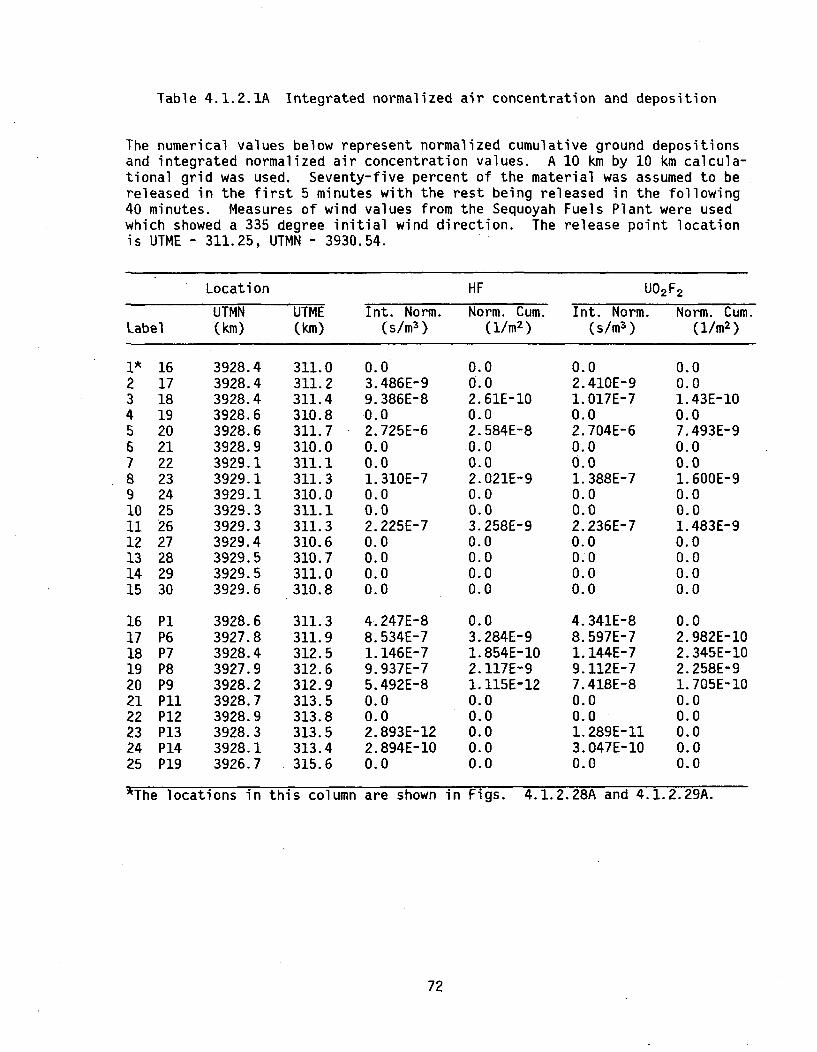
Table 4.1.2.1A Integrated normalized air concentration and deposition
The numerical values below represent normalized cumulative ground depositionsand integrated normalized air concentration values. A 10 km by 10 km calcula-tional grid was used. Seventy-five percent of the material was assumed to bereleased in the first 5 minutes with the rest being released in the following40 minutes. Measures of wind values from the Sequoyah Fuels Plant were usedwhich showed a 335 degree initial wind direction. The release point locationis UTME - 311.25, UTMN - 3930.54.
Location HF U02 F2
UTMN UTME Int. Norm. Norm. Cum. Int. Norm. Norm. Cum.Label (kin) (kin) (s/m 3 ) (1/m 2 ) (s/m 3 ) (1/m 2 )
1* 16 3928.4 311.0 0.0 0.0 0.0 0.02 17 3928.4 311.2 3.486E-9 0.0 2.410E-9 0.03 18 3928.4 311.4 9.386E-8 2.61E-10 1.017E-7 1.43E-104 19 3928.6 310.8 0.0 0.0 0.0 0.05 20 3928.6 311.7 2.725E-6 2.584E-8 2.704E-6 7.493E-96 21 3928.9 310.0 0.0 0.0 0.0 0.07 22 3929.1 311.1 0.0 0.0 0.0 0.08 23 3929.1 311.3 1.310E-7 2.021E-9 1.388E-7 1.600E-99 24 3929.1 310.0 0.0 0.0 0.0 0.010 25 3929.3 311.1 0.0 0.0 0.0 0.011 26 3929.3 311.3 2.225E-7 3.258E-9 2.236E-7 1.483E-912 27 3929.4 310.6 0.0 0.0 0.0 0.013 28 3929.5 310.7 0.0 0.0 0.0 0.014 29 3929.5 311.0 0.0 0.0 0.0 0.015 30 3929.6 310.8 0.0 0.0 0.0 0.0
16 P1 3928.6 311.3 4.247E-8 0.0 4.341E-8 0.017 P6 3927.8 311.9 8.534E-7 3.284E-9 8.597E-7 2.982E-1018 P7 3928.4 312.5 1.146E-7 1.854E-10 1.144E-7 2.345E-1019 P8 3927.9 312.6 9.937E-7 2.117E-9 9.112E-7 2.258E-920 P9 3928.2 312.9 5.492E-8 1.115E-12 7.418E-8 1.705E-1021 P11 3928.7 313.5 0.0 0.0 0.0 0.022 P12 3928.9 313.8 0.0 0.0 0.0 0.023 P13 3928.3 313.5 2.893E-12 0.0 1.289E-11 0.024 P14 3928.1 313.4 2.894E-10 0.0 3.047E-10 0.025 P19 3926.7 315.6 0.0 0.0 0.0 0.0
3The locations in this column are shown in Figs. 4.1.2.28A and 4.1.2.29A.
72
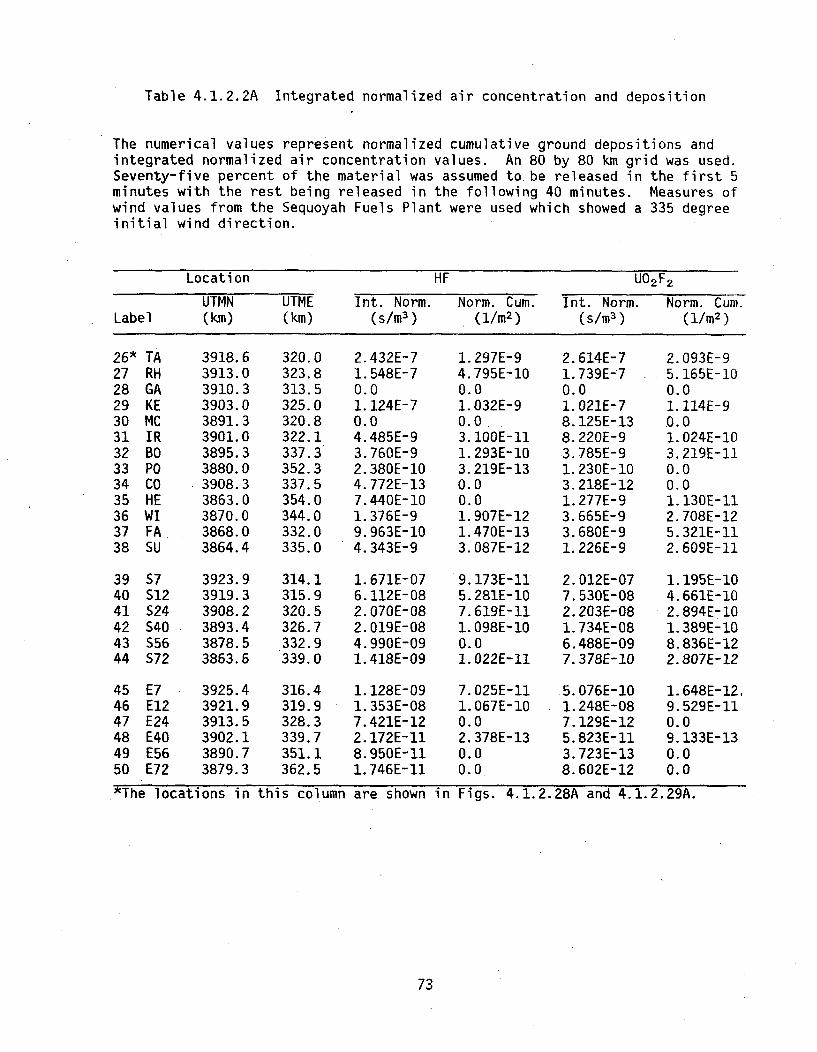
Table 4.1.2.2A Integrated normalized air concentration and deposition
The numerical values represent normalized cumulative ground depositions andintegrated normalized air concentration values. An 80 by 80 km grid was used.Seventy-five percent of the material was assumed to be released in the first 5minutes with the rest being released in the following 40 minutes. Measures ofwind values from the Sequoyah Fuels Plant were used which showed a 335 degreeinitial wind direction.
Location HF U02 F2
UTMN UTME Int. Norm. Norm. Cum. Int. Norm. Norm. Cum.Label (km) (km) (s/m 3 ) (1/m 2 ) (s/m 3 ) (1/m 2 )
26* TA 3918.6 320.0 2.432E-7 1.297E-9 2.614E-7 2.093E-927 RH 3913.0 323.8 1.548E-7 4.795E-10 1.739E-7 5.165E-1028 GA 3910.3 313.5 0.0 0.0 0.0 0.029 KE 3903.0 325.0 1.124E-7 1.032E-9 1.021E-7 1.114E-930 MC 3891.3 320.8 0.0 0.0 , 8.125E-13 0.031 IR 3901.0 322.1 4.485E-9 3.100E-11 8.220E-9 1.024E-1032 BO 3895.3 337.3 3.760E-9 1.293E-10 3.785E-9 3.219E-1133 PO 3880.0 352.3 2.380E-10 3.219E-13 1.230E-10 0.034 CO 3908.3 337.5 4.772E-13 0.0 3.218E-12 0.035 HE 3863.0 354.0 7.440E-10 0.0 1.277E-9 1.130E-1136 WI 3870.0 344.0 1.376E-9 1.907E-12 3.665E-9 2.708E-1237 FA 3868.0 332.0 9.963E-10 1.470E-13 3.680E-9 5.321E-1138 SU 3864.4 335.0 4.343E-9 3.087E-12 1.226E-9 2.609E-11
39 S7 3923.9 314.1 1.671E-07 9.173E-11 2.012E-07 1.195E-1040 S12 3919.3 315.9 6.112E-08 5.281E-10 7.530E-08 4.661E-1041 S24 3908.2 320.5 2.070E-08 7.619E-11 2.203E-08 2.894E-1042 S40 3893.4 326.7 2.019E-08 1.098E-10 1.734E-08 1.389E-1043 S56 3878.5 332.9 4.990E-09 0.0 6.488E-09 8.836E-1244 S72 3863.6 339.0 1.418E-09 1.022E-11 7.378E-10 2.807E-12
45 E7 3925.4 316.4 1.128E-09 7.025E-11 5.076E-10 1.648E-12,46 E12 3921.9 319.9 1.353E-08 1.067E-10 1.248E-08 9.529E-1147 E24 3913.5 328.3 7.421E-12 0.0 7.129E-12 0.048 E40 3902.1 339.7 2.172E-11 2.378E-13 5.823E-11 9.133E-1349 E56 3890.7 351.1 8.950E-11 0.0 3.723E-13 0.050 E72 3879.3 362.5 1.746E-11 0.0 8.602E-12 0.0*The locations in this column are shown in Figs. 4.1.2.28A and 4.1.2.29A.
73

Table 4.1.2.3A Normalized peak air concentrations
LocationNormalized
Air Concentration ApproximatingPeak 10-Minute Period (1/m 3 )
U02 F2 HF
2 1.9 x 10⁻¹² 5.3 x 10-123 4.2 x 10⁻¹¹ 5.4 x 10-115 1.5 x 10⁻⁹ 1.6 x 10-98 1.0 x 10⁻¹⁰ 1.3 x 10⁻¹⁰
11 3.0 x 10⁻¹⁰ 1.4 x 10⁻¹°16 1.8 x 10⁻¹¹ 4.3 x I0- 117 4.0 x I0-1° 4.9 x 10-1018 1.0 x 10⁻¹⁰ 1.1 x 10-1019 5.0 x 10⁻¹⁰ 7.0 x 10-1020 2.2 x 10⁻¹¹ 2.6 x 10-1124 5.2 x 10⁻¹³
Locations 2 through 11 are sampling points.Locations 16, 17, 18, 19, 20 and 24 correspond respectively
to residence locations 1, 6, 7, 8, 9 and 14 on,Figure 4.1.3.1.
74
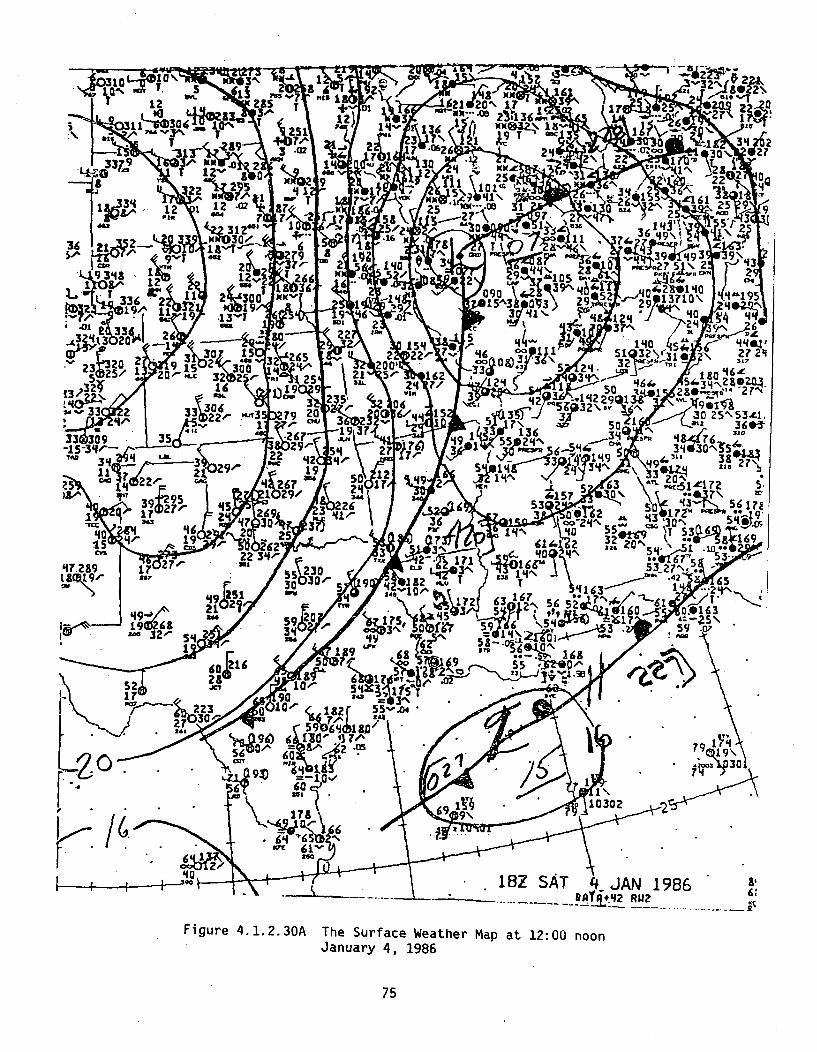
a6 2,
31 L- Pfl.3W.
" 3G\ .L"
33 "to 1 x 4%°
126162 1? ,3 +- - -2-+,
t o 1 2 3 - xl J O 1 7 2 5 ., 2,+PN. 01 a. 1 13*2ý27
T% -24%39 4. ý T .£ 1 L9 T 2. c 34
" -313- 3"" ?-OW2 30 2
96 T .21 3.0 .1 2\ ZZ.62
337ý9 kK ~.0 2L3 I
12 102 x. -.
,,,1+G5 1 2 25,.•.
0+ "7 r-, 59& ss,- T. ."Z5 'CU 312- 1 o m
KKOga5 .16 s 36 ,vlC
* 342 8. 126 T N1 , ?
_+As?- 2 243r"
lq 4lq : -5 .a Q? 5,\ 2
134 Tx11 26 2A, 1P2.
&A° 2 " a" 1S 36 3" 4- '
25"sq T~~ '~ p41 ; q 183760\
. ? , ~ )0 ~~ 8 . 3
19a 59 19 !"ýrAi2 ql 3ý
9--Z SAT JAN 1986
Figure 4.1.2.30A The Surface Weather Map at 12:00 noonJanuary 4, 1986
75

1 ~~-1d. 394
1 #06 11
-as .' -o 5 8 o# 9 ' )f~
12 LFN.. 78~ ~ ~ -0#005q
2 E5a USD-Ll CODE
V'f3 .~ 50M ANAYSI ~ HS/ PERAURE12Z AT JAN86w
Figure 4.1.2.31A The 850 Millibar Weather Map at 6:00 a.m, January 4, 1986
APPENDIX 4.1.4.2
SFC'S INVESTIGATION REPORT OF THE EFFECTS ON CATTLE ANDANIMALS IN THE POTENTIALLY AFFECTED AREAS AFTER THE ACCIDENT
77

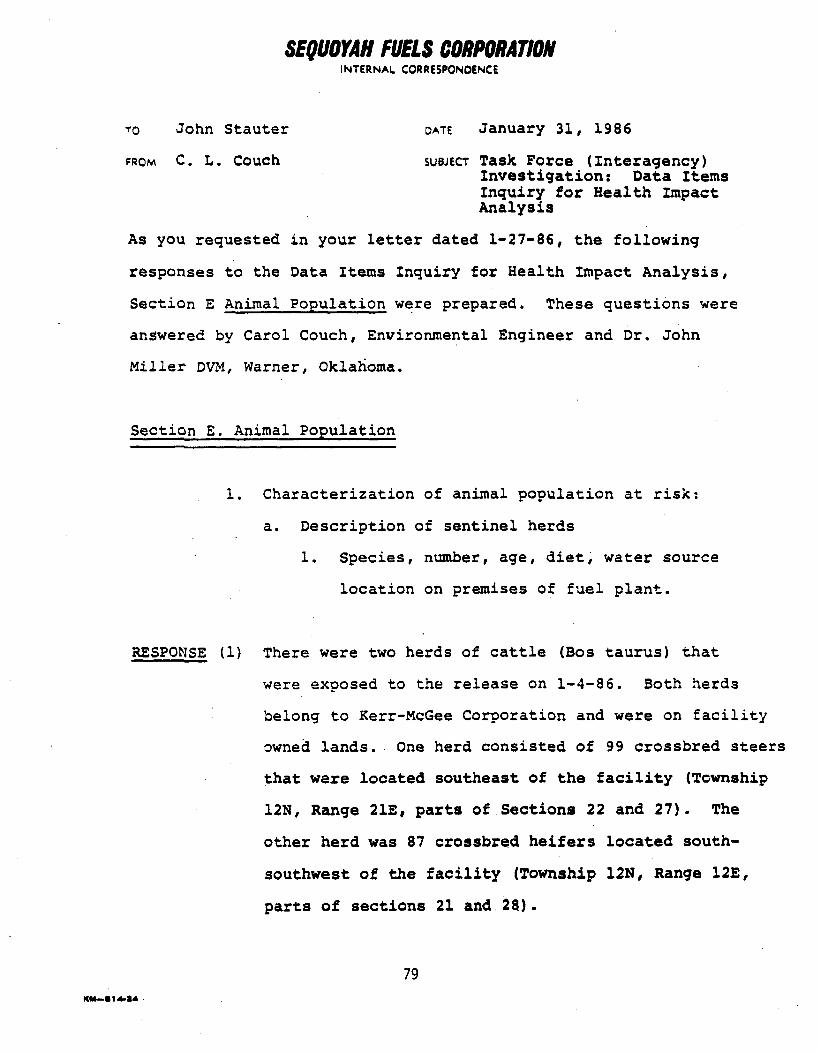
SEQUOYAH FUELS CORPORATIONINTERNAL CORRESPONOENCE
• John Stauter DATE January 31, 1986
FROM C. L. Couch SUBJECT Task Force (Interagency)Investigation: Data ItemsInquiry for Health ImpactAnalysis
As you requested in your letter dated 1-27-86, the following
responses to the Data Items Inquiry for Health Impact Analysis,
Section E Animal Population were prepared. These questions were
answered by Carol Couch, Environmental Engineer and Dr. John
Miller DVM, Warner, Oklahoma.
Section E. Animal Population
1. Characterization of animal population at risk:
a. Description of sentinel herds
1. Species, number, age, diet, water source
location on premises of fuel plant.
RESPONSE (1) There were two herds of cattle (Bos taurus) that
were exposed to the release on 1-4-86. Both herds
belong to Kerr-McGee Corporation and were on facility
owned lands. One herd consisted of 99 crossbred steers
that were located southeast of the facility (Township
12N, Range 21E, parts of Sections 22 and 27). The
other herd was 87 crossbred heifers located south-
southwest of the facility (Township 12N, Range 12E,
parts of sections 21 and. 28).
79Km-- i -da
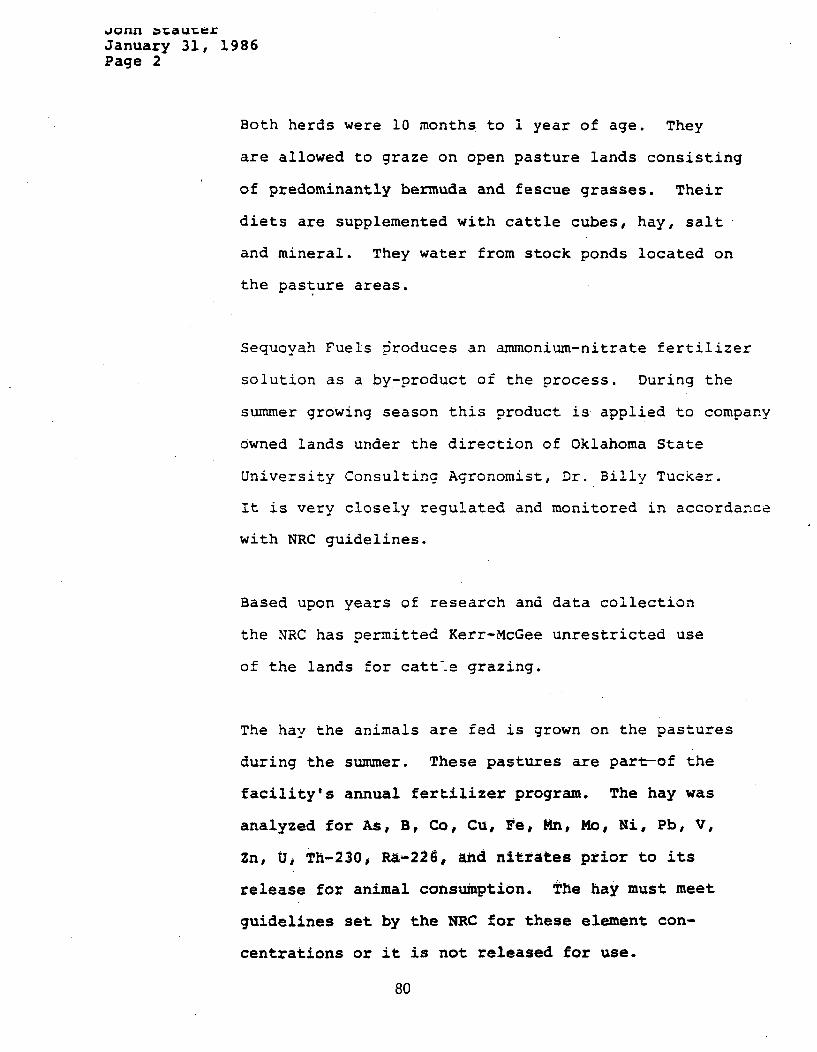
Jioanf .1taurerJanuary 31, 1986Page 2
Both herds were 10 months to 1 year of age. They
are allowed to graze on open pasture lands consisting
of predominantly bermuda and fescue grasses. Their
diets are supplemented with cattle cubes, hay, salt
and mineral. They water from stock ponds located on
the pasture areas.
Sequoyah Fuels produces an ammonium-nitrate fertilizer
solution as a by-product of the process. During the
summer growing season this product is applied to company
owned lands under the direction of Oklahoma State
University Consulting Agronomist, Dr. Billy Tucker.
It is very closely regulated and monitored in accordance
with NRC guidelines.
Based upon years of research and data collection
the NRC has permitted Kerr-McGee unrestricted use
of the lands for catt½e grazing.
The hay the animals are fed is grown on the pastures
during the summer. These pastures are part-of the
facility's annual fertilizer program. The hay was
analyzed for As, B, Co, Cu, Fe, Mn, Mo, Ni, Pb, V,
Zn, U, Th-230, Ra-226, and nitrates prior to its
release for animal consumption. The hay must meet
guidelines set by the NRC for these element con-
centrations or it is not released for use.
80
John StauterJanuary 31, 1986Page 3
Stock ponds in these pasture areas are monitored
for N, As, Cu, Mo, Pb, Se, gross alpha, Ra-226s,
Ra-226i, and U-238 as has been directed by the NRC
to meet compliance of the annual fertilizer program.
QUESTION (2)
RESPONSE (2)
Is there a regular health monitoring program for
these animals that is supervised by a veterinarian?
If so, what information is available regarding base-
line health status?
No. The ranch manager takes care of any immunization
and regular herd health maintenance. If something
should develop that he does not feel he can adequately
handle a veterinarian is called.
There is not any baseline data on the herd. However
they were received at the facility in good health
and are growing and gaining weight very well.
QUESTICN (3)
RESPONSE (3)
Are blood, urine, or tissue specimens collected and
analyzed on a regular basis? If so, what are base-
line fluoride levels in the animals?
No. The facility has very little if any effect on
the surrounding environment. All facility discharges
are well below standards set by the State, EPA, and
NRC. There has not been any need prior, to the
81

John StauterJanuary 31, 1986Page 4
QUESTION (4) Current status of the herds.
RESPONSE (4) Dr. John Miller DVM, has monitored the herds since
1-6-86. He feels that they are in good general
physical health.
Urine samples were taken from 56 steers on 1/6-7/86.
These samples were analyzed for uranium and fluoride.
Analysis results are given in Item 1. Dr. Miller
checked temperatures, eyes, nose, and mouth areas
looking for any evidence of HF acid irritation,
or toxin symptoms. Temperatures were normal.
Their eyes did not show anything that would be
acid related. There was not any excess mucus
or lesions of the nose or mouth which would in-
dicate a toxin. Their general health looked good.
The steers were held in a holding pen out of the
plume area to prohibit any further contamination.
However, two steers were lost due to the close
confinenfewrt. Dr. Miller conducted necropsys on
the two animals and found them to be stressed toro4e
death. The other steers "*esd" them to death.
This is common when strange cattle are introduced
to a herd. (See Item 7)
The heifers were moved to an area well to the
west of the plume path. Urine samples were taken
82
John StauterJanuary 31, 1986Page 5
from 12 of these animals on the 1-7-86. Dr. Miller
examined the herd and found them to have normal
temperature, no eye irritation or excessive mucus of
the nose or mouth.
Heifer No. 320 was found dead on 1-15-86. Dr.
Miller conducted a necropsy on the animal and
determined the cause of death to be -=. The
heifer's diet had been changed using her to
-. herself. (See Item 8)
Analysis of the heifers are attached in Item 2.
There was one horse in the same area as the steers.
This anLmal was checked on 1-7-86. His physical
condition was fine. His lungs were clear, heart rate
and temperature was normal, there was not any signs
of irritation of the eyes or exposed skin. A urine
samle was taken. (Results are given in Item 3.)
further testing of this animal was not warranted.
The 11 heifers are being resampled weekly. Dr.
Miller is checking the animals on a weekly basis.
Twenty of the steers were selected for weekly
testing. Dr. Miller is also keeping a watch on
these animals. Testing of the urine for uranium
and fluoride will continue until the levels have
83
John StauterJanuary 31, 1986Page 6
dropped to those of area control cattle. The
remaining animals have been returned to their
respective pastures. The test animals are being
held in separate pastures to allow ease of testing.
The ranch manager does a daily check on all the
animals and does a count to assure all the animals
are accounted for and are in good health.
Dr. John Miller feels the herd are in good general
health. They have some very common herd problems
such as ringworms, one case of rot foot, lice rub,
watering of the eyes from hay and dust. However,
none of these problems are abnormal to any herd
in the area. Dr. Miller has not found any illnesses
that have been a result of the release. His comments
are given in Item 5. Dr. Billy Tucker, OSU consultant,
evaluated the urine data, his comments are atta' :bed.
(See 7tem 6)
TOPIC (b) Description of domestic animal population in area
surrounding the fuel plant:
QUESTION 1) Species, number, location of livestock, parti-
cularly range or pasture animals.
RESPONSE (1) The response to the inquiry is only an estimation.
To be able to be specific a survey would need to
be conducted.
84
John StauterJanuary 31, 1986Page 7
Typical domestic animals in the area would be as
follows: dogs, Canis familearis; cats, Felis catus;
horses, Equus przewalski; cattle, Bos tauras. There
could be some swine (Sus) and possibly some goats
(Capra aegagrus) in the area.
After the release on 1-4-86 herds of animals south
of the facility, that could have had exposure to the
release were surveyed. Also as persons, even those
well out of the plume area, requested visits were
made to their farms to check their animals. Item 4
is a summary of these off-site visits and the results
of this investigation.
TOPIC
RESPONSE
TOPIC
QUESTION
(c) Description of wild animal population in area:
1) Species, number, location.
2) Fish ponds in area or other sport or commercial
fishing.
This is not a question that personnel at the facility
or Dr. John Miller are qualified to answer. The State
Fish and Wildlife Department should have this in-
formation.
(2) Estimation of dose to animals:
a) Have the sentinel herds been monitored since the
incident for signs of illness? If so, describe
illnesses.85

John StauterJanuary 31, 1986Page 8
RESPONSE (a)
QUESTION (b)
RESPONSE (b)
Yes. The ranch manager checks the herds daily and
Dr. Miller checks the animals weekly. There have
been no signs of illnesses that could or are related
to the release.
Have any blood, urine, or tissue samples been
collected from the sentinel herds since the
incident? If so, what tissues were collected,
what are the results of any analysis that have
been done, and are any of these tissues still
available? Slaughter and necropsy of sentinel
herd animals would not be appropriate.
Urine samples on 20 steers and 10 heifers are
being collected weekly and this will continue
until results fall within the range of control
animals (See Item 4). The urine is being
analyzed for uranium and fluoride.
No tissue was or is being collected.
What are the results of the survey of local
veterinarians to determine if there have been
any illnesses in livestock or pot animals that
could be due to plume exposure? Provide a de-
scription of species affected illnesses seen,
and location of animals in relation to fuel plant.
QUESTION (c)
86
John StauterJanuary 31, 1986Page 9
Provide the results of any milk samples collected.
Provide the results of any analysis of any milk
samples collected.
RESPONSE (c) Dr. John Miller has talked with Dr. Cindy Carter
DVM, Gore, and she has not had any reported ill-
nesses. Dr. Miller also visited with Dr. Gary Cox, DVM,
Sallisaw'. Dr. Cox had looked at some of resident 5R's
swine and told him it was his opinion that the
animals had swine dysentery and parasites. Dr. Cox
did not feel the swine were ill as a result of the
release. Dr. Cox did not report any other cases or
illnesses.
Dr. Miller has responded to all the suspect cases
,that have been brought to the attention of the
company. Dr. Miller has not found any illnesses
that were a result of plume exposure.
The following types of domestic animals have been
observed or examined and none have shown any
illnesses as a result of the release:
Cattle (steers, heifers, cows, bulls), horses
(gelding and mares) goats, swine, ducks, geese,
rabbits, dogs, and cats. The location of these
animals ranged from the facility sight to 15 miles
southeast of the facility.
87
John StauterJanuary 31, 1986Page 10
No milk samples have been collected.
QUESTION (d)
RESPONSE (d)
QUESTION (e)
Has the State Fish and Wildlife Service surveyed
wild animal populations near the plant to determine
if there have been increases in illnesses or deaths?
Have there been reports of fish die-off in the re-
servoir or the rivers near the plant?
This question should be addressed to the appropriate
State agencies. But, to our knowledge the answers to
the above questions are no.
What steps have been enacted to control the move-
ment of livestock and poultry in and out of or
within (quarantine) the contaminated area.
There is not nor is there any need for a quarantine
of the area. The orly animals that have shown any
contamination are the animals on the plant site
that belong to Kerr-McGee and they are being
monitored. They are showing no signs of illness.
Off-site investigation of animals has not indicated
any contamination or any plume related illnesses.
RESPONSE (e)
CLC: dd
88
Attachments
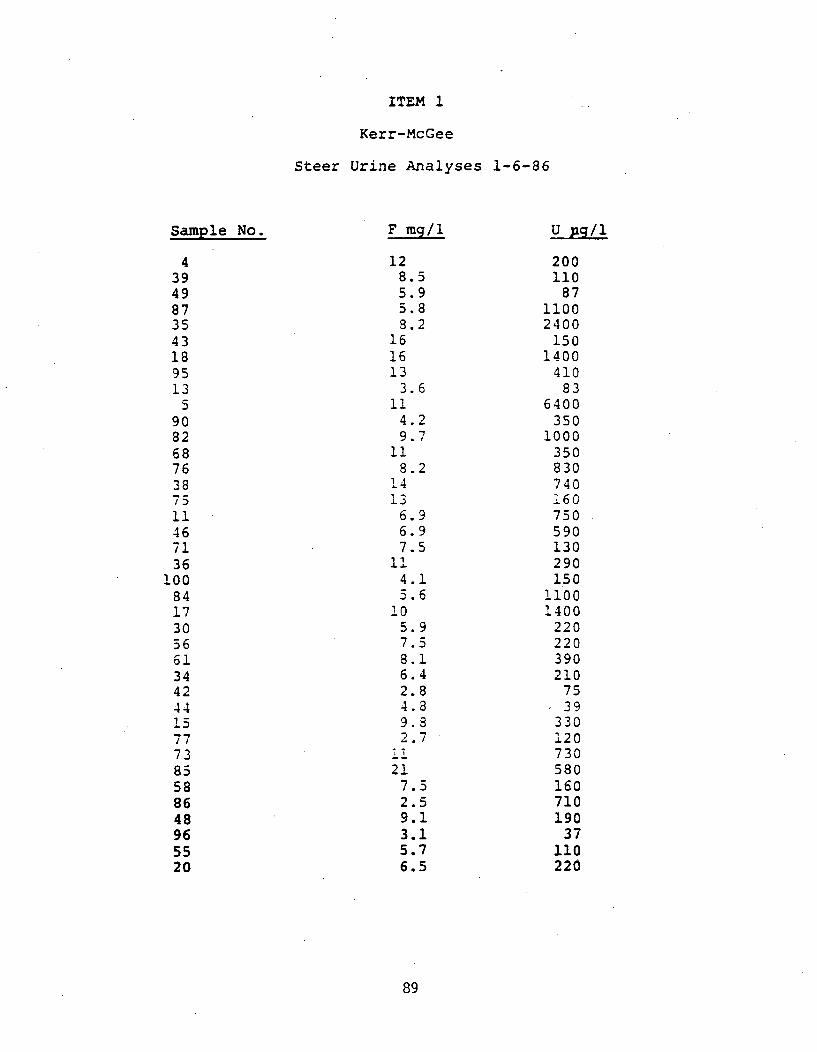
ITEM 1
Kerr-McGee
Steer Urine Analyses 1-6-86
Sample No. F mg/l U pg/1
4 12 20039 8.5 11049 5.9 8787 5.8 110035 8.2 240043 16 15018 16 140095 13 41013 3.6 83
5 11 640090 4.2 35082 9.7 100068 11 35076 8.2 83038 14 74075 13 16011 6.9 75046 6.9 59071 7.5 13036 11 290
100 4.1 15084 5.6 110017 10 140030 5.9 22056 7.5 22061 8.1 39034 6.4 21042 2.8 7544 4.8 3915 9.8 33077 2.7 'L2073 1. 73085 21 58058 7.5 16086 2.5 71048 9.1 19096 3.1 3755 5.7 11020 6.5 220
89
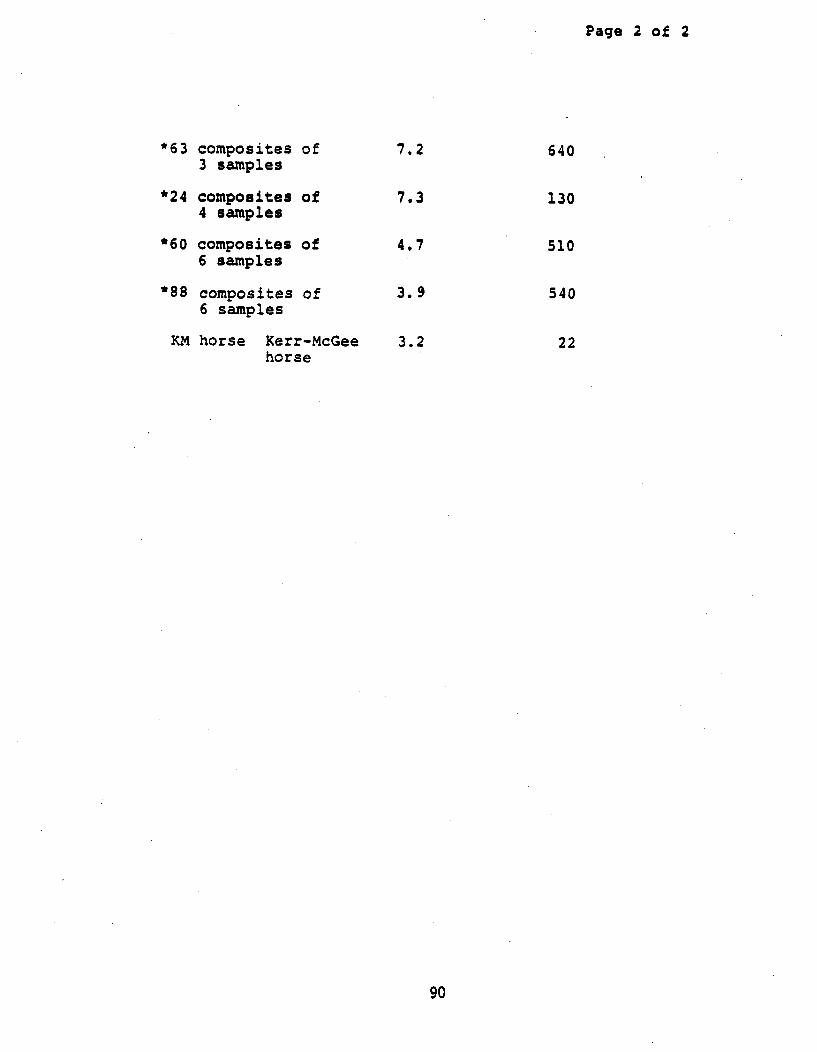
Page 2 of 2
*63 composites of 7.2 6403 samples
*24 composites of 7.3 1304 samples
*60 composites of 4.7 5106 samples
*88 composites of 3.9 5406 samples
KM horse Kerr-McGee 3.2 22horse
90
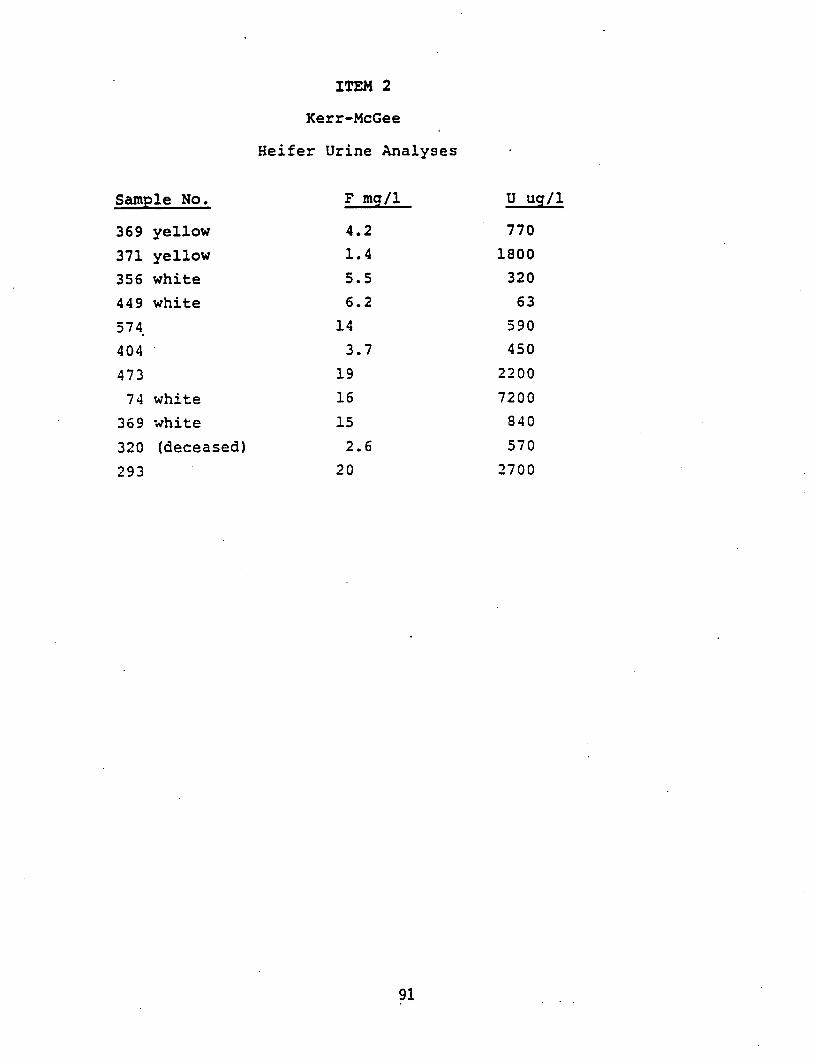
ITEM 2
Kerr-McGee
Heifer Urine Analyses
Sample No.
369 yellow
371 yellow
356 white
449 white
574.
404
473
74 white
369 white
320 (deceased)
293
F mg/i
4.2
1.4
5.5
6.2
14
3.7
19
16
15
2.6
20
U ug/l
770
1800
320
63
590
450
2200
7200
840
570
2700
91

ITEM 3
Kerr-McGee
Horse Urine Analyses
Sample No.
K-M horse
F mg/l U ug/l
3.2 22
92
ITEM 4
OFF SITE INVESTIGATION
I N D E X:
Section 1: Investigation of Animals South of
Facility in Plume Path
Section 2:
Section 3:
Requested Investigation of Animals
Control Head Investigation
93

ITEM 4
SECTION 1
94

IRRESIDENCE:
DATE:
LOCATION:
HERD TYPE:
HERD SIZE:
January 7, 1986
Township 12N, Range 21E, Section 26
Cross bred and hereford cattle
Approximately 43 head
Dr. John Miller and I visited . 1R and took urine samples
from 4 of IR's calves. IR's herd size was
approximately 43 head of herfords and crossbred cattle. Dr.
Miller also examined two of ]R's young dogs. The
dogs were in good health with no signs of illness or evidence
of HF acid burn or toxin. The cattle were in good general health
with signs common herd parasites. There was not any signs oB acid
or uranium related illnesses. Urine analysis results:
Sample No.
I calf
2 calf
3 calf
4 calf
F mg/l
1.3
U mg/l
Insufficient sample
1.2
0.9
1.0
8
48
below those of the control group.Urine analyses were normal and
Further testing was not warrented
95
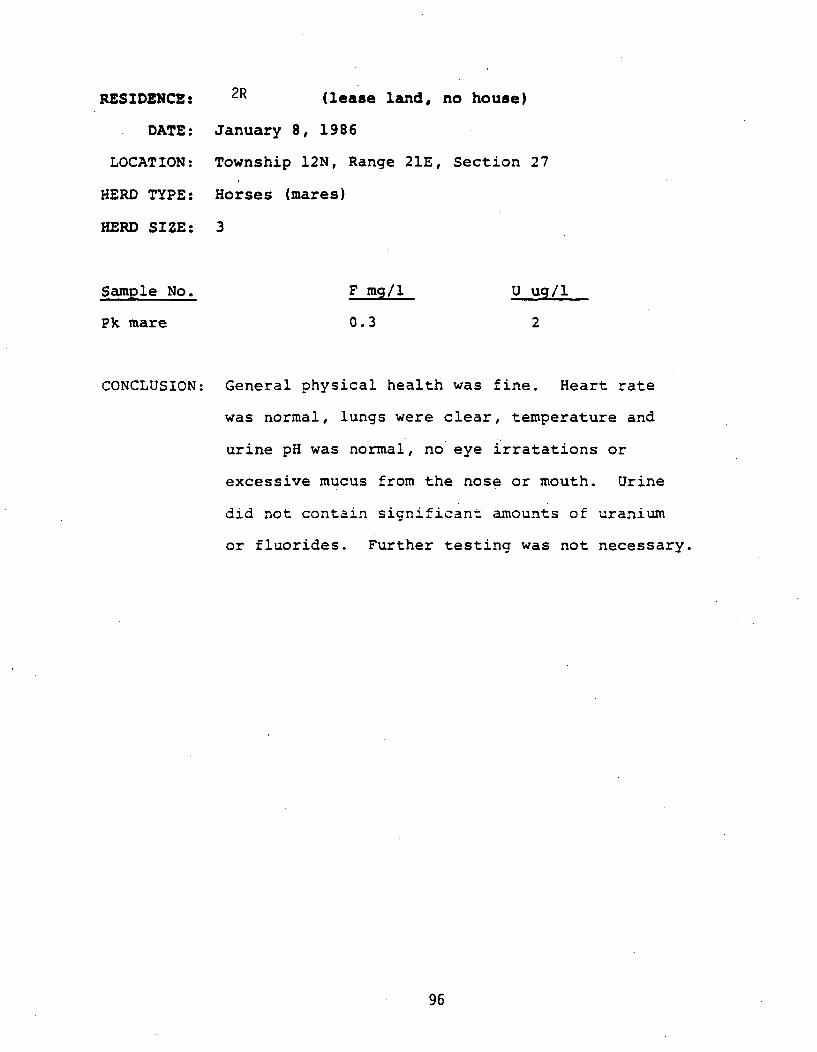
RESIDENCE:
DATE:
LOCATION:
HERD TYPE:
HERD SIZE:
2R (lease land, no house)
January 8, 1986
Township 12N, Range 21E, Section 27
Horses (mares)
3
Sample No.
Pk mare
F mg/l
0.3
U ug/1
2
CONCLUSION: General physical health was fine. Heart rate
was normal, lungs were clear, temperature and
urine pH was normal, no eye irratations or
excessive mucus from the nose or mouth. Urine
did not contain sicnificant amounts of uranium
or fluorides. Further testing was not necessary.
96
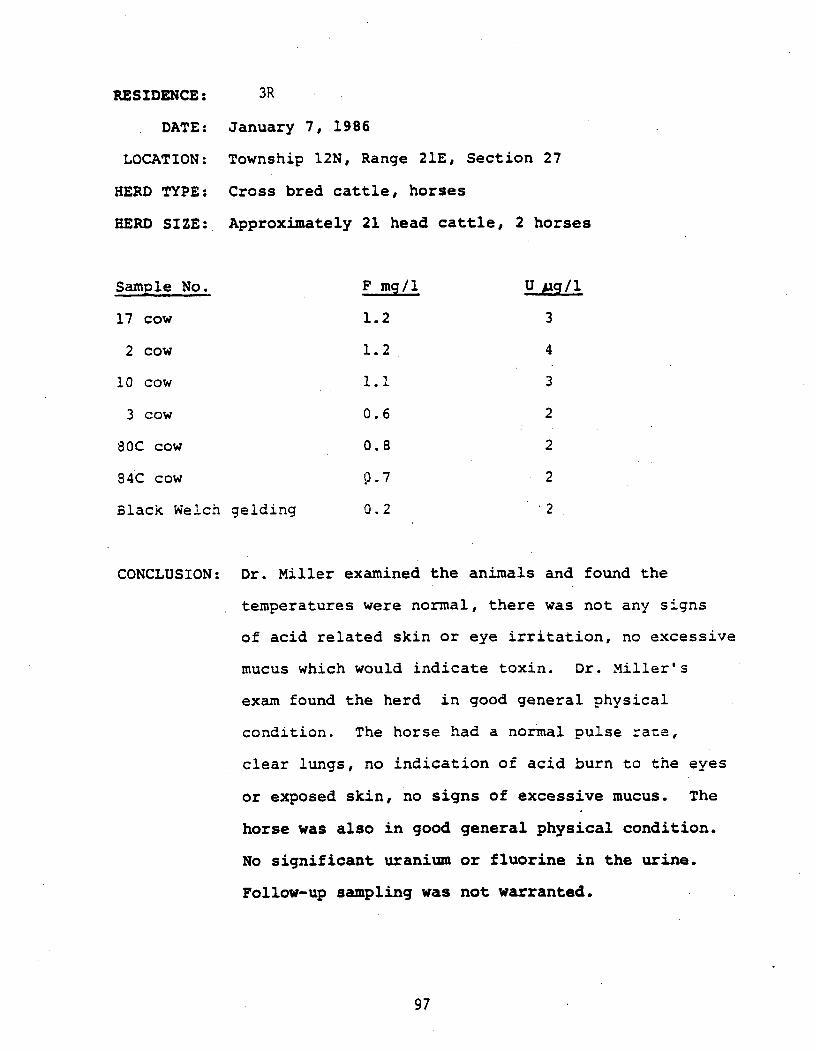
RESIDENCE:
DATE:
LOCATION:
HERD TYPE:
HERD SIZE:
3R
January 7, 1986
Township 12N, Range 21E, Section 27
Cross bred cattle, horses
Approximately 21 head cattle, 2 horses
Sample No.
17 cow
2 cow
10 cow
3 cow
80C cow
84C cow
Black Welch gelding
F mg/i
1.2
1.2
1.1
0.6
0.8
.. 7
0.2
U Ag/i
3
4
3
2
2
2
2
CONCLUSION: Dr. Miller examined the animals and found the
temperatures were normal, there was not any signs
of acid related skin or eye irritation, no excessive
mucus which would indicate toxin. Dr. Miller's
exam found the herd in good general physical
condition. The horse had a normal pulse rate,
clear lungs, no indication of acid burn to the eyes
or exposed skin, no signs of excessive mucus. The
horse was also in good general physical condition.
No significant uranium or fluorine in the urine.
Follow-up sampling was not warranted.
97

RESIDENCE:
DATE:
LOCATION:
HERD TYPE:
HERD SIZE:
4R
January 7, 1986
Township 12N, Range 21E, Section 26
Hereford cattle
Approximately 10
Sample No.
1 cow
2 cow
3 calf (6 wks. old)
F mg/l
2.8
1.3
0.6
U jig/1
2
2
4
CONCLUSION: Dr. Miller examined the animals and did not find
any HF acid or uranium suspect illnesses. Eye,
mouth, nose areas appeared normal. Temperatures
were normal. Dr. Miller did not find anything
except normal herd parasites. The urine contained
no significant uranium or fluoride, further testing
was not warranted.
98

ITEM 4
SECTION 2
99
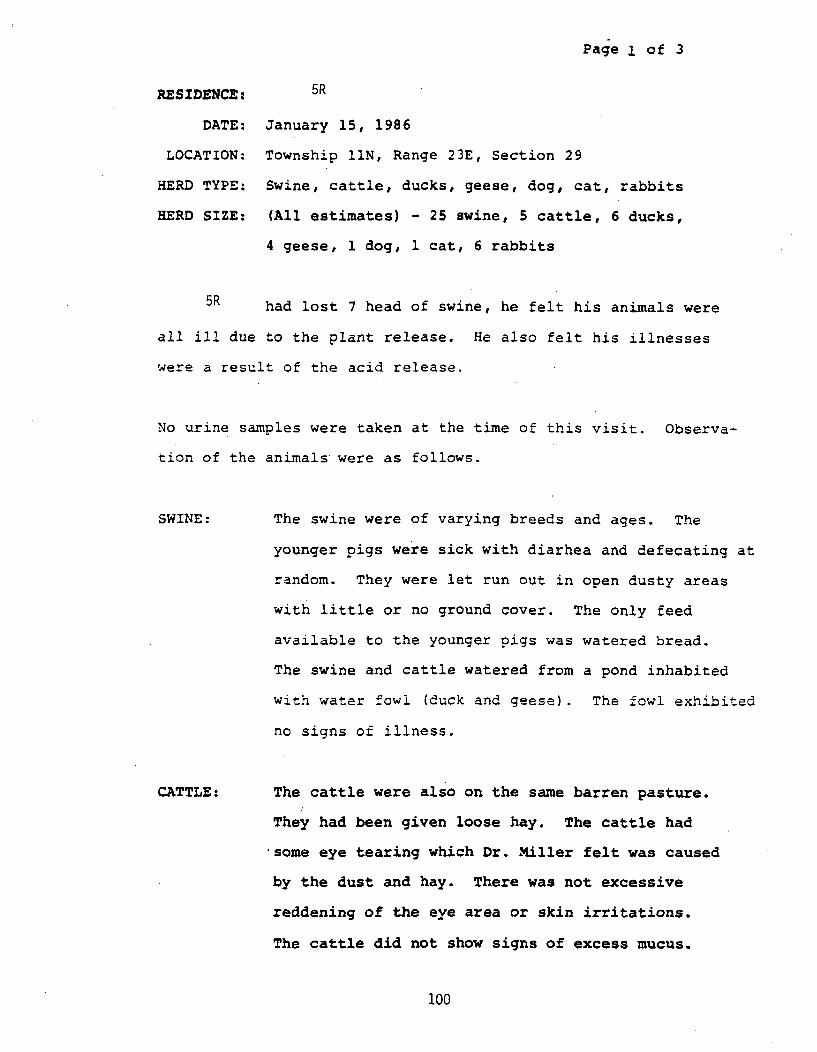
Page I of 3
RESIDENCE: 5R
DATE: January 15, 1986
LOCATION: Township 11N., Range 23E, Section 29
HERD TYPE: Swine, cattle, ducks, geese, dog, cat, rabbits
HERD SIZE: (All estimates) - 25 swine, 5 cattle, 6 ducks,
4 geese, 1 dog, 1 cat, 6 rabbits
5R had lost 7 head of swine, he felt his animals were
all ill due to the plant release. He also felt his illnesses
were a result of the acid release.
No urine samples were taken at the time of this visit. Observa-
tion of the animals were as follows.
SWINE: The swine were of varying breeds and ages. The
younger pigs were sick with diarhea and defecating at
random. They were let run out in open dusty areas
with little or no ground cover. The only feed
available to the younger pigs was watered bread.
The swine and cattle watered from a pond inhabited
with water fowl (duck and geese). The fowl exhibited
no signs of illness.
CATTLE: The cattle were also on the same barren pasture.
They had been given loose hay. The cattle had
.some eye tearing which Dr. Miller felt was caused
by the dust and hay. There was not excessive
reddening of the eye area or skin irritations.
The cattle did not show signs of excess mucus.
100
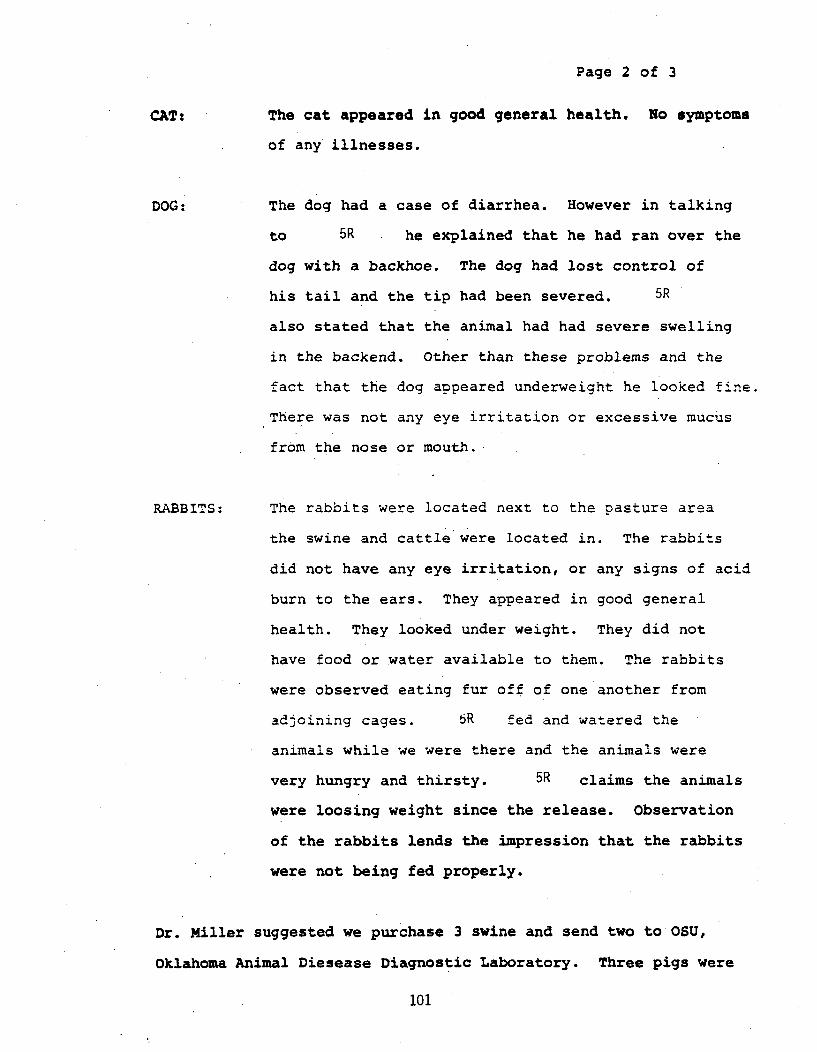
Page 2 of 3
CAT:
DOG:
The cat appeared in good general health. No symptoms
of any illnesses.
The dog had a case of diarrhea. However in talking
to 5R he explained that he had ran over the
dog with a backhoe. The dog had lost control of
his tail and the tip had been severed. 5R
also stated that the animal had had severe swelling
in the backend. Other than these problems and the
tact that the dog appeared underweight he looked fine.
There was not any eye irritation or excessive mucus
from the nose or mouth.
The rabbits were located next to the pasture area
the swine and cattle were located in. The rabbits
did not have any eye irritation, or any signs of acid
burn to the ears. They appeared in good general
health. They looked under weight. They did not
have food or water available to them. The rabbits
were observed eating fur off of one another from
adjoining cages. 5R fed and watered the
animals while we were there and the animals were
very hungry and thirsty. 5R claims the animals
were loosing weight since the release. Observation
of the rabbits lends the impression that the rabbits
were not being fed properly.
RABB IT.S:
Dr. Miller suggested we purchase 3 swine and send two to 06U,
Oklahoma Animal Diesease Diagnostic Laboratory. Three pigs were
101

Page 3 of 3
purchased and 5R gave the fourth pig, which was dying,
for diagnoses. A full report from OSU is attached. See Item 9.
Dr. Miller examined the other 2 pigs and found no evidence of
HF or uranium related problems. Dr. Miller's findings were the
same as those of OSU.
CONCLUSION: 5R's property was not in the plume path.
Dr. Miller did not find any illnesses that were
related to the facility release.
5R claimed his eyes were burned the day of
the release and that he had holes burnt in his jean
legs. However, his eyeglasses were not etched.
The glass in the cab of his backhoe and vehicles
showed no evidence of etching. Etching of glass
should be quite evident and is characteristic of
HF. None was observed.
Also, the rabbits should have shown some evidence
of "burn" since they have extremely sensitive eyes
and ears, but they did not.
In summary 5R had several noted items
indicating poor animal husbandry, infections, and
parasites in his herds.
102
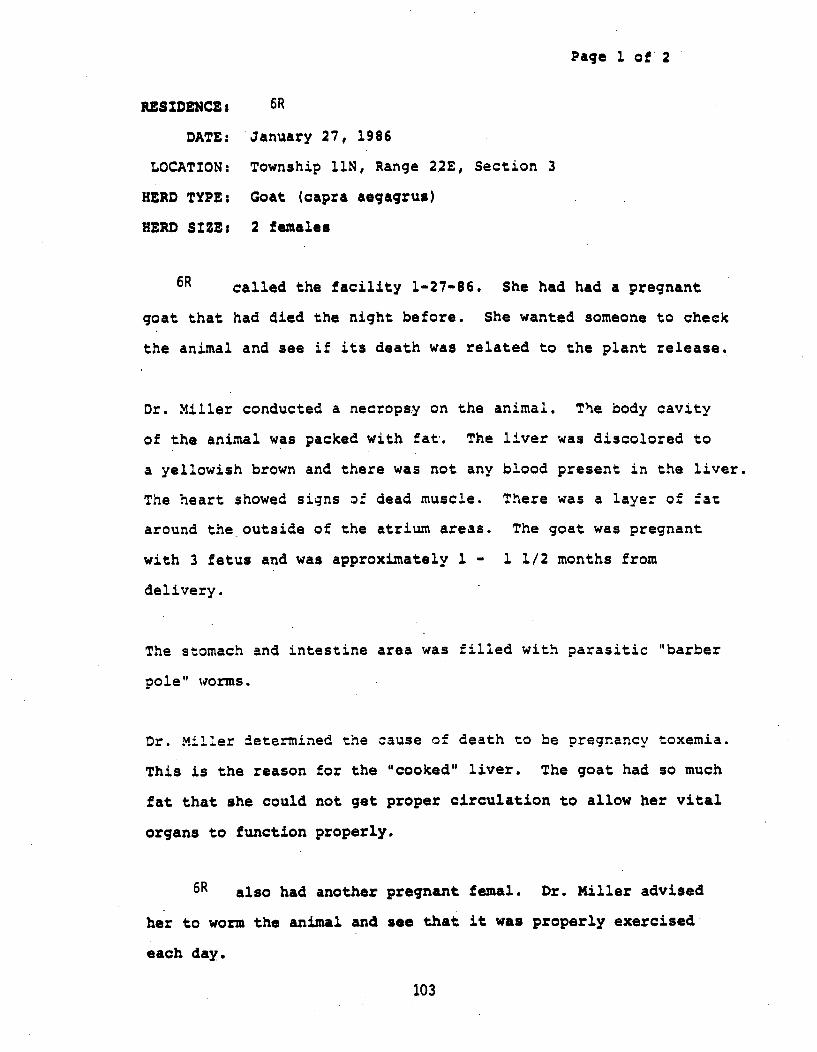
Page 1 of' 2
RESIDENCE: 6R
DATE: January 27, 1986
LOCATION: Township 11N, Range 2.2E, Section 3
HERD TYPE: Goat (capra aegagrus)
HERD SIZE: 2 females
6R called the facility 1-27-86. She had had a pregnant
goat that had died the night before. She wanted someone to check
the animal and see if its death was related to the plant release.
Dr. Miller conducted a necropsy on the animal. The body cavity
of the animal was packed with fat. The liver was discolored to
a yellowish brown and there was not any blood present in the liver.
The heart showed signs of dead muscle. There was a layer of fat
around the-outside of the atrium areas. The goat was pregnant
with 3 fetus and was approximately 1 -1 1/2 months from
delivery.
The stomach and intestine area was filled with parasitic "barber
pole" worms.
Dr. Miller determined the cause of death to be pregnancy toxemia.
This is the reason for the "cooked" liver. The goat had so much
fat that she could not get proper circulation to allow her vital
organs to function properly.
6R also had another pregnant femal. Dr. Miller advised
her to worm the animal and see that it was properly exercised
each day.
103

Page 2 of 2
6R witness the necropsy and was completely satisfied
that the goat died of a physiological problem and not as a
result of anything from the facility.
104
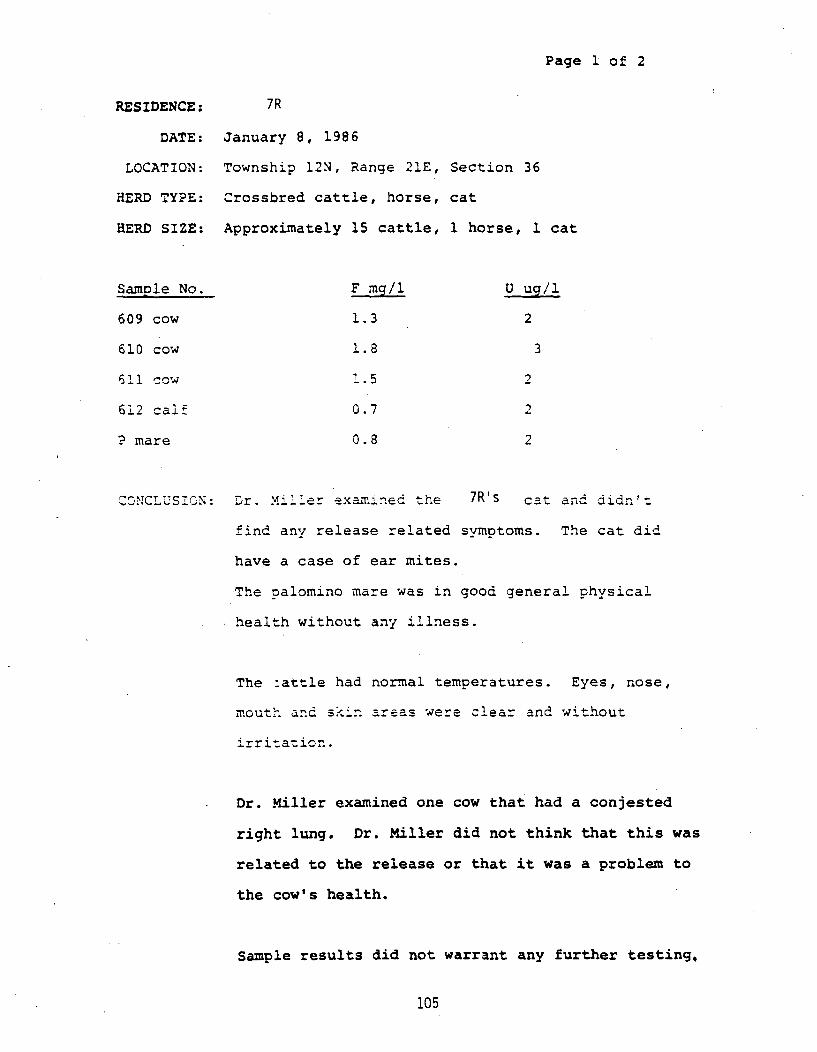
Page I of 2
RESIDENCE:
DATE:
LOCATION:
HERD TYPE:
HERD SIZE:
Samole No.
609 cow
610 cow
611 cow
612 cali
P mare
20NCLUSI0N:
7R
Tanuary 8, 1986
Township 12N, Range 21E, Section 36
Crossbred cattle, horse, cat
Approximately 15 cattle, 1 horse, 1 cat
F mg/l
1.3
1.8
1.5
0.7
0.8
U ug/1
2
3
2
2
2
Dr. Miller examined the 7R's cat and didn't
find any release related symptoms. The cat did
have a case of ear mites.
The oalomino mare was in good general physical
health without any illness.
The :attle had normal temperatures. Eyes, nose,
mouth and skin areas were clear and without
ir ritation.
Dr. Miller examined one cow that had a conjested
right lung. Dr. Miller did not think that this was
related to the release or that it was a problem to
the cow's health.
Sample results did not warrant any further testing,
105

Page 2 of 2
The herds' general condition was good. However,
7R requested some additional urine testing
and this was conducted on 1-16-86. Dr. Miller
examined some additional cattle in 7R's
herd and found them to be in good health. Some
of the cows had a common uterin virus but there
was not any illnesses that were related to the
facility release. Analyses on five head of
cattle sampled on 1-16-86 are still pending.
106

ITEM 4
SECTION 3
107
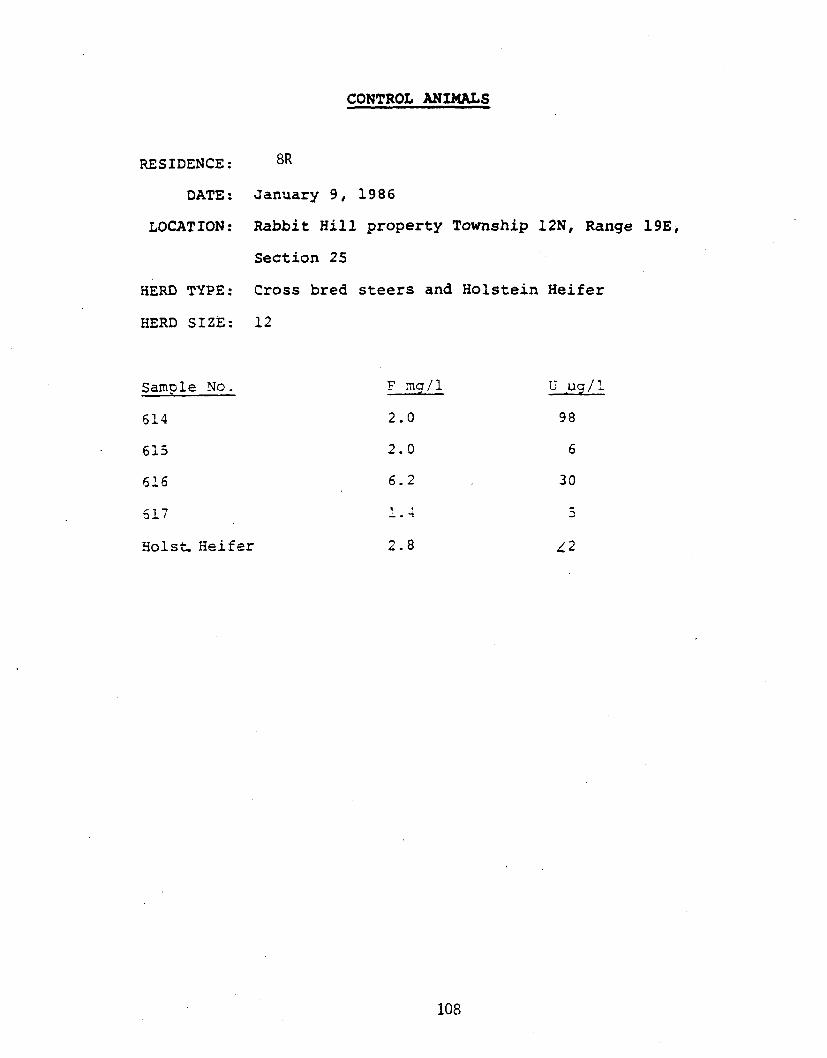
CONTROL ANIMALS
RESIDENCE:
DATE:
LOCATION:
HERD TYPE:
HERD SIZE:
Sample No.
614
615
616
617
Holst- Heifei
8R
January 9, 1986
Rabbit Hill property Township 12N, Range 19E,
Section 25
Cross bred steers and Holstein Heifer
12
F mg/l
2.0
2.0
6.2
1..
2.8
98
6
30
3
/-2
108
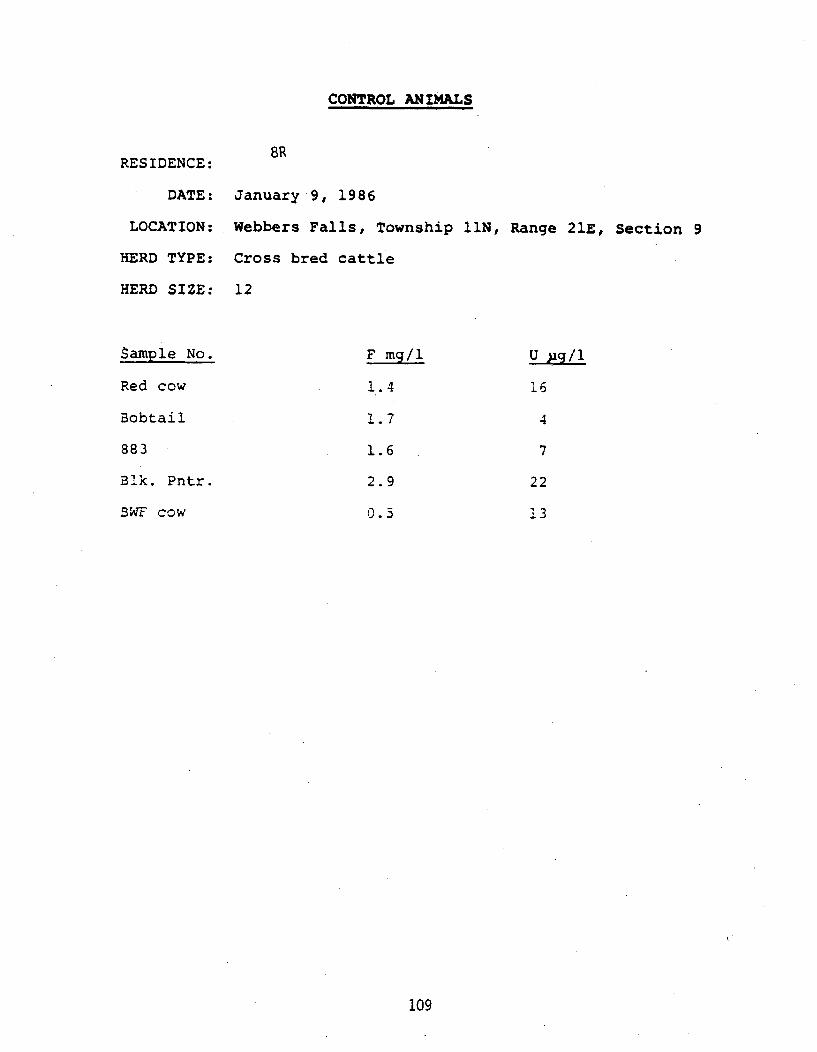
CONTROL ANIMALS
RESIDENCE:
DATE:
LOCATION:
HERD TYPE:
HERD SIZE:
SR
January 9, 1986
Webbers Falls, Township 11N, Range 21E, Section 9
Cross bred cattle
12
Sample No.
Red cow
Bobtail
883
Blk. Pntr.
BWF cow
F mg/l
1..4
1.7
1.6
2.9
0.3
U 2g/i
16
4
7
22
13
109

CONTROL ANIMALS
RESIDENCE:
DATE:
LOCATION:
HERD TYPE:
HERD SIZE:
K-M Corporation
January 9, 1986
Township 12N, Range 12E, Section 22
Crossbred steers
Sample No.
14CG
27CG
84CG
160CG
154CG
F mg/1
1.6
1.2
0.8
U jig/ 1
47
13
12
9
23
2.0
1.5
110
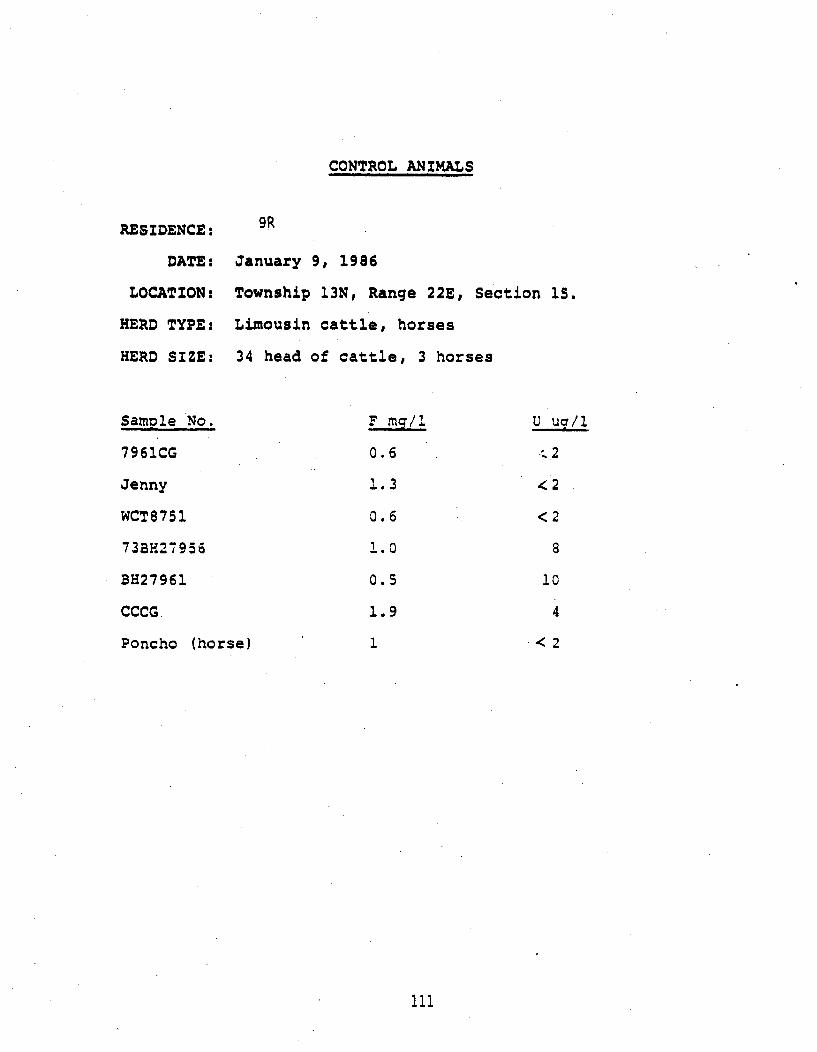
CONTROL ANIMALS
RESIDENCE:
DATE:
LOCATION:
HERD TYPE:
HERD SIZE:
9R
January 9, 1986
Township 13N, Range 22E, Section 15.
Limousin cattle, horses
34 head of cattle, 3 horses
Sample No.
7961CG
Jenny
WCT8751
73BH27956
BH27961
CCCG
Poncho (horse)
F Mq/.
0.6
1.3
0.6
1.0
0.5
1.9
1
U uq/1
<2
<2
8
10
4
<2
il
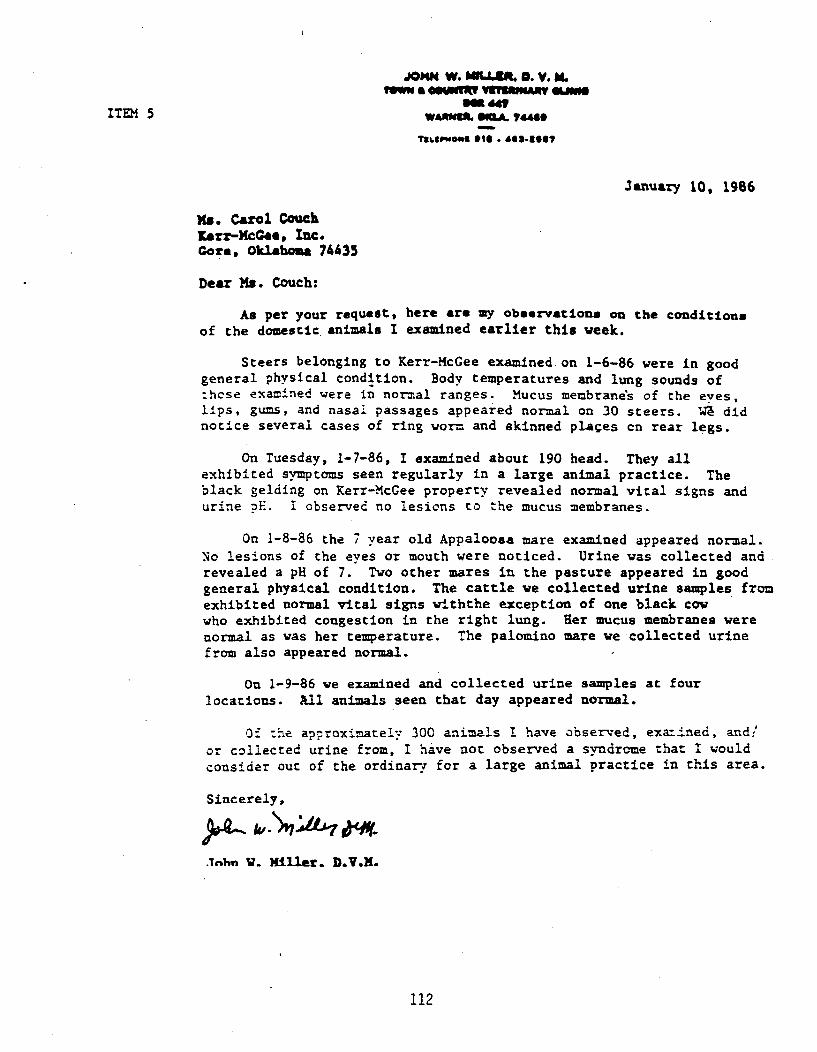
JOHN W. MIALL.. D. V. h.t"va & Os0wMeI WSYMaAy *.LM@
Iam do'ITEM 5 WAnM.L A. ,07440
?7en.3lPwOe0 OSt • 4e0.3O67
January 10. 1966
Ms. Carol CouchKerr-McGee, Inc.Gore, Oklahoma 74435
Dear Ms. Couch:
As per your request, here are my observations on the conditionsof the domestic animals I examined earlier this week.
Steers belonging to Kerr-McGee examined, on 1-6-86 were in goodgeneral physical condition. Body temperatures and lung sounds of:hcse examined were in normal ranges. Mucus membranes of the eves,l•ps, gums, and nasal passages appeared normal on 30 steers. WZ didnotice several cases of ring worm and skinned pla~es cn rear legs.
On Tuesday, 1-7-86, I examined about 190 head. They allexhibited symptoms seen regularly in a large animal practice. Theblack gelding on Kerr-McGee property revealed normal vital signs andurine .E. I observed no lesions to the mucus membranes.
On 1-8-86 the 7 year old Appaloosa mare examined appeared normal.No lesions of the eyes or mouth were noticed. Urine was collected andrevealed a pH of 7. Two other mares in the pasture appeared in goodgeneral physical condition. The cattle we collected urine samples fromexhibited normal vital signs withthe exception of one black cowwho exhibited congestion in the right lung. Her mucus membranes werenormal as was her temperature. The palomino mare we collected urinefrom also appeared normal.
On 1-9-86 we examined and collected urine samples at fourlocations. All animals seen that day appeared normal.
0: -he approximately 300 animals I have observed, exa:ined, and!or coliected urine from, I have not observed a syndrome that I wouldconsider out of the ordinary for a large animal practice in this area.
Sincerely,
.)•,l Da
.Tnhn W. Miller. D.V.M.
112

ITEM 6
1212 N. JardotS•aclvater. OklahomaJanuary 27, 1986
74074
Me. Carol CouchSequoyah Fuels IncorporatedP. 0. Box 610Gore, OK 74435
Dear Carol:
I have reviewed the analyses from urine samples takenfrom the livestock owned by Sequoyah Fuels.
Even though concentrations of uranium and fluorine inthe urine were higher in some of the animals than thosezenerally found from other animals tested, these concentra-tions are still below suggested critical levels. LevelsFound in these animals pose no health problems to the animalsand there is no risk of elevated levels being transmitted tothe human chain from these animals or their products.
Sincerely yours,
B. TuckerAgronomist and
Soil Scientist
Enclosure
113
~66 I6
DIL J.W.M~l=WUOX 447U~*flT
o* ma- -m -7
SOELD DY ýCAIN C.OO. ^no ~ON AcT4 "Dom. MIPDOS
/ UIA IW i14
'-aI-.
b
c
PC
KEEP TM UP PM UUEFEREWCEwe511 .f
CUSTOMeRt's Oposol NO. I ftC'O OV
KEEP THIS SLIP FOR REFERENCE5H 527 !99MMM.
ITEM 8
5 I
I OROER NO. "cc=O sy
KEEP THIS SLIP FOR REFERENCE5H 527 AM
115
-fo 9
SloaSease Diql
case J 2q1o

Oklahoma State University /OKLAHOMA ANIMAL DISEASE DIAGNOSTIC LABORATORY (
January 22, 1986
Mr. Butch Garver Case No.: 112782P.O. Box 393 Owner: 5RGore, Oklahoma 74435
Dear Mr. Garner:
HiSTlPATHOLOG!C £Yq•.MINATON FN g "A"- Colonic lesion=s consistmoderate to severe diffuse areas of superficial mucosal necrosis with
associated accumulation of necrotic cellular debris and the presence ofnumerous bacterial colonies.
Mesenteric lymph nodes reveal moderate to heavy infiltrates orneutronhils, macrophages and occasional ecs incohils within the
paracortical areas with associated lymphoid hyperplasia of the cortizazgerminal centers.
There are no significant lesions in heart, lung, liver, spleen, kidney,stomach and intestines.
Pig "B" - Pulmonary findings include focally extensive infiltrates ofneurrophils within significant portions of alveoli and air passageswith the presence of several peribronchial and perivascular lymphoidinfiltrates.
Colonic lesions reveal the presence of numerous trichura (whipworms)embedded within the superficial mucooa and extension into crypts.
There are no significant lesions in hear:, liver, spleen, kidney,stomach and intestines.
Pig "C" - Colonic lesions reveal heavy numbers of Trichura(whipworms) embedded within the mucosa.
HISTOPATHOLOGIC CONCLUSION: Pig "A" - Severe necrotizing colitis;moderate suppurative lymphadenitis. Pig "B" - Moderate suppurativebronchopneumonia, severe trichuriasis. Pig "C" - severe trichuraisis.
Sincerely.
DV.:.dPW
RWR:ds117
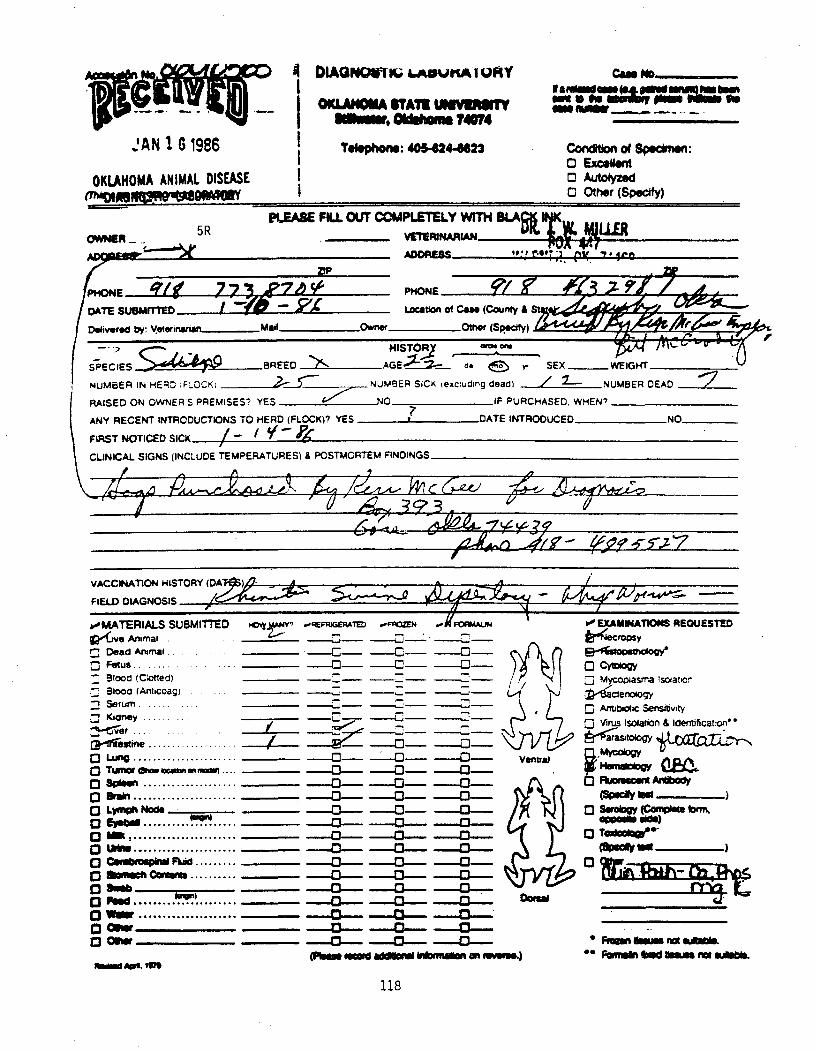
to• I DiAGNOMF.; WUPKJIA- 0 1RYam OICLAMIM STATER WEINUTY14vr%- - S qso , Ois 0 iune74074
.'AN1!6 1986 IjAN 1 1986Teftpfone: 405-4244623
OKLAHOMA ANIMAL OISEASE I
lla_.-~we to - 0111111
Condion of Specimen:C Excellento Autolyzed0 Other (Specify)
AE FILL OUT COMPLETELY WITH BLA .OWER5R VIETRIIARI S y!L
ADDRIN .90PVA W14• f
PPHONE
DAT SUMITED ocLocation of Case (County a S
Delivered by: Veterawjani ..... mai~l Owner - Other (Specify)
NU BE IN H RD P OC * NUMBER SICK texctuding dead) Z NUMBER DEAD 'N UM BER IN HE D ;FL ZCK I __ __"N M E J K e c uij e d
RAISED ON OWNERS PREMISES) YES NO -IF PURCHASED, WHEN?
ANY RECENT INTRODUCTIONS TO HERD (FLOCK)? YES _ __DATE INTROCUCED NO
FIRST NOTICED SICK / 'f {CLINICAL SIGNS (INCLUDE TEMPERATURES) & POSTMORTEM FINDINGS
VACCINATION HISTORY (DA
FIELD DIAGNOSIS
boMATERIALS SUSMITTED .FPA=N kMMA, bErowi o w EXAMINATIONS REQUESTED&-ie Animal .. _ ___.c _.._2 -sy
1` Dead Animal .... ...... ( -~a~~cigC Fetus .......... ....- ) ~ I ytlg
Blood (CAotlec) -, - ----- Z Mycolasma isolatior;• B10 c0 (Anhicoagl • •- ~ ' a - L- • - cenoo
'1 Se rum ._..... ... _ -A en i y
- y ......- i - C--] Virus Isolalion & Identification'
•1: o6 itn . .............. 6//r•ok * L'xra r ?_-u .... ...... --- ... Veta Ani'My o"i estv
o 3 -C-w ohoo- -o on MN.Molio ov ...........• 0 - -- O-- 0e
O Lale .....--...... ... -0- q. (
O Lwh• o -0---- -m-o---- 0 S60oy (Cafa lei
MR ........................ -0 0 0 Twioowv-r
a c.bmapbW Ad -- -0- -0 0-o h C.t....... 0 10 -0--
o .ft ................ 0 11 107 110 oWS ..................... - - ..
o cm.W 0 - --a .0- C R mt aIWs 'Uafmew adhdmw Wbomian ativtn5. PSIII Fil ima 6W bmesno
Y-N
fte
avid APO IWO
118

112782 Pi~'~'~. ~&NU looIm""
SAMPW We@gAM LM N
N- i OE. -o
* Samales for serology should be collected in sterile vacutlaner tubes without anticoagul-ant. "-D tubes are satisfactory. Brucellosis tubes and some other vacuum tubes fre-quently contain toxic residues.
Laboratory charges are doubled for cases not owned by Oklahoma cdizens.
"N, uVL ,epAOMorfto ProleW, . 1t .ar POP. hhon•.
WtMyc boa) ($4 00)
8 Swin e ~o~rsa($a0N'euaWI aor s VMStomt
TGEIO ((300
Siumis oftf (P APM 19ica, g~r
Brucema cn.0se0)Can em (Laeru .3m (3. oVD) (17.00)8~ i AWMW fWIe L*M, Snjestla.
Meorne Abortion Profile (Cepto, Riocl smear.s,EIA-Send EIA form) (.00)CSheep Abortion Proflte (Lapto, Brucella. Bluelongue.Chiamydia) (S9.00)Swine Influenza Viris ($4 00)
SSwine Parvovirus (S4 00)P seujdora~ies ($4.00)TGE (54.00)
SBrucella canis (S4.00)Canine Distemper (Serum or CSF) ($4.00)Feline Leukemia (need unfixed blood smears) ($A 00)EtA (55.00)Equine Rhinooneumonlitis ($4.00)Equine influenza 1 ($4.00)Equine Influenza 2 ($4.00)OtherOtherOther
ADDITONAL. REMARKS-
j~~C~jALi
119
Oklahoma State UniversityOKLAHOMA ANIMAL DISEASE DIAGNOSTIC LABORATORY
January 22, 1986
STILLWATER. OKLAHOMA 7d078(4OS) 624.6623
Butch Garvers.0. Box 393Sore, Oklahoma 74435
Case No.: 112782Owner: 5RReferral Laz.: Boren Veterinary Medical
Teachina Hospital,:klahcna.tar C nzmaer4 7Stillwater, khca7:T
Dear Mr. Garver :
At:tched hereto are the results of tests performed by an outside labcratorv:" w"hich •a~erlais were referrea :-ro- :h-e above re-ere--ed :ase.
Sincerely,
Rat . DVM, PhD
120
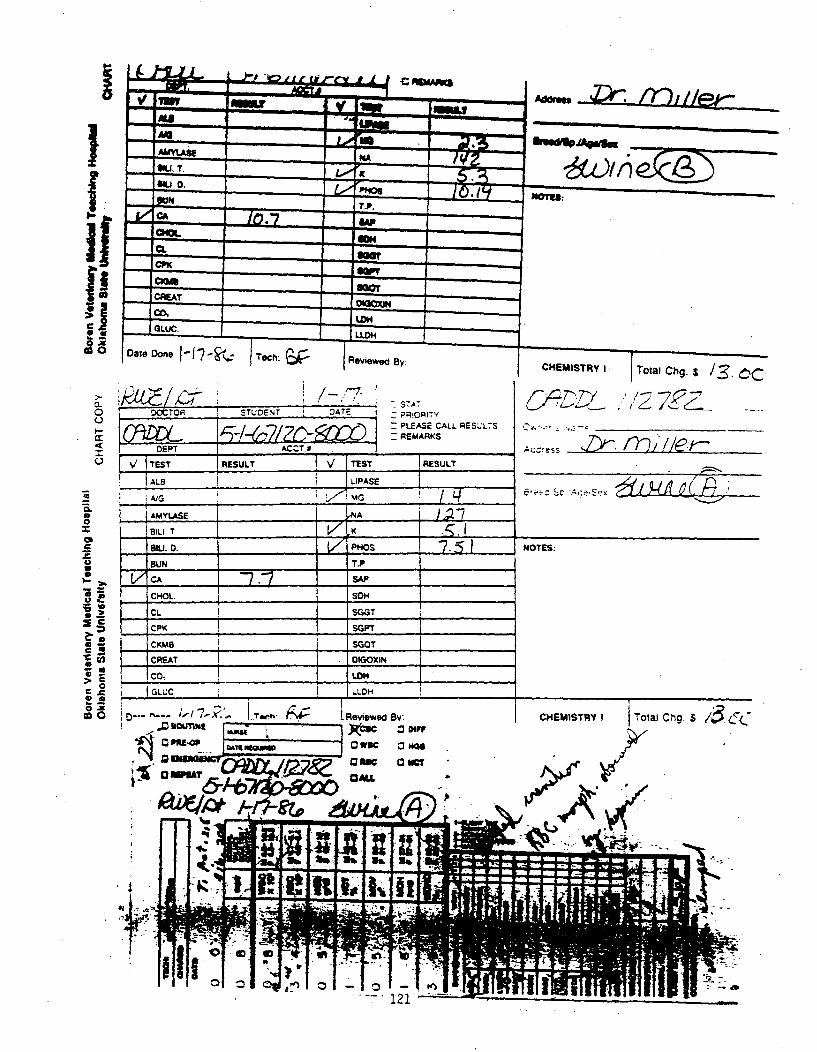
0ILI
0~
0
Cc
*D M
I , 0 -1 W" . -, -, .£ a -
A*
- AMVLAGE_
11114u 0,
CL
CREAT
GLUC.
Date Donse-f- T.1t:
L..hm~m~mH i~~4~ei
LON
Reviewed~ BY: CHEMISTRY I Total Chg. S/.o
,~ ~ / 1 7\-7Ž'ocmTop STUDENT= D-A-TE t
DEPT ACCT.
-- PRGRTA
PLEASE CALL RES.LTS
7REMARKS
v¶TEST RPESULT ___TEST' RESULT
ALB______ LI_ PASE
A~MwYLASE LXG
Er., S~ Ac '.' I
BIL. T, 4•1SIL. 0. _POS. 7.5 J1 ,NOTES:._ SUN . ... T.P.
CHOL. : SON_
CL __ S_-._T
cPK ___ SGPT
CREAT I ._ __ DOXiN
cot LONc__ __I _ _ _ _ _ _
GU LLDH _______ ___________________
i0 *D-- I- '' - !T-.h ['4 Reviewed BY:1 -011L - 1 Wuflh. 1a )(Coe 0 CWF
ca mm *11 W C l ~NGO1lS 11m aW
a 4 spu CA~f LLRi F
CHEMISTRY I Total Chg $ /3 jt'
-- 121

SOKLAHOMA ANIMAL DISUAU DIAONOSTIC LA&ORATORY
OKLA HOMA STATE( UNIVERSITY 8LU.NL.IUOA ?•e (ie.4mBACTERIOLOGY REPORT
CO Preliminary Report
Vtetrinmrian r)o J.J. MWL",
Final Report
ft.mftw r% 0
species P_,______p._Specimen(g)
o Lung
Liver
rSpleen " -.L
o3 Kidney
[9 Ly-mph node -,Nw
3intestine i&-.49)
o uterusO Stomach contents
o Urinea Feces
C MuscleOskin
Date Received Il-ti Case No. //271A..
isolate (s) Specimen (s) Ieolatese s)
G1 (twv 0; 1
* t
C L3 -0
"_ __3_ _ _0 _ _ __ _ _ _
We were unable to isolate any bacteria from the sample(s) submitted.
0The bacteria isolated were not- considered significant.
he bacter.a iscL:aed were :c.-sidered si,..i:a.-. See &:'.ached z.ee-for antibiogram(s).
Q Zsolate referred to another lab for identification:An addendum report will follow.
CODMMTSt
Date I.%I i
OlAbstaot I. J. Nortan, DWN, NSactierioloqist122
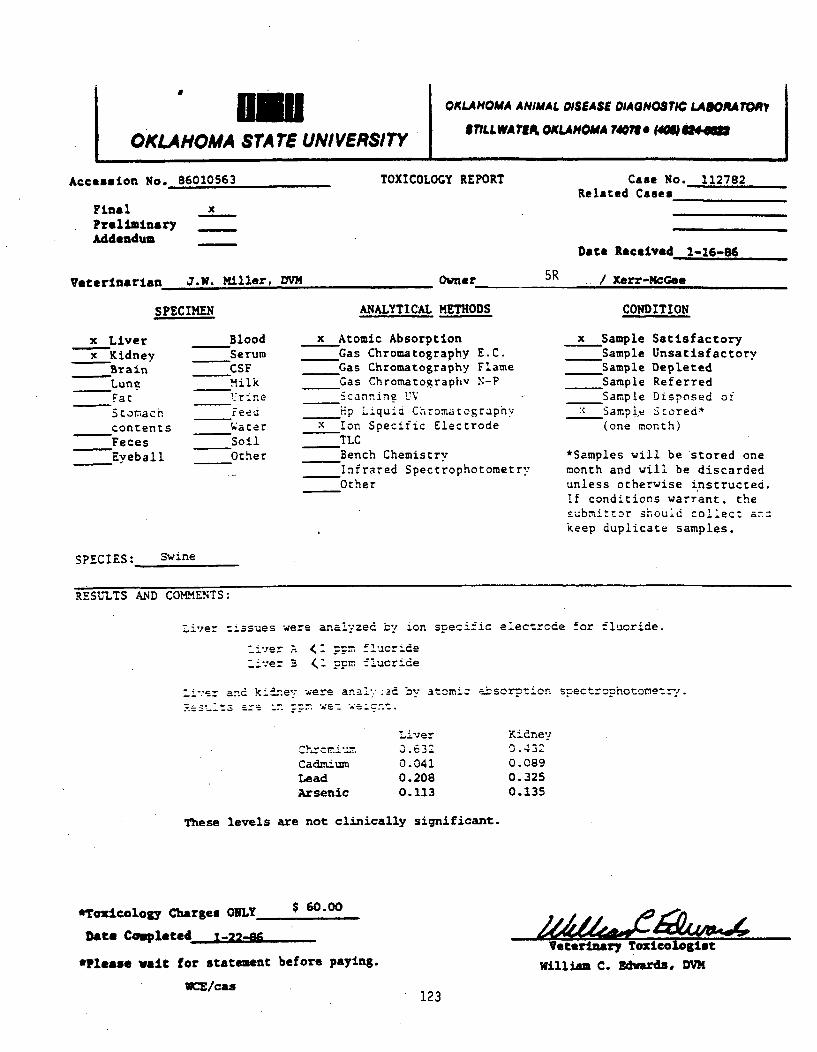
I i 1OILAHOMA ANIMAL DISEASE DIAGNOSTIC LAMORA TOA'
OKLAHOMA STATE UNIVERSITY 8nLLWATI• OALAMOMA 74078. (4U @4.3
Accession No. 86010563 TOXICOLOGY REPORT
FinalPreliminaryAddendum
x
Case No. 112782Related Cases
Date Received 1-16-86
/ Xerr-McGeeVeterinarian J.w. Miller, DVM Owner 5R
SPECIMEN ANALYTICAL METHODS CONDITION
x Liverx Kidney
BrainLunzFatStomachcontentsFecesEyeball
BloodSerumCSFMilk
-- eej
WacerSoilOther
x Atomic AbsorptionGas Chromatography E.C.Gas Chromatography FlameGas Chromatography N-P
___cannine UVHp Liquid Chromatography
X Ion Specific ElectrodeTLCBench ChemistryInfrared SpectrophotometryOther
x Sample SatisfactorySample UnsatisfactorySample DepletedSample Referred
_ Sample Disposed ofX Samp1,t Stored*
(one month)
*Samples will be stored one
month and will be discardedunless otherwise instructed.
if conditions warrant, thesubmi-tor should collect an.
keep duplicate samples.
SPECIES: Swine
RESL'LTS AND COKMENTS:
..iver =issues were analyzed by ion specific electrode for fluoride.
-i-er A <i I=m flucride.Jiver ( ncrm flucride
&iver and ki:!ney were analv:ad by atomiz ascr-icpcn sectromhotomet•'.e rsre: wn
CadmiumLeadArsenic
Liver0.6320.0410.2080.113
IKidnev0. 43Z
0.0890.3250.135
These levels are not clinically significant.
*Toxicology Charges ONLY $ 60.00
Date Completed 1-22-7ff
*Please wait for statement before paying.
lrE/cas
Veterinary To.xiologistWilliam C. Ed WadSo MV)
123

w~wOklahoma Stat University
OKLAHOMA ANIMAL DISEASE DIAGNOSTIC LABORATORY / ST•eUWATfR, OKLAHOMA 74078(405) 624-6623
January 22, 1986
Butch GarverP.O. Box 393Gore, Oklahoma 74435
Case No s 112782Owner: - 5RReferral Lab.: Boren Veterinary Medical
Teaching Hospital"k:Tahcma State -
Dear %r. Garver:
Attached hereto are the results of tests performed by an outside laboratorywhich were referred from the abcve referenced case.
Sincerely,
Ray W. Ely, DVM, PhDrathologist
RW-E/Cas
124

F 'Ii,
A
OATS:-,
2g-::---WBC Uajý-ID in)r 101 or 4h&-lu*
- MC bf47-41
x Igo F 42-L
ICT U
-Jr3 ~* ., pFm g~uoem
P
1' K
j I-5
VMCVAe
Mll-P Irn-r
14I
Lii0 0
S2 0
~.
4
.95 - ~-. - ft
125
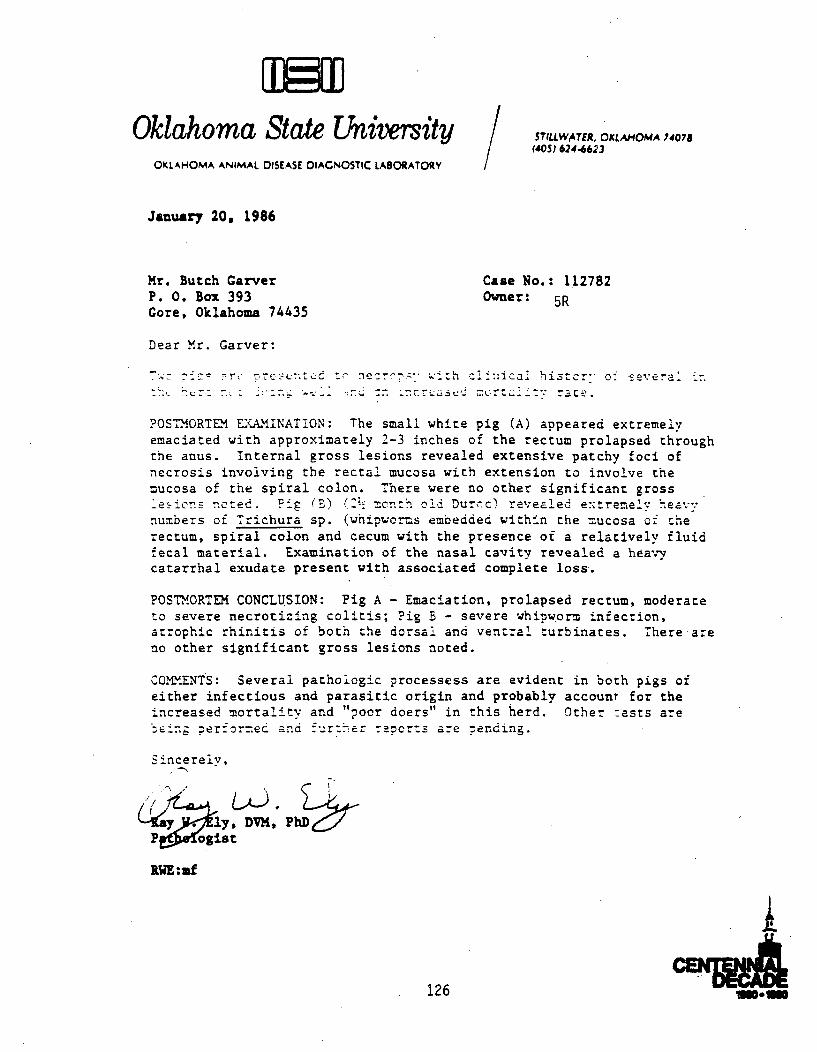
Oklahoma State University ,.WATER, OKLAHOMA 74078
OKLAHOMA ANIMAL DISEASE DIAGNOSTIC LABORATORY
January 20, 1986
Mr. Butch Garver Case No.: 112782P. 0. Box 393 Owner: 5RGore, Oklahoma 74435
Dear Mr. Garver:
-. ?-: 9r& nr~ ' -Td -n.. 'ith c!lnica1 histcr- of severa... :- .- . n i2 ,J- " m- r-,•zý,.• rZcE.
?OSTIMORTEM EXAMINATION: The small white pig (A) appeared extremelyemaciated with approximately 2-3 inches of the rectum prolapsed throughthe anus. Internal gross lesions revealed extensive patchy foci ofnecrosis involving the rectal mucosa with, extension to involve themucosa of the spiral colon. There were no other significant grosse:-icns noted. Fig (B) ( mi mcnth old Dur7c) revealed e:-tremelv hear,:
numbers of Trichura sp. (whipwcrs embedded within the mucosa of therectum, spiral colon and cecum with the presence of a relatively fluidfecal material. Examination of the nasal cavity revealed a heavycatarrhal exudate present with associated complete loss.
POSTMORTEM CONCLUSION: Pig A - Emaciation, prolapsed rectum, moderateto severe necrotizing colitis; Pig 5 - severe whipworm infection,atrophic rhinitis of both the dorsal and ventral -urbinates. There areno other significant gross lesions noted.
CO',1/MENTS: Several pathologic processess are evident in both pigs ofeither infectious and parasitic origin and probably account for theincreased mortality and "poor doers" in this herd. Other tests are' -En'- erfrced. and furt:-er revert-s are -pending.
Sincerely,
•Kayly, DVM, Phýogist
RWE:uf
126

ameNo
"AN 10 1986 TMephoew 46HM4S~ Ceiilo I of Sektna Emuln"0 AuW"Wzea Othr (speify)
OKLAHOMA ANIMAL DISEASEv11- - i
5R P LEAEPL OUT COMPLIETILY WITH 0UfL Jai l~~ in~s
PNONE PWONE_
DFATE 7 VB~rMDLWIRWn Of C4141e (CountIY a
SECIES.- BREED AGEl_-.__. 05 ( ,, SEX _ WEIHNT UNwk&8ER IN HERD IFLCK; .2 .. NUMBER SICK fezcI.wding aead) -...-/L...2-....NUMBER DEAD I~IRAISED ON OWNER'S PREMISES'? YES- *"0 NO -IF PURCHASED, WHEN7 _
ANY RECENT INTRODUCTIONS TO HERD (FLOCK)? YES -ATE INTRODUCED NO
,IRST NOTICED SICK( -1 •' &
CLINICAL SIGNS (INCLUDE TEMPERATURES) & POSTMORTEM FINDINGS
KVACCINATION HISTORY (DAp)
FIELD DIAGNOSIS
boMATERIALS SUBMITITED ~ Pv#WnqKWM so.w11 .. Mpoftuu RUXMINATIONS AREO4JESI
C Dead Aramal ... ..
SBlood 1C.artel)- - - ~ ~ Mycoolaara 150allo!BlSood (ArnicoaaG "-le- -g
Serum.. -:-bti Senitviy
Ki-e Vi Ieoation & Idendifieaw.0
3-1o _ie I 1~w -7 i
O Lpn ............... 17
0 hvw .......... . -
.............-....
0 0Wo -.......... -
0Pm &fflEwawQtSi 4 ~ II d I~S
127
W - 1- .4 Gail I.. A -C,
I I
- -IL
rW-" -t==" I" A" ,4 O.ny
SI I
"Samples for serology should be collecved in sterile vacutainer tubes without anticoagul-ant. B-0 tubes are satisfactory Brucellosis tubes and some other vacuum tubes ire-querttly contain toxic residues.
Laboratory charges are doubled for cases not owned by Oklahoma citizens.
ol Swifl Abae~an Proll4LaM, Brucaia.P larvon. Pudorbies) (9.00)o Hose AlO Prioile (e'epto. Rhinoq'eumonitis.EIA-send EIA form) (SO 00)
' Sheep Abortion Profile (Lapto. Brucella. Bluetongue.Chfamydia) ($9.00)Swine influenza Virus •34 00)SSwne Parvovirus (S4 00,Pseuoora:,es ($4.00)TGE ($4.00)
! Brucella canis ($4.00)Canine Distemner (Serum or CSF) ($4 00)Feline Leukem'ia (need unfixedl blood smears) ($4 00,
EIA (S5.00)Equine Rhinopneumonitis ($4.00)Equine Influenza I (54.00)Equine Influenza 2 (S4.00)Othe,
OtherOther
ADDITIONAL REMARKS
4&-, , :,
1 /, k -.--- • '• '
-*~- - -
r
- -r-~ -.
~: 4q~a
"V...
* ~i- r ~ - :~.
128 ..-
Mý411Oklahoma State Universit y
OKLAHOMA ANIMAL DISEASE DIAGNOSTIC LABORATORY
January 21, 1986
STILLWATER. OKLAHOMA 740781405) 624-6623
Mr. Butch GarverP.O. Box 393Gore, Oklahoma 74435
Case No.: 112782Owner: 5RReferral Lab.: Boren Veterinary Medical
Teachina Hospttali00o-. .ahratzr:"
:klah n z -tateý Un. 7, r '
Stiiiwater, Oklahcma 74C7z-
Dear Mr. Garver:
Attached hereto are the results of tests performed by an outside !aborator-:1o wrnch mater'als were referred from the above referenced case.
Sincerely,
Ray, •4. Ely, DVM, Y'.DPathoc~O2iSt
PYAT/cas
129
ING."
07XP //2*7g2SE-1-67120- Fncol
-h1-i7IL
To" =odowilrsciwnq
2~~r leM e - WfJIs"af _ _ _ _ _ _
RESULTS
WIM fi" "3. Sffrsegmos L ______
7 Aimparo ___________
a P.'aaciF
elm -tWNWRWi1. golo .......... ......... ...
Itid m . . . .. . . . . . .. . . . . . .. . . . . .01110. mggtas
SOSS 02166l10 iOl0e111,FC&aDC
HISTORY
£ ,Aftbars :olide Yet.* Wh: at.__Ohio _______ 140 urillosn
CLINICAL SIGNS:
ro-, ________ O"'. Yes _____ No-_____ CNS SQA y8 ______ ______
muo0coup..g 9; Yes-_____ No -______ rmat~ita yes No -
Edemla: yes_____ O_____
SPECIMEN (S): moe cwoec oe - Na,__ ow___
find am"s _____________
TEST DESIRED.*..
PARASITOLOGY LABORATORY1 ~REPORT.I130
APPENDIX 5.1.1
AIR SAMPLE ANALYSES BY SFC AND ORNL
131

SEQUOYAH FUELS CORPORATIONPOST OFFICE 8OW 25861 • OKLAHOMA CItY OKLAýOMA D1125
January 27, 1986
FEDERAL EXPRESS
Mr. Edward ShumUranium Fuel Licensing BranchDivision of Fuel Cycle & Material SafetyOffice of Nuclear Material Safety & SafeguardsUnited States Nuclear Regulatory CommissionWillste Building7915 Eastern AvenueSilver Spring, Maryland 20912
Re: License SUB-1010Docket 40-8027
Dear Mr. Shum:
During our telephone conversation on Monday, January 20, 1986, concerningNRC's evaluation of the UF6 release at the Sequoyah Facility on January 4,you asked for background information on several items. Sequoyah Fuelscontinues to assemble and evaluate the data obtained from samplingfollowing the accident. As those,,data are finalized, they will besubmitted to NRC for its use. We provide the information below:
1. Describe the plant and residential potable water supply sources forthe area south of the plant which may have been in the path of theplume.
The plant potable water supply is provided by a pipeline from the LakeTenkiller reservoir. The subject area residences are served by RuralWater District #5 which buys water from the Sequoyah County RuralWater Supply Association. The water comes from the Tenkillerreservoir. Ron Barnett, Sequoyah County Health Department, indicatesall residences south of the facility and 1-40 are on the rural watersystem for potable water. They are in the process of confirming this.
2. Is the Robert S. Kerr Reservoir used as a potable water source?
To SFC's and the Sequoyah County Health Department's knowledge, it isnot. The water is for recreational purposes.
3. Please provide a map showing the location of residences south of 1-40in the probable downwind plume direction.
Attached is a map showing the residences, identified by family name.Additionally, known livestock assemblages in the area on the day ofthe release are noted. A key to the map is provided for referencenoting family size and where sampling of livestock was done.Livestock sampling results will be submitted when completed.
133 A SuSSIDIARY OF KEWAWMcGE COAWO4flMv

Mr. Edward ShumJanuary 27, 1986Page Two
A map of the subject area, assembled from USGS quadrangle maps is alsoprovided for your use. The USNRC on-site response team was providedwith mylars of the subject study area, this map was one of them.
4. Please provide facility weather data for January 4, 1986. Informationconcerning temperature, relative humidity and general description(visibility) besides the wind speed and direction would be helpful.
The plant wind speed and direction chart for the accident period areattached with reference to 11:30 AM, January 4, 1986 noted (1400 onthe graph). Data from the Ft. Smith station concerning wind speed,direction, temperature and humidity are attached. The Oklahoma Citystation data for 11:00 AM, January 4, 1986 is also provided.
5. Please provide the results of uranium and fluoride analysis for theenvironmental air monitoring stations around the facility and off-sitelocations for the periods before, during and after the UF6 release.
The data for the fenceline and off-site monitor stations are attached.Sampling was done according to those procedures prescribed in licenseSUB-1010, Chapter 5.
6. Please provide the results of urinalysis taken of employees andoff-site residents.
This data was submitted on January 22, 1986, under separate cover toNRC Region IV. A copy was submitted to William Crow, NRC staff. Anyupdates to this submittal will be forwarded.
7. Have measurements been made to determine the amount of UF6 that waspotentially released to the environment?
At the time of the release emergency actions were taken which includedwater spray, with fog nozzles, to minimize the release. The resultingwash down water was routed to the facility emergency basin forpositive containment. Analysis of the basin contents resulting fromthe response action, shows that approximately 9,250 pounds uraniumwere recovered. This is 13,700 pounds of UF or about 46 percent ofthe material believed to have been in the cylinder. Further analysisof sod removed from in front of the building and facilitydecontamination solutions continues and these amounts will be added asthey are reported.
134

Edward ShumJanuary 27, 1986Page Three
Please contact me if you need further information at this time.
Sincerely,
Stauter, Director
Nuclear Licensing & Regulation
JCS/br
Attachments As Stated
cc: Robert L. Craig, Oklahoma State Department of Health
135
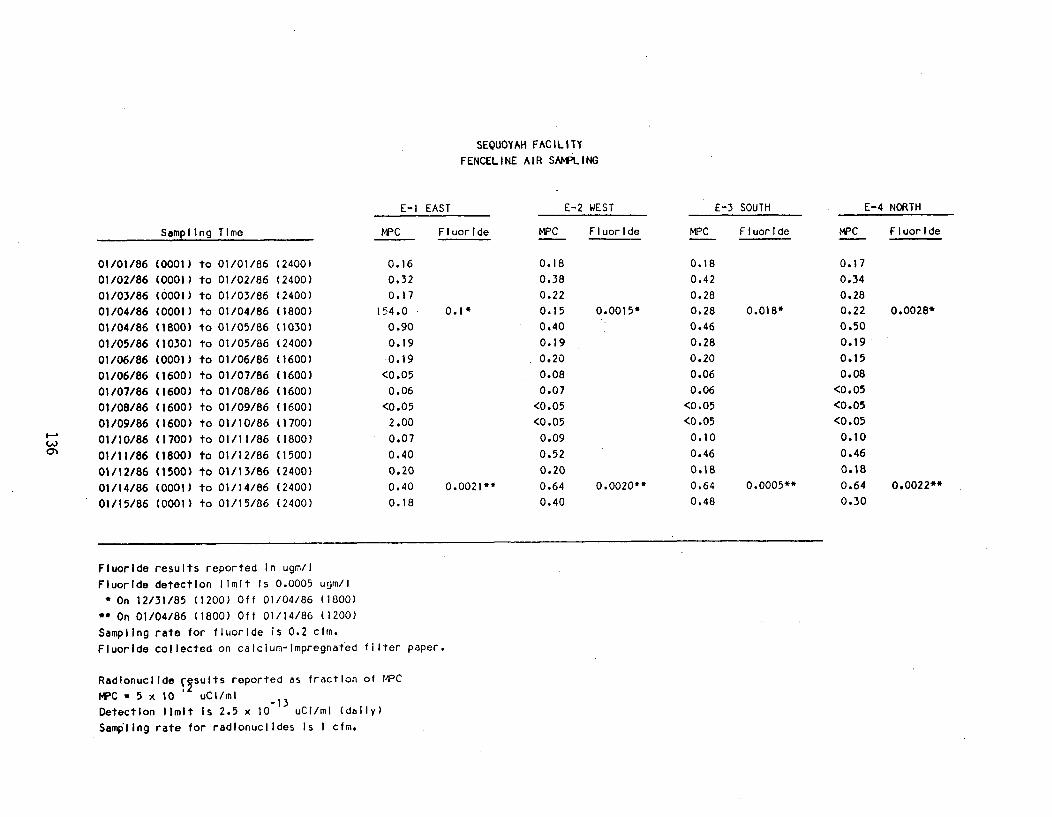
SEQUOYAH FACILITYFENCELINE AIR SAMPLING
E-I EAST E-2 WEST E-3 SOUTH E-4 NORTH
Sampling Time vPC Fluoride MPc Fluoride MPC Fluoride MPC Fluoride
01/01/86 (0001) to 01/01/86 (2400) 0.16 0.18 0.18 0.17
01/02/86 (0001) to 01/02/86 (2400) 0.32 0.38 0.42 0.34
01/03/86 (0001) to 01/03/86 (2400) 0.17 0.22 0.28 0.28
01/04/86 (0001) to 01/04/86 (1800) 154.0 0.1* 0.15 0.0015* 0.28 0.018* 0.22 0.0028*
01/04/86 (1800) to 01/05/86 (1030) 0.90 0.40 0.46 0.50
01/05/86 (1030) to 01/05/86 (2400) 0.19 0.19 0.28 0.19
01/06/86 (0001) to 01/06/86 (1600) 0.19 0.20 0.20 0.15
01/06/86 (1600) to 01/07/86 (1600) <0.05 0.08 0.06 0.08
01/07/86 (1600) to 01/08/86 (1600) 0.06 0.07 0.06 <0.05
01/08/86 (1600) to 01109186 (1600) <0.05 <0.05 <0.05 <0.05
01/09/86 (1600) to 01/10/86 (1700) 2.00 <0.05 <0.05 <0.05
01/10/86 (1700) to 01/11/86 (1800) 0.07 0.09 0.10 0.10
01/11/86 (1800) to 01/12/86 (1500) 0.40 0.52 0.46 0.46
01/12/86 (1500) to 01/13/86 (2400) 0.20 0.20 0.18 0.18
01/14/86 (0001) to 01/14/86 (2400) 0.40 0.0021** 0.64 0.0020** 0.64 0.0005** 0.64 0.0022**
01/15/86 (0001) to 01/15/86 (2400) 0.18 0.40 0.48 0.30
Fluoride results reported In ugm/IFluoride detection limit Is 0.0005 ugm/I
* On 12/31/85 (1200) Off 01/04/86 (1800)
** On 01/04/86 (1800) Off 01/14/86 (1200)
Sampling rate for fluoride is 0.2 cfm.
Fluoride collected on calcium-Impregnated filter paper.
Radionuclide Csults reported as fraction of MPC
PC - 5 x 10 uCl/mI -13
Detection limit Is 2.5 x 10 uCI/mI (daily)
Sampllng rate for radlonuclides Is I cfm.

SEQUOYAH FACILITYOFF-SITE ENVIRONMENTAL AIR SA4PLING
Sampling Time
2103
MPC Fluoride
<0.007 <0.0005
<0.007 <0.0005
2105
MPC Fluoride
2106
MPC Fluoride
2107
MPC Fluoride
2108
MPC Fluoride
12/10/8512/17/8512/24/85
*12/31/85*01/04/86*01/05/8601/06/86
*01/07/86*01/08/86
*01/09/86"01110/86*01/11/86
(1200)(1200)(1200)(1200)(1800)(1100)(1630)
(1530)(1530)(1530)(1700)
(1700)
to 12/17/85 (1200)to 12/24/85 (1200)
to 12/31/85
to 01/04/86
to 01/05/86
to 01/06/86
to 01/07/86
to 01/08/86
to 01/09/86
to 01/10/86
to 01/11/86
to 01/12/86
(1200)(1800)
(1100)
(1630)(1530)(1530)(1530)(1700)(1700)(1500)
<0.007<0.007
<0 .05
<0.05
<0. 05
<0.05
<0.05<0. 05
<0.05<0.05
<0.00050.0038
<0.007<0.007<0.007<0.007<0.05<0.05<0.05<0.05<0.05<0.05<0.05<0.05<0.05
<0.0005 <0.007<0.0005 <0.007<0.0005 <0.007
0.00351 <0.007<0.05<0.05
<0.05
<0.05<0.05
<0.05<0.05<0.05
0.00068 <0.05
<0.0005
<0.0005<0.0005
0.00307
<0. 0005
<0.007<0.007
<0.007
<0.007<0.05<0.05<0.05<0.05<0.05
NS<0.05<0.05<0.05
<0.0005 <0.007<0.0005 <0.007<0.0005 <0.007
0.00402 2.6<0.05<0.05
<0.05<0.05<0.05<0.05<0.05<0.05
0.00051 <0.05
<0.0005Q0.00050.000660.0038
<0.0005I-.j *01/12/86 (1500) to 01/14/86 (1200) <0.05 0.00061
Fluoride results reported In ug/I
Sampling rate for fluoride Is 0.2 cfm.
Fluoride collected on calcium-Impregnated filter paper.
Locations:
Radionuclide results reported as fraction of MPC.
Sampling rateljor radionuclides Is 1 cfm.
PC a 5 x 10 uCi/ml
Detection limit Is 3.6 x 10 uCl/mI (weekly); 2.5 x 10 uCi/ml (daily)*Final count done on 01/23/86
21032105210621072108
East, 1,000 feet from plant
1. Mile southwest of plant
Carlisle School
Highway 64 north of plant
1-40 south of plant
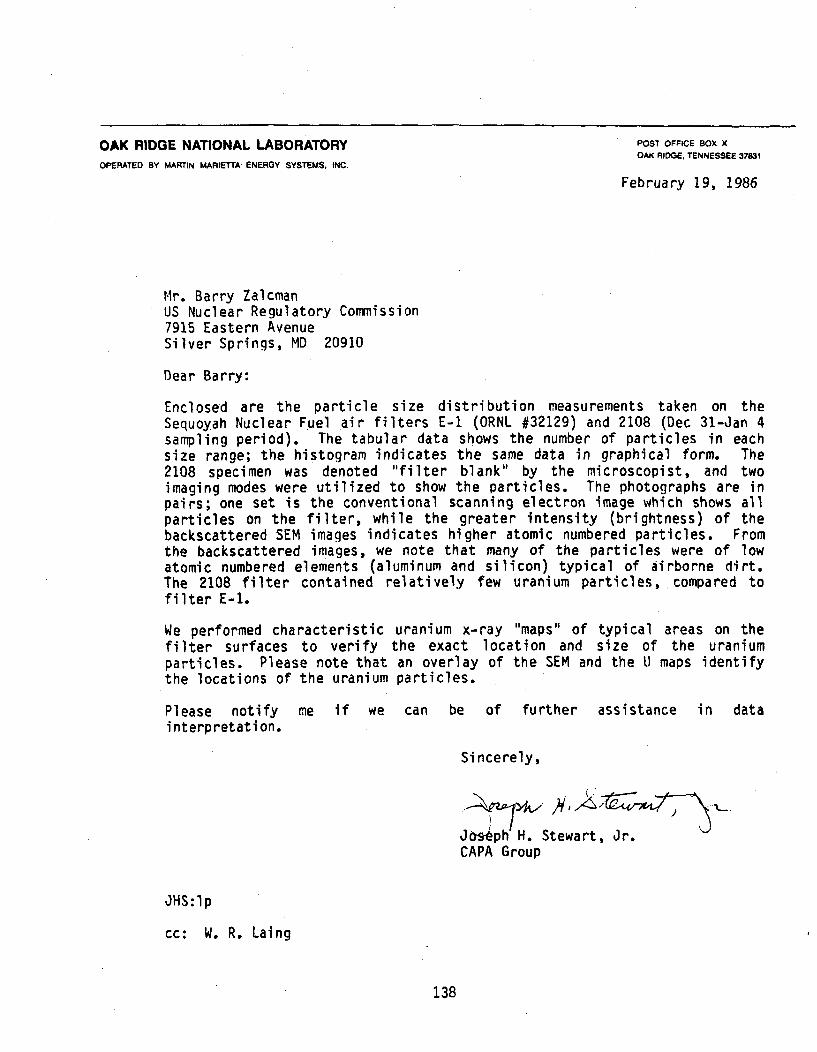
OAK RIDGE NATIONAL LABORATORY POST OFFICE BOX X
OAK RIDGE, TENNESSEE 37631
OPERATED BY MARTIN MARIETTA ENERGY SYSTEMS. INC.
February 19, 1986
Mr. Barry ZalcmanUS Nuclear Regulatory Commission7915 Eastern AvenueSilver Springs, MD 20910
Dear Barry:
Enclosed are the particle size distribution measurements taken on theSequoyah Nuclear Fuel air filters E-1 (ORNL #32129) and 2108 (Dec 31-Jan 4sampling period). The tabular data shows the number of particles in eachsize range; the histogram indicates the same data in graphical form. The2108 specimen was denoted "filter blank" by the microscopist, and twoimaging modes were utilized to show the particles. The photographs are inpairs; one set is the conventional scanning electron image which shows allparticles on the filter, while the greater intensity (brightness) of thebackscattered SEM images indicates higher atomic numbered particles. Fromthe backscattered images, we note that many of the particles were of lowatomic numbered elements (aluminum and silicon) typical of airborne dirt.The 2108 filter contained relatively few uranium particles, compared tofilter E-1.
We performed characteristic uranium x-ray "maps" of typical areas on thefilter surfaces to verify the exact location and size of the uraniumparticles. Please note that an overlay of the SEM and the U maps identifythe locations of the uranium particles.
Please notify me if we can be of further assistance in datainterpretation.
Sincerely,
Joseph H. Stewart, Jr.CAPA Group
JHS:lp
cc: W. R. Laing
138
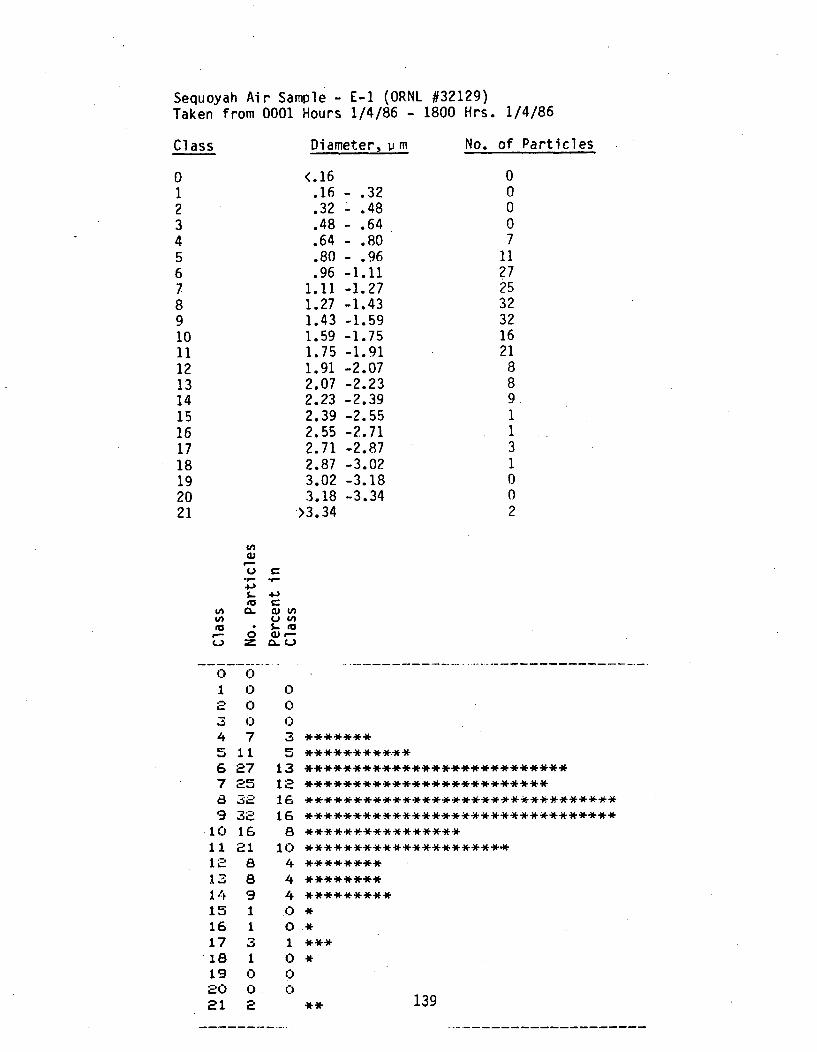
Sequoyah Air Sample - E-1 (ORNL #32129)Taken from 0001 Hours 1/4/86 - 1800 Hrs. 1/4/86
Class Diameter, v m
0123456789101112131415161718192021
<.16.16.32.48.64.80.96
1.111.271.431.591.751.912.072.232.392.552.712.873.023.18
>3.34
- .32' .48- .64- .80- .96-1.11-1.27-1.43-1.59-1.75-1.91-2.07-2.23-2.39-2.55-2.71-2.87-3.02-3.18-3.34
No. of Particles
00007
11
272532321621
88911
31002
4.1-
0
4.'
w-ninin0
9-.
C-)
0 0
1 02 03 04 75 116 27 17 25 1
32 19 3ac:10 16
11 21 112 813 814 9-15 116 117 318 1
19 020 021 2
0003
532668
0444001000 ** 139

Sample - Filter Blank
Class
0123456789
101112131415161718192021
Diameter, im
<.53.53- .61.61- .69.69- .77.77- .85.85- .93.93-1.01
1.01-1.091.09-1.171.17-1.251.25-1.331.33-1.411.41-1.491.49-1.,571.57-1. 641.64-1.721. 72-1 801.80-1. 881.88-1. 961.96-2. 042.04-2.12
>2.12
No. of Particles
03231
122
31210000002000
U,
4J-S.- 4.-)'UC
t o C -
1 3 13 *****************.*-*******************
2 2 9 **************************
3- 3 13********************4 1 4 *************5 1 4 *************6 2 9 **************************7 2 9 **************************8 3 13 ***************************************9 1 4 *************
10 2 9 **************************11 1 4 *************
12 0 013 0 014 0 015 0 016 0 017 0 018 2 9 **************************19 0 020 0 021 0 140

OAK RIDGE NATIONAL LABORATORYANALYTICAL CHEMISTRY DIVISIONBUILDING RM 517 PHONE
Willste Bldg. 8-42ACD REQ. NO.
51195COMMENTS
PHOTOGRAPLIIC REPORT SHEET
7-4216NAME
Barry ZalcmanSAMPLE NO.
9007 B 2/AT18/86
3
-I,
CI.C-)
M0 cl
N\30: r%)
00DCD
c I a La
-n,
Do
cu
Al
(DI
00)0D
AlC)
141

Other, photos in this set were omitted because they were difficult to reproduce.
142
APPENDIX 5.2.1
INTERORGANIZATIONAL COMPARISON RESULTS
143

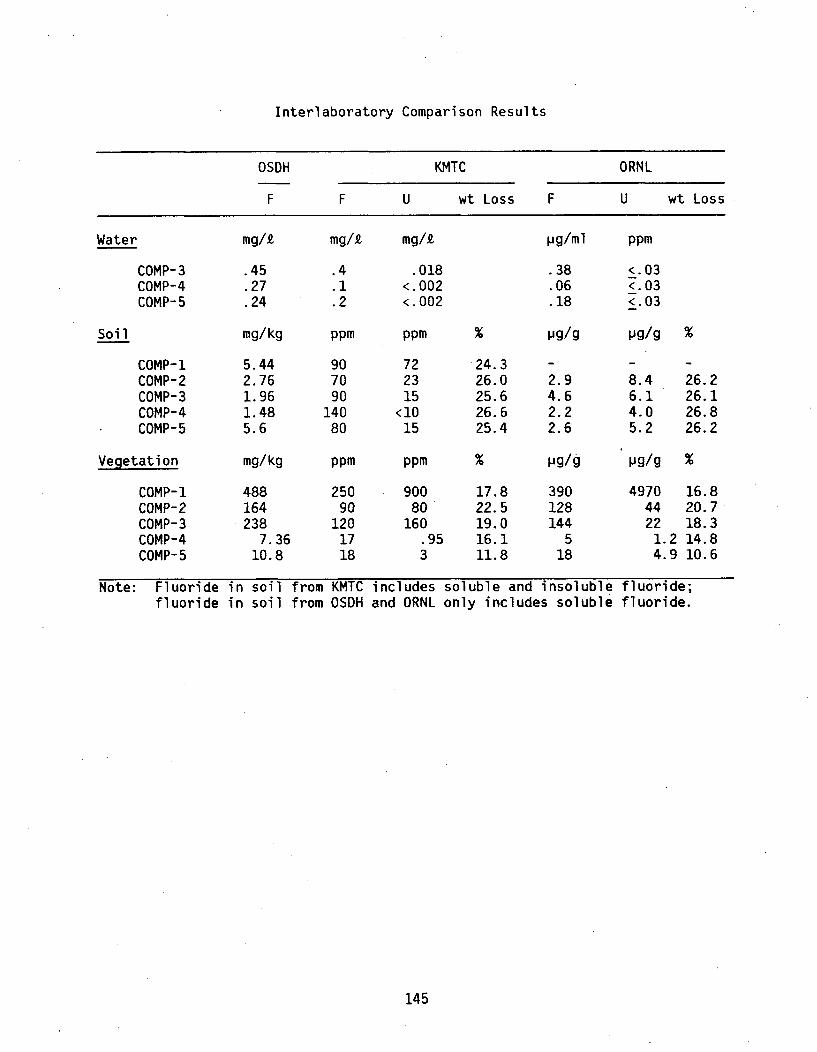
Interlaboratory Comparison Results
OSDH KMTC ORNL
F F U wt Loss F U wt Loss
Water mg/k mg/k mg/k Pg/ml ppm
COMP-3 .45 .4 .018 .38 <.03COMP-4 .27 .1 <.002 .06 <.03COMP-5 .24 .2 <.002 .18 <.03
Soil mg/kg ppm ppm % Pg/g Pg/g %
COMP-1 5.44 90 72 24.3 - - -
COMP-2 2.76 70 23 26.0 2.9 8.4 26.2COMP-3 1.96 90 15 25.6 4.6 6.1 26.1COMP-4 1.48 140 <10 26.6 2.2 4.0 26.8COMP-5 5.6 80 15 25.4 2.6 5.2 26.2
Vegetation mg/kg ppm ppm % Pg/g Pg/g %
COMP-1 488 250 900 17.8 390 4970 16.8COMP-2 164 90 80 22.5 128 44 20.7COMP-3 238 120 160 19.0 144 22 18.3COMP-4 7.36 17 .95 16.1 5 1.2 14.8COMP-5 10.8 18 3 11.8 18 4.9 10.6
Note: Fluoride in soil from KMTC includes soluble and insoluble fluoride;fluoride in soil from OSDH and ORNL only includes soluble fluoride.
145


APPENDIX 5.2.2
K-M TECHNICAL CENTER LABORATORY ANALYSIS PROCEDURES
147


SEQUOYAH FUELS CORPORATIONPOST OFFICE BO% 2586, a OKLAHOMA CITY OKLAHOMA '3'25
January 27, 1986
FEDERAL EXPRESS
Donald A. Cool, Ph.D.Uranium Fuel Licensing BranchDivision of Fuel Cycle & Material SafetyOffice of Nuclear Material Safety & SafeguardsUnited States Nuclear Regulatory CommissionWillste Building7915 Eastern AvenueSilver Spring, Maryland 20912
Re: License SUB-1010Docket 40-8027
Dear Dr. Cool:
Per your request of Friday, January 24, 1986, attached are the Kerr-McGeeTechnology Diviison, Technical Center analytical procedures, equipmentlist and calibration procedures applicable for the analysis of samplesfrom the Sequoyah Facility.
Copies of these procedures were provided to Dr. Blair Nickolas, USNRCRegion IV, during a visit to the Technical Center on January 7, 8, 9 and10, 1986.
If you have any further questions concerning the analytical procedures orquality control/quality assurance protocols used, please contact Dr. GaretVan de Steeg at (405) 341-8551.
Sincerely,
.C. Stauter, Director
Nuclear Licensing & Regulation
JCS/br
Attachments
149A SUBSIDIARY OF EW*M-WCEE COROaMV

APPENDIX I
EQUIPMENT LIST ANDCALIBRATION PROCEDURES
Page
A. Instrumentation for the Detection of Nuclear Events I
1. Gamma Radiation I
a. Packard Auto-Gamma Multi-Channel Analyzer Ib. Canberra Gemini Series 90 Gamma Pulse Height I
Analysis System
2.' Alpha and Beta Radiation 2
a. Canberra Model 2400 Low-Background Gas 2Proportional Counter
b. Packard Tricarb Liquid Scintillation 2Spectrometer
c. Ludlum Model 148 (GEV-1) Scintillation Counter 3d. Nuclear Measurements PC-4 Proportional Counter 3e. Random Scintillation Counter 3f. Princeton Gamma Tech Silicon Surface Barrier System 4g. Ludlum Model 248 (GEV-2) Scintillation Counter 4h. Capability 5i. Tracers 5
B. Inductively Coupled Argon Plasma Emission Spectroscopy (ICP) 5
C. Atomic Absorption Spectroscopy (AAS) 7
a. Perkin-Elmer (PE) Model 460 7b. Perkin-Elmer (PE) Model 280 9
D. X-Ray Radiation 9
a. Siemens D-500 X-ray Diffraction (XRD) System 9
b. Siemens SRS-300 X-ray Fluorescence (XRF) System 11
E. Absorption of Ultraviolet, Visible and Infrared Light 12
a. Perkin-Elmer (PE) Model 1750 (FT-IR) 12b. Varian Superscan I-BE, Beckman Model DU, Beckman 12
Model DB (UV-Visible)c. Jarrell Ash Model 26-000 Fluorimeter 12d. Calibration Procedure 12
150
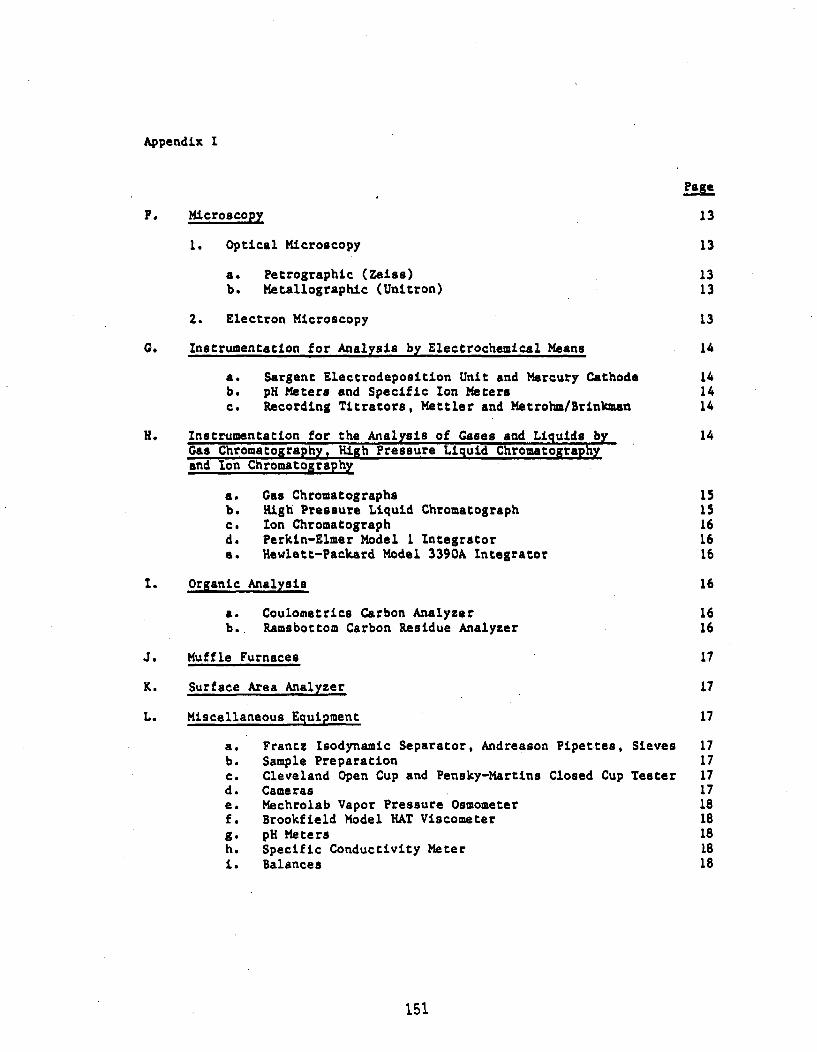
Appendix I
F. Microscopy 13
1. Optical Microscopy 13
a. Petrographic (Zeiss) 13b. Metallographic (Unitron) 13
2. Electron Microscopy 13
G. Instrumentation for Analysis by Electrochemical Means 14
a. Sargent Electrodeposition Unit and Mercury Cathode 14b. pH Meters and Specific Ion Meters 14c. Recording Titracors, Mettler and Metrohm/Brinkman 14
H. Instrumentation for the Analysis of Gases and Liquids by_ 14Gas Chromatography, High Pressure Liquid Chromatographyand Ion Chromatography
a. Gas Chromatographs 15b. High Pressure Liquid Chromatograph 15c. Ion Chromatograph 16d. Perkin-Elmer Model I Integrator 16a. Hewlett-Packard Model 3390A Integrator 16
I. Organic Analysis 16
a. Coulometrics Carbon Analyzer 16b. Ramabottom Carbon Residue Analyzer 16
J. Muffle Furnaces 17
K. Surface Area Analyzer 17
L. Miscellaneous Equipment 17
a. Frantz Isodynamic Separator, Andreason Pipettes, Sieves 17b. Sample Preparation 17c. Cleveland Open Cup and Pensky-Martins Closed Cup Tester 17d. Cameras 17e. Mechrolab Vapor Pressure Osmometer 18f. Brookfield Model HAT Viscometer 18g. pH Meters 18h. Specific Conductivity Meter 18i. Balances 18
151

Appendix I
Page
M. Quality Assurance - Quality Control 18
a. Definition 19b. Quality Assurance Plan 19
152

FUNCTIONS AND USE
A. Instrumentation for the Detection of Nuclear Events
1. Gamma Radiation
a. A Packard Auto-Gamma Multi-Channel Analyzer is a sodiumiodide based gamma detection system. This analyzer is usedfor routine gamma spectral analysis where only limitedspectral resolution is required. This instrument has a300-sample capacity automatic sample changer, a 1024 channelmulti-channel analyzer for storing the data, and a teletypefor recording the spectral information. The entire system issituated in a controlled environment room where temperature ismaintained at 21 0 C ± 10C. The system and its essentialcomponents are to be maintained as follows:
1) Maintenance and repair of electronic components are to beperformed by the manufacturer as required.
2) The counting system should be effficiency calibratedduring each 300-sample run and energy calibrated weekly.
3) Outage of electricity sufficient to cause loss of bias tothe detectors, or repair of detector or electronics iscause for recalibration prior to further analyses beingperformed. .
b. A Canberra Gemini Series 90 Gamma Pulse Height Analysis Systemis used for qualitative and quantitative analysis. Four gammadetectors, three wide range Ge(Li)s and an intrinsic Ge aresituated in low background gamma shields fabricated from6-inch thick pre WW-II steel plate. This system is used forabsolute measurement of gamma emitting radionuclides. Theentire system is situated in a controlled environment roomwhere the temperature is maintained at 21*C ± 10C. The systemand its essential components are to be maintained as follows:
1) Maintenance and repair for electronic components are tobe performed by the manufacturer as required, but atleast twice yearly.
2) Ge(Li) and Ge detector dewars are to be filled withliquid nitrogen weekly. The date of the liquid N2 fillis to be logged into a file maintained at the detectors.
3) The Ge(Li) and Ge detectors are calibrated at leastquarterly, and checked at least weekly, for efficiencyand energy calibrations using standards directlytraceable to the U. S. National Bureau of Standards.
153
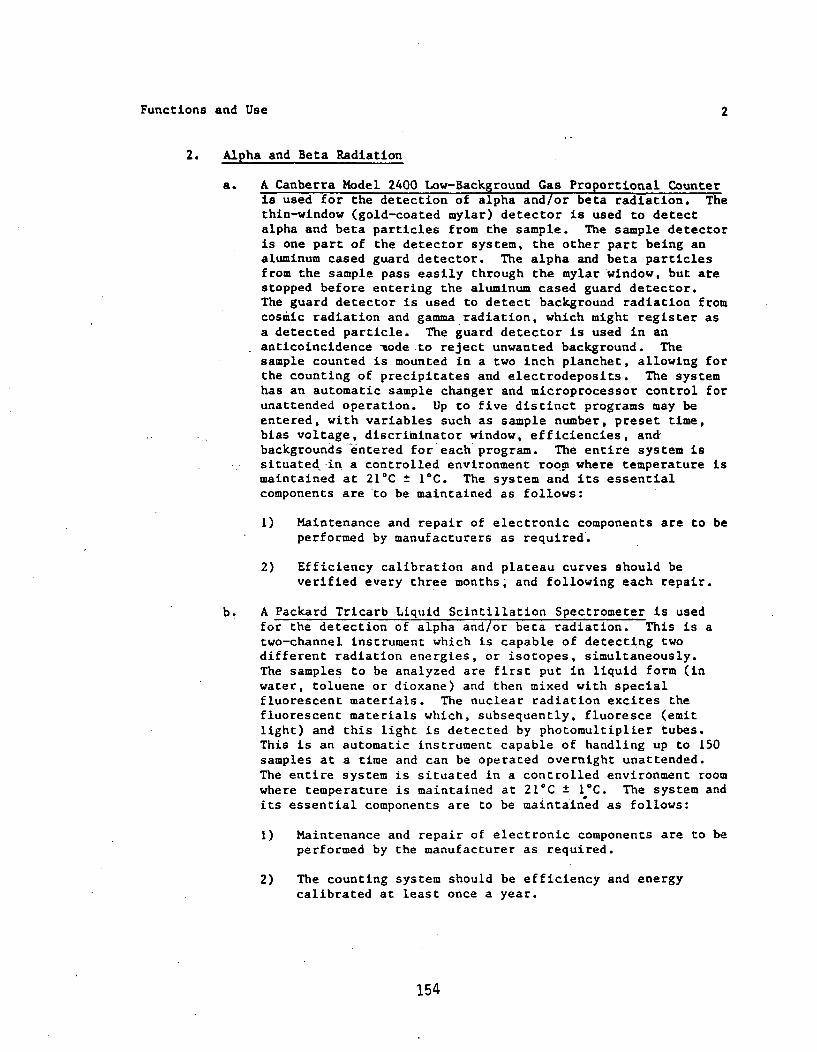
Functions and Use 2
2. Alpha and Beta Radiation
a. A Canberra Model 2400 Low-Background Gas Proportional Counteris used for the detection of alpha and/or beta radiation. Thethin-window (gold-coated mylar) detector is used to detectalpha and beta particles from the sample. The sample detectoris one part of the detector system, the other part being analuminum cased guard detector. The alpha and beta particlesfrom the sample pass easily through the mylar window, but atestopped before entering the aluminum cased guard detector.The guard detector is used to detect background radiation fromcosmic radiation and gamma radiation, which might register asa detected particle. The guard detector is used in ananticoincidence -node to reject unwanted background. Thesample counted is mounted in a two inch planchet, allowing forthe counting of precipitates and electrodeposits. The systemhas an automatic sample changer and microprocessor control forunattended operation. Up to five distinct programs may beentered, with variables such as sample number, preset time,bias voltage, discriminator window, efficiencies, andbackgrounds entered for each program. The entire system issituated in a controlled environment roo'm where temperature ismaintained at 21°C ± I°C. The system and its essentialcomponents are to be maintained as follows:
1) Maintenance and repair of electronic components are to beperformed by manufacturers as required.
2) Efficiency calibration and plateau curves should beverified every three months, and following each repair.
b. A Packard Tricarb Liquid Scintillation Spectrometer is usedfor the detection of alpha and/or beta radiation. This is atwo-channel instrument which is capable of detecting twodifferent radiation energies, or isotopes, simultaneously.The samples to be analyzed are first put in liquid form (inwater, toluene or dioxane) and then mixed with specialfluorescent materials. The nuclear radiation excites thefluorescent materials which, subsequently, fluoresce (emitlight) and this light is detected by photomultiplier tubes.This is an automatic instrument capable of handling up to 150samples at a time and can be operated overnight unattended.The entire system is situated in a controlled environment roomwhere temperature is maintained at 21%C ± IC. The system andits essential components are to be maintained as follows:
1) Maintenance and repair of electronic components are to beperformed by the manufacturer as required.
2) The counting system should be efficiency and energycalibrated at least once a year.
154
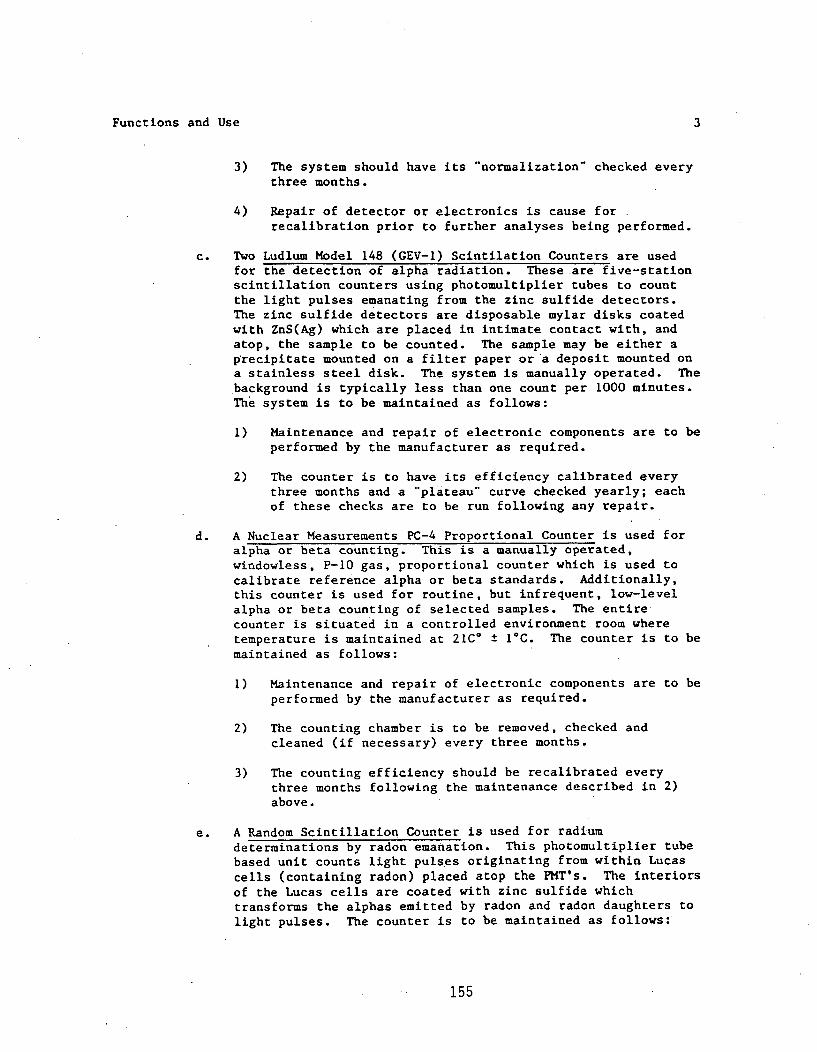
Functions and Use 3
3) The system should have its "normalization" checked everythree months.
4) Repair of detector or electronics is cause forrecalibration prior to further analyses being performed.
c. Two Ludlum Model 148 (GEV-1) Scintilation Counters are usedfor the detection of alpha radiation. These are five-stationscintillation counters using photomultiplier tubes to countthe light pulses emanating from the zinc sulfide detectors.The zinc sulfide detectors are disposable mylar disks coatedwith ZnS(Ag) which are placed in intimate contact with, andatop, the sample to be counted. The sample may be either aprecipitate mounted on a filter paper or a deposit mounted ona stainless steel disk. The system is manually operated. Thebackground is typically less than one count per 1000 minutes.The system is to be maintained as follows:
1) Maintenance and repair of electronic components are to beperformed by the manufacturer as required.
2) The counter is to have its efficiency calibrated everythree months and a -plateau" curve checked yearly; eachof these checks are to be run following any repair.
d. A Nuclear Measurements PC-4 Proportional Counter is used foralpha or beta counting. This is a manually operated,windowless, P-10 gas, proportional counter which is used tocalibrate reference alpha or beta standards. Additionally,this counter is used for routine, but infrequent, low-levelalpha or beta counting of selected samples. The entirecounter is situated in a controlled environment room wheretemperature is maintained at 21C' ± I*C. The counter is to bemaintained as follows:
1) Maintenance and repair of electronic components are to beperformed by the manufacturer as required.
2) The counting chamber is to be removed, checked andcleaned (if necessary) every three months.
3) The counting efficiency should be recalibrated everythree months following the maintenance described in 2)above.
e. A Random Scintillation Counter is used for radiumdeterminations by radon emanation. This photomultiplier tubebased unit counts light pulses originating from within Lucascells (containing radon) placed atop the PMT's. The interiorsof the Lucas cells are coated with zinc sulfide whichtransforms the alphas emitted by radon and radon daughters tolight pulses. The counter is to be maintained as follows:
155
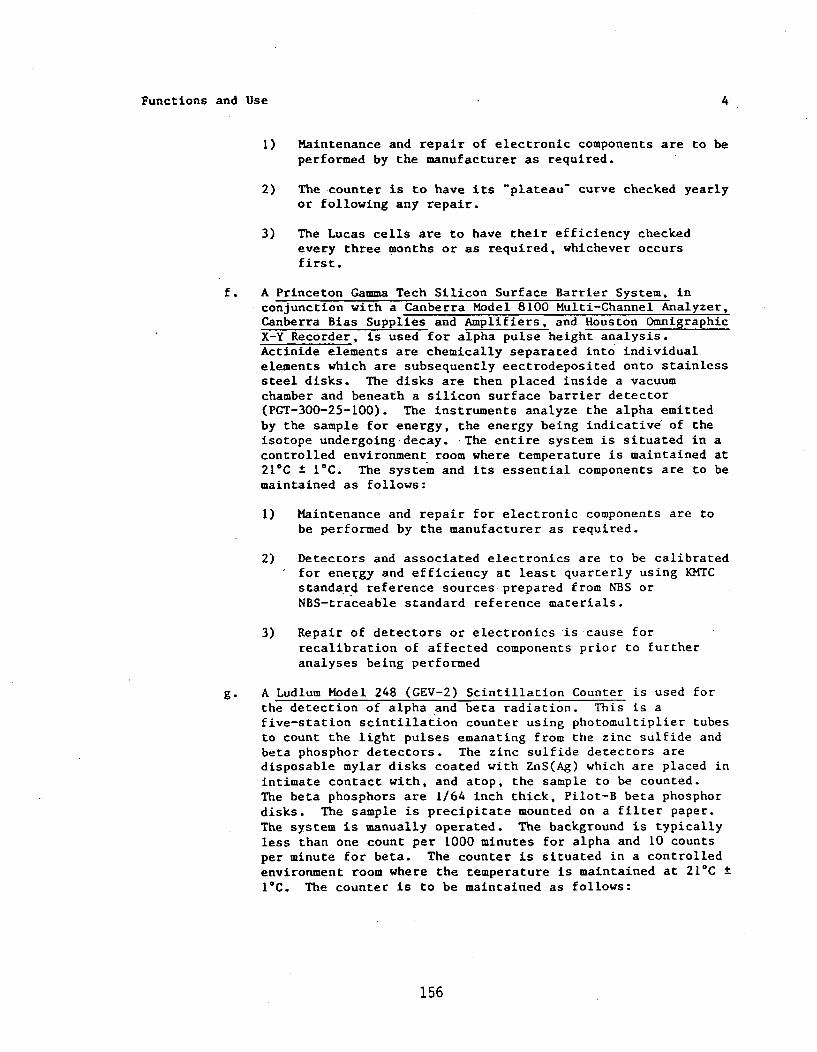
Functions and Use 4
1) Maintenance and repair of electronic components are to beperformed by the manufacturer as required.
2) The counter is to have its "plateau- curve checked yearlyor following any repair.
3) The Lucas cells are to have their efficiency checkedevery three months or as required, whichever occursfirst.
f. A Princeton Gamma Tech Silicon Surface Barrier System, inconjunction with a Canberra Model 8100 Multi-Channel Analyzer,Canberra Bias Supplies and Amplifiers, and Houston OmnigraphicX-Y Recorder, is used for alpha pulse height analysis.Actinide elements are chemically separated into individualelements which are subsequently eectrodeposited onto stainlesssteel disks. The disks are then placed inside a vacuumchamber and beneath a silicon surface barrier detector(PGT-300-25-100). The instruments analyze the alpha emittedby the sample for energy, the energy being indicative of theisotope undergoing decay. The entire system is situated in acontrolled environment room where temperature is maintained at21*C ± I*C. The system and its essential components are to bemaintained as follows:
1) Maintenance and repair for electronic components are tobe performed by the manufacturer as required.
2) Detectors and associated electronics are to be calibratedfor energy and efficiency at least quarterly using KMTCstandard reference sources prepared from NBS orNBS-traceable standard reference materials.
3) Repair of detectors or electronics is cause forrecalibration of affected components prior to furtheranalyses being performed
g. A Ludlum Model 248 (GEV-2) Scintillation Counter is used forthe detection of alpha and beta radiation. This is afive-station scintillation counter using photomultiplier tubesto count the light pulses emanating from the zinc sulfide andbeta phosphor detectors. The zinc sulfide detectors aredisposable mylar disks coated with ZnS(Ag) which are placed inintimate contact with, and atop, the sample to be counted.The beta phosphors are 1/64 inch thick, Pilot-B beta phosphordisks. The sample is precipitate mounted on a filter paper.The system is manually operated. The background is typicallyless than one count per 1000 minutes for alpha and 10 countsper minute for beta. The counter is situated in a controlledenvironment room where the temperature is maintained at 210C
I*C. The counter is to be maintained as follows:
156

Functions and Use 5
1) Maintenance and repair of electronic components are to beperformed by the manufacturer as required.
2) The counter is to have its efficiency calibrated everythree months and a "plateau" curve checked yearly; eachof these checks are to be run following any repair.
h. Capability
With the present intsrumentation, we are capable ofperforming most types of radiometric analyses such as alpha,beta or gamma spectroscopy, Ra-226, Th-230 and total U, Pu,Th, etc. Additionally, virtually any radioactive isotope canbe analyzed radiometrically should the need arise. Extremelylow-detection levels are maintained such that we routinelyanalyze at levels of 1 x 10 15 curies.
i. Tracers
A program to use radioactive tracers in the study of problemsrelating to chemical processing, analysis and engineering isavailable. Radioaetive tracers (isotopes) are used tosimplify the often difficult problem of monitoring thedisposition of materials in dilute systems or to simplifyotherwise difficult or impossible analytical procedures. Weare licensed to use any isotopes of atomic numbers 1 through96 in any chemical form.
B. Inductively Coupled Argon Plasma Emission Spectroscopy (ICP)
An argon plasma is maintained by the interaction of an RF field withionized argon gas and is reported to reach temperatures as high as12,000*K near the top load coil. Analytical measurements are made atplasma observation heights that correspond to temperatues in the rangeof 5500-8000*K. These high temperatures ensure complete dissociationand effective atomization of the various sample matrix elements, thusminimizing chemical interferences.
In order to form an argon plasma, RF power is applied through inductioncoils which surround the quartz plasma torch assembly. This creates anoscillating magnetic field. Three separate argon streams ultimatelydetermine the symmetry of the plasma. A tangential stream of argon(plasma gas) flows between the outer two quartz tubes of the ICP torchassembly. This stream produces a vortex stabilization of the plasmadischarge. A secondary stream of argon (coolant gas) passes between thesample introduction jet and the adjacent concentric tube. The coolantgas flow lifts the discharge slightly above the tip of the sampleintroduction jet to protect the quartz jet from the intense heat. Thesample aerosol is carried through the center quartz tube of the assemblyvia a third argon stream (carrier gas). The plasma is initiated when
157
Functions and Use 6
the argon is exposed to the discharge of a Tesla coil, thus creatingseed electrons and ions making the gas conductive. Inside the inducedmagnetic field, the charged particles are forced to flow in a closedannular path. As the particles meet resistance to their flow, ohmicheating takes place and additional ionization occurs. The processoccurs almost instantaneously, and the plasma expands symmetrically.
The basis of all emission spectroscopy is that atoms or ions in anenergized state, either directly or indirectly as a result of heating,spontaneously revert to a lower energy state and so doing emit a photonof energy. The ICF method of heating offers a much better chance foravoiding the self-absorption and self-reversal effects that arecharacteristic of both arcs and flames.
The light emitted by analyte atoms or ions must be converted toelectrical signals that can be measured quantitatively. This is done by
resolving the light into its component radiation by means of adiffraction grating and then measuring selected light intensities withphotomultiplier tubes at specific analyte wavelengths.
After appropriate analyte emission wavelengths are chosen, the
spectrometer can be calibrated using standard solutions. Then, analyteconcentrations can be determined for all sample solutions.
ICP Instrumentation
Applied ResearCh-Laboratories (ARL) Model 3520
This ICP is a sequential instrument with a scanning 1.0 metervacuum monochromator. It is equipped with a 1080.1ines/mm concavereflecting grating (produced using laser interferometry) with ahorizontal Paschen-Runge mounting. Light intensities are measuredby two photomultiplier tubes (PMTs), one for UV and the other forvisible up to IR. The two PMTs are mounted on'-a carriage.Metal-dielectric-metal, narrow bandpass filters allow the use ofhigher orders to provide higher resolution. The positioning of theprimary slit, the selection of filters, the setting of PMTmillivoltages, the selection PMTs, and the selection of PMTpositions are microprocessor controlled.
The radio frequency (RF) generator is a crytal controlledoscillator operating at 27.12 MHz.
The central processor unit (CPU) is comprised of a PDP 11/23computer with 16 bit parallel logic. It is equipped with a realtime clock, 256K bytes MOS memory and bootstrap.
The computer is also equipped with an RLOI disk controller, a VT100 display terminal, and an LA-120 printer.
The SAS/DPS software is a program package consisting of an RT-1Isystem and an SAP-Il Spectrometer Automation Program.
158
Functions and Use 7
This ICP system is to be maintained as follows:
1) Maintenance and repair of major components are to be performedby the instrument and computer manufacturer as required.
2) There will be yearly preventive maintenance conducted by anARL service engineer.
3) A system log will be generated daily and compared to thespecifications set by the manufacturer.
4) The nebulizer will be cleaned daily.
5) Sensitivity will be evaluated monthly as prescribed by themanufacturer.
C. Atomic Absorption Specroscopy (AAS)
Atomic absorption is an analytical technique that is used for thequantitative determination of metal concentrations in a wide variety ofmaterials.
Atomic absorption is the process that occurs when a ground state atomabsorbs energy in the form of light of a specific wavelength and is thuselevated to an excited state. The amount of light energy absorbed atthis wavelength will increase proportionately as the number of atoms ofthe selected element in the light path increases. Therefore, the' linearrelationship between the various analyte concentrations present incalibration standards and the light absorbed by those standards can beused to determine unknown analyte concentrations present in samplesolutions.
The basic instrumentation for atomic absorption requires a primary lightsource, an atom source, a monochromator to isolate the specificwavelength of light to be used, a detector to measure the amount oflight accurately, electronics to treat the signal and a data loggingdevice to display the results. The light source used is either a hollowcathode lamp (HCL) or an electrodeless discharge lamp (EDL). The atomsource used must produce free analyte atoms from the sample. The sourceof energy for free atom production is heat, most commonly in form of anair-acetylene or nitrous oxide-acetylene flame or a graphite furnace.The sample is introduced as an aerosol into the flame and as a liquidinto the graphite furnace. The flame burner head or furnace cell isaligned so that the light beam passes through the flame or graphite tubewhere the light is absorbed.
Atomic Absorption Instruments
a. Two Perkin-Elmer (PE) Model 460s
These are microcomputerized double-beam atomic absorptionspectrometers. They are equipped with a PE safety interlock burner
159
Functions and Use 8
system for use with nitrous oxide-acetylene and air-acetyleneflames. One of these is equipped with a PE Model HGA-500 graphitefurnace for ultra-trace (low ppb) metals analyses. Hollow cathodeand electrodeless discharge light sources are used. These systemsare to be maintained as follows:
1) Maintenance and repair are to be performed by the manufactureras required.
2) The burner system is to be cleaned with a Contrad 70 cleaningsolution and rinsed with 1+1 hydrochloric acid and deionizedwater. This is to be done on a daily basis or more frequentlyif required.
3) The nebulizer system is to be cleaned on a daily basis with aContrad 70 cleaning solution and rinsed with 1+1 hydrochloricacid and deionized water. Replace the needle assembly andventuri every six months or sooner if required. Aspirationrate is to be adjusted to -6 ml/min.
4) Visual inspection of the optics for "clouding- should beperformed every 3 months, or sooner if needed.
5) The D2 arc output and alignment should be checked monthly, orsooner if required.
6) The HGA-500 graphite furnace is to be checked as follows:
. Internal gas flows - check with bubble flow meter asdescribed in the HGA-500 manual every 3-months, or
.• sooner if required.
Replace furnace cones every 3 months, or sooner ifrequired.
Replace furnace quartz windows every 3 months, or soonerif required.
Furnace cooling system - check every 3 months, or soonerif required.
Inspect and clean optical heat sensor before eachanalysis.
7) Sensitivity checks must be conducted every 3 months, orsooner if required.
8) A system log will be prepared on a daily basis and compared tothe specifications set by the manufacturer.
160
Functions and Use 9
b. Perkin Elmer (PE) Model 280
This single beam instrument is equipped with a PE safety interlockburner system for use with nitrous oxide-acetylene andair-acetylene flames. It is to be maintained using the sameprocedures as are used for the (PE) Model 460s.
The instrument was recently equipped with a 60 Hz mechanicalchopper. Now EDLs can be used with the Model 280 specifically forhydride generation and cold vapor mercury analyses. The MHS-20Hydride Generation Apparatus has been installed on the Model 280.
D. X-Ray Radiation
X-ray diffraction (XRD) and x-ray fluorescence (XRF) both utilize highenergy electromagnetic radiation. This radiation is produced whenelectrons are "boiled off" the surface of a heated tungsten filament,and accelerated by a high voltage potential toward a suitable target.Primary x-rays are generated by the stepwise deceleration of highvelocity electrons as they approach the atoms that make up the target ofthe x-ray tube. These x-rays, traveling in straight lines at the speedof light, exhibit properties of both waves and discreet particles. Thisduality allows them to interact with matter in several ways. Examplesof wave properties are reflection, refraction, polarization, coherentscatter, velocity and diffraction. Examples of corpuscular propertiesare incoherent scatter, gas ionization, photoelectric absorption andscintillation production.
X-ray diffraction occurs when x-rays are scattered by a crystallinematerial. The scattered x-rays will interact by constructiveinterference to yield diffracted rays. If x-rays of known wavelength Iimpinge on a crystal whose lattice planes are separated by the distanced, the radiation will be strongly reflected at specific angles 6. Sincethe wavelength X is known and the 20 angles of the reflections measured,the corresponding values of d (lattice plane spacings) can becalculated. This phenomenon was investigated by W. L. Bragg and hisfather W. H. Bragg, and is defined as Bragg's equation: (nX = 2d sin 8).
X-ray fluorescence occurs when primary x-rays create a vacancy byexpelling an electron from the inner orbitals of the atoms of a sample.Electrons from orbitals that are farther away from the nucleus can thenfall into the vacancy created.. The difference in energy between theorbitals is emitted as a secondary x-ray of a precise quanta. Thisradiation is dispersed into the individual spectral lines by reflectionat an analyzer crystal. The amount of the element present is related tothe intensity of the secondary fluorescent radiation detected from thesample.
a. X-ray Diffraction (XRD) (Siemens D-500)
X-ray diffraction permits the rapid qualtitative identification ofcrystalline solids by yielding an XRD pattern that ischaracteristic for that crystalline material. This pattern iscompared to the patterns of known compounds in the JCPDS literature
161
Functions and Use 10
(Joint Committee for Powder Diffraction Standards) for matching.This search of the literature can be performed either manually orby computer. The entire JCPDS data base (40,000 compounds,inorganic and organic) can be searched by computer while the Siemacmicroprocessor is independently running a scan.
Quantitative x-ray diffraction analysis is also possible byanalyzing a series of carefully chosen peaks present in both thesamples and a prepared standard for the phases of interest.
With the'automated sample changer, up to 40 samples may be rununder the control of the PDP 11/23+ computer. This enablesovernight, unattended operation for both qualtitative andquantitative analysis.
Unit cell refinement is also possible using the program, APPLE, anddetermination of crystallite size by the program CRYSIZ.
These x-ray analyses are nondestructive in nature and the sample isavailable afterwards for analysis by other techniques.
The Siemens D-500 system consists of a KRISTALLOFLEX 805 generator,thallium doped Nal detector with graphite monochromator, coppertargeted x-ray tube (molybdenum optional), DIFFRAC V softwarepackage with JCPDS data base, Tektronix 4027A graphics terminal,DEC LA-120 printer, Hewlett-Packard 7220C graphics plotter, and DECPDP 11/23+ computer for control of the 40 position sample changerand the goniometer.
Routine and emergency service is provided by Siemens under a yearlyservice contract. The following procedure will check on thealignment of the system optics. For the "five fingers of quartz"XRD scan, analyze the novaculite standard under the followingconditions and compare to previous scans.
Slit Number Degrees KV MA Det. Volt
1 1 40 30 1050
III I Time Constant = I secondIV .018 Goniometer speed = 1/5 per min
V .15 Chart speed = 2 cm/minute
Scale = I x 103
Start the scan at 67.5 degrees and end at 68.7 degrees.
An additional check on the overall alignment may be performed byscanning the NBS silicon standard at .01 degree two-theta steps andcounting for one second at each step. The program ADR is then runto locate the peaks and determine their intensities. The resultsof the scans are compared to previous scans.
162
Functions and Use I1I
Slit Number Degrees KV MA
I 1 50 30II 1
III I Time constant - I secondIV .05V .15
Analyze the novaculite standard from 20.0 through 30.0 degreestwo-theta and run the program ADR to locate the peaks and determinetheir intensities. Compare to previous scans.
Slit Number Degrees KV MA
I 1 50 30II I
III I Time constant - I secondIV .05
V .15
b. X-Ray Fluorescence (XRF) (Siemens SRS-300)
X-ray fluorescence is a rapid qualitative and quantitativeanalytical method for the determination of elementalconcentrations. It is useful over a wide range of concentrationsand for a wide variety of samples. The Siemens SRS-300 automatedsequential x-ray fluorescence unit is capable of detecting elementsfrom boron (Z 5) through uranium (Z = 92), but is presentlyconfigured to analyze from sodium (Z = 11) on up.
Under the control of the DEC PDP 11/23+ computer, up to 10 samplescan be scanned under a wide range of operating parameters. Theatmosphere of the sample chamber, the voltages, analyzing crystals,detectors, counting times, pulse height windows, soller slits,deadtime correction, filters, mask sizes, and sample rotation areunder control of the computer. These can be varied to provideoptimum analyzing conditions for each element and each matrix.Sample preparation is usually minimal, with grinding andpelletizing handling the majority of the samples submitted. Themethod is nondestructive; however, the sample usually has a binderadded to it as an aid in pelletizing.
Routine and emergency service is provided by Siemens under a yearlyservice contract.
Presently, a synthetic ilmenite standard is being used as a checkon the instrument's performance. A more durable standard would bebeneficial for the long term. A polished metal alloy of knowncomposition is something we hope to obtain shortly for use inverifing the instrument's operating condition.
163

Functions and Use 12
E. Absorption of Ultraviolet, Visible and Infrared Light
a. Perkin-Elmer (PE) Model 1750 FT-IR
Instrumentation has been described which utilizes the emission oflight for analysis. The converse, the absorption of light, is moreadaptable for the analysis of ionic and molecular species insolutions, gases, and some solids, and it can also be used for theanalysis of metal atoms in the atomic or ground state.
Fourier-Transform Infrared Spectroscopy (FT-IR) is a lightabsorption technique that employs the lower energy region of thatpart of the electromagnetic spectrum referred to as -light".Samples in solid, liquid or gaseous form are subjected to infraredradiation in the 2.5-25 micrometer wavelength range. When theenergy of the radiation coincides with the proper energy to raise amolecule to an excited molecular state, the radiation is absorbed.The absorption energy is characteristic of the vibration (bending),stretching or rotation mode of the molecule. Infrared isprincipally used for the investigation of organic molecules.
b. The Varian Superscan I-BE is a recording ultraviolet (UV) - visible(Vis) spectrophotometer. Its range is from 190 to 900 nanometers(nm). Ultraviolet-Vis absorption spectroscopy employs the middleand higher energy region of that part of the electromagneticspectrum referred to as -light". Samples in either solid, liquid,or gaseous form are subjected to UV or Vis radiation. When theenergy of the radiation coincides with the energy of an electronictransition, an electron is promoted to a higher energy level andradiation is absorbed. The electronic may be either molecular(i.e., promoting an electron normally thought of as beingassociated with a chemical bond such as the UV absorption ofaromatic molecules) or atomic (i.e., prompting an electron normallythought of as being associated with an atom such as d-d transitionfor "transition-series" elements in solution). Ultraviolet-Visspectroscopy is principally used for the investigation of inorganicions and inorganic complexes of "transition-series metals".
Other instruments available of this type, but less flexible, arethe Beckman Models DU and DB.
c. A Jarrell-Ash Fluorimeter Model 26-000 is available for thedetermination of uranium in solid samples. Uranium in a mixedsodium-lithium fluoride melt will fluoresce under the influence ofnear ultraviolet light. The amount of fluorescence is dependentupon the quantity of uranium-Vt present. Typical sensitivities areon the order of I to 5 parts per billion uranium.
d. Calibration Procedure
The spectrophotometers are situated in several-areas of the KMTC
and, at times, are moved to other locations. They are to bemaintained as follows:
164
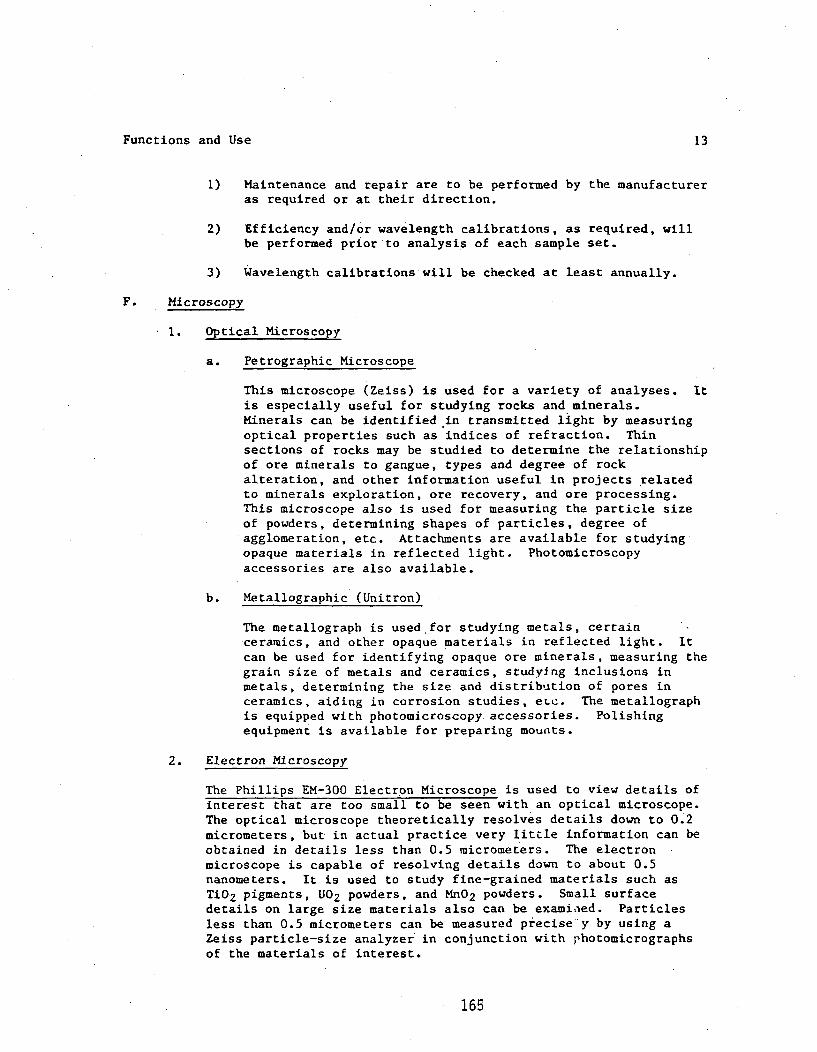
Functions and Use 13
1) Maintenance and repair are to be performed by the manufactureras required or at their direction.
2) Efficiency and/or wavelength calibrations, as required, willbe performed prior to analysis of each sample set.
3) Wavelength calibrations will be checked at least annually.
F. Microscopy
1. Optical Microscopy
a. Petrographic Microscope
This microscope (Zeiss) is used for a variety of analyses. Itis especially useful for studying rocks and minerals.Minerals can be identified in transmitted light by measuringoptical properties such as indices of refraction. Thinsections of rocks may be studied to determine the relationshipof ore minerals to gangue, types and degree of rockalteration, and other information useful in projects relatedto minerals exploration, ore recovery, and ore processing.This microscope also is used for measuring the particle sizeof powders, determining shapes of particles, degree ofagglomeration, etc. Attachments are available for studyingopaque materials in reflected light. Photomicroscopyaccessories are also available.
b. Metallographic (Unitron)
The metallograph is used for studying metals, certainceramics, and other opaque materials in reflected light. Itcan be used for identifying opaque ore minerals, measuring thegrain size of metals and ceramics, studying inclusions inmetals, determining the size and distribution of pores inceramics, aiding in corrosion studies, eLC. The metallographis equipped with photomicroscopy.accessories. Polishingequipment is available for preparing mounts.
2. Electron Microscopy
The Phillips EM-300 Electron Microscope is used to view details ofinterest that are too small to be seen with an optical microscope.The optical microscope theoretically resolves details down to 0.2micrometers, but in actual practice very little information can beobtained in details less than 0.5 micrometers. The electronmicroscope is capable of resolving details down to about 0.5nanometers. It is used to study fine-grained materials such asTiO2 pigments, U02 powders, and MnO 2 powders. Small surfacedetails on large size materials also can be examiaed. Particlesless than 0.5 micrometers can be measured precise y by using aZeiss particle-size analyzer in conjunction with photomicrographsof the materials of interest.
165
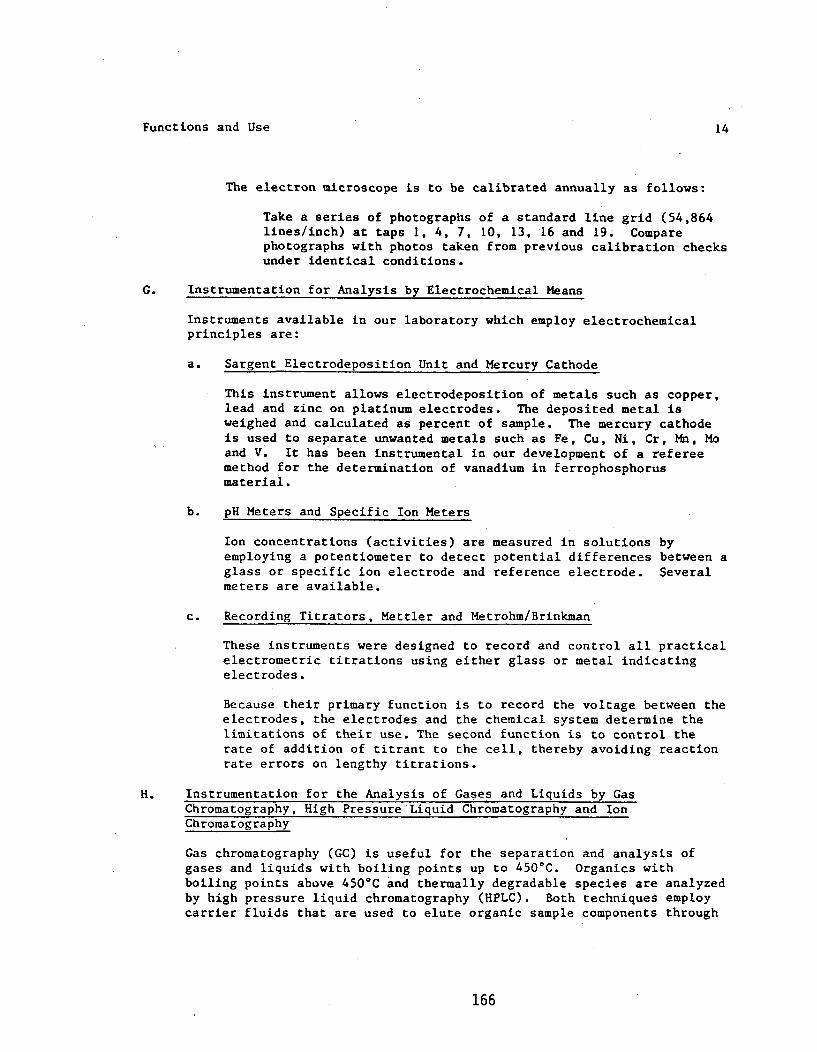
Functions and Use 14
The electron microscope is to be calibrated annually as follows:
Take a series of photographs of a standard line grid (54,864lines/inch) at taps 1, 4, 7, 10, 13, 16 and 19. Comparephotographs with photos taken from previous calibration checksunder identical conditions.
G. Instrumentation for Analysis by Electrochemical Means
Instruments available in our laboratory which employ electrochemicalprinciples are:
a. Sargent Electrodeposition Unit and Mercury Cathode
This instrument allows electrodeposition of metals such as copper,lead and zinc on platinum electrodes. The deposited metal isweighed and calculated as percent of sample. The mercury cathodeis used to separate unwanted metals such as Fe, Cu, Ni, Cr, Mn, Moand V. It has been instrumental in our development of a refereemethod for the determination of vanadium in ferrophosphorusmaterial.
b. pH Meters and Specific Ion Meters
Ion concentrations (activities) are measured in solutions byemploying a potentiometer to detect potential differences between aglass or specific ion electrode and reference electrode. Severalmeters are available.
c. Recording Titrators, Mettler and Metrohm/Brinkman
These instruments were designed to record and control all practicalelectrometric titrations using either glass or metal indicatingelectrodes.
Because their primary function is to record the voltage between theelectrodes, the electrodes and the chemical system determine thelimitations of their use. The second function is to control therate of addition of titrant to the cell, thereby avoiding reactionrate errors on lengthy titrations.
H. Instrumentation for the Analysis of Gases and Liquids by GasChromatography, High Pressure Liquid Chromatography and IonChromatography
Gas chromatography (GC) is useful for the separation and analysis ofgases and liquids with boiling points up to 450*C. Organics withboiling points above 450°C and thermally degradable species are analyzedby high pressure liquid chromatography (HPLC). Both techniques employcarrier fluids that are used to elute organic sample components through
166

Functions and Use 15
the columns at different rates, depending on how they partition betweenthe stationary phase and carrier. Components are detected by variousmeans as they emerge from the column. The detected components aredisplayed as peaks on a potentiometric strip chart recorder.
In GC, the carrier is a gas such as helium and samples are eluted asgases (liquids may be converted to gases in a heated compartment priorto entering the column). In HPLC, the carrier is a liquid such asmethanol and components are eluted as liquids.
In GC, temperature programming is used to permit the analysis of bothheavy and light components in a single sample. In HPLC, the temperatureis usually low and constant and changes in column material and columnpolarity are used to effect the separation of heavy and light componentsin liquid samples.
a. Gas Chromatographs available are as follows:
Thermal Conduct. Flame IonizationManufacturer Model # Detector (TCD) Detector (FID)
Carle SX-AGC Yes NoHewlett-Packard 5830 No YesHewlett-Packard 5840 No Yes
They are to be maintained and calibrated as follows:
1) Maintenance and repair are to be performed by the manufactureror according to his specifications as required.
2) Standards are to be run prior to each sample set beinganalyzed to calibrate the instrument.
b. High Pressue Liquid Chromatograph
One HPLC instrument is available; namely, the Waters ModelALC-202/401 equipped with solvent programmer, refractive index andultraviolet detectors and using the Fisher Recordall 2-penrecorder. It is to be maintained and calibrated as follows:
1) Maintenance and repair are to be performed by the manufactureror according to his specifications as required.
2) Standards are to be run prior to each sample set beinganalyzed to calibrate the instrument.
167
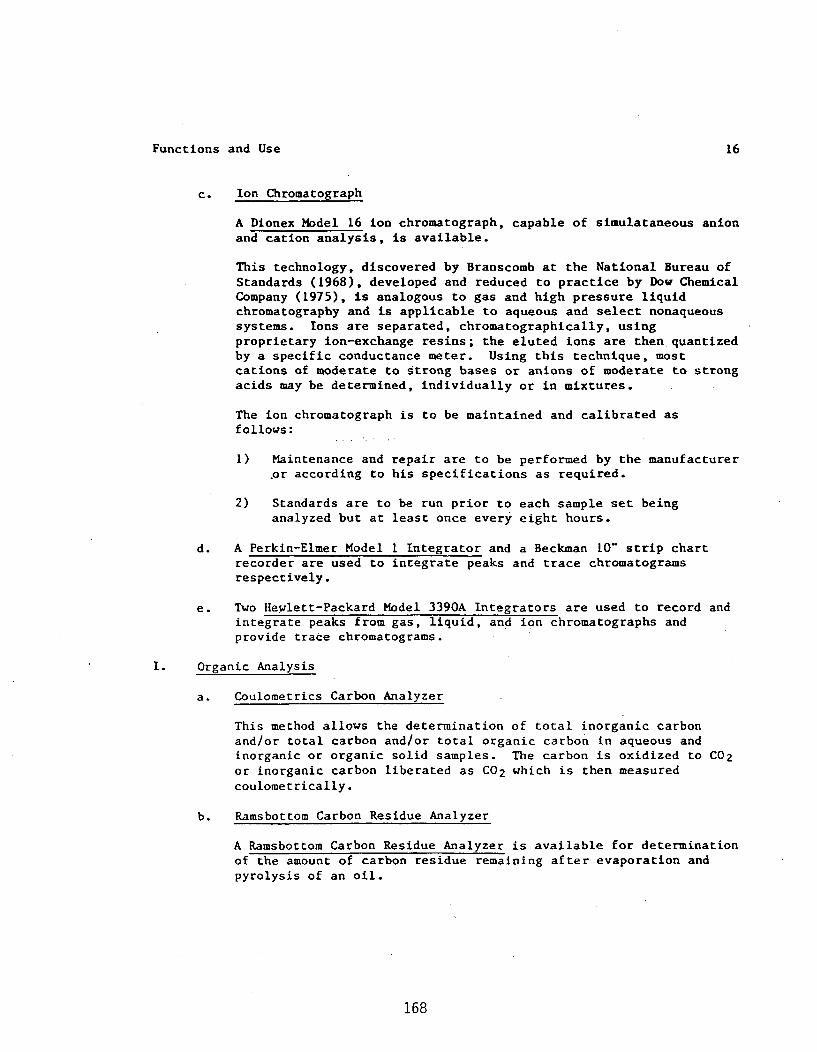
Functions and Use 16
c. Ion Chromatograph
A Dionex Model 16 ion chromatograph, capable of simulataneous anionand cation analysis, is available.
This technology, discovered by Branscomb at the National Bureau of
Standards (1968), developed and reduced to practice by Dow ChemicalCompany (1975), is analogous to gas and high pressure liquidchromatography and is applicable to aqueous and select nonaqueoussystems. Ions are separated, chromatographically, usingproprietary ion-exchange resins; the eluted ions are then quantizedby a specific conductance meter. Using this technique, mostcations of moderate to strong bases or anions of moderate to strongacids may be determined, individually or in mixtures.
The ion chromatograph is to be maintained and calibrated asfollows:
1) Maintenance and repair are to be performed by the manufacturer.or according to his specifications as required.
2) Standards are to be run prior to each sample set beinganalyzed but at least once every eight hours.
d. A Perkin-Elmer Model I Integrator and a Beckman 10" strip chartrecorder are used to integrate peaks and trace chromatogramsrespectively.
e. Two Hewlett-Packard Model 3390A Integrators are used to record andintegrate peaks from gas, liquid, and ion chromatographs andprovide trace chromatograms.
I. Organic Analysis
a. Coulometrics Carbon Analyzer
This method allows the determination of total inorganic carbonand/or total carbon and/or total organic carbon in aqueous andinorganic or organic solid samples. The carbon is oxidized to C02or inorganic carbon liberated as CO2 which is then measuredcoulometrically.
b. Ramsbottom Carbon Residue Analyzer
A Ramsbottom Carbon Residue Analyzer is available for determinationof the amount of carbon residue remaining after evaporation andpyrolysis of an oil.
168
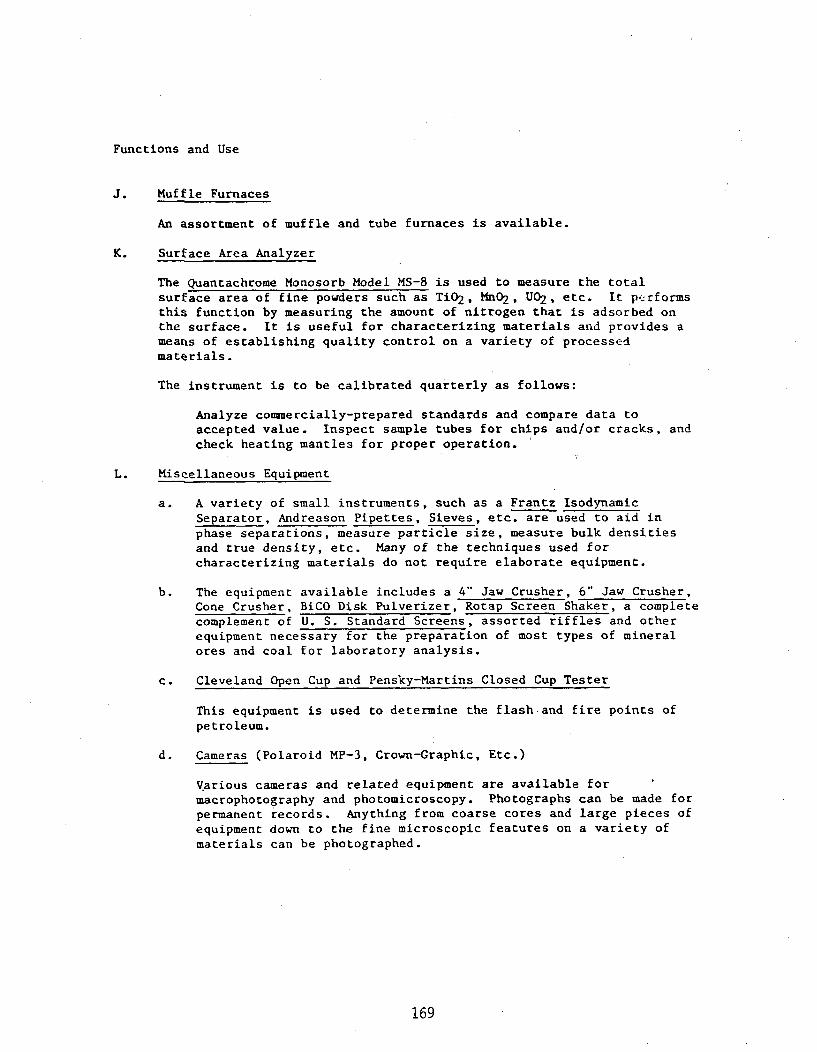
Functions and Use
J. Muffle Furnaces
An assortment of muffle and tube furnaces is available.
K. Surface Area Analyzer
The Quantachrome Monosorb Model MS-8 is used to measure the totalsurface area of fine powders such as TiO2 , MnO2 , U02 , etc. It purformsthis function by measuring the amount of nitrogen that is adsorbed onthe surface. It is useful for characterizing materials and provides ameans of establishing quality control on a variety of processedmaterials.
The instrument is to be calibrated quarterly as follows:
Analyze commercially-prepared standards and compare data toaccepted value. Inspect sample tubes for chips and/or cracks, andcheck heating mantles for proper operation.
L. Miscellaneous Equipment
a. A variety of small instruments, such as a Frantz IsodynamicSeparator, Andreason Pipettes, Sieves, etc. are used to aid inphase separations, measure particle size, measure bulk densitiesand true density, etc. Many of the techniques used forcharacterizing materials do not require elaborate equipment.
b. The equipment available includes a 4- Jaw Crusher, 6" Jaw Crusher,
Cone Crusher, BiCO Disk Pulverizer, Rotap Screen Shaker, a completecomplement of U. S. Standard Screens, assorted riffles and otherequipment necessary for the preparation of most types of mineralores and coal for laboratory analysis.
C. Cleveland Open Cup and Pensky-Martins Closed Cup Tester
This equipment is used to determine the flashand fire points ofpetroleum.
d. Cameras (Polaroid MP-3, Crown-Graphic, Etc.)
Various cameras and related equipment are available formacrophotography and photomicroscopy. Photographs can be made forpermanent records. Anything from coarse cores and large pieces ofequipment down to the fine microscopic features on a variety ofmaterials can be photographed.
169
Functions and Use 18
e. Mechrolab Vapor Pressure Osmometer
The Mechrolab Vapor Pressure Osmometer is used for thedetermination of the molecular weight of organic molecules.
f. Brookfield Model HAT Viscometer
The Brookfield Model HAT Viscometer is used for measuringviscosities between 1-10 centipoise. Also available areCannon-Fenske Viscometers for measuring liquids between 1-20,000centipoise. The temperature range for viscosity measurements is0-200°C.
The instrument is to be calibrated quarterly as follows:
Analyze DC-200 Silicone Fluid at several temperatures up to500°F and compare data with that obtained from previousanalysis under identical conditions. Also, check instrumentat room temperature by analyzing 900 cp and 11,000 cpstandards.
g. pH Meters
These instruments are used for pH and millivolt determination.Standards or buffers are to be run prior to each sample set beinganalyzed to calibrate the instrument. In addition, the millivoltscale will be tested annually using a known potential source.
h. Specific Conductivity Meter - YSI-31
This instrument is used for specific conductivity determination.Standards are to be run prior to each sample set being analyzed.
i. Baladces
Analytical balances are to be tested and certified biannually by anoutside consultant and given internal checks annually.
M. Quality Assurance - Quality Control
A quality assurance - quality control program is maintained using theprinciples outlined in Quality Assurance Principles for AnalyticalLaboratories, Frederick M. Garfield, Association of Official AnalyticalChemists, 1984.
170
Functions and Use 19
a. Definition
Quality Control is defined as a planned system of activities whosepurpose is to provide a quality product. Quality Assurance isdefined as a planned system of activites whose purpose is toprovide assurance that the quality control program is actuallyeffective. For a quality assurance program to be effective, theremust be a plan.
b. Quality Assurance Plan
In reality, a quality assurance plan is composed of three essentialcomponents, and costs are associated with each component:
- Prevention- Assessment or appraisal- Correction
Prevention requires an orderly program of planning and positiveactions before or during analyses to ensure that analytical systemsare functioning properly. Examples are quality control planning,training, calibration of instruments, instrument maintenance, andfrequent standardization of "standard solutions", etc.
Assessment is a form of control that includes periodic checks onperformance to determine precision and accuracy. Examples includeanalysis of duplicate and check samples, peer check of chartreadings and calculations, and validation of methodology.
Correction is action taken to determine causes of quality defectsand to restore proper functioning of the analytical system. Thiscan involve trouble shooting to correct malfunctioning equipment,examination of more check samples, re-evaluations of methodology,retraining, etc.
171
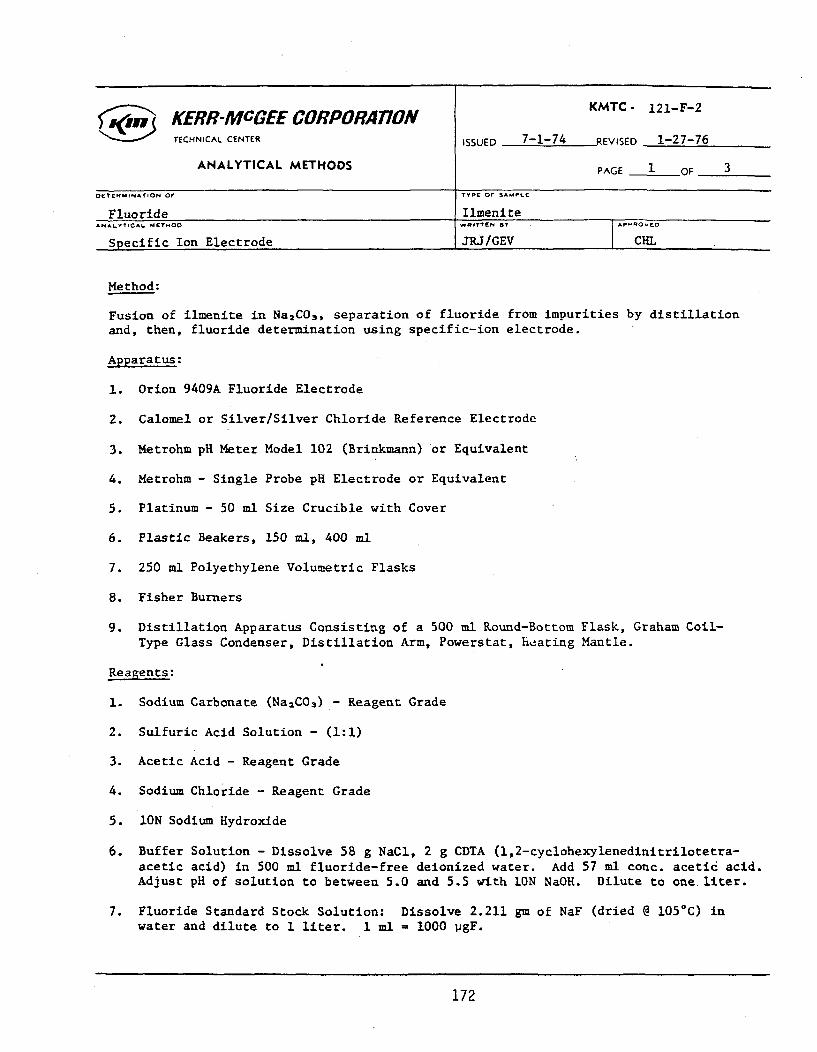
KERR-MCGEE CORPORATION KMTC- 121-F-2
TECHNICAL CENTER ISSUED 7-1-74 REVISED 1-27-76
ANALYTICAL METHODS PAGE 1 OF 3
ODEERMINATION Of TYPE OF SAMPLE
Fluoride IlmeniteANALYTICAL METHOD wPTTY N BY AP1 POSFO
Specific Ion Electrode JRJ/GEV CHL
Method:
Fusion of ilmenite in Na 2 CO3 , separation of fluoride from impurities by distillationand, then, fluoride determination using specific-ion electrode.
Apparatus:
1. Orion 9409A Fluoride Electrode
2. Calomel or Silver/Silver Chloride Reference Electrode
3. Metrohm pH Meter Model 102 (Brinkmann) or Equivalent
4. Metrohm - Single Probe pH Electrode or Equivalent
5. Platinum - 50 ml Size Crucible with Cover
6. Plastic Beakers, 150 ml, 400 ml
7. 250 ml Polyethylene Volumetric Flasks
8. Fisher Burners
9. Distillation Apparatus Consisting of a 500 ml Round-Bottom Flask, Graham Coil-Type Glass Condenser, Distillation Arm, Powerstat, heating Mantle.
Reagents:
1. Sodium Carbonate (Na 2 CO 3 ) - Reagent Grade
2. Sulfuric Acid Solution - (1:1)
3. Acetic Acid - Reagent Grade
4. Sodium Chloride - Reagent Grade
5. lON Sodium Hydroxide
6. Buffer Solution - Dissolve 58 g NaCI, 2 g CDTA (1,2-cyclohexylenedinitrilotetra-acetic acid) in 500 ml fluoride-free deionized water. Add 57 ml conc. acetic acid.Adjust pH of solution to between 5.0 and 5.5 with ION NaOH. Dilute to one. liter.
7. Fluoride Standard Stock Solution: Dissolve 2.211 gm of NaF (dried @ 105 0 C) inwater and dilute to 1 liter. 1 ml = 1000 PgF.
172
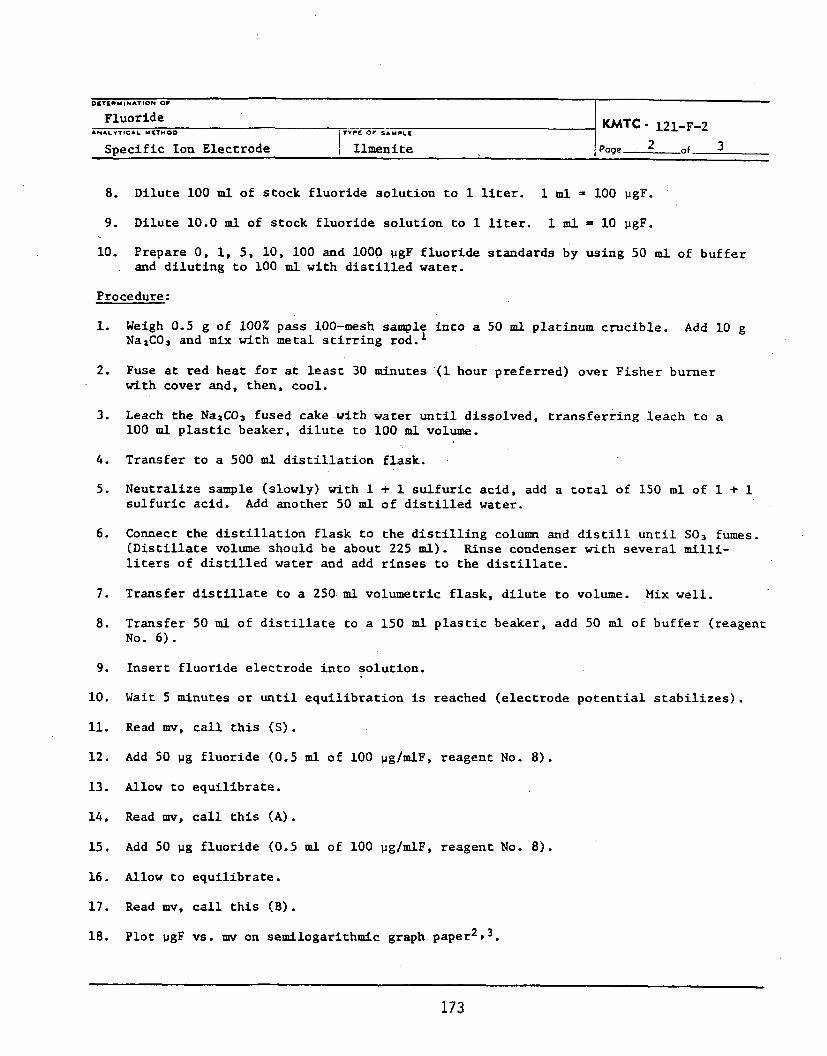
OCTIERM IATION OVFluoride KMTC - 121-F-2
ANALYTICAL MIETHOD i TV'E 01 3AMPLIE
Specific Ion Electrode Illmenite iPage 2 of 3
8. Dilute 100 ml of stock fluoride solution to 1 liter. 1 ml = 100 PgF.
9. Dilute 10.0 ml of stock fluoride solution to I liter. I ml 10 PgF.
10. Prepare 0, 1, 5, 10, 100 and 1000 pgF fluoride standards by using 50 ml of bufferand diluting to 100 ml with distilled water.
Procedure:
1. Weigh 0.5 g of 100% pass 100-mesh sample into a 50 ml platinum crucible. Add 10 gNa 2 CO 3 and mix with metal stirring rod. 1
2. Fuse at red heat for at least 30 minutes '(1 hour preferred) over Fisher burnerwith cover and, then, cool.
3. Leach the Na2 CO3 fused cake with water until dissolved, transferring leach to a100 ml plastic beaker, dilute to 100 ml volume.
4. Transfer to a 500 ml distillation flask.
5. Neutralize sample (slowly) with 1 + 1 sulfuric acid, add a total of 150 ml of 1 + Isulfuric acid. Add another 50 ml of distilled water.
6. Connect the distillation flask to the distilling column and distill until SO 3 fumes.(Distillate volume should be about 225 ml). Rinse condenser with several milli-liters of distilled water and add rinses to the distillate.
7. Transfer distillate to a 250.ml volumetric flask, dilute to volume. Mix well.
8. Transfer 50 ml of distillate to a 150 ml plastic beaker, add 50 ml of buffer (reagent
No. 6).
9. Insert fluoride electrode into solution.
10. Wait 5 minutes or until equilibration is reached (electrode potential stabilizes).
11. Read my, call this (S).
12. Add 50 pg fluoride (0.5 ml of 100 Ug/mlF, reagent No. 8).
13. Allow to equilibrate.
14. Read my, call this (A).
15. Add 50 vg fluoride (0.5 ml of 100 pg/mlF, reagent No. 8).
16. Allow to equilibrate.
17. Read my, call this (B).
18. Plot UgF vs. my on semilogarithmic graph paper 2 , 3 .
173
DETERMINATION O0
Fluoride KMTC - 121-F-2ANALYTICAL MCTHOO TYPE OF SAMPLE
Specific Ion Electrode Ilmenite Page 3 of 3
19. From graph, record jg of S, A, and B.
20. Calculations:
F i/xg of S x vg of F added x 250mlFpg of (A + B) - ug of S] x 0.5 g x 50 ml
Note: 1A blank of all reagents should be carried through the procedure for a blank de-determination.
2 The concentration of fluoride is plotted on the log axis and the electrode po-tential developed with the standard on the linear axis.
3The dilution-error from the standard addition results in a potential error of 1%in the resulting potential obtained. This error may be considered negligible.
Precision studies on four different ilmenites, for a total of fifteen determinations,indicated by averaging the fifteen relative percent standard deviations, the precision
in the 30-35 ppm range is + 7.8% of the value. Accordingly, it is recommended that at50 ppm F, two values from two different determinations should be considered in agree-ment if the average of the two lies within plus or minus 4 ppm and that the average beconsidered the assay of that sample if the sample is prepared and split in an approvedmanner. For a 50 ppm F standard, the value of plus or minus 4 ppm represents one stand-ard deviation; which is to say, if a 50 ppm F absolute standard was assayed, a largenumber of times, 67% of the assays would fall within the range of one standard devia-tion or from 46 to 54 ppm (50 + 4 ppm), 95% of the assays would fall within the rangeof two standard deviations or Trom 42 to 58 ppm (50 + 8 ppm), and 99 + % of the assayswould fall within the range of three standard deviations or from 38 to 62 ppm (50 + 12 ppm).
Manpower Requirements:
One sample of ilmenite, run in duplicate, from a split of the original, requireseight clock hours and five manhours of labor. This assessment assumes a dual distilla-tion set-up which may be run simultaneously. Each additional sample, to be run in dup-licate, will require an additional three-and-one-half manhours.
174
KERR-MCGEE CORPORATIONTECHNICAL CENTER
ANALYTICAL METHODS
KMTC. 76-U-14
ISSUED 1-14-71 REVISED
PAGE 1 OF 3
OCTCAMINATION Or rype OP SAMPLIE
Uranium UrineA N AL,,TY CA L M I T 14O D W R ITTEN NY APP -OVED
Fluorimetric DMK/ MFIII CHL
Method
An aliquot of urine is deposited on a fluorimetric flux mixture (2% lithium influoride - 98% Sodium Fluoride) in platinum dishes. The pellets are dried, fused,and allowed to cool, forming buttons which slide easily from the dish. Thefluoresence of the fluoride button is measured in a Jarrel-Ash fluorimeter, comparedwith a standard uranium curve, and reported as micrograms of uranium per literof urine.
Limits of the Method
The fluorimeter will measure from one to 10,000 micrograms of uranium per literof Urine. Background fluoresence reduces the accuracy of the analysis at verylow concentrations (l-10ug per liter). Above 10Ug per liter, the accuracyis within 10%. High concentrations (over 1000ug) are usually diluted priorto analysis to prevent saturation of the fluoresence in the pellet.
Cost
The labor for the determination of a set of 20 pellets would be 40 minutes. Thenumber of samples, depend upon the number of standards and blank analyzed perset of 20 pellets.
Equipment and Reagents
1. Jarrel-Ash Galvenck - Morrison Fluorimeter, Newtonville, Massachusetts.
2. Fusion Burner - Modified Fletcher Burner w/Nichrome gauze to accomodate20 pellets.
3. Platinum dishes - Stamped from discs 0.015 inch thick and 0.75 inch indiameter purchased from J. T. Baker and Company, Newark, New Jersey.
4. Pellet Maker - Custom fabricated from Stainless steel.
5. Timer for fluorimetric burner - (TDAF)
6. Propane Regulator - with fluorinator and needle valve.
7. Air regulator - Air blower assemble w/booster pump.
8. Heat lamp.
9. Die for forming platinum fusion dishes.
175
OETEUM.NATION OP
UraniumANALYTICAL. METHIOD TypE or SAMPLE KT 7--i
Fluorimetric Urine Page 2 _of 3
10. Sodium Fluoride, reagent grade. Meets fluorimetric specifications,lithium fluoride flux.A reagent jar containing 98% sodium fluoride and 2Z lithium fluoride powdersis agitated on a shaker and or dilutable rolling mill for a period of 36 hours.
Aliquots of the mixture is sampled until a suitable blank is determined or
the entire procedure repeated.
11. Uranium Standard Solution (chemically pure, NBS - certified, Natural uranium).
Stock Solution "A' 500iig/mlDissolve 58.9 mg of NBS certified U3 08 in 2 ml conc HN0 3 and evaporate to
dryness. Take up with 2 ml water containing 10 drops of conc HNO 3 , transferto a 100 ml Pyrex volumetric flask and dilute to volume.
Standard Solution "B" 0.54g/mlTransfer 0.1 ml of solution "A" to a 50 ml pyrex volumetric flask, add5 drops of conc HNO 3 and dilute to volume. The standard solutions should be
stored in polyethylene bottles.
Procedure
Sample Preparation
1. A clear sample may be used as received. The addition of 1% by volume ofRC1 at the time of sampling will prevent deterioration.
2. If the sample is cloudy, add 1% by volume of conc HCI and let stand
overnight.
3. If the sample is clear, proceed with the analysis.
4. If the sample is still not clear, add 15 ml of conc HNO 3 and 2 ml of30% HRO2. Carefully evaporate to dryness, cool, and make up to theoriginal volume with distilled water.
Determination
1. Adjust the pellet maker to accommodate 400 mg of flux and add this amount
onto each platinum disc.
2. Pipette 0.2 ml of urine onto each pellet. Using duplicate aliquots per sample.
3. Place samples under heat lamp and dry for 10 minutes.
4. Ignite the residue over the fusion burner using the following method.
a. Set the timer switch for 3 min., and ignite the burner. (switch on timer)
b. Adjust the volumeter setting to 18, this will approximate a pressureallowing flame temperature to fuse the flux at 900*C.
c. After two minutes, adjust the volumeter to 21, decreasing the temperature 8500 C.d. Allow the fusion to continue through the time period. The timer will cut off
the air and the gas simultaneously.
176
ODTERMINATION Of
Uranium KMTC- 76-U-14ANALYTICAL MIT4OO !TYPC OF SA.PL
Fluorimetric I Urine Poge 3 of 3
5. When the fluoride melts have solidified, remove the gauze and dishes from theburner and allow to cool for at least 15 minutes.
Measurement of Fluorescence
1. Push the sample slide to the forward stop, so that the empty aluminum holderis in the read position.
2. Adjust the 0.1 key to zero on the meter scale, with the background control.
3. Adjust the 0.1 key to zero with the fine adjustment. (Use a screwdriver).
4. Pull the slide to the Front stop, depress the 0.1 key and check for zero, usingthe background control.
5. Invert each platinum dish and allow the fused button to slide out of the pan.
6. Using forceps, carefully arrange blanks, standards, and samples in preparationfor measurement.
7. Place each sample in the aluminum holder, insert the slide to the forward orread position, depress the scale 0.1 or 1, and read the scale deflection,recording for calculation.
Calculations
From the following equation determine micrograms of U or U30 8 in the unknownurine sample.
Micrograms of U in unknown: jig of U3 08 in standard x (ave unknown - blank(ave standard -blankJ
Cleaning of Platinum Ware
1. Rinse in hot distilled H20.
2. Let stand overnight in 9N HN0 3 , and fuse with fluoride flux.
3. Fuse with potassium bisulfate, wash with tap water and soak in9N HN0 3 as above.
4. Rinse with distilled water and dry over flame.
5. Fuse with fluroide flux on each dish. Usual fusing time.
6. Select 3 dishes and observe the reading on the meter scale. If any show areading above a normal blank level the entire batch is re-cleaned, and threerandom samples again tested.
References
1. Fluorimetric Determinations of Uranium
Frederick A. Centanni, Arthur M. Ross, and Michael A. DeSesa, Raw MaterialsDevelopment Laboratory, National Lead Co., Inc. Winchester, Mass. AnalyticalChemistry, Vol 28, No. 11, November 1956.
177
KMTC.- 149-EC-10KERR -MCGEE CORPORATIONTECHNICAL CENTER ISSUED 12/1/77 REVISED None
ANALYTICAL METHODS PAGE I OF 8
0ITCRM•0,,ION OP ?,tP Of SAMOL9 Water, Soil, Vegetation and
Thorium, Uranium and Plutonium Products or By-ProductsANAL.VTICAL M[TWOO WRIITIN ey APPPOV(O
Alpha Pulse Height Analysis GEVS CHL
Method:
Except for natural uranium Or natural thorium, environmentally important concentrationsof actinides cannot be readily determined by ordinary chemical means. Additionally,chemical methods do not offer any information as to the isotopic composition of theelement in question. Therefore, for samples where either an isotopic composition and/or ultra low level of detection is required, alpha pulse height analysis is the methodof choice.
This method utilizes the following technologies:
1. In-situ formation of calcium phosphate is used to concentrate the actinidesfrom a large aqueous volume.
2. Anion exchange is used to permit separation of the actinides into relativelypure form.
a) For thorium, good separation is achieved from all elements except uran-ium. A separation factor in the vicinity of 106 is achieved for mostelements, but only about 104 separation is achieved between uranium andthorium. As a result, some uranium will report to the electrodepositwhen analyzing for thorium in a uranium rich material such as yellowcake.
b) For uranium, good separation is achieved from all elements except thoriumand those which form stable anion complexes with chloride (i.e., iron,aluminum, etc.). For this reason, whenever a material rich in these met-als is to be analyzed for uranium, such as soils or mill tailings, theuranium must first be solvent-extracted from a nitrate or sulfate systemin order to eliminate these interferences.
c) For plutonium, good separation is achieved from all metals except for ironfrom iron-rich systems (i.e., liver tissue, iron or steel and their alloys,etc.). When analyzing an iron-rich system, the ion-exchange step should berepeated once. (Note: Three evaporations to dryness with concentratednitric acid area required to completely remove traces of chloride andfluoride from the first ion-exchange strip liquor prior to the second ion-exchange. Failure to remove the chloride or fluoride will result in poorrecovery of the plutonium.).
3. Electrodeposition is utilized to prepare an "infinitesimally thin" depositnecessary for good alpha pulse height energy resolution. A thick deposit(> ten micrograms) causes alphas, from the bottom of the deposit, to degrade(lose energy) as they pass up through the deposit. As a result, the siliconsurface barrier detector will see alphas with a lower energy which will produce
178
OctKN,*n-TfON Or
Thorium, Uranium and Plutonium KMTC- 149-EC-10A NAL Y,.IC L -H tHOO 1 111 o1 O $A 011 W a t e r , S o i l , V e g e t a t i o n
Alpha Pulse Height Analysis and Products or By-Products Page 2 ----- °f 8
a spectral smear. Poor resolution of alpha energy will destroy the usefulnessof the procedure. Alpha resolution should be < 50 KeV FWHM (full width athalf maximum) and any spectra with an alpha resolution of > 100 KeV FWHMshould result in rejection of the analysis.
Range and Precision:
Amounts of Th, U, or Pu as low as one femtocurie (1 X 10-15 curie or 3.7 X 10⁻⁵ disin-tegrations per second) can be detected over a counting time of 1000 minutes using sili-con surface barrier alpha detectors in conjunction with a multichannel analyzer. Theprecision attained is a function of the activity in the sample and the recovery of theinternal standard; however, typical precision, at one standard deviation, ranges from3 to 50%.
Cost:
Cost (manhours) = k + nt
Where:
k = 2 manhours; t = 2 manhours, and n = number of samples.
Apparatus:
1. Silicon surface barrier detector(s) (Princeton Gamma Tech, 300-25-100) is used inconjunction with a multichannel analyzer.
2. Millipore filter equipment including 0.45V Millipore Filter.
3. Magnetic stirring hotplate(s).
4. Ion-exchange column(s), Bio-Rad or equivalent, 1.5 cm I.D. X 15 cm in length, andaccessories.
5. Ripple-free D. C. power supply capable of at least 1.5 amp @ 10 volts.
6. Electrodeposition cells - (Talvite, Anal. Chem. 1972) and polished stainless steeldiscs.
7. Assorted glass and plastic ware common to analytical laboratories.
Reagents:
1. a) Concentrated sulfuric acid (H2 SO).
b) Concentrated hydrochloric acid (HCI).
c) Concentrated nitric acid (HNO 3 ).
d) Concentrated hydrofluoric acid (HF).
e) Concentrated phosphoric acid (H 3 PO).
179

OCTtNMiKATION OP
Thorium, Uranium and Plutonium KMTC- 149-EC-10A-ALYICAL M-T,0 I " Water Soil, Vegetation
Alpha Pulse Height Analysis and Products or By-Products Page 3 of 8
f. Concentrated ammonium hydroxide (NHIOH).
g. Concentrated perchloric acid (HCIO).
2. 50% calcium nitrate solution [Ca(NO3 ) 2 1.
3. 7.2F nitric acid
4. Bio-Rad (or Dowex) AG I X 4, 50-100 mesh, anion exchange resin.
5. 1.5F hydrochloric acid.
6. O.lF silver nitrate.
7. 8F hydrochloric acid.
8. 0.5F hydrochloric acid.
9. 0.36F hydrochloric acid, 0.008F in hydrofluoric acid.
10. Thymol blue indicator.
11. 0.15F ammonium hydroxide.
12. 95% or 100% ethanol (not denatured).
13. 0.18F sulfuric acid (H 2 SO).
14. Sodium nitrite.
15. Standard Pu-242, U-232 or Th-228 solution. The Pu-242 (99.9999 + %), prepared bycyclotron and purified by mass spectrometry (Alexander and Irene Dupzik, LawrenceLivermore Laboratory) is available from John Harley, New York Dept. of Health.
brated "in-house."
Sample Preparation:
A. Aqueous Solutions
1. Filter sample through 0. 4 5u Millipore filter.
2. For samples < 100 ml, use 100-250-mil beaker.
a) Add 25 ml conc. HNO 3 , heat to 75-80°C while stirring.
b) Add the spike (Pu-242, U-232 or Th-228). Make sure the exact amount of spikeadded is known and recoraea. Add only that spike necessary for the analysis.For environmental samples, spikes should be on the order of 2-12 dpm.
c) Continue the heating for at least 30 minutes (60 min for Pu).
d) Evaporate the solution to dryness. CAUTION, DO NOT SAKE THE RESIDUE.
180
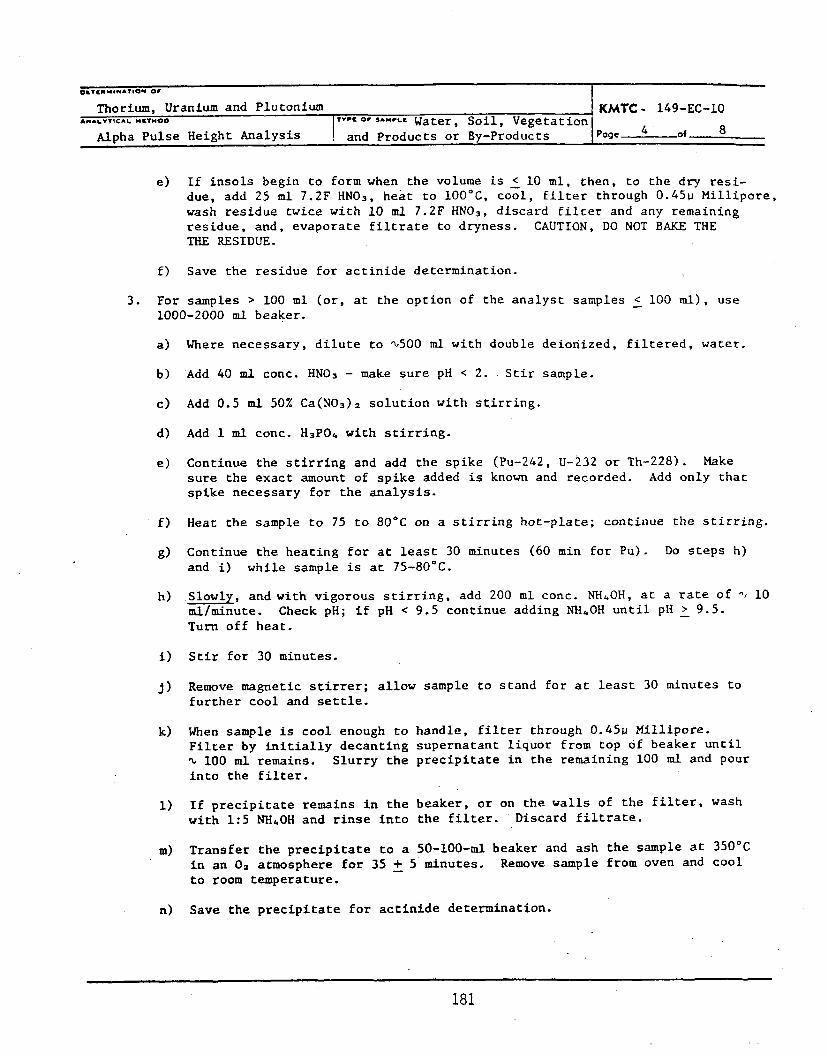
OkTCWM.JATIOM OfThorium, Uranium and Plutonium KMTC - 149-EC-10AMA%.VTICAL. M&TH00 ITYPI 'IF SAOPI-1 Water, Soil, Vegetation
Alpha Pulse Height Analysis ,and Products or By-Products ipage 4' f 8
e) If insols begin to form when the volume is < 10 ml, then, to the dry resi-due, add 25 ml 7.2F HNO3 , heat to 100 0 C, cool, filter through 0. 4 5P Millipore,wash residue twice with 10 ml 7.2F HNO 3 , discard filter and any remainingresidue, and, evaporate filtrate to dryness. CAUTION, DO NOT BAKE THETHE RESIDUE.
f) Save the residue for actinide determination.
3. For samples > 100 ml (or, at the option of the analyst samples < 100 ml), use1000-2000 ml beaker.
a) Where necessary, dilute to '\500 ml with double deionized, filtered, water.
b) Add 40 ml conc. HNO 3 - make sure pH < 2. Stir sample.
c) Add 0.5 ml 50% Ca(N0 3 ) 2 solution with stirring.
d) Add 1 ml conc. H3 PO4 with stirring.
e) Continue the stirring and add the spike (Pu-242, U-232 or Th-228). Makesure the exact amount of spike added is known and recorded. Add only thatspike necessary for the analysis.
f) Heat the sample to 75 to 80°C on a stirring hot-plate; continue the stirring.
g) Continue the heating for at least 30 minutes (60 min for Pu). Do steps h)and i) while sample is at 75-800 C.
h) Slowly, and with vigorous stirring, add 200 ml conc. NH4 OH, at a rate of ^, 10mi/minute. Check pH; if pH < 9.5 continue adding NHZ.OH until pH > 9.5.Turn off heat.
i) Stir for 30 minutes.
j) Remove magnetic stirrer; allow sample to stand for at least 30 minutes tofurther cool and settle.
k) When sample is cool enough to handle, filter through 0.45p Millipore.Filter by initially decanting supernatant liquor from top of beaker until^ 100 ml remains. Slurry the precipitate in the remaining 100 ml and pourinto the filter.
1) If precipitate remains in the beaker, or on the walls of the filter, washwith 1:5 NH4OH and rinse into the filter. Discard filtrate.
m) Transfer the precipitate to a 50-100-ml beaker and ash the sample at 350°Cin an 02 atmosphere for 35 + 5 minutes. Remove sample from oven and coolto room temperature.
n) Save the precipitate for actinide determination.
181
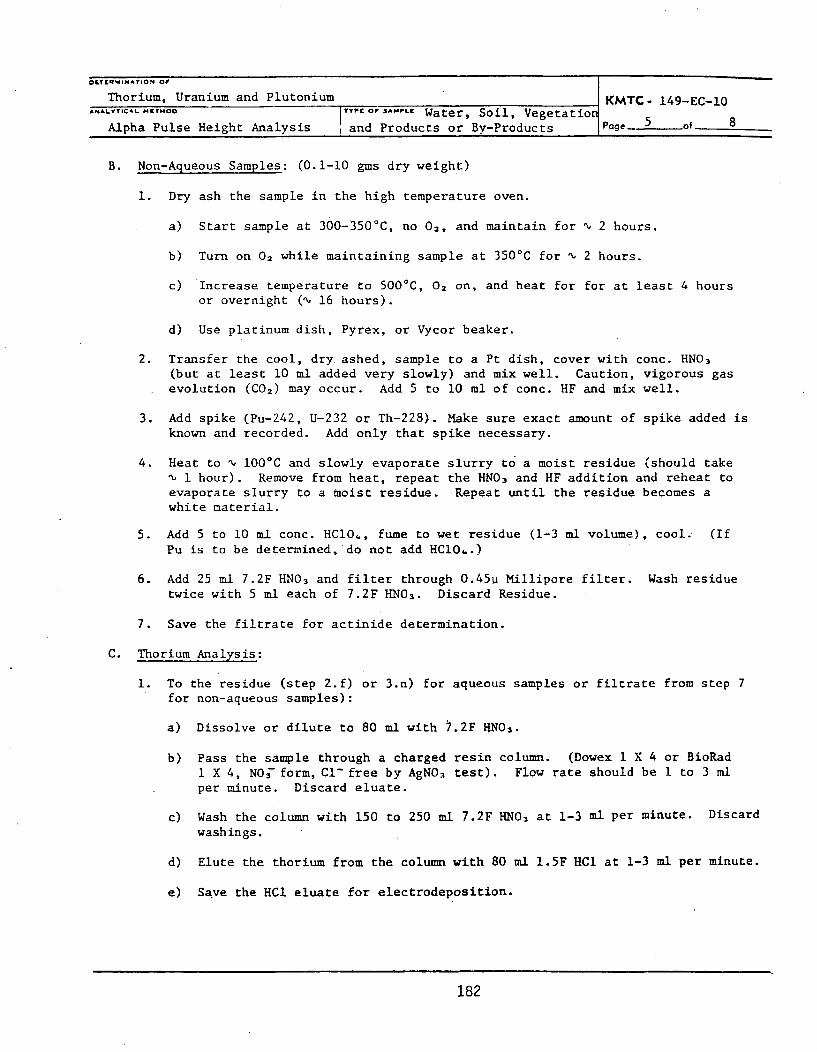
OCTLM.INAT.ON O0
Thorium, Uranium and Plutonium KMTC- 149-EC-10ANALYTICAL HNE.OO ITyYC OP SAM'L Water, Soil, Vegetation
Alpha Pulse Height Analysis i and Products or By-Products Poge_ of 8
B. Non-Aqueous Samples: (0.1-10 gms dry weight)
1. Dry ash the sample in the high temperature oven.
a) Start sample at 300-350°C, no 02, and maintain for v 2 hours.
b) Turn on 02 while maintaining sample at 350*C for n 2 hours.
c) Increase temperature to 500'C, 02 on, and heat for for at least 4 hoursor overnight (, 16 hours).
d) Use platinum dish, Pyrex, or Vycor beaker.
2. Transfer the cool, dry. ashed, sample to a Pt dish, cover with conc. HNO 3(but at least 10 ml added very slowly) and mix well. Caution, vigorous gasevolution (CO2 ) may occur. Add 5 to 10 ml of conc. HF and mix well.
3. Add spike (Pu-242, U-232 or Th-228). Make sure exact amount of spike added isknown and recorded. Add only that spike necessary.
4. Heat to , 100*C and slowly evaporate slurry to a moist residue (should takei 1 hour). Remove from heat, repeat the HN0 3 and HF addition and reheat to
evaporate slurry to a moist residue. Repeat until the residue becomes awhite material.
5. Add 5 to 10 ml conc. HClO4 , fume to wet residue (1-3 ml volume), cool. (IfPu is to be determined, do not add HCIO.)
6. Add 25 ml 7.2F HN0 3 and filter through 0. 4 5p Millipore filter. Wash residuetwice with 5 ml each of 7.2F HN03 . Discard Residue.
7. Save the filtrate for actinide determination.
C. Thorium Analysis:
1. To the residue (step 2.f) or 3.n) for aqueous samples or filtrate from step 7for non-aqueous samples):
a) Dissolve or dilute to 80 ml with 7.2F KNO 3 .
b) Pass the sample through a charged resin column. (Dowex I X 4 or BioRad1 X 4, NOT form, C1- free by AgNOs test). Flow rate should be 1 to 3 mlper minute. Discard eluate.
c) Wash the column with 150 to 250 ml 7.2F HNO 3 at 1-3 ml per minute. Discardwashings.
d) Elute the thorium from the column with 80 ml 1.5F HCI at 1-3 ml per minute.
e) Save the HCl eluate for electrodeposition.
182

OT7ZAMINATION OF'
Thorium, Uranium and Plutonium KMTC- 149-EC-10AMA,,,,,GM. M,,HoB lY9 Of SAML9 Water, Soil, Vegetation
Alpha Pulse Height Analysis and Products or By-Products Page 6 of
D. Uranium Analysis:
1. To the residue (step 2.f) or 3.n) for aqueous samples or step 7 for non-aqueoussamples evaporated to moist residue), if Fe (III) content is > 1 ppm, proceedas follows:
a) Dissolve residue into 10 ml 2F HNO 3 /2F AI(NO3 ) 3.
b) Extract uranium twice into 10 ml ethylacetate.
c) Transfer ethylacetate (20 ml) to clear, dry, beaker and evaporate todryness. CAUTION, DO NOT BAKE RESIDUE.
2. If < 1 ppm, proceed to next step.
a) Dissolve the residue in 80 ml SF HCl.
b) Pass the sample through a charged resin column. (Dowex 1 X 4 or BioRad1 X 4, Cl-form). The flow rate should be 1-3 ml per minute. Discardeluate.
c) Wash the column with 150 to 250 ml 8F HCl. Discard washings. Use flowrate of 1-3 ml per minute.
d) Elute uranium from column with 80 ml 0.5F HCI at a flow rate of 1-3 mlper minute.
e) Save the HCI eluate for electrodeposition.
E. Plutonium Analysis:
1. To the residue (step 2.f) or 3.n) for aqueous samples or filtrate from step 7.for non-aqueous samples):
a) Dissolve residue in 80 ml 7.2F HNO 3 or dilute to 80 ml with 7.2F HNO3, and.5 g boric acid (H3BO3).
b) Add several milligrams NaN0 2 , heat to 90*C, cool and let stand overnight(or heat to, and maintain at, 100*C for at least I hour).
c) Pass the sample through a charged resin column. (Dowex 1 X 4 or.BioRad1 X 4, NO; form, Cl- free by AgNO3 test). Flow rate should be 1-3 ml perminute. Discard eluate.
d) Wash column with 150-250 ml 7.2F HNO3 at a flow rate of 1-3 ml per minute.Discard washings.
e) Elute plutonium from column with 80 ml of 0.36F HCl/O.OO8F HF at a flowrate of 1-3 ml per minute.
f) Save the HCl/HF eluate for electrodeposition.
183
DETER.I.ATION 00 /Thorium, Uranium and Plutonium KMTC - 149-EC-10
AN^LTIC AL MT H00 JTYP 01'S IMPLE Water, Soil, Vegetat io nAlpha Pulse Height Analysis ! and Products or By-Products I age 7- of
F. Electrodeposition:
1. To the eluates from Th, U, or Pu procedures (step C.l.e) for Th, step D.l.e)for U, and step E.l.f) for Pu):
a) Add 0.30 ml conc. H2 SO,. and 5 ml conc. HNO 3 .
b) Evaporate to dense S03 fumes and cool.
c) Add 5.0 ml H20.
d) Add thymol blue indicator.
e) Adjust pH to 2 (first color change) with gaseous NH3 . Do not overshootpH of 2. Obtain NH 3 by cutting inside stem off of polyethylene washbottle flush with cap. Fill wash bottle 1/2 full with conc. NH3OH."Puff" NH 3 vapors from bottle. Direct NH3 stream at, but above, surfaceof liquid sample.
f) Transfer to electrodeposition cell. Have clean, degreased stainless steelplanchet in place in the cell.
g) Add 5 ml 0.18F H2SO - use for beaker rinse.
h) Repeat step g) at once.
i) Adjust to pH of 2 (first color change) with gaseous NH3 . Do not over-shoot pH of 2.
j) Place cell in electrodeposition apparatus and plate actinide onto thecathode (stainless steel planchet) for 1.2 amp/hour (0.6 amps for2 hours or 1.2 amps for 1 hour).
k) With current flowing, add 5 ml conc. NH4OH and continue current flow for1-2 minutes.
1) With current still flowing, remove platinum anode from solution. Turn offcurrent and disconnect cell.
m) Discard aqueous contents of cell.
n) Wash cell three times with 0.15F NH4OH. Do not direct stream onto platedsurface.
o) Wash cell twice with 95% ethanol.
p) Disassemble cell and carefully remove planchet. Do not touch plated sur-face.
q) Place planchet on hotplate at 250-300*C and heat for 5-10 minutes.
r) Remove planchet from hotplate and cool to room temperature.
184

UaT[RMIMAOft Or
Thorium, Uranium and Plutonium KMTC- 149-EC-10ANALYTICAL MT HYOO OF A°'s Water, Soil, Vegetation iP age 8
Alpha Pulse Height Analysis and Products or By-Products of
G. Alpha Pulse Height Analysis:
1. Active area of surface barrier detector should be at least 2X's that of theplated surface of the planchet.
2. Place planchet in close proximity to, but not touching, surface barrier de-tector. The surface barrier detector and sample must be inside a vacuumchamber with a pressure < 1mm Hg.
3. Count the sample, over the energy range 3.8 to 5.8 MeV, for 1000 minutes.
4. Integrate the alpha peaks and identify each isotope by its alpha energy.
5. For the internal standard, the recovery is determined by the equation
counts per 1000 min found Fcounts per 1000 min added Recovery Factor
6. Divide each alpha integral by the recovery factor and divide the quotient by1000. The result is the activity of that alpha (isotope) in the sample inunits of disintegrations per minute (dpm).
7. To convert to picocuries per sample: dpm 2.22 = pCiTo convert to femtocuries per sample: dpm ÷ .00222 = fCi
8. In alpha pulse height analysis, using silicon surface barrier detectors, thesample size should be chosen such that the alpha activity, on the planchet,exclusive of the internal standard, lies in the range of from 1.5 to 15 pCi.However, for low level samples it usually is impractical to exceed 1 liter or10 grams of sample and, as a result, one often finds the alpha activity, ex-clusive of the internal standard, lies in the range of from < 0.001 to < 1.5 pCi.
9. For samples where the recovery of the internal standard is < 50%, based upon ameasured counting geometry, the assay should be rejected.
185

KERR-MCGEE CORPORATION KMTC- 200-XRF-1TECHNICAL CENTER ISSUED 7-15-85 REVISED
ANALYTICAL METHODS PAGE 1 O 3
O(TCOWMIPATION Of TyPe Or SAM•LE
Quantitative Elemental Analysis Solids and LiquidsANAL'YICAL M9MNOO WAIDtN DY *APDOVE
General X-Ray Fluorescence CDE GEV
METHOD:
Primary x-rays are generated by the bombardment of a suitable target materialby electrons from a heated tungsten filament. These electrons are acceleratedto a high velocity by a high voltage potential between the tungsten filamentand the target material.
As the electrons deccelerate, they give up their energy as x-rays in a seriesof stepwise transitions.
The primary x-rays from the rhodium-targeted tube are used to excite the innerelectrons of a sample. These electrons (from the K, L and M shells primarily)are expelled from the inner shells of the atom. Electrons from orbitalsfarther away from the nucleus then fall into the vacancies created. Thedifference in energy between the orbitals is emitted as a secondary x-rayphoton of an exact energy. Because the x-rays come from the inner electronsof the atoms, they are not related to any of the chemical properties of theelements nor to the compounds in which they may be present. These emittedwavelengths are detected by using various analyzing crystals with preciselyknown d-spacings (distances between the planes of the crystal). Coupled withthe crystals is a flow proportional counter and thallium-doped NaI detector.These detectors are used both separately and in tandem.
RANGE:
The present configuration of the Siemens SRS-300 x-ray fluorescence unitprovides analytical capabilities from Sodium (element 11) through Uranium(element 92) for a wide range of sample types. The detection limits rangefrom a few ppm to 100 percent. This is dependent upon the element ofinterest, the matrix effects, the analyzing crystal used, the excitationconditions, the detector, sample preparation techniques, the use of air,vacuum or helium for the analysis conditions, etc. These instrumentalparameters are best determined by optimizing the analysis conditionsexperimentally prior to analysis.
EQUIPMENT AND REAGENTS:
1. Siemens SRS-300 sequential wavelength x-ray spectrometer and 10-positionsample changer under computer control (DEC family of PDP computers).
2. DEC VT-240 monochrome graphics display terminal and DEC Letterwriter 100
for printout of results plus graphic plots.
3. Retsch Micro-Mill for grinding samples prior to analysis.
4. Sample binder and various dies for pressing samples into pellets using ahydraulic press.
186
09TIraMINATION OfrQuantitative Elemental Analysis KMTC- 200-XR-iANALYTICAL. MTM00 TYPIE 01 SA m LII
General X-Ray Fluorescence Solids and Liquids Page 2 of 3
5. Sample cups with polypropylene covers plus sample holders for theinstrument.
6. Compressed air to operate the system pneumatics, helium for the samplechamber atmosphere, P-1O gas for the flow proportional counter, plus aHaskris heat exchanger for the x-ray tube and generator.
SAMPLE PREPARATION:
To obtain a sample that is as homogeneous as possible, materials should beground to as fine a particle size as practical. Particle size is an importantconsideration, especially when dealing with the lighter elements and theirlonger and less energetic wavelengths.
The ground solids are mixed with a binder and pressed into a pellet. A smoothsurface on the finished pellet is desirable for both accurary andreproducibility of the analysis.
Liquids are generally homogeneous and may be pipetted into the sample cup 'asreceived. The cup and liquid should be set aside for approximately 30 minutes.and then checked for leaks. As the sample is inverted directly over the x-raytube, a leak may deposit sample directly on the beryllium window, causingerroneous results or possibly failure of the tube itself. Semisolid samples(i.e. ROSE samples) may be gently heated and poured into the sample cup.After cooling, they may be analyzed under a helium atmosphere like theliquids.
INSTRUMENTAL PARAMETERS:
These should be determined experimentally for each analyte and it'scorresponding matrix.
The most effective wavelength for exciting an element is the wavelengthapproximately 0.2 Angstrom shorter than the absorption edge wavelength forthat element. For example, the Cu K-alpha line at 1.54 Angstrom is veryeffective in exciting the iron K-spectrum with it's K absorption edge atapproximately 1.7 Angstrom.
The kV and mA at which the x-ray tube is operated determine the wavelength andintesity of the primary radiation. These (kV and mA) can be optimized for theelements of interest. The analyzing crystals and detectors can also beoptimized for each element of interest.
The use of air, helium, or vacuum in the spectrometer is dependent upon thecharacteristics of the sample itself.
ANALYSIS:
A qualitative scan can be quickly performed to yield information about theelements that make up the sample (from Z-I1 to 92). A quantitative analysismay then be performed in a number of ways.
187
O(TIRMINATION or
Quantitative Elemental Analysis KMTC - 200-XRF-1ANALYTICAL. ME 4MOO I TYPE[ OF" LMPLl
General X-Ray Fluorescence I Solids and Liquids Page o3 f 3
1. By standard addition of known quantities of the elements of interest.
2. By preparation of a set of standards that have a matrix that is verynearly the same as that of the sample.
3. By preparing a standard with known quantities of the elements ofinterest and using the fundamental parameters approach (Criss Software)to calculate the mass absorption coefficients based on theoreticalconsiderations.
The fundamental parameters approach provides for the analysis of samples withwidely divergent matrices, requiring the preparation of only one or twostandards instead of an entire suite of standards.
INTERFERENCES:
There are a number of areas where problems may rise in the XRF analysis. Peakoverlap can be a problem when analyzing elements that lie very close to aextremely strong peak. For example, the target of the tube is the elementrhodium, Z=45; the peak for ruthenium, Z=44, is so close to the rhodium peakthat it can not be resolved because of the massive cahracteristic radiationpeak coming from the target itself.
Another problem is that the matrix may give rise to absorption-enhancementeffects that may affect the analyte line intensity. Another is that samplesand standards must be "infinitely thick", or at. least the same thickness.
188

KERR-MCGEE CORPORATiON KMTC - 204-U-16
TECHNICAL CENTER ISSUEo 4/15/76 REVISED 1/22/85
ANALYTICAL METHODS PAGE 1 OF 9
oETERMNATION OF T SAMP Rocks, Pulps, Vegetations,Uranium U 3 08 Cuttings and Solutions
ANALYTICAL ME TOD WRITTEN BY I ^PP•OVEO
Fluorimetric JRJ GEV
Method:
It has been proven experimentally and in actual application that, with theproper care, quick, dependable assays can be turned out with a minimum of man-power. One person can turn out one hundred assays per day without difficulty,
including blanks and standards. A crew of three people can handle 80-120solid samples per 8-hour day on a regular basis. The procedure adopted by theKerr-McGee Technical Center laboratory was developed by National Lead Co.,Winchester Laboratory, and reported in "Analytical Chemistry," Vol. 28, Page
1651, November, 1956.
A new rotary fusion burner system has been installed, on which 22 fluoridefusions are performed simultaneously under reproducible fusion conditions. Afluorometric flux mixture of 2% lithium fluoride ands98% sodium fluoride isused and has been found to be superior to other fluxes in sensitivity, preci-sion and convenience. The coefficient of variation of the fusion method (only)employing this new flux has been determined to be 0.7%. This constitutes atleast a sixfold improvement in precision over that of the previous fusion sys-tem. This method has been proven to be rapid, accurate and economical.
A combination of dilution and solvent extraction is used to separate the ura-nium from possible interferences and quenchers. An aliquot of a liquid sampleor of a solution of a solid sample is diluted and acidified so that the dilut-
ed sample contains approximately .005 mg of U 3 0 8 per ml in a 5% nitric acidsolution. One milliliter of the diluted sample Is salted with saturated alu-minum nitrate solution and the uranium is extracted into 10 ml of ethyl ace-
tate. Aliquots of 0.2 ml are removed and transferred onto pellets of 2% lith-ium fluoride/98% sodium fluoride flux in platinum dishes. The pellets aredried, fused and allowed to cool, forming buttons which slide easily from thedish. The fluorescence of the fluoride button is measured with a Jarrell-AshModel 26000 fluorometer.
Apparatus:
40-ml Vials -. 4-1/4" in length and I" in diameter.
Aluminum Foil-Lined Caps - purchased in quantities and used only once.
Machlett Autopipet - 10-ml capacity.
Platinum Dishes - These dishes are formed from discs 0.015" thick and0.75" in diameter. Discs are available from EnglehardInstruments, Inc., 113 Astor Street, Newark, NewJersey.
189
DETERMI4NATION Of
Uranium U3 08 ' KMTC 204-U-16ANALYTICAL METHOO CI[ cf SAMP
4IC'Locks, Pulps, Vegetations, Page 2 of __
Fluorimetric ! Cuttings and Solutions
Dish Forming Tool - Available from Jarrell-Ash Co., Waltham, Mass.,Catalog No. 26100. Before forming, discs should beannealed at 850*C. After forming, they should becleaned with 1:1 nitric acid and rinsed thoroughlywith water.
Pellet Maker - Jarrell-Ash Co., Catalog No. 26110.
Rotary Burner -
Drying Units -
The burner is a rotary fusion burner. The burner isavailable from EDA Intruments Inc., 5151 Ward Road,Wheat Ridge, Colorado 80033. The system consists offifteen Humboldt-burners arranged in a circle, twoflowmeters, temperature readout meter, gas igniterautomatch, low heat timer, high heat timer.
Fabricated in house using four 500 watt infrared heatlamps mounted in two separate boxes of two lamps each19" long, 12" deep and 10- high. The boxes are con-structed of 1/2 inch thick transite and is closed allaround except for a 19" x 10" opening in front.
Propane Regulator - Must be able to maintain 30 lbs output pressure.
Shaking Machine - Eberback Model 6010. Available from Scientific Pro-ducts.
Fluorometer - Jarrell-Ash Co., Model 26000 fitted with reflectance at-tachment, Model 26050.
Microliter Pipet - Eppendorf 200-pl pipet with a supply of disposablepipet tips.
Reagents - The use of reagents that contains negligible uranium or otherfluorescence impurities is essential. With the exception ofsodium fluoride, it has been found that Mallinckrodt reagentgrade chemicals give the best all-around performance.
98% Sodium FLuoride - 2% lithium fluoride Fluorometric grade, EDA In-struments, Inc., 5151 Ward Road, Wheat Ridge,Denver, Colorado 80033.
Ethyl Acetate - Mallinckrodt reagent grade.
Aluminum Nitrate - Mallinckrodt reagent grade.
A solution of aluminum nitrate is made by dissolving5 lb in 1100 ml deionized H20.
A reagent blank prepared from the above reagentshould read no more than 15 units on the most sensi-tive meter range. Full scale meter reading - 10pamps.
190

Uranium U30 8 KMTC - 204-U-16ANALY14ALNTI Miro* TTXPE QF S*M €. V-
FOlCKSeAL OclsOc rmlps, Vegetations, Page 3 of 9Fluorimetric ICuttings and Solutions
Acid - Reagent grade nitric, perchloric, hydrochloric and hydrofluoric
acids.
Mallinckrodt reagent grade.
Perchloric acid should only be used in approved hoods with wash-down facilities.
Standard U3 08 Solution - 1.000 grams of 99.99% U308 is weighed into a250-mi beaker. Add 10 ml HC104 and 10 ml HN03and fume to 3-5 ml. Cool, rinse sides of beak-er with DI H2 0, and 50 ml concentrated HN0 3 anddilute to 1.00 liter.
1.00 ml of this stock solution diluted to 200ml will give a standard solution of 5 iLg/mlU308 which should be made fresh once each month.
A. Sample Preparation
I. Aqueous Samples
Dilute all aqueous samples according to the estimated concentration sothat I ml of the diluted sample contains approximately .005 mg ofU308. Since the diluted sample should contain 5 percent (v/v) freenitric acid, samples which are alkaline must be neutralized before theproper amount of nitric acid is added.
Samples which are known to contain reduced uranium, such as Wet Phos-phoric Acid (WPA), must be oxidized to uranium (VI). The preferredmethod is to pipet an aliquot into a 250-mi beaker. Add 5 ml HC1O4and 5 ml HNO 3 and take to strong HC1O4 acid fumes, cool, add HN03 tomake dilution 3-5% v/v HN03 and dilute in mixing cylinder.
Organic samples, such as those from solvent extraction studies, aretreated by stripping the uranium into aqueous carbonate solution be-fore proceeding with the dilution and extraction. Pipet a suitablevolume of the sample into an extraction vial and add 2 to 3 ml ofcarbon tetrachloride to make the organic layer heavier than water. Inspecial cases, wet oxidation is the preferred treatment.
Add 10 ml of 5 percent (w/v) sodium carbonate solution from an auto-matic pipet, cap the vial, agitate on the shaker for I to 2 minutes,and centrifuge to separate the phases completely. Treat the resultingcarbonate solution according to the procedure described above for anaqueous sample.
2. Solids
Pulped samples are weighed, normally 2 grams, into a 250-m1 beaker andtreated with 10 ml each of perchloric acid and nitric acid. Place onhot plate and take to fumes, remove and add 5 ml perchloric, 10 ml of
191
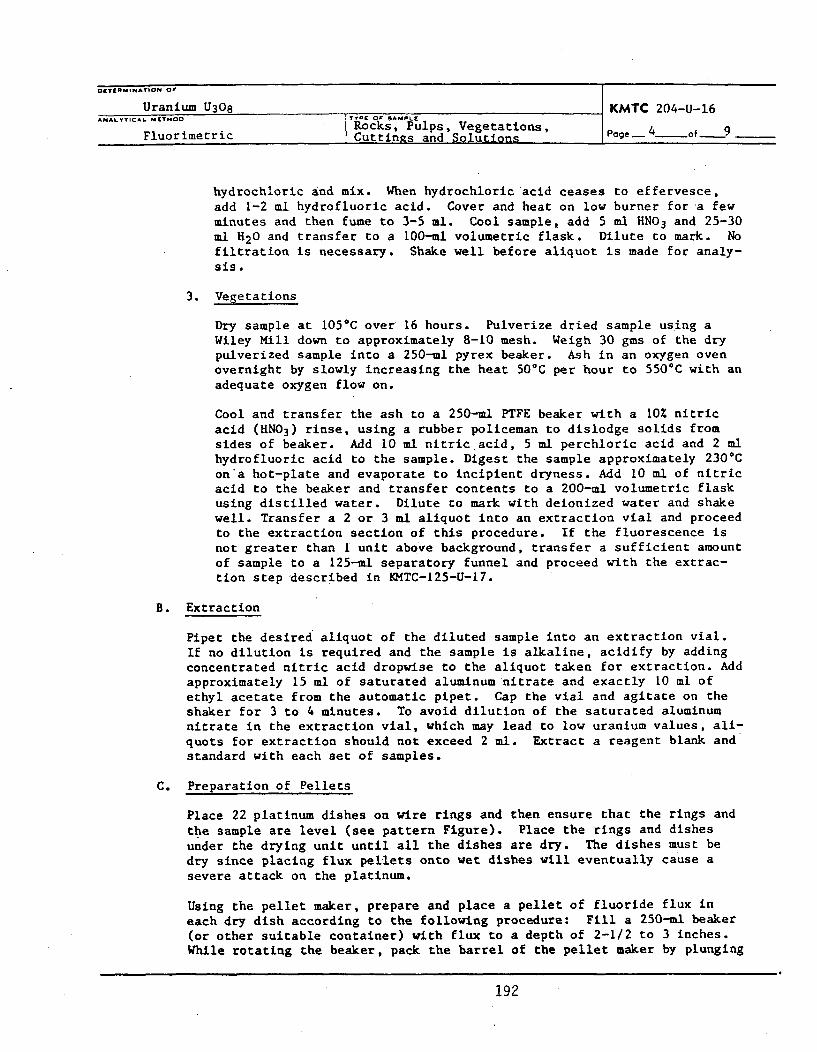
OCTERMONATION Or
Uranium U30 8 KMTC 204-U-16ANALYTICAL M.00tOO T'Pr Of SAMPLC
Rocks, Pulps, Vegetations,Fluorimetric Cuttings and Solutions Page-4_°f-9
hydrochloric and mix. When hydrochloric acid ceases to effervesce,add 1-2 ml hydrofluoric acid. Cover and heat on low burner for a fewminutes and then fume to 3-5 ml. Cool sample, add 5 ml HN0 3 and 25-30ml H2 0 and transfer to a 100-ml volumetric flask. Dilute to mark. Nofiltration is necessary. Shake well before aliquot is made for analy-sis.
3. Vegetations
Dry sample at 105*C over 16 hours. Pulverize dried sample using aWiley Mill down to approximately 8-10 mesh. Weigh 30 gms of the drypulverized sample into a 250-mi pyrex beaker. Ash in an oxygen ovenovernight by slowly increasing the heat 50*C per hour to 550*C with anadequate oxygen flow on.
Cool and transfer the ash to a 250-mi PTFE beaker with a 10% nitricacid (HNO 3 ) rinse, using a rubber policeman to dislodge solids fromsides of beaker. Add 10 ml nitric acid, 5 ml perchloric acid and 2 mlhydrofluoric acid to the sample. Digest the sample approximately 230*Con a hot-plate and evaporate to incipient dryness. Add 10 ml of nitricacid to the beaker and transfer contents to a 200-ml volumetric flaskusing distilled water. Dilute to mark with deionized water and shakewell. Transfer a 2 or 3 ml aliquot into an extraction vial and proceedto the extraction section of this procedure. If the fluorescence isnot greater than I unit above background, transfer a sufficient amountof sample to a 125-mi separatory funnel and proceed with the extrac-tion step described in R4TC-125-U-17.
B. Extraction
Pipet the desired aliquot of the diluted sample into an extraction vial.If no dilution is required and the sample is alkaline, acidify by addingconcentrated nitric acid dropwise to the aliquot taken for extraction. Addapproximately 15 ml of saturated aluminum nitrate and exactly 10 ml ofethyl acetate from the automatic pipet. Cap the vial and agitate on theshaker for 3 to 4 minutes. To avoid dilution of the saturated aluminumnitrate in the extraction vial, which may lead to low uranium values, all-quots for extraction should not exceed 2 ml. Extract a reagent blank andstandard with each set of samples.
C. Preparation of Pellets
Place 22 platinum dishes on wire rings and then ensure that the rings andthe sample are level (see pattern Figure). Place the rings and dishesunder the drying unit until all the dishes are dry. The dishes must bedry since placing flux pellets onto wet dishes will eventually cause asevere attack on the platinum.
Using the pellet maker, prepare and place a pellet of fluoride flux ineach dry dish according to the following procedure: Fill a 250-ml beaker(or other suitable container) with flux to a depth of 2-1/2 to 3 inches.While rotating the beaker, pack the barrel of the pellet maker by plunging
192
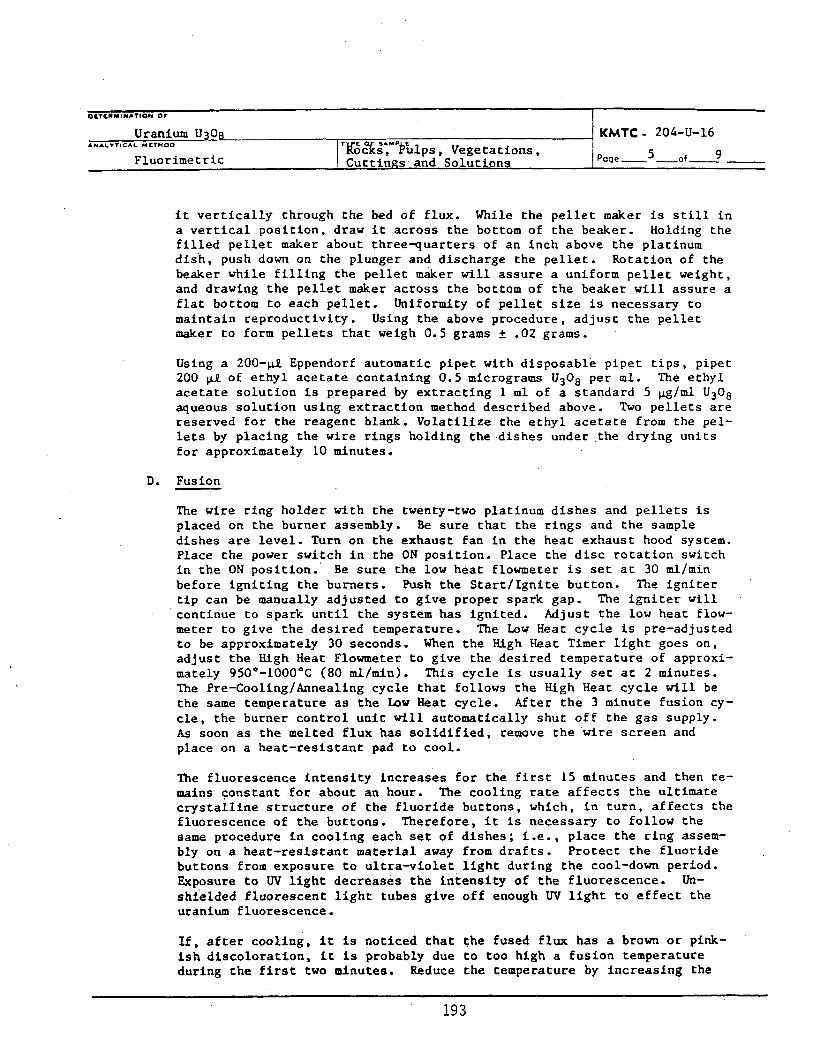
ODThRMINATION OF
Uranium U30 8 KMTC- 204-U-16AN ALY TICAL M TIO OI T kocl s ,"i• ips , Vegetations , po ge of 9
Fluorimetric Cuttings and Solutions
it vertically through the bed of flux. While the pellet maker is still ina vertical position, draw it across the bottom of the beaker. Holding thefilled pellet maker about three-quarters of an inch above the platinumdish, push down on the plunger and discharge the pellet. Rotation of thebeaker while filling the pellet maker will assure a uniform pellet weight,and drawing the pellet maker across the bottom of the beaker will assure aflat bottom to each pellet. Uniformity of pellet size is necessary tomaintain reproductivity. Using the above procedure, adjust the pelletmaker to form pellets that weigh 0.5 grams ± .02 grams.
Using a 20 0 -g£ Eppendorf automatic pipet with disposable pipet tips, pipet200 g1 of ethyl acetate containing 0.5 micrograms U30 8 per ml. The ethylacetate solution is prepared by extracting 1 ml. of a standard 5 pg/ml U3 08aqueous solution using extraction method described above. Two pellets arereserved for the reagent blank. Volatilize the ethyl acetate from the pel-lets by placing the wire rings holding the dishes under the drying unitsfor approximately 10 minutes.
D. Fusion
The wire ring holder with the twenty-two platinum dishes and pellets isplaced on the burner assembly. Be sure that the rings and the sampledishes are level. Turn on the exhaust fan in the heat exhaust hood system.Place the power switch in the ON position. Place the disc rotation switchin the ON position. Be sure the low heat flowmeter is set at 30 ml/minbefore igniting the burners. Push the Start/Ignite button. The ignitertip can be manually adjusted to give proper spark gap. The igniter willcontinue to spark until the system has ignited. Adjust the low heat flow-meter to give the desired temperature. The Low Heat cycle is pre-adjustedto be approximately 30 seconds. When the High Heat Timer light goes on,adjust the High Heat Flowmeter to give the desired temperature of approxi-mately 950*-1000*C (80 ml/min). This cycle is usually set at 2 minutes.The Pre-Cooling/Annealing cycle that follows the High Heat cycle will bethe same temperature as the Low Heat cycle. After the 3 minute fusion cy-cle, the burner control unit will automatically shut off the gas supply.As soon as the melted flux has solidified, remove the wire screen andplace on a heat-resistant pad to cool.
The fluorescence intensity increases for the first 15 minutes and then re-mains constant for about an hour. The cooling rate affects the ultimatecrystalline structure of the fluoride buttons, which, in turn, affects thefluorescence of the buttons. Therefore, it is necessary to follow thesame procedure in cooling each set of dishes; i.e., place the ring assem-bly on a heat-resistant material away from drafts. Protect the fluoridebuttons from exposure to ultra-violet light during the cool-down period.Exposure to UV light decreases the intensity of the fluorescence. Un-shielded fluorescent light tubes give off enough U`V light to effect theuranium fluorescence.
If, after cooling, it is noticed that the fused flux has a brown or pink-ish discoloration, it is probably due to too high a fusion temperatureduring the first two minutes. Reduce the temperature by increasing the
193
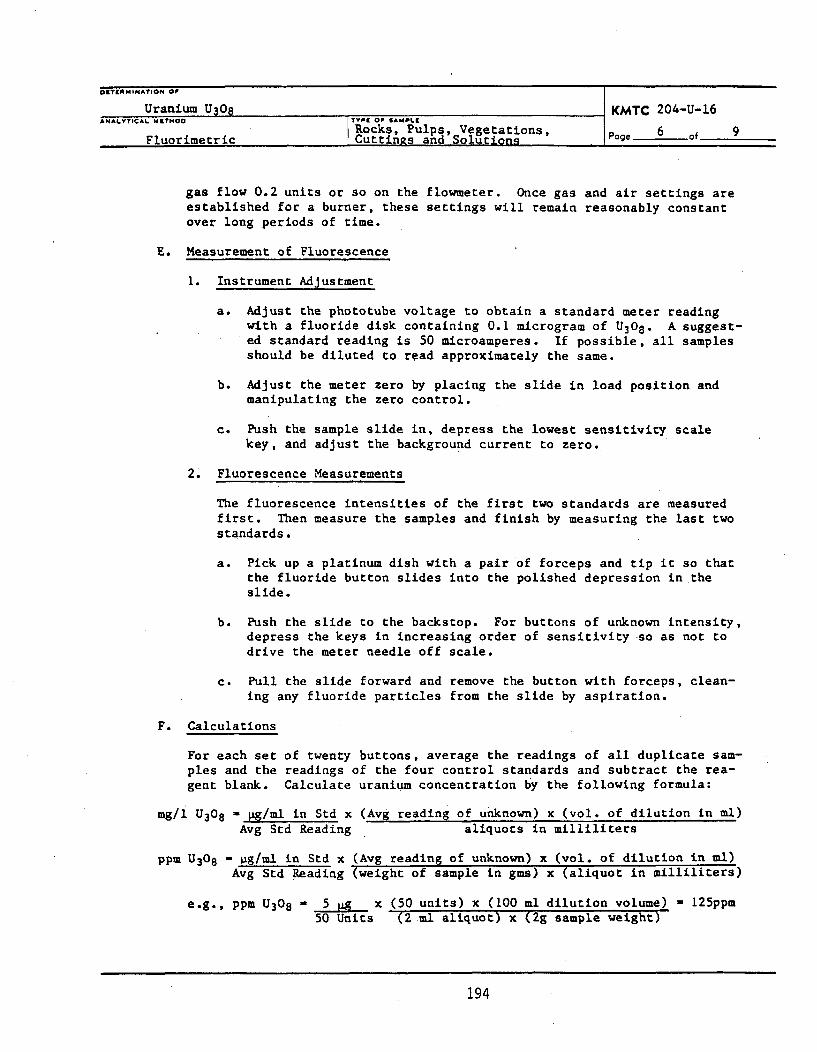
DOTCAMINATION OF
Uranium U308 KMTC 204-U-16ANALYTICAL MITHOO ?TYP OP SAMPLI
Rocks, Pulps, Vegetations, Page 6 of_ 9Fluorimetric Cuttings and Solutions
gas flow 0.2 units or so on the flowmeter. Once gas and air settings areestablished for a burner, these settings will remain reasonably constantover long periods of time.
E. Measurement of Fluorescence
1. Instrument Adjustment
a. Adjust the phototube voltage to obtain a standard meter readingwith a fluoride disk containing 0.1 microgram of U308 . A suggest-ed standard reading is 50 microamperes. If possible, all samplesshould be diluted to read approximately the same.
b. Adjust the meter zero by placing the slide in load position andmanipulating the zero control.
c. Push the sample slide in, depress the lowest sensitivity scale
key, and adjust the background current to zero.
2. Fluorescence Measurements
The fluorescence intensities of the first two standards are measuredfirst. Then measure the samples and finish by measuring the last twostandards.
a. Pick up a platinum dish with a pair of forceps and tip it so thatthe fluoride button slides into the polished depression in theslide.
b. Push the slide to the backstop. For buttons of unknown intensity,depress the keys in increasing order of sensitivity so as not todrive the meter needle off scale.
c. Pull the slide forward and remove the button with forceps, clean-ing any fluoride particles from the slide by aspiration.
F. Calculations
For each set of twenty buttons, average the readings of all duplicate sam-ples and the readings of the four control standards and subtract the rea-gent blank. Calculate uranium concentration by the following formula:
mg/l U30 8 - 4i/ml in Std x (Avg reading of unknown) x (vol. of dilution in ml)Avg Std Reading aliquots in milliliters
ppm U3 08 - 1ig/ml in Std x (Avg reading of unknown) x (vol. of dilution in ml)Avg Std Reading (weight of sample in gms) x (aliquot in milliliters)
e.g., ppm U308 - 5 M x (50 units) x (100 ml dilution volume) - 125ppm50 Units (2 ml aliquot) x (2g sample weight)
194

OCTPM INATiON Or
Uranium U308 KMTC 204-U-16,L Mo00ulps, Vegetations,
FIluoimetric Cuttings and Solutions Page7 of9
The above calculation assumes that the same volume of ethyl acetate isused for the standards and the unknowns; e.g., 10 ml for extraction and200 R1 aliquot on the fluoride pellet or I ml aq. . 5 gg 0.2 ml ETAC
ml X' 10 ml ETAC- 0.1 g U3 08 actually on pellet.
G. Cleanliness
As with any other method employed for trace analysis, contamination mustbe carefully guarded against at all times. The fluorometric method ofanalysis is generally used in a laboratory or plant where uranium ore dustor even uranium concentrate dust is present in the atmosphere. Therefore,a room supplied with filtered air and used only for fluorometric analysisis a requirement. Each week all the floors and benches in the room shouldbe washed and about once a month the walls and overhead fixtures should bevacuum cleaned.
Glassware and other equipment used for this analysis should not be usedfor other purposes and should be scrupulously cleaned after each use.People working in the fluorometer room should not use protective handcreams since these creams usually have a strong ultraviolet fluorescence,and anything touched by the hands will become contaminated.
For best quality ultra-trace analysis, only plastic and teflon ware shouldbe used. All glassware and quartzware contains measureable levels of ura-nium which can bias high the final result when ultra-trace levels of ura-nium are being determined.
H. Costs
In groups of at least 15 rock or soil samples, the cost is 0.23 man-hoursper sample, excluding sample preparation (crushing and pulping) cost.
I. Sensitivity, Precision and Accuracy
The lower limit is I ppm; upper recommended limit is 5000 ppm.
Accuracy is very dependent upon the nature of the sample and the qualityof the standards. In no circumstances should accuracy be assumed to beequivalent to the precision. In a study on a Grand Junction analyzedsandstone certified at 0.107% U3 08 , the following results were obtainedover about a one-month period:
0.107% U3080.101 x - 0.109% U3 080.112 S - 0.0052% U3080.107 RSD - 4.72%0.1090.1170.113
195
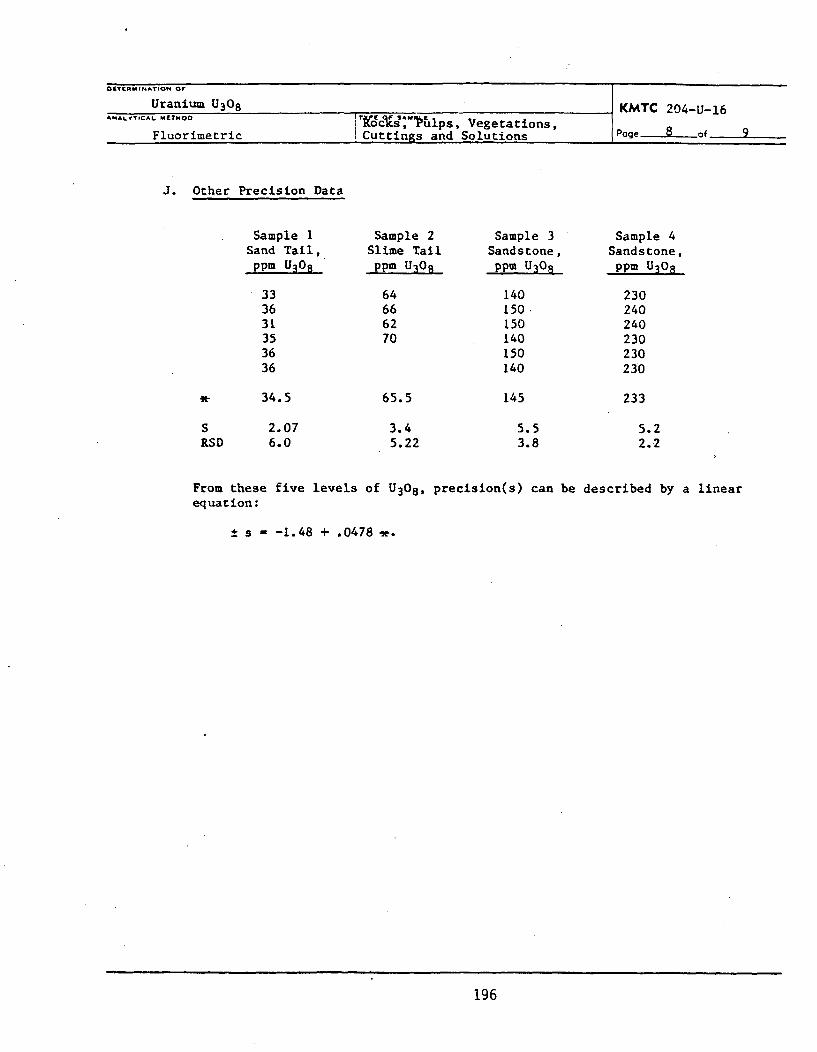
0 .(T..,o.-TN o Of
Uranium U30 8 KMTC 204-U-16AN.ALYTICAL MEIOO %'cls, 1ulps. Vegetations,
Fluorimetric Cuttings and Solutions Pageof-9
J. Other Precision Data
Sample 1Sand Tail,
ppm U3 08
333631353636
Sample 2Slime Tail
ppm U308
64666270
Sample 3Sandstone,
ppm U3 0 8
140150150140150140
Sample 4Sandstone,
ppm U3O8
230240240230230230
*34.5 65.5 145
5.53.8
233
5.22.2
SRSD
2.076.0
3.45.22
Fromequat
these five levels of U3 0 8 , precision(s) can be described by a linear:ion:
± s - -1.48 + .0478 -.
196
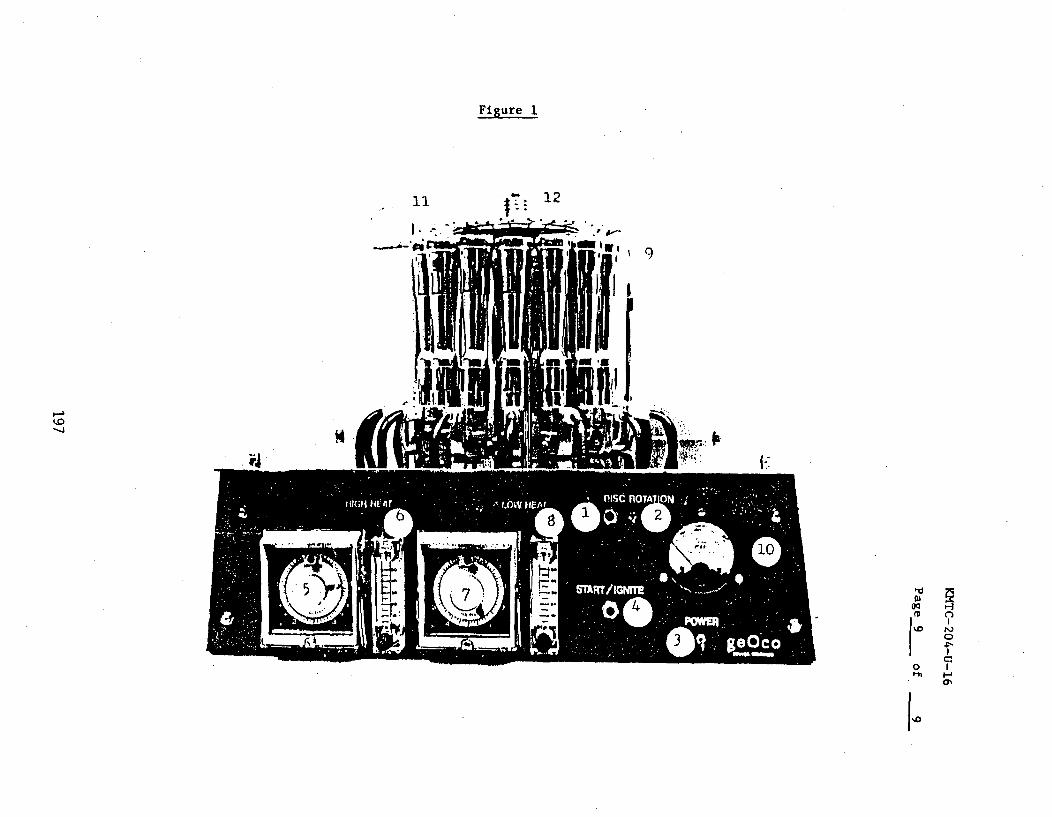
Figure 1
11 *'~12
P0
It 0
0 1
%0
KERR-MCGEE CORPORATION KMTC - C-2TECHNICAL CENTER ISSUED 10/13/82 .REVISED 3/31/85
ANALYTICAL METHODS PAGE _ _OF 23
OETERNTOfThe Solublity and.Di.l.ti.n Rate TYPE OF SAMPLE
Classification of Air-Borne Particulates in Air-Borne Particulates
It' Idn F i WRITTEN BY APPROVEO
In-Vitro AKD/AKW GEV
INTRODUCTION:
The manufacture of nuclear fuel elements, as at the Sequoyah Facility ofSequoyah Fuels Corporation, where uranium hexafluoride is produced from theuranium concentrate, involves the processing of several uranium compoundswhich at certain stages are present in finely divided form. The continuoushandling of large quantities of these materials, and some escape of volatilefluorides of uranium, inevitably results in some air contamination.(1) Bydetermining the concentration and size-spectrum of particulates within theworking environment as well as at the nearest residence, the likely intakeand retention of material in the human body (a measure of associated hazarddue to inhalation) may be calculated using the Standard Man data of theInternational Commission on Radiological Protection, "ICRP (1959)" inassociation with the lung model proposed by the ICRP Task Group on LungDynamics (1966). Thisrspecial task group was created by the ICRP Committee(2) for the purpose of reviewing the so-called lung model; a scheme forcomputing dust deposition as a function of particle size and clearance fromthe human respiratory tract thereby providing a basis for lung dosimetryfrom radionuclide deposited and the setting of exposure limits. Theclearance of deposited material in the human body is carried out by numerousbiological processes. The rates of these processes depend upon thesolubility of the materials concerned in biological fluids. It has beenknown for some years that some materials insoluble in water havenevertheless a significant solubility in biological fluids. The ICRPcommented on it in lung dynamics. Some initial solubility studies wereperformed with real plasma, but due to bacterial deterioration of theplasma, enormous difficulties were encountered. It was subsequently decidedto use a simulated lung fluid as the solvent for solubility studies ofair-borne uranium particles.
According to the ICRP lung clearance model, the deposited material in thelung is classified into three groups. The basis of this classification isthe rate at which it leaves the lung. These three classes are D, W, and Y,corresponding to half-times in the lung of 0 to 10 days, 11 to 100 days, and>100 days, respectively. It was originally assumed that the rate at whichthe mass leaves the lung is proportional to the lung burden and a simplerelationship is obtained which predicts that the lung burden will diminishexponentially with time. But, in many cases, the clearance of material fromthe lung has been found to be progressively slower than predicted by asingle exponential process, and it becomes necessary to include additionalexponential terms. The deposited material is then classified according tothe weight fractions of D, W and Y components. Although biologicalprocesses (3) like endocytosis and ciliary-mucus transport are known tocontribute to the lung clearance, the complete and thorough biological dataare not available. As a result, the dissolution half-times for materials
198
(air-borne particles) in simulated lung fluid have been assumed to beapproximately equal to their lung clearance half-times.(C,2) When thelung-clearance classification for a material is determined by the solubilitytest in simulated lung fluid, its transport rates between other anatomicalcompartments are automatically evaluated. From these values,- the residencetime of the material and the associated radiation dose in each compartmentcan be calculated.(4)
The Nuclear Regulatory Commission requires Kerr-McGee Corporation to carryout the dissolution-rate classification test of uranium on each quarterlycomposited dust sample collected near the uranium conversion plant. Samplesfrom other locations or facilities maybe required in the future. Themethod followed here for the dissolution test is that of D. R. Kalkwarf,(5)as required also by the NRC. The dissolution test is carried out at 37*C-.Although the U.S. Environmental Protection Agency has recommended that allparticulates with <10 Um be considered inhalable for hazard evaluations, thesolubility test is performed on the whole sample which contains bothrespirable and non-respirable dust. Since the lung is believed to be a sitefor efficient dissolution, the solubility test is performed in awell-stirred suspension to achieve maximum clearance rates. As a result,these values should also approximate the lung clearance rates that includecontributions from endocytosis and ciliary-mucus transport.
SAMPLE COLLECTION AND PREPARATION
For each quarter, air particulate samples are collected on filter papers. Ahigh-volume air sampler is used for collection of air particulates. Thefilter paper used is replaced by a new one (8 X 10" Nucleopore or Millipore)every week during the quarter. The dust sample collected on the filterpaper contains both respirable and non-respirable particulates.
Each filter paper containing air particulates is split. One-half of eachfilter paper for the quarter is either retained or sent to the U.S. NuclearRegulatory Commission for performing the verification of uranium dissolutiontest in simulated lung fluid. The other half is again split; one-half ofthis is kept for gross alpha and uranium analysis, and the other half isutilized for the uranium solubility test.
In order to get a representative sample, filter paper strips of proper sizeare cut from each original filter paper containing the sample. The sizes(areas) of the strips are determined in such a way that the volume of airpassing through each filter paper strip is approximately the same. Thesedust coated filter paper strips are dried in a desiccator over anhydrouscalcium sulfate (Drierite) for 5 days. At the end of the drying period, thedust particles are 'vacuumed off' the surface of each filter paper stripwith a vacuum line fitted with a plastic filter-holder (MilliporeCorporation, Swinex 25) containing a 25-mm diameter membrane filter(Millipore, Type HA, pore size 0.45 um). The dust collected on the membranefilter is sterilized by running ethylene oxide gas, from a small lecturebottle, through the membrane filter at a very slow rate for 4 hours.Sterilization is important so that the possible effects of bacterial growthin the suspension can be prevented. The dust collected on the membrane
199
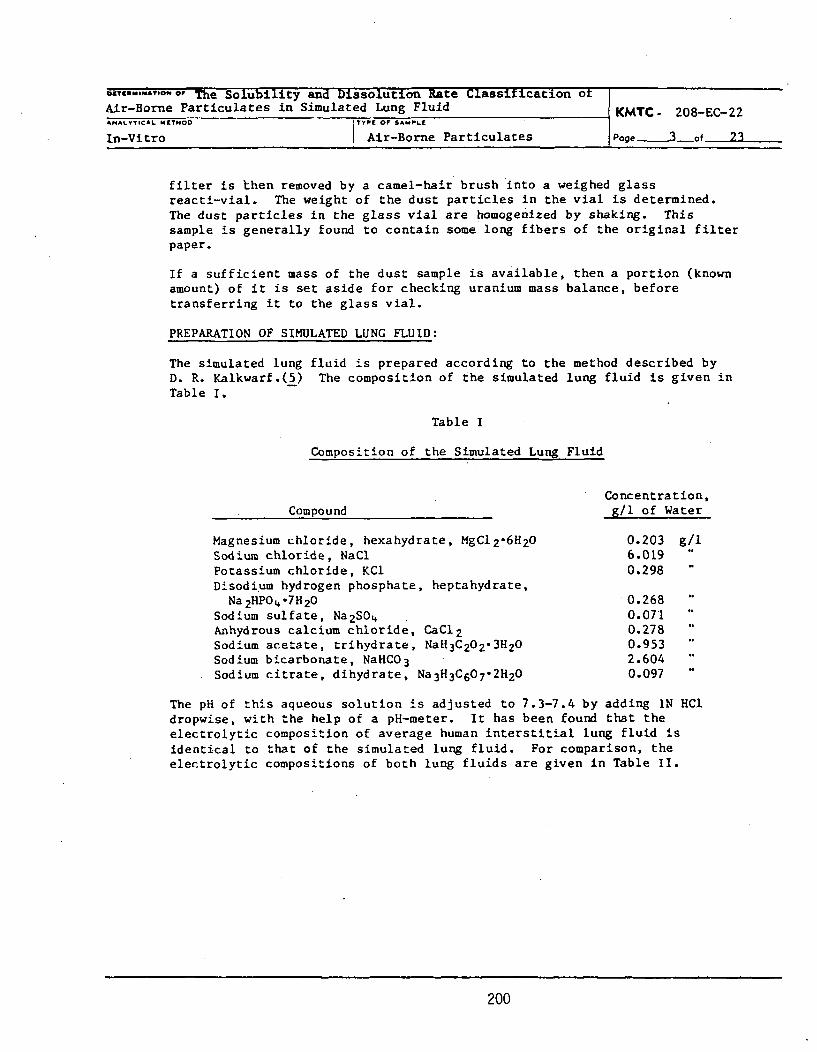
DETERMINAION or The Solubility and Dissolution Rate Classification otAir-Borne Particulates in Simulated Lung Fluid KMTC- 208-EC-22&NPALYTICAL METHOD ITYPE OF SAMPLE
In-Vitro Air-Borne Particulates Page 3 of 23
filter is then removed by a camel-hair brush into a weighed glassreacti-vial. The weight of the dust particles in the vial is determined.The dust particles in the glass vial are homogenized by shaking. Thissample is generally found to contain some long fibers of the original filterpaper.
If a sufficient mass of the dust sample is available, then a portion (knownamount) of it is set aside for checking uranium mass balance, beforetransferring it to the glass vial.
PREPARATION OF SIMULATED LUNG FLUID:
The simulated lung fluid is prepared according to the method described byD. R. Kalkwarf.(5) The composition of the simulated lung fluid is given inTable I.
Table I
Composition of the Simulated Lung Fluid
Concentration,Compound g/l of Water
Magnesium chloride, hexahydrate, MgC12-6H 2 0 0.203 g/lSodium chloride, NaCl 6.019Potassium chloride, KCl 0.298Disodium hydrogen phosphate, heptahydrate,
Na 2RPO-7H2 0 0.268Sodium sulfate, Na 2 SO4 0.071Anhydrous calcium chloride, CaCI 2 0.278
Sodium acetate, trihydrate, NaH 3C 2 02-3H20 0.953Sodium bicarbonate, NaHCO 3 2.604Sodium citrate, dihydrate, Na 3H3C 6 07-2H20 0.097 "
The pH of this aqueous solution is adjusted to 7.3-7.4 by adding IN HCUdropwise, with the help of a pH-meter. It has been found that theelectrolytic composition of average human interstitial lung fluid isidentical to that of the simulated lung fluid. For comparison, theelectrolytic compositions of both lung fluids are given in Table II.
200
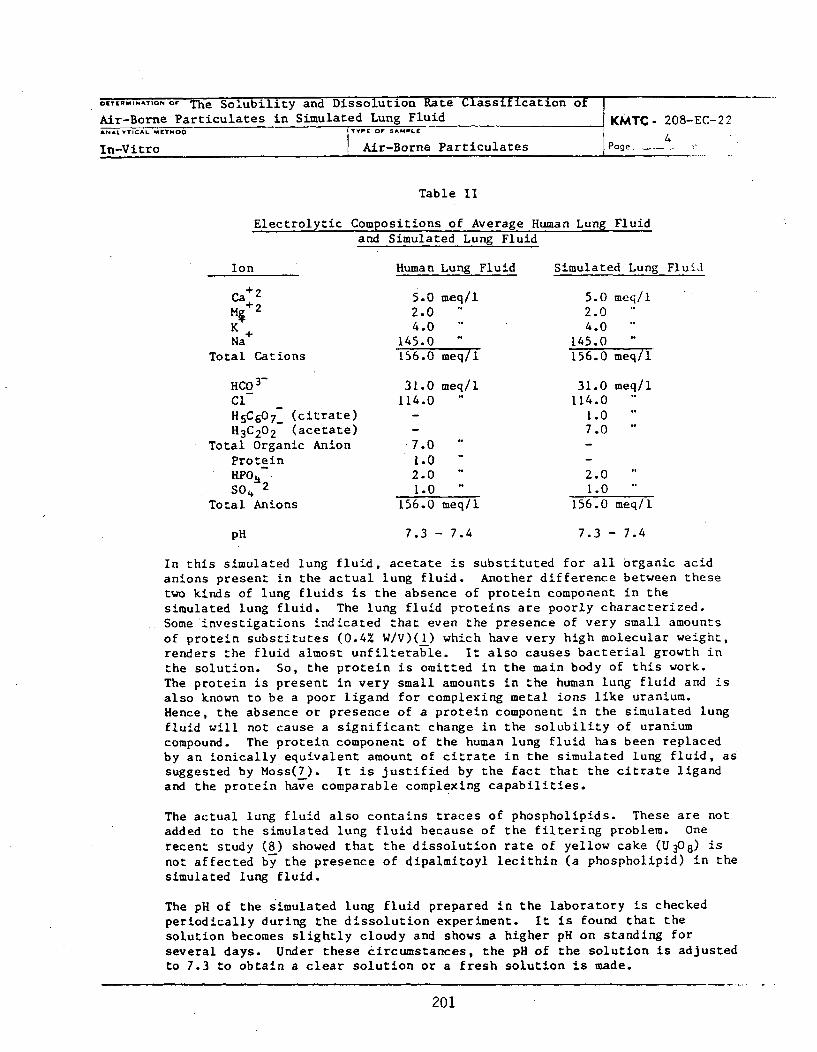
ODTER.MINATtON Or The Solubility and Dissolution Rate Classification of
Air-Borne Particulates in Simulated Lung Fluid KMTC- 208-EC-22ANALYTICAL METHOO ITVPE OF SA"PLt
In-Vitro Air-Borne Particulates Page_ 4'
Table II
Electrolytic Compositions of Average Human Lung Fluid
and Simulated Lung Fluid
Ion Human Lung Fluid Simulated Lung Fluid
Ca+2 5.0 meq/l 5.0 meq/lM$+2 2.0 2.0
K + 4.0 4.0Na 145.0 145.0
Total Cations 156.0 meq/l 156.0 meq/l
HCO 3- 31.0 meq/l 31.0 meq/lCl 114.0 114.0H5C 6 0 7 - (citrate) - 1.0H3 C2 0 2 (acetate) - 7.0
Total Organic Anion .7.0Protein 1.0HPO2 2.0 2.0S0 4
2 1.0 1.0Total Anions 156.0 meq/l 156.0 meq/l
pH 7.3 - 7.4 7.3 - 7.4
In this simulated lung fluid, acetate is substituted for all organic acidanions present in the actual lung fluid. Another difference between thesetwo kinds of lung fluids is the absence of protein component in thesimulated lung fluid. The lung fluid proteins are poorly characterized.Some investigations indicated that even the presence of very small amountsof protein substitutes (0.4% W/V)(1) which have very high molecular weight,renders the fluid almost unfilterable. It also causes bacterial growth inthe solution. So, the protein is omitted in the main body of this work.The protein is present in very small amounts in the human lung fluid and isalso known to be a poor ligand for complexing metal ions like uranium.Hence, the absence or presence of a protein component in the simulated lung
fluid will not cause a significant change in the solubility of uraniumcompound. The protein component of the human lung fluid has been replacedby an ionically equivalent amount of citrate in the simulated lung fluid, assuggested by Moss(7). It is justified by the fact that the citrate ligandand the protein have comparable complexing capabilities.
The actual lung fluid also contains traces of phospholipids. These are notadded to the simulated lung fluid because of the filtering problem. One
recent study (8) showed that the dissolution rate of yellow cake (U 30 8 ) isnot affected by the presence of dlpalmitoyl lecithin (a phospholipid) in the
simulated lung fluid.
The pH of the simulated lung fluid prepared in the laboratory is checkedperiodically during the dissolution experiment. It is found that thesolution becomes slightly cloudy and shows a higher pH on standing forseveral days. Under these circumstances, the pH of the solution is adjustedto 7.3 to obtain a clear solution or a fresh solution is made.
201
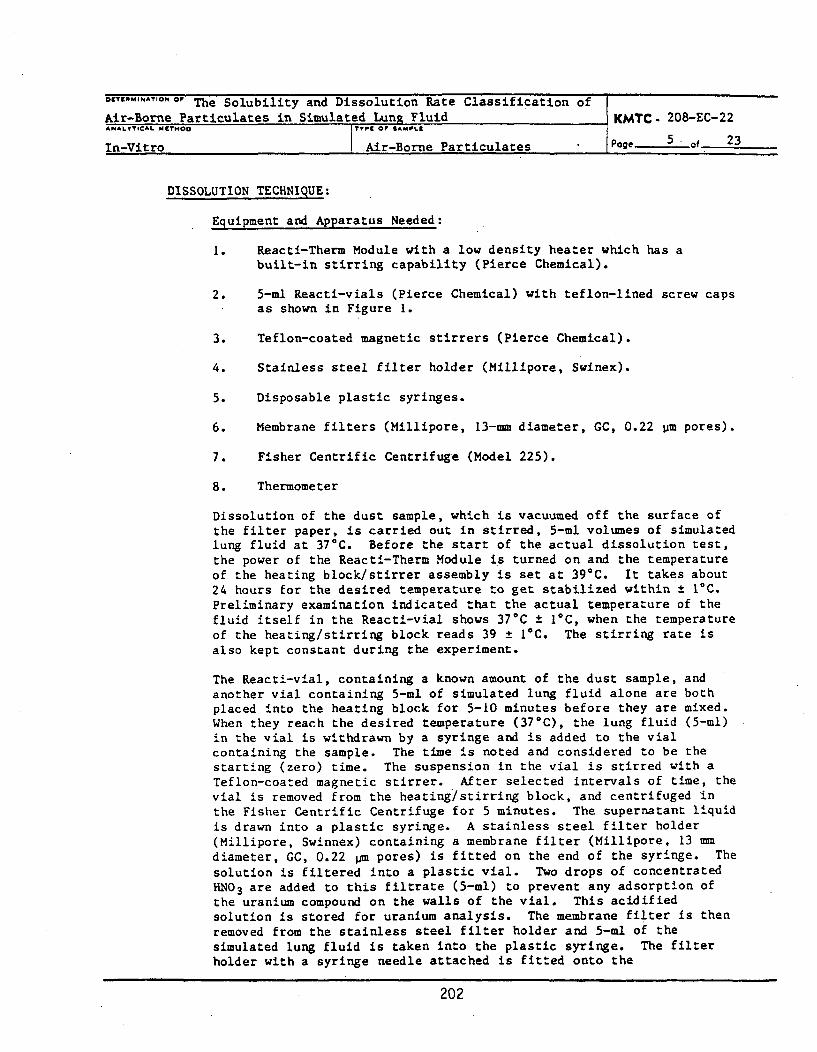
09"mm°Nor, The Solubility and Dissolution Rate Classification of
Air-Borne Particulates in Simulated Lung Fluid KMTC- 208-EC-22ANALYTICAL M ETMOO I TYPE OP SAMPL5
In-Vitro Air-Borne Particulates Page of 23
DISSOLUTION TECHNIQUE:
Equipment and Apparatus Needed:
1. Reacti-Therm Module with a low density heater which has abuilt-in stirring capability (Pierce Chemical).
2. 5-ml Reacti-vials (Pierce Chemical) with teflon-lined screw capsas shown in Figure 1.
3. Teflon-coated magnetic stirrers (Pierce Chemical).
4. Stainless steel filter holder (Millipore, Swinex).
5. Disposable plastic syringes.
6. Membrane filters (Millipore, 13-mm diameter, GC, 0.22 pm pores).
7. Fisher Centrific Centrifuge (Model 225).
8. Thermometer
Dissolution of the dust sample, which is vacuumed off the surface ofthe filter paper, is carried out in stirred, 5-ml volumes of simulatedlung fluid at 37*C. Before the start of the actual dissolution test,the power of the Reacti-Therm Module is turned on and the temperatureof the heating block/stirrer assembly is set at 39 0 C. It takes about24 hours for the desired temperature to get stabilized within ± 10 C.
Preliminary examination indicated that the actual temperature of the
fluid itself in the Reacti-vial shows 37*C ± 10 C, when the temperature
of the heating/stirring block reads 39 ± 10C. The stirring rate is
also kept constant during the experiment.
The Reacti-vial, containing a known amount of the dust sample, and
another vial containing 5-ml of simulated lung fluid alone are both
placed into the heating block for 5-10 minutes before they are mixed.
When they reach the desired temperature (37*C), the lung fluid (5-ml)
in the vial is withdrawn by a syringe and is added to the vial
containing the sample. The time is noted and considered to be the
starting (zero) time. The suspension in the vial is stirred with a
Teflon-coated magnetic stirrer. After selected intervals of time, the
vial is removed from the heating/stirring block, and centrifuged in
the Fisher Centrific Centrifuge for 5 minutes. The supernatant liquidis drawn into a plastic syringe. A stainless steel filter holder
(Millipore, Swinnex) containing a membrane filter (Millipore, 13 mm
diameter, GC, 0.22 pm pores) is fitted on the end of the syringe. The
solution is filtered into a plastic vial. Two drops of concentrated
HN03 are added to this filtrate (5-ml) to prevent any adsorption of
the uranium compound on the walls of the vial. This acidified
solution is stored for uranium analysis. The membrane filter is then
removed from the stainless steel filter holder and 5-ml of the
simulated lung fluid is taken into the plastic syringe. The filter
holder with a syringe needle attached is fitted onto the
202
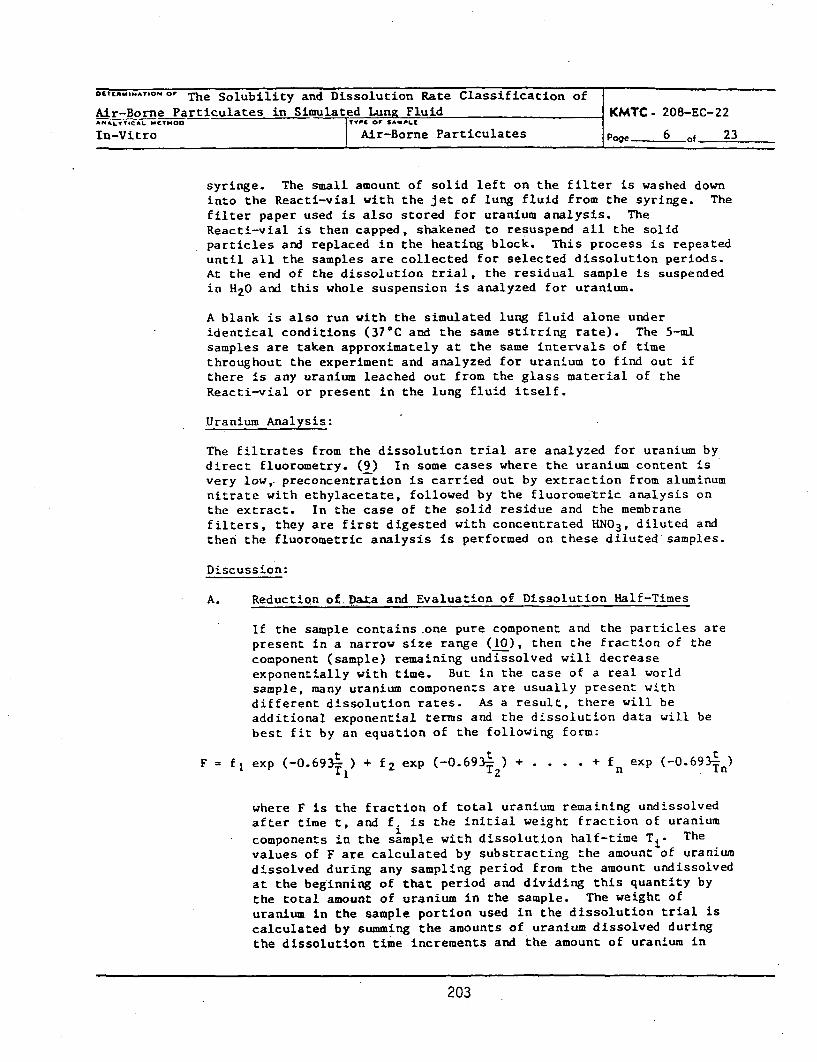
syringe. The small amount of solid left on the filter is washed downinto the Reacti-vial with the jet of lung fluid from the syringe. Thefilter paper used is also stored for uranium analysis. TheReacti-vial is then capped, shakened to resuspend all the solidparticles and replaced in the heating block. This process is repeateduntil all the samples are collected for selected dissolution periods.At the end of the dissolution trial, the residual sample is suspendedin H2 0 and this whole suspension is analyzed for uranium.
A blank is also run with the simulated lung fluid alone underidentical conditions (37*C and the same stirring rate). The 5-ml
samples are taken approximately at the same intervals of timethroughout the experiment and analyzed for uranium to find out ifthere is any uranium leached out from the glass material of theReacti-vial or present in the lung fluid itself.
Uranium Analysis:
The filtrates from the dissolution trial are analyzed for uranium bydirect fluorometry. (9) In some cases where the uranium content isvery low,- preconcentration is carried out by extraction from aluminumnitrate with ethylacetate, followed by the fluorometric analysis onthe extract. In the case of the solid residue and the membranefilters, they are first digested with concentrated HN0 3 , diluted andthen the fluorometric analysis is performed on these diluted samples.
Discussion:
A. Reduction of Data and Evaluation of Dissolution Half-Times
If the sample contains .one pure component and the particles arepresent in a narrow size range (10), then the fraction of the
component (sample) remaining undissolved will decreaseexponentially with time. But in the case of a real worldsample, many uranium components are usually present with
different dissolution rates. As a result, there will beadditional exponential terms and the dissolution data will bebest fit by an equation of the following form:
t t tF =f exp (-0.693T) + f 2 exp (-0.693T) . . . . + f exp (-0.693n
where F is the fraction of total uranium remaining undissolvedafter time t, and f. is the initial weight fraction of uranium1
components in the sample with dissolution half-time T.- The
values of F are calculated by substracting the amount of uranium
dissolved during any sampling period from the amount undissolvedat the beginning of that period and dividing this quantity bythe total amount of uranium in the sample. The weight ofuranium in the sample portion used in the dissolution trial iscalculated by summing the amounts of uranium dissolved during
the dissolution time increments and the amount of uranium in
203

Page 7 of 23KMTC-208-EC-22
PLASTIC CAP
TEFLON LINER
SIMULATED "-_--LUNG FLU I D -
MAGNETICSTIRRER
GLASS VIAL.....
FIGURE I. Cross Section of Dissolution Chamber forDust Samples
204
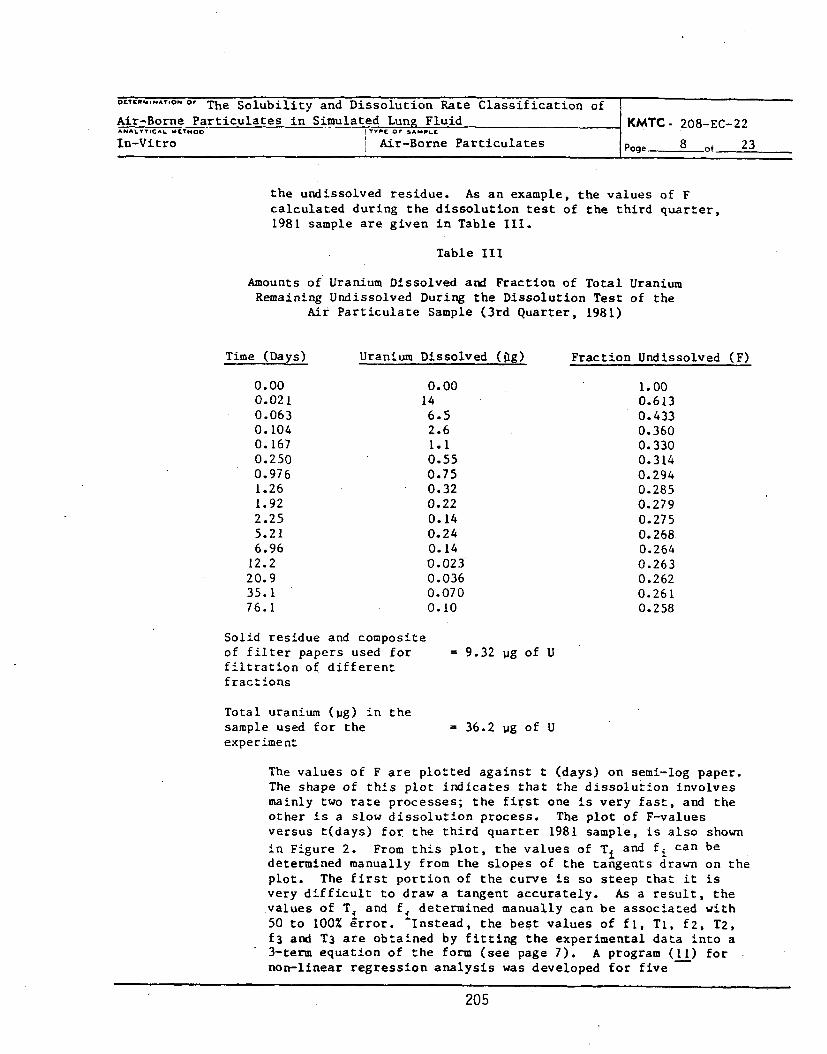
oLTERM*.AI.o O The Solubility and Dissolution Rate Classification of
Air-Borne Particulates in Simulated Lung Fluid KMTC- 208-EC-22ANALYTICAL METHOD J YYP OF SAMPLE
In-Vitro i Air-Borne Particulates Page 8 of 23
the undissolved residue. As an example, the values of Fcalculated during the dissolution test of the third quarter,1981 sample are given in Table 11.
Table III
Amounts of Uranium Dissolved and Fraction of Total UraniumRemaining Undissolved During the Dissolution Test of the
Air Particulate Sample (3rd Quarter, 1981)
Time (Days)
0.000.0210.0630.1040. 1670.2500.9761.261.922.255.216.96
12.220.935. 176.1
Uranium Dissolved (ag) Fraction Undissolved (F)
0.0014
6.52.61.10.550.750.320.220.140.240.140.0230.0360.0700.10
1.000.6130.4330.3600.3300.3140.2940.2850.2790.2750.2680.2640.2630.2620.2610.258
Solid residue and compositeof filter papers used forfiltration of differentfractions
Total uranium ().g) in thesample used for theexperiment
= 9.32 Ug of U
= 36.2 ug of U
The values of F are plotted against t (days) on semi-log paper.The shape of this plot indicates that the dissolution involvesmainly two rate processes; the first one is very fast, and the
other is a slow dissolution process. The plot of F-valuesversus t(days) for the third quarter 1981 sample, is also shown
in Figure 2. From this plot, the values of Ti and fi can be
determined manually from the slopes of the tangents drawn on theplot. The first portion of the curve is so steep that it isvery difficult to draw a tangent accurately. As a result, thevalues of T4 and f4 determined manually can be associated with50 to 100% irror. -Instead, the best values of fl, TI, f2, T2,
f3 and T3 are obtained by fitting the experimental data into a3-term equation of the form (see page 7). A program (11) fornon-linear regression analysis was developed for five
205

FIGURE 2
Fraction of-Uraniumn Undissolved (F) vs. Time (days)
... .... ... ...-
... .. .i li i . .
0.8~ : .'i
N)tIi iC>I
0.4,
0.8 3 . 1!' . 'I:j'I~~~; 0'¾~~*
0.21 "A 1ff.i T
11 IN 1000
I IrFl;' . I tM ,S ;
OcTNMNAYION of The Solubility and Dissolution Rate Classification of
Air-Borne Particulates in Simulated Lung Fluid KMTC-208-EC-22ANALYTICAL 0ETMOD0 TYPZ OF OAMPLI
In-Vitro Air-Borne Particulates Page _0 of 23
independent variables. This program is called 'NEWBRIT' and itsFortran Coding is given in the Appendix. For determining thesixth variable, one condition has been introduced into theprogram, that the summation of the weight fractions of threecomponents must be equal to 1, that is fl + f 2 + f 3 - 1. Thisparticular program needs a "seed" error value associated withthe feeding values of both F and t in order to start. Thearbitrary values of 0.0001 and 0.01 are introduced as errorsassociated with t and F, respectively. In the iterativeprogram, these values of error are varied in such a way that thebest values of fl, T1 , T2 and T3 are obtained with minimumerrors. Then the value of f 3 is determined by difference.
The data is entered into the data file "ASOK as in thefollowing example:
.6689 .0092 .1383 1.2454 320
.1 .00001 .001 .01 501. 1. 1. 100 IE50 .0001 1. .010.0208 .0001 .724 .01.0625 .0001 .647 .01.1042 .0001 .613 .01.1874 .0001 .583 .01.2708 .0001 .563 .01.9422 .0001 .526 .011.276 .0001 .508 .011.928 .0001 .498 .013.02 .0001 .489 .016.21 .0001 .48 .019.24 .0001 .473 .0113.95 .0001 .468 .0127.12 .0001 .459 .0178.12 .0001 .349 .01
Lines 1-3 remain unchanged from sample to sample as these arethe "seed" values used by the program to calculate thevariables. Lines 4-18 are the actual data obtainedexperimentally. Column I is the time in days from the start ofthe test.
Columns 2 and 4 are the arbitrary error values discussed above.Column 3 is the fraction of uranium undissolved at the timelisted in Column 1. After the data is entered, the program"NEWBRIT" is run manually. At each iteration the operatorenters values for IT (number of iterations) = usually 1, IDEM(maximum number of deming iterations) = usually 1, and GAMACT(maximum feasible step from binding bounds) = any number from10-5 to 105. After the first iteration, the value for GAMACT isvaried to slowly approach the SumDEL (sum of values of the dataadjustments) value calculated for the previous step. Thismethod, when taken through 30-50 iterations, producesreproducible values for fl, f 2 , TI, T2 and T3 with errors on theorder of < 1% of the value.
Zui /•
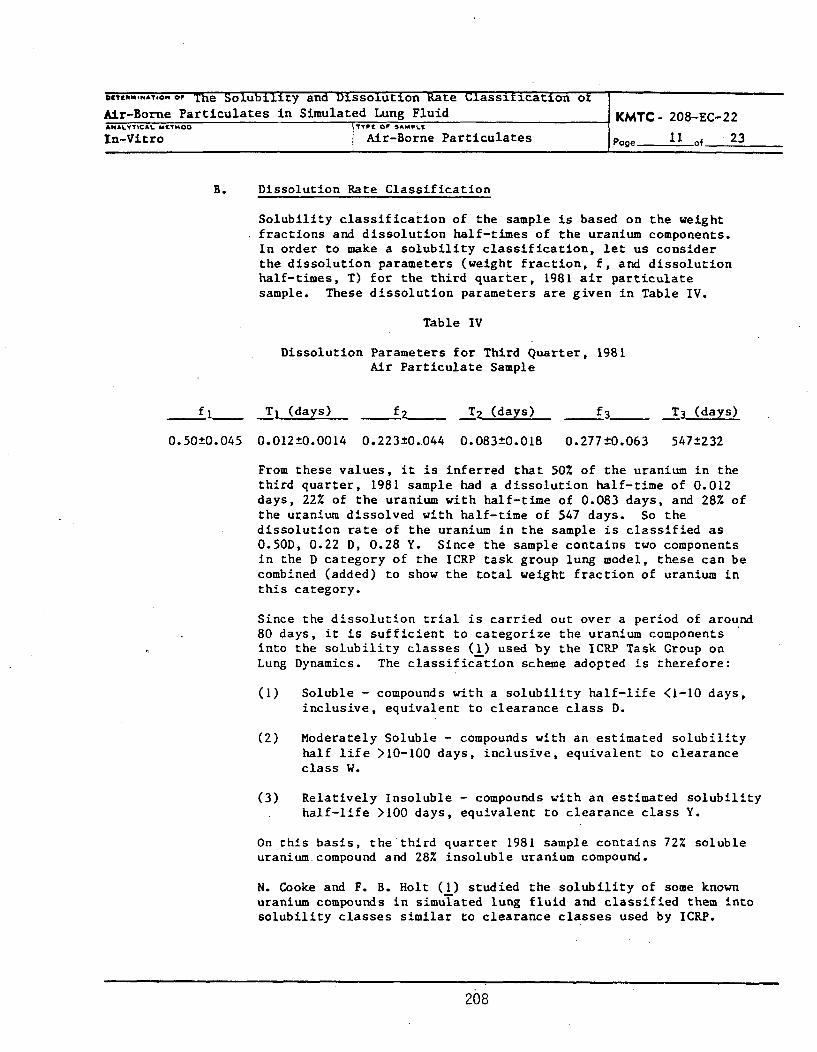
DETINMNATION O0 The Solubility and Dissolution Rate Classitication ot
Air-Borne Particulates in Simulated Lung Fluid KMTC- 208-EC-22ANALYT•tC L MffT4O0 TYP E O f SAMP^2
In-Vitro Air-Borne Particulates Poge 1 of • 23
B. Dissolution Rate Classification
Solubility classification of the sample is based on the weightfractions and dissolution half-times of the uranium components.In order to make a solubility classification, let us considerthe dissolution parameters (weight fraction, f, and dissolutionhalf-times, T) for the third quarter, 1981 air particulatesample. These dissolution parameters are given in Table IV.
Table IV
Dissolution Parameters for Third Quarter, 1981Air Particulate Sample
fl_ _ 1I (days) fZ T_2 (days) f 3 T3" (days)
0.50±0.045 0.012±0.0014 0.223±0.044 0.083±0.018 0.277±0.063 547±232
From these values, it is inferred that 50% of the uranium in thethird quarter, 1981 sample had a dissolution half-time of 0.012days, 22% of the uranium with half-time of 0.083 days, and 28% ofthe uranium dissolved with half-time of 547 days. So thedissolution rate of the uranium in the sample is classified as0.50D, 0.22 D, 0.28 Y. Since the sample contains two componentsin the D category of the ICRP task group lung model, these can becombined (added) to show the total weight fraction of uranium inthis category.
Since the dissolution trial is carried out over a period of around80 days, it is sufficient to categorize the uranium componentsinto the solubility classes (1) used by the ICRP Task Group onLung Dynamics. The classification scheme adopted is therefore:
(1) Soluble - compounds with a solubility half-life <1-10 days,inclusive, equivalent to clearance class D.
(2) Moderately Soluble - compounds with an estimated solubilityhalf life >10-100 days, inclusive, equivalent to clearanceclass W.
(3) Relatively Insoluble - compounds with an estimated solubilityhalf-life >100 days, equivalent to clearance class Y.
On this basis, the third quarter 1981 sample contains 72% solubleuranium. compound and 28% insoluble uranium compound.
N. Cooke and F. B. Holt (1) studied the solubility of some knownuranium compounds in simulated lung fluid and classified them intosolubility classes similar to clearance classes used by ICRP.
208

Class D Class W Class Y
Very soluble0-10 daysUranium hexafluorideUranyl fluorideUranyl nitrate
Moderately soluble>10-100 daysAmmonium diuranateUranium trioxideUranium tetrafluoride
Relatively insoluble>100 daysUranium dioxideUranium octoxide
This is a very general classification, as Steckel and West (12)showed that the solubility in simulated lung fluid of a number ofuranium process materials and laboratory-prepared oxides wasrelated to the effect of thermal history on chemical compositionand particle size. So, the solubility of a uranium compound isvery much dependent on the condition (physical conditions) underwhich it has gone through.
209
WRENE:
1. N, Cooke and F. B. Holt, "The 9;olubility of Some Uranium Compounds inSimulated Lung Fluid," Health Physics, 27: 69-77 (1974).
2. Task Group on Lung Dynamics fot Committee 11 of the InternationalCommission on Radiological Protection, "Deposition and Retention Modelsfor internal Dosimetry of the 1 uman Respiratory Tract," Health Physics,12t 173-206 (1966).
3. P. E. Morrow, F. R. Gibb, and L. Johnson, "Clearance of Insoluble Dustfrom the Lower Respiratory Tract," Health Physicao 10: 543-555 (1964).
4. J. R. Houston$ D. L. Strange, and E. C. Watson, DACRIN - A ComputerProgram for Calculating Organ Cose from Acute or Chronic RadlonuclideInhalation. BNWL-B-389, Pacific Northwest Laboratory, Richland, WA(1975).
S. D. L. "lkwarf, Solubility Classification of Airborne Uranium Productsfrom LWR-Fuel Plants, NUREG/CR-1428, PNL-3411, Pacific NorthwestLaboratory, Richlarl, WA 99352.
6. F. J. Killer, D. E. Gardner, J. A. Graham, R. E, Lee, Jr., W. E. Wilson,and J. D. Bachmann, "Size Conaiderations for Establishing a Standard forInhalable Particles," J, Air PoLl. Control Assoc., 29t 610-615 (1979).
7. 0. Re Moss, "Simulants of Lung Interstitial Fluid," Health Physics, 36:447-448 (1979).
8. St A. Dennis, "Dissolution Ratem of Yellov Cake In Simulated LungFluid," M. S, Thesis, Universitr of Pittsburgh, Pittsburgh, PA (1979).
9. IO-TC-125-U-17, Detearmination of Uranium in Water, Technical CenterReport, TCR-77003, Dec, 31, 1977, Kerr-McGee Corporation.
10, To T. HMercr, "On the Role of Pirticle Size in the Dissolution of LungSurdens," Health Phyeics, 131 1211-1221 (1967).
11, Y. So Bards "0Nonlinear Parameter: letimation," Academic Press, New York,1974, Sec. A-3, Programmer: Re I. Williams, Oct. 76.
12. L, M. Stebnal &ad C. M, West 196i8 Union Carbide Corporation, NuclearDivision, Report Y-1544-h.
210
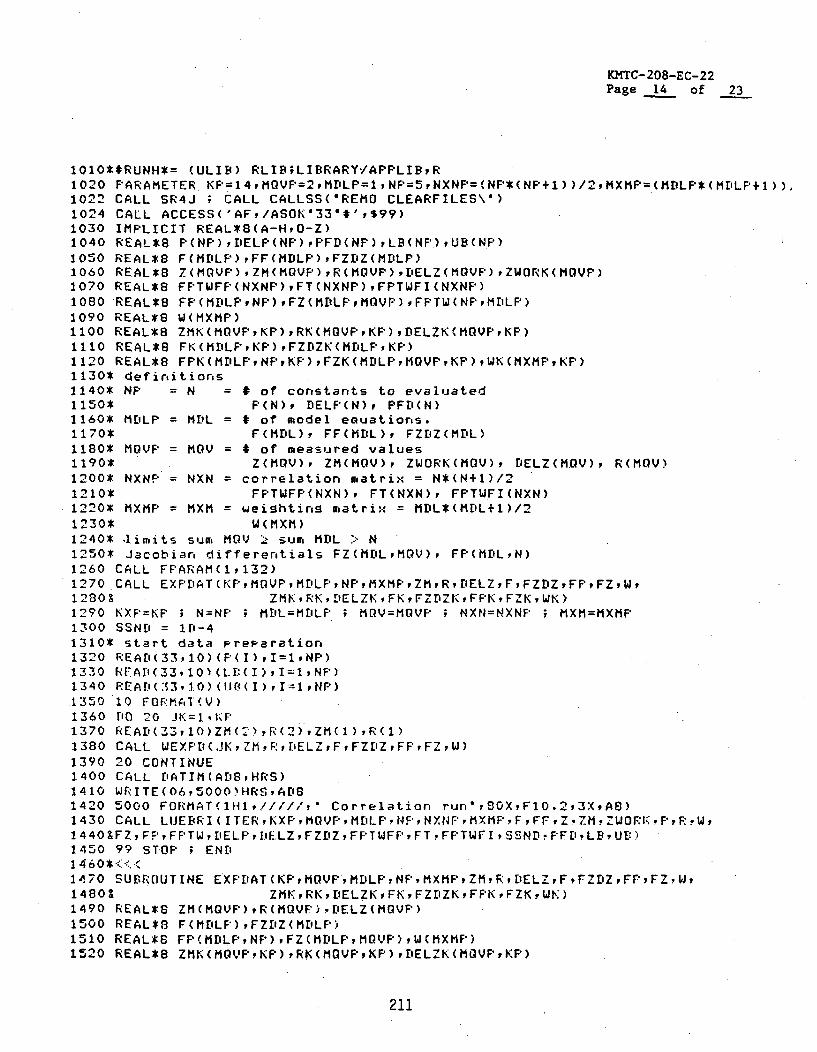
KMTC-208-EC-22Page 14 of 23
1010*#RUNH*= (ULIB) RLIB;LIBRARY-/APPLIB,R1020 PARAMETER KP=14,MQVP=2pMDLP=l1NP=5,NXNP=(NF'*(NP+1))/2,MXMP=(MDLP*(MDLF+,1)),1022 CALL SR4J ; CALL CALLSS("REMO CLEARFILES\6)1024 CALL ACCESS('AF,/ASOK'33*#',$99)1030 IMPLICIT REAL*8(A-HO-Z)1040 REAL*8 P(NP),DELP(NP),PFD(NP),LB(NF'),UB(NP)1050 REAL*8 F(MDLP),FF(1DLF'),FZDZ(MDLP)1060 REAL*8 Z(MQVF'),ZM(MQVP),R(MGVP).,DELZ(MQVF')ZWORK(MOVP)1070 REAL*8 FPTWFP(NXNP),FT(NXNP),FPTWFI(NXNP)1080 REAL*8 FP(MDLP,NF'),FZ(MDLF',MQVP),FPTW(NPMI'LP)1090 REAL*8 W(MXMP)1100 REAL*8 ZMK(MOVPKP),RK(MOVPKP)tDELZK(MQVPKF')1110 REAL*8 FK(MDLP,KP),FZDIZK(MDLP,KP)1120 REAL*8 FPK(MDLF'NPKP),FZK(MDLPMQVPKP),WK(MXMPKP)1130* definitions1140* NP = N = # of constants to evaluated1150* P(N), DELF(N), PFDI(N)1160* MDLP = MDL = # of model eauatiorns.1170* F(MDL), FF(mIIL), FZDZ(MDL)1180* MOVP = NOV = # of measured values1190* Z(MOV), ZM(MOV), ZWORK(MOV), DELZ(M.QV), R(MOV)1200* NXNF" = NXN = correlation matrix = N*(N+1)/21210* FPTWFP(NXN)f FT(NXN), FPTWFI(NXN)1220* MXMP = MXM = weightinr matri: = MDL*(MDL+1)/21230* W(MXM)1240* .limits sum NOV : sum MDL > N1250* Jacobian differentials FZ(MDLMOV), FP(ME'L,N)1260 CALL FPARAM(1,132)1270 CALL EXF'DAT(KP,MOVPMEILPFNPMXMP,ZMREIELZF,FZDZFPFZ,W,1280 9 ZMK , RE , DELZK ,FK , FZEZK, FF'K FZK ,WK)1290 K×F=KP ; N=NF ; MDL=MI'LP MQV=MOVP ; NXN=NXNP ; MXM=MXMF'1300 SSNE' = 111-41310* start data Preparation1320 REAl.(33,10) (P(I) ,I=1,NP)13 30 REFADI(33,10) (LD (I) ,I=1,NP)1340 READ[(33, 10) (1.18( I), I=1, NP)A1350 10 FOF:MAT(V)1360 DO 20 JK=1,PF1370 READ(33, 10)ZM (2) ,R(2) ,ZM(1) ,R(1)1380 CALL WEXFEZ(JK,ZM!,R'aELZ,F,FZriZ,FP,FZ,W)1390 20 CONTINUE1400 CALL ['ATIM(ADS,HRS)1410 WRITE(06,5000' HRS, ADS1420 5000 FOFMAT(1H1,!////, Correlation rur,n,SOX,FIO.2,3X,A8)1430 CALL LUEBRI(ITERKXF',MOVPMDLPNF',NNPF',MXMP.F,FF,ýZM.ZUWOF:r.F',RF.W,1440 aFZ, FP , FPTW, DELP, I.'ELZ, FZDZ, FPTWFF',FT , FPTWF I, SSND- PF.EI LB' UE:)1450 99 STOP ; END146 0*.::.<1470 SUBROUTINE EXF'[.AT(KPMQVPMDLPNPMXMF'ZMRDEL7,FFZZFF',FZW,1480Z ZMK, R(, DELZK, FK, FZDZK, FPK, FZKUWK)1490 REAL*S ZM(MQVP),R(MQVP).DELZ(MOVP)1500 REAL*8 F(MDLFI,FZIZ(M[ELP)1510 REAL*8 FF'(MELPNP),FZ(MELP,MOVF'),W(MXMP)1520 REAL*8 ZMK(MOVPKP),RK(MtVP,KP),DELZK(MQVPKF)
211

KMTC-208-EC-22Page 15 of 23
1530 REAL*8 FK(MDLPKP),FZ['ZK(MDLPKP)
1540 REAL*8 FF'K(M[LPNPKP),FZK(MDLPMOVP,KP),WK(MXMPKF')1550 RETURN1560 ENTRY REXPE(KZMR,DELZ,F,FZDZ, FPFZW)1570 IO 10 I=I,MLIVP1580 ZM(I) = ZMK(IK)1590 R(I) = RK(IK)1600 DELZ(I) = DELZIK(IK)1610 10 10 J=1,ME'LP1620 10 FZ(J,I) = FZK(JIK)1630 DO 12 J=I,MDLP1640 F(J) = FK(JK)1650 FZDZ(J) = FZDZK(JK)1660 DO 12 I=INP1670 12 FP(J,I) = FPK(JI,tK)1680 DO 14 I=IMXMF'1690 14 U(l) = WK(IK)1700 RETURN1710 ENTRY WEXF'D(KZMR, DELZF,FZDZFPFZW)1720 DO 20 I=IMOVF1730 ZMK(IK) = ZM(I)1740 RK(IK) =R(I)1750 DELZK(I,K) = DELZ(I)1760 [1O 20 .J=IMDLP1770 20 FZK(J,II() = FZ(JI)1780 DO 22J=, 9 MDLF.1790 FK(JK) = F(J)1800 FZDZK(.J,K) = FZDZ(J)1810 LID 22 I=IHP18202`2. FPK(J,I,K) = FP(JI)1830 DO 24 I=IMXMP-F1840 24 WK(IK) = W(I)18,50 RETURN1860 END167 . -.7 01880 S~h1F:'nUlINE MO[DEL(MOV,7Z, DLF,N,PF')1890 REAL *8 , ',tiF(1),F'(1),X,X"1900 XZ -. 693147I81D0*Z(2)1910 X = Or'O ; IF(XZ/F'(2).GT.-871D0) X = 'EXF'(XZ/P(F''))1920 F(1) = --Z(1) + F'(1)*X1930 X = O01O ; IF(XZ/'P(4).GT.-87DO) X = DEXP(XZ/F,(4))1940 F(1) = F (1) + F'(3)).X + (IDO - P(1) - P(3))*DEXP(XZ/P(5))1950 RETURN ; END1960*-..'...'1970 SUBROUTINE LUE6FUI(ITERKPMQVPMDLPNPNXNF*,MXMP,F,FF,Z,ZM'" OFk.F'<R',F1980,FZ, FF, FPTW, DELF', DELZ, FZDZ, FPTWFPFT!,FF'TWFI ,SSNDPF' , Lr, UP.)1970 IMPLICIT REAL*8(A-H,O-Z)21000 REAL-8 F'(Nr-),DELF'(NP),PFD (NP),LF(NP),UP(NP)2010 REAL*8 F(M'DLP):FF(MDLF'),FZlIZ(MDLP)2020 REAL*8 Z(MVP),ZM(rM(MVF)vR(MOVF'),PIELZ(MOVF'),ZWORK(MOVF')'030 REAL*8 FPTWFP(NXNP),FT(NXNP),FPTWFI(NXNP)2040 REAL*8 SSNPI,LAME(24)2050 REAL*8 FPF(MDLP ,NP),FZ(MULF',MQVP),FPTWu(NP, vMDLF*)
212
KMTC-208-EC-22Page 16 of 23
2060 REAL*8 W(MXMP)
2070 DIMENSION JJJ(24)2080 STEP1 = IDO+SSND2090 STEP2 = IDO-SSND2100 5002 FORMAT(V)2110 IDEM = 1 ; EAMACT .1002120 KXP=KP ; N=NP ; MDL=MDLP ; MOV=MQVP ; NXN=NXNP ; MXM=MXMP2130*2140* start iteration loop2150*2170 1000 WRITE(06,900)2180 900 FORMAT(' Input - ITIDEMGAMACT')2190 READ(05,5002)ITIDEMEAMACT2200 DO 90 JN=I,N2210 PFD(JN) = ODO2220 DO 90 IN=IJN2230 KK = JN*(JN-1)/2 + IN2240 90 FFTWFFP(KK) = ODO2250*
2260* start e-perimental data loop 12270*2280 DO 400 JK=IKXP2290 CALL REXPD(JK,ZM,R,EDELZ,F,FZDZ,FPFZW)2300 DO 100 JQ=IIMQV2310 IF(IDEM.EQ.1)DELZ(JG) = ODO2320 100 Z(JO) = ZM(JO) - DELZ(JO)2330 140 CALL MODEL(MQVZ,MDL,F,N,P)2340* COMMENT2350 STEP = STEP12360 DENOM = ir'o2370 1D 142 JM=ItMDL2380 ElO 142 JO=1,MPV2390 142 FZ(JMJO) = ODO2400 144 1DO 146 J0=•1,MV2410 146 ZWORK(JO) = 7J11)2420 DO 148 JO=.1,MO'2430 IF(JO.GT.1)ZU I<JO-1) = :(JO-1)2440 ZWORK(JO) = STEPF*Z f m)2450 IF(Z(JQ).EV.0D0) ZWORK(JQ) STEP - 1DO
2460 CALL MODEL..(M lV,7WORIM,M[IL.,FF,NF')2470 A = Z(JQ)2480 IF(A.EO.OtO) A=1'02490 10 148 JM=I,MIIL2500 148 FZ(JMJQ) = ((FF(JM)-F(JM))/SSND/A - FZ(JMJQ))/DENOM2510 IF(STEP.NE.STE'1) GOTO 1502520 STEP = STEF-22530 [iENOM = -21-02540 GOTO 1442550 150 CONTINUE2560* start FF calc.2570 STEP = STEF12580 DENOM = 1DO2590 DO 152 JM=I,MBL
213
KMTC-208-EC-22Page 17 of 23
2600 110 152 JN=I,N2610 152 FF'(JMJN) = ODO2620 154 DO 156 JN=IN2630 156 DELP(JN) = F'(JN)2640 DO 158 JN=1,N2650 IF(JN.GT.1) DELP(JN-1) = F(JN-1)2660 DELP(JN) = STEP*P(JN)2670 IF(P(JN).EQ.ODO) DELP(JN) = STEF - 1DO2680 CALL MODEL(M0V,Z,MDLFF,N,DELF')2690 A = P(JN)2700 IF(A.EO.ODO)A=EIO2710 DO 158 J=IY,MDL2720 158 FP(JMJN) = ((FF(JM)-F(JM))/SSND/A - FP(JMJN))/DENOM2730 IF(STEP.NE.STEPI) GOTO 1602740 STEP = STEP22750 DENOM = -'Do2760 GOTO 1542770 160 CONTINUE2780* start W calc.2790 DO 200 JM=I,MriL2800 DO 200 IM=I,JM2810 KK = J+*(JI-1)/2 + IM2820 W(KK) = 01102830 DO 200 JQ=lM0QV2840 200 W(KK) = W-tKK) + FZ(IM,JO)*FZ(JM,JO)*R(JQ)**22850 IF(MDL.EO.1)W(1) = 1DO/W(1)2860 IF(MDL.GT.1)CALL DSINV(WMDL,1.E-12,IER)2870 DO 210 JM=,MEIL2880 DIO 210 JN=I,N2890 FF'TW(JN.JM) = 01102900 11O 210 IM=1,MLIL2910 KK = MAX(JM*(JM-1),IM*(IM-1))/2 + MIN(JMIM)2920 210 FF'TW(JN,JM) = FF'TW(JN,JM) + FF'(IMYJN)*W(KK)2930 DO 220 IN=1,N2940 DO 220 JIN=1.IN2950 KK = IN*(IN-1)/2 + JIN2960 DO 220 IM=1iDFL2970 220 FF'TWF7F(KK) = FPTWFF'(KK) + FPTW(JINPIM)*FP(IMIN)2980 DO 230 JM=l,MrAL2990 FZDZ(JM) = 0003000 DO 240 JO=lMOV3010 240 FZE'Z(JM) = FZDZ(JM) + FZ(JM,J0)*DELZ(JQ)3020 230 FZDZ(.JM) = FZ[IZ(JM) + F(JM)3030 DO 260 JN=1,N3040 DO 260 JM=IMDL3050 260 F'FD(JN) = PF'F(JN) + FPTW(JNJM)*FZDZ(JM)3060 CALL WEXPD(JKZMFRDELZFFZDZFF',FZ W)3070 400 CONTINUE3080f3090* end experimental data looicp 13100*3110 LAM = ODO3120 DO 300 JIN=IIO
214

KMTC-208-EC-22Page 18 of 23
1130 JO = 05140 SUM = 0D01150 DO 310 JN=IN5160 DO 310 IN=1,JN5170 JO = JO+l5180 FT(JO) = FFTWFF'(JO)5190 IF(JN-IN)310,312,3105200 312 IF(JIN.GT.1) FT(JO) = FT(JO) + LAM*DABS(FT(JO))5210 IF(JIN.GT.1.AND.FT(J0).EO.0D0) FT(JO) = (1DO÷LAM)*AVGS220 SUM = SUM + DABS(FT(JO))5230 310 CONTINUE5240 AVG = SUM/N3250 CALL DSINV(FT,N,1.E-12,IER)5260 IF(IER.EQ.O) GOTO 3203270 IF(JIN.EG.1) LAM = 5.1-33280 300 LAM LAM*1ODO3290 RETURN5300 320 JO = .03310 DO 330 JN=1,N3320 DELP(JN) = 0DO3330 00 330 IN=1,JN3340 JO = JO+13350 FPTWFI(JcO) = FT(JO)3360 DELF'(JN) = DELP(JN) + FPTWFI(JO)*PFD(IN)3370 IF(JN.NE.oN) IELP(IN) = DELP(IN) + FPTWFI(J0)QPFD(JN)3380 330 CONTINUE3390 GAMMAX = 1D383400 CALL GRADPFJ(LBI,UB4P,FPTWEIDELP,EJJJ(N+1),JJJ(2*N+I),JJJ(3*N+1),N,GAMMAXII3410 GAMACT = MIN(EAMACTGAMMAX)34.20 SUMDEL = 01O3430 DO 340 ,JN=ItN3440 BASE = P(JN)3450 IF(BASE.E0.0D0) BASE = DELP(JN)3460 IF(BASE.E.O.iO) BASE = 1DO3470 SUMDEL = SUMDEL + (DEL.F'(JN)/BASE)**23480 IF(IT.EO.1) WRITE(06,5008)JNP(JN),DELP(JN)3490 340 P(JN) = F'JN) - GAMACT*DELPCJN)3500 SUMDEL * DSORT(SUMDEL/N)3510 WRITE(06,5004)ITSUMDELPGAMACT3520 5004 FORMAT(14,' SUMDEL = ',1PE15.8,' GAMACT m ',E15.8)3530 WSUM = ODO ; SUMSO = ODO o RUMSQ = ODO3540*3550* start experinmental data locip 23560*3570 DO 410 JK=IKXF3580 CALL REXF'D(JI(,ZM,R,DELZ,F,rFZDIZFPFZPW)3590 DO 350 JN=IPN3600 DO 350 JM=IMDL3610 350 FZDZ(JM) = FZDZ(JM) - GAMACT*FP(JMJN)*DELP(JN)3620 DO 360 JO=I,MCV3630 ZWORK(JO) = ODO ; RUMSO = RUMSQ + 1DO/(R(JQ))**23640 DO 370 JM=I,MDL3650 DO 370 IM=1,MDL
215
366036703500
3690370037103720
7730"40
KMTC-208-EC-22Page 19 of 23
KK = MAX(JM*(JM-1),IM*(IM-1))/2 + MIN(JMIM)370 ZWORK(Jdi) = ZWORK(JO) + FZ(JMJQ)*W(KK)*FZDZ(IM)DELZ(JO) = ZWORK(JQ)*R(JQ)**2IF( IT0LE.O.OR.AABS(SUMIDEL) ,LT. 1 .11-4) WRITE(06,5008) JQ, ZM(JQ) ,DELZ(JQ)360 SUMSO = SUMSQ + (DELZ(JO)/R(J0))**2KK = 0 ; DO 380 IM=IMDL ; KK = KK+IM380 WSUM = WSUM + W(KK)CALL WEXF'D (JK, ZMR, DELZ F, FZDZ, FP- FZ, W)410 CONTINUE
S,'uv: end experimental data loop 2377ý;*3780 SIGMA = DSORT((SUMSO*KXP)/(WSUM*(KXP-N)))3790 WRITE(06,5010)SUMSO,WSUMSIGMA3 1C 5010 FORMAT(" SUMSO = ",IPE15.8,', WSUM ='"El
6i> .. RITE(06,5018).,.010 FORMAT(1H ,4Xr*t,3X,"Para,,eter',BX,'Si,,a',J
38*) KK = 0 ; DO 5006 I=1,N ; KK = KK+I3840 FT(KK) = DSQRT(SUMSQ*FPTWFI(KK)/(KXP-N))3850 WRITE(O6,5OO8)IF'(I),FT(KK),DELP(I)3860 5008 FORMAT(I6,1F'E17.8,2E17.8)3870 5006 CONTINUE3880 5014 FORMAT(3XlPE12.4,9E12.4)3890 IF(ABS(SUMDEL).LT.1.E'-8.AND..IDEM.EQ.O.OR.IEIEM.LT.3900 IF(IT.GT.0) GOTO 10003910*3920* end iteration loop3930*3940 1002 WRITE(06,5016)3950 5016 FORMAT(* Correlation ,,atriý ")3960 WSUM = WSUM/IDO ; KK = 0 ; DO 1004 I=IN3970 KK = KK+I ; KKK KK-I+!3980 1004 WRITE(O6,5O14)(FF'TWFI(J),J=KKI<,KK)3990 IF(IPERF.NE.0) RETURN4000 1012 CONTINUE4010 SUMSOF = ODO4020 D[0 420 JK=IvKX P4030 CALL REXFE: (JKZM.F:, DELZFFZDZFF',FZW)4040 CALL MODEL(MOV),ZMFMIDLFvN,F')4050 DO 430 JM=I,Ml'L4060 430 SLJMSOF = SUMSOF + F(JM)**24070 420 CON!TINUE4080 PRINT," ERR',SUMSOF4090 RETURN4100 END
412C4SERIEI BRITT CLASS A NAME DSINV FORTRAN4130*READ ['SINV FOFTRAN B1 TESTLB 5/04/79 12:3741404:t *1 BY: BRITT ['ATE: 01/04/79 FIRST ABSORB4150 SIJBROUTINE DSINV(AN.EF'3,IEPR)4160 DIMENSION All)4170 REAL *8 ArIINWORK4180 CALL DMFSD(AN,E'PS,IER)
5.8,', SIGM
12X,'Delta*)
O)GOTO 1002
A = ",E15.8)
06/01/79 17:08:06
216
KKMTC-208-EC-22Page 20 of 23
41904200 1421042204230424042504260427042804290 2430043104320433043404350436043704380 343904400 44410 54420 64430444044504460447044804490450045104520 745304540 84550 945604 5'7 04580 . SEFR I I4590 * RE A D4600*$ $146104620463046404650 1466046704680469047004710
IF(IER) 9,1,1IF'IV=N*(N+1)/2IND=IPIVDO 6 I=I,NDIIN= .DO/A(IF'IV)A( IPIV)=DINMIN=NKEND=I-1LANF=N-KENDIF%: END) 5,5,2J=INDDO 4 K=1,KENDWORK=O DOMIN=MIN-1LHOR=IPIVLVER=JDO 3 L=LANFMINLVER=LVER+1LHOR=LHOR+LWOIFK: WORK+A (LVER) *A (LHOR)A(J)=-WORK.*DINJ=J -M I NIPIV=IF'IV-MININD=IND-1D11 8 I:=,NIFPIV=IF'IV+ IJ=IF'IVDO 8 K=INWORK=0. D0 -LHOR=JDO 7 L=KNLVEF'=LHOR+K-- IWORK=WORK+A(LHOR) *A(LVER)LHOR=LHOR+LA ( J) =WORKJ=J+KRETURNE ND
.;RITT CLASS A NAME DMFSD FORTRANDMFSD FORTRAN B1 TESTLE 5/04/79 12:36
BY: BRITT DATE: 01/04/79 FIRST ABSORBSUriROUTINE DMFSD(A,N,EF'S,IER)DIMENSION A(l)REAL *8 E'PFVE,DSUMtAIF(N-1) 12,1,1IE':0O
KF''IV=O
DO 11 K=:,NKPIV=KF'IV+KI ND =KPF IV
LEND=K-1TOL=ABS(EF'S*SNGL(A (K'IV)))
06/01/79 17:09:18
217
KJMTC-208-EC- 22Page 21 of 23
4720473047404750 2476047704780 34790 448004810 54820 64830 74840 84850 94860487048804890 104900 1149104920 12493049404950*>>>>4960497049.8049905000*5010*5020*50305040*5050*5060*5070508050905100511051205130*5140 4515051605170518051905200
521052205230*5240 6
DO 11 I=K,NDSUM=O . DOIF(LEND) 2,492DO 3 L=ILENDLANF=KPIV-LLIND=IND-LDSUM=DSUM+A(LANF)*A(LIND)DSUM=A(IND)-DSUMIF(I-K) 10,5,10IF(SNOL(DSUM)-TOL) 6,6,9IF(DSUM) 12,12p7IF(IER) 8,8,9IERIK-1DPIV-DSORT(DSUM)A(KPIV)-DPIVDPIV=1.DO/DPIV60 TO 11A(IND)=DSUM*DPIVIND=IND+IRETURNIERw-1RET U RFNEND
SULBROUTINE GRADPJ(LB,UB,P,R,S,E,M,K,IDXN,SSMAXIER)IMPLICIT REAL*8(A-HO--Z)REAL*8 LB(N),UB(N),P(N),R(1), S(N),E(N,1)INTEGER M(N),K(N) ,IDX(N)
LOCATE SYMMETRIC STORAGE MODE ARRAY ELEMENT FOR I>vJ
LOC(IJ)= I*(I-1)/2+J
CHECK FOR ACTIVE BOUNDS AND SET UP M AND K ARRAYS
IER=0NAC=ODO 10 I=lNIF(DABS(P(I)-LB(I)) *LT. 1D-6) GO TO 4IF(P(I) *LT. LB(I)*1.00001'0) GO TO 4
GO TO 5LOWER BOUND ACTIVE
NAC=NAC+ 1P(I) = LB(I)M(NAC)=Ir.(PNAC)=1IDX(N AC)=IGO TO 10IFiPcABS(F'(I)-UB*I)) .LT. 1D-6) 00 TO 6IF(P(I) .GT. 0.?7999DO*UB(I)) G0 TO 6O0 TO 10
UPPER BOUNDl ACTIVENAC=NAC+1
218
5250 P(I) = UB(I)
5260 M(NAC)=-I5270 K(NAC)=15280 IDX(NAC)=I5290 10 CONTINUE5300* IF IN INTERIOR, NO PROJECTION5310 IF(NAC.EQ.0) GO TO 605320*5330* CONSTRUCT TABLEAU AND FIND BINDING BOUNDS5340*5350 DO 20 I=INAC5360 E(INAC+1)=-S(IDX(I))5370 DO 20 J=INAC5380 IF(I.GE.J) E(IJ)=R(LOC(IDX(I),IDX(J)))5390 IF(I.LT.J) E(IJ)=R(LOC(I'DX(J),IDX(1)))5400 20 CONTINUE5410 ICOUNT=O5420 25 ICOUNT=ICOUNT+÷5430 IF(ICOUNT.LE.10*NAC) GO TO 275440 IER=15450 RETURN5460 27 A=1D385470 DO 30 I=INAC5480 AI=M(I)*K(I)*E(INAC+I)5490 IF(AI.GE.A) GO TO 305500 A=AI5510 IR=I5520 30 CONTINUE5530 IF(A.GT.-1D-6) GO TO 405540 K(IR)=-I5550 CALL GJF'VT(NACNAC÷INIRIREIER)5560 IF(IER.EQ.O) GO TO 255570 RETURN5580W5590* COMPUTE PROJECTION STEP5600*5610 40 DO 50J=INAC5620 IF(K(J).NE.-I) GO TO 505630 DO 45 I=1,N5640 IF(I.GE°IDX(J)) S(I)=S(I)+R(LOC(I, IDX(J)))*E(J,NAC+I)5650 IF(I.LT.IDX(J)) S(I)=S(I)+R(LOC(IDX(J),I))*E(JNAC+÷ )56.60 45 CONTINUE5670 50 CONTINUE5680*5690* FOR BINDING BOUNDS SET STEP TO IDENTICALLY 0.0 AND LOA;,5700* LAGRANGE MULTIPLIERS(SENSITIVITY DERIVATIVES) INTO THE FIRST
5710* COLUMN OF E FOR RETURN. SET ALL OTHER MULTIPLIERS TO 0.0
5720*5730 DO 54 I=I,N5740 54 E(I,1)=O.O5750 DO 55 I=INAC5760 IF(K(I).NE.-1) GO TO 555770 S(IDX(I))=O.O
219
KIMTC-208-EC-22Page 23 of 23
5780 E(IDX(I)p,)=-E(INAC+l)5790 55 CONTINUE5800*5810* MAXIMUM FEASIBLE STEP SIZE AND EXIT5820*5830 60 SSMAX=1D385840 DO 65 I=IN5850 IF(S(I).LT.0.0) SSMAX=DMIN1(SSMAX,-(UB(I)-P(I))/S(I))5860 IF(S(I).GT.0.0) SSMAX=DMINI(SSMAX,-(LB(I)-P(I))/S(I))5870 65 CONTINUE5880 M(1)=NAC5890 IF(NAC.NE.O) RETURN5900 DO 70 I=I,N5910 70 E(I,1)=O.O5920 RETURN5930 END59-40 SUBROUTINE GJPVT(N,M,NDI,J,B,IER)5950 REAL*8 B(1)5960*5970* PERFORM GAUSS-JORDAN PIVOT ON MATRIX B(NM)5980* STORED IN AN ARRAY WITH ROW DIMENSION ND5990* USING B(IJ) AS THE PIVOT ELEMENT6000* ON RETURN, IER = 0 IF NO ERROR6010A, IER =-1 IF B(I,J) = 06020*.6030* REFERERENCE: BARD,Y.o,BoNONLINEAR PARAMETER ESTIMATION,'ACADEMIC6040* PRESSNEW YORK,1974,SEC.A-36050*6060* PROGRAMMER: R.F. WILLIAMS, OCT 766070*6080* L IS A FUNCTION TO LOCATE MATRIX ELEMENT B(IROWJCOL) IN ARRAY6090*6100 L(IROWJCOL)=ND*(JCOL-1)+IROW6110 IER = 06120 IF(B(L(IJ)).NE.0.DO) GO TO 106130 IER=-l6140 GO TO 2006150 10 DO 100 IP=I,N6160 DO 100 JO=lM6170 IF(IF*.EQ.I.OP.JQ.EO.J) GO TO 1006180 B(L(IP,Jr'))=B(L(IPJQ) )-B(L(IJQ) )*EB(L(IF',J) )/B(L(I,J)6190 100 CONTINUE6200 DO 120 IP=IN6210 IF(IP.EO.I) GO TO 1206220 E(L(IF',J))=-B(L(IP,J))!B(L(IJ))6230 120 CONTINUE6240 DO 140 JQ=1,M6250 IF(JO.EQ.J) GO TO 1406260 B(L(IJQ))=D(L(IJO))/B(L(IJ))6270 140 CONTINUES280 B(L(IJ))=I.DO/B(L(I,J))6290 200 RETURN6300 END
220
APPENDIX 5.2.3
ORNL'S ANALYTICAL PROCEDURE
221

OAK RME NATMONAL LABORATORY PaSr MMON "m xOAnAW. T1I~M*I 3151
CPOftUO V WAMI1 MARE11 114Wt 6"TDVW. 6MMOommm
January 30, 1986
1ir. Barry ZalcmanU. S. Nticlaar Regulatory CommissionWillste Bldg., Room 5177915 Eastern AvenueSilver Springs, IMaryland 20910
De.r Barry:
I enclose the copies of the specific analytical procedures used to measure theuranium and fluoride concentrations in the specimens received after the January49 1086 Sequoyah Nuclear Fuels incident.
As wa discussed by telephone, we utilized our neutron activation facility todetermine the uranium concentrations in the vegetations soils, and waternaecimns. Thp limits of detection for uranium ape 0.030 micrograms wrmilliliter in wter, and 0.020 micrograms per gram of vegetation or soil. Thecon'fdunce level is 10.0 + 0.2 micrograms of uranium.
The uranium concentrations In the two shipments of urine specimens were deter.mined by ultraviolet.eexcitation and measurement of the characteristic yellow.green uranium fluorescence. The limit of detection for uranium ft 0.005microgram3 of uranium per milliliter of urine. The relative standard deviationic 7.6 percent at the 0.05 microgram per milliliter concentration level. Thedetftiled procedura is Included, for your information, together with a lettervhtch datails the quality assurance standards measured with your specimens.Y'lNse note that VV meosured more standards than specimens, and that these quill.ty assurance concentrations covered the entiro range experienced in thespecimens,.
Tho procedures for "-asuring fluoride concentration In vegetation and water areattached. The fluoride in the soil specimens wes extracted with deionized.lortdo-fren water, tho extract was filtered to remove soil perticles, and the'final d.tenrir•tIon of fluoride was measured with a fluoride specific ionclectrode as detailed in the surface water procedure. We analyzed a 4.0microgram -pr gram National Bureau of Standards orchard grass standard as aquallty &saurance test and recovered 3.4 micrograms of fluoride. We alsoprepared duplicate ORNL standards containing 20.0 micrograms of fluoride andsubjected them to the entire analytical procedure, Including distillation. Werecovered 20.3 and 20.9 micrograms of fluoride to demonstrate excellent recover.le.
As requested by Mr. Jerry Swift, I also enclose the dAta sheet from the NRC ship.ment of the COMP watear, soill, and vegetation specimens received at ORNL onJanuary 22, 1986. 1 have taken the information written on the plastic specimenbags and included It on. the data sheet that was in the shipping carton.
223
KMTC - 149-EC-10KERR-MCGEE CORPORATIONTECHNICAL CENTER ISSUED 12/1/77 REVISED None
ANALYTICAL METHODS PAGE 1 OF 8
a•.T .- ,.NAToft ov .•pTvf Of A4P Water, Soil, Vegetation and
Thorium, Uranium and Plutonium Products or By-ProductsAN4ALYYICAL •(?HOO WftI1?N SY i APOC
Alpha Pulse Height Analysis GEVSI CHL
Method:
Except for natural uranium or natural thorium, environmentally important concentrationsof actinides cannot be readily determined by ordinary chemical means. Additionally,chemical methods do not offer any information as to the isotopic composition of theelement in question. Therefore, for samples where either an isotopic composition and/or ultra low level Of detection is required, alpha pulse height analysis is the methodof choice.
This method utilizes the following technologies:
1. In-situ formation of calcium phosphate is used to concentrate the actinidesfrom a large aqueous volume.
2. Anion exchange is used to permit separation of the actinides into relativelypure form.
a) For thorium, good separation is achieved from all elements except uran-ium. A separation factor in the vicinity of 106 is achieved for mostelements, but only about 10 separation is achieved between uranium andthorium. As a result, some uranium will report to the electrodepositwhen analyzing for thorium in a uranium rich material such as yellowcake.
b) For uranium, good separation is achieved from all elements except thoriumand those which form stable anion complexes with chloride (i.e., iron,aluminum, etc.). For this reason, whenever a material rich in these met-al* is to be analyzed for uranium, such as soils or mill tailings, theuranium must first be solvent-extracted from a nitrate or sulfate systemin order to eliminate these interferences.
c) For plutonium, good separation is achieved from all metals except for ironfrom iron-rich systems (i.e., liver tissue, iron or steel and their alloys,etc.). When analyzing an iron-rich system, the ion-exchange step should berepeated once. (Note: Three evaporations to dryness with concentratednitric acid area required to completely remove traces of chloride andfluoride from the first ion-exchange strip liquor prior to the second ion-exchange. Failure to remove the chloride or fluoride will result in poorrecovery of the plutonium.).
3. Electrodeposition is utilized to prepare an "infinitesimally thin" depositnecessary for good alpha pulse height energy resolution. A thick deposit(> ten micrograms) causes alphas, from the bottom of the deposit, to degrade(lose energy) as they pass up through the deposit. As a result, the siliconsurface barrier detector will see alphas with a lower energy which will produce
224

ThoriumtUON Ow
Thorium, Uranium and Plutonium WtrSolVetainKMTC - 149-EC-lO0ANALTtCAL CTt Water, Soil, VegetationPa 2 f 8
Aipha Pulse Height Analysis and Products or By-Products . 8
a spectral smear. Poor resolution of alpha energy will destroy the usefulnessof the procedure. Alpha resolution should be < 50 KeV FWHM (full width athalf maximum) and any spectra with an alpha resolution of > 100 KeV FWHMshould result in rejection of the analysis.
Range and Precision:
Amounts of Th, U, or Pu as low as one femtocurie (I X 10-15 curie or 3.7 X 10⁻⁵ disin-tegrations per second) can be detected over a counting time of 1000 minutes using sili-con surface barrier alpha detectors in conjunction with a multichannel analyzer. Theprecision attained is a function of the activity in the sample and the recovery of theinternal standard; however, typical precision, at one standard deviation, ranges from3 to 50%.
Cost:
Cost (manhours) = k + nt
Where:
k 2 manhours; t = 2 manhours, and n = number of samples.
Apparatus:
1. Silicon surface barrier detector(s) (Princeton Gamma Tech, 300-25-100) is used inconjunction with a multichannel analyzer.
2. Millipore filter equipment including 0.4 5 u Millipore Filter.
3. Magnetic stirring hotplate(s).
4. Ion-exchange column(s), Bio-Rad or equivalent, 1.5 cm I.D. X 15 cm in length, andaccessories.
5. Ripple-free D. C. power supply capable of at least 1.5 amp @ 10 volts.
6. Electrodeposition cells - (Talvite, Anal.discs.
Chem. 1972) and polished stainless steel
7. Assorted glass and plastic ware common to analytical laboratories.
Reagents:
1. a) Concentrated sulfuric acid (H2S04i.
b) Concentrated hydrochloric acid (HCl).
c) Concentrated nitric acid (HNO3).
d) Concentrated hydrofluoric acid (HF).
e) Concentrated phosphoric acid (H3PO4.).
225
Mr, Barry Zalcman -2- January 30, 1986
We are pleased that the M'artin Marietta Energy Systems staff and facilities wereable to respond to your needs during the Incident.
Please notify me if we can be of further assistance.
Sincerely,
. tewart Jr.CAPA Group LeaderAnalytical Chemistry DivisionOak Ridge National Laboratory
JHS:sdc
Enclosures
cc: W. R. LaingW/. O. ShultsJ. R. Stokely, Jr,.
226
ENVIRONMENTAL ANALYSIS PROCEDURE , ._EC 410
UNION CARBIDE CORPORATION C,, C
NUCLEAR DIVISION July 21, 197OAtM NOW, vguNNrSSE .P*AGU•AN, XUlff#vC1Y 9,PrUO
FLUORIDE (IN VYGETATION), ION-SELECTIVE ELECTRODE METHOD __1_ 0,,,____
1.0 SCOPE AND APPLICATION
1.1 This method is applicable to vegetation Such as grasses, leaves,and forest floor litter.
1.2 The range of the method may be varied by sample size and/ordilution. For a 3 gram sample, the lowest fluoride concentrationreported Is 34ag/g.
2.0 SUMMARY OF METHOD
2.1 The sample is air dried, puiverized in a Wiley mill and digestedIn potassium hydroxide. Phosphoric acid Is added and the fluoridedetermined by the ion-selective electrode method using thestandard addition technique,
3.0 IMRFERENCES
3.1 The s•iwn-phphoaphorir arid solution in 01hch the fluoride ismeasuded eliminates the Interference of complexing agents sucnas aluminum, Iron, thorium, and silicon compounds.
4.0. -W4PL. HANDLING AND PRESERVATION
4.1 No special requirements.
5.0 APPARATUS
5.1 Orion Model 801 digital pH/mV meter, or similar instrument for usewith ion-selective electrodes.
5.2 Fluoride Ion-selective e!ectrode
5.3 Reference Plactrode
5.4 p1l Meter
S.S Wiley M1lli. Intermediate Model
5.6 Magnetic stirrers.
pop EC 41o
227

EC 410
July 21, 1977
2 - o2 _ 3
6.0 REMGENTS
6.1 Fluoride Standard, 2000 mg/liter: dissolve 2.2102 grpM of drfqdreagent grade sodium fluoride in distilled water and diluteto 500 ml. One milliter - 2.0 milligram fluoride.
6.2 HydrochlorIc acid, concentrated.
6.3 Phosphoric acid, 18 N: dilute 407 ml reagent grade phosphoricacid, 86%0 to one it.er with distilled water,
6.4 Potassium hydroxide, 2 N: dissolve 112 g reagent grade potassiumhydroxide in distilled iater and dilute to one liter.
7.0 PROCEDURE
7.1 Grind the dried sample to minus 40 mesh in the Wiley m111.Weigh a 3-g sample. or less if more than 400 microgram offluoride is expected, and transfer to a 150-ml beaker.
7.2 Add 35 ml of N. potassium hydroxide, cover beaker with watchglass and plac'e on hot plate adusted to a low setting. Also,place a beaker containing 35 ml of 2 N potassium hydroxide on.hot.plate and carry through the procedure as a reagent blank.
7.3 Digest sample for a total of 90 minutes, rinsing the beaker wallsand cover with distilled water after 30 and 60 minutes of digestion.
1.1 After 90 minutes, remove beakers from hot plate, rinse covers an(%walls and cool to room temperature.
7.5 Add 25 ml of 18 N phosphoric acid and adjust solutions to pH 1.0by dropwlse addition of concentrated hydrochloric acid.
7.6 Place beaker on a magnet stirrer. Insert the fluoride ion-selective electrode and the reference. electrode. Allow stirredsample to equilibrate and record the millivolt reading.
7.7 Add 0.20 ml of the 2.0 mg/ml fluoride standard. The volume ofstandard added must be small so as not to significantly affectthe volume of the sample solution.
7.8 Allow stirred sample to equilibreto again and record the secondmillivolt reading.. Determine the fluoride content of the sampleusing the calculations given below.
228M•, 410• . ... +. .

EC 410OAT "
July 21, 1977JU PE[RSE OEUI - •
PAGE
. 3 o- 3
7.9 If the sample Is found to contain more t•aan 400 micrograms of fluoride,repeat the anaij1is using a 'Smaller sample.
8.1 Co"rN-
where:
Ca
intilog a !I. - IS
C• _ total microgram fluoride in sample solutionCa mcrogra standard fluoride addeddifference In potential of sample solution and fluoridespiked sample solution
S - 59.?, the theoretical electrode slope value for S at 26C
8.2 Fluoride concentration, g C/9 B
where:
Cc the microgram F In sample solution, from (8.1).B.a the micrograms F in reagent blank, andN1 the sample weight in gram.
9.0 REFERENCES
9.1 Gallw, H. L., Shoar, R. E., Skaggs, C. H,, "A PApid eod Sou,ghe v '0 1 Ftuo e .dJ A. Vege&taonl'; A=erican. ndutrtal
Hygiene Association Journal, 36 p.721 (1975).
229EC 410
ENVIRONMENTAL ANALYSIS PROCEDURE..UNION CARBIDE CORPORATION
NUCLEAR DIVISIONOAK MOL YIWNNE. K N PAOUCAN. 93TNUCMY
III I m n t
FC 133~
doarch2.17
FLUORZDE. ION-SELECTIVE ELECTRODE METHODp*or
op
1.0 SCO.PE AND APPLICATION . I
1.1 This method is applicable to the measurement of fluoride 6i di'surface, and saline waters, domestic and Industrial wastes.
.1.2 Concentrations flfluoride from 0.1 up to 1000 mg/liter may be,measured.
lhkihgo
1.3 For total or total dissolved fluoride, the Bellack distillationmust be performed on samples prior :to electrode analysis. Thedistillation must also be performed when samples are not knownto be free from extreme Interferences.
(10.1)
* .0 SULARY OF METHOD
2.1 The fluoride Is determined potentiometrically using an ion-selctiveelectrode In conjunction with a standard single junction sleeve-tylereference electrode and a pH meter hwing an expanded millivolt .::scale, or an ion-selective meter having a direct concentration scalefor fluoride.
2.2. The fluoride electrode consists of.a lanthanum fluoride crsta i.22 The a.& fl a A Ig..Aa ..
g•rvu~ iy.,i•,% a VUT.4wOfiu 19 u9v610e0 Dy T luoriae ions. he celIwmay be represented by Ag/AgCe, C11-0.3), F-(0.001) LaF/test solution/l SClE/
. 2.3 Using a 300-ml swnple, 'the lowest concentration reported is 0.1 mg/litii
3.0.o LE MfJgL NG AND;' PsEieREATION
1 '3.1 no special requirements.
.4.0 , NTRFE .NCE,4.1 Extrwmes of pH and the presence of polyvalent cations of $i44.'
and Al- 3 which form complexes with fluoride Interfere. The degreeof Interferences depends upon the concentration of the camplexing!-cationa. the concmntratlon1"of fl"oride, and the pH of the sample.
. samol pH shoyid be initially adjusted to between 5 and 9. Finaladjustnent Is accomplished by addition of pH 5.0 buffer. (describedbelow) containing a strong chelating iagent which preferentiallyc complexes aluminum (the most comion Interference), silicon, andIron,.
APP me jip~e Vm ']APPROW80 a V
A, EC 133
230

March 24, 1977
'PAGE
5.1 Electrometer (pH meter). with expanded mY scale, or an i6n-s'Iectivemoter such as the Orion Model 801.
5,2 Fluoride Ion Activity Electrode, such as Orion No. 94-09 .
5.3 Reference electrode, single junctions sleew-type, such as Orion
No. 90-01, Beckman No. 40454, or Corning No. 44 76010..
5.4 Magnetic Mixer, Teflon-coated stirring bar.
6.5 -Direct distillation apparatus for fluoride, as shown in.Figure 1L
6.0 R" •UENTS . . ..
61. suffer solution, pH 5,0-5ý5: To approximateli 500 ml.of distilledwater in a I-liter beaker add 57ml of glaecti acetic acid 59 g ofsodium chloride and 2 g of CDTA (1, 2 cyclohexyleneadi.nlt ro ,.tetracatic acid or cyclohexane diamine tetracidic acid). Stir todissolve and. cool to room temperature. Adjust pH *of solution tobetween 5.0 and 5.5 with 5 !J sodium hydroxide (about 150 ml will'berequired). Transfer solution to a l-1iterr volumetric flask anddilute to the mark with distilled water. For work With brines,additional NaCi should be added to raise the chloridelsvel to twicethe highest expected level of chloride in.the sampl.e0
6.2 Sodium fluorides stock solution. 1.0 t1 * 0.1 Mg F. Dissolve0.2210 g of sodium fluoride In distilled water and dilute to 1 literin a volumetric flask, Store In chemical-resistant. glass orpolyethylene. Use anhydrous HAF In preparing this solution.
6.3 Sodium fluoride, standard solution: 1.0 l o-0.01'g Fi DilIte100.0 ml of sodium fluoride stock solution (6.2) to 1000 ml.withdistilled water. . .. ,s .. , . .
6.4 Sulfuric acid, conc.
.7. 0 .81RAT1ZOW
:7,.1 Prepare a series of appropriate standards using the fluoride standardsolution (6.3). The range of the concentration of the standardsshould enclose the concentration of the samples.
231KC ....1323EC 12.3 .

N"tl Yq o
(4 A [ I .. .. ..
March 24, 1977
PAGE
OP
7.2 Calibration of Electrometer: Proceed as described in (8.2). Usingsemilogaritthmic raph paper, plot the concentration of fluoride Inmg/liter on the log axis vs the electrode potential developed bythe standard on the linear axis, starting with the lowest concedtrationat the bottom of ,the scale. Calibration of an Ion-selective meter:Follow the directions of the manufacturer for the operation of theInstrument.
8.1 Distillation
8.1.1 Place 400 ml distilled water in the distilling flask andcarefully add 200 ml conc. H2SO4, Swirl until the flaskcontents are homogeneous. Add 26-35 glass beads and connectthe apparatus as shown In Figure 1 making sure all jointsare tight. Begin heating slowly at first, then as rapidlyas the efficiency of the condenser w 11 permit (the distillatemust be cool) until the temperature T' the flask tOntintareaches 1808C. Discard the distillate. This process servesto remove fluoride contamination and to adjust the acid-waterratio for subsequent distillations.
8.1.2 After cooling the acid mixture remaining from the stepsoutlined in 8.1.1 or previous d6tillations, to 120Cor below$ add 250 ml of sample, mix thoroughly, and distillas before until the temperature reaches 180%C To preventsulfate carry-over, do not permit the temperature to exceed1800C.
8.1.3 Add silver sulfate to the distilling flask at the rate of5 mg per milligram of chloride when high-chloride samplesare distilled.
8.1.4 Continue to use the sulfuric acid solution in the flaskuntil the contaminants from the water samples accumulateto an extent that recovery is affected or interferencesappear in the distillate. Check suitability of the acidperiodically by distilling standard fluoride samples. Afterthe distillation of high-fluoride samples, flush the stillwith 300 ml distilled water and combine the two fluoridedistillates. If necessary, repeat the flushing operation untilthe fluoride content of the distillates is at a minimum.Include the additional fluoride recovered with that of thefirst distillation. After periods of inactivity, similarlyflush the still and discard the distillate.
232 Fi 1 F... . . ... . ..... .. EC 133

7UU-Avg
Condenser
mantlo
TOe
250-miVolumtricFlask
SA.°, o
Figure 1. DIRECT DISTILLATION APPARATUS FOR FLUORIDE... [•l;•cJ m
Vt* viiI
233
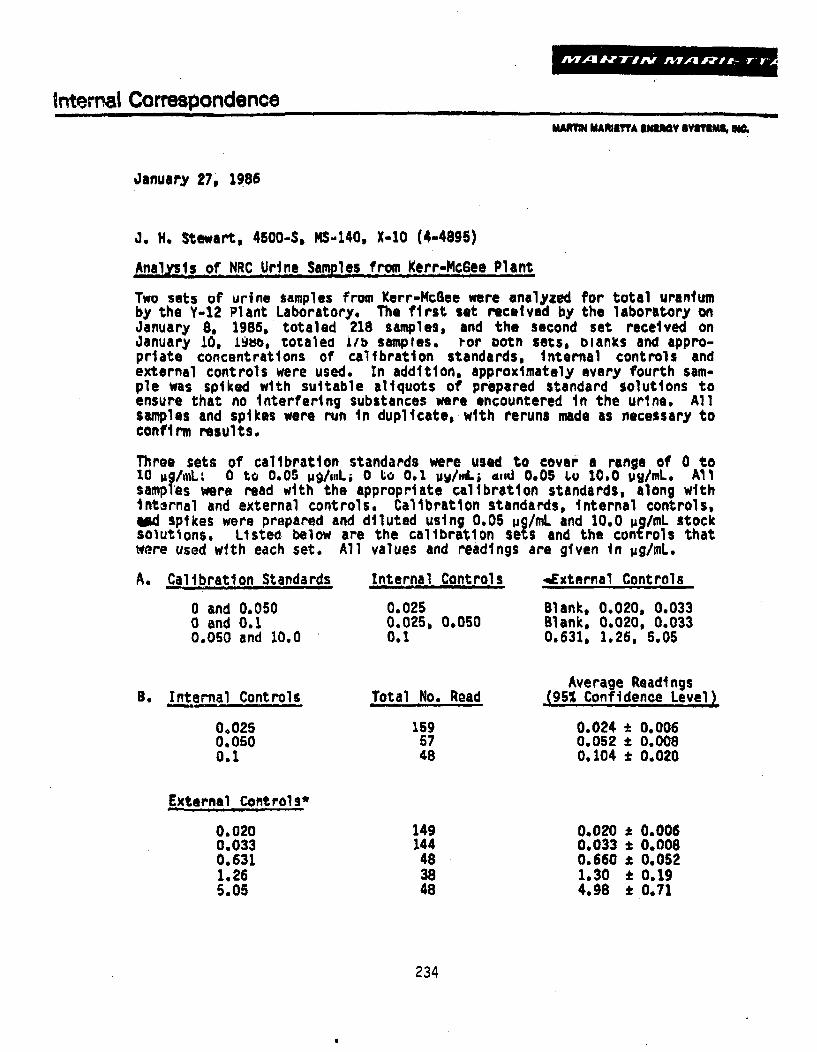
Internal CorrespondenceIIAMM MARIETA IAtRY BYSIMSh NO.
January 27, 1986
J. H, Stewart, 4500-S, MS140, X-10 (4-4895)
Analysls of NRC Urine SamIes from Kerr-McGee Plant
Two sets of urine samples from Kerr-McGee were analyzed for total uraniumby the Y-12 Plant Laboratory. The first set received by the laboratory onJanuary 8, 1986, totaled 218 samples, and the second set received onJanuary 10. igt, totaled iIb samples. ror both sets, Dlanis and appro-priate concentrations of calibration standards. Internal controls andexternal controls were used. In addition, approximately every fourth sam-ple was spiked with suitable aliquots of prepared standard solutions toensure that no Interfering substances were encountered In the urine. Allsamples and spikes were run in duplicate, with reruns made as necessary toconfirm results.
Three sets of calibration standards were used to cover a range of 0 to10 pIg/mLU 0 to 0.05 lp9/s,,L; 0 Lo 0.1 1Viml. a,id 0.05 LW 10.0 ug/mL. Allsamples were read with the appropriate calibration standards, along withlntarnal and external controls. Calibration standards, internal controls,!d spikes were prepared and diluted using 0.05 jag/mL and 10.0 4g/mL stockSOlUtionS. Listed below are the calibration sets and the controls thatware used with each set. All values and readings are given in Vg/mL.
A. Calibration Standards Internal Controls qExtarnal Controls
0 and 0.050 0.025 Blank, 0.020, 0.0330 and 0.1 0.025, 0.050 Blank, 0.020, 0.0330.050 and 10.0 0.1 0.631, 1.26, 5.05
T Average ReadingsB. Internal Controls Total-No. Read (95% Confidence Level)
0,025 159 0.024 * 0.0060.050 57 0.052 * 0.0080.1 48 0.104 * 0.020
External Controls*
0.020 149 0.020 * 0.0060.033 144 0.033 ± 0.0080.631 48 0.660 * 0.0521.26 38 1.30 * 0.195.05 48 4.98 * 0.71
234

J. H. StewartJanuary 27, 1986Page 2
*External control samples were prepared for the Plant Laboratory by theY-12 Quality Division. The standard values for the external controlswere calculated by the Quality Division.
Concentrations and amount of spikes used depended upon the readings of thesample. The samples were spiked so that the spike of sample readlngs wereapproximately twice that of the sample. For this purpose, various dilu-tions were prepared using the stock uranlum solutions. The average recov-ery of all the spiked samples was 99 1 24%.
K. D. Pickell, 9995, MS-i, Y-12 (4-2958) - NoRC
KDPP:dh
cc: J. . Dorsey. 9995, MS-2R. J. McElhaneyb 9995, MS-2L. E. White, 9995, MS-1
235
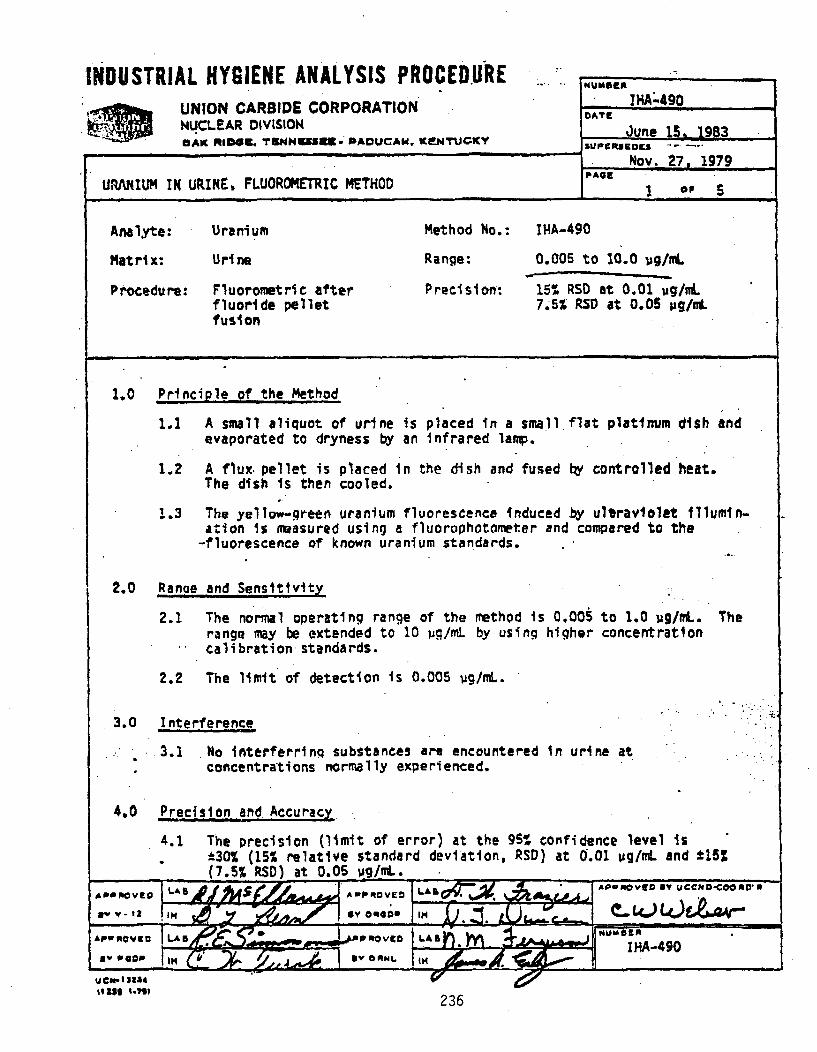
INDUSTRIAL HYGIENE ANALYSIS PROCEDUREUNION CARBIDE CORPORATIONNUCLEAR DIVISIONOAK RIDE.- ?BNN=Z1S- PA0UCAW, KFNTUCKY
IIIAL490
June 15, 1983SUNPEREOr . ..
Nov. 27, 1979
URAIUM IN URINE, FLUOROMETRIC METHODPAGE
1 *1 5
Analyte: Uranium Method No.: IHA-490
Matrix: Urine Range: 0.005 to 10.0 9g/mL
Procedure: Fluorometric after Precision: 15% RSD at 0.01 9g/mLfluoride pellet 7.5% RSD at 0.05 jg/ntfusion
1.0 Principle of the MethodI I I II I I I m
1.2 A small aliquot of urine is placed In a smallevaporated to dryness by an infrared lamp.
1.2 A flux- pellet is placed in the dish and fusedThe dish Is then cooled.
flat platinum dish and
by controlled heat.
1.3 The yellow-green uranium fluorescence Induced by ultraviolet fllumin-ation is measured using a fluorophotometer and compared to the
-fluorescence of known uranium standards.
2.0 Range and Sensitivity
2.1 The normal operating range of the method is 0.005 to 1.0 ug/ML. Therange may be extended to 10 ug/mL by using higher concentrationcalibration standards.
2.2 The limit of detection is 0.005 ug/mL.
3.0 I nterference
.3.1 No interferrinq substances are encountered in urine at• ~concentrations normally experienced. ~*1
4.0 Precision and Accuracy-
4.1 The precision (limit of error) at the 9Ma confidence level isi30% (15% relative standard deviation, RSD) at 0.01 jig/rL and t15%(7.5% RSD) at 0.05 ug/mL.
APPROVE LAS AM OE
APRVED jLAB RO0
e P GOP GV kvOMNI.,
0M~ t-791236

I .XHA-490 -
June 15, 1983
supemsevas
I Nov. 27, 1979PAGZ 2 +,
4.2 The accuracy of the method depends on how well the matrix of thecalibration standards matches that of the sample being analyzed.No significant bias has been identified.
5.0 Advantaaes and Disadvantages of the Method
5.1 Advantages over previous methods include simplicity, speed, andsensitivity.
5.2 One disadvantage is that, without chemical separation of theuranium, the accuracy of the measurement depends on the amountof dissolved solids in the sample, and on how well this matchesthe calibration standard.
6.0 Apparatus
6.1 Fluorophotometer, modified Oak Ridge National Laboratory Model
0-1165, or equivalent.
6.2 Furnace, Induction; or burner, modified Fletcher.
6 Dishes, platinum fusion, T72-inch diameter, 1/16-inch lip, 1/8-inchdeep.
6.4 Fusion dish holder.
6.5 Pelletizer, delivering 0.3 or 0.6-g pellet of flux.
6.6 Infrared lamp and stand, 375-w.
6.7 Pipet, 100-or 200-uL, semiautomatic.
7.0 Reagents
7.1 Sodium fluoride - 2% lithium fluoride flux: Put 1359 g (3 pounds)of fluorometric grade sodium fluoride and 27 grams of lithiumfluoride into a clean S-pound glass reagent jar. Place the jar onthe mechanical roller and roll for 48 hours.
IHA-490. 237
UCMN.O76e. Itt a••71i
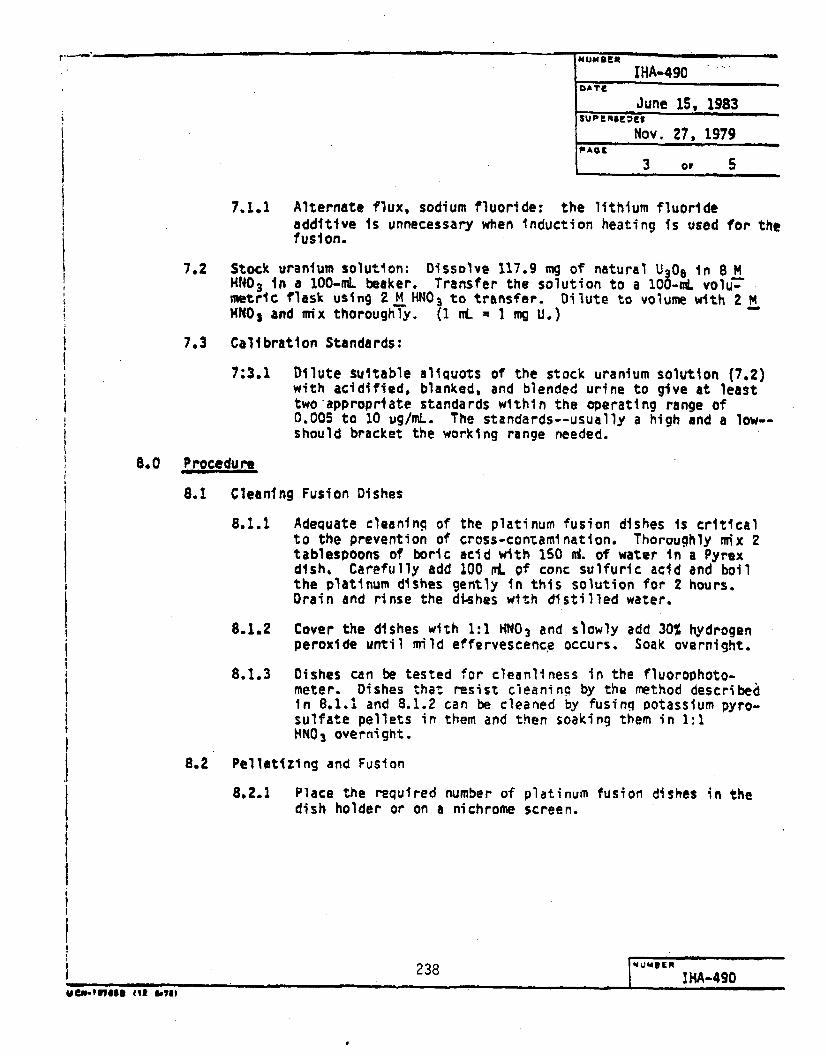
1 _______ .uwuuq - -NUMBER...
IHA-490
June 15, 1983SUPERSE
Nov. 27, 1979
3 0P 5
7.1.1 Alternate flux. sodium fluoride: the lithium fluorideadditive is unnecessary when Induction heating is used for thefusion.
7.2 Stock uranium solution: Dissolve 117.9 rg of natural U306 in 8 MH"03 in a 100-mL beaker. Transfer the solution to a 1O0-mL volu-metric flask using 2 M HNO 3 to transfer. Dilute to volume with 2 MMN03 and mix thoroughly. (1 nt = I mg U.,)
7.3 Calibration Standards:
7:3.1 Dilute suitable aliquots of the stock uranium solution (7.2)with acidified, blanked, and blended urine to give at leasttwoeappropriate standards within the operating range of0.005 to 10 ug/mL. The standards--usually a high and a low--should bracket the working range needed.
8.0 Procedure
8.1 Cleaning Fusion Dishes
8.1.1 Adequate cleaning of the platinum fusion dishes is criticalto the prevention of cross-contamination. Thoroughly mix 2tablespoons of boric acid with 150 ot. of water in a Pyrexdish. Carefully add 100 mL of conc sulfuric acid and boilthe platinum dishes gently in this solution for 2 hours.Drain and rinse the dishes with distilled water.
8.1.2 Cover the dishes with 1:1 HNO 3 and slowly add 30% hydrogenperoxide until mild effervescence occurs. Soak overnight.
8.1.3 Dishes can be tested for cleanliness in the fluorophoto-meter. Dishes that resist cleaninc by the method describedIn 8.1.1 and 8.1.2 can be cleaned by fusinq potassium pyro-sulfate pellets in them and then soaking them in 1:1HN0 3 overnight.
8.2 Pelletizing and Fusion
8.2.1 Place the required number of platinum fusion dishes in thedish holder or on a nichrome screen.
238 DERIHA-490
VCgMr-VINOW 412u iln

IMA-.4'90
June 15, 1983
Nov. 27, 1979
4 6
8.2.2 Swirl each sample bottle to mix the sample and to suspendall solids. Process a blank and the calibration standardswith each set of samples.
8.2.3 QuIckly insert the semiautomatic pipet Into the samplebottle and withdraw an appropriate aliquot of solution(usually 100 uL for a 0.3-g p4llet or 200 uL for a 0.6.9pellet); discharge the conteufts of the pipet Into a platinumdish.
8.2.4 Place the dish holder or screen and the platinum dishesunder the infrared lamp and evaporate all samples todryness. Then remove the holder or screen from under thelamp.
8.2.5 With the pelletizer, place a 0.3- or 0.6-g pellet of the
fluoride flux into each platinum fusion dish.
8.2.6 Fusion using a modified Fletcher Burner.
8.2.6.1 Place the screen over the fusion burner; fuse for2 minutes at approximately 11006C, then reduce to950*C and fuse for 1 minute. (An optical pyro-meter will provide teemperature estimates.)
8.2.6.2 Remove the screen containing the dishes from: .the
burner and allow to cool.
8.2.7 Alteonatv rublurt, using an Induction Furnace:
8.2.7.1 Place four dishes at a time in the inductionfurnace coil.
8.2.7.2 Apply 600 ma current for 60 seconds.
8.2.7.3 Transfer the dishes back to the holder to cool.(CAUTION: Use forceps.)
8.3 Fluorescence Measurement
8.3.1 Place the platinum dishes containinq the blank, uraniumstandards, and sample melts on the turn-table of thefluorophotoometer.
•NA-" 239U 6A-490 1
IJCO-16?IIA ftl 1,,761

--- i II I
NUMBER -IHA-490
June i$, 1983
Nov. 27, 1979PAGE
S o, 5
8.3.2 Move the blank under the ultraviolet light and adjust the
zero control knob to make the instrument read zero.
8.3.3 Move the hiqh uranium standard malt under the ultravioletlight and adjust the calibration control until the instrument
reads the known value of the standard.
8.3.4 Move the low uranium standard malt under the ultravioletlight. It should read the known value of the standard if
the instrument is properly calibrated. The fluarophotometeris now calibrated for direct-readout of uranium in.theworking range, which could extend from 0.005 to 10 ug/mL.Readout may be in appropriate units other than ug/mL.
8.3.5 Move the samplp pellets under the ultraviolet light of the
fluorophotometer and read the uranium content of the aliquots.Record the readings.
9.0 Calculations
9.1 If the readings are in ug/mL, no further calculations are necessary.
9.2 If the readings are in ug or ng, use the followfiq formulas:
...... U. Wg/AL -. U.
no UU. uglmL -- ~--.
where; A - volume of sample (see 8.2.3) pipetted onto the pellet, nL,
9.3 If the ulg U/day for an employee is to be reported, use the followingformul1a:
U, vg/day = U ug/mL X4-- X 24
where: V = volume excreted, mLT a time interval, hr
24 - hr/day
10&.Q Reference
10.1 Centanni, F. A., Moss, A. M., and DeSesse, M. A.; "FluorometricOatermlmation of lr~ntiim": Anal. Chem.. 28. o. 1651 %1966).
240 O'4 IAA"-490
I -I ,it ! I , .., . ..
5 119245-22-80
Determination of Uraflium by Neutron Activationand Delayed Neutron Counting
1.0 SCOPE
This method is applicable to the determination of 2 3 5 U in liquid or
solid samples. Total uranium analyses cAn be nhr.ained by the method
if the isotopic composition of uranium in. the sample is known.
2.0 PRINCIPLE
This procedure assumes familiarity with the delayed neutron counting
facility and pneumatic tube control panel at the Oak Ridge Research
Reactor (ORR). After irradiation time and aliquot size are established,
the sample ic irradiated and the neutrone emitted following decay of
certain short-lived fission products of 235U are counted. A 235U
standard that corresponds to the configuration of the unknown sample is
irradiated and counted exactly in the same manner as the sample. An
empty rabbit is also irradiated and the neutron count rate is subtracted
from the count rates of the sample and standard. The resulting count
rates and weights of the standard and sample are compared to obtain the
uranium content of the sample.
3.0 APPARATUS
.Analytical balance
Micro-pipettes
Heat lamp
Rabbits and inserts
Soldering iron
4.0 SAIETY
The hood that contains the rabbit loading station is considered a con-
tamination zone and general health physics rules apply. Care should be
241
5 11924-25-22-80
taken when loadin3.A wabbit .po as not to touch any contaminated equipment.
5.0 MRCEDURE
5.1 Sample Pr•earation
5.1.1. If a solid specimen is large and crystalline In structure, it
should be crushed or ground to a fine consistency and blended
wall bafore weighing.
5,1.2. Transfer the sample to a previously prepared and tared insert
and xelh the sample, Rx840sd? l the, wAhW.t-in-the lo&5book-or
delayed neutron measurements along with the sample identift-
cation. Cop the insert and heat seal the cap to the body of.
the insert. Load the insert into a Tabbit for irradiation.
341,3. If a small insert is used, the finger of a plastic &love or other
similar material should be put lu the rabbit to keep the insert
in placme.
5.1.4. If the specimen is a liquid, pipet an aliquot (usually 1 =I)
directly into an insert and evaporate the liquid under a heat
lamp. After the solution has evaporated, allow It to cool and
heat seal the insert. Transfer the insert to a rabbit for
irradiation.
5.1.5. gome organic compounds that will not dry under ordiuary heat
lamp temperatures must be treated differently. Pipet these
kinds of samples into an insert that contains enough accelerator
Maisher 09-906) to absorb the aliquot (usually 100 14). Beat
seal the insert and load it in a rabbit for irradiation.
3.2. Stanvardizatign of tha Delayed Niturrnn •,•inting SXctom
5.2.1. Take a 400 socod background count of tthu empty system and qtcor4
It in the log book. Place the 2 4 1Am-boron neutron source luto
242
5 11924-35-22-80
the access tube of the system and count it for 400 seconds.
These two counts are not used iu the actual analysis, but they
are a good check as/to the status of the system.
5.2.2. Set the control pQ& f9r ZQ eCond irradiattin with the
rabbit return selector switched for return to the delayed neutron
counter.. ket the decay timer for 12 seconds and the tlmar for
the counter on 40 seconds.
5.2.3. Irvadiate,.cont.q and record counts for three blanks using thisse•Up.
5.2.4. Irradiate, count, and record counts for to 235U standards and
on~tNES.-coal and fly ash (Note A).
5.3.1. Irradiate, count, and record the counts for each of the samples
In. he same manner as with the standards and quality control
namplex. The samples -must correspond Id con•iguration with the
standards (standard in large insert - sample in large insert. etc.).
5.3.2. The-uranium content can be calculated by hand or by using the
MONSTR program on the PDF-15 computer. Rand calculations are
performed with the following equation:
,23 5U ppm _ AS/CD
Natural U, ppa - U/P
where:
A MOL. sample. aliquot counts corrected for background,
NOT A: The uranium standards are prepared beforehand exactly as the unknowns
are prepared. They may be reused if the insert remains in good condition.
243

5 11924-45-22-80
`3 - weight of 2335"'Urhe standard, )ig,
C aliquot weight, g;
D - standard counts corrected for background,U -23"5 U ppa,
F abundance of 2350 In sample U.
5L3.3. Store the data on DEC tape and save the line printer output
for reporting the data.
6.0 PzRcIsIoN
6.1. The precision for uranium by this method is excellent If the
count rate of the sample is significantly above the blank
count rate. Precision can be Improved by careful preparation
of the unknowns and standards and careful attention to maintaining
the same irradiation geometry for standards and samples. If
the criteria are met, the accuracy is probably +2.5%
7.0 INTEF.E.CES
A specimen that is either depleted .or enriched in 2 3 5U lwill of course give
erroneous natural-U results. Any element present in high concentration
with a high capture cross section could cause a negative bias in the
results. Under a high ga a field, the BY3 neutron detectors lose
effieiency, and the resulting count rate may be somewhat low giving
erroneous results.
1. Dyer, 7. 7., Emery, J. F., and Leddicotte, G. W., A Comprehensive
Study of the Neutron Activation Analysis of Uranium by Delayed
Neutron Counting.. ORNL-3342 (1962).
244
5 11924-55-22-80
1. "Reactor Operations and Experiments," ORNL Radiation Safety
and Control Manual, Section 8-9.
rittteu byi
J. W. Wade
Approved by:
1. J. R. Stokely, Section Head
2.. W. D. Shulte, Director, ORNLAnalytical Chemistry Division
245

APPENDIX 5.2.4
OSDH SAMPLING PROCEDURE
247

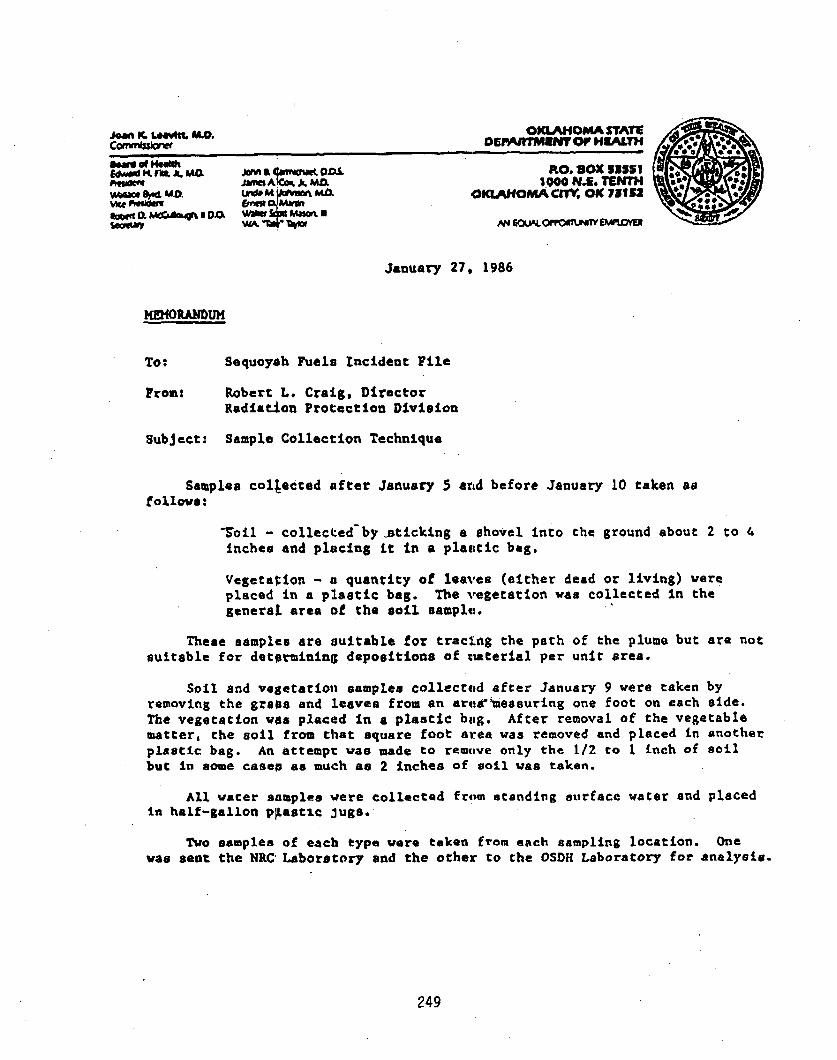
Joan r_ IWevftI M.D. OKLAHOMA STATZConwnijw DEI•ARTMEM' Of HALNTH
0 1no wd , of ,n .• • RO. BOX 52S51MOM IA. Jr. MIX 1000 N.E, TENTHS- . MA OKLAoA cfl, OK 751,2
w.ice Os.iw E•sw O•.MM ,n
January 27, 1986
To: Sequoysh Fuels tncident File
From: Robert L. Craig, DirectorRadiation Protection Division
Subject: Sample Collection Technique
Samples coltected after January 5 arnd before January 10 taken asfollows:
-Soil - collected'by sticking a shovel into the ground about 2 to 4inches and placing it in a platicic bag.
Vegetation - a quantity of leavea (either dead or living) wereplaced in a plastic bag. The vegetation was collected In thegeneraL area of the soil sample.
Theme samples are suitable for tracIng the path of the plume but are notsuitable for detptrining depositions of naterial per unit area.
Soil and vegetation samples collected after January 9 were taken byremoving the grass and leaves from an aresrinessuring one foot on each side.The vegetation was placed in a plastic bag. After removal of the vegetablematter, the soil from chat square foot area W3s removed and placed in anotherplastic bag. An attempt was made to remove only the 1/2 co 1 inch of soilbut in some cases as much as 2 inches of soil was taken.
All water samples were collected from standing surface water and placedin half-gallon pLastic jugs.
Two samples of each type were taken from each sampling location. Onewas sent the NRC Laboratory and the other to the OSDH Laboratory for analysis.
249

APPENDIX 5.2.5
SFC SAMPLING PROCEDURE (2 DOCUMENTS)
251


SEQUOYAH FUELS CORPORATIONINTERNAL CORRESPONDENCE
TO W. L. Utnage DATE January 21, 1986
FROM A. W. Norwood SUBJECT Sequoyah Recovery Operation
Information concerning the survey and sampling techniques used,and the chronological sequence of actions taken by the SequoyahFuels' Cimarron Facility Response team has been requested byE.G.&G. personnel. With your concurrence this correspondencewill be provided to them to assist in the documentation of thesample and survey results.
Cimarron survey and sampling team members at various points intime were:
A. W. Norwood - Cimarron Facility ManagerRon Fine - Health Physics SupervisorWill Rogers - Decontamination SupervisorJoe Kegin - Maintenance SupervisorClaude Thompson - Health Physics SpecialistJack Andrews - Senior Health Physics TechnicianFrank Murch - Senior Health Physics TechnicianDon Rall - Decontamination Supervisor
All of the direct alpha survey readings provided on the surveymao documents were taken with portable alpha survey instrumentswith 60 cm2 probes. The sensivitiy of the portable alpha surveyinstruments allows good confidence in readings as low as 200 dpm/60 cm2 ; therefore, negative readings are shown as <200 dpm/60 cm2
on the survey maps.
Off-site smears at the residences south of highway 1-40 werecounted with portable smear counters with a sensitivity thatallows good confidence in readings as low as 6 dpm/100 cm .Most of the smears taken on site within the exclusion area fencewere counted with portable alpha Iurvey instruments with negativereadings shown as <200 dpm/100 cm2. All smear readings shownon the survey maps are per 100 cm2 .
The sampling criteria for the vegetation and soil grab samplestaken around the residences by the Cimarron team was only that atleast 100 grams of sample be taken to assure an ample quantityfor analysis. This same criteria was used for the 180' gridgrab samples taken on-site from the lawn between the processbuilding and the south exclusion area fence as shown on thegrid map. Five of these grab samples were taken immediatelyoutside of the exclusion area fence as shown on the grid map.The five grab samples taken just outside of the exclusion areafence were split with NRC. Both vegetation and soil grab sampleswere taken on the 180' grid pattern and soil grab sampling wasrepeated in the areas where the grass was removed on the samegrid pattern.
?53KN -Sl-214-
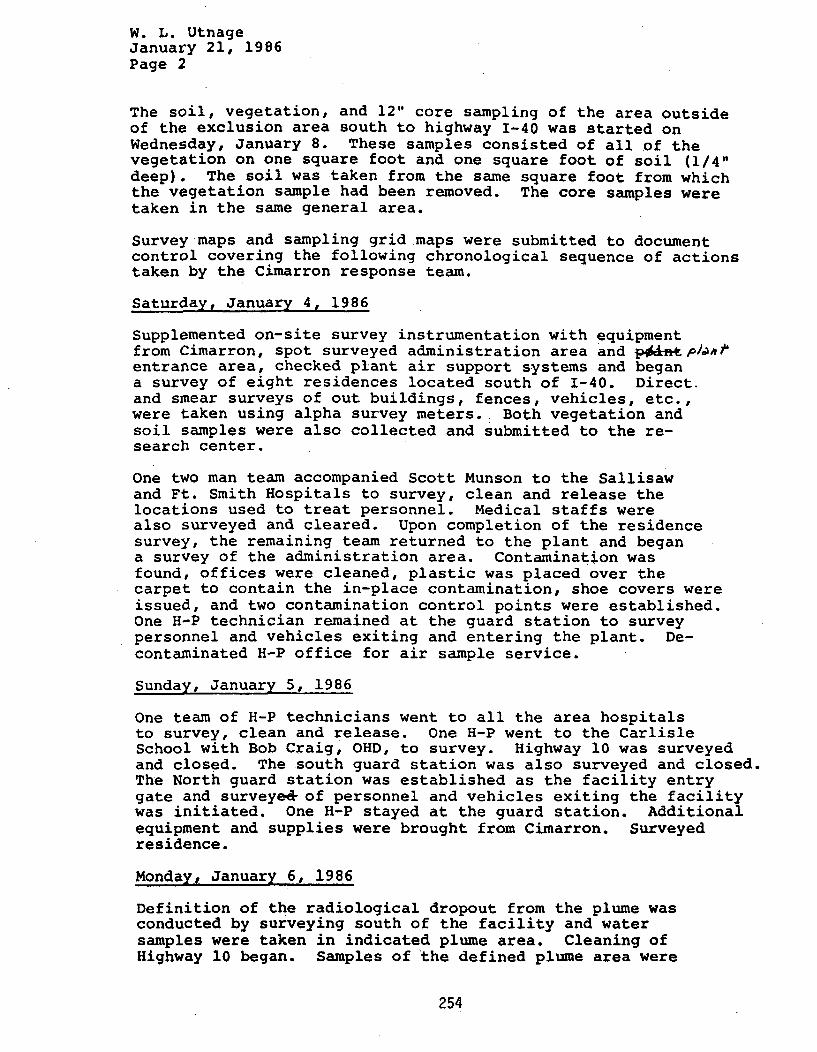
W. L. UtnageJanuary 21, 1986Page 2
The soil, vegetation, and 12" core sampling of the area outsideof the exclusion area south to highway 1-40 was started onWednesday, January 8. These samples consisted of all of thevegetation on one square foot and one square foot of soil (1/4"deep). The soil was taken from the same square foot from whichthe vegetation sample had been removed. The core samples weretaken in the same general area.
Survey maps and sampling grid maps were submitted to documentcontrol covering the following chronological sequence of actionstaken by the Cimarron response team.
Saturday, January 4, 1986
Supplemented on-site survey instrumentation with equipmentfrom Cimarron, spot surveyed administration area and •entrance area, checked plant air support systems and begana survey of eight residences located south of 1-40. Direct.and smear surveys of out buildings, fences, vehicles, etc.,were taken using alpha survey meters. Both vegetation andsoil samples were also collected and submitted to the re-search center.
One two man team accompanied Scott Munson to the Sallisawand Ft. Smith Hospitals to survey, clean and release thelocations used to treat personnel. Medical staffs werealso surveyed and cleared. Upon completion of the residencesurvey, the remaining team returned to the plant and begana survey of the administration area. Contamination wasfound, offices were cleaned, plastic was placed over thecarpet to contain the in-place contamination, shoe covers wereissued, and two contamination control points were established.One H-P technician remained at the guard station to surveypersonnel and vehicles exiting and entering the plant. De-contaminated H-P office for air sample service.
Sunday, January 5, 1986
One team of H-P technicians went to all the area hospitalsto survey, clean and release. One H-P went to the CarlisleSchool with Bob Craig, OHD, to survey. Highway 10 was surveyedand closed. The south guard station was also surveyed and closed.The North guard station was established as the facility entrygate and surveyed of personnel and vehicles exiting the facilitywas initiated. One H-P stayed at the guard station. Additionalequipment and supplies were brought from Cimarron. Surveyedresidence.
Monday, January 6, 1986
Definition of the radiological dropout from the plume wasconducted by surveying south of the facility and watersamples were taken in indicated plume area. Cleaning ofHighway 10 began. Samples of the defined plume area were
254
0. . Li . V A&V4.
January 21, 1986Page 3
taken on 180' centers for vegetation and soil inside theexclusion area fence. The Tyler home south of 1-40 wassurveyed and samples were taken and submitted for analysis.A survey of the process area was made by Ron Fine. DonMajors was established as the focal point to documentenvironmental surveys and sample results onto maps.
Tuesday, January 7, 1986
Orientations of contractor personnel for health and safetywas given and stripping of the contaminated areas in frontof the plant began to avoid further contamination spread.H-P monitors were used to control traffic through the highairborne area and to monitor operations. Definition ofthe plume area was completed.between exclusionary fenceand 1-40. The ambulances used to transport the injuredemployees were tracked down, surveyed, and released. Washingof the contaminated grass outside the plant fence was initiatedwith water/soda ash solution. Cleaning of Highway 10 wascompleted. It was surveyed at 10' intervals and released.
Wednesday, January 8, 1986
Stripping operations continued by contractor personnel wearingrespirators. The drivers were also wearing lapel samples.Began taking samples of the plume area (i.e., one on the centerline, one on each boundary, and one at 1000 feet outside theplume on each side). These samples were taken at 1000 footintervals with baseline samples. One square foot of grass,one square foot of soil (1/4") and a core sample at each locationwas taken for the NRC. Urine samples of the stripping operatorswere collected each day.
Thursday, January 9, 1986
Completed grass stripping. Moved the excavated soil to a dikeestorage area northwest of plant. Completed the soil andvegetation sampling of the plume grid and began taking NRC coresamples. Began washdown operations of roadways and vehicles.Pulled "pinch" samples of soil where the grass had been removed forcounting in the H-P proportional counter. Resampled the soilafter excavation in accordance with the previous grid.
Friday, January 10, 1986
Completed the roadway and sidewalk survey at 25 foot intervals(NRC verified). Surveyed the O.G.&E. substation and recorded -no cleaning was done. Received data from proportional counteron pinch sampling taken on Thursday indicating soil remaining
255
W. L. UtnageJanuary 21, 1986Page 4
in front yard was 8 dpm/2" planchet. Resurveyed office area.Steam cleaned vehicles. Washed down front of building. Con-tinued NRC core sampling.
Saturday, January 11, 1986
Contacted Quadrex for H-P assistance to monitor personnelexit of the restricted area in response to NRC's comments.Continued NRC core s pling. Lined sod storage with PVCliner for contaminate control. Cleaned and released southguard station, Highway 10 entry, and service road and re-established south guard station operations. Watered Highway 10.Steam cleaned poles and signs at front of plant and released.
Sunday, January 12, 1986
Surveyed UF4 construction site and released. Surveyed allroads inside of perimeter fence and released. Resurveyedplant administration area. Continued NRC core sampling.
Monday, January 13, 1986
Resodding began after orientation by H-P. Surveyed administrationareas for final release of shoe cover requirements. ContinuedNRC core sampling. Wayne Norwood assumed additional responsi-bilities for process clean-up.
Tuesday, January 14, 1986
Met with NRC and released administration area of shoe coverrequirements. Completed NRC core sampling (for the third time).Surveyed, cleaned and released lunchroom vendor's car. Follow-upto ensure fencing of sod and storage area was completed. Continuedresodding. Resampled areas in plume area as follow-up to watersamples taken on 1/6/86. Urine samples from the re-sodders willbe collected upon completion of the work activity.
AWN:dd
xc: C. A. GrosclaudeDocument Control
256
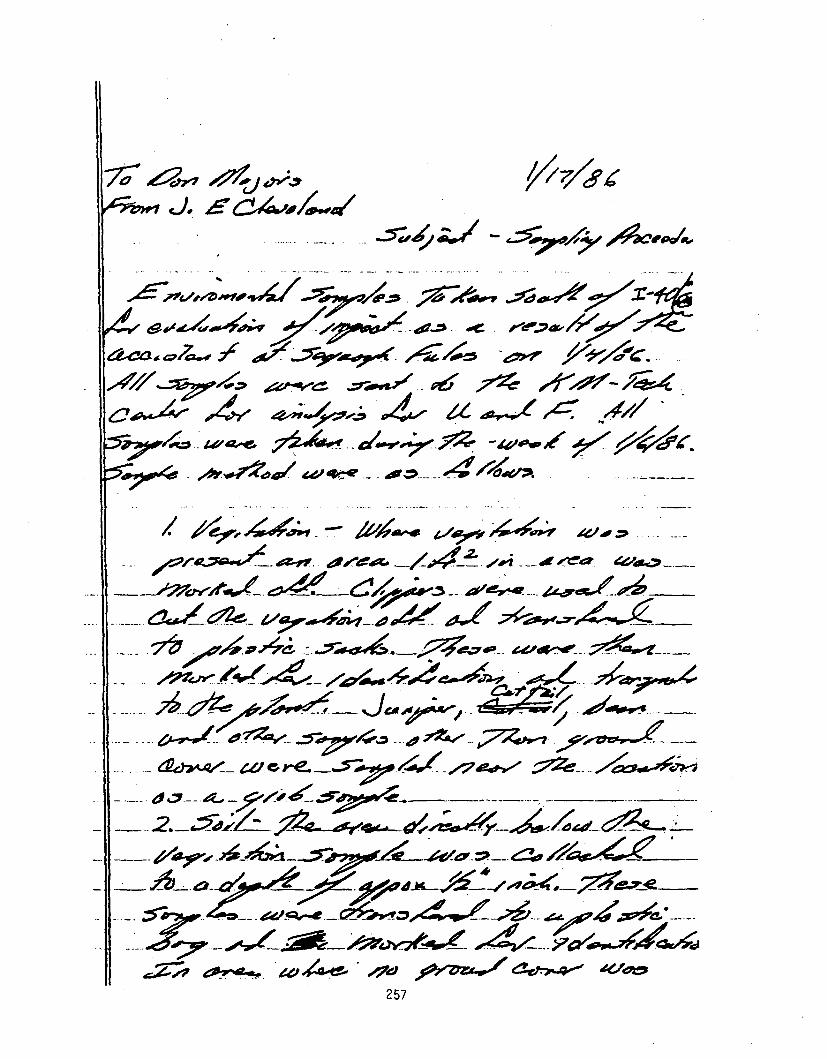
, ............ ~ ~...... .... .•, -. • /• , , ,
-:I-
-.. .d. ... .
• '• .d •J w .,t ..... -, ..... , ' .,_,. ..... _,
./ _
- __,' i/ S,,-,',"*,,,4 _ .'A ... .. 0._
257
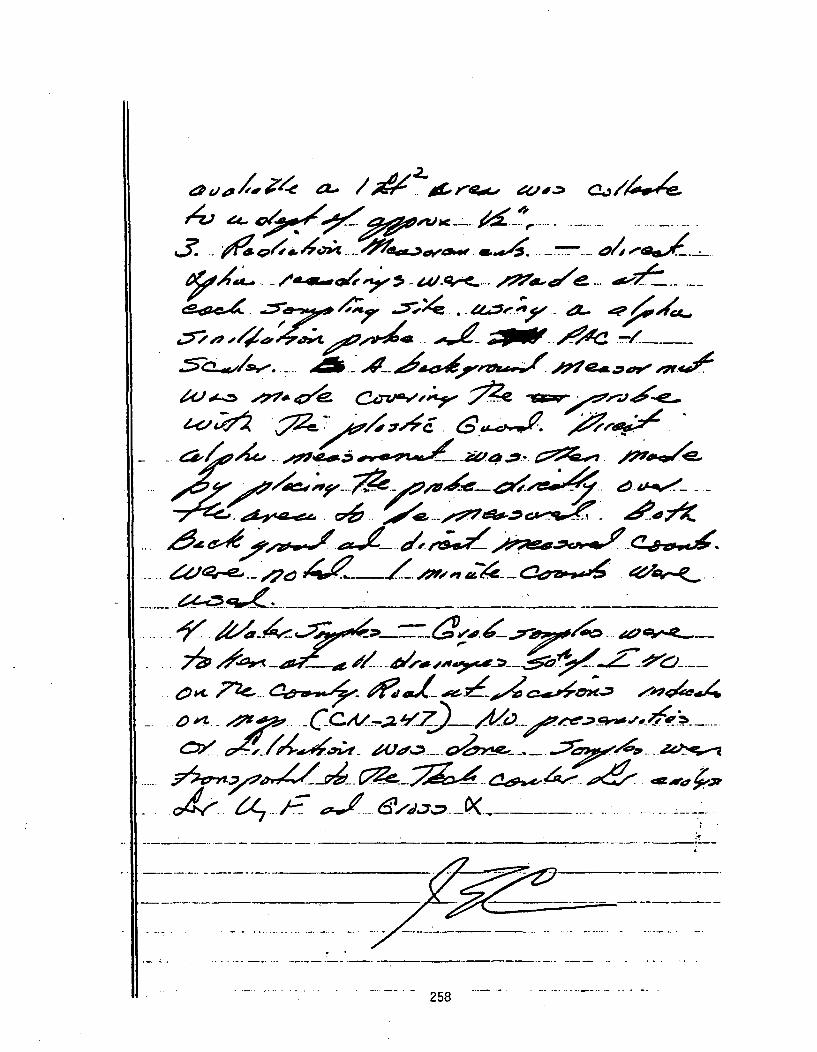
M-•-•- "I Lp.- - P' V- 4,-/-
~a 0
~9w
-,•/ J•./ :,•E .- cz.a.. . "
258

APPENDIX 5.2.6
OSDH LABORATORY ANALYSIS PROCEDURES
259

January 13, 1986
MEMORANDUM
TO: Dale McHard, ChiefRadiation and Special Hazards
FROM: Judith A. Duncan, Chief 'J-4D)State Environmental Laboratory Service
SUBJECT: Summary of analytical methods used for analyses of soil, vegetationand water samples from the area of the recent Sequoyah FuelsIncident.
Bob Craig requested that we provide a written summary of our analyticalmethods and quality control procedures for the recent fluoride analyses which weperformed on samples submitted in relation to the Sequoyah Fuels Incident earlierthis month. It is my understanding that NRC requested this information.
Attached you will find an outline of our methods. Should you or anyone fromNRC have any questiQns, please contact me.
261
SEDIMENTS: S grams of sediment were weighed into a 100 milliliterbeaker. Equal amounts of Deionized water and TISAB (TotalIonic Strength Adjustment Buffer) were added. Sample wasthen refluxed for 1 hour. Sample was brought back up tooriginal volume with D.I. water if evaporation occurred.After sample cooled it was analyzed on an Orion FluorideMeter. Fluoride. value was determined by followingcalculation:
Vw x Cfwt
Cs mg/kg
whereVwCfwtCS
Volume of D.I. water added in ml.Concentration of fluoride read from meterWeight of sample used in gramsConcentration of fluoride in sample
FOLIAGE:
QUALITY CONTROL:
The procedure for foliage differs from that of sediment onlyin the weight of sample used and the need to remove thefoliage from the DI/TISAB solution to enable stir bar torotate.
Duplicates and spikes were done every 10 samples. %Recovery ranged from 60% to 127%. The datameasurements were made in hopes of approximating thepassage of the plume by looking for gross differences in thefluoride concentration.
262
GROSS ALPHA AND GROSS BETA ANALYTICAL PROCEDURES
SAMPLE PREPARATION:
SOIL:
VEGETATION:
CALCULATION:
The sample was dried on a hot plate and ground. 2.5grams of sample was placed in a 50 ml capped centrifugetube, 25 ml of deionized water was added, shaken forabout 10 minutes and centrifuged. 10 ml of thesupernatant was transferred to a 2 in. x 1/4 in. ringedSS planchette and dried under a heat lamp. Theplanchette was counted on a low background, thin windowproportional counter for 10 minutes.
2 grams of the sample (as received) were placed in a 50ml capped centrifuge tube, 25 ml of deionizied water wasadded and shaken for about 10 minutes. The liquid wasdecanted and centrifuged. 10 ml of the liquid wastransferred to a 2 in. x 1/4 in. cared planchette andsufficient CaSO solution was added to ensure that thesolids on the pianchette would be in excess of 10milligrams. The planchette was dried under a heat lamp,weighed, and counted for 10 minutes.
Gross alpha and gross beta concentrations werecalculated as follows:
Activity (pCi/gm) - Net X 2.5WT X EFF X 2.22
Where:Net - Net cpm of alpha or beta activityWT - Sample weight in gramsEFF - Counting efficiency (cpm/dpm)2.5 - Ratio of volume of water added to sample
volume of sample analyzed.2.22- dpm/pCi
Counter background and counting efficiency were checkedprior to counting each batch of samples.
QUALITY CONTROL:
263

APPENDIX 5.2.7
ENVIRONMENTAL SAMPLING: VEGETATION AND SOIL
265

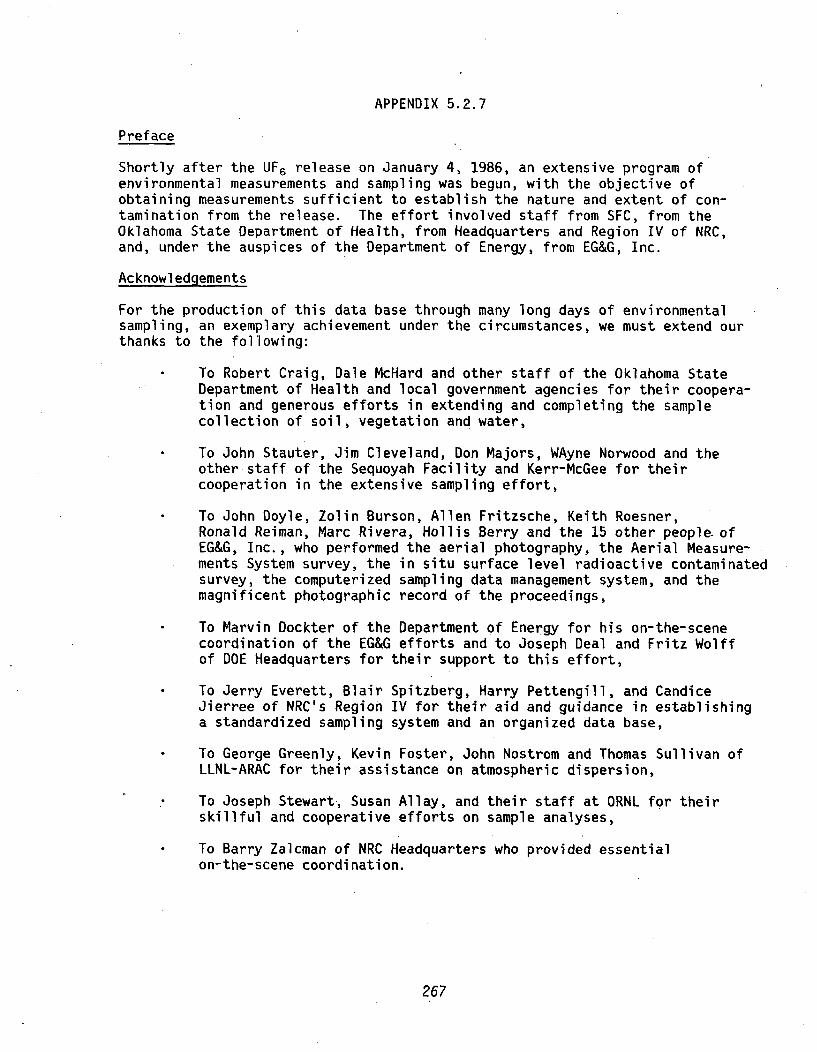
APPENDIX 5.2.7
Preface
Shortly after the UF6 release on January 4, 1986, an extensive program ofenvironmental measurements and sampling was begun, with the objective ofobtaining measurements sufficient to establish the nature and extent of con-tamination from the release. The effort involved staff from SFC, from theOklahoma State Department of Health, from Headquarters and Region IV of NRC,and, under the auspices of the Department of Energy, from EG&G, Inc.
Acknowledgements
For the production of this data base through many long days of environmentalsampling, an exemplary achievement under the circumstances, we must extend ourthanks to the following:
To Robert Craig, Dale McHard and other staff of the Oklahoma StateDepartment of Health and local government agencies for their coopera-tion and generous efforts in extending and completing the samplecollection of soil, vegetation and water,
To John Stauter, Jim Cleveland, Don Majors, WAyne Norwood and theother staff of the Sequoyah Facility and Kerr-McGee for theircooperation in the extensive sampling effort,
To John Doyle, Zolin Burson, Allen Fritzsche, Keith Roesner,Ronald Reiman, Marc Rivera, Hollis Berry and the 15 other people. ofEG&G, Inc., who performed the aerial photography, the Aerial Measure-ments System survey, the in situ surface level radioactive contaminatedsurvey, the computerized sampling data management system, and themagnificent photographic record of the proceedings,
To Marvin Dockter of the Department of Energy for his on-the-scenecoordination of the EG&G efforts and to Joseph Deal and Fritz Wolffof DOE Headquarters for their support to this effort,
To Jerry Everett, Blair Spitzberg, Harry Pettengill, and CandiceJierree of NRC's Region IV for their aid and guidance in establishinga standardized sampling system and an organized data base,
To George Greenly, Kevin Foster, John Nostrom and Thomas Sullivan ofLLNL-ARAC for their assistance on atmospheric dispersion,
To Joseph Stewart, Susan Allay, and their staff at ORNL for theirskillful and cooperative efforts on sample analyses,
To Barry Zalcman of NRC Headquarters who provided essentialon-the-scene coordination.
267

Sample Collection
Environmental sampling began on January 4, 1986, soon after the release.Initially, "grab" samples of soil, vegetation, and water were taken. These servedto indicate roughly the concentrations and extent of contamination. However,comparisons of results from different locations and sampling organizations weredifficult due to use of nonuniform sampling procedures. Therefore, proceduresfor more uniform sampling of the ground surface were designed, and put intopractice by the SFC sampling teams on January 8, 1986, and by the OSDH samplingteams on January 10, 1986. Thus samples collected on those dates or later areof a more uniform quality.
Samples were collected by two organizations, the Oklahoma State Department ofHealth and by Sequoyah Fuels Corporation. Most samples were split, with thesecond portion being sent to Oak Ridge National Laboratory for confirmatoryanalysi's. Thus analyses were performed by SFC or the Kerr-McGee TechnicalCenter (designated K-M), by OSDH and by ORNL.
Maps of Sampling Locations and Results
Sampling locations were plotted at the SFC directly on overlays on two base maps,one being a 1" = 400' map of the site and its immediate surroundings, and theother a composite of 1:24,000 scale U.S. Geological Survey maps covering alarger area. These two base map areas have been designated the near-field andthe far-field areas. They are also characterized by having different samplinglocation coordinate systems, the near field using the SFC plant grid and thefar field using the land survey township-range-section grid found on the USGSmaps. (Futher details on the coordinate systems are in a later section.)
The sampling locations and results on (in most cases) the original overlayshave been superimposed on base maps and are included here (reduced in size) asFigures 5.2.7.1A through 5.2.7.24A. The significance of use of the originalsis that they reflect the location plotting done at the time, at the SFC, andthus they include the contribution to accuracy made by input of the individualswho personally collected the samples. Figures 5.2.7.1A through 5.2.7.4A showthe sampling locations for vegetation, soil, and water. Figures 5.2.7.5A through5.2.7.24A show the analysis results for vegetation and soil (results for watersampling are in Appendix 5.3.1). Results for grab samples are italicized.Some grab sample locations were resampled under the systematic sampling programand thus one location may have two results, for example, fluoride on vegeta-tion. For reproduction here, the overlays have been superimposed on basemapsredrawn to eliminate topography and other extraneous detail which tends toobscure the results.
Tables of Sampling Locations and Results
The plots of analysis results are followed by tables of the results. The tablesprovide the sample label, the coordinates (plant grid or township-range-section)*of the sample location, a designation of the organization which performed thesample analysis, the date the sample was collected, the type of analysis (i.e.,whether for uranium or for fluoride), the numerical result and its units, andcomments which call out unusual characteristics of the sample. Some sampleswere analyzed for alpha and beta radioactivity (rather than for uranium per se)and are listed accordingly.
268

At the time the samples were collected, some, taken near residences, werelabeled with the residents' names. To allow the residents some privacy, theselabels have been changed.
Tables 5.2.7.1A through 5.2.7.17A are listings by type of analysis (e.g., U or F)and by the analysis-performing organization. Tables 5.2.7.18A through 5.2.7.25Aare the same information sorted numerically and alphabetically by the sample label(to simplify looking up results by a location label); these tables also includewater sample results as found in Appendix 5.3.1.
Coordinate Systems
The near-field figures, e.g., Figure 5.2.7.1A, show the plant grid; the grid isin feet, with the lines shown being 1,000 feet apart. The plant buildings arein Section 21 of T12N, R21E; Highway 10 runs north-south on the east boundary ofSection 21. The southeast corner of Section 21 (which is in Highway 10) is thepoint on the plant grid which has coordinates N-10,O00, E-10,000. The N-10,O00line of the plant grid lies along the section line (in Highway 10). The avail-ability of maps with the plant grid superimposed made the plant grid a naturalchoice for the locations of near-field sampling.
Similarly, the availability of U.S. Geological Survey maps showing the sectionsand section lines made the township-range-section grid a natural choice for thelocations of far-field sampling. In Oklahoma, as in much of the United States,the land was surveyed in sections which are a square, one mile on each side.Where the topography permits, many roads and fences run on the section line, orat right angles to it at 1/2 or 1/4 of the section. Thus it is relatively simpleto determine one's location on a map which also shows the section lines. Thefar-field figures, e.g., Figure 5.2.7.3A, show the section lines, the townshipand range lines, and the section numbers of the sections adjoining the intersec-tions of the township and range lines. Figure 5.2.7.25A shows the sectionnumbering in each 6-mile by 6-mile township, and the relationship of the numbersof the sections with the numbers of adjacent sections. For purposes of designatinga sampling location more precisely than the nearest mile (section), an ad-hocdivision of sections into 1/14-mile subdivisions was made, with 14 strips designatedA through N from north to south, and 14 strips numbered 1 through 14 from westto east. This arrangement is shown in Figure 5.2.7.26A. This arrangementpermits designating a sample location to the nearest 1/14 mile, roughly 100 meters.
For its atmospheric dispersion simulation calculations, LLNL-ARAC chose to usethe Universal Transverse Mercator (UTM) coordinate system, which is also indicatedon the U.S. Geological Survey maps, in kilometers. The advantage of the UTMcoordinate system is that it is shown on the maps for long distances withoutsignificant corrections. (The plant grid is only shown for a few miles. Thetownship-range-section grid contains offsets at the T8N, T9N line and at theT12N, T13N line, and is significantly offset at the Oklahoma-Arkansas border.)A difficulty with the UTM coordinate system is that it is set about 1.2 degreesof angle counterclockwise from the section lines at the plant site, and theangular difference changes slightly over long distances. For reference, thesoutheast corner of Section 21, T12N, R21E (N-10,000; E-10,O00 on the plant grid)is approximately at UTM 3929.49N, 311.41E (coordinates in km). Figures 4.1.2.7,4.1.3.1, 4.1.2.28A and 4.1.2.29A, show both the UTM coordinate grid and thetownship-range-section grid.
269
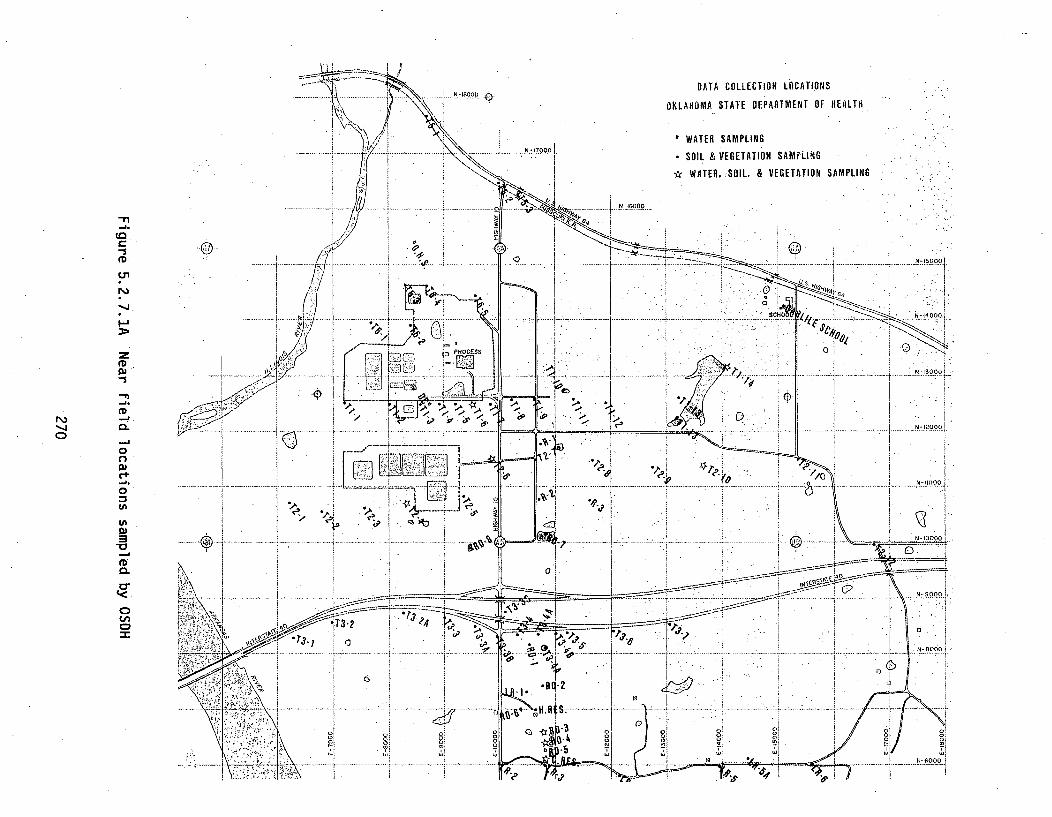
A --. -- -- ---- oo --V DATA COLLECTION LOCATIONS
S "OKLAHOMA STATE DEPARTMENT OF HEALTH
0WATER SAMPLING
/ - -.NJIS~PL •SOIL & VEGETATION SAMPLING
, WATER, SOIL, & VEGETATION SAMPLIN
------ -. - ------ / -
,. . ..r
-',,I4~ t ,i o,.,........
:0 •-.t I .".it' I°"'0 -
0
,, LI • KK__
.- ---.. .....
J,, " .. ; i ..
. .. .... ... ... .. ........... ..... .. I ,...... •.. ..
M.
00*
0 .......
0~~- -------- - (
= E '4 .

-n
CDp1
N- 17000
-.. 101 02
N-I85000
-7-c
DATA CMLLECT'ng ?OCAT!ONSSEOUOYAH FUELS CORP
WOTER SAMPLING
•So F-VEGETATfnN SAMPLING
• WATER. SOIL. & VEGETATION SAMPLING
t5~*
N-14000O
0)03m
0
C+
0
(4*
Cn0l
f~20
P.
-204 205 206________ It +-
~ge igg 4
198 199 200!
,60 N-12000
W-7I
',q
15 151
"7--114
115 1151 0
II i
Fý
I
N-0000
~'?40
14* I,____
K14,
'4
-q 7','.ff t
43
01
r W-1.2
111ýp
e *13
I-
! I / ooi I Soo
! ~N-60008! -
ol
Si 'I
N
o
-'--1----- 1

r.3-",,i
-n.
(0
C+
(D
r-a
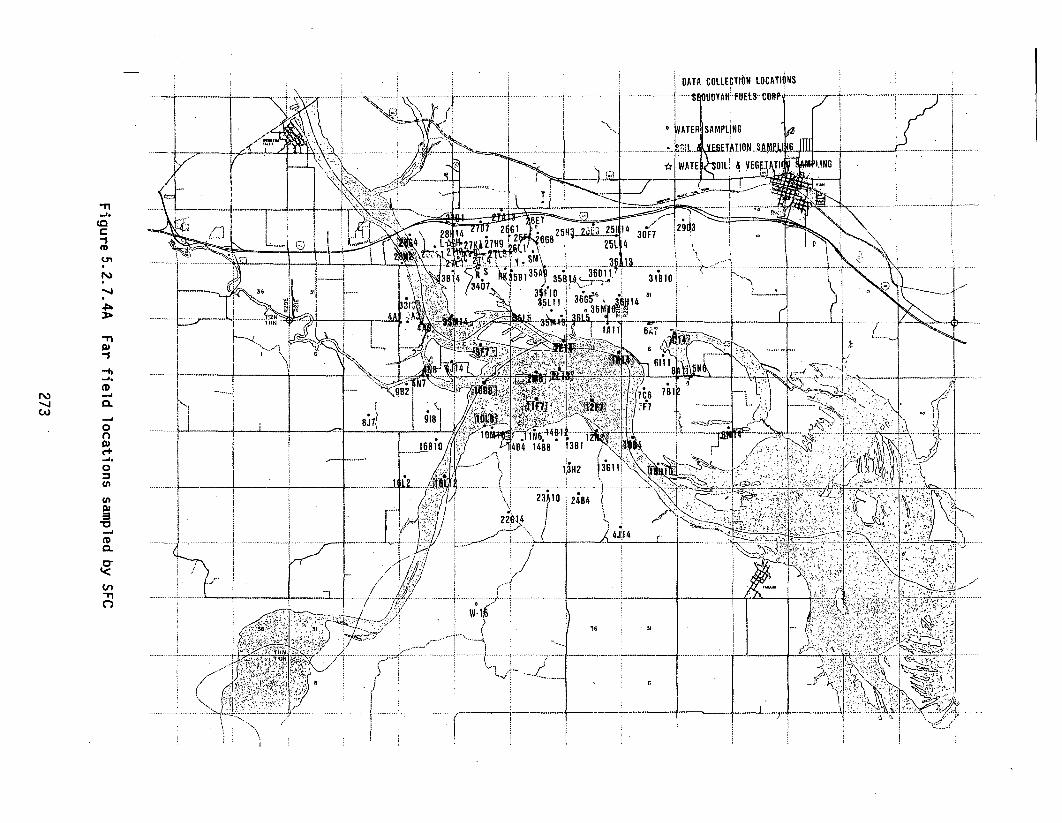
DATA COLLE T16PJ LOCATIONS-- ------_ _ - - - -- - -- - -- - - I lO Y A I-FU EL S - C O R F ---- --- ----------
0 TER SAMP1 NG
TTTT O--4_3 p IGI----------------- -- 1 --~ 3---- 10---
367
226
35A
51.1
II I 9
1691
ln -- ----------
_____ _ _3111
22 1
U)~~~ - ,A12
------- -- ---- . ... .. ----c 1r
l_<_ _ _ I
(n- '~ _ __ _ _ _ _x
-4
C1
0)
0
CL
e.4
0

U,o
(n
-5.
0
U-,
(D(aC+
Wn
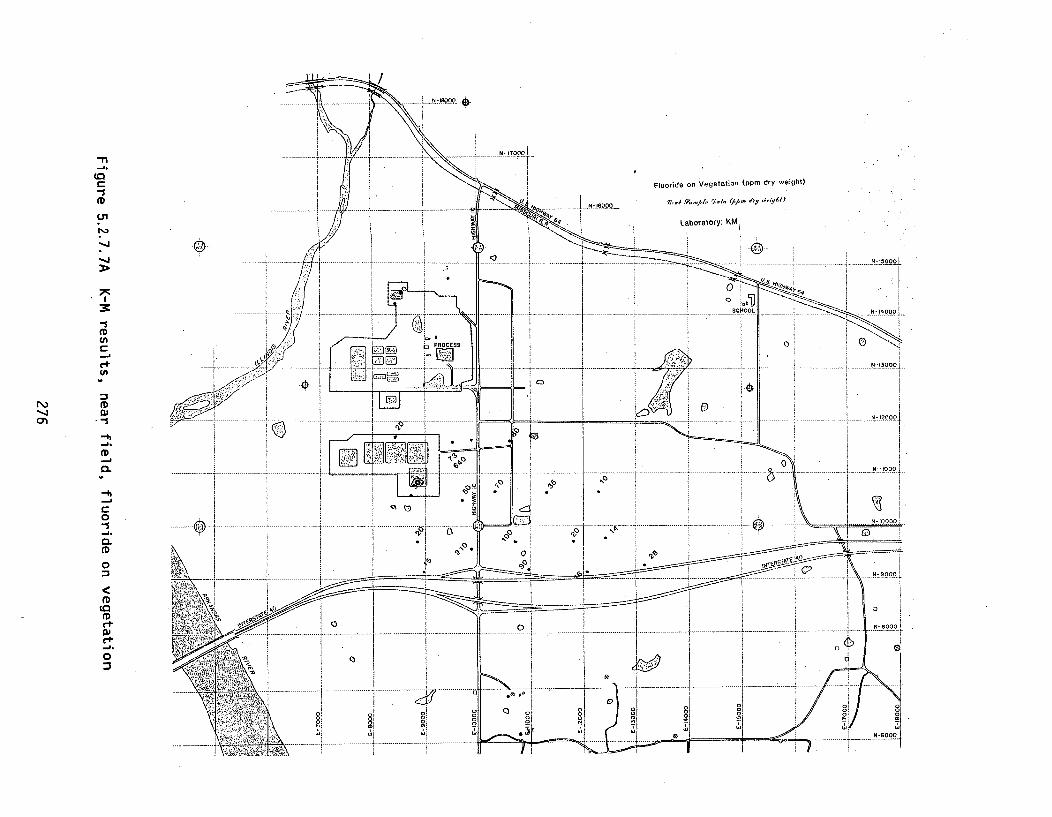
-n.
(D
(DU)
('A
(D
0nCL
fl)
0
(a.
C+
0
0J
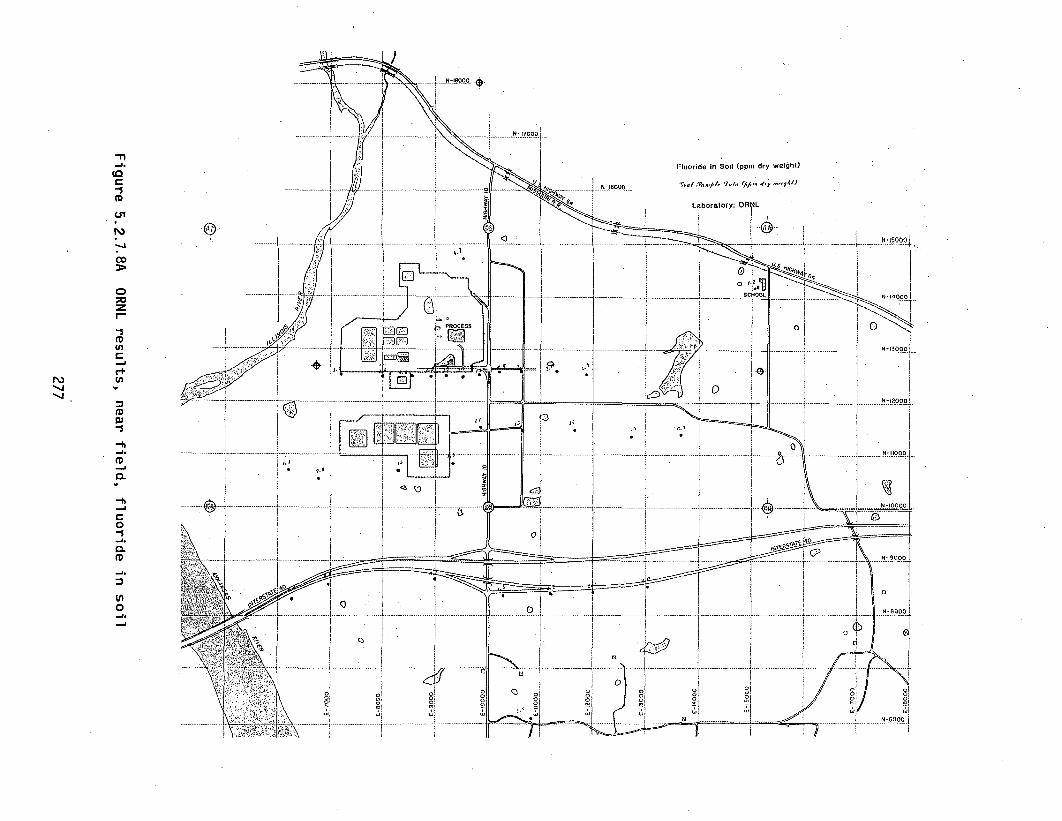
I\3'-.1-4
-..1
C+
~1
0s
CL
cn
:3
0
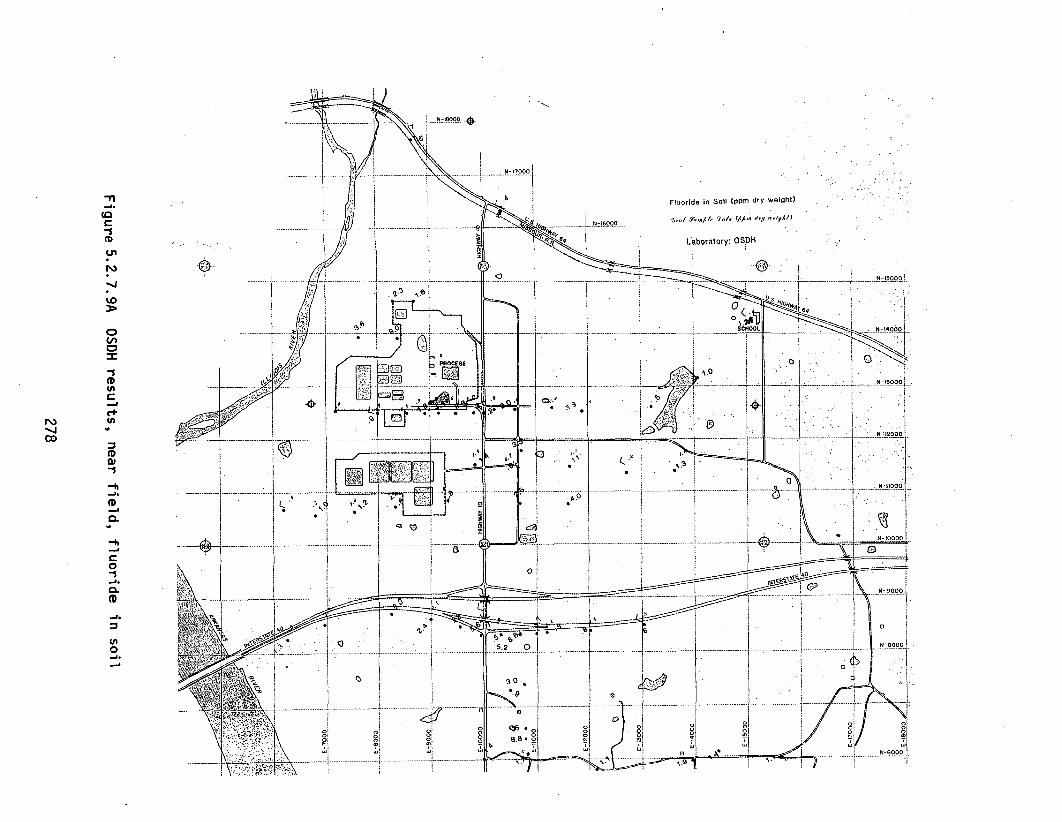
N-WqOOe .
-n
C+
-s
m
F!uoride in Soil (ppm dry weight)
I Lao-!Woy O6000•
Laboratory: OS.H
~2
- - -
.i
----- ----- --
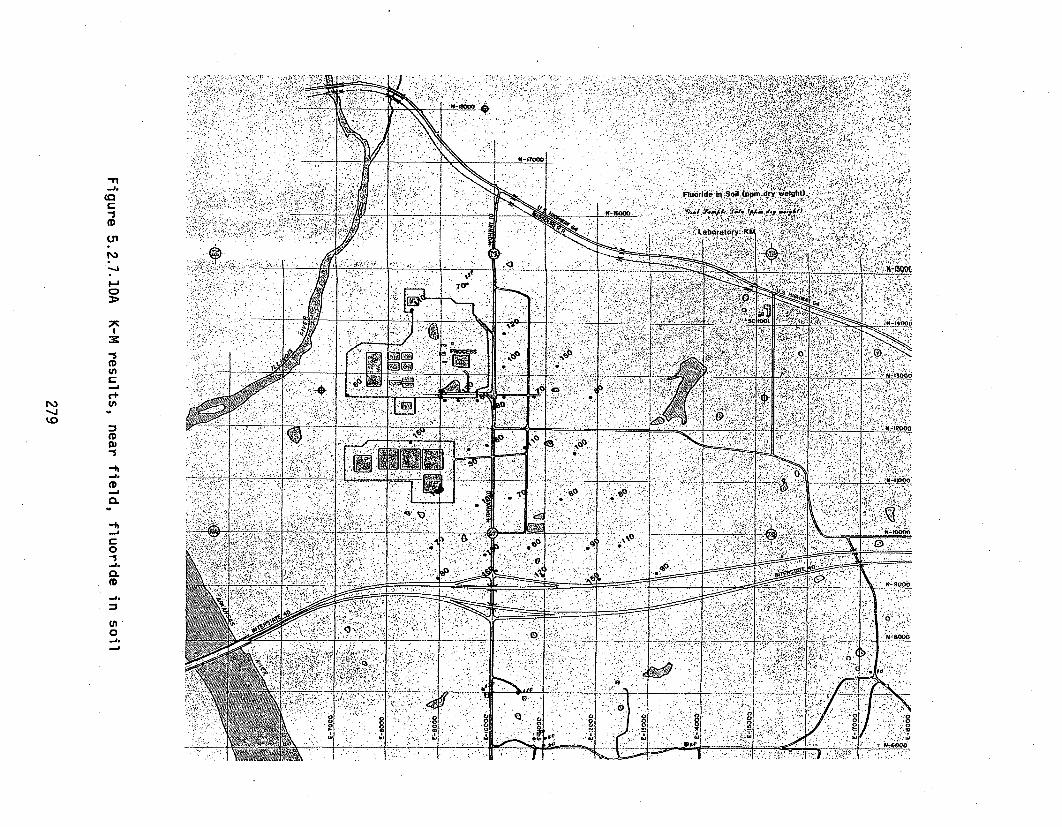
Fluoride inr Soil (Ppm dry wýeight)
Laboratory Klý
-s
CD
0
In
ICD
(D
14000
0
N -12000
1[
91. 10000l~lO
91-91000
'U,'I

N - 17000
CD
0;0
I-(A
coC)
0.
C+0)
C+
0
=1
Uranium on Vegetation (ppm dry weight)
Labor atOryt ORNL
(b
0
.0
0. a
0. a
----------
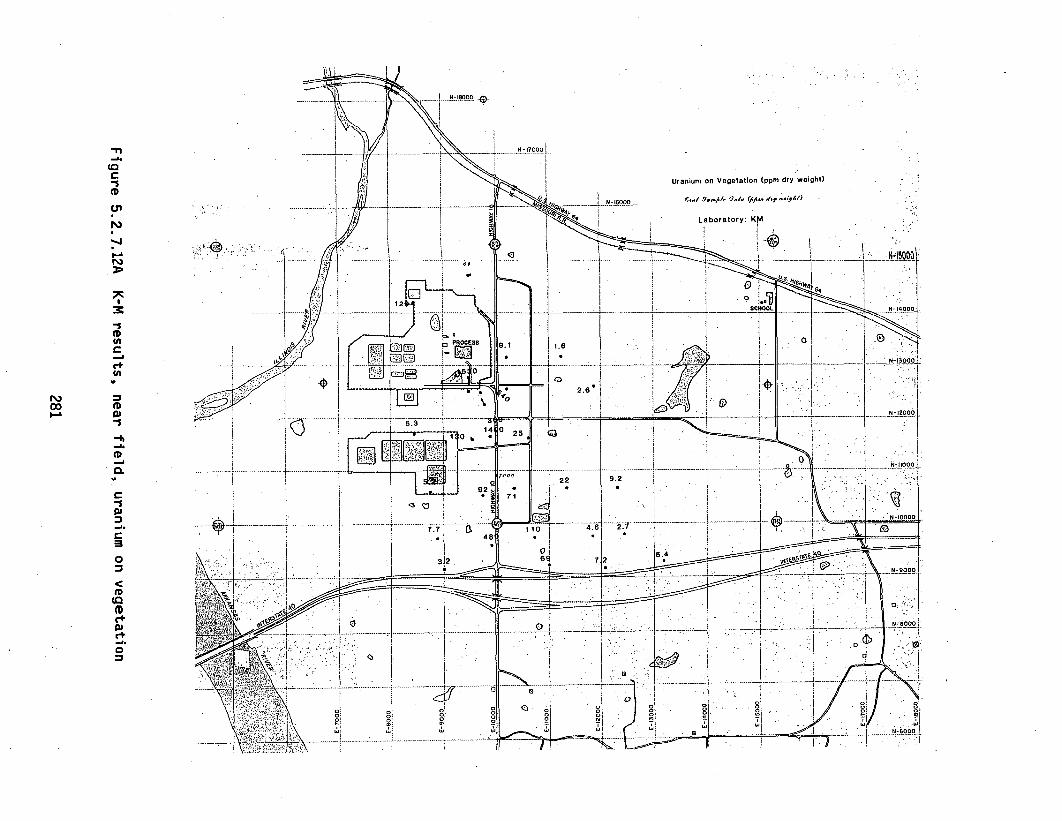
-n.
Co
C+
NI
00
C+
0)
C+
Uranium on Vegetation (ppm dry weight)
Laboratory: K tA
4-
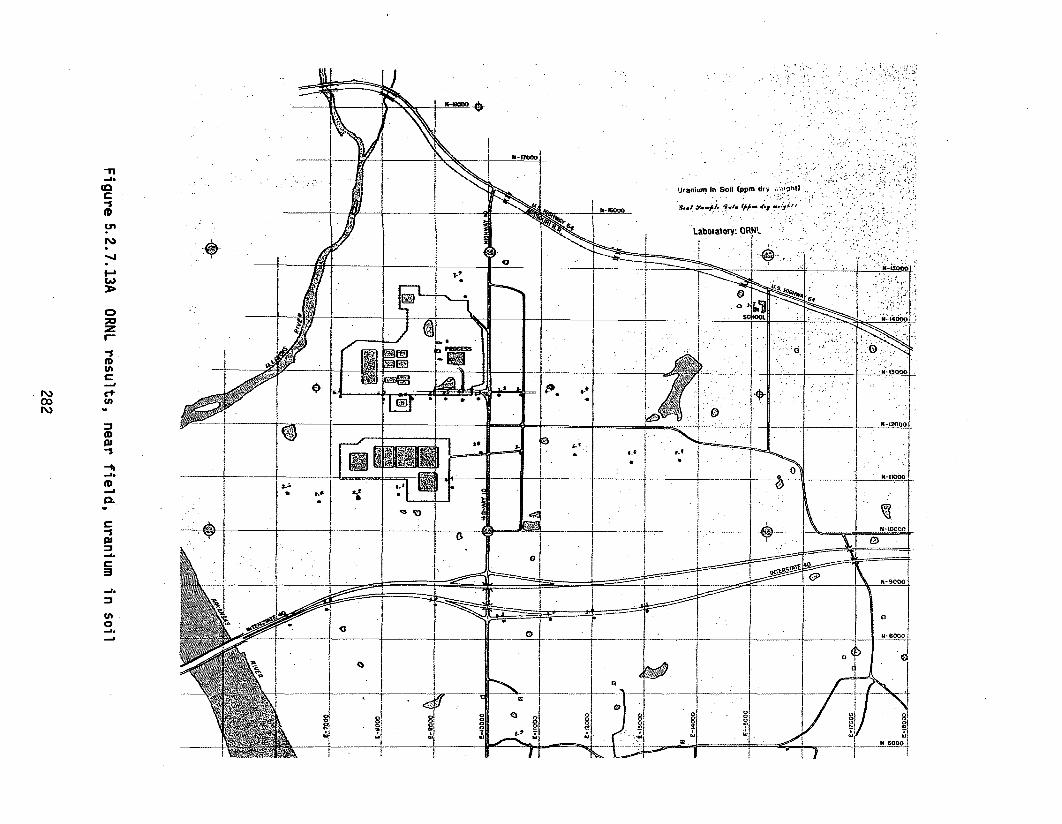
rP%
'1-9.
(0
(3
U'
CL
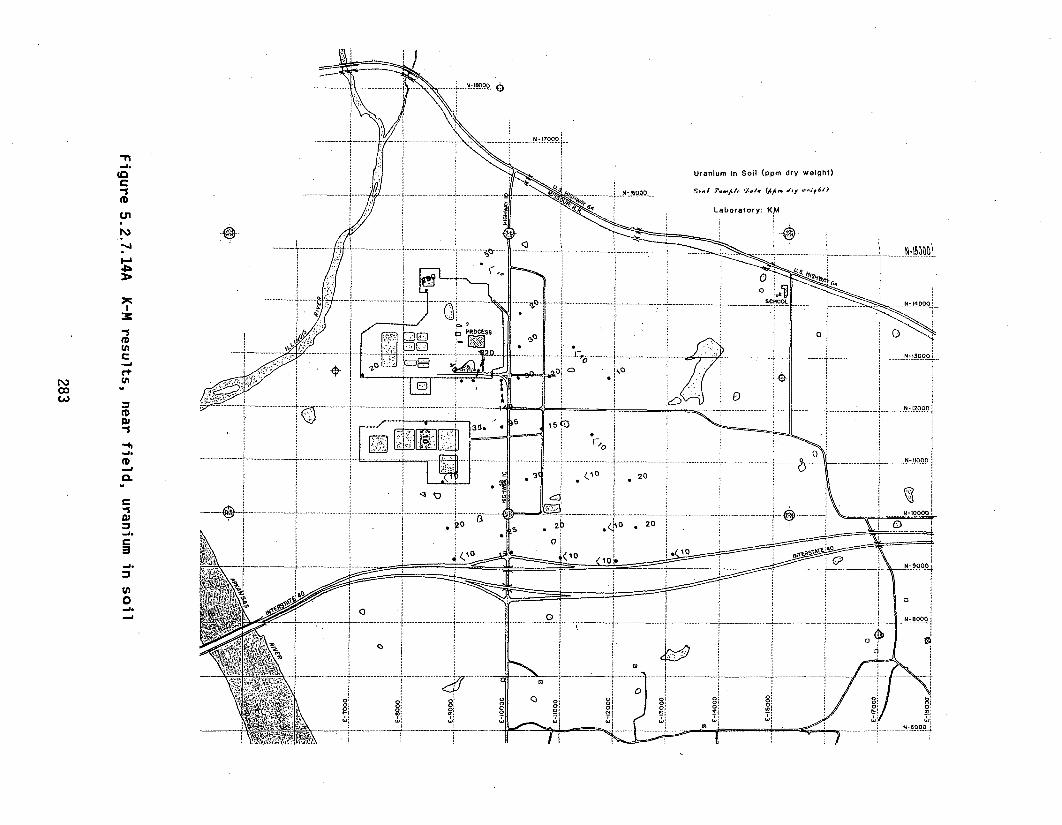
'N,00w,,
-n-I.ci
CD
U'
r%3-II-a
z
-ICDEfl
(n
CDDi
-a.CD-aa-
C
Di-a.C5a.
En0-a

N)
-a.
U,
U,
0
M
En
C+
a)
C+
03
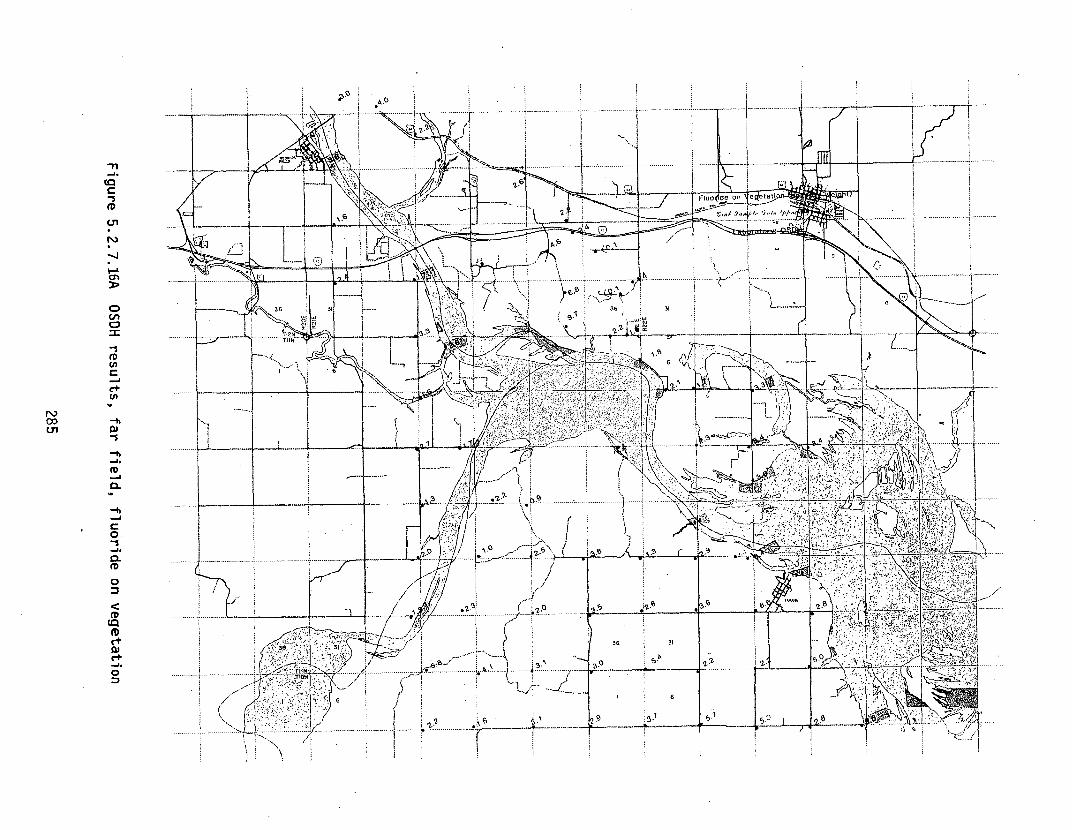
N)100C.n
Cn
0
C+
0w
Cd,
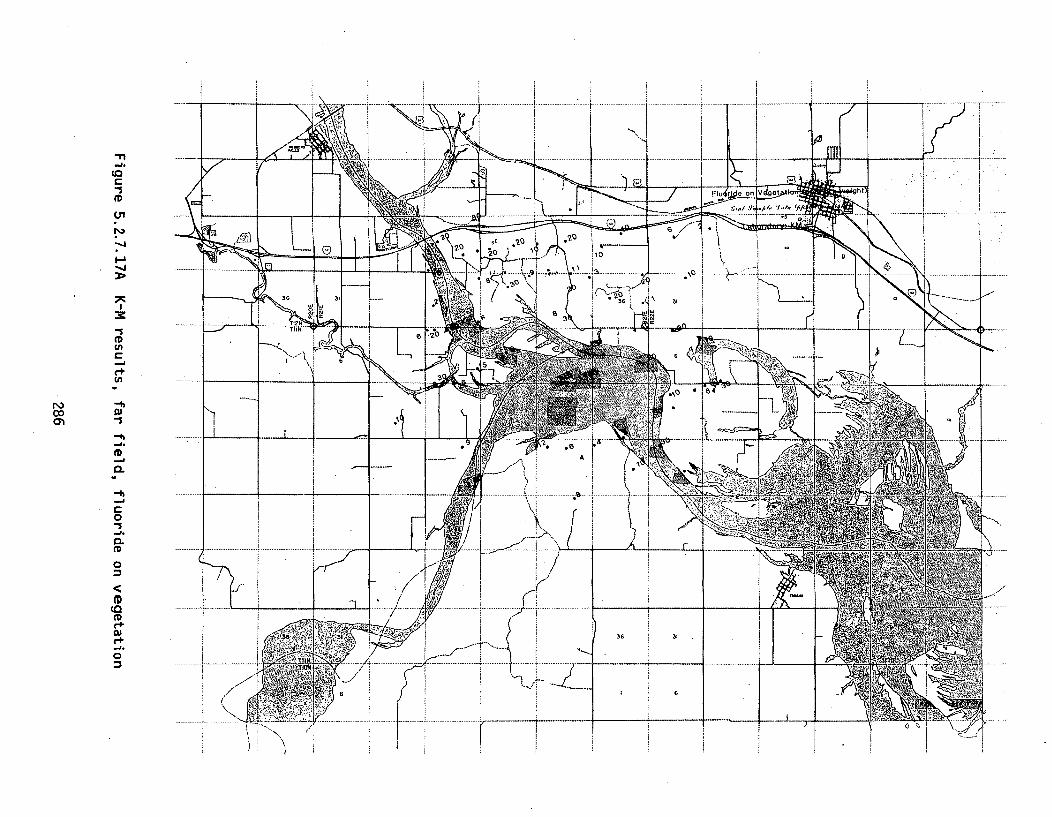
-n 111r
1,w
0~0-aD
---------- ------------------
36.3
C+
00-3ts
0
CL4-- - --- - -- -- -- -- ---. -- -

Cp;a
C+
I-
-1
(0CD
0
S.
__'
'.
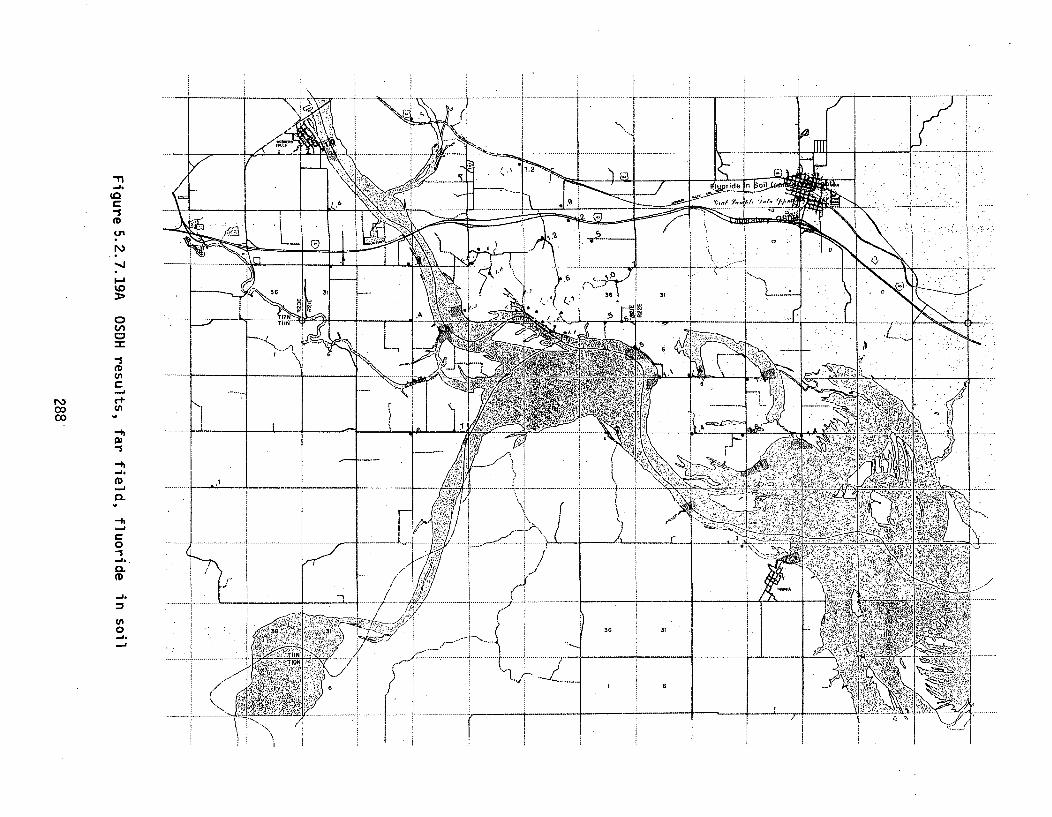
-- -----
----- --
000
00
CL
-- --------
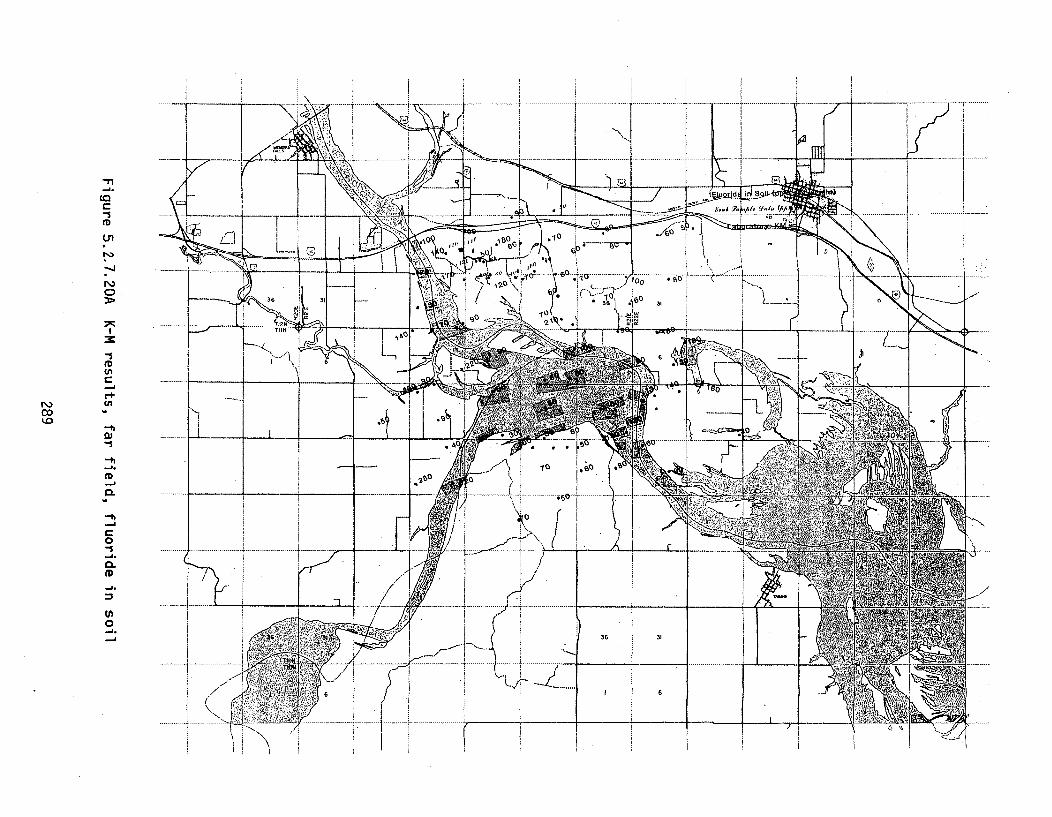
(0l
-nCoC-sen(.71
-.1
0
-1enC-a
-5
-a.en-D
0.
-JC0-s0.en-a.
0
A
-----------31
QN-----------
IN -
----------- ---- --- ---- -------- ------ -- --- T--
------- --- ----------
- -- -------- ---
-----------
36 31
......!•i42---- -----
;Awl
--- -- - ------
ids
---------- ----
luo
Ij&
iI
.. . .../
T 1 .- .. .. .. ..T ý/
--- ---- --- -- -- -----
/.
/
-- --- -/ -
-- ------ -- -- -- -- ----
----- ----
- - -- - --------
-71, -
----------
36 31
S 6
7/
7"---
I --f
/
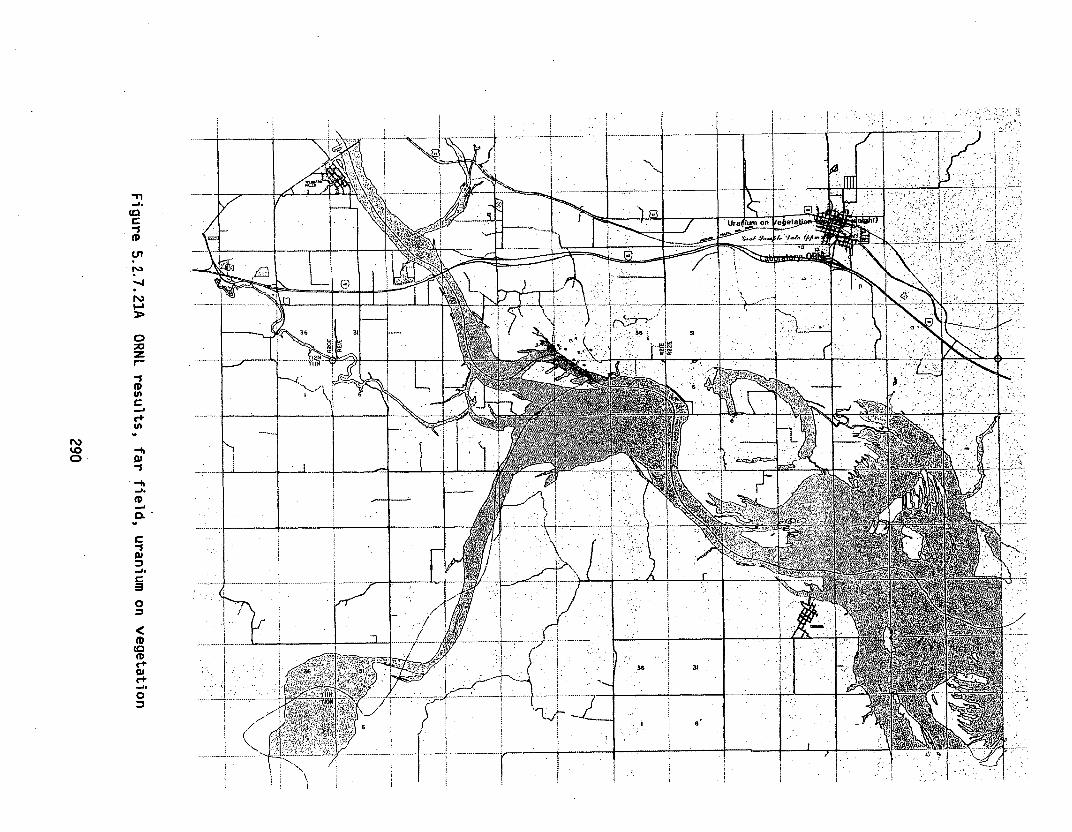
IN-
7~&rz4Y~
r1340
-I,
'p
c.n
0
z
-1'Pcn
(~4*(n
-9'0~1-9'-I.
'P~.8
0.
-10-I.
0
'P(0'P
0
0
4- -- ---- --- ------
L ------ JLý
31
L P. Aiým on
-
V-I
36 31
o ici
IN y. ... .. ..... I
SJ
---I-
I.
t -,
) ______
V __
V.___
1~•i J 1i• ..
~'-
A,,!,AK
I--
Th
1-
-----------
----- ------------- --- -- --------
LI
.
-7m
I " 3
36 31
__6
f
i
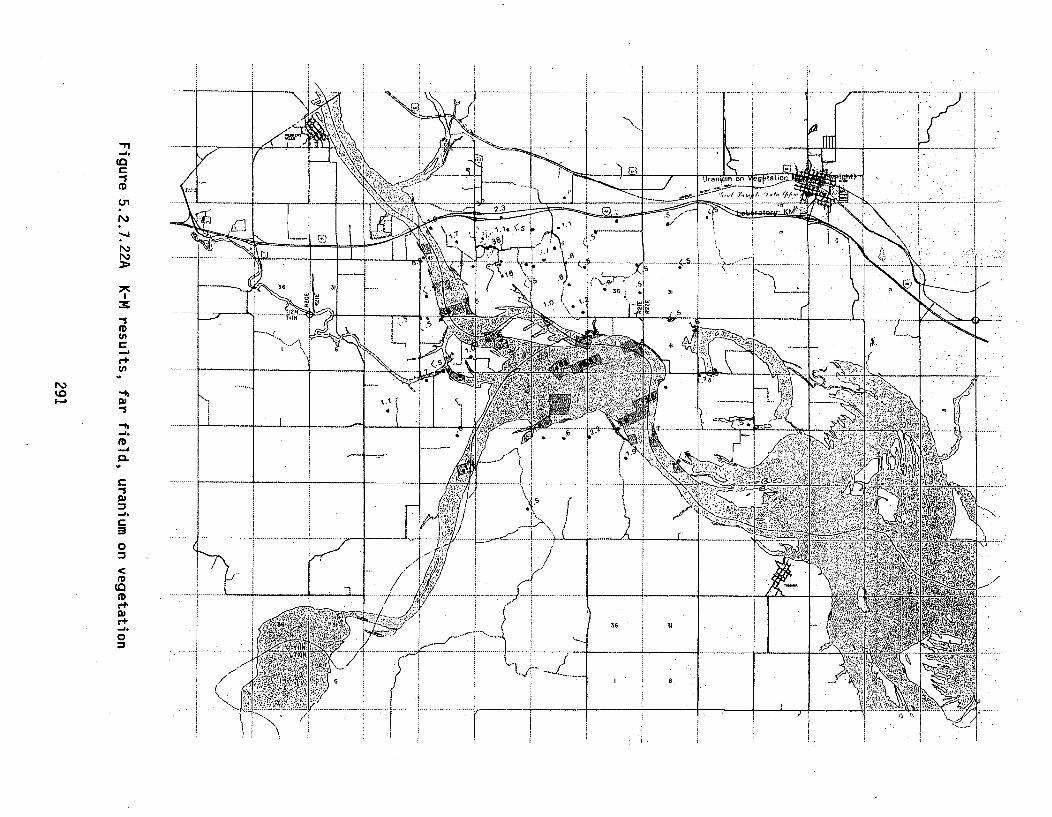
-n,
-J.
(D
C+
C+
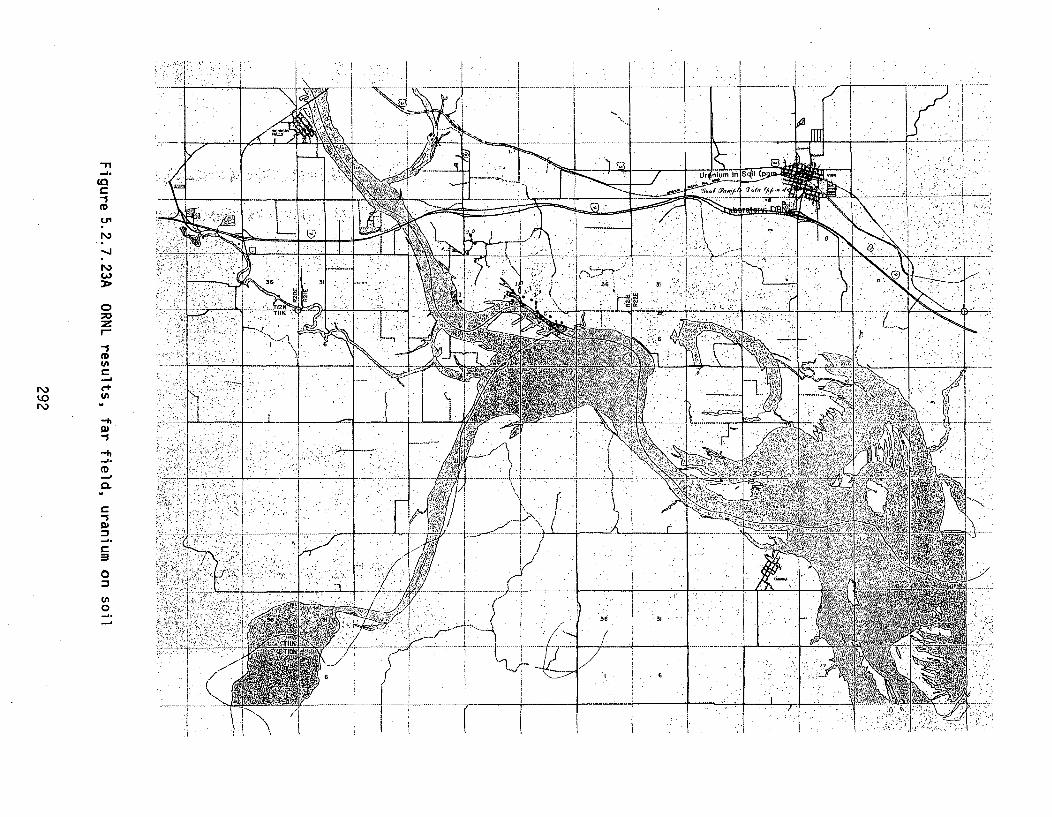
N)t.0N),
-I.
C
CDulN)
N)
0
z-sCD
C
'-4.
cn
0'-1
CD
0~
C-50)
C
0
cn0
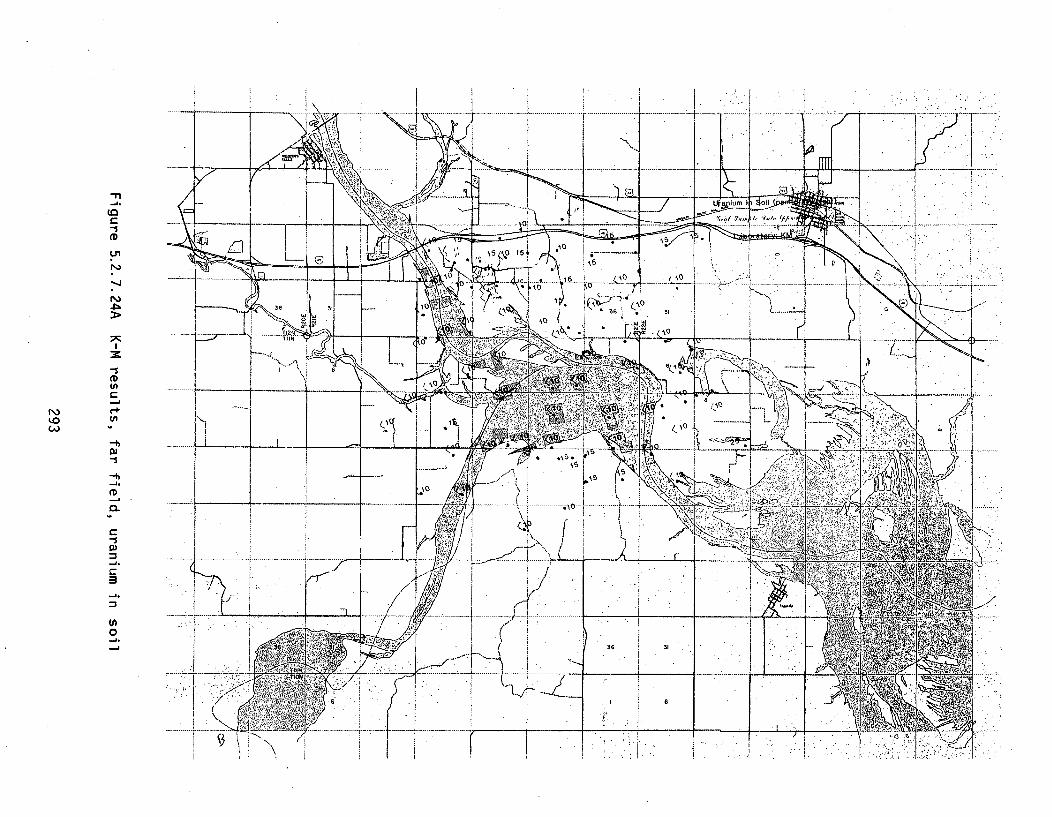
N0
-I,-4.
CoC-1(D
U,
C
(n
0-1
-ti-I.
0.
C
0
=
-a.
cn0-4.
----- -- --------
- -- - - - ----- ---- -
-- -- ----- -
5/ip 1
'1
-------- -- -----
31
1,
60L
_Q --- --- ...
-S
~
1" S.
A .. ~ 'I
eli
-IT .-
II [.; I
Ik; , I - , 4
31
3'
-'~ 3<.
7~4~
PI7.

w10 U1'IiC-
33
q- C-4
T1;Ti11
P1N 36 31 32 34 135 136 1311 - - -DI -
IN 1 6 5 4 3 2 1 6
12 7 8 9 10 11 12 7
13 18 17 16 15 14 .13 18
24 19 20 21 22 23 24 19
25 30 29 28 27 26 25 30
IN 36 31 32 33 34 35 36 31-- --TiTION 1 2 11 6
Arrangement of Sections(one mile square) byTownship and Range
Figure 5.2.7.25A Township-Range-Section grid
1 2 3 4 5 6 7 8 9 1011121314AB
DCF ii - -
GH
J
KLMN
Subsection Designations(subdivision = 1/14 mile)
Figure 5.2.7.26A Grid for subsection designations
294
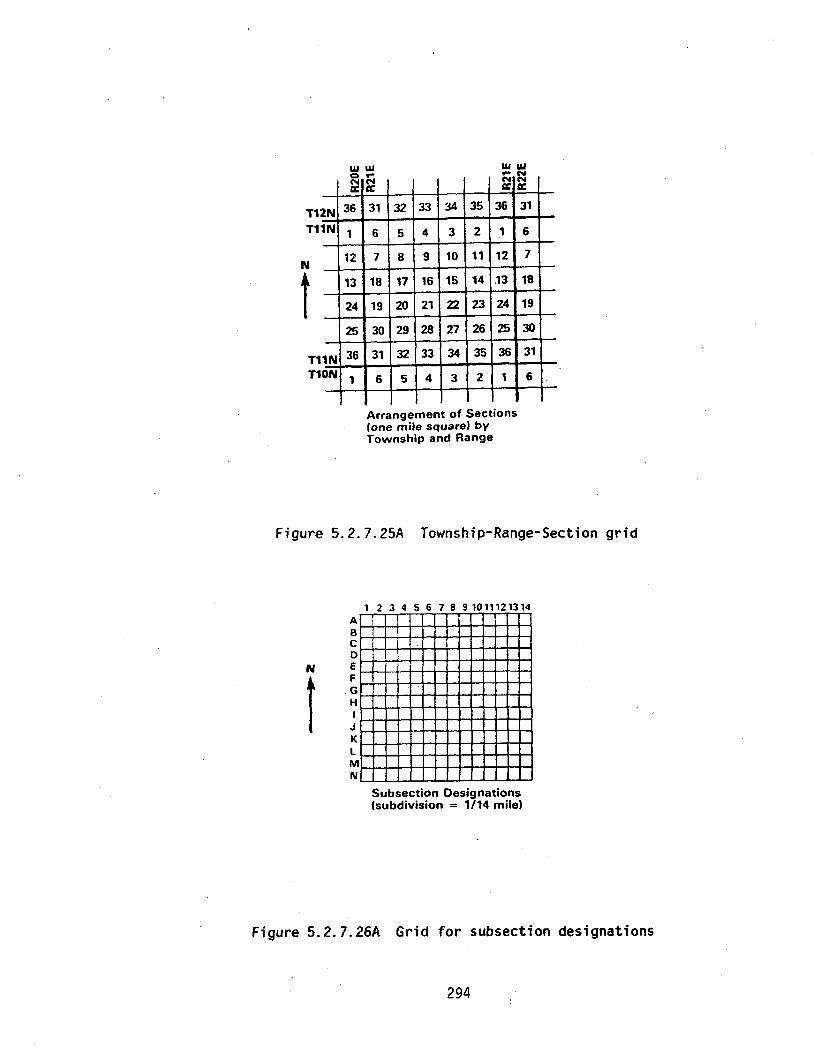
T1TI
3w 31
36 j31
V- (NC41 04
32 t33 t34 T35IN 1 6 5 4 3 2 1 6
12 7 8 9 10 11 12 7
13 18 17 16 15 14 .13 18
24 19 20 21 22 23 24 19
25 30 29 28 27 26 25 30
IN 36 31 32 33 34 35 36 31T1TI ON 1 6j5 4 1 6
Arrangement of Sections(one mile square) byTownship and Range
Figure 5.2.7.25A Township-Range-Section grid
Subsection Designations(subdivision = 1/14 mile)
Figure 5.2.7.26A Grid for subsection designations
294
RAW SOIL AND VEGETATION DATA
295
NEAR FIELD ENVIRONMENTAL SAMPLING RESULTS BY MEDIA AND TYPE ANALYSIS
296
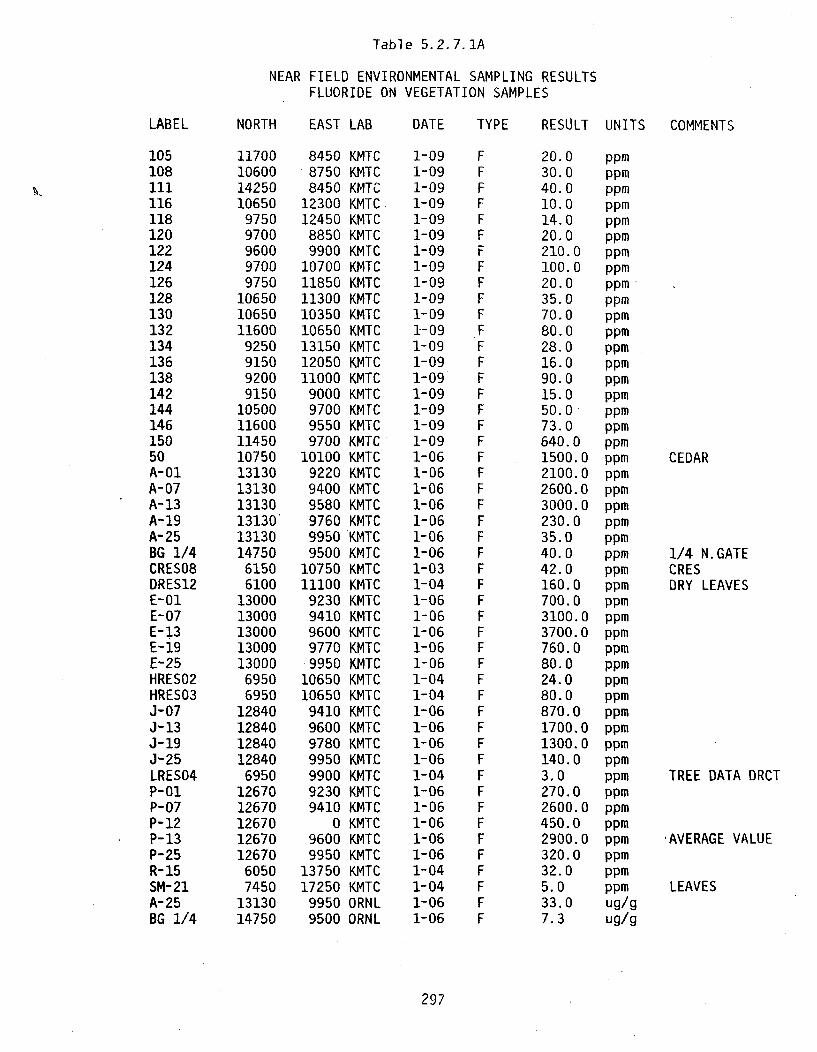
Table 5.2.7.1A
NEAR FIELD ENVIRONMENTAL SAMPLING RESULTSFLUORIDE ON VEGETATION SAMPLES
LABEL NORTH EAST LAB DATE TYPE RESULT UNITS COMMENTS
105108il111611812012212412612813013213413613814214414615050A-01A- 07A-13A-19A-25BG 1/4CRES08DRES12E-01E-07E- 13E-19E-25HRES02HRES03J-07J-13J-19J-25LRES04P-01P-07P-12P-13P-25R- 15SM-21A-25BG 1/4
11700106001425010650
97509700960097009750
1065010650116009250915092009150
10500116001145010750131301313013130131301313014750
61506100
1300013000130001300013000
69506950
128401284012840128406950
126701267012670126701267060507450
1313014750
845087508450
1230012450
88509900
1070011850113001035010650131501205011000
9000970095509700
10100922094009580976099509500
1075011100
9230941096009770
-99501065010650
9410960097809950990092309410
096009950
1375017250
99509500
KMTCKMTCKMTCKMTCKMTCKMTCKMTCKMTCKMTCKMTCKMTCKMTCKMTCKMTCKMTCKMTCKMTCKMTCKMTCKMTCKMTCKMTCKMTCKMTCKMTCKMTCKMTCKMTCKMTCKMTCKMTCKMTCKMTCKMTCKMTCKMTCKMTCKMTCKMTCKMTCKMTCKMTCKMTCKMTCKMTCKMTCKMTCORNLORNL
1-091-091-091-091-091-091-091-091-091-091-091-091-091-091-091-091-091-091-091-061-061-061-061-061-061-061-031-041-061-061-061-061-061-041-041-061-061-061-061-041-061-061-061-061-061-041-041-061-06
20.030.040.010.014.020.0210.0100.020.035.070.080.028.016.090.015.050.073.0640.01500.02100.02600.03000.0230.035.040.042.0160.0700.03100.03700.0760.080.024.080.0870.01700.01300.0140.03.0270.02600.0450.02900.0320.032.05.033.07.3
ppmppmppmppmppmppmppmppmppmppmppmppmppmppmppmppmppmppmppmppmppmppmppmppmppmppmppmppmppmppmppmppmppmppmppmppmppmppmppmppmppmppmppmppmppmppmppmug/gug/g
CEDAR
1/4 N.GATECRESDRY LEAVES
TREE DATA DRCT
,AVERAGE VALUE
LEAVES
297
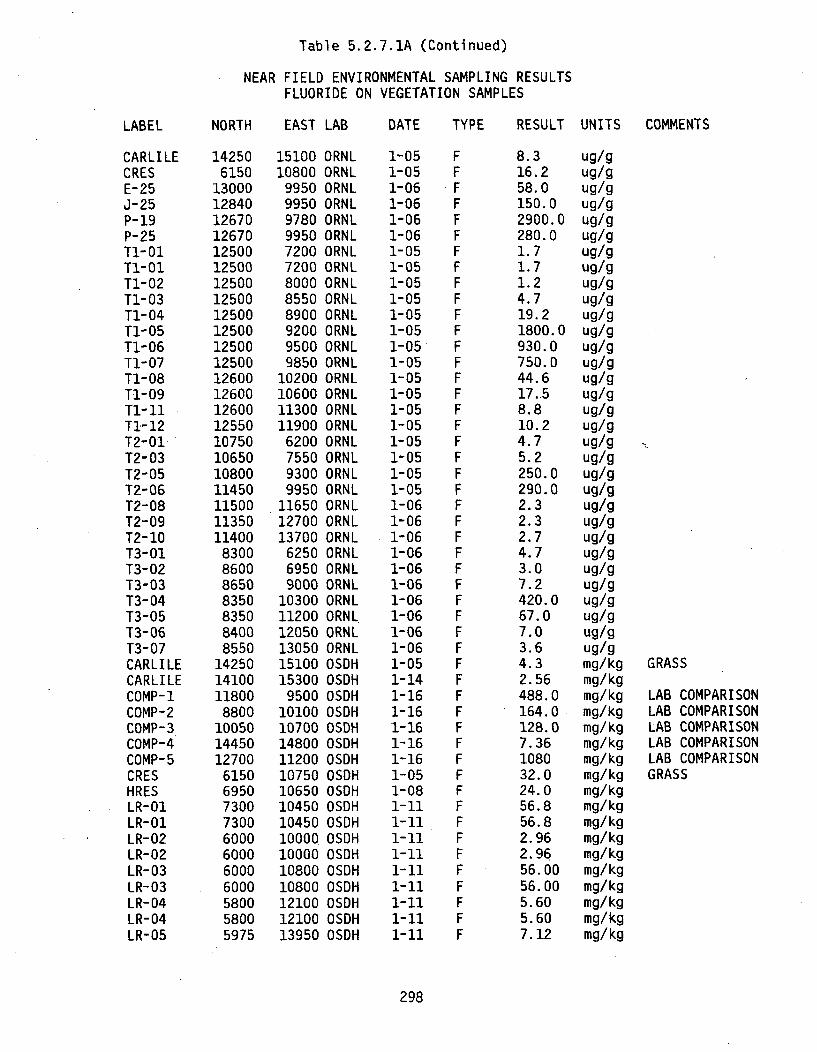
Table 5.2.7.1A (Continued)
NEAR FIELD ENVIRONMENTAL SAMPLING RESULTSFLUORIDE ON VEGETATION SAMPLES
LABEL
CARLILECRESE-25J-25P-19P-25TI-OlTI-OlT1-02Tl-03T1-04Tl-05Tl-06T1-07T1-08T1-09T1-11Tl-12T2-01T2-03T2-05T2-06T2-08T2-09T2-10T3-01T3-02T3-03T3-04T3-05T3-06T3-07CARLILECARLILECOMP-1COMP-2COMP-3COMP-4COMP-5CRESHRESLR-01LR-01LR-02LR-02LR-03LR-03LR-04LR-04LR-05
NORTH EAST LAB DATE TYPE RESULT UNITS COMMENTS
142506150
1300012840126701267012500125001250012500125001250012500125001260012600126001255010750106501080011450115001135011400
8300860086508350835084008550
142501410011800
8800100501445012700
61506950730073006000600060006000580058005975
1510010800.
995099509780995072007200800085508900920095009850
10200106001130011900
6200755093009950
116501270013700
625069509000
103001120012050130501510015300
9500101001070014800112001075010650104501045010000100001080010800121001210013950
ORNLORNLORNLORNLORNLORNLORNLORNLORNLORNLORNLORNLORNLORNLORNLORNLORNLORNLORNLORNLORNLORNLORNLORNLORNLORNLORNLORNLORNLORNLORNLORNLOSDHOSDHOSDHOSDHOSDHOSDHOSDHOSDHOSDHOSDHOSDHOSDHOSDHOSDHOSDHOSDHOSDHOSDH
1-051-051-061-061-061-061-051-051-051-051-051-051-051-051-051-051-051-051-051-051-051-051-061-061-061-061-061-061-061-061-061-061-051-141-161-161-161-161-161-051-08I-li1-111-II1-111-Il1-11I-Il
1-il
8.316.258.0150.02900.0280.01.71.71.24.719.21800.0930.0750.044.617.58.810.24.75.2250.0290.02.32.32.74.73.07.2420.067.07.03.64.32.56488.0164.0128.07.36108032.024.056.856.82.962.9656.0056.005.605.607.12
ug/gug/gug/gug/gug/gug/gug/gug/gug/gug/gug/gug/gug/gug/gug/gug/gug/gug/gug/gug/gug/gug/gug/gug/gug/gug/gug/gug/gug/gug/gug/gug/gmg/kgmg/kgmg/kgmg/kgmg/kgmg/kgmg/kgmg/kgmg/kgmg/kgmg/kgmg/kgmg/kgmg/kgmg/kgmg/kgmg/kgmg/kg
GRASS
LAB COMPARISONLAB COMPARISONLAB COMPARISONLAB COMPARISONLAB COMPARISONGRASS
298
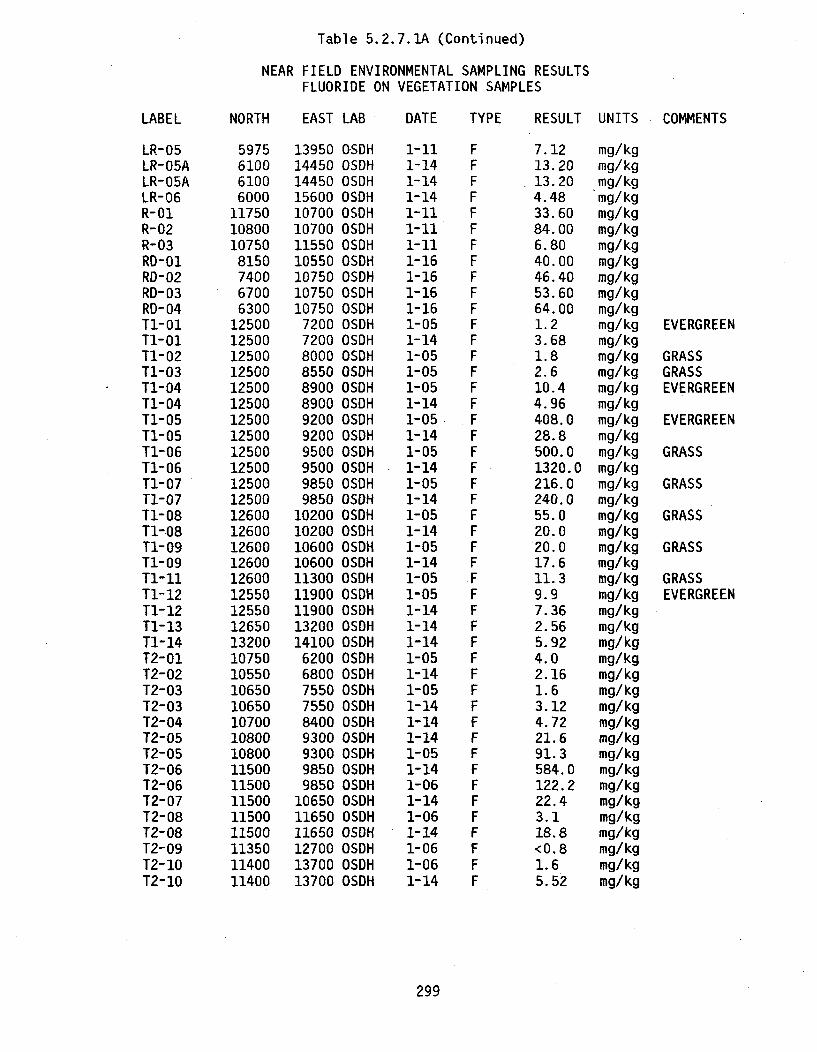
Table 5.2.7.1A (Continued)
NEAR FIELD ENVIRONMENTAL SAMPLING RESULTSFLUORIDE ON VEGETATION SAMPLES
LABEL
LR-05LR-05ALR-05ALR-06R-01R-02R-03RD-01RD-02RD-03RD-04T1-01T1-01T1-02T1-03Tl-04T1-04Tl-05T1-05T1-06T1-06T1-07T1-07Tl-08T1-08T1-09T1-09T1-11Tl-12Tl-12T1-13T1-14T2-01T2-02T2-03T2-03T2-04T2-05T2-05T2-06T2-06T2-07T2-08T2-08T2-09T2-10T2-10
NORTH EAST LAB DATE TYPE RESULT UNITS COMMENTS
5975610061006000
117501080010750
8150740067006300
125001250012500125001250012500125001250012500125001250012500126001260012600126001260012550125501265013200107501055010650106501070010800108001150011500115001150011500113501140011400
1395014450144501560010700107001155010550107501075010750
720072008000855089008900920092009500950098509850
102001020010600106001130011900119001320014100620068007550755084009300930098509850
106501165011650127001370013700
OSDHOSDHOSDHOSDHOSDHOSDHOSDHOSDHOSDHOSDHOSDHOSDHOSDHOSDHOSDHOSDHOSDHOSDHOSDHOSDHOSDHOSDHOSDHOSDHOSDHOSDHOSDHOSDHOSDHOSDHOSDHOSDHOSDHOSDHOSDHOSDHOSDHOSDHOSDHOSDHOSDHOSDHOSDHOSOHOSDHOSDHOSDH
1-111-141-141-141-111-11
1-111-161-161-161-161-051-141-051-051-051-141-051-141-051-141-051-141-051-141-051-14
1-051-051-141-141-141-051-141-051-141-141-141-051-141-061-141-061-14
1-061-061-14
7.1213.2013.204.4833.6084.006.8040.0046.4053.6064.001.23.681.82.610.44.96408.028.8500.01320.0216.0240.055.020.020.017.611.39.97.362.565.924.02.161.63.124.7221.691.3584.0122.222.43.118.8<0.81.65.52
mg/kgmg/kgmg/ kgmg/kgmg/kgmg/kgmg/kgmg/kgmg/kgmg/kgmg/kgmg/kgmg/kgmg/kgmg/kgmg/kgmg/kgmg/kgmg/kgmg/kgmg/kgmg/kgmg/kgmg/kgmg/kgmg/kgmg/kgmg/kgmg/kgmg/kgmg/kgmg/kgmg/kgmg/kgmg/kgmg/kgmg/kgmg/kgmg/kgmg/kgmg/kgmg/kgmg/kgmg/kgmg/kgmg/kgmg/kg
EVERGREEN
GRASSGRASSEVERGREEN
EVERGREEN
GRASS
GRASS
GRASS
GRASS
GRASSEVERGREEN
299
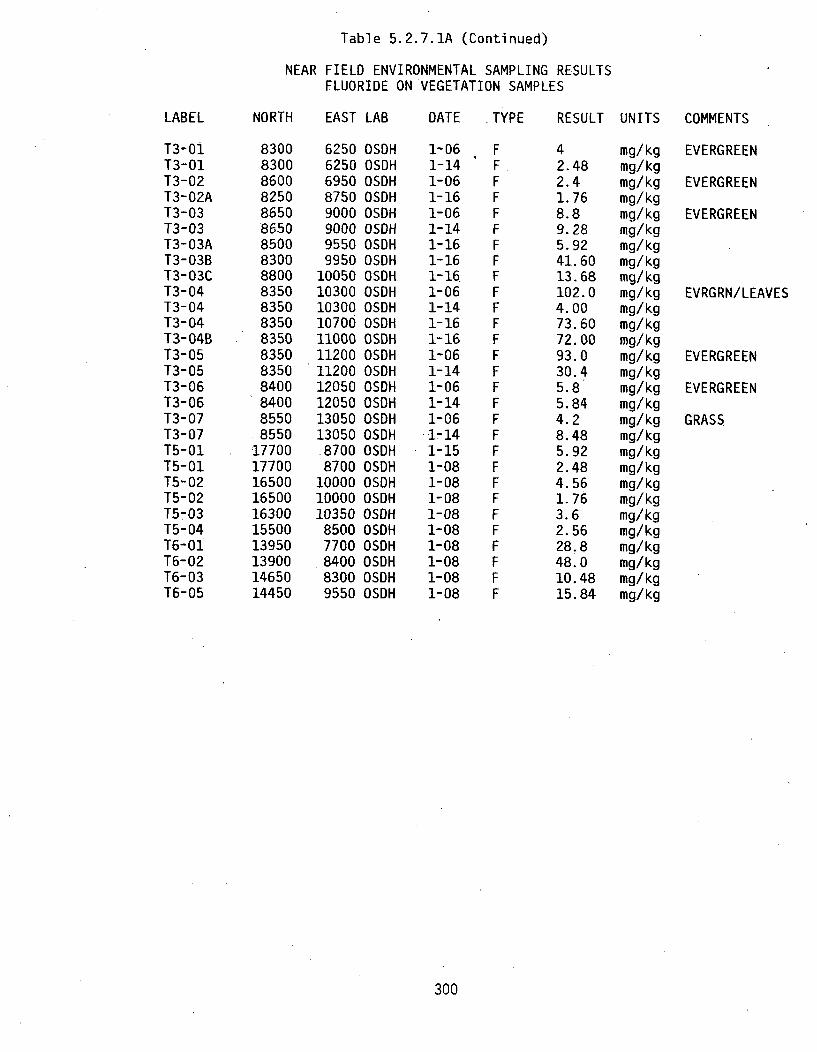
Table 5.2.7.1A (Continued)
NEAR FIELD ENVIRONMENTAL SAMPLING RESULTSFLUORIDE ONVEGETATION SAMPLES
LABEL
T3-01T3-01T3-02T3-02AT3-03T3-03T3-03AT3-03BT3-03CT3-04T3-04T3-04T3-04BT3-05T3-05T3-06T3-06T3-07T3-07T5-01T5-01T5-02T5-02T5-03T5-04T6-01T6-02T6-03T6-05
NORTH EAST LAB DATE TYPE RESULT UNITS COMMENTS
8300830086008250865086508500830088008350835083508350835083508400840085508550
17700177001650016500163001550013950139001465014450
62506250695087509000900095509950
1005010300103001070011000112001120012050120501305013050
87008700
1000010000
10350850077008400
83009550
OSDHOSDHOSDHOSDHOSDHOSDHOSDHOSDHOSDHOSDHOSDHOSDHOSDHOSDHOSDHOSDHOSDHOSDHOSDHOSDHOSDHOSDHOSDHOSDHOSDHOSDHOSDHOSDHOSDH
1-061-141-061-161-061-141-161-161-16.1-061-141-161-161-061-141-061-141-061-141-151-081-081-081-081-081-081-081-081-08
42.482.41.768.89.285.9241.6013.68102.04.0073.6072.0093.030.45.85.844.28.485.922.484.561.763.62.5628.848.010.4815.84
mg/kgmg/kgmg/kgmg/kgmg/kgmg/kgmg/kgmg/kgmg/kgmg/kgmg/kgmg/kgmg/kgmg/kgmg/kgmg/kgmg/kgmg/kgmg/kgmg/kgmg/kgmg/kgmg/kgmg/kgmg/kgmg/kgmg/kgmg/kgmg/kg
EVERGREEN
EVERGREEN
EVERGREEN
EVRGRN/LEAVES
EVERGREEN
EVERGREEN
GRASS
300
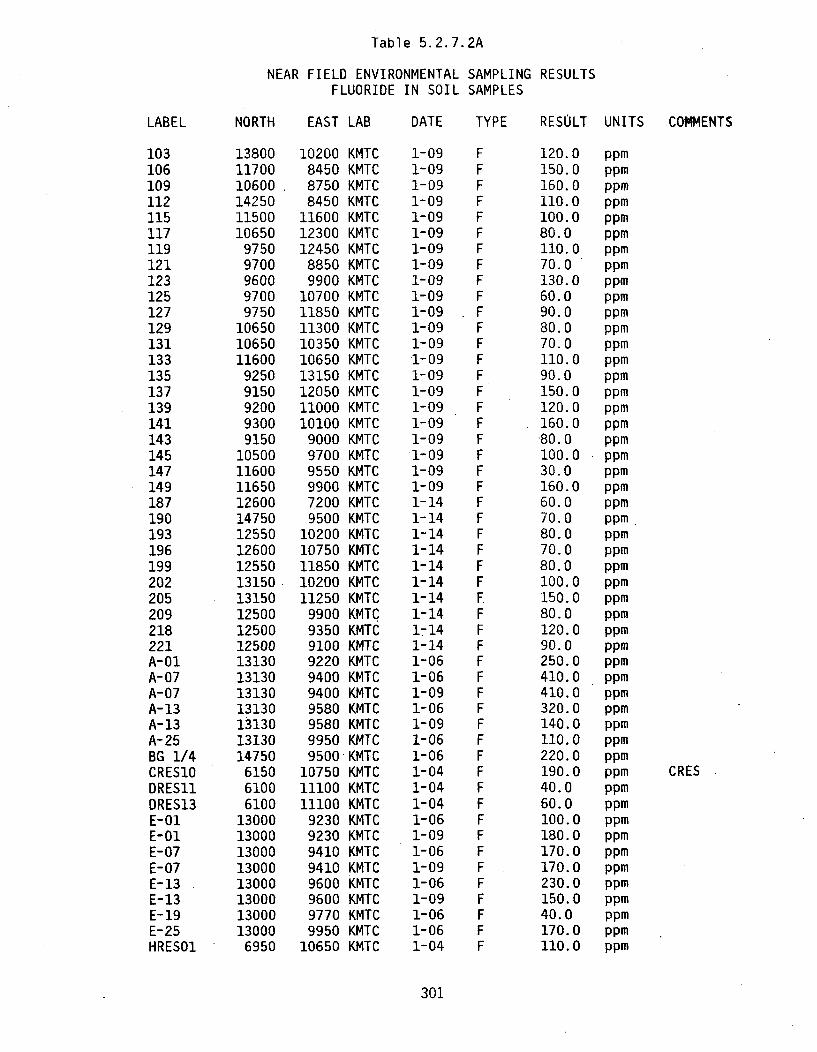
Table 5.2. 7.2A
NEAR FIELD ENVIRONMENTAL SAMPLING RESULTSFLUORIDE IN SOIL SAMPLES
LABEL
103106109112115117119121123125127129131133135137139141143145147149187190193196199202205209218221A-01A-07A-07A- 13A- 13A-25BG 1/4CRESlODRES11DRES13E- 01E-01E-07E-07E-13E-13E- 19E-25HRES01
NORTH EAST LAB DATE TYPE RESOLT UNITS COMMENTS
138001170010600142501150010650
97509700960097009750
106501065011600
92509150920093009150
1050011600116501260014750125501260012550131501315012500125001250013130131301313013130131301313014750
615061006100
1300013000130001300013000130001300013000
6950
10200845087508450
11600123001245088509900
107001185011300103501065013150120501100010100
900097009550990072009500
1020010750118501020011250
9900935091009220940094009580958099509500
107501110011100
92309230941094109600960097709950
10650
KMTCKMTCKMTCKMTCKMTCKMTCKMTCKMTCKMTCKMTCKMTCKMTCKMTCKMTCKMTCKMTCKMTCKMTCKMTCKMTCKMTCKMTCKMTCKMTCKMTCKMTCKMTCKMTCKMTCKMTCKMTCKMTCKMTCKMTCKMTCKMTCKMTCKMTCKMTCKMTCKMTCKMTCKMTCKMTCKMTCKMTCKMTCKMTCKMTCKMTCKMTC
1-091-091-091-091-091-091-091-091-091-091-091-091-091-091-091-091-091-091-091-091-091-091-141-141-141-141-141-141-141-141-141-141-061-061-091-061-091-061-061-041-041-041-061-091-061-091-061-091-061-061-04
120.0150.0160.0110.0100.080.0110.070.0130.060.090.080.070.0110.090.0150.0120.0160.080.0100.030.0160.060.070.080.070.080.0100.0150.080.0120.090.0250.0410.0410.0320.0140.0110.0220.0190.040.060.0100.0180.0170.0170.0230.0150.040.0170.0110.0
ppmppmppmppmppmppmppmppmppmppmppmppmppmppmppmppmppmppmppmppmppmppmppmppmppmppmppmppmppmppmppmppmppmppmppmppmppmppmppmppmppmppmppmppmppmppmppmppmppmppmppm
CRES
301

Table 5.2.7.2A (Continued)
NEAR FIELD ENVIRONMENTALFLUORIDE IN SOIL
NORTH EAST LAB DATE
SAMPLING RESULTSSAMPLES
LABEL
J-07J-07J-13J-13J-19J-25LRES05LRES06P-07P-07P-13P- 13P-19P-25R- 16SM-20A-25A-25BG 1/4BG 1/4CARLILECARLILECRESCRESE-25E-25J-25J-25P-19P-19P-25P-25T1-01T1-01T1-02T1-02T1-03T1-03T1-04T1-04TI-05Ti-05T1-06Tl-06T1-07T1-07T1-08T1-08T1-09T1-09T1-11
TYPE RESULT UNITS COMMENTS
128401284012840128401284012840
69506950
126701267012670126701267012670
60507450
131301313014750147501425014250
61506150
130001300012840128401267012670126701267012500125001250012500125001250012500125001250012500125001250012500125001260012600126001260012600
9410941096009600978099509900990094.1094109600960097809950
1375017250
9760976095009500
15100151001075010750
9950995099509950960096009780978072007200800080008550855089008900920092009500950098509850
1020010200106001060011300
KMTCKMTCKMTCKMTCKMTCKMTCKMTCKMTCKMTCKMTCKMTCKMTCKMTCKMTCKMTCKMTCORNLORNLORNLORNLORNLORNLORNLORNLORNLORNLORNLORNLORNLORNLORNLORNLORNLORNLORNLORNLORNLORNLORNLORNLORNLORNLORNLORNLORNLORNLORNLORNLORNLORNLORNL
1-061-091-061-091-061-061-041-041-061-091-061-091-061-061-041-041-061-061-061-061-051-051-051-051-061-061-061-061-061-061-061-061-051-051-051-051-051-051-051-051-051-051-051-051-051-051-051-051-051-051-05
150.0180.0220.0200.090.0110.0120.060.0300.0170.050.0290.0210.090.080.040.09.011.43.74.71.20.81.92.87.48.68.311.228.732.814.221.03.12.31.41.24.23.47.55.723.517.722.526.312.222.86.65.12.11.77.6
ppmppmppmppmppmppmppmppmppmppmppmppmppmppmppmppmug/gug/gug/gug/gug/gug/gug/gug/gug/gug/gug/gug/gug/gug/gug/gug/gug/gug/gug/gug/gug/gug/gug/gug/gug/gug/gug/gug/gug/gug/gug/gug/gug/gug/gug/g
WETDRYWETDRYDRYWETWETDRYWETDRYWETDRYWETDRYWETDRYDRYWETDRYWETDRYWETDRYWETDRYWETWETDRYWETDRYDRYWETDRYWETDRY
302
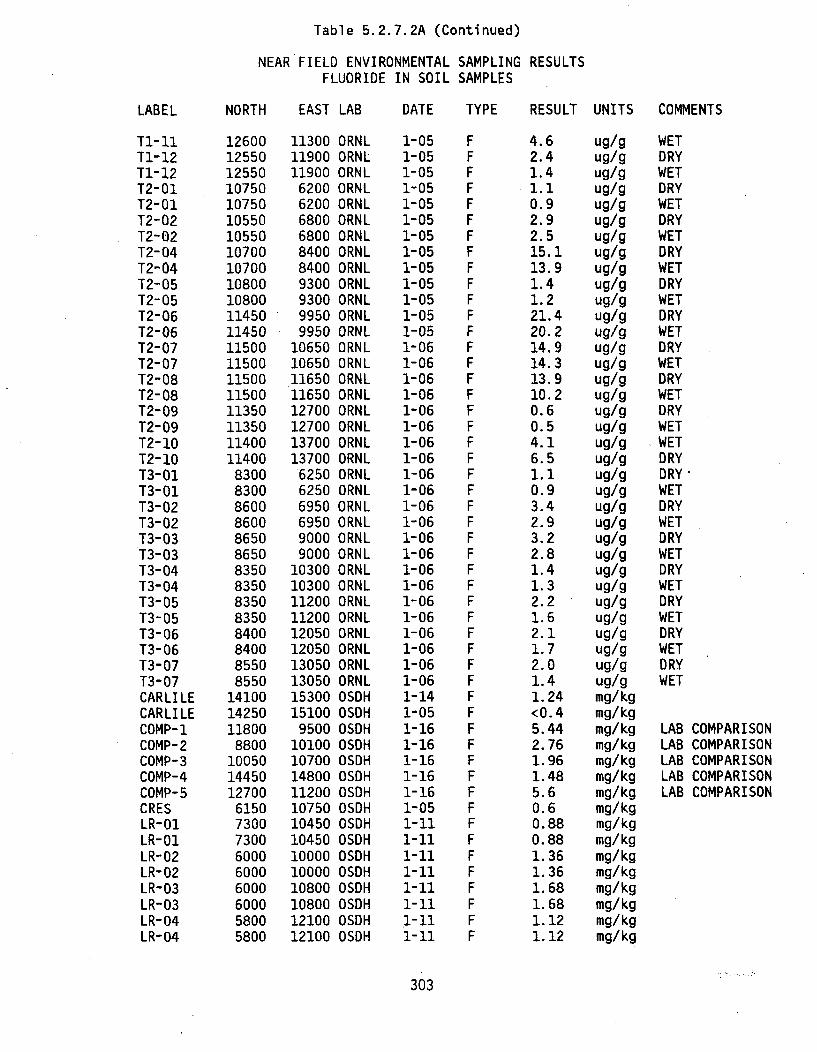
Table 5.2.7.2A (Continued)
NEAR FIELD ENVIRONMENTALFLUORIDE IN SOIL
NORTH EAST LAB DATE
SAMPLING RESULTSSAMPLES
LABEL
T1-11T1-12T1-12T2-01T2-01T2-02T2-02T2-04T2-04T2-05T2-05T2-06T2-06T2-07T2-07T2-08T2-08T2-09T2-09T2-10T2-10T3-01T3-01T3-02T3-02T3-03T3-03T3-04T3-04T3-05T3-05T3-06T3-06T3-07T3-07CARLILECARLILECOMP-1COMP-2COMP-3COMP-4COMP-5CRESLR-01LR-01LR-02LR-02LR-03LR-03LR-04LR-04
TYPE RESULT UNITS COMMENTS
126001255012550107501075010550105501070010700108001080011450114501150011500115001150011350113501140011400
83008300860086008650865083508350835083508400840085508550
141001425011800
8800100501445012700
615073007300600060006000600058005800
113001190011900
6200620068006800840084009300930099509950
1065010650116501165012700127001370013700
625062506950695090009000
10300103001120011200120501205013050130501530015100
950010100107001480011200107501045010450100001000010800108001210012100
ORNLORNLORNLORNLORNLORNLORNLORNLORNLORNLORNLORNLORNLORNLORNLORNLORNLORNLORNLORNLORNLORNLORNLORNLORNLORNLORNLORNLORNLORNLORNLORNLORNLORNLORNLOSDHOSDHOSDHOSDHOSDHOSDHOSDHOSDHOSDHOSDHOSDHOSDHOSDHOSDHOSDHOSDH
1-051-051-051-051-051-051-051-051-051-051-051-051-051-061-061-061-061-061-061-061-061-061-061-061-061-061-061-061-061-061-061-061-061-061-061-141-051-161-161-161-161-161-051-111-111-111-111-111-111-111-11
4.62.41.41.10.92.92.515.113.91.41.221.420.214.914.313.910.20.60.54.16.51.10.93.42.93.22.81.41.32.21.62.11.72.01.41.24<0.45.442.761.961.485.60.60.880.881.361.361.681.681.121.12
ug/gug/gug/gug/gug/gug/gug/gug/gug/gug/gug/gug/gug/gug/gug/gug/gug/gug/gug/gug/gug/gug/gug/gug/gug/gug/gug/gug/gug/gug/gug/gug/gug/gug/gug/gmg/kgmg/kgmg/kgmg/kgmg/kgmg/kgmg/kgmg/kgmg/kgmg/kgmg/kgmg/kgmg/kgmg/kgmg/kgmg/kg
WETDRYWETDRYWETDRYWETDRYWETDRYWETDRYWETDRYWETDRYWETDRYWETWETDRYDRYWETDRYWETDRYWETDRYWETDRYWETDRYWETDRYWET
LABLABLABLABLAB
COMPARISONCOMPARISONCOMPARISONCOMPARISONCOMPARISON
303
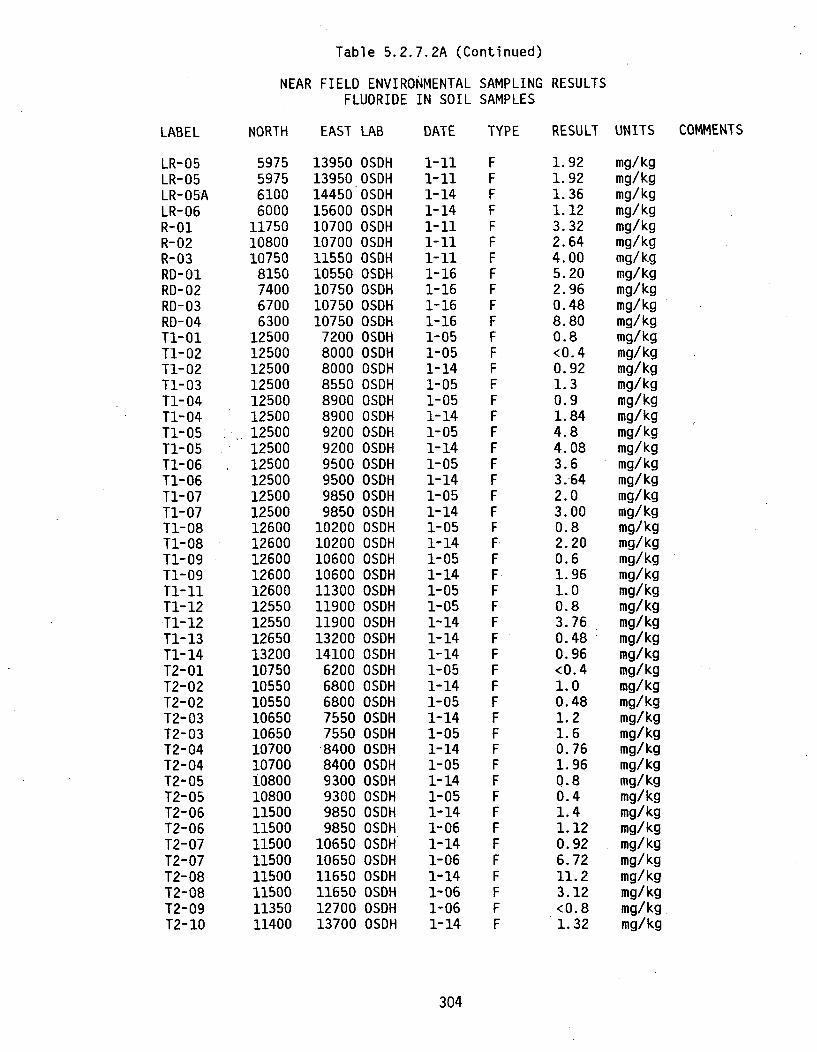
Table 5.2.7.2A (Continued)
NEAR FIELD ENVIRONMENTALFLUORIDE IN SOIL
NORTH EAST LAB DATE
SAMPLING RESULTSSAMPLES
LABEL
LR-05LR-05LR-05ALR-06R-01R-02R-03RD-01RD-02RD-03RD-04T1-01T1-02Tl-02T1-03T1-04Tl-04T1-05T1-05TI-06T1-06T1-07T1-07T1-08T1-08T1-09Tl-09T1-11T1- 12T1-12T1-13T1-14T2-01T2-02T2-02T2-03T2-03T2-04T2-04T2-05T2-05T2-06T2-06T2-07T2-07T2-08T2-08T2-09T2-10
TYPE RESULT UNITS COMMENTS
5975597561006000
117501080010750
8150740067006300
1250012500125001250012500125001250012500125001250012500125001260012600126001260012600125501255012650132001075010550105501065010650107001070010800108001150011500115001150011500115001135011400
13950 OSDH13950 OSDH14450 OSDH15600 OSDH10700 OSDH10700 OSDH11550 OSDH10550 OSDH10750 OSDH10750 OSDH10750 OSDH
7200 OSDH8000 OSDH8000 OSDH8550 OSDH8900 OSDH8900 OSDH9200 OSDH9200 OSDH9500 OSDH9500 OSDH9850 OSOH9850 OSDH
10200 OSDH10200 OSDH10600 OSDH10600 OSDH11300 OSDH11900 OSDH11900 OSDH13200 OSDH14100 OSDH
6200 OSDH6800 OSDH6800 OSDH7550 OSDH7550 OSDH
•8400 OSDH8400 OSDH9300 OSDH9300 OSDH9850 OSDH9850 OSDH
10650 OSDH10650 OSDH11650 OSDH11650 OSDH12700 OSDH13700 OSDH
I-Il
1-141-141-111-111-111-161-161-161-161-051-051-141-051-051-141-051-141-051-141-051-141-051-141-051-141-051-051-141-141-141-051-141-051-141-051-141-051-141-051-141-061-141-061-141-061-061-14
1.921.921.361.123.322.644.005.202.960.488.800.8<0.40.921.30.91.844.84.083.63.642.03.000.82.200.61.961.00.83.760.480.96<0.41.00.481.21.60.761.960.80.41.41.120.926.7211.23.12<0.81.32
mg/kgmg/kgmg/kgmg/kgmg/kgmg/kgmg/kgmg/kgmg/kgmg/kgmg/kgmg/kgmg/kgmg/kgmg/kgmg/kgmg/kgmg/kgmg/kgmg/kgmg/kgmg/kgmg/kgmg/kgmg/kgmg/kgmg/kgmg/kgmg/kgmg/kgmg/kgmg/kgmg/kgmg/kgmg/kgmg/kgmg/kgmg/kgmg/kgmg/kgmg/kgmg/kgmg/kgmg/kgmg/kgmg/kgmg/kgmg/kgmg/kg
304
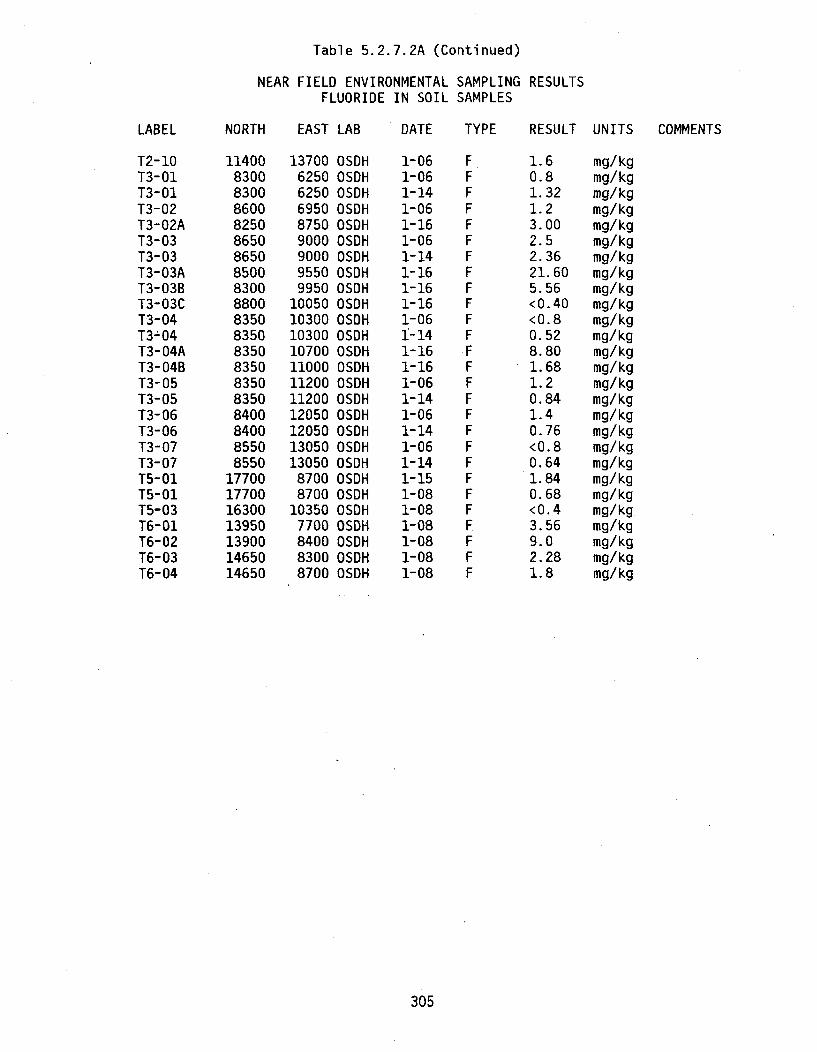
Table 5.2.7.2A (Continued)
NEAR FIELD ENVIRONMENTAL SAMPLING RESULTSFLUORIDE IN SOIL SAMPLES
LABEL NORTH EAST LAB DATE TYPE RESULT UNITS COMMENTS
T2-10 11400 13700 OSDH 1-06 F 1.6 mg/kgT3-01 8300 6250 OSDH 1-06 F 0.8 mg/kgT3-01 8300 6250 OSDH 1-14 F 1.32 mg/kgT3-02 8600 6950 OSDH 1-06 F 1.2 mg/kgT3-02A 8250 8750 OSDH 1-16 F 3.00 mg/kgT3-03 8650 9000 OSDH 1-06 F 2.5 mg/kgT3-03 8650 9000 OSDH 1-14 F 2.36 mg/kgT3-03A 8500 9550 OSDH 1-16 F 21.60 mg/kgT3-03B 8300 9950 OSDH 1-16 F 5.56 mg/kgT3-03C 8800 10050 OSDH 1-16 F <0.40 mg/kgT3-04 8350 10300 OSDH 1-06 F <0.8 mg/kgT3-:04 8350 10300 OSDH 1-14 F 0.52 mg/kgT3-04A 8350 10700 OSDH 1-16 F 8.80 mg/kgT3-04B 8350 11000 OSDH 1-16 F 1.68 mg/kgT3-05 8350 11200 OSDH 1-06 F 1.2 mg/kgT3-05 8350 11200 OSDH 1-14 F 0.84 mg/kgT3-06 8400 12050 OSDH 1-06 F 1.4 mg/kgT3-06 8400 12050 OSDH 1-14 F 0.76 mg/kgT3-07 8550 13050 OSDH 1-06 F <0.8 mg/kgT3-07 8550 13050 OSDH 1-14 F 0.64 mg/kgT5-01 17700 8700 OSDH 1-15 F 1.84 mg/kgT5-01 17700 8700 OSDH 1-08 F 0.68 mg/kgT5-03 16300 10350 OSDH 1-08 F <0.4 mg/kgT6-01 13950 7700 OSDH 1-08 F 3.56 mg/kgT6-02 13900 8400 OSDH 1-08 F 9.0 mg/kgT6-03 14650 8300 OSDH 1-08 F 2.28 mg/kgT6-04 14650 8700 OSDH 1-08 F 1.8 mg/kg
305
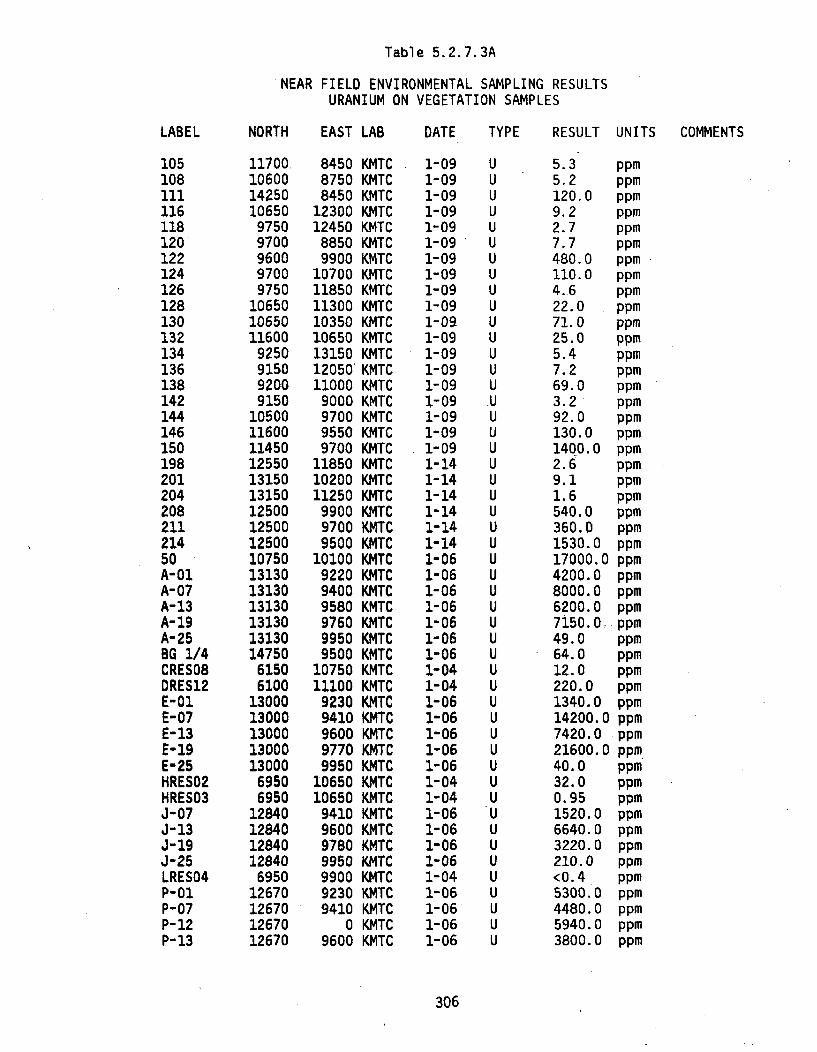
Table 5.2.7.3A
NEAR FIELD ENVIRONMENTAL SAMPLING RESULTSURANIUM ON VEGETATION SAMPLES
LABEL
10510811111611812012212412612813013213413613814214414615019820120420821121450A-01A-07A-13A- 19A-25BG 1/4CRES08DRES12E-01E-07E-13E-19E-25HRES02HRES03J-07J-13J-19J-25LRES04P-01P-07P-12P-13
NORTH EAST LAB DATE TYPE RESULT UNITS COMMENTS
1170010600142501065097509700960097009750
106501065011600
9250915092009150
10500116001145012550131501315012500125001250010750131301313013130131301313014750
61506100
1300013000130001300013000
69506950
12840128401284012840
695012670126701267012670
845087508450
1230012450
88509900
10700118501130010350106501315012050'11000
9000970095509700
118501020011250
990097009500
10100922094009580976099509500
1075011100
92309410960097709950
1065010650
9410960097809950990092309410
09600
KMTCKMTCKMTCKMTCKMTCKMTCKMTCKMTCKMTCKMTCKMTCKMTCKMTCKMTCKMTCKMTCKMTCKMTCKMTCKMTCKMTCKMTCKMTCKMTCKMTCKMTCKMTCKMTCKMTCKITCKMTCKMTCKMTCKMTCKMTCKMTCKMTCKMTCKMTCKMTCKMTCKMTCKMTCKMTCKMTCKMTCKMTCKMTCKMTCKMTC
1-091-091-091-091-091-091-091-091-091-091-091-091-091-091-091-091-091-091-091-141-141-141-141-141-141-061-061-061-061-061-061-061-041-041-061-061-061-061-061-041-041-061-061-061-061-041-061-061-061-06
5.35.2120.09.22.77.7480.0110.04.622.071.025.05.47.269.03.292.0130.01400.02.69.11.6540.0360.01530.017000.04200.08000.06200.07150.049.064.012.0220.01340.014200.07420.021600.040.032.00.951520.06640.03220.0210.0<0.45300.04480.05940.03800.0
ppmppmppmppmppmppmppmppmppmppmppmppmppmppmppmppmppmppmppmppmppmppmppmppmppmppmppmppmppmppmppmppmppmppmppmppmppmppmppmppmppmppmppmppmppmppmppmppmppmppm
306

Table 5.2.7.3A (Continued)
NEAR FIELD ENVIRONMENTAL SAMPLING RESULTSURANIUM ON VEGETATION SAMPLES
LABEL
P-25R- 15SM-21A-25BG 1/4CARLILECRESE-25J-25P-19P-25T2-05T2-06T2-08T2-09T2-10T3-01T3-02T3-03T3-04T3-05T3-06T3-07
NORTH EAST LAB DATE TYPE RESULT UNITS COMMENTS
1267060507450
131301475014250
6150130001284012670126701080011450115001135011400
8300860086508350835084008550
99501375017250
99509500
1510010800
995099509780995093009950
116501270013700
625069509000
10300112001205013050
KMTCKMTCKMTCORNLORNLORNLORNLORNLORNLORNLORNLORNLORNLORNLORNLORNLORNLORNLORNLORNLORNLORNLORNL
1-061-041-041-061-061-051-051-061-061-061-061-051-051-061-061-061-061-061-061-061-061-061-06
360.00.60.611.83.910.18813.824.2148.03600.0186.0393.0285.00.6331.530.5965.033.213.39624.0177.06.035.6
ppmppmppmppmppmppmppmppmppmppmppmppmppmppmppmppmppmppmppmppmppmppmppm
307

Table 5.2.7.4A
NEAR FIELD ENVIRONMENTAL SAMPLING RESULTSURANIUM IN SOIL SAMPLES
LABEL
103106109112115117119121123125127129131133135137139141143145147149187190193196199202205209218221A-01A-07A-07A- 13A-13A-25BG 1/4CRES1ODRES11DRES13E-01E-01E-07E- 07E-13E-13E-19E-25HRESO1
NORTH EAST LAB DATE TYPE RESULT UNITS COMMENTS
138001170010600142501150010650
97509700960097009750
106501065011600
92509150920093009150
1050011600116501260014750125501260012550131501315012500125001250013130131301313013130131301313014750
615061006100
1300013000130001300013000130001300013000
6950
10200845087508450
11600123001245088509900
107001185011300103501065013150120501100010100900097009550990072009500
1020010750118501020011250
9900935091009220940094009580958099509500
107501110011100
92309230941094109600960097709950
10650
KMTCKMTCKMTCKMTCKMTCKMTCKMTCKMTCKMTCKMTCKMTCKMTCKMTCKMTCKMTCKMTCKMTCKMTCKMTCKMTCKMTCKMTCKMTCKMTCKMTCKMTCKMTCKMTCKMTCKMTCKMTCKMTCKMTCKMTCKMTCKMTCKMTCKMTCKMTCKMTCKMTCKMTCKMTCKMTCKMTCKMTCKMTCKMTCKMTCKMTCKMTC
1-091-091-091-091-091-091-091-091-091-091-091-091-091-091-091-091-091-091-091-091-091-091-141-141-141-141-141-141-141-141-141-141-061-091-061-061-091-061-061-041-041-041-061-091-061-091-061-091-061-061-04
20.0<10<10290.0<1020.020.020.025.020.0<10<1030.015.0<10<10<1015.0<1030.035.095.020.050.030.020.010.030.0<10140.0220.040.02180.0590.0730.0655.0200.025.0<10<1015.013.0210.0300.0465.0380.0130.0130.015.020.0<10
ppmppmppmppmppmppmppmppmppmppmppmppmppmppmppmppmppmppmppmppmppmppmppmppmppmppmppmppmppmppmppmppmppmppmppmppmppmppmppmppmppmppmppmppmppmppmppmppmppmppmppm
308
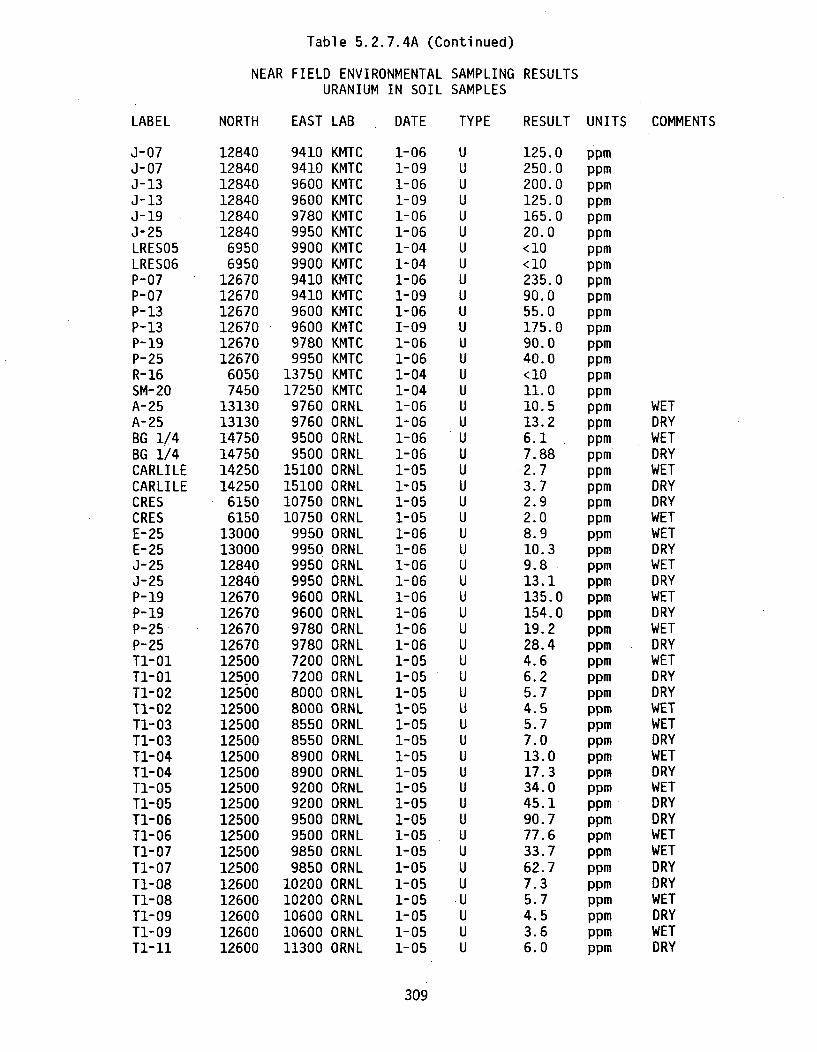
Table 5.2.7.4A (Continued)
NEAR FIELD ENVIRONMENTALURANIUM IN SOIL
SAMPLING RESULTSSAMPLES
LABEL
J-07J-07J-13J-13J-19J-25LRES05LRES06P-07P-07P- 13P-13P-19P-25R- 16SM-20A-25A-25BG 1/4BG 1/4CARLILECARLILECRESCRESE-25E-25J-25J-25P-19P-19P-25P-25T1-01T1-01TI-02T1-02T1-03T1-03T1-04T1-04Tl-05Ti-05T1-06Tl-06TI-07T1-07T1-08T1-08T1-09T1-09T1-11
NORTH EAST LAB DATE TYPE RESULT UNITS COMMENTS
128401284012840128401284012840
69506950
126701267012670126701267012670
60507450
13130131301475014750142501425061506150
130001300012840128401267012670126701267012500125001250012500125001250012500125001250012500125001250012500125001260012600126001260012600
94109410960096009780995099009900941094109600960097809950
13750172509760976095009500
15100151001075010750
9950995099509950960096009780978072007200800080008550855089008900920092009500950098509850
1020010200106001060011300
KMTCKMTCKMTCKMTCKMTCKMTCKMTCKMTCKMTCKMTCKMTCKMTCKMTCKMTCKMTCKMTCORNLORNLORNLORNLORNLORNLORNLORNLORNLORNLORNLORNLORNLORNLORNLORNLORNLORNLORNLORNLORNLORNLORNLORNLORNLORNLORNLORNLORNLORNLORNLORNLORNLORNLORNL
1-061-091-061-091-061-061-041-041-061-091-061-091-061-061-041-041-061-061-061-061-051-051-051-051-061-061-061-061-061-061-061-061-051-051-051-051-051-051-051-051-051-051-051-051-051-051-051-051-051-051-05
125.0250.0200.0125.0165.020.0<10<10235.090.055.0175.090.040.0<1011.010.513.26.17.882.73.72.92.08.910.39.813.1135.0154.019.228.44.66.25.74.55.77.013.017.334.045.190.777.633.762.77.35.74.53.66.0
ppmppmppmppmppmppmppmppmppmppmppmppmppmppmppmppmppmppmppmppmppmppmppmppmppmppmppmppmppmppmppmppmppmppmppmppmppmppmppmppmppmppmppmppmppmppmppmppmppmppmppm
WETDRYWETDRYWETDRYDRYWETWETDRYWETDRYWETDRYWETDRYWETDRYDRYWETWETDRYWETDRYWETDRYDRYWETWETDRYDRYWETDRYWETDRY
309

Table 5.2.7.4A (Continued)
NEAR FIELD ENVIRONMENTALURANIUM IN SOIL
NORTH EAST LAB DATE
SAMPLING RESULTSSAMPLES
LABEL
T1-11T1-12T1-12T2-01T2-01T2-02T2-02T2-03T2-03T2-04T2-04T2-05T2-05T2-06T2-06T2-07T2-07T27-08T2-08T2-09T2-09T2-10T2-10T3-01T3-01T3-02T3-02T3-03T3-03T3-04T3-04T3-05T3-05T3-06T3-06T3-07T3-07
TYPE RESULT UNITS COMMENTS
1260012550125501075010750105501055010650106501070010700108001080011450114501150011500115001150011350113501140011400
83008300860086008650865083508350835083508400840085508550
113001190011900
620062006800680075507550840084009300930099509950
1065010650116501165012700127001370013700
625062506950695090009000
1030010300112001120012050120501305013050
ORNLORNLORNLORNLORNLORNLORNLORNLORNLORNLORNLORNLORNLORNLORNLORNLORNLORNLORNLORNLORNLORNLORNLORNLORNLORNLORNLORNLORNLORNLORNLORNLORNLORNLORNLORNLORNL
1-051-051-051-051-051-051-051-051-051-051-051-051-051-051-051-061-061-061-061-061-061-061-061-061-061-061-061-061-061-061-061-061-061-061-061-061-06
3.76.03.52.93.52.62.23.23.94.13.24.53.925.924.45.235.05.213.83.953.02.43.864.343.33.863.35.344.74.283.94.03.04.883.93.92.8
ppmppmppmppmppmppmppmppmppmppmppmppmppmppmppmppmppmppmppmppmppmppmppmppmppmppmppmppmppmppmppmppmppmppmppmppmppm
WETDRYWETWETDRYDRYWETWETDRYDRYWETDRYWETDRYWETDRYWETDRYWETDRYWETWETDRYDRYWETDRYWETDRYWETDRYWETDRYWETDRYWETDRYWET
310
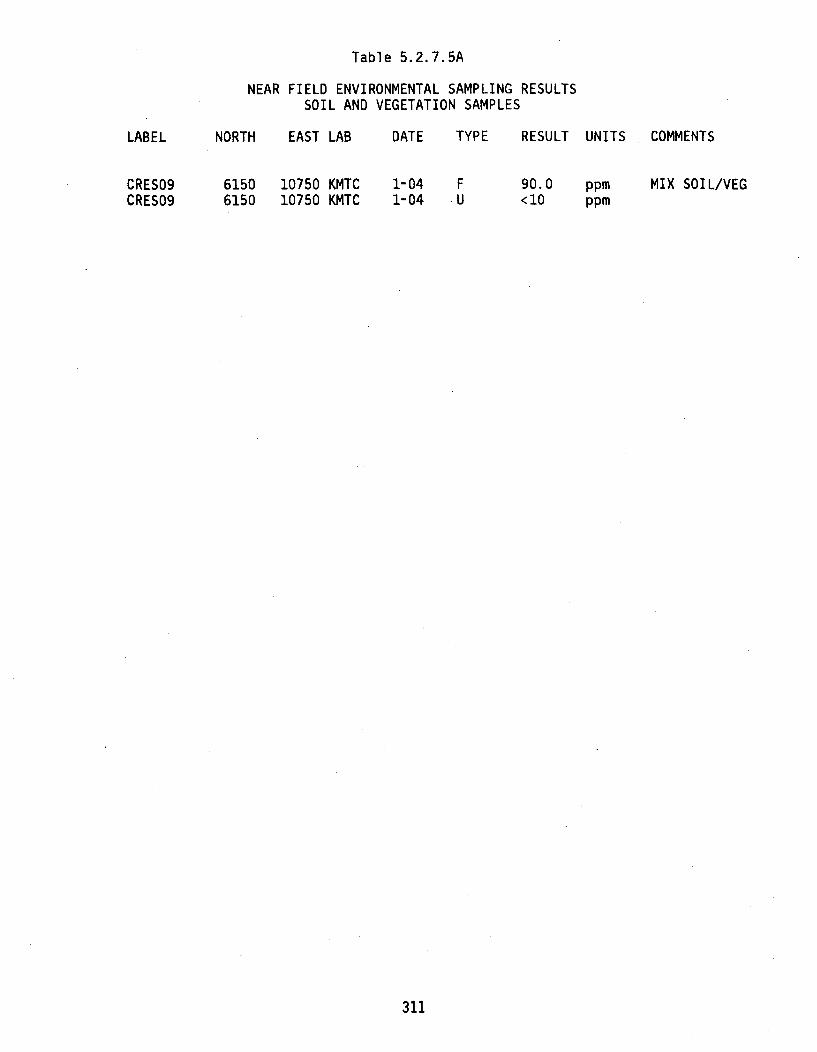
Table 5.2.7.5A
NEAR FIELD ENVIRONMENTAL SAMPLING RESULTSSOIL AND VEGETATION SAMPLES
LABEL NORTH EAST LAB
6150 10750 KMTC6150 10750 KMTC
DATE TYPE RESULT UNITS COMMENTS
CRES09CRES09
1-041-04
FU
90.0<10
ppmppm
MIX SOIL/VEG
311
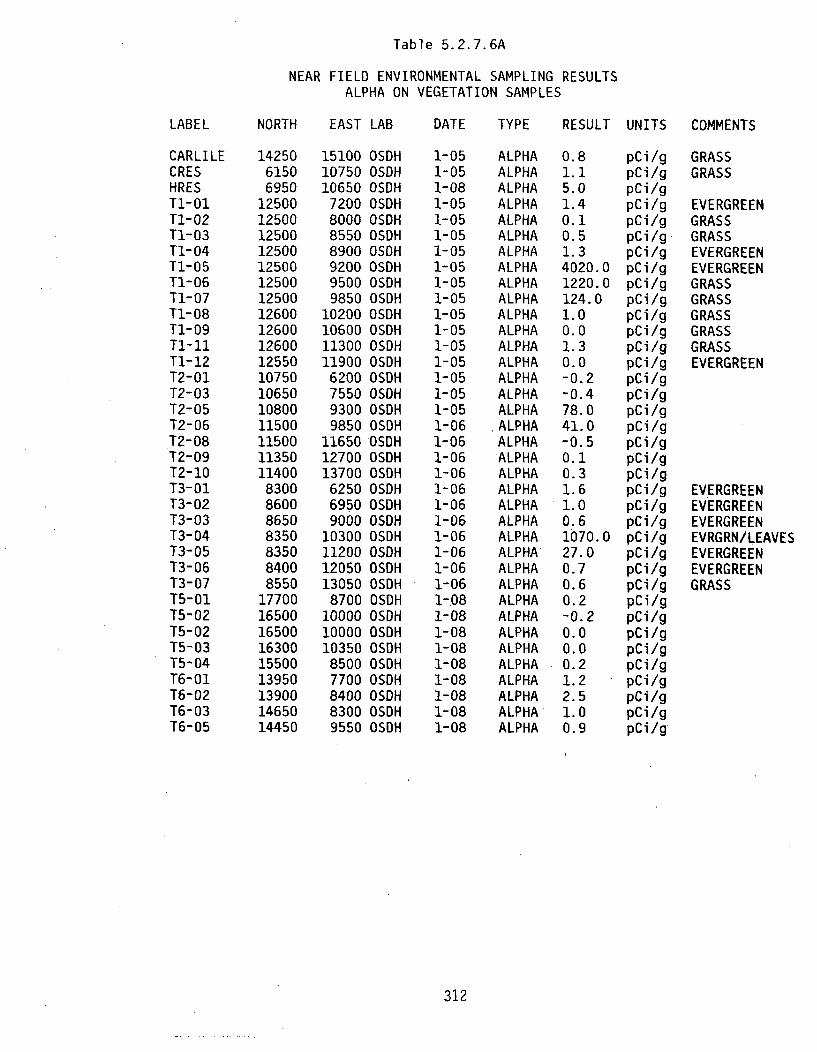
Table 5.2.7.6A
NEAR FIELD ENVIRONMENTAL SAMPLING RESULTSALPHA ON VEGETATION SAMPLES
LABEL NORTH EAST LAB DATE TYPE RESULT UNITS COMMENTS
CARLILE 14250 15100 OSDH 1-05 ALPHA 0.8 pCi/g GRASSCRES 6150 10750 OSDH 1-05 ALPHA 1.1 pCi/g GRASSHRES 6950 10650 OSDH 1-08 ALPHA 5.0 pCi/gT1-01 12500 7200 OSDH 1-05 ALPHA 1.4 pCi/g EVERGREENT1-02 12500 8000 OSDH 1-05 ALPHA 0.1 pCi/g GRASSTI-03 12500 8550 OSDH 1-05 ALPHA 0.5 pCi/g GRASST1-04 12500 8900 OSDH 1-05 ALPHA 1.3 pCi/g EVERGREENTl-05 12500 9200 OSDH 1-05 ALPHA 4020.0 pCi/g EVERGREENTl-06 12500 9500 OSDH 1-05 ALPHA 1220.0 pCi/g GRASST1-07 12500 9850 OSDH 1-05 ALPHA 124.0 pCi/g GRASST1-08 12600 10200 OSDH 1-05 ALPHA 1.0 pCi/g GRASST1-09 12600 10600 OSDH 1-05 ALPHA 0.0 pCi/g GRASST1-11 12600 11300 OSDH 1-05 ALPHA 1.3 pCi/g GRASST1-12 12550 11900 OSDH 1-05 ALPHA 0.0 pCi/g EVERGREENT2-01 10750 6200 OSDH 1-05 ALPHA -0.2 pCi/gT2-03 10650 7550 OSDH 1-05 ALPHA -0.4 pCi/gT2-05 10800 9300 OSDH 1-05 ALPHA 78.0 pCi/gT2-06 11500 9850 OSDH 1-06 ALPHA 41.0 pCi/gT2-08 11500 11650 OSDH 1-06 ALPHA -0.5 pCi/gT2-09 11350 12700 OSDH 1-06 ALPHA 0.1 pCi/gT2-10 11400 13700 OSDH 1-06 ALPHA 0.3 pCi/gT3-01 8300 6250 OSDH 1-06 ALPHA 1.6 pCi/g EVERGREENT3-02 8600 6950 OSDH 1-06 ALPHA 1.0 pCi/g EVERGREENT3-03 8650 9000 OSDH 1-06 ALPHA 0.6 pCi/g EVERGREENT3-04 8350 10300 OSDH 1-06 ALPHA 1070.0 pCi/g EVRGRN/LEAVEST3-05 8350 11200 OSDH 1-06 ALPHA 27.0 pCi/g EVERGREENT3-06 8400 12050 OSDH 1-06 ALPHA 0.7 pCi/g EVERGREENT3-07 8550 13050 OSDH 1-06 ALPHA 0.6 pCi/g GRASST5-01 17700 8700 OSDH 1-08 ALPHA 0.2 pCi/gT5-02 16500 10000 OSDH 1-08 ALPHA -0.2 pCi/gT5-02 16500 10000 OSDH 1-08 ALPHA 0.0 pCi/gT5-03 16300 10350 OSDH 1-08 ALPHA 0.0 pCi/gT5-04 15500 8500 OSDH 1-08 ALPHA 0.2 pCi/gT6-01 13950 7700 OSDH 1-08 ALPHA 1.2 pCi/gT6-02 13900 8400 OSDH 1-08 ALPHA 2.5 pCi/gT6-03 14650 8300 OSDH 1-08 ALPHA 1.0 pCi/gT6-05 14450 9550 OSDH 1-08 ALPHA 0.9 pCi/g
312
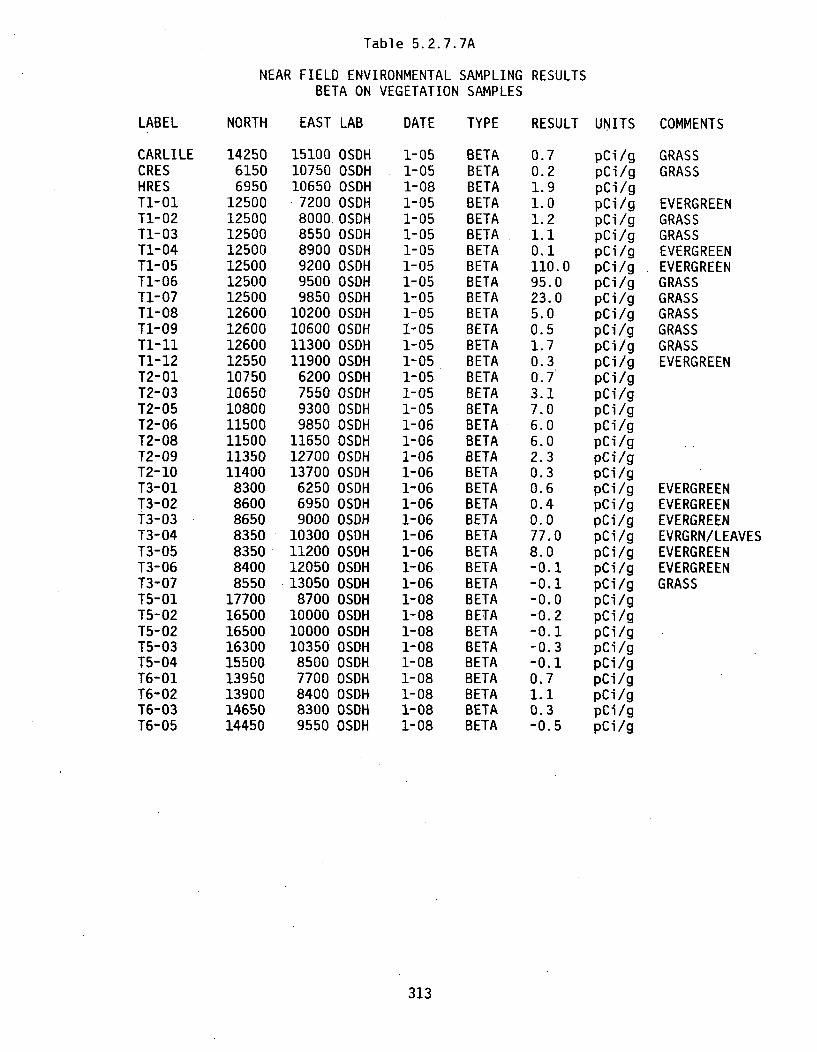
Table 5.2.7.7A
NEAR FIELD ENVIRONMENTAL SAMPLING RESULTSBETA ON VEGETATION SAMPLES
LABEL NORTH EAST LAB DATE TYPE RESULT UNITS COMMENTS
CARLILE 14250 15100 OSDH 1-05 BETA 0.7 pCi/g GRASSCRES 6150 10750 OSDH 1-05 BETA 0.2 pCi/g GRASSHRES 6950 10650 OSDH 1-08 BETA 1.9 pCi/gT1-01 12500 7200 OSDH 1-05 BETA 1.0 pCi/g EVERGREENT1-02 12500 80000QSDH 1-05 BETA 1.2 pCi/g GRASST1-03 12500 8550 OSDH 1-05 BETA 1.1 pCi/g GRASST1-04 12500 8900 OSDH 1-05 BETA 0.1 pCi/g EVERGREENTl-05 12500 9200 OSDH 1-05 BETA 110.0 pCi/g EVERGREENT1-06 12500 9500 OSDH 1-05 BETA 95.0 pCi/g GRASST1-07 12500 9850 OSDH 1-05 BETA 23.0 pCi/g GRASST1-08 12600 10200 OSDH 1-05 BETA 5.0 pCi/g GRASST1-09 12600 10600 OSDH 1-05 BETA 0.5 pCi/g GRASST1-11 12600 11300 OSDH 1-05 BETA 1.7 pCi/g GRASST1-12 12550 11900 OSDH 1-05 BETA 0.3 pCi/g EVERGREENT2-01 10750 6200 OSDH 1-05 BETA 0.7 pCi/gT2-03 10650 7550 OSDH 1-05 BETA 3.1 pCi/gT2-05 10800 9300 OSDH 1-05 BETA 7.0 pCi/gT2-06 11500 9850 OSDH 1-06 BETA 6.0 pCi/gT2-08 11500 11650 OSDH 1-06 BETA 6.0 pCi/gT2-09 11350 12700 OSDH 1-06 BETA 2.3 pCi/gT2-10 11400 13700 OSDH 1-06 BETA 0.3 pCi/gT3-01 8300 6250 OSDH 1-06 BETA 0.6 pCi/g EVERGREENT3-02 8600 6950 OSDH 1-06 BETA 0.4 pCi/g EVERGREENT3-03 8650 9000 OSDH 1-06 BETA 0.0 pCi/g EVERGREENT3-04 8350 10300 OSDH 1-06 BETA 77.0 pCi/g EVRGRN/LEAVEST3-05 8350 11200 OSDH 1-06 BETA 8.0 pCi/g EVERGREENT3-06 8400 12050 OSDH 1-06 BETA -0.1 pCi/g EVERGREENT3-07 8550 13050 OSDH 1-06 BETA -0.1 pCi/g GRASST5-01 17700 8700 OSDH 1-08 BETA -0.0 pCi/gT5-02 16500 10000 OSDH 1-08 BETA -0.2 pCi/gT5-02 16500 10000 OSDH 1-08 BETA -0.1 pCi/gT5-03 16300 10350 OSDH 1-08 BETA -0.3 pCi/gT5-04 15500 8500 OSDH 1-08 BETA -0.1 pCi/gT6-01 13950 7700 OSDH 1-08 BETA 0.7 pCi/gT6-02 13900 8400 OSDH 1-08 BETA 1.1 pCi/gT6-03 14650 8300 OSDH 1-08 BETA 0.3 pCi/gT6-05 14450 9550 OSDH 1-08 BETA -0.5 pCi/g
313

Table 5.2.7.8A
NEAR FIELD ENVIRONMENTAL SAMPLING RESULTSALPHA IN SOIL SAMPLES
LABEL
CARLILECRESTI-O1Ti-02T1-03Tl-04T1-05Ti-06TI-07TI-08Tl-09TI-1ITl-12T2-01T2-02T2-03T2-04T2-05T2-06T2-07T2-08T2-09T2-10T3-01T3-02T3-03T3-04T3-05T3-06T3-07T5-01T5-03T6-01T6-02T6-03T6-04
NORTH EAST LAB DATE TYPE RESULT UNITS COMMENTS
142506150
125001250012500125001250012500125001260012600126001255010750105501065010700108001150011500115001135011400
8300860086508350835084008550
177001630013950139001465014650
15100 OSDH10750 OSDH
7200 OSDH8000 OSDH8550 OSDH8900 OSDH9200 OSDH9500 OSDH9850 OSDH
10200 OSDH10600 OSDH11300 OSDH11900 OSDH
6200 OSDH6800 OSDH7550 OSDH8400 OSDH9300 OSDH9850 OSDH
10650 OSDH11650 OSDH12700 OSDH13700 OSDH
6250 OSDH6950 OSDH9000 OSDH
10300 OSDH11200 OSDH12050 OSDH13050 OSDH
8700 OSDH10350 OSDH
7700 OSDH8400 OSDH8300 OSDH8700 OSDH
1-051-051-051-051-051-051-051-051-051-051-051-051-051-051-051-051-051-051-061-061-061-061-061-061-061-061-061-061-061-061-081-081-081-081-081-08
ALPHAALPHAALPHAALPHAALPHAALPHAALPHAALPHAALPHAALPHAALPHAALPHAALPHAALPHAALPHAALPHAALPHAALPHAALPHAALPHAALPHAALPHAALPHAALPHAALPHAALPHAALPHAALPHAALPHAALPHAALPHAALPHAALPHAALPHAALPHAALPHA
0.1-0.10.10.10.40.90.41.8-0.3-0.31.6-0.30.40.10.1132.00.10.11.93.00.11.2-0.3-0.33.0-0.3-0.30.90.40.1-0.3-0.30.1-0.30.40.4
pCi/gpci/gpCi/gpCi/gpCi/gpCi/gpCi/gpci/gpCi/gpCi/gpCi/gpci/gpCi/gpCi/gpCi/gpCi/gpCi/gpCl/gpCi/gpCi/gpci/gpCi/gpci/gpcilgpCi/gpCi/gpCi/gpCi/gpci/gpci/gpci/gpCi/gpCi/gpCi/gpCi/gpCi/g
314
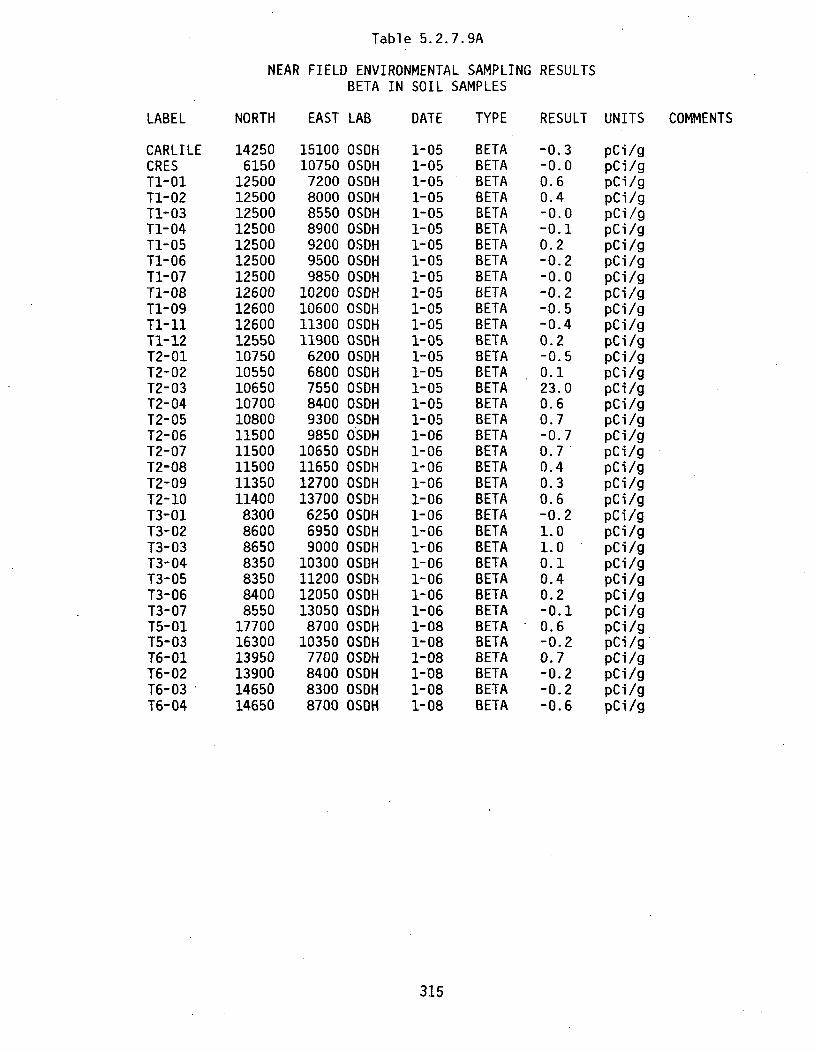
Table 5.2.7.9A
NEAR FIELD ENVIRONMENTAL SAMPLING RESULTSBETA IN SOIL SAMPLES
LABEL
CARLILECREST1-01Tl-02T1-03T1-04Tl-05T1-06Ti-07T1-08T1-09T1-11TI-12T2-01T2-02T2-03T2-04T2-05T2-06T2-07T2-08T2-09T2-10T3-01T3-02T3-03T3-04T3-05T3-06T3-07T5-01T5-03T6-01T6-02T6-03T6-04
NORTH EAST LAB DATE TYPE RESULT UNITS COMMENTS
142506150
125001250012500125001250012500125001260012600126001255010750105501065010700108001150011500115001135011400
8300860086508350835084008550
177001630013950139001465014650
1510010750
7200800085508900920095009850
10200106001130011900
620068007550840093009850
10650116501270013700
625069509000
10300112001205013050
870010350
7700840083008700
OSOHOSDHOSDHOSDHOSDHOSDHOSDHOSDHOSDHOSDHOSDHOSDHOSDHOSDHOSDHOSDHOSDHOSDHOSDHOSDHOSDHOSDHOSDHOSDHOSDHOSDHOSDHOSDHOSDHOSDHOSDHOSDHOSDHOSDHOSDHOSDH
1-051-051-051-051-051-051-051-051-051-051-051-051-051-051-051-051-051-051-061-061-061-061-061-061-061-061-061-061-061-061-081-081-081-081-081-08
BETABETABETABETABETABETABETABETABETABETABETABETABETABETABETABETABETABETABETABETABETABETABETABETABETABETABETABETABETABETABETABETABETABETABETABETA
-0.3-0.00.60.4-0.0-0.10.2-0.2-0.0-0.2-0.5-0.40.2-0.50.123.00.60.7-0.70.70.40.30.6-0.21.01.00.10.40.2-0.10.6-0.20.7-0.2-0.2-0.6
pCi/gpCi/gpCi/gpCi/gpCi/gpCi/gpCi/gpCi/gpCi/gpCi/gpCi/gpCi/gpCifgpCi/gpCi/gpCi/gpCilgpCi/gpCi/gpCi/gpCi/gpCi/gpCi/gpCi/gpCi/gpCi/gpCi/gpCi/gpCi/gpci/gpCi/gpCi/gpCi/gpCi/gpCi/gpCi/g
315
FAR FIELD ENVIRONMENTAL SAMPLING RESULTS BY MEDIA AND TYPE ANALYSIS
316
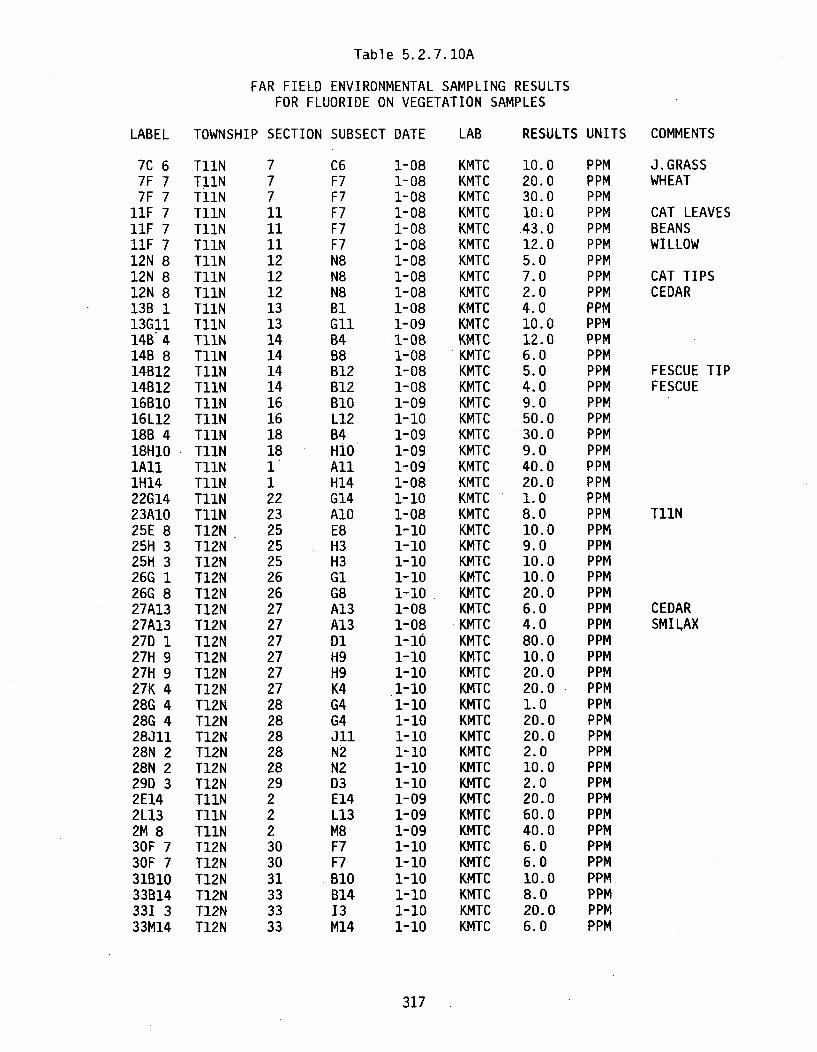
Table 5.2.7.10A
FAR FIELD ENVIRONMENTAL SAMPLING RESULTSFOR FLUORIDE ON VEGETATION SAMPLES
LABEL TOWNSHIP SECTION SUBSECT DATE LAB RESULTS UNITS COMMENTS
7C 67F 77F 7
11F 711F 711F 712N 812N 812N 813B 113G1114B 414B 814B1214B1216B1016L1218B 418H101All1H1422G1423A1025E 825H 325H 326G 126G 827A1327A1327D 127H 927H 927K 428G 428G 428J1128N 228N 229D 32E142L132M 830F 730F 731B1033B14331 333M14
T11NT11N
T11NT11NT11NT11NT11NT11NT11NT11NT11NT11NT11NT11NT11NT11NT11NT11NT11NT11NT11NT11NT11NT12NT12NT12NT12NT12NT12NT12NT12NT12NT12NT12NT12NT12NT12NT12NT12NT12NT11NT11NT11NT12NT12NT12NT12NT12NT12N
77711
1212121212
131314141414161618181
22232525252626272727272727282828282829222303031333333
C6F7F7F7F7F7N8N8N8B1GllB4B8B12B12B10L12B4H10AllH14G14A1OE8H3H3G1G8A13A13DlH9H9K4G4G4JllN2N2D3E14L13M8F7F7B10B1413M14
1-081-081-081-081-081-081-081-081-081-081-091-081-081-081-081-091-101-091-091-091-081-101-081-101-101-101-101-101-081-081-101-101-101-101-101-101-101-101-101-101-091-091-091-101-101-101-101-101-10
KMTCKMTCKMTCKMTCKMTCKMTCKMTCKMTCKMTCKMTCKMTCKMTCKMTCKMTCKMTCKMTCKMTCKMTCKMTCKMTCKMTCKMTCKMTCKMTCKMTCKMTCKMTCKMTCKMTCKMTCKMTCKMTCKMTCKMTCKMTCKMTCKMTCKMTCKMTCKMTCKMTCKMTCKMTCKMTCKMTCKMTCKMTCKMTCKMTC
10.020.030.010. 043.012.05.07.02.04.010.012.06.05.04.09.050.030.09.040.020.01.08.010.09.010.010.020.06.04.080.010.020.020.01.020.020.02.010.02.020.060.040.06.06.010.08.0
20.06.0
PPMPPMPPMPPMPPMPPMPPMPPMPPMPPMPPMPPMPPMPPMPPMPPMPPMPPMPPMPPMPPMPPMPPMPPMPPMPPMPPMPPMPPMPPMPPMPPMPPMPPMPPMPPMPPMPPMPPMPPMPPMPPMPPMPPMPPMPPMPPMPPMPPM
J.GRASSWHEAT
CAT LEAVESBEANSWILLOW
CAT TIPSCEDAR
FESCUE TIPFESCUE
T11N
CEDARSMIlAX
317
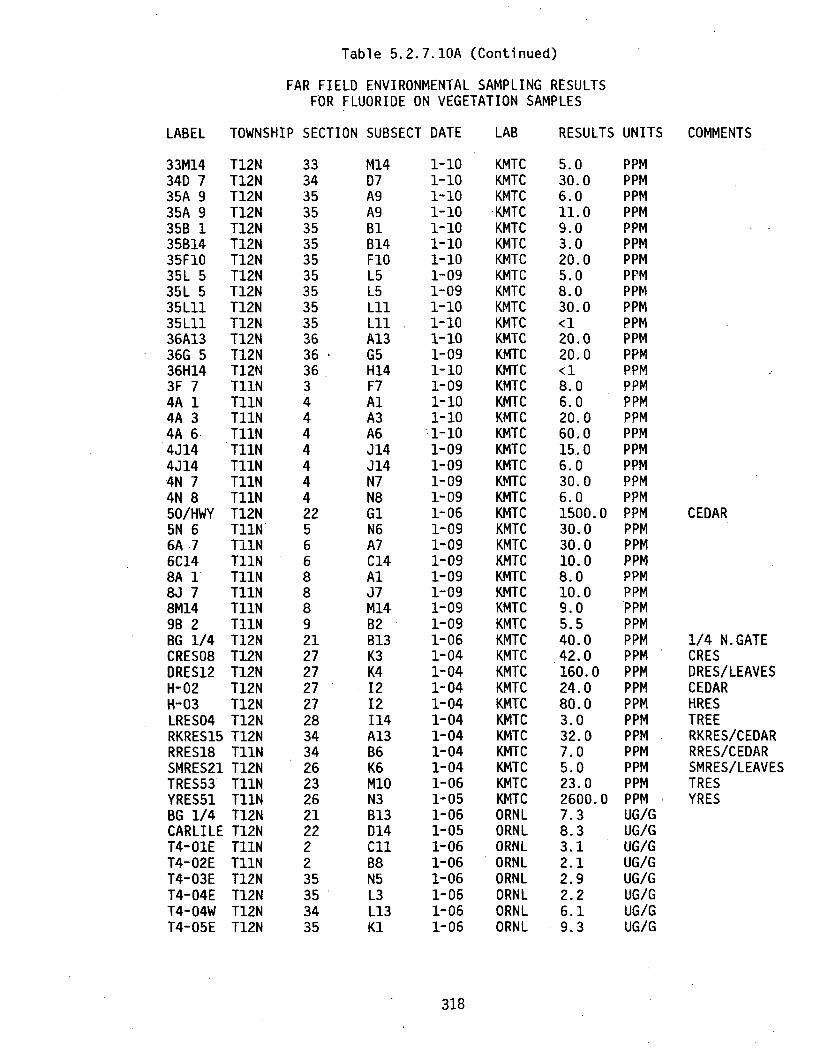
Table 5.2.7.10A (Continued)
FAR FIELD ENVIRONMENTAL SAMPLING RESULTSFOR FLUORIDE ON VEGETATION SAMPLES
LABEL TOWNSHIP SECTION SUBSECT DATE
33M1434D 735A 935A 935B 135B1435F1035L 535L 535L1135L1136A1336G 536H143F 74A 14A 34A 64J144J144N 74N 850/HWY5N 66A 76C148A 18J 78M149B 2BG 1/4CRES08DRES12H-02H-03LRES04RKRES15RRES18SMRES21TRES53YRES51BG 1/4CARLILET4-O1ET4-02ET4-03ET4-04ET4-04WT4-O5E
T12NT12NT12NT12NT12NT12NT12NT12NT12NT12NT12NT12NT12NT12NT11NT11NT11NT11NT11NT11NT11NT11NT12NT11NT11NT11NT11NT11NT11NT11NT12NT12NT12NT12NT12NT12NT12NT11NT12NT11NT11NT12NT12NT11NT11NT12NT12NT12NT12N
333435353535353535353536363634444444225668889212727272728343426232621222235353435
M14D7A9A9B1B14F1OL5L5L11LIIA13G5H14F7AlA3A6J14J14N7N8G1N6A7C14AlJ7M14B2B13K3K41212114A13B6K6M1ON3B13D14Cl1B8N5L3L13K1
1-101-101-101-101-101-101-101-091-091-101-101-101-091-101-091-101-10ý1-101-091-091-091-091-061-091-091-091-091-091-091-091-061-041-041-041-041-041-041-041-041-061-051-061-051-061-061-061-061-061-06
LAB
KMTCKMTCKMTCKMTCKMTCKMTCKMTCKMTCKMTCKMTCKMTCKMTCKMTCKMTCKMTCKMTCKMTCKMTCKMTCKMTCKMTCKMTCKMTCKMTCKMTCKMTCKMTCKMTCKMTCKMTCKMTCKMTCKMTCKMTCKMTCKMTCKMTCKMTCKMTCKMTCKMTCORNLORNLORNLORNLORNLORNLORNLORNL
RESULTS UNITS
5.030.06.011.09.03.020.05.08.030.0<120.020.0<18.06.020.060.015. 06.030.06.01500.030.030.010.08.010.09.05.540.042.0160.024.080.03.032.07.05.023.02600.07.38.33.12.12.92.26.19.3
PPMPPMPPMPPMPPMPPMPPMPPMPPMPPMPPMPPMPPMPPMPPMPPMPPMPPMPPMPPMPPMPPMPPMPPMPPMPPMPPMPPMPPMPPMPPMPPMPPMPPMPPMPPMPPMPPMPPMPPMPPMUG/GUG/GUG/GUG/GUG/GUG/GUG/GUG/G
COMMENTS
CEDAR
1/4 N.GATECRESDRES/LEAVESCEDARHRESTREERKRES/CEDARRRES/CEDARSMRES/LEAVESTRESYRES
318

Table 5.2.7.1OA (Continued)
FAR FIELD ENVIRONMENTAL SAMPLING RESULTSFOR FLUORIDE ON VEGETATION SAMPLES
LABEL TOWNSHIP SECTION SUBSECT DATE
AB-01AB-02AB-03AB-04AB-05AB-06AB-07AB-08AB-09AB-1OCARLILECARLILECNTRL01CNTRL02CNTRLO3CNTRL04CNTRL05CNTRL06CNTRLO7CNTRL08CNTRL09CNTRL09CNTRLIOCNTRL11CNTRL13CNTRL15CRESG-01G-02G-03G-04GL-01HC-01HC-02HC-03HC-04HC-05HC-07HC-08HC-09HC-10HC-11HC-11HC-12HC-13HC-14HC-15HC-16HC-17
T11NT11NT12NT11.NT11NT12NT12NT12NT12NT12NT12NT12NTO9NTIONT11NT11NT11NTO9NT11NTiONT11NT11NT11NT12NT11NTO9NT12NT12NT12NT12NT12NT12NT11NT11NT11NT11NT11NT11NT11NT11NT10NT10NTIONT11NT11NT12NTIONT11NTiON
171632942931191813222216352820194138212121263162788771623222021152628324442226253339
A14AllN1481C8N14A8N8M6G14014D14
C14EION1OF13113B7K8C12C12113E3C2G13K3L583813K9FlNiNIN14AlN5NiMilA12NiN14N14A13A14A14AlN2A14
1-151-151-151-151-151-151-151-151-151-151-051-141-061-061-061-061-061-061-061-061-061-061-061-061-061-061-051-151-151-151-151-151-111-111-111-111-111-111-111-111-111-111-111-111-111-111-111-111-11
LAB
OSDHOSDHOSDHOSDHOSDHOSDHOSDHOSDHOSDHOSDHOSDHOSDHOSDHOSDHOSDHOSDHOSDHOSDHOSDHOSDHOSDHOSDHOSDHOSDHOSDHOSDHOSDHOSDHOSDHOSDHOSDHOSDHOSDHOSDHOSDHOSDHOSDHOSDHOSDHOSDHOSDHOSDHOSDHOSDHOSDHOSDHOSDHOSDHOSDH
RESULTS UNITS
2.721.683.281.522.641.682.401.603.602.964.32.560.91.92.42.52.21.40.92.72.21.93.01.21.41.632.04.008.002.083.042.162.481.042.001.282.242.002.321.522.241.601.520.903.601.284.085.762.80
MG/KGMG/KGMG/KGMG/KGMG/KGMG/KGMG/KGMG/KGMG/KGMG/KGMG/KGMG/KGMG/KGMG/KGMG/KGMG/KGMG/KGMG/KGMG/KGMG/KGMG/KGMG/KGMG/KGMG/KGMG/KGMG/KGMG/KGMG/KGMG/KGMG/KGMG/KGMG/KGMG/KGMG/KGMG/KGMG/KGMG/KGMG/KGMG/KGMG/KGMG/KGMG/KGMG/KGMG/KGMG/KGMG/KGMG/KGMG/KGMG/KG
COMMENTS
GRASS
GRASS
319

Table 5.2.7.10A (Continued)
FAR FIELD ENVIRONMENTAL SAMPLING RESULTSFOR FLUORIDE ON VEGETATION SAMPLES
LABEL TOWNSHIP SECTION SUBSECT DATE
HC-18HC-19HC-20P-01P-02P-03P-04P-05P-06P-07P-08P-09S-01S-02S-03S-04S-05S-06S-07S-08S-09S-10S-11S-12S-13S-14S-15S-16T3-08T4-O1ET4-02ET4-03ET4-04ET4-04WT4-O5EWR-01WR-02WR-03WR-05WR-07WR-08WR-09WR-10
TIONT11NT11N
T12NT12NT12NT12NT11NT11NT12NT12NT12NT11NT11NT11NT11NT11NT11NTIONT11NTIONTIONTIONTIONT11NTIONTIONTIONT12NT11NT11NT12NT12NT12NT12NT11NTIINT11NT11NT11NT11NT11NT11N
1029302625363611353526342830253634231659433622262235353435151717966617
A13A14A14AllH4A13D1OAllA7MIODIOH6AlN1N14N14AlN14AlNiA14NIAlAlN14NiN14NiC12CliB8N5L3L13K1AlA14114AlN14N7G1Al
1-131-111-il1-131-131-131-131-131-131-131-131-13
1-0i
1-061-lI1-111-111-151-111-11
1-111-111-111-111-11
1-li1-111-141-061-061-061-061-061-061-151-151-151-.151-151-151-151-15
LAB
OSDHOSDHOSDHOSDHOSDHOSDHOSDHOSDHOSOHOSDHOSDHOSDHOSDHOSDHOSDHOSDHOSDHOSDHOSDHOSDHOSDHOSDHOSDHOSDHOSDHOSDHOSDHOSDHOSDHOSDHOSDHOSDHOSDHOSDHOSDHOSDHOSDHOSDHOSDHOSDHOSDHOSDHOSDH
3.606.402.882.24<0.11.36<0.11.762.249.686.804.642.86.643.922.563.523.123.045.442.165.685.042.164.963.682.883.122.402.62.73.51.854.011.23.365.363.603.281.682.081.842.32
RESULTS UNITS COMMENTS
MG/KGMG/KGMG/KGMG/KGMG/KGMG/KGMG/KGMG/KGMG/KGMG/KGMG/KGMG/KGMG/KGMG/KGMG/KGMG/KGMG/KGMG/KGMG/KGMG/KGMG/KGMG/KGMG/KGMG/KGMG/KGMG/KGMG/KGMG/KGMG/KGMG/KGMG/KGMG/KGMG/KGMG/KGMG/KGMG/KGMG/KGMG/KGMG/KGMG/KGMG/KGMG/KGMG/KG
EVERGREENEVERGREENEVERGREENEVERGREENLEAVESEVERGREEN
320
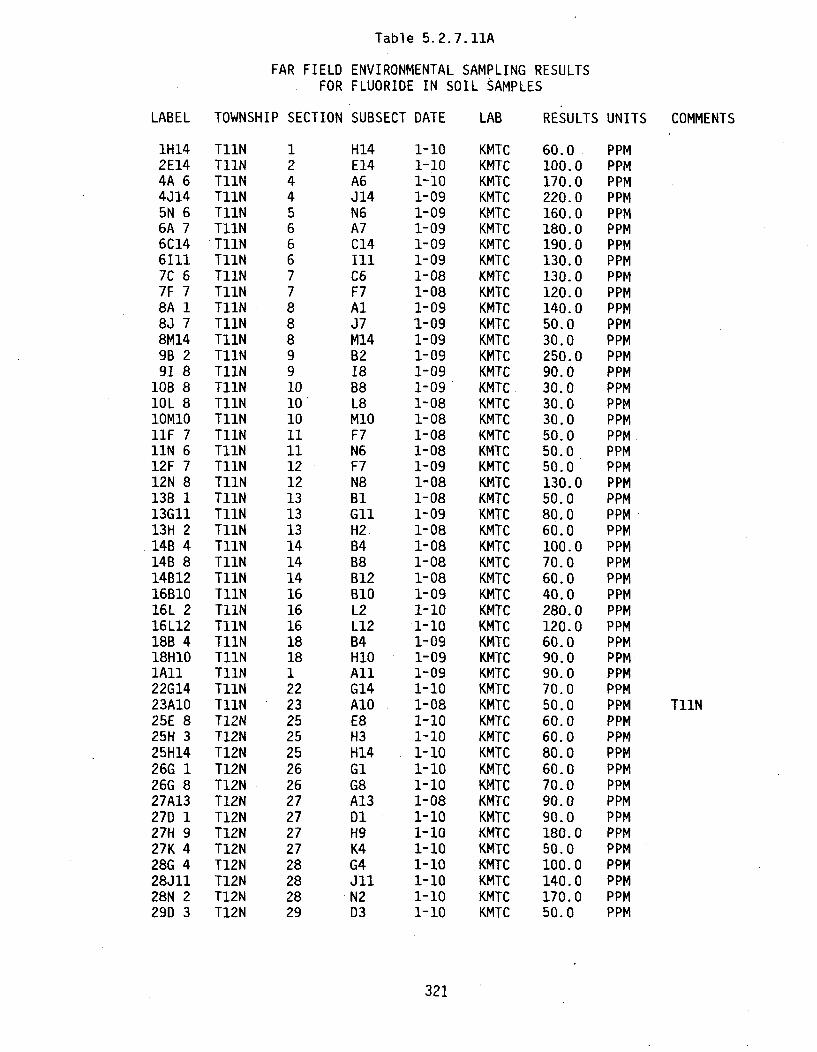
Table 5.2.7.11A
FAR FIELD ENVIRONMENTAL SAMPLING RESULTSFOR FLUORIDE IN SOIL SAMPLES
LABEL TOWNSHIP SECTION SUBSECT DATE
1H142E144A 64J145N 66A 76C1461117C 67F 78A 18J 78M149B 291 8
lOB 81OL 8loMlo11F 711N 612F 712N 813B 113G1113H 214B 414B 814B1216B1016L 216L1218B 418H10lAll22G1423A1025E 825H 325H1426G 126G 827A1327D 127H 927K 428G 428J1128N 229D 3
T11NT11NT11NT11NT11NT11NT11NT11NT11NT11NT11NT11NT11NT11NT11NT11NT11NT11NT11NT11NT11NT11NT11NT11NT11NT11NT11NT11NT11NT11NT11NT11NT11NT11NT11NT11NT12NT12NT12NT12NT12NT12NT12NT12NT12NT12NT12NT12NT12N
1244566677888991010101111121213131314141416161618181222325252526262727272728282829
H14E14A6J14N6A7C14illC6F7AlJ7M14B218B8L8M1OF7N6F7N8B1GllH2B4B8B12B10L2L12B4H1OAllG14A1OE8H3H14G1G8A13D1H9K4G4JllN2D3
1-101-101-101-091-091-091-091-091-081-081-091-091-091-091-091-091-081-081-081-081-091-081-081-091-081-081-081-081-091-101-101-091-091-091-101-081-101-101-101-101-101-081-101-101-101-101-101-101-10
LAB
KMTCKMTCKMTCKMTCKMTCKMTCKMTCKMTCKMTCKMTCKMTCKMTCKMTCKMTCKMTCKMTCKMTCKMTCKMTCKMTCKMTCKMTCKMTCKMTCKMTCKMTCKMTCKMTCKMTCKMTCKMTCKMTCKMTCKMTCKMTCKMTCKMTCKMTCKMTCKMTCKMTCKMTCKMTCKMTCKMTCKMTCKMTCKMTCKMTC
RESULTS UNITS COMMENTS
60.0100.0170.0220.0160.0180.0190.0130.0130.0120.0140.050.030.0250.090.030.030.030.050.050.050.0130.050.080.060.0100.070.060.040.0280.0120.060.090.090.070.050.060.060.080.060.070.090.090.0180.050.0100.0140.0170.050.0
PPMPPMPPMPPMPPMPPMPPMPPMPPMPPMPPMPPMPPMPPMPPMPPMPPMPPMPPMPPMPPMPPMPPMPPMPPMPPMPPMPPMPPMPPMPPMPPMPPMPPMPPMPPMPPMPPMPPMPPMPPMPPMPPMPPMPPMPPMPPMPPMPPM
T11N
321
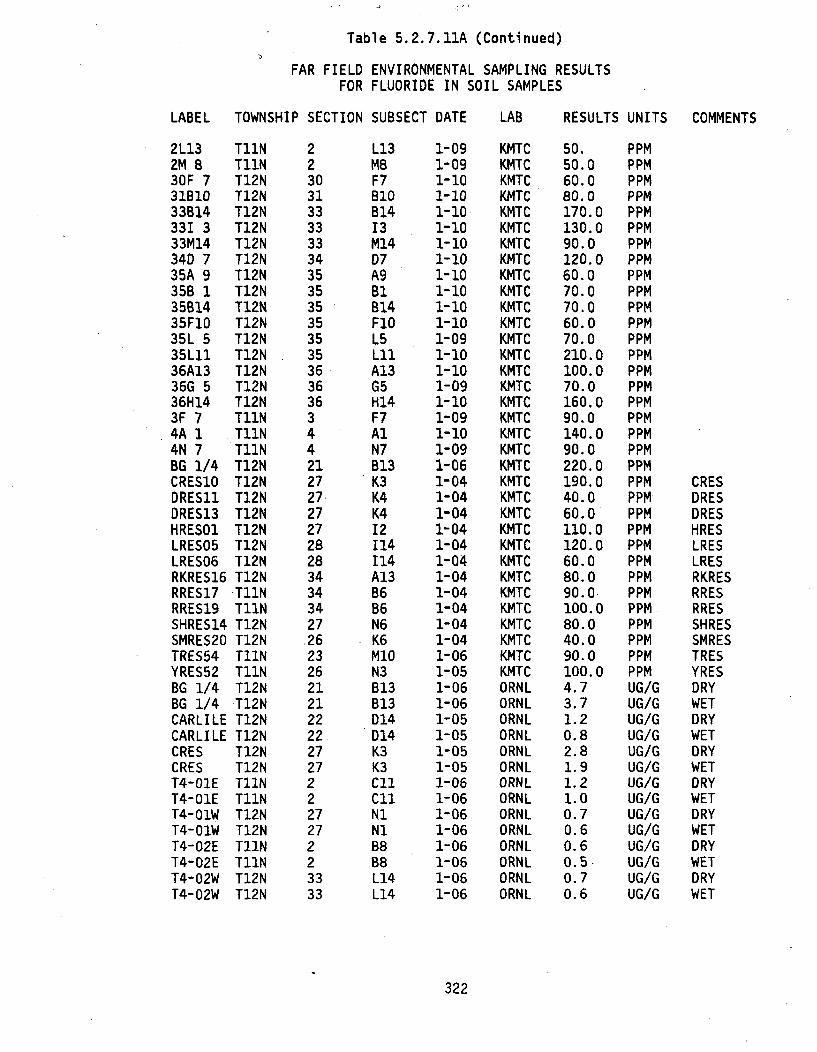
Table 5.2.7.11A (Continued)
FAR FIELD ENVIRONMENTAL SAMPLING RESULTSFOR FLUORIDE IN SOIL SAMPLES
LABEL TOWNSHIP SECTION SUBSECT DATE
2L132M 830F 73181033B14331 333M1434D 735A 935B 135B1435F1035L 535L1136A1336G 536H143F 74A 14N 7BG 1/4CRES1ODRESl1DRES13HRESO1LRES05LRES06RKRES16RRES17RRES19SHRES14SMRES20TRES54YRES52BG 1/4BG 1/4CARLILECARLILECRESCREST4-OIET4-OIET4-O1WT4-O1WT4-02ET4-02ET4-02WT4-02W
T11NT11NT12NT12NT12NT12NT12NT12NT12NT12NT12NT12NT12NT12NT12NT12NT12NT11NT11NT11NT12NT12NT12NT12NT12NT12NT12NT12NT11NT12NT12NT12NT11NT12NT12NT12NT12NT12NT12NT12NT11N
T12NT12NT12NTIINT12NT12N
22303133333334353535353535363636344212727.2727282834343427.262326212122222727222727223333
L13M8F7B10B1413M14D7A9B1B14FIOL5LIIA13G5H14F7AlN7B13K3K4K412114114A13B6B6N6K6M1ON3B13B13D14D14K3K3Cl'CllN1N1B8B8L14L14
1-091-091-101-101-101-101-101-101-101-101-101-101-091-101-101-091-101-091-101-091-061-041-041-041-041-041-041-041-041-041-041-041-061-051-061-061-051-051-051-051-061-061-061-061-061-061-061-06
LAB
KMTCKMTCKMTCKMTCKMTCKMTCKMTCKMTCKMTCKMTCKMTCKMTCKMTCKMTCKMTCKMTCKMTCKMTCKMTCKMTCKMTCKMTCKMTCKMTCKMTCKMTCKMTCKMTCKMTCKMTCKMTCKMTCKMTCKMTCORNLORNLORNLORNLORNLORNLORNLORNLORNLORNLORNLORNLORNLORNL
RESULTS UNITS
50.50.060.080.0170.0130.090.0120.060.070.070.060.070.0210.0100.070.0160.090.0140.090.0220.0190.040.060.0110.0120.060.080.090.01100.080.040.090.0100.04.73.71.20.82.81.91.21.00.70.60.60.50.70.6
PPMPPMPPMPPMPPMPPMPPMPPMPPMPPMPPMPPMPPMPPMPPMPPMPPMPPMPPMPPMPPMPPMPPMPPMPPMPPMPPMPPMPPMPPMPPMPPMPPMPPMUG/GUG/GUG/GUG/GUG/GUG/GUG/GUG/GUG/GUG/GUG/GUG/GUG/GUG/G
COMMENTS
CRESDRESDRESHRESLRESLRESRKRESRRESRRESSHRESSMRESTRESYRESDRYWETDRYWETDRYWETDRYWETDRYWETDRYWETDRYWET
322
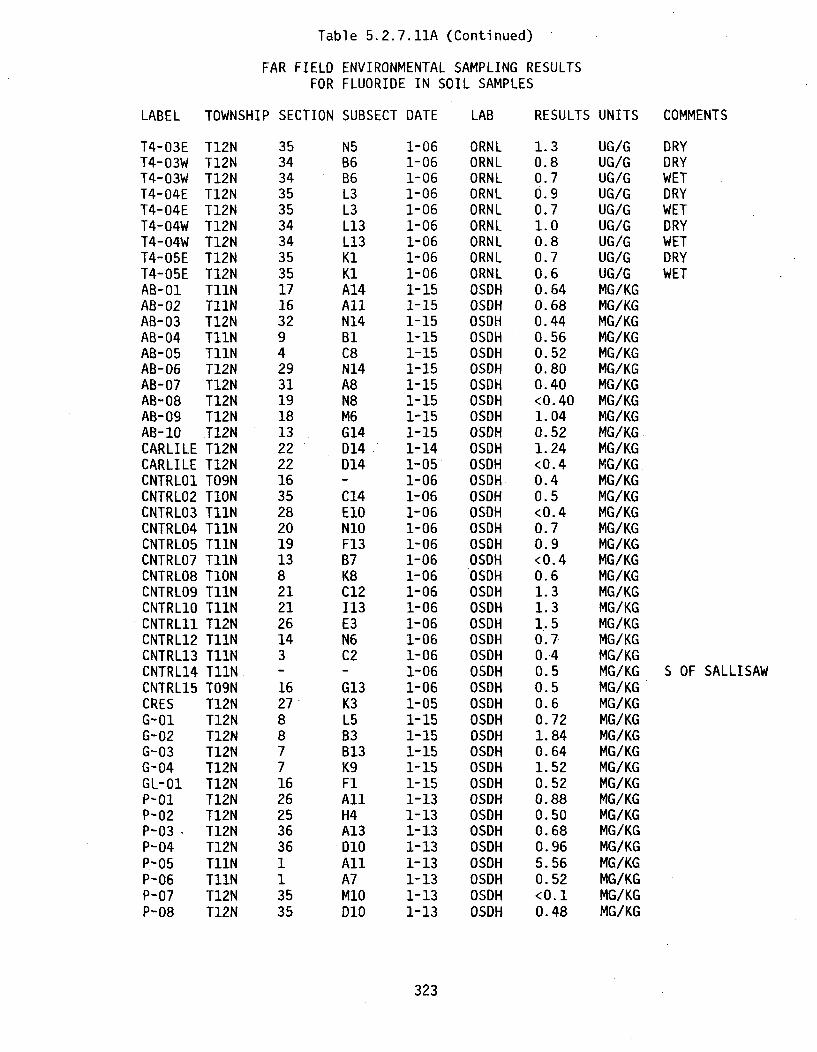
Table 5.2.7.11A (Continued)
FAR FIELD ENVIRONMENTAL SAMPLING RESULTSFOR FLUORIDE IN SOIL SAMPLES
LABEL TOWNSHIP SECTION SUBSECT DATE
T4-03ET4-03WT4-03WT4-04ET4-04ET4-04WT4-04WT4-05ET4-05EAB-01AB-02AB-03AB-04AB-05AB-06AB-07AB-08AB-09AB-IOCARLILECARLILECNTRL01CNTRL02CNTRL03CNTRL04CNTRL05CNTRL07CNTRL08CNTRL09CNTRL1OCNTRL11CNTRL12CNTRL13CNTRL14CNTRL15CRESG-01G-02G-03G-04GL-01P-01P-02P-03P-04P-05P-06P-07P-08
T12NT12NT12NT12NT12NT12NT12NT12NT12NT11NT11NT12NT11NT11NT12NT12NT12NT12NT12NT12NT12NTO9NTIONT11NT11NT11NT11NTIONT11NT11NT12NT11NT11NT11NTO9NT12NT12NT12NT12NT12NT12NT12NT12NT12NT12NT11NT11NT12NT12N
35343435353434353517163294293119181322221635282019138212126143
162788771626253636113535
N5B6B6L3L3L13L13K1K1A14AllN14B1C8N14A8N8M6G14D14D14
C14E1ON1OF13B7K8C12113E3N6C2
G13K3L5B3B13K9F1AllH4A13D1OAllA7M1ODID
1-061-061-061-061-061-061-061-061-061-151-151-151-151-151-151-151-151-151-151-141-051-061-061-061-061-061-061-061-061-061-061-061-061-061-061-051-151-151-151-151-151-131-131-131-131-131-131-131-13
LAB
ORNLORNLORNLORNLORNLORNLORNLORNLORNLOSDHOSDHOSDHOSDHOSDHOSDHOSDHOSDHOSDHOSDHOSDHOSDHOSDHOSDHOSDHOSDHOSDHOSDHOSDHOSDHOSDHOSDHOSDHOSDHOSDHOSDHOSDHOSDHOSDHOSDHOSDHOSDHOSDHOSDHOSDHOSDHOSDHOSDHOSDHOSDH
RESULTS UNITS
1.30.80.70.90.71.00.80.70.60.640.680. 440.560.520.800.40<0.401.040.521.24<0.40.40.5<0.40.70.9
0.61.31.31.50.70.40.50.50.60.721.840.641.520.520.880.500.680.965.560.52<0.10.48
UG/GUG/GUG/GUG/GUG/GUG/GUG/GUG/GUG/GMG/KGMG/KGMG/KGMG/KGMG/KGMG/KGMG/KGMG/KGMG/KGMG/KGMG/KGMG/KGMG/KGMG/KGMG/KGMG/KGMG/KGMG/KGMG/KGMG/KGMG/KGMG/KGMG/KGMG/KGMG/KGMG/KGMG/KGMG/KGMG/KGMG/KGMG/KGMG/KGMG/KGMG/KGMG/KGMG/KGMG/KGMG/KGMG/KGMG/KG
COMMENTS
DRYDRYWETDRYWETDRYWETDRYWET
S OF SALLISAW
323

Table 5.2.7.11A (Continued)
FAR FIELD ENVIRONMENTAL SAMPLING RESULTSFOR FLUORIDE IN SOIL SAMPLES
LABEL TOWNSHIP SECTION SUBSECT DATE
P- 09T3-08T4-O1ET4-O1WT4-02ET4-02WT4-03ET4-03WT4-04ET4-04WT4-05EWR-01WR-02WR-03WR-05WR-07WR-08WR-09WR-IO
T12NT12NT11NT12NT11NT12NT12NT12NT12NT12NT12NT11NT11NTIINT11NT11NT11NT11NT11N
26262272333534353435151717966617
H6C12CliN1B8L14N5B6L3L13K1AlA14114AlN14N7G1Al
1-131-141-061-061-061-061-061-061-061-061-061-151-151-151-151-151-151-151-15
LAB
OSDHOSDHOSDHOSDHOSDHOSDHOSDHOSDHOSOHOSDHOSDHOSDHOSDHOSDHOSDHOSDHOSDHOSDHOSDH
RESULTS UNITS COMMENTS
1. 161.241.11.1<0.82.3<0.81.6<0.81.41.21.401.641.121.28<0.401.080.52<0. 40
MG/KGMG/KGMG/KGMG/KGMG/KGMG/KGMG/KGMG/KGMG/KGMG/KGMG/KGMG/KGMG/KGMG/KGMG/KGMG/KGMG/KGMG/KGMG/KG
324
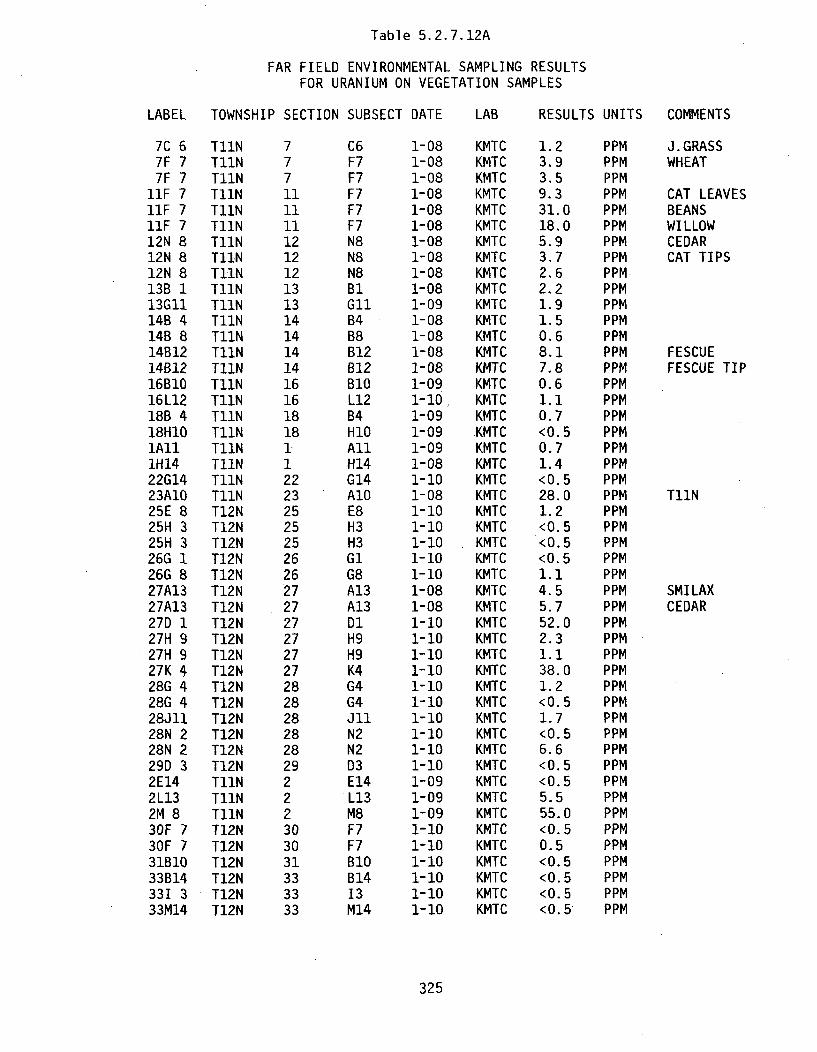
Table 5.2.7.12A
FAR FIELD ENVIRONMENTAL SAMPLING RESULTSFOR URANIUM ON VEGETATION SAMPLES
LABEL TOWNSHIP SECTION SUBSECT DATE
7C 67F 77F 7
11F 711F 711F 712N 812N 812N 813B 113G1114B 414B 814B1214B1216B1016L1218B 418H10lAll1H1422G1423A1025E 825H 325H 326G 126G 827A1327A1327D 127H 927H 927K 428G 428G 428J1128N 228N 229D 32E142L132M 830F 730F 731B1033B14331 333M14
T11NT11NT11NT11NT11NT11NT11NT11NT11NT11NT11NT11NT11NT11NT11NT11NT11NT11NT11NT11NT11NT11NT11NT12NT12NT12NT12NT12NT12NT12NT12NT12NT12NT12NT12NT12NT12NT12NT12NT12NT11NT11NT11NT12NT12NT12NT12NT12NT12N
77712hII
I2121212
1313141414141616181811
22232525252626272727272727282828282829222303031333333
C6F7F7F7F7F7N8N8N8B1GilB4B8B12B12BIOL12B4H1OAllH14G14A1OE8H3H3G1G8A13A13DlH9H9K4G4G4JillN2N2D3E14L13M8F7F7BlOB1413M14
1-081-081-081-081-081-081-081-081-081-081-091-081-081-081-081-091-101-091-091-091-081-101-081-101-101-101-101-101-081-081-101-101-101-101-101-101-101-101-101-101-091-091-091-101-101-101-101-101-10
LAB
KMTCKMTCKMTCKMTCKMTCKMTCKMTCKMTCKMTCKMTCKMTCKMTCKMTCKMTCKMTCKMTCKMTCKMTCKMTCKMTCKMTCKMTCKMTCKMTCKMTCKMTCKMTCKMTCKMTCKMTCKMTCKMTCKMTCKMTCKMTCKMTCKMTCKMTCKMTCKMTCKMTCKMTCKMTCKMTCKMTCKMTCKMTCKMTCKMTC
RESULTS UNITS
1.23.93.59.331.018.05.93.72.62.21.91.50.68.17.80.61.10.7<0.50.71.4<0.528.01.2<0.5<0.5<0.51.14.55.752.02.31.138.01.2<0. 51.7<0.56.6<0. 5<0.55.555.0<0.50.5<0.5<0.5<0.5<0.5
PPMPPMPPMPPMPPMPPMPPMPPMPPMPPMPPMPPMPPMPPMPPMPPMPPMPPMPPMPPMPPMPPMPPMPPMPPMPPMPPMPPMPPMPPMPPMPPMPPMPPMPPMPPMPPMPPMPPMPPMPPMPPMPPMPPMPPMPPMPPMPPMPPM
COMMENTS
J.GRASSWHEAT
CAT LEAVESBEANSWILLOWCEDARCAT TIPS
FESCUEFESCUE TIP
T11N
SMILAXCEDAR
325
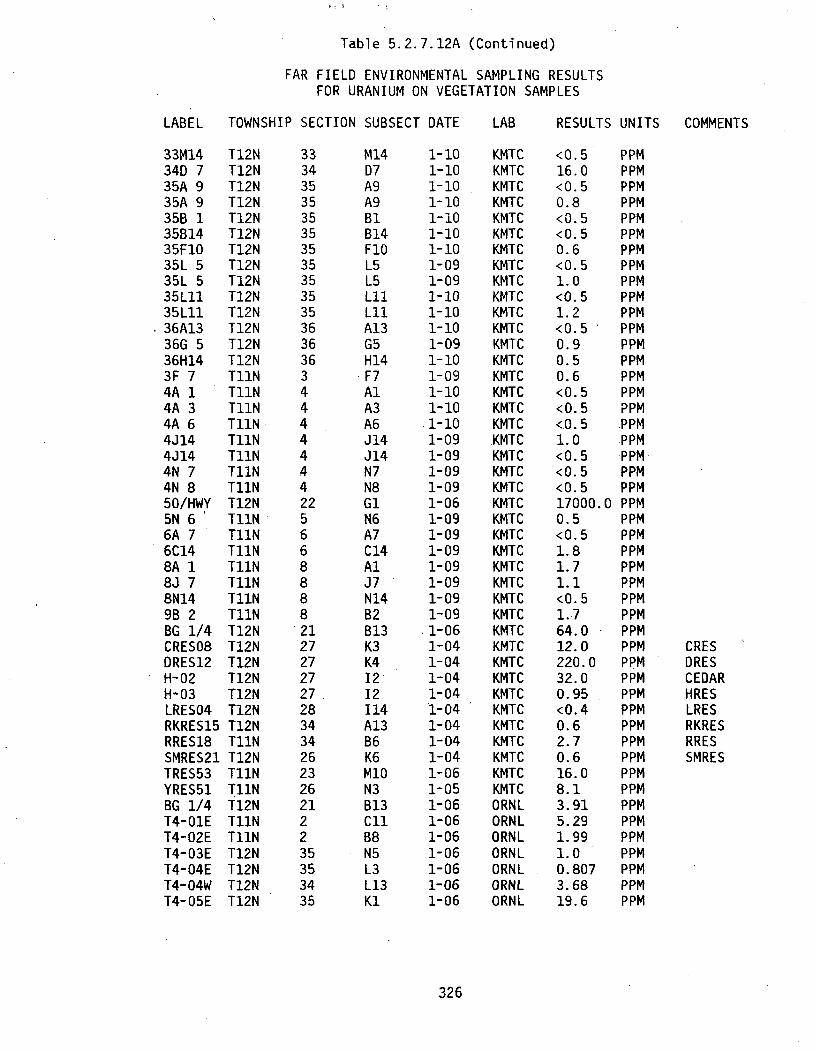
Table 5.2.7.12A (Continued)
FAR FIELD ENVIRONMENTAL SAMPLING RESULTSFOR URANIUM ON VEGETATION SAMPLES
LABEL TOWNSHIP SECTION SUBSECT DATE
33M1434D 735A 935A 935B 135B1435F1035L 535L 535L1135L1136A1336G 536H143F 74A 14A 34A 64J144J144N 74N 850/HWY5N 66A 76C148A I8J 78N149B 2BG 1/4CRES08DRES12H-02H-03LRES04RKRES15RRES18SMRES21TRES53YRES51BG 1/4T4-O1ET4-02ET4-03ET4-04ET4-04WT4-05E
T12NT12NT12NT12NT12NT12NT12NT12NT12NT12NT12NT12NT12NT12NT11NT11NT11NT11NT11NT11NT11NT11NT12NT11NT11NT11NT11NT11NT11NT11NT12NT12NT12NT12NT12NT12NT12NT11NT12NT11NT11NT12NT11NT11NT12NT12NT12NT12N
3334353535353535353535363636344444442256688882127272727283434262326212235353435
M14D7A9A9B1B14F1OL5L5L11L11A13G5H14F7AlA3A6J14J14N7N8G1N6A7C14AlJ7N14B2B13K3K41212114A13B6K6MION3B13C11B8N5L3L13K1
1-101-101-101-101-10:1-101-101-091-091-101-101-101-091-101-091-101-101-101-091-091-091-091-061-091-091-091-091-091-091-091-061-041-041-041-041-041-041-041-041-061-051-061-061-061-061-061-061-06
LAB
KMTCKMTCKMTCKMTCKMTCKMTCKMTCKMTCKMTCKMTCKMTCKMTCKMTCKMTCKMTCKMTCKMTCKMTCKMTCKMTCKMTCKMTCKMTCKMTCKMTCKMTCKMTCKMTCKMTCKMTCKMTCKMTCKMTCKMTCKMTCKMTCKMTCKMTCKMTCKMTCKMTCORNLORNLORNLORNLORNLORNLORNL
RESULTS UNITS COMMENTS
<0.516.0<0.50.8<0.5<0. 50.6<0.51.0<0.51.2<0.50.90.50.6<0.5<0.5<0.51.0<0.5<0.5<0. 517000.00.5<0.51.81.71.1<0. 51.764.012.0220.032.00.95<0.40.62.70.616.08.13.915.291.991.00.8073.6819.6
PPMPPMPPMPPMPPMPPMPPMPPMPPMPPMPPMPPMPPMPPMPPMPPMPPMPPMPPMPPMPPMPPMPPMPPMPPMPPMPPMPPMPPMPPMPPMPPMPPMPPMPPMPPMPPMPPMPPMPPMPPMPPMPPMPPMPPMPPMPPMPPM
CRESORESCEDARHRESLRESRKRESRRESSMRES
326

fable b.Z./.±MA
FAR FIELD ENVIRONMENTAL SAMPLING RESULTSFOR URANIUM IN SOIL SAMPLES
LABEL TOWNSHIP SECTION SUBSECT DATE
IH142E144A 64J145N 66A 76C1461117C 67F 78A 18J 78N149B 291 8
lOB 81OL 8lOMiO11F 711N 612F 712N 813B 113GII13H 214B 414B 814B1216B1016L 216L1218B 418HlOlAll22G1423A1025E 825H 325H1426G 126G 827A1327D 127H 927K 428G 428JII28N 229D 3
T11NT11NT11NT11NT11NT11NT11NT11NT11NT11NT11NT11NT11NT11NT11NTIINT11NT11NT11NT11NT11NT11NT11NT11NT11NT11NT11NT11NT11NT11NT11NT11NT1lNT11NT11NT11NT12NT12NT12NT12NT12NT12NT12NT12NT12NT12NT12NT12NT12N
1244566677888991010101111121213131314141416161618181222325252526262727272728282829
H14E14A6J14N6A7C14IllC6F7AlJ7M14B218B8L8MIOF7N6F7N8BiGllH2B4B8B12B10L2L12B4HIOAllG14AlOE8H3H14G1G8A13DlH9K4G4JllN2D3
1-101-101-101-091-091-091-091-091-081-081-091-091-091-091-091-091-081-081-081-081-091-081-081-091-081-081-081-081-091-101-101-091-091-091-101-081-101-101-101-101-101-081-101-101-101-101-101-101-10
LAB
KMTCKMTCKMTCKMTCKMTCKMTCKMTCKMTCKMTCKMTCKMTCKMTCKMTCKMTCKMTCKMTCKMTCKMTCKMTCKMTCKMTCKMTCKMTCKMTCKMTCKMTCKMTCKMTCKMTCKMTCKMTCKMTCKMTCKMTCKMTCKMTCKMTCKMTCKMTCKMTCKMTCKMTCKMTCKMTCKMTCKMTCKMTCKMTCKMTC
RESULTS UNITS
<10<10<10<10<10<10<10<10<10<10<10<1020.0<1015.0<10<10<10<10<10<10<1015.015.015.0<1015.015.0<10<10<10<10<10<10<1010.015.015.015.015.010.010.015.0<1015.0<10<10<1015.0
PPMPPMPPMPPMPPMPPMPPMPPMPPMPPMPPMPPMPPMPPMPPMPPMPPMPPMPPMPPMPPMPPMPPMPPMPPMPPMPPMPPMPPMPPMPPMPPMPPMPPMPPMPPMPPMPPMPPMPPMPPMPPMPPMPPMPPMPPMPPMPPMPPM
COMMENTS
T11N
327

Table 5.2.7.13A (Continued)
FAR FIELD ENVIRONMENTAL SAMPLING RESULTSFOR URANIUM IN SOIL SAMPLES
LABEL TOWNSHIP SECTION SUBSECT DATE
2L132L132M 830F 731B1033B14331 333M1434D 735A 935B 135B1435F1035L 535L1136A1336G 536H143F 74A I4N 7BG 1/4CRES09CRESlODRES11DRES13HRES01LRES05LRES06RKRES16RRES17RRES19SHRES14SMRES20TRES54YRES52BG 1/4BG 1/4CARLILECARLILECRESCREST4-OIET4-O1ET4-O1WT4-O1WT4-02ET4-02ET4-02W
T11NT11NT11NT12NT12NT12NT12NT12NT12NT12NT12NT12NT12NT12NT12NT12NT12NT12NT11NT11NT11NT12NT12NT12NT12NT12NT12NT12NT12NT12NT11NT11NT12NT12NT1INT11NT12NT12NT12NT12NT12NT12NT11NT11NT12NT12NT11NT11NT12N
2223031333333343535353535353636363442127272727272828343434272623262121222227272227272233
L13L13M8F7B10B1413M14D7A9B1B14F10L5L11A13G5H14F7AlN7B13K3K3K4K412114114A13B6B6N6K6M1ON3B13B13D14D14K3K3CIICIIN1N1B8B8L14
1-091-091-091-101-101-101-101-101-101-101-101-101-101-091-101-101-091-101-091-101-091-061-041-041-041-041-041-041-041-041-041-041-041-041-061-051-061-061-051-051-051-051-061-061-061-061-061-061-06
LAB
KMTCKMTCKMTCKMTCKMTCKMTCKMTCKMTCKMTCKMTCKMTCKMTCKMTCKMTCKMTCKMTCKMTCKMTCKMTCKMTCKMTCKMTCKMTCKMTCKMTCKMTCKMTCKMTCKMTCKMTCKMTCKMTCKMTCKMTCKMTCKMTCORNLORNLORNLORNLORNLORNLORNLORNLORNLORNLORNLORNLORNL
RESULTS UNITS
<10<10<1015.0<10<10<10<10<1015.010.010.015.010.0<10<10<10<10<10<10<10<10<10<1015.013.0<10<10<10<10<10<10<1011.0<10<107.886.13.72.72.92.03.723.11.521.33.593.01.5
PPMPPMPPMPPMPPMPPMPPMPPMPPMPPMPPMPPMPPMPPMPPMPPMPPMPPMPPMPPMPPMPPMPPMPPMPPMPPMPPMPPMPPMPPMPPMPPMPPMPPMPPMPPMPPMPPMPPMPPMPPMPPMPPMPPMPPMPPMPPMPPMPPM
COMMENTS
CRESCRESDRESDRESHRESLRESLRESRKRESRRESRRESSHRESSMRES
DRYWETDRYWETDRYWETDRYWETDRYWETDRYWETWET
328
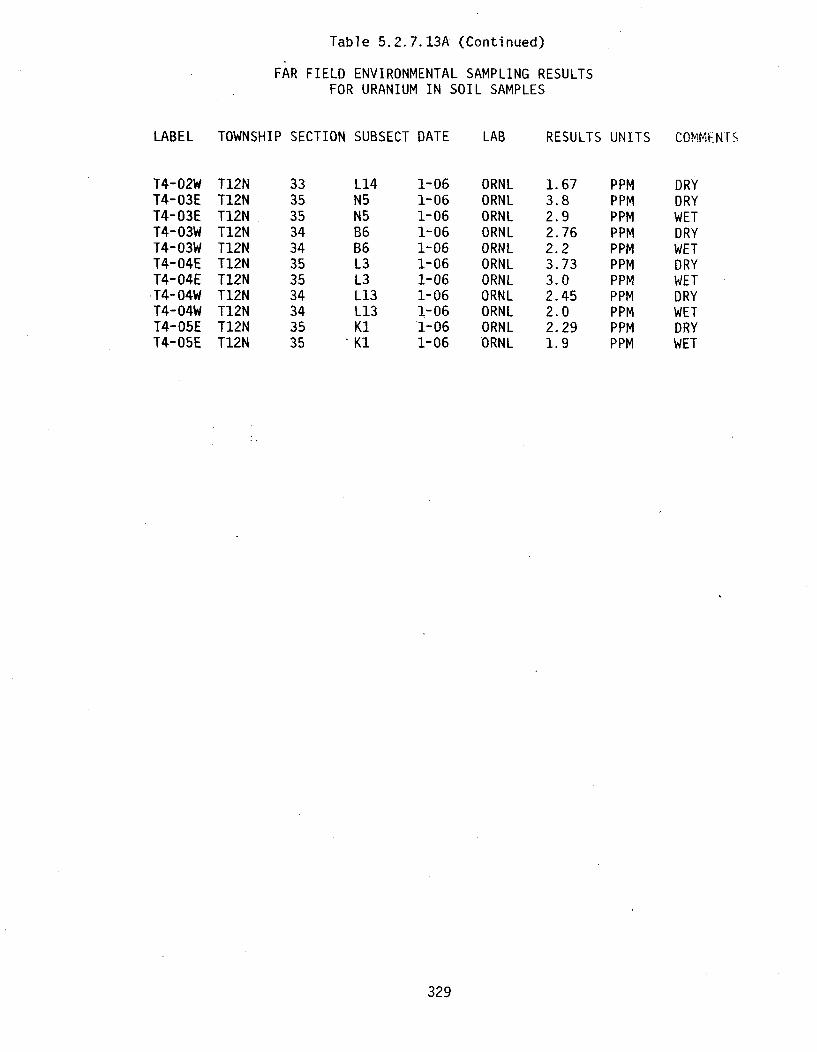
Table 5.2.7.13A (Continued)
FAR FIELD ENVIRONMENTAL SAMPLING RESULTSFOR URANIUM IN SOIL SAMPLES
LABEL TOWNSHIP SECTION SUBSECT DATE
T4-02WT4-03ET4-03ET4-03WT4-03WT4-04ET4-04ET4-04WT4-04WT4-05ET4-05E
T12NT12NT12NT12NT12NT12NT12NT12NT12NT12NT12N
3335353434353534343535
L14N5N5B6B6L3L3L13L13KIK1
1-061-061-061-061-061-061-061-061-061-061-06
LAB
ORNLORNLORNLORNLORNLORNLORNLORNLORNLORNLORNL
RESULTS UNITS COMMFNTS
1.673.82.92.762.23.733.02.452.02.291.9
PPMPPMPPMPPMPPMPPMPPMPPMPPMPPMPPM
DRYDRYWETDRYWETDRYWETDRYWETDRYWET
329

FAR FIELD ENVIRONMENTAL SAMPLING RESULTSFOR ALPHA ON VEGETATION SAMPLES
LABEL TOWNSHIP SECTION SUBSECT DATE
CARLILE T12NCNTRL01 TO9NCNTRL02 TiONCNTRL03 T11NCNTRL04 T11NCNTRL05 T11NCNTRL06 TO9NCNTRL07 T11NCNTRL08 TIONCNTRL09 T11NCNTRL09 T11NCNTRL1O T11NCNTRL11 T12NCNTRL13 T11NCNTRL15 TO9NCRES T12NHRES T12NT4-01E T11NT4-02E T11NT4-03E T12NT4-04E T12NT4-04W T12NT4-05E .T12N
22163528201941382121212631627272235353435
D14
C14ElON1OF13113B7K8C12C12113E3C2G13K312CliB8N5L3L13K1
1-051-061-061-061-061-061-061-061-061-061-061-061-061-061-061-05
1-061-061-061-061-061-06
LAB
OSDHOSDHOSDHOSDHOSDHOSDHOSDHOSDHOSOHOSDHOSDHOSDHOSDHOSDHOSDHOSDHOSDHOSDHOSDHOSDHOSDHOSDHOSDH
RESULTS UNITS
0.8-0.40.20. 10.5-0.3-0.4-0.31.01.00.40.10.20.2-0.31.15.00.3-0.2-0.10.0-0.14.5
PCI/GPCI/GPCI/GPCI/GPCI/GPCI/GPCI/GPCI/GPCI/GPCI/GPCI/GPCI/GPCI/GPCI/GPCI/GPCI/GPCI/GPCI/GPCI/GPCI/GPCI/GPCI/GPCI/G
COMMENTS
GRASS
GRASS
EVERGREENEVERGREENEVERGREENEVERGREENLEAVESEVERGREEN
330
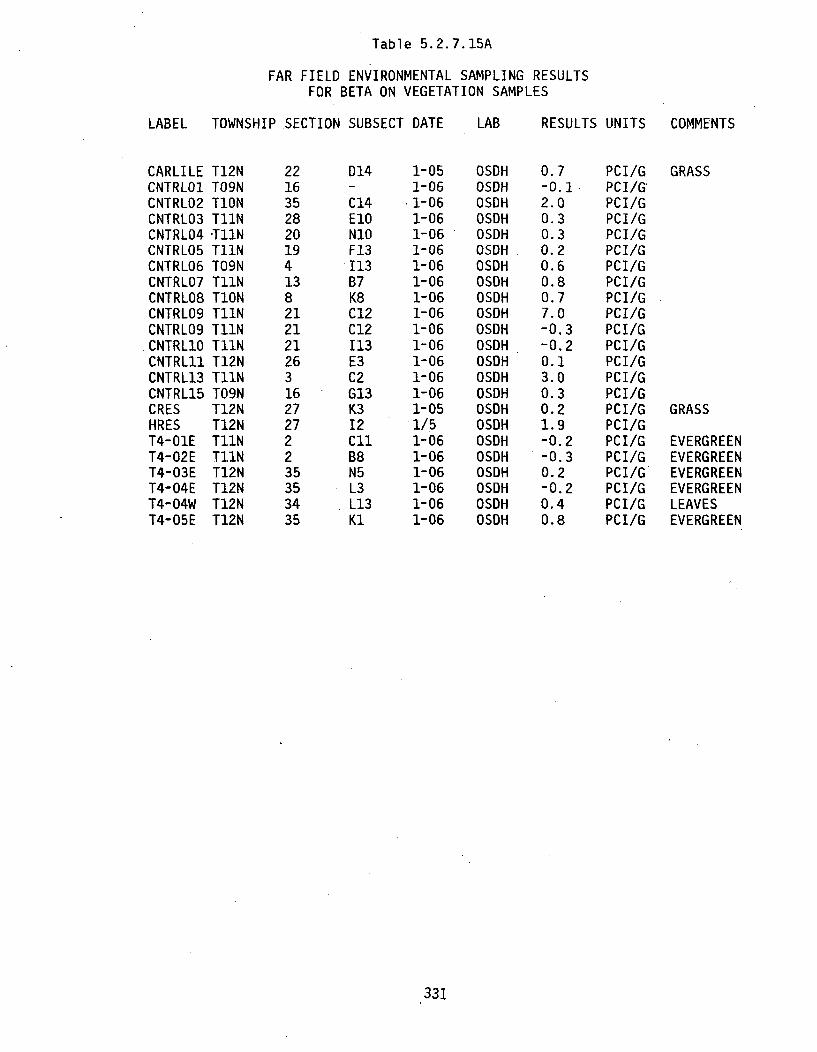
Table 5.2.7.15A
FAR FIELD ENVIRONMENTAL SAMPLING RESULTSFOR BETA ON VEGETATION SAMPLES
LABEL TOWNSHIP SECTION SUBSECT DATE LAB RESULTS UNITS
CARLILECNTRLO1CNTRL02CNTRL03CNTRL04CNTRL05CNTRL06CNTRL07CNTRL08CNTRL09CNTRL09CNTRL1OCNTRL11CNTRL13CNTRL15CRESHREST4-O1ET4-02ET4-03ET4-04ET4-04WT4-05E
T12NTO9NTIONT11N-T11NT11NTO9NT11NTIONT11NT11NT11NT12NT11NTO9NT12NT12NT11NT11NT12NT12NT12NT12N
22163528201941382121212631627272235353435
D14
C14EION1OF13113B7K8C12C12113E3C2G13K312CiIB8N5L3L13K1
1-051-061-061-061-061-061-061-061-061-061-061-061-061-061-061-051/51-061-061-061-061-061-06
OSDHOSDHOSDHOSDHOSDHOSDHOSDHOSDHOSDHOSDHOSDHOSDHOSDHOSDHOSDHOSDHOSDHOSDHOSDHOSDHOSDHOSDHOSDH
0.7-0.12.00.30.30.20.60.80.77.0-0.3-0.20.13.00.30.21.9-0.2-0.30.2-0.20.40.8
PCI/GPCI/GPCI/GPCI/GPCI/GPCI/GPCI/GPCI/GPCI/GPCI/GPCI/GPCI/GPCI/GPCI/GPCI/GPCI/GPCI/GPCI/GPCI/GPCI/GPCI/GPCI/GPCI/G
COMMENTS
GRASS
GRASS
EVERGREENEVERGREENEVERGREENEVERGREENLEAVESEVERGREEN
331

tadte ),Z.I.IbA
FAR FIELD ENVIRONMENTAL SAMPLING RESULTSFOR ALPHA ON SOIL SAMPLES
LABEL TOWNSHIP SECTION SUBSECT DATE
CARLILECNTRL01CNTRL02CNTRL03CNTRL04CNTRL05CNTRL07CNTRL08CNTRL09CNTRL1OCNTRL11CNTRL12CNTRL13CNTRL14CNTRL15CREST4-OIET4-O1WT4-02ET4-02WT4-03ET4-03WT4-04ET4-04WT4-05E
T12NTO9NTIONT11NT11NT11NT11NTIONT11NT11NT12NT11NT11NT11NTO9NT12NT11NT12NT11NT12NT12NT12NT12NT12NT12N
221635282019138212126143
16272272333534353435
DI4
C14E10N1OF13B7K8C12113E3N6C2
G13K3C1lNiB8L14N5B6L3L13K1
1-051-061-061-061-061-061-061-061-061-061-061-061-061-061-061-051-061-061-061-061-061-061-061-061-06
LAB
OSDHOSDHOSDHOSDHOSDHOSDHOSDHOSDHOSDHOSDHOSDHOSDHOSDHOSDHOSDHOSDHOSDHOSDHOSDHOSDHOSDHOSDHOSDHOSDHOSDH
RESULTS UNITS COMMENTS
0.10.80.4-0.21.1-0.3-0.30.40.1-0.3-0.30.50.40.7-0.3-0.1-0.3-0.20.40.70.10.10.10.1-0.3
PCI/GPCI/GPCI/GPCI/GPCI/GPCI/GPCI/GPCI/GPCI/GPCI/GPCI/GPCI/GPCI/GPCI/GPCI/GPCI/GPCI/GPCI/GPCI/GPCI/GPCI/GPCI/GPCI/GPCI/GPCI/G
S OF SALLISAW
332

Table 5.2.7.17A
FAR FIELD ENVIRONMENTAL SAMPLING RESULTSFOR BETA IN SOIL SAMPLES
LABEL TOWNSHIP SECTION SUBSECT DATE LAB RESULTS UNITS COMMENTS
CARLILECNTRL01CNTRL02CNTRL03CNTRL04CNTRL05CNTRL07CNTRL08CNTRL09CNTRL1OCNTRL11CNTRL12CNTRL13CNTRL14CNTRL15CREST4-O1ET4-O1WT4-02ET4-02WT4-03ET4-03WT4-04ET4-04WT4-05E
T12NTO9NTIONT11NT11NT11NT11NTIONT11NT11NT12NT11NT11NT11NTO9NT12NT11NT12NT11NT12NT12NT12NT12NT12NT12N
221635282019138212126143
16272272333534353435
D14
C14E1ON1OF13B7K8C12113E3N6C2
G13K3C1iN1B8L14N5B6L3L13KI
1-051-061-061-061-061-061-061-061-061-061-061-061-061-061-061-051-061-061-061-061-061-061-061-061-06
OSDHOSDHOSDHOSDHOSDHOSDHOSDHOSDHOSDHOSDHOSDHOSDHOSDHOSDHOSDHOSDHOSDHOSDHOSDHOSDHOSDHOSDHOSDHOSDHOSDH
-0.3-0.30.3-0.0-0.3-0.00.5-0.4-0.30.3-0.20.90.50.6-0.4-0.00.1-0.2-0.20.10.6-0.60.1-0.4-0.4
PCI/GPCI/GPCI/GPCI/GPCI/GPCI/GPCI/GPCI/GPCI/GPCI/GPCI/GPCI/GPCI/GPCI/GPCI/GPCI/GPCI/GPCI/GPCI/GPCI/GPCI/GPCI/GPCI/GPCI/GPCI/G
S OF SALLISAW
333
NEAR FIELD ENVIRONMENTAL SAMPLING RESULTS BY TYPE OF SAMPLESORTED BY LABEL
334

Table 5.2.7.18A
NEAR FIELD ENVIRONMENTAL SAMPLING RESULTSFOR FLUORIDE SAMPLES
LABEL
1W2W3W4W5W6W7W8W
low11W12W13W14W14W15W15W17W18W19W20W
103105106108109111112115116117118119120121122123124125126127128129130131132133134135
NORTH EAST LAB DATE MEDIA RESULT UNITS COMMENTS
1450013250127501170010100
98501060011800118001635067507475
18450184501290012900
765015100
68507750
13800117001170010600106001425014250115001065010650
9750975097009700960096009700970097509750
106501065010650106501160011600
92509250
1480013950112001115010950
94507000700062009450
1105013350
69506950595059504350
103009050
1700010200845084508750875084508450
1160012300123001245012450
8850885099009900
107001070011850118501130011300103501035010650106501315013150
KMTCKMTCKMTCKMTCKMTCKMTCKMTCKMTCKMTCKMTCKMTCKMTCKMTCKMTCKMTCKMTCKMTCKMTCKMTCKMTCKMTCKMTCKMTCKMTCKMTCKMTCKMTCKMTCKMTCKMTCKMTCKMTCKMTCKMTCKMTCKMTCKMTCKMTCKMTCKMTCKMTCKMTCKMTCKMTCKMTCKMTCKMTCKMTC
1-061-061-061-061-061-061-061-061-061-061-061-061-061-081-061-081-061-081-081-081-091-091-091-091-091-091-091-091-091-091-091-091-091-091-091-091-091-091-091-091-091-091-091-091-091-091-091-09
WATERWATERWATERWATERWATERWATERWATERWATERWATERWATERWATERWATERWATERWATERWATERWATERWATERWATERWATERWATERSOILVEGSOILVEGSOILVEGSOILSOILVEGSOILVEGSOILVEGSOILVEGSOILVEGSOILVEGSOILVEGSOILVEGSOILVEGSOILVEGSOIL
0.10.10.20.20.40.10.20.30.1<0. I0.1<0.1<0.1<0. 1<0.1<0.10.20.10.20.1120.020.0150.030.0160.040.0110.0100.010.080.014.0110.020.070.0210.0130.0100.060.020.090.035.080.070.070.080.0110.028.090.0
mg/img/Img/Img/lmg/img/img/Img/lmg/lmg/Img/lmg/lmg/lmg/Img/lmg/lmg/lmg/img/lmg/lppmppmppmppmppmppmppmppmppmppmppmppmppmppmppmppmppmppmppmppmppmppmppmppmppmppmppmppm
335
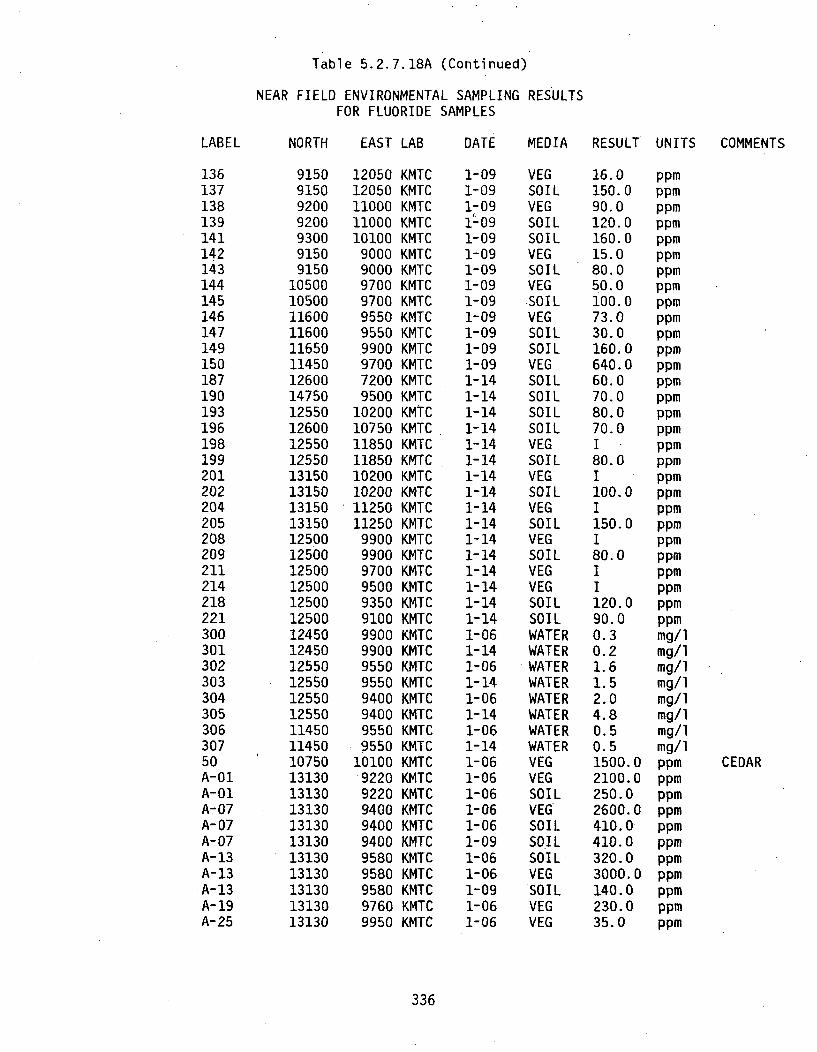
Table 5.2.7.18A (Continued)
NEAR FIELD ENVIRONMENTAL SAMPLING RESULTSFOR FLUORIDE SAMPLES
LABEL
13613713813914114214314414514614714915018719019319619819920120220420520820921121421822130030130230330430530630750A-01A-01A-07A- 07A-07A- 13A- 13A-13A- 19A-25
NORTH EAST LAB DATE MEDIA RESULT UNITS COMMENTS
9150915092009200930091509150
1050010500116001160011650114501260014750125501260012550125501315013150131501315012500125001250012500125001250012450124501255012550125501255011450114501075013130131301313013130131301313013130131301313013130
1205012050110001100010100
9000900097009700955095509900970072009500
1020010750118501185010200102001125011250
99009900970095009350910099009900955095509400940095509550
101009220922094009400940095809580958097609950
KMTCKMTCKMTCKMTCKMTCKMTCKMTCKMTCKMTCKMTCKMTCKMTCKMTCKMTCKMTCKMTCKMTCKMTCKMTCKMTCKMTCKMTCKMTCKMTCKMTCKMTCKMTCKMTCKMTCKMTCKMTCKMTCKMTCKMTCKMTCKMTCKMTCKMTCKMTCKMTCKMTCKMTCKMTCKMTCKMTCKMTCKMTCKMTC
1-091-091-091P091-091-091-091-091-091-091-091-091-091-141-141-141-141-141-141-141-141-141-141-141-141-141-141-141-141-061-141-061-141-061-141-061-141-061-061-061-061-061-091-061-061-091-061-06
VEGSOILVEGSOILSOILVEGSOILVEGSOILVEGSOILSOILVEGSOILSOILSOILSOILVEGSOILVEGSOILVEGSOILVEGSOILVEGVEGSOILSOILWATERWATERWATERWATERWATERWATERWATERWATERVEGVEGSOILVEG'SOILSOILSOILVEGSOILVEGVEG
16.0150.090.0120.0160.015.080.050.0100.073.030.0160.0640.060.070.080.070.0I
80.0I
100.0I150.0I80.0II
120.090.00.30.21.61.52.04.80.50.51500.02100.0250.02600.0410.0410.0320.03000.0140.0230.035.0
ppmppmppmppmppmppmppmppmppmppmppmppmppmppmppmppmppmppmppmppmppmppmppmppmppmppmppmppmppmmg/Img/img/img/img/img/img/img/ippmppmppmppmppmppmppmppmppmppmppm
CEDAR
336
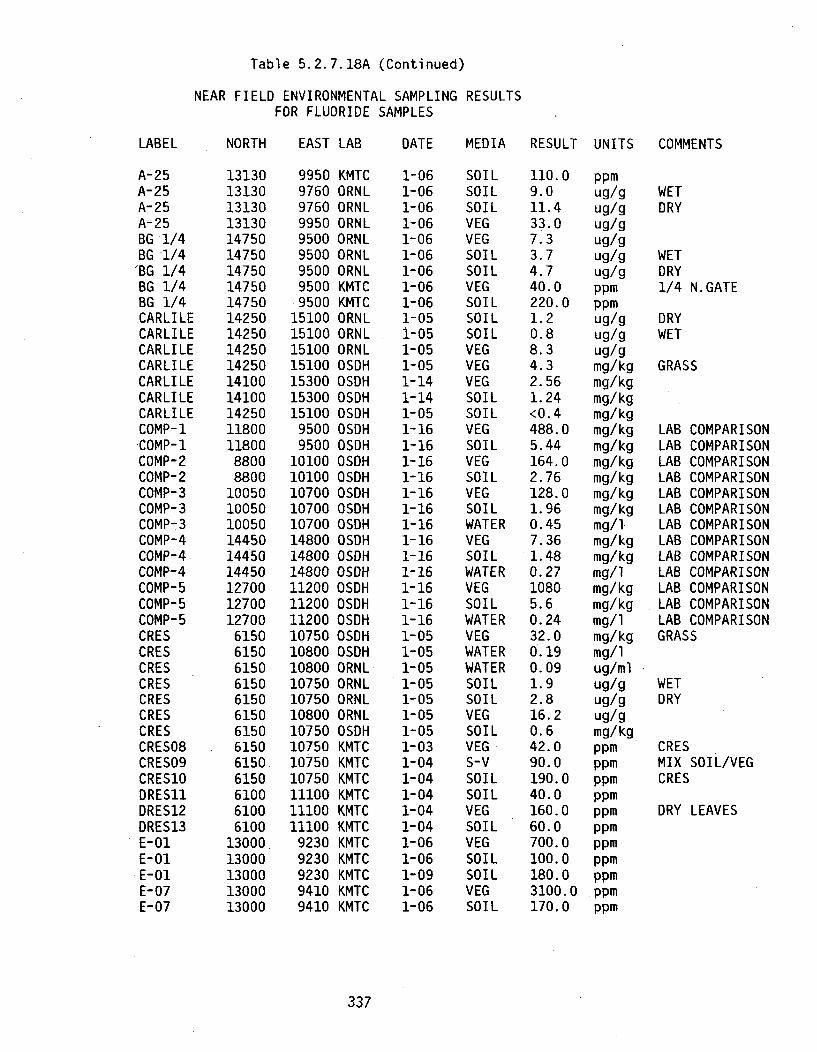
Table 5.2.7.18A (Continued)
NEAR FIELD ENVIRONMENTAL SAMPLING RESULTSFOR FLUORIDE SAMPLES
LABEL, NORTH EAST LAB DATE MEDIA RESULT UNITS COMMENTS
A-25A-25A-25A- 25BG 1/4BG 1/4'BG 1/4BG 1/4BG 1/4CARLILECARLILECARLILECARLILECARLILECARLILECARLILECOMP-1COMP-1COMP-2COMP-2COMP-3COMP-3COMP-3COMP-4COMP-4COMP-4COMP-5COMP-5COMP-5CRESCRESCRESCRESCRESCRESCRESCRES08CRES09CRES1ODRES11DRES12DRES13E-01E-01E-01E-07E-07
13130131301313013130147501475014750147501475014250142501425014250141001410014250118001180088008800
100501005010050144501445014450127001270012700
6150615061506150615061506150615061506150610061006100
1300013000130001300013000
99509760976099509500950095009500
.950015100151001510015100153001530015100
95009500
101001010010700107001070014800148001480011200112001120010750108001080010750107501080010750107501075010750111001110011100
92309230923094109410
KMTCORNLORNLORNLORNLORNLORNLKMTCKMTCORNLORNLORNLOSDHOSDHOSDHOSDHOSDHOSDHOSDHOSDHOSDHOSDHOSDHOSDHOSDHOSDHOSDHOSDHOSDHOSDHOSDHORNLORNLORNLORNLOSDHKMTCKMTCKMTCKMTCKMTCKMTCKMTCKMTCKMTCKMTCKMTC
1-061-061-061-061-061-061-061-061-061-051-051-051-051-141-141-051-161-161-161-161-161-161-161-161-161-161-161-161-161-051-051-051-051-051-051-051-031-041-041-041-041-041-061-061-091-061-06
SOILSOILSOILVEGVEGSOILSOILVEGSOILSOILSOILVEGVEGVEGSOILSOILVEGSOILVEGSOILVEGSOILWATERVEGSOILWATERVEGSOILWATERVEGWATERWATERSOILSOILVEGSOILVEGS-VSOILSOILVEGSOILVEGSOILSOILVEGSOIL
110.09.011.433.07.33.74.740.0220.01.20.88.34.32.561.24<0.4488.05.44164.02.76128.01.960.457.361.480.2710805.60.2432.00.190.091.92.816.20.642.090.0190.040.0160.060.0700.0100.0180.03100.0170.0
ppmug/gug/gug/gug/gug/gug/gppmppmug/gug/gug/gmg/kgmg/kgmg/kgmg/kgmg/kgmg/kgmg/kgmg/kgmg/kgmg/kgmg/i.mg/kgmg/kgmg/Img/kgmg/kgmg/lmg/kgmg/lug/mlug/gug/gug/gmg/kgppmppmppmppmppmppmppmppmppmppmppm
WETDRY
WETDRY1/4 N.GATE
DRYWET
GRASS
LAB COMPARISONLAB COMPARISONLAB COMPARISONLAB COMPARISONLAB COMPARISONLAB COMPARISONLAB COMPARISONLAB COMPARISONLAB COMPARISONLAB COMPARISONLAB COMPARISONLAB COMPARISONLAB COMPARISONGRASS
WETDRY
CRESMIX SOIL/VEGCRES
DRY LEAVES
337
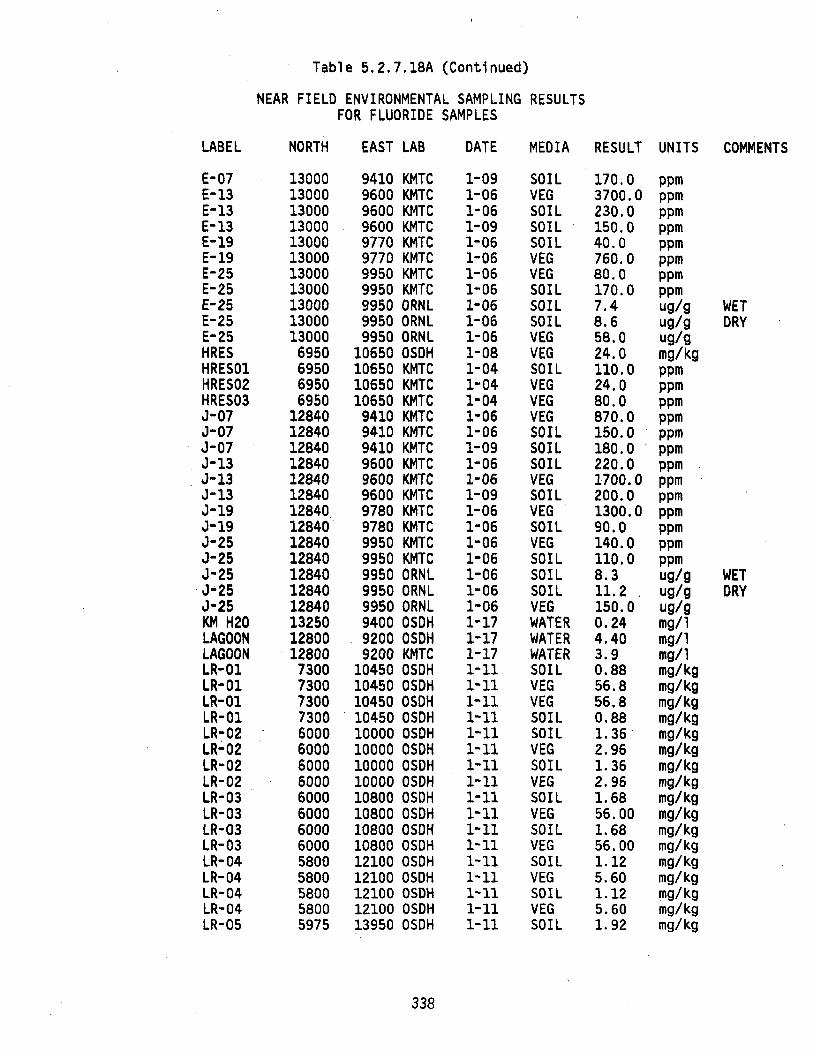
Table 5.2.7.18A (Continued)
NEAR FIELD ENVIRONMENTAL SAMPLING RESULTSFOR FLUORIDE SAMPLES
LABEL
E-07E-13E-13E-13E-19E-19E-25E-25E-25E-25E- 25HRESHRES01HRES02HRES03J-07J-07J-07J-13J-13J-13J-19J-19J-25J-25J-25J-25J-25KM H20LAGOONLAGOONLR-01LR-01LR-01LR-01LR-02LR-02LR-02LR-02LR-03LR-03LR-03LR-03LR-04LR-04LR-04LR-04LR-05
NORTH EAST LAB DATE MEDIA RESULT UNITS COMMENTS
1300013000130001300013000130001300013000130001300013000
6950695069506950
12840128401284012840128401284012840128401284012840128401284012840132501280012800
73007300730073006000600060006000600060006000600058005800580058005975
94109600960096009770977099509950995099509950
10650106501065010650
9410941094109600960096009780978099509950995099509950940092009200
1045010450104501045010000100001000010000108001080010800108001210012100121001210013950
KMTCKMTCKMTCKMTCKMTCKMTCKMTCKMTCORNLORNLORNLOSDHKMTCKMTCKMTCKMTCKMTCKMTCKMTCKMTCKMTCKMTCKMTCKMTCKMTCORNLORNLORNLOSDHOSDHKMTCOSDHOSDHOSDHOSDHOSDHOSDHOSDHOSDHOSDHOSDHOSDHOSDHOSDHOSDHOSDHOSDHOSDH
1-091-061-061-091-061-061-061-061-061-061-061-081-041-041-041-061-061-091-061-061-091-061-061-061-061-061-061-061-171-171-171-11
1-111-111-111-111-111-1.11-111-111-111-111-111-111-111-111-11
SOILVEGSOILSOILSOILVEGVEGSOILSOILSOILVEGVEGSOILVEGVEGVEGSOILSOILSOILVEGSOILVEGSOILVEGSOILSOILSOILVEGWATERWATERWATERSOILVEGVEGSOILSOILVEGSOILVEGSOILVEGSOILVEGSOILVEGSOILVEGSOIL
170.03700.0230.0150.040.0760.080.0170.07.48.658.024.0110.024.080.0870.0150.0180.0220.01700.0200.01300.090.0140.0110.08.311.2150.00.244.403.90.8856.856.80.881.362.961.362.961.6856.001.6856.001.125.601.125.601.92
ppmppmppmppmppmppmppmppmug/gug/gug/gmg/kgppmppmppmppmppmppmppmppmppmppmppmppmppmug/gug/gug/gmg/lmg/lmg/lmg/kgmg/kgmg/kgmg/kgmg/kgmg/kgmg/kgmg/kgmg/kgmg/kgmg/kgmg/kgmg/kgmg/kgmg/kgmg/kgmg/kg
WETDRY
WETDRY
338
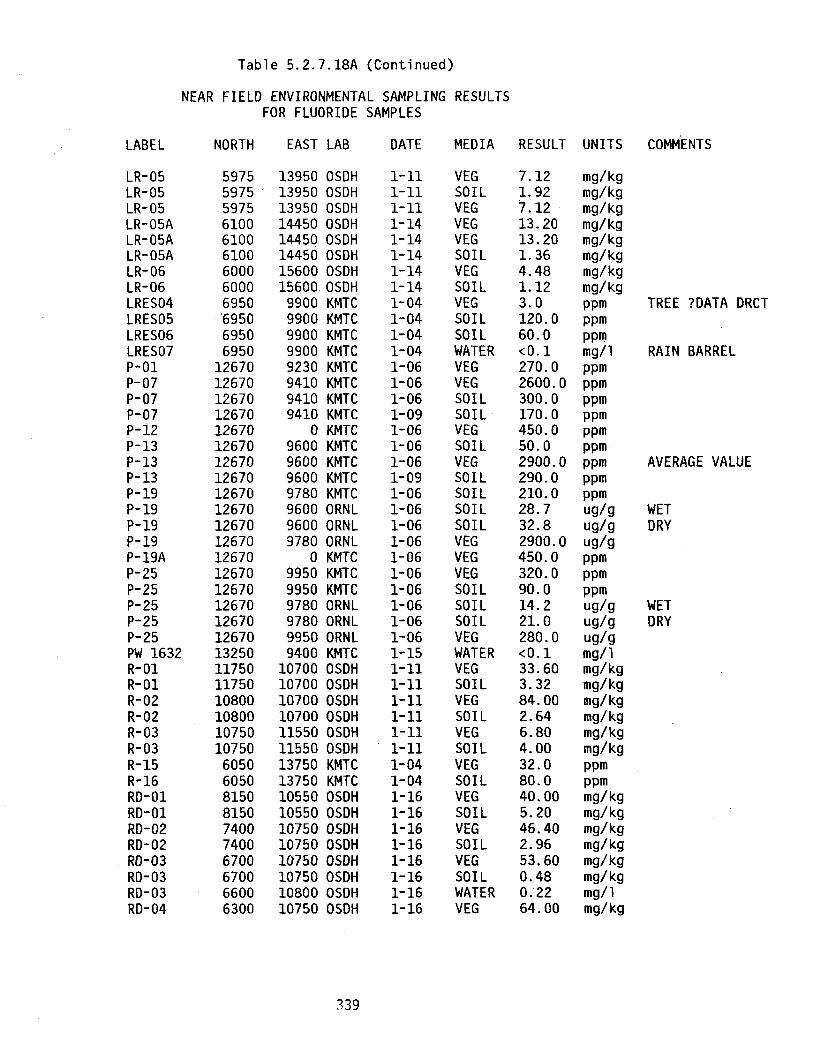
Table 5.2.7.18A (Continued)
NEAR FIELD ENVIRONMENTAL SAMPLING RESULTSFOR FLUORIDE SAMPLES
LABEL
LR-05LR-05LR-05LR-O5ALR-O5ALR-05ALR-06LR-06LRES04LRES05LRES06LRES07P-01P-07P-07P-07P-12P-13P-13P- 13P-19P- 19P- 19P- 19P-19AP-25P-25P-25P-25P-25PW 1632R- 01R-01R-02R-02R-03R-03R-15R-16RD-01RD-01RD-02RD-02RD-03RD-03RD-03RD-04
NORTH EAST LAB DATE MEDIA RESULT UNITS COMMENTS
597559755975610061006100600060006950695069506950
1267012670126701267012670126701267012670126701267012670126701267012670126701267012670126701325011750117501080010800
.1075010750
6050605081508150740074006700670066006300
1395013950139501445014450144501560015600
99009900990099009230941094109410
09600960096009780960096009780
0995099509780978099509400
10700107001070010700115501155013750137501055010550107501075010750107501080010750
OSDHOSDHOSDHOSDHOSDHOSDHOSDHOSDHKMTCKMTCKMTCKMTCKMTCKMTCKMTCKMTCKMTCKMTCKMTCKMTCKMTCORNLORNLORNLKMTCKMTCKMTCORNLORNLORNLKMTCOSDHOSDHOSDHOSDHOSDHOSDHKMTCKMTCOSDHOSDHOSDHOSDHOSDHOSDHOSDHOSDH
1-111-111-111-141-141-141-141-141-041-041-041-041-061-061-061-091-061-061-061-091-061-061-061-061-061-061-061-061-061-061-151-111-111-111-111-11
1-041-041-161-161-161-161-161-161-161-16
VEGSOILVEGVEGVEGSOILVEGSOILVEGSOILSOILWATERVEGVEGSOILSOILVEGSOILVEGSOILSOILSOILSOILVEGVEGVEGSOILSOILSOILVEGWATERVEGSOILVEGSOILVEGSOILVEGSOILVEGSOILVEGSOILVEGSOILWATERVEG
7.121.927.1213.2013.201.364.481.123.0120.060.0<0.1270.02600.0300.0170.0450.050.02900.0290.0210.028.732.82900.0450.0320.090.014.221.0280.0<0.133.603.3284.002.646.804.0032.080.040.005.2046.402.9653.600.480.'2264.00
mg/kgmg/kgmg/kgmg/kgmg/kgmg/kgmg/kgmg/kgppmppmppmmg/ippmppmppmppmppmppmppmppmppmug/gug/gug/gppmppmppmug/gug/gug/gmg/img/kgmg/kgmg/kgmg/kgmg/kgmg/kgppmppmmg/kgmg/kgmg/kgmg/kgmg/kgmg/kgmg/img/kg
TREE ?DATA DRCT
RAIN BARREL
AVERAGE VALUE
WETDRY
WETDRY
339

Table 5.2.7.18A (Continued)
NEAR FIELD ENVIRONMENTAL SAMPLING RESULTSFOR FLUORIDE SAMPLES
LABEL NORTH EAST LAB DATE MEDIA RESULT UNITS COMMENTS
RD-04RD-04RD-05RD-06RD-07RD-08SM-20SM-21STRM GHT1-01T1-01T1-01T1-01T1-01T1-01T1-01T1-02T1-02T1-02T1-02T1-02T1-02Ti-03T1-03Tl-03T1-03T1-03Ti-03&4Tl-04T1-04T1-04Tl-04Tl-04Tl-04T1-04Tl-05Ti-05Tl-05Tl-05TI-05Tl-05T1-05T1-06T1-06
6300635062006900
10100990074507450
126501250012500125001250012500125001250012500125001250012500125001250012500125001250012500125001250012500125001250012500125001250012500125001250012500125001250012500125001250012500
1075010750108501020010700
94501725017250
955072007200720072007200720072008000800080008000800080008550855085508550855087508900890089008900890089008900920092009200920092009200920095009500
OSDHOSDHOSDHOSOHOSDHOSDHKMTCKMTCOSDHOSDHOSDHOSDHORNLORNLORNLORNLOSDHOSDHOSDHORNLORNLORNLOSDHOSDHORNLORNLORNLOSDHOSDHOSDHOSDHOSDHORNLORNLORNLOSDHOSDHOSDHOSDHORNLORNLORNLOSDHOSDH
1-161-161-161-161-161-161-041-041-161-051-051-141-051-051-051-051-051-051-141-051-051-051-051-051-051-051-051-141-051-051-141-141-051-051-051-051-051-141-141-051-051-051-051-05
SOILWATERWATERWATERWATERWATERSOILVEGWATERSOILVEGVEGSOILSOILVEGVEGSOILVEGSOILSOILSOILVEGSOILVEGSOILSOILVEGWATERSOILVEGVEGSOILSOILSOILVEGSOILVEGVEGSOILSOILSOILVEGSOILVEG
8.800.300.170.190.320.2040.05.07.000.81.23.683.12.31.71.7<0.41.80.921.41.21.21.32.64.23.44.70.230.910.44.961.847.55.719.24.8408.028.84.0823.517.71800.03.6500.0
mg/kgmg/lmg/img/img/img/ippmppmmg/img/kgmg/kgmg/kgug/gug/gug/gug/gmg/kgmg/kgmg/kgug/gug/gug/gmg/kgmg/kgug/gug/gug/gmg/img/kgmg/kgmg/kgmg/kgug/gug/gug/gmg/kgmg/kgmg/kgmg/kgug/gug/gug/gmg/kgmg/kg
LEAVES
EVERGREEN
DRYWET
GRASS
DRYWET
GRASSDRYWET
EVERGREEN
DRYWET
EVERGREEN
DRYWET
GRASS
340
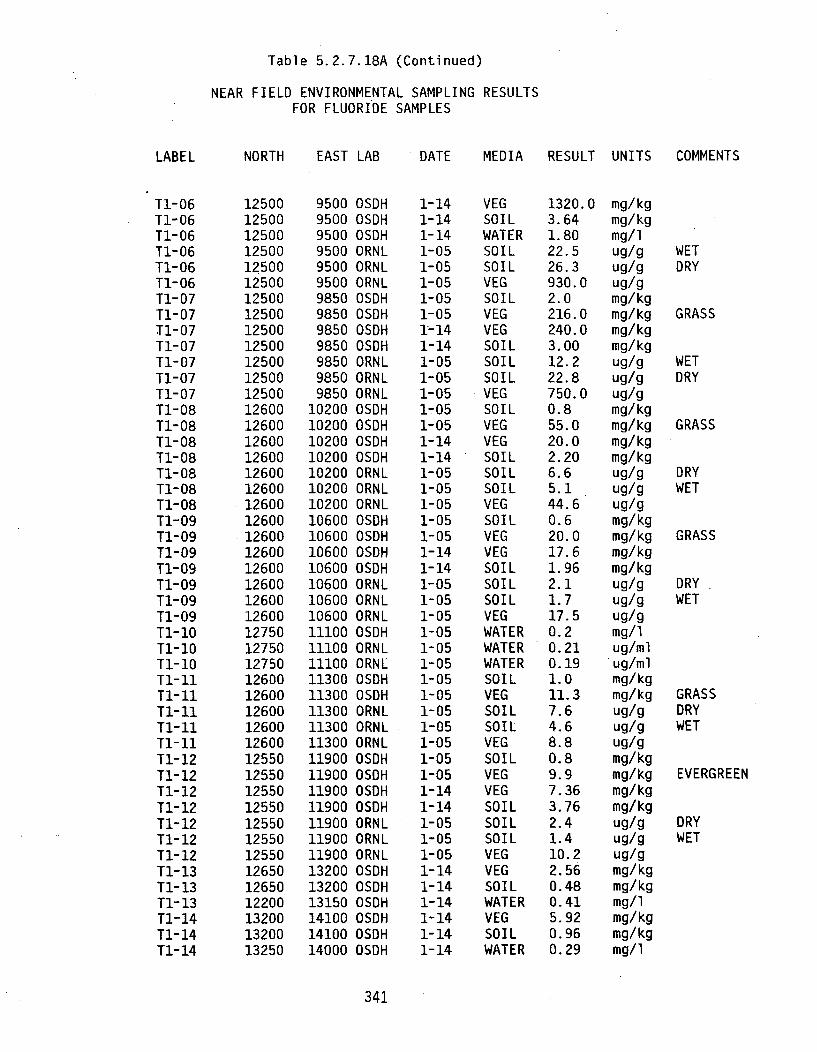
Table 5.2.7.18A (Continued)
NEAR FIELD ENVIRONMENTAL SAMPLING RESULTSFOR FLUORIDE SAMPLES
LABEL
T1-06T1-06T1-06T1-06T1-06T1-06T1-07T1-07T1-07T1-07T1-07T1-07Ti-07T1-08T1-08T1-08T1-08T1-08TI-08Tl-08T1-09T1-09T1-09T1-09T1-09T1-09T1-09T1-10Ti-10Ti-10T1-11T1-11T1-11T1-11T1-11T1-12T1-12Tl-12T1-12Tl-12T1-12Tl-12T1-13T1-13Tl-13T1-14T1-14T1-14
NORTH EAST LAB DATE MEDIA RESULT UNITS COMMENTS
125001250012500125001250012500125001250012500125001250012500125001260012600126001260012600126001260012600126001260012600126001260012600127501275012750126001260012600126001260012550125501255012550125501255012550126501265012200132001320013250
9500950095009500950095009850985098509850985098509850
1020010200102001020010200102001020010600106001060010600106001060010600111001110011100113001130011300113001130011900119001190011900119001190011900132001320013150141001410014000
OSDHOSDHOSDHORNLORNLORNLOSDHOSDHOSDHOSDHORNLORNLORNLOSDHOSDHOSDHOSDHORNLORNLORNLOSDHOSDHOSDHOSDHORNLORNLORNLOSDHORNLORNLOSDHOSDHORNLORNLORNLOSDHOSDHOSDHOSDHORN LORNLORNLOSDHOSDHOSDHOSDHOSDHOSDH
1-141-141-141-051-051-051-051-051-141-141-051-051-051-051-051-141-141-051-051-051-051-051-141-141-051-051-051-051-051-051-051-051-051-051-051-051-051-141-141-051-051-051-141-141-141-141-141-14
VEGSOILWATERSOILSOILVEGSOILVEGVEGSOILSOILSOILVEGSOILVEGVEGSOILSOILSOILVEGSOILVEGVEGSOILSOILSOILVEGWATERWATERWATERSOILVEGSOILSOILVEGSOILVEGVEGSOILSOILSOILVEGVEGSOILWATERVEGSOILWATER
1320.03.641.8022.526.3930.02.0216.0240.03.0012.222.8750.00.855.020.02.206.65.144.60.620.017.61.962.11.717.50.20.210.191.011.37.64.68.80.89.97.363.762.41.410.22.560.480.415.920.960.29
mg/kgmg/kgmg/iug/gug/gug/gmg/kgmg/kgmg/kgmg/kgug/gug/gug/gmg/kgmg/kgmg/kgmg/kgug/gug/gug/gmg/kgmg/kgmg/kgmg/kgug/gug/gug/gmg/iug/mlug/mlmg/kgmg/kgug/gug/gug/gmg/kgmg/kgmg/kgmg/kgug/gug/gug/gmg/kgmg/kgmg/lmg/kgmg/kgmg/I
WETDRY
GRASS
WETDRY
GRASS
DRYWET
GRASS
DRYWET
GRASSDRYWET
EVERGREEN
DRYWET
341
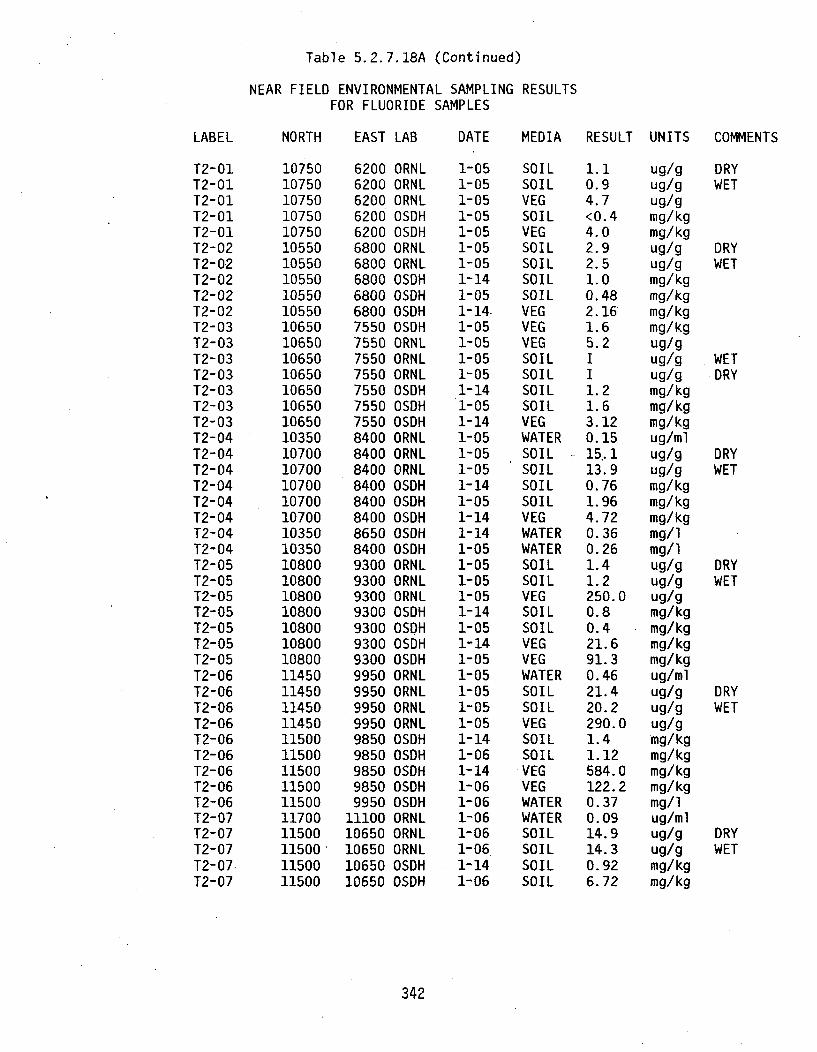
Table 5.2.7.18A (Continued)
NEAR FIELD ENVIRONMENTAL SAMPLING RESULTSFOR FLUORIDE SAMPLES
LABEL
T2-01T2-01T2-01T2-01T2-01T2-02T2-02T2-02T2-02T2-02T2-03T2-03T2-03T2-03T2-03T2-03T2-03T2-04T2-04T2-04T2-04T2-04T2-04T2-04T2-04T2-05T2-05T2-05T2-05T2-05T2-05T2-05T2-06T2-06T2-06T2-06T2-06T2-06T2-06T2-06T2-06T2-07T2-07T2-07T2-07T2-07
NORTH EAST LAB DATE MEDIA RESULT UNITS COMMENTS
10750107501075010750107501055010550105501055010550106501065010650106501065010650106501035010700107001070010700107001035010350108001080010800108001080010800108001145011450114501145011500115001150011500115001170011500115001150011500
62006200620062006200680068006800680068007550755075507550755075507550840084008400840084008400865084009300930093009300930093009300995099509950995098509850985098509950
1110010650106501065010650
ORNLORNLORNLOSDHOSDHORNLORNLOSDHOSDHOSDHOSDHORNLORNLORNLOSDHOSDHOSDHORNLORNLORNLOSDHOSDHOSDHOSDHOSDHORNLORNLORNLOSDHOSDHOSDHOSDHORNLORNLORNLORNLOSDHOSDHOSDHOSDHOSDHORNLORNLORNLOSDHOSDH
1-051-051-051-051-051-051-051-141-051-14-1-051-051-051-051-141-051-141-051-051-051-141-051-141-141-051-051-051-051-141-051-141-051-051-051-051-051-141-061-141-061-061-061-061-061-141-06
SOILSOILVEGSOILVEGSOILSOILSOILSOILVEGVEGVEGSOILSOILSOILSOILVEGWATERSOILSOILSOILSOILVEGWATERWATERSOILSOILVEGSOILSOILVEGVEGWATERSOILSOILVEGSOILSOILVEGVEGWATERWATERSOILSOILSOILSOIL
1. 10.94.7<0.44.02.92.51.00.482.161.65.2II
1.21.63.120.1515.. 113.90.761.964.720.360.261.41.2250.00.80.421.691.30.4621.420.2290.01.41.12584.0122.20. 370. 0914.914.30.926.72
ug/gug/gug/gmg/ kgmg/kgug/gug/gmg/kgmg/kgmg/kgmg/kgug/gug/gug/gmg/kgmg/kgmg/kgug/mlug/gug/gmg/kgmg/kgmg/kgmg/lmg/lug/gug/gug/gmg/kgmg/kgmg/kgmg/kgug/mlug/gug/gug/gmg/kgmg/kgmg/kgmg/kgmg/iug/mlug/gug/gmg/kgmg/kg
DRYWET
DRYWET
WETDRY
DRYWET
DRYWET
DRYWET
DRYWET
342
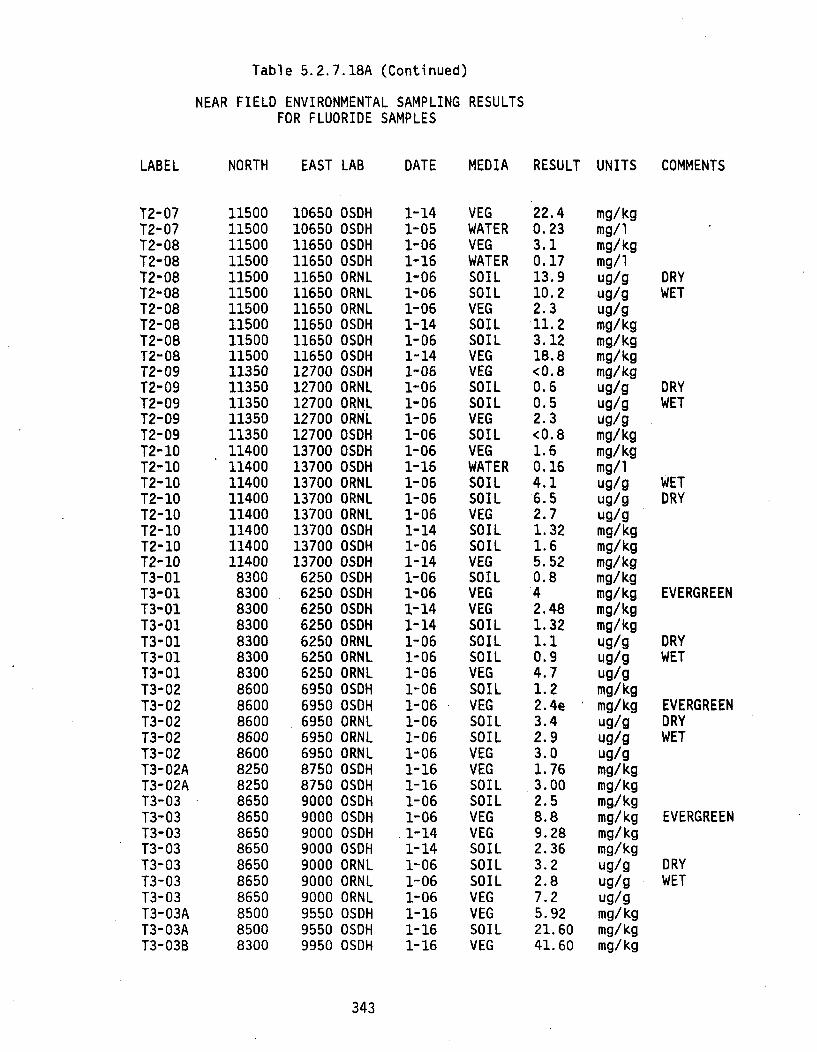
Table 5.2.7.18A (Continued)
NEAR FIELD ENVIRONMENTAL SAMPLING RESULTSFOR FLUORIDE SAMPLES
LABEL NORTH EAST LAB DATE MEDIA RESULT UNITS COMMENTS
T2-07T2-07T2-08T2-08T2-08T2-08T2-08T2-08T2-08T2-08T2-09T2-09T2-09T2-09T2-09T2-10T2-10T2-10T2-10T2-10T2-10T2-10T2-10T3-01T3-01T3-01T3-01T3-01T3-01T3-01T3-02T3-02T3-02T3-02T3-02T3-02AT3-02AT3-03T3-03T3-03T3-03T3-03T3-03T3-03T3-03AT3-03AT3-03B
1150011500115001150011500115001150011500115001150011350113501135011350113501140011400114001140011400114001140011400830083008300830083008300830086008600860086008600825082508650865086508650865086508650850085008300
1065010650116501165011650116501165011650116501165012700127001270012700127001370013700137001370013700137001370013700
625062506250625062506250625069506950695069506950875087509000900090009000900090009000955095509950
OSDHOSDHOSDHOSDHORNLORNLORNLOSDHOSDHOSDHOSDHORNLORNLORNLOSDHOSDHOSDHORNLORNLORNLOSDHOSDHOSDHOSDHOSDHOSDHOSDHORNLORNLORNLOSDHOSDHORNLORNLORNLOSDHOSDHOSDHOSDHOSDHOSDHORNLORNLORNLOSDHOSDHOSDH
1-141-051-061-161-061-061-061-141-061-141-061-061-061-061-061-061-161-061-061-061-141-061-141-061-061-141-141-061-061-061-061-061-061-061-061-161-161-061-06
.1-141-141-061-061-061-161-161-16
VEGWATERVEGWATERSOILSOILVEGSOILSOILVEGVEGSOILSOILVEGSOILVEGWATERSOILSOILVEGSOILSOILVEGSOILVEGVEGSOILSOILSOILVEGSOILVEGSOILSOILVEGVEGSOILSOILVEGVEGSOILSOILSOILVEGVEGSOILVEG
22.40.233.10.1713.910.22.311.2
3.1218.8<O0.80.60.52.3<0.81.60.164.16.52.71.321.65.520.842.481.321.10.94.71.22. 4e3.42.93.01.763.002.58.89.282.363.22.87.25.9221.6041.60
mg/kgmg/lmg/kgmg/lug/gug/gug/gmg/kgmg/kgmg/kgmg/kgug/gug/gug/gmg/kgmg/ kgmg/1ug/gug/gug/gmg/kgmg/kgmg/kgmg/kgmg/kgmg/kgmg/kgug/gug/gug/gmg/kgmg/kgug/gug/gug/gmg/kgmg/kgmg/kgmg/kgmg/kgmg/kgug/gug/gug/gmg/kgmg/kgmg/kg
DRYWET
DRYWET
WETDRY
EVERGREEN
DRYWET
EVERGREENDRYWET
EVERGREEN
DRYWET
343

Table 5.2.7.18A (Continued)
NEAR FIELD ENVIRONMENTAL SAMPLING RESULTSFOR FLUORIDE SAMPLES
LABEL NORTH EAST LAB DATE MEDIA RESULT UNITS COMMENTS
T3-03BT3-03CT3-03CT3-04T3-04T3-04T3-0413-04T3-04T3-04T3-04T3-04AT3-04AT3-04BT3-04BT3-05T3-05T3-05T3-05T3-05T3-05T3-05T3-06T3-06T3-06T3-06T3-06T3-06T3-06T3-07T3-07T3-07T3-07T3-07T3-07T3-07T5-01T5-01T5-01T5-01T5-02T5-02T5-03T5-03T5-04T5-04T6-01T6-01
830088008800835083508350835083508350835083508350815083508350835083508350835083508350835084008400840084008400840084008550855085508550855085508550
177001770017700177001650016500163001630015500
15501395013950
995010050100501030010300103001030010700103001030010300107001080011000110001120011200112001120011200112001120012050120501205012050120501205012050130501305013050130501305013050130508700870087008700
10000100001035010350
8500850077007700
OSDHOSDHOSDHOSDHOSDHOSDHOSDHOSDHORNLORNLORNLOSDHOSDHOSDHOSDHOSDHOSDHOSDHOSDHORNLORNLORNLOSDHOSDHOSDHOSDHORNLORNLORNLOSDHOSDHOSDHOSDHORNLORNLORNLOSDHOSDHOSDHOSDHOSDHOSDHOSDHOSDHOSDHOSDHOSDHOSDH
1-161-161-161-061-061-141-141-161-061-061-061-161-161-161-161-061-061-141-141-061-061-061-061-061-141-141-061-061-061-061-061-141-141-061-061-061-151-151-081-081-081-081-081-081-081-081-081-08
SOILVEGSOILSOILVEGVEGSOILVEGSOILSOILVEGSOILWATERVEGSOILSOILVEGVEGSOILSOILSOILVEGSOILVEGVEGSOILSOILSOILVEGSOILVEGVEGSOILSOILSOILVEGVEGSOILSOILVEGVEGVEGSOILVEGVEGWATERSOILVEG
5.5613.68<O.40<0.8102.04.000.5273.601.41.3420.08.800.1272.001.681.293.030.40.842.21.667.01.45.85.840.762.11.77.0<0.84.28.480.642.01.43.65.921.840.682.484.561.76<0.43.62.560.323.5628.8
mg/kgmg/kgmg/kgmg/kgmg/kgmg/kgmg/kgmg/kgug/gug/gug/gmg/kgmg/lmg/kgmg/kgmg/kgmg/kgmg/kgmg/kgug/gug/gug/gmg/kgmg/kgmg/kgmg/kgug/gug/gug/gmg/kgmg/kgmg/kgmg/kgug/gug/gug/gmg/kgmg/kgmg/kgmg/kgmg/kgmg/kgmg/kgmg/kgmg/kgmg/img/kgmg/kg
EVRGRN/LEAVE
DRYWET
EVERGREEN
DRYWET
EVERGREEN
DRYWET
GRASS
DRYWET
344
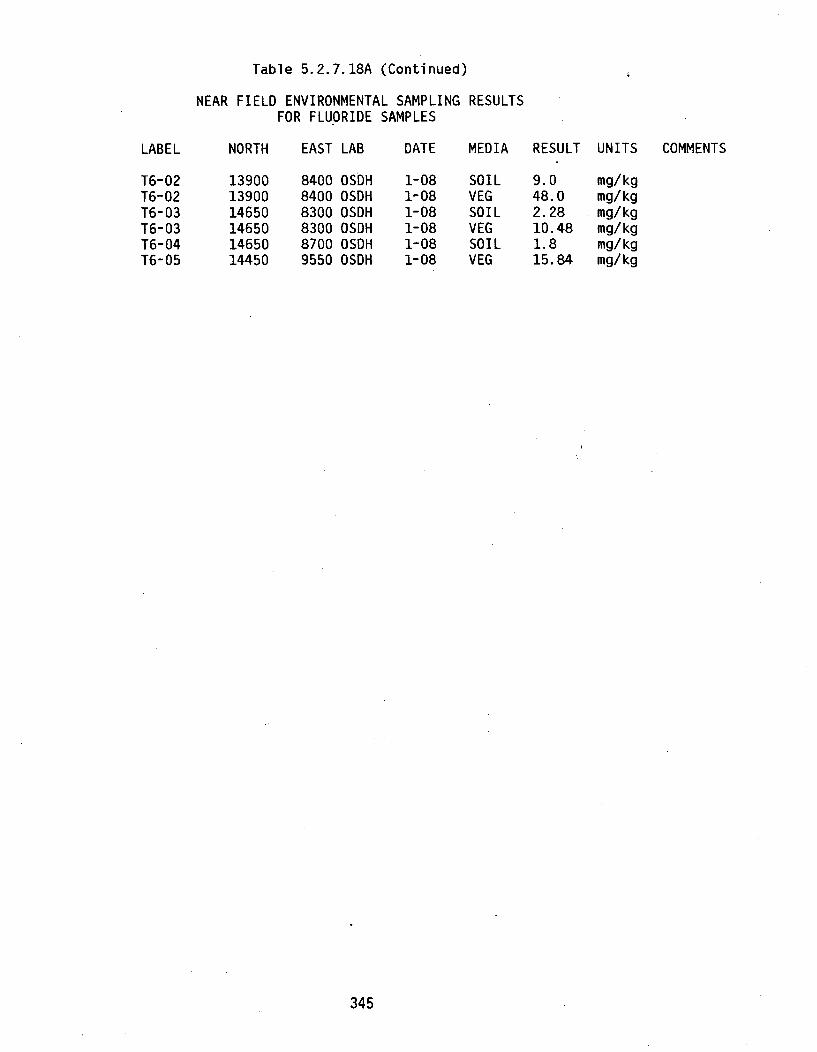
Table 5.2.7.18A (Continued)
NEAR FIELD ENVIRONMENTAL SAMPLING RESULTSFOR FLUORIDE SAMPLES
LABEL
T6-02T6-02T6-03T6-03T6-04T6-05
NORTH EAST LAB DATE MEDIA RESULT UNITS COMMENTS
139001390014650146501465014450
840084008300830087009550
OSDHOSDHOSDHOSDHOSDHOSDH
1-081-081-081-081-081-08
SOILVEGSOILVEGSOILVEG
9.048.02.2810.481.815.84
mg/kgmg/kgmg/kgmg/kgmg/kgmg/kg
345
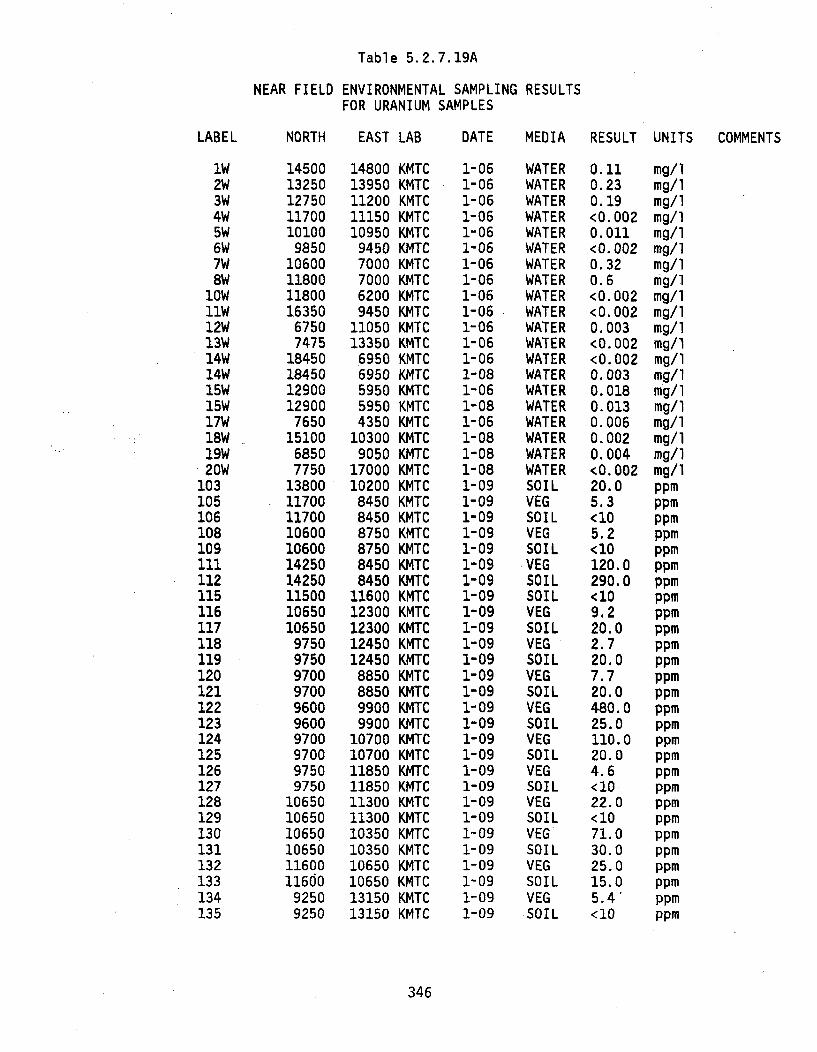
Table 5.2.7.19A
NEAR FIELD ENVIRONMENTAL SAMPLING RESULTSFOR URANIUM SAMPLES
LABEL
1W2W3W4W5W6W7W8W
low11W12W13W14W14W15W15W17W18W19W20W
103105106108109111112115116117118119120121122123124125126127128129130131132133134135
NORTH EAST LAB DATE MEDIA RESULT UNITS COMMENTS
1450013250127501170010100
985010600118001180016350
67507475
18450184501290012900
765015100
68507750
13800117001170010600106001425014250115001065010650
9750975097009700960096009700970097509750
106501065010650106501160011660
92509250
1480013950112001115010950
94507000700062009450
1105013350
69506950595059504350
103009050
1700010200845084508750875084508450
11600123001230012450124508850885099009900
107001070011850118501130011300103501035010650106501315013150
KMTCKMTCKMTCKMTCKMTCKMTCKMTCKMTCKMTCKMTCKMTCKMTCKMTCKMTCKMTCKMTCKMTCKMTCKMTCKMTCKMTCKMTCKMTCKMTCKMTCKMTCKMTCKMTCKMTCKMTCKMTCKMTCKMTCKMTCKMTCKMTCKMTCKMTCKMTCKMTCKMTCKMTCKMTCKMTCKMTCKMTCKMTCKMTC
1-061-061-061-061-061-061-061-061-061-061-061-061-061-081-061-081-061-081-081-081-091-091-091-091-091-091-091-091-091-091-091-091-091-091-091-091-091-091-091-091-091-091-091-091-091-091-091-09
WATERWATERWATERWATERWATERWATERWATERWATERWATERWATERWATERWATERWATERWATERWATERWATERWATERWATERWATERWATERSOILVEGSOILVEGSOILVEGSOILSOILVEGSOILVEGSOILVEGSOILVEGSOILVEGSOILVEGSOILVEGSOILVEGSOILVEGSOILVEGSOIL
0.110.230.19<0.0020.011<0. 0020.320.6<0.002<0.0020.003<0.002<0.0020.0030.0180.0130.0060. 0020.004< 0. 00220.05.3<105.2<10120.0290.0<109.220.02.720.07.720.0480.025.0110.020.04.6<1022.0<1071.030.025.015.05.4<10
mg/Img/lmg/img/lmg/img/lmg/img/lmg/img/img/img/lmg/lmg/lmg/img/img/Img/Img/lmg/ippmppmppmppmppmppmppmppmppmppmppmppmppmppmppmppmppmppmppmppmppmppmppmppmppmppmppmppm
346
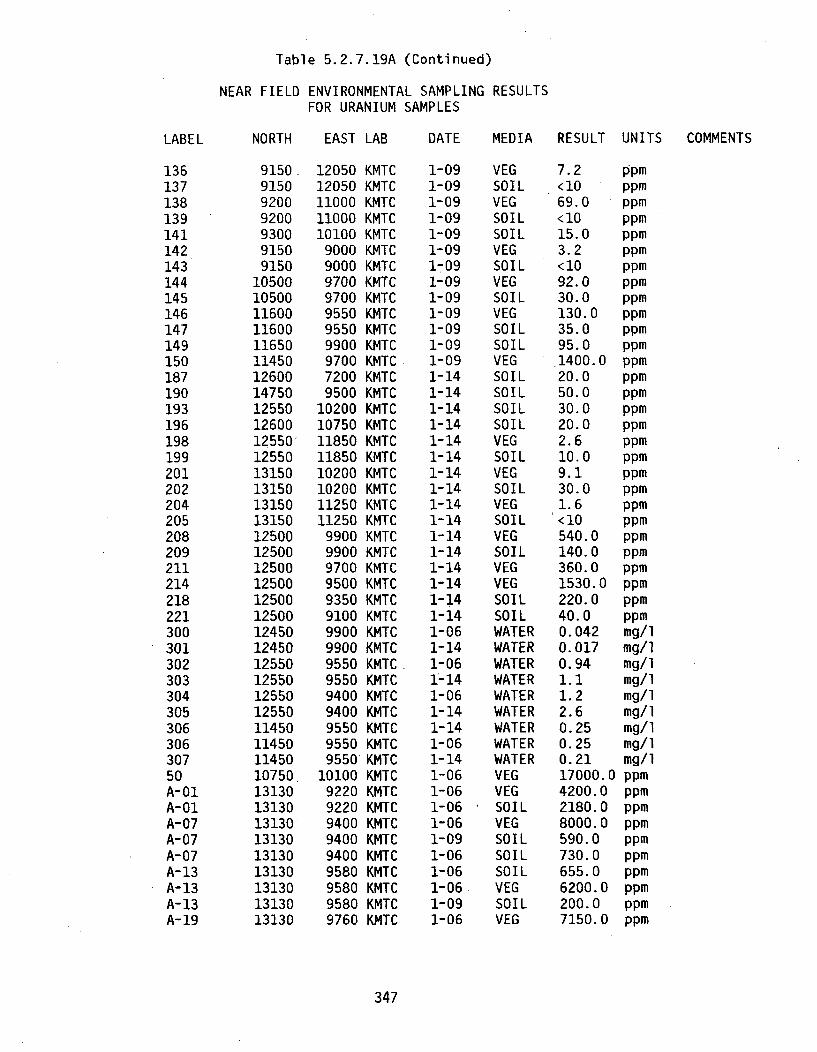
Table 5.2.7.19A (Continued)
NEAR FIELD ENVIRONMENTAL SAMPLING RESULTSFOR URANIUM SAMPLES
LABEL
13613713813914114214314414514614714915018719019319619819920120220420520820921121421822130030130230330430530630630750A- 01A-01A-07A-07A-07A- 13A- 13A- 13A- 19
NORTH EAST LAB DATE MEDIA RESULT UNITS COMMENTS
9150915092009200930091509150
1050010500116001160011650114501260014750125501260012550125501315013150131501315012500125001250012500125001250012450124501255012550125501255011450114501145010750131301313013130131301313013130131301313013130
1205012050110001100010100
9000900097009700955095509900970072009500
1020010750118501185010200102001125011250
990099009700950093509100990099009550955094009400955095509550
10100922092209400940094009580958095809760
KMTCKMTCKMTCKMTCKMTCKMTCKMTCKMTCKMTCKMTCKMTCKMTCKMTCKMTCKMTCKMTCKMTCKMTCKMTCKMTCKMTCKMTCKMTCKMTCKMTCKMTCKMTCKMTCKMTCKMTCKMTCKMTCKMTCKMTCKMTCKMTCKMTCKMTCKMTCKMTCKMTCKMTCKMTCKMTCKMTCKMTCKMTCKMTC
1-091-091-091-091-091-091-091-091-091-091-091-091-091-141-141-141-141-141-141-141-141-141-141-141-141-141-141-141-141-061-141-061-141-061-141-141-061-141-061-061-061-061-091-061-061-061-091-06
VEGSOILVEGSOILSOILVEGSOILVEGSOILVEGSOILSOILVEGSOILSOILSOILSOILVEGSOILVEGSOILVEGSOILVEGSOILVEGVEGSOILSOILWATERWATERWATERWATERWATERWATERWATERWATERWATERVEGVEGSOILVEGSOILSOILSOILVEGSOILVEG
7.2<1069.0<1015.03.2<1092.030.0130.035.095.0
.1400.020.050.030.020.02.610.09.130.01.6<10540.0140.0360.01530.0220.040.00. 0420.0170.941.11.22.60.250.250.2117000.04200.02180.08000.0590.0730.0655.06200.0200.07150.0
ppmppmppmppmppmppmppmppmppmppmppmppmppmppmppmppmppmppmppmppmppmppmppmppmppmppmppmppmppmmg/img/img/img/lmg/lmg/lmg/lmg/img/lppmppmppmppmppmppmppmppmppmppm
347
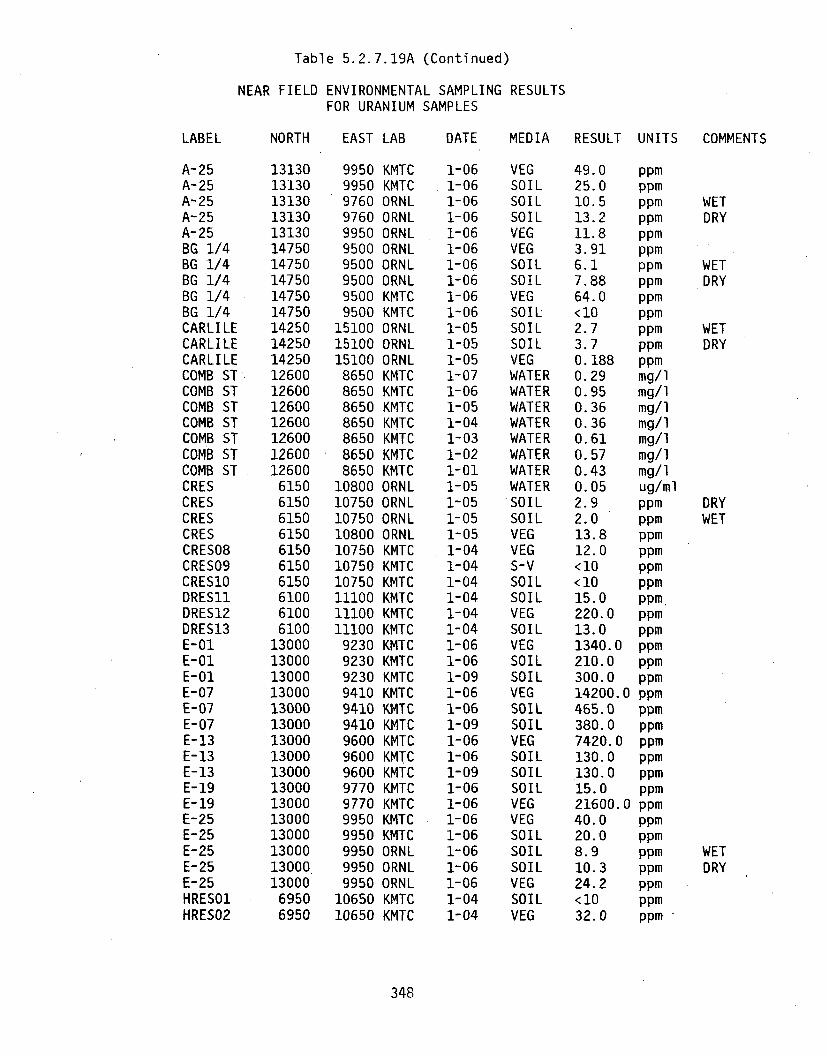
Table 5.2.7.19A (Continued)
NEAR FIELD ENVIRONMENTAL SAMPLING RESULTSFOR URANIUM SAMPLES
LABEL
A-25A-25A-25A-25A-25BG 1/4BG 1/4BG 1/4BG 1/4BG 1/4CARLILECARLILECARLILECOMB STCOMB STCOMB STCOMB STCOMB STCOMB STCOMB STCRESCRESCRESCRESCRES08CRES09CRES1ODRES11DRES12DRES13E-01E-01E-01E-07E-07E-07E-13E-13E-13E-19E-19E-25E-25E-25E-25E-25HRES01HRES02
NORTH EAST LAB DATE MEDIA RESULT UNITS COMMENTS
1313013130131301313013130147501475014750147501475014250142501425012600126001260012600126001260012600
6150615061506150615061506150610061006100
13000130001300013000130001300013000130001300013000130001300013000130001300013000
69506950
995099509760976099509500950095O095009500
151001510015100
8650865086508650865086508650
10800107501075010800107501075010750111001110011100
9230923092309410941094109600960096009770977099509950995099509950
1065010650
KMTCKMTCORNLORNLORNLORNLORNLORNLKMTCKMTCORNLORNLORNLKMTCKMTCKMTCKMTCKMTCKMTCKMTCORNLORNLORNLORNLKMTCKMTCKMTCKMTCKMTCKMTCKMTCKMTCKMTCKMTCKMTCKMTCKMTCKMTCKMTCKMTCKMTCKMTCKMTCORNLORNLORNLKMTCKMTC
1-061-061-061-061-061-061-061-061-061-061-051-051-051-071-061-051-041-031-021-011-051-051-051-051-041-041-041-041-041-041-061-061-091-061-061-091-061-061-091-061-061-061-061-061-061-061-041-04
VEGSOILSOILSOILVEGVEGSOILSOILVEGSOILSOILSOILVEGWATERWATERWATERWATERWATERWATERWATERWATERSOILSOILVEGVEGS-VSOILSOILVEGSOILVEGSOILSOILVEGSOILSOILVEGSOILSOILSOILVEGVEGSOILSOILSOILVEGSOILVEG
49.025.010.513.211.83.916.17.8864.0<102.73.70.1880.290.950.360.360.610.570.430.052.92.013.812.0<10<1015.0220.013.01340.0210.0300.014200.0465.0380.07420.0130.0130.015.021600.040.020.08.910.324.2<1032.0
ppmppmppmppmppmppmppmppmppmppmppmppmppmmg/img/lmg/lmg/lmg/lmg/lmg/Iug/mlppmppmppmppmppmppmppmppmppmppmppmppmppmppmppmppmppmppmppmppmppmppmppmppmppmppmppm
WETDRY
WETDRY
WETDRY
DRYWET
WETDRY
348
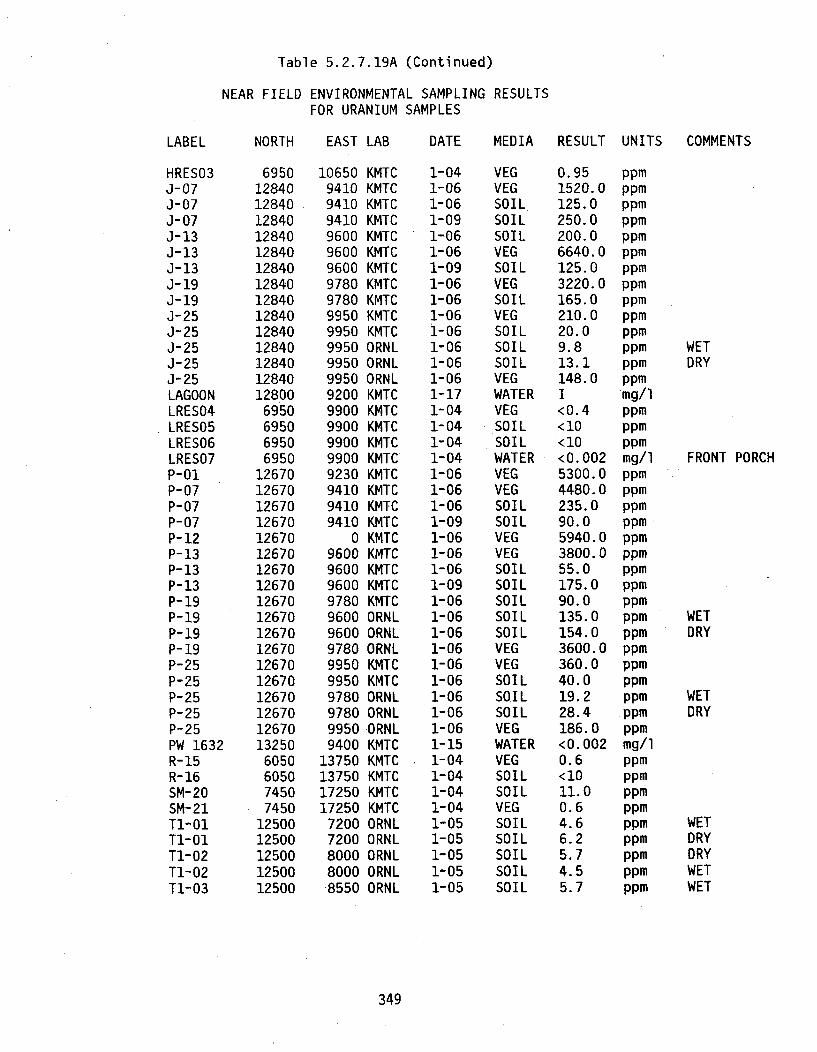
Table 5.2.7.19A (Continued)
NEAR FIELD ENVIRONMENTAL SAMPLING RESULTSFOR URANIUM SAMPLES
LABEL
HRES03J-07J-07J-07J-13J-13J-13J-19J-19J-25J-25J-25J-25J-25LAGOONLRES04LRES05LRES06LRES07P-01P-07P- 07P-07P-12P-13P-13P-13P-19P-19P- 19P- 19P-25P-25P-25P-25P-25PW 1632R- 15R- 16SM-20SM-21TI-OIT1-01T1-02T1-02T1-03
NORTH EAST LAB DATE MEDIA RESULT UNITS COMMENTS
69501284012840128401284012840128401284012840128401284012840128401284012800
6950695069506950
126701267012670126701267012670126701267012670126701267012670126701267012670126701267013250
6050605074507450
1250012500125001250012500
106509410941094109600960096009780978099509950995099509950920099009900990099009230941094109410
09600960096009780960096009780995099509780978099509400
13750137501725017250
72007200800080008550
KMTCKMTCKMTCKMTCKMTCKMTCKMTCKMTCKMTCKMTCKMTCORNLORNLORNLKMTCKMTCKMTCKMTCKMTCKMTCKMTCKMTCKMTCKMTCKMTCKMTCKMTCKMTCORNLORNLORNLKMTCKMTCORNLORNLORNLKMTCKMTCKMTCKMTCKMTCORNLORNLORNLORNLORNL
1-041-061-061-091-061-061-091-061-061-061-061-061-061-061-171-041-041-041-041-061-061-061-091-061-061-061-091-061-061-061-061-061-061-061-061-061-151-041-041-041-041-051-051-051-051-05
VEGVEGSOILSOILSOILVEGSOILVEGSOILVEGSOILSOILSOILVEGWATERVEGSOILSOILWATERVEGVEGSOILSOILVEGVEGSOILSOILSOILSOILSOILVEGVEGSOILSOI LSOILVEGWATERVEGSOILSOILVEGSOILSOILSOILSOILSOIL
0.951520.0125.0250.0200.06640.0125.03220.0165.0210.020.09.813.1148.0I<0.4<10<10<0.0025300.04480.0235.090.05940.03800.055.0175.090.0135.0154.03600.0360.040.019.228.4186.0<0. 0020.6<1011.00.64.66.25.74.55.7
ppmppmppmppmppmppmppmppmppmppmppmppmppmppmmg/ippmppmppmmg/ippmppmppmppmppmppmppmppmppmppmppmppmppmppmppmppmppmmg/ippmppmppmppmppmppmppmppmppm
WETDRY
FRONT PORCH
WETDRY
WETDRY
WETDRYDRYWETWET
349
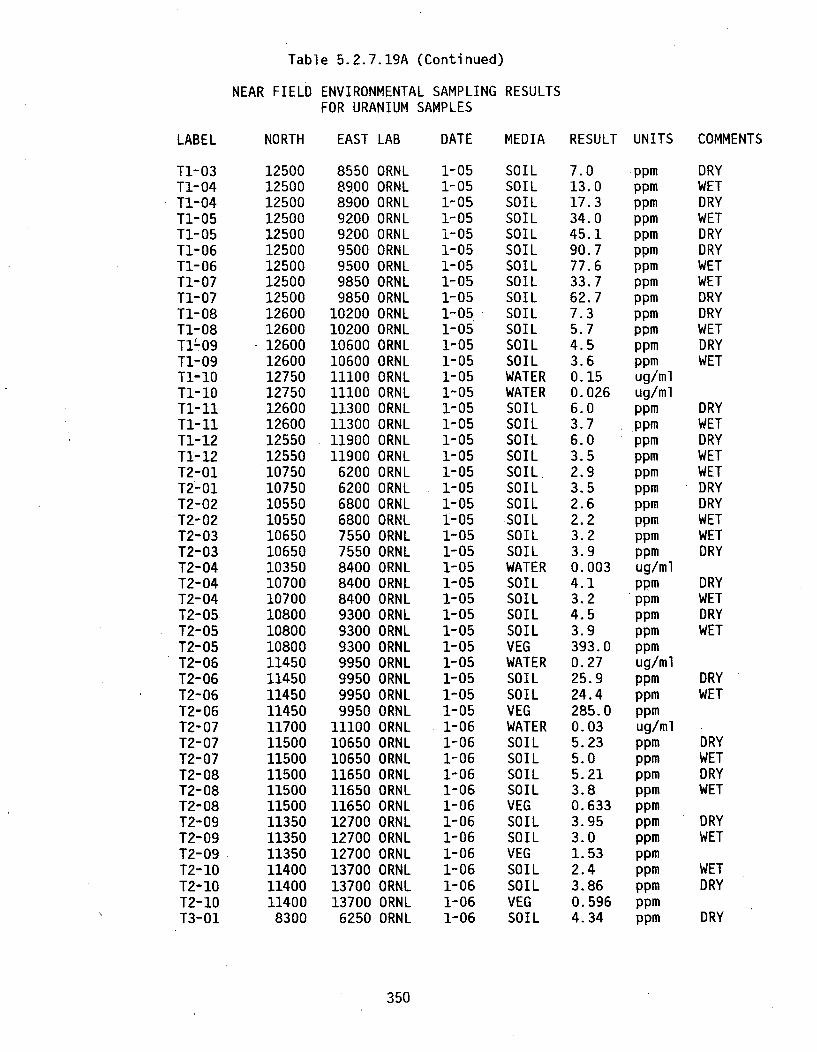
Table 5.2.7.19A (Continued)
NEAR FIELD ENVIRONMENTAL SAMPLING RESULTSFOR URANIUM SAMPLES
LABEL
T1-03T1-04T1-04T1-05Ti-05T1-06T1-06T1-07T1-07T1-08T1-08T1l-09T1-09Tl-10TI-IOTI-11TI-I1T1-12T1-12T2-01T2-01T2-02T2-02T2-03T2-03T2-04T2-04T2-04T2-05T2-05T2-05T2-06T2-06T2-06T2-06T2-07T2-07T2-07T2-08T2-08T2-08T2-09T2-09T2-09T2-10T2-10T2-10T3-01
NORTH EAST LAB DATE MEDIA RESULT UNITS COMMENTS
1250012500125001250012500125001250012500125001260012600
* 1260012600127501275012600126001255012550107501075010550105501065010650103501070010700108001080010800114501145011450114501170011500115001150011500115001135011350113501140011400114008300
855089008900920092009500950098509850
10200102001060010600111001110011300113001190011900
6200620068006800755075508400840084009300930093009950995099509950
111001065010650116501165011650127001270012700137001370013700
6250
ORNLORNLORNLORNLORNLORNLORNLORNLORNLORNLORNLORNLORNLORNLORNLORNLORNLORNLORNLORNLORNLORNLORNLORNLORNLORNLORNLORNLORNLORNLORNLORNLORNLORNLORNLORNLORNLORNLORNLORNLORNLORNLORNLORNLORNLORNLORNLORNL
1-051-051-051-051-051-051-051-051-051-051-051-051-051-051-051-051-051-051-051-051-051-051-051-051-051-051-051-051-051-051-051-051-051-051-051-061-061-061-061-061-061-061-061-061-061-061-061-06
SOILSOILSOILSOILSOILSOILSOILSOILSOILSOILSOILSOILSOILWATERWATERSOILSOILSOILSOILSOILSOILSOILSOILSOILSOILWATERSOILSOILSOILSOILVEGWATERSOILSOILVEGWATERSOILSOILSOILSOILVEGSOILSOILVEGSOILSOILVEGSOIL
7.013.017.334.045.190.777.633.762.77.35.74.53.60.150.0266.03.76.03.52.93.52.62.23.23.90.0034.13.24.53.9393.00.2725.924.4285.00.035.235.05.213.80.6333.953.01.532.43.860.5964.34
ppmppmppmppmppmppmppmppmppmppmppmppmppmug/mlug/mlppmppmppmppmppmppmppmppmppmppmug/mlppmppmppmppmppmug/mlppmppmppmug/mlppmppmppmppmppmppmppmppmppmppmppmppm
DRYWETDRYWETDRYDRYWETWETDRYDRYWETDRYWET
DRYWETDRYWETWETDRYDRYWETWETDRY
DRYWETDRYWET
DRYWET
DRYWETDRYWET
DRYWET
WETDRY
DRY
350
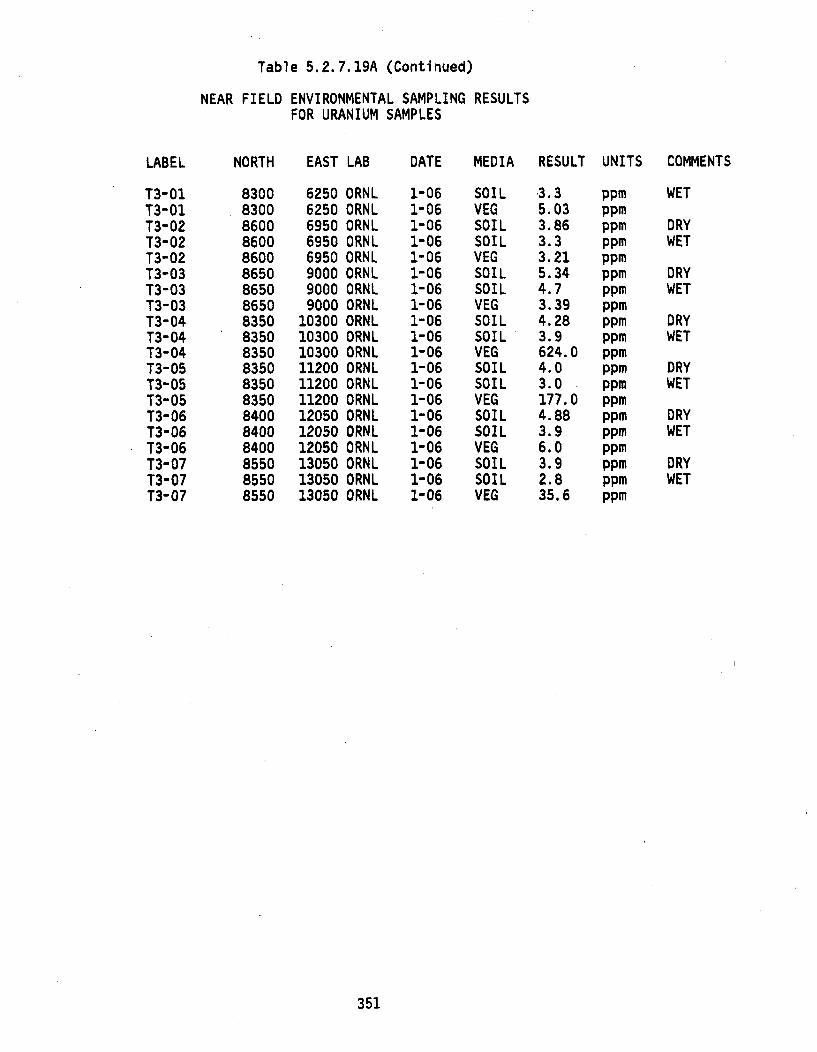
Table 5.2.7.19A (Continued)
NEAR FIELD ENVIRONMENTAL SAMPLING RESULTSFOR URANIUM SAMPLES
LABEL
T3-01T3-01T3-02T3-02T3-02T3-03T3-03T3-03T3-04T3-04T3-04T3-05T3-05T3-05T3-06T3-06T3-06T3-07T3-07T3-07
NORTH EAST LAB DATE MEDIA RESULT UNITS COMMENTS
83008300860086008600865086508650835083508350835083508350840084008400855085508550
62506250695069506950900090009000
103001030010300112001120011200120501205012050130501305013050
ORNLORNLORNLORNLORNLORNLORNLORNLORNLORNLORNLORNLORNLORNLORNLORNLORNLORNLORNLORNL
1-061-061-061-061-061-061-061-061-061-061-061-061-061-061-061-061-061-061-061-06
SOILVEGSOILSOILVEGSOILSOILVEGSOILSOILVEGSOILSOILVEGSOILSOILVEGSOILSOILVEG
3.35.033.863.33.215.344.73.394.283.9624.04.03.0177.04.883.96.03.92.835.6
ppmppmppmppmppmppmppmppmppmppmppmppmppmppmppmppmppmppmppmppm
WET
DRYWET
DRYWET
DRYWET
DRYWET
DRYWET
DRYWET
351
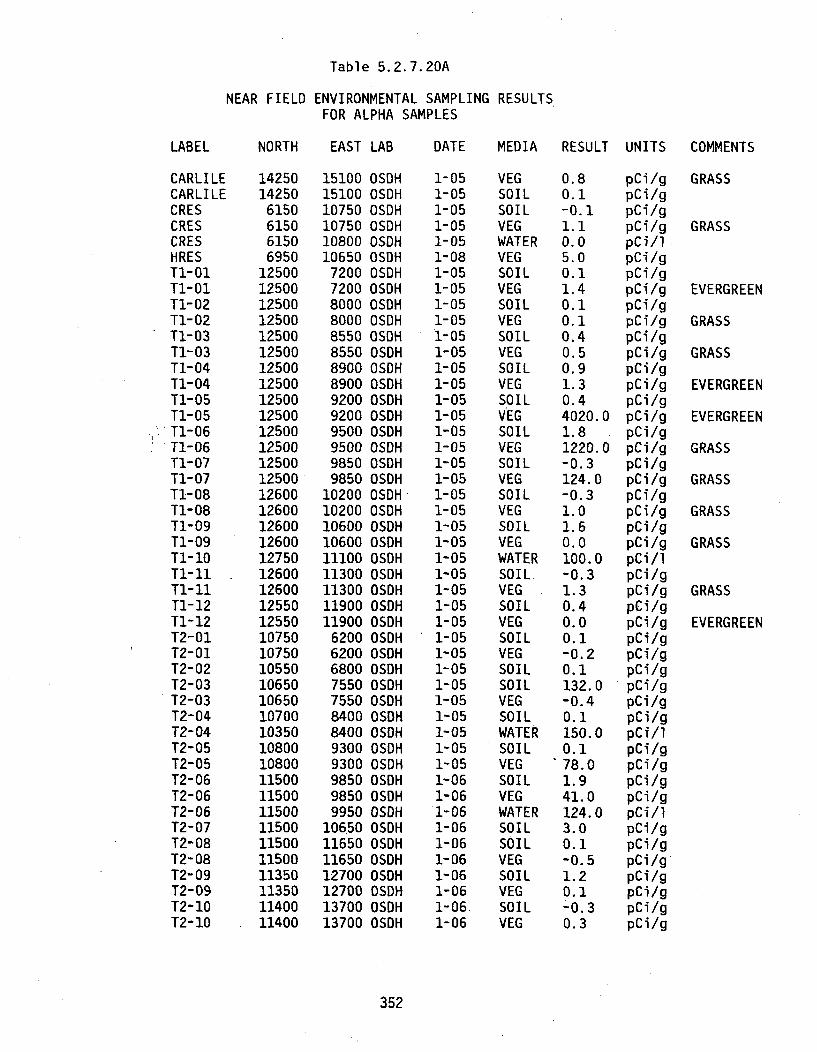
Table 5.2.7.20A
NEAR FIELD ENVIRONMENTAL SAMPLING RESULTSFOR ALPHA SAMPLES
LABEL NORTH EAST LAB DATE MEDIA RESULT UNITS COMMENTS
CARLILECARLILECRESCRESCRESHREST1-01T1-01Tl-02Tl-02T1-03T1-03T1-04T1-04Ti-05Tl-05
•Tl-06Tl-06
T1-07Tl-07Ti-08Tl-08Tl-09TI-09Ti-10T1-11TI-11Tl-12Tl-12T2-01T2-01T2-02T2-03T2-03T2-04T2-04T2-05T2-05T2-06T2-06T2-06T2-07T2-08T2-08T2-09T2-09T2-10T2-10
1425014250
6150615061506950
125001250012500125001250012500125001250012500125001250012500125001250012600126001260012600127501260012600125501255010750107501055010650106501070010350108001080011500115001150011500115001150011350113501140011400
151001510010750107501080010650
72007200800080008550855089008900920092009500950098509850
102001020010600106001110011300113001190011900
620062006800755075508400840093009300985098509950
10650116501165012700127001370013700
OSDHOSDHOSDHOSDHOSDHOSDHOSDHOSDHOSDHOSDHOSDKOSDHOSDHOSDHOSDHOSDHOSDHOSDHOSDHOSDHOSDHOSDHOSDHOSDHOSDHOSDHOSDHOSDHOSDHOSDHOSDHOSDHOSDHOSDHOSDHOSDHOSDHOSDHOSDHOSDHOSDHOSDHOSDHOSDHOSDH0SDHOSDHOSDH
1-051-051-051-051-051-081-051-051-051-051-051-051-051-051-051-051-051-051-051-051-051-051-051-051-051-051-051-051-051-051-051-051-051-051-051-051-051-051-061-061-061-061-061-061-061-061-061-06
VEGSOILSOILVEGWATERVEGSOILVEGSOILVEGSOILVEGSOILVEGSOILVEGSOILVEGSOILVEGSOILVEGSOILVEGWATERSOILVEGSOILVEGSOILVEGSOILSOILVEGSOILWATERSOILVEGSOILVEGWATERSOILSOILVEGSOILVEGSOILVEG
0.80.1-0.11.10.05.00.11.40.10.10.40.50.91.30.44020.01.81220.0-0.3124.0-0.31.01.60.0100.0-0.31.30.40.00.1-0.20.1132.0-0.40.1150.00.178.01.941.0124.03.00.1-0.51.20.1-O.30.3
pCi/gpCi/gpci/gpCi/gpCi /1pCi/gpci/gpCi/gpci/gpCi/gpCi/gpCi/gpci/gpCi/gpCi/gpCi/gpCi/gpci/gpCi/gpci/gpCi/gpCilgpC i/gpCi/gpCi/ipCi/gpCi/gpci/gpCi/gpciigpC i/gpcilgpG i/gpci/gpCi/gp i / 1pci/gpci/gpCi/gpci/gpCi/ipCi/gpCi/gpci/g,pC i/gpci/gpCi/gpCilg
GRASS
GRASS
EVERGREEN
GRASS
GRASS
EVERGREEN
EVERGREEN
GRASS
GRASS
GRASS
GRASS
GRASS
EVERGREEN
352
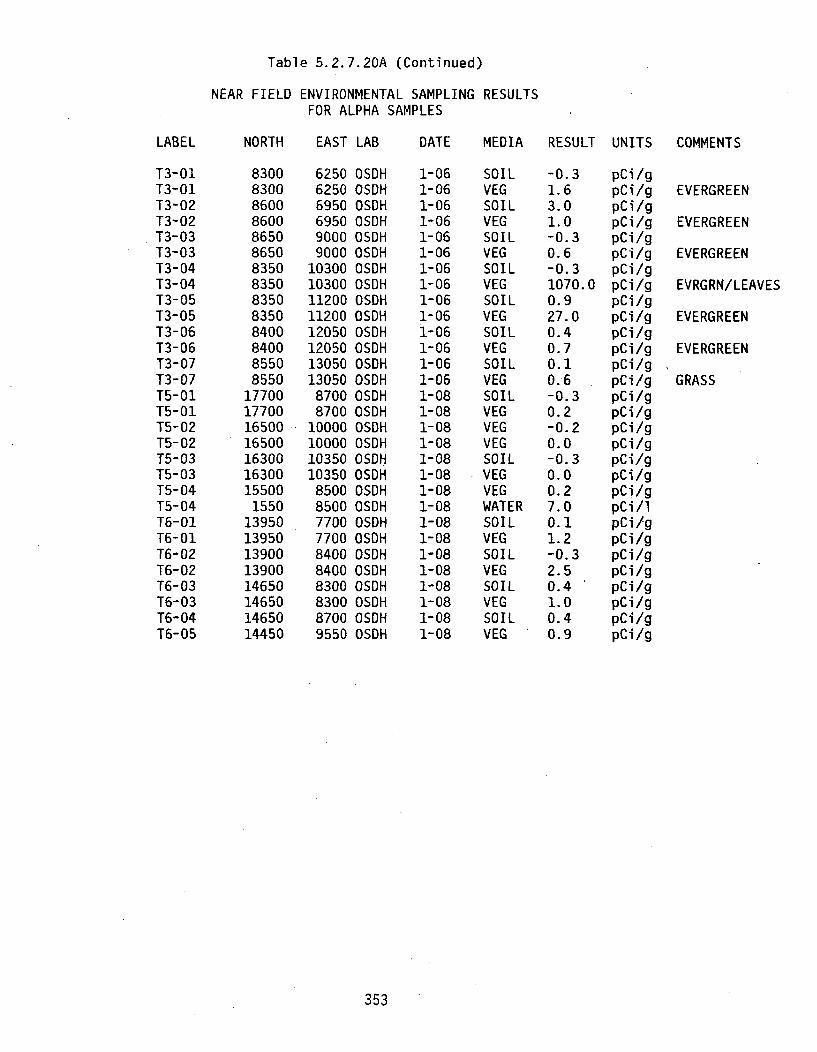
Table 5.2.7.20A (Continued)
NEAR FIELD ENVIRONMENTAL SAMPLING RESULTSFOR ALPHA SAMPLES
LABEL
T3-01T3-01T3-02T3-02T3-03T3-03T3-04T3-04T3-05T3-05T3-06T3-06T3-07T3-07T5-01T5-01T5-02T5-02T5-03T5-03T5-04T5-04T6-01T6-01T6-02T6-02T6-03T6-03T6-04T6-05
NORTH EAST LAB DATE MEDIA RESULT UNITS COMMENTS
83008300860086008650865083508350835083508400840085508550
17700177001650016500163001630015500
15501395013950139001390014650146501465014450
625062506950695090009000
1030010300112001120012050120501305013050
87008700
10000100001035010350
8500850077007700840084008300830087009550
OSDHOSDHOSDHOSDHOSDHOSDHOSDHOSDHOSDHOSDHOSDHOSDHOSDHOSDHOSDHOSDHOSDHOSDHOSDHOSDHOSDHOSDHOSDHOSDHOSDHOSDHOSDHOSDHOSDHOSDH
1-061-061-061-061-061-061-061-061-061-061-061-061-061-061-081-081-081-081-081-081-081-081-081-081-081-081-081-081-081-08
SOILVEGSOILVEGSOILVEGSOILVEGSOILVEGSOILVEGSOILVEGSOILVEGVEGVEGSOILVEGVEGWATERSOILVEGSOILVEGSOILVEGSOILVEG
-0.31.63.01.0-0.30.6-0.31070.00.927.00.40.70.10.6-0.30.2-0.20.0-0.30.00.27.00. 11.2-0.32.50.41.00.40.9
pCi /gpCi/gpCi/gpCi/gpCi/gpCi/gpCi/gpC i/gpCi/gpCi/gpCi/gpCi/gpCi/gpCji/gpCi/gpCi/gpCi/gpCi/gpCi/gpci/gPci/gpCi/ipci/gpCi/gpCi/gpCi/gpCi/gpCi/gpCi/gpCi/g
EVERGREEN
EVERGREEN
EVERGREEN
EVRGRN/LEAVES
EVERGREEN
EVERGREEN
GRASS
353
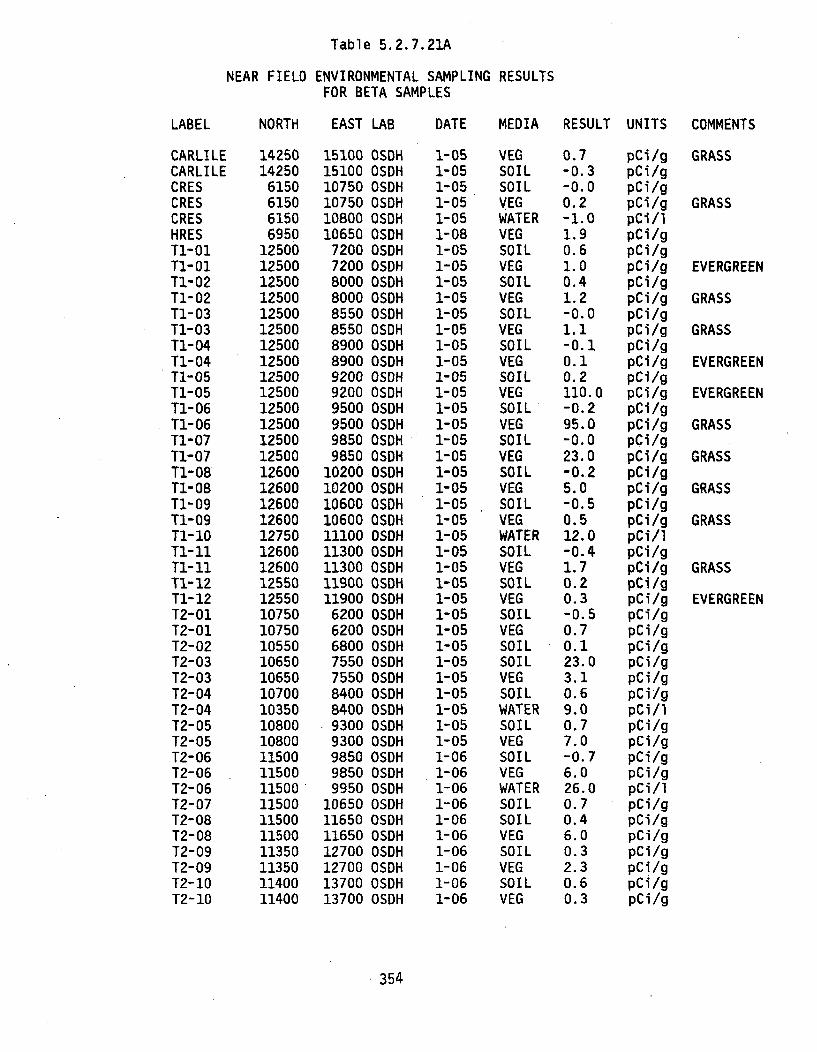
Table 5.2.7.21A
NEAR FIELD ENVIRONMENTAL SAMPLING RESULTSFOR BETA SAMPLES
LABEL NORTH EAST LAB DATE MEDIA RESULT UNITS COMMENTS
CARLI LECARLILECRESCRESCRESHREST1-01TI-O0Tl-02T1-02Tl-03T1-03T1-04T1-04TI-05T1-05TI-06T1-06TI-07T1-07T1-08Tl-08Tl-09Tl-09TI-10T1-11T1-11T1-12Tl-12T2-01T2-01T2-02T2-03T2-03T2-04T2-04T2-05T2-05T2-06T2-06T2-06T2-07T2-08T2-08T2-09T2-09T2-10T2-10
1425014250
6150615061506950
125001250012500125001250012500125001250012500125001250012500125001250012600126001260012600127501260012600125501255010750107501055010650106501070010350108001080011500115001150011500115001150011350113501140011400
151001510010750107501080010650
72007200800080008550855089008900920092009500950098509850
102001020010600106001110011300113001190011900
620062006800755075508400840093009300985098509950
10650116501165012700127001370013700
OSDHOSDHOSDHOSDHOSDHOSDHOSDHOSDHOSDHOSDHOSDHOSDHOSDHOSDHOSDHOSDHOSDHOSDHOSDHOSDHOSDHOSDHOSDHOSDHOSDHOSDHOSDHOSDKOSDHOSDHOSDHOSDHOSDHOSDHOSDHOSDHOSDHOSDHOSDHOSDHOSDHOSDHOSDHOSDHOSDHOSDHOSDHOSDH
1-051-051-051-051-051-081-051-051-051-051-051-051-051-051-051-051-051-051-051-051-051-051-051-051-051-051-051-051-051-051-051-051-051-051-051-051-051-051-061-061-061-061-061-061-061-061-061-06
VEGSOILSOILVEGWATERVEGSOILVEGSOILVEGSOILVEGSOILVEGSOILVEGSOILVEGSOILVEGSOILVEGSOILVEGWATERSOILVEGSOILVEGSOILVEGSOILSOILVEGSOILWATERSOILVEGSOILVEGWATERSOILSOILVEGSOILVEGSOILVEG
0.7-0.3-0.00.2-1.01.90.61.00.41.2-0.01.1-0.10.10.2110.0-0.295.0-0.023.0-0.25.0-0.50.512.0-0.41.70.20.3-0.50.70.123.03.10.69.00.77.0-0.76.026.00.70.46.00.32.30.60.3
pCi/gpCi/gpCi/gpCi/gpCi/IpCi/gpCi/gpCi/gpCilgpCi/gpCi/gpCi/gpCi/gpCi/gpCi/gpCi/gpCilgpCi/gpCi/gpCi/gpCi/gpCi/gpCi/gpCi/gpCi/ 1pCi/gpCi/gpCi/gpCi/gpCi/gpCi/gpCi/gpCi/gpcilgpCiigpCi/ipCi/gpCi/gpCi/gpCi/gpCi/ipCi/gpCi/gpCi/gpCi/gpCi/gpCi/gpCi/g
GRASS
GRASS
EVERGREEN
GRASS
GRASS
EVERGREEN
EVERGREEN
GRASS
GRASS
GRASS
GRASS
GRASS
EVERGREEN
354
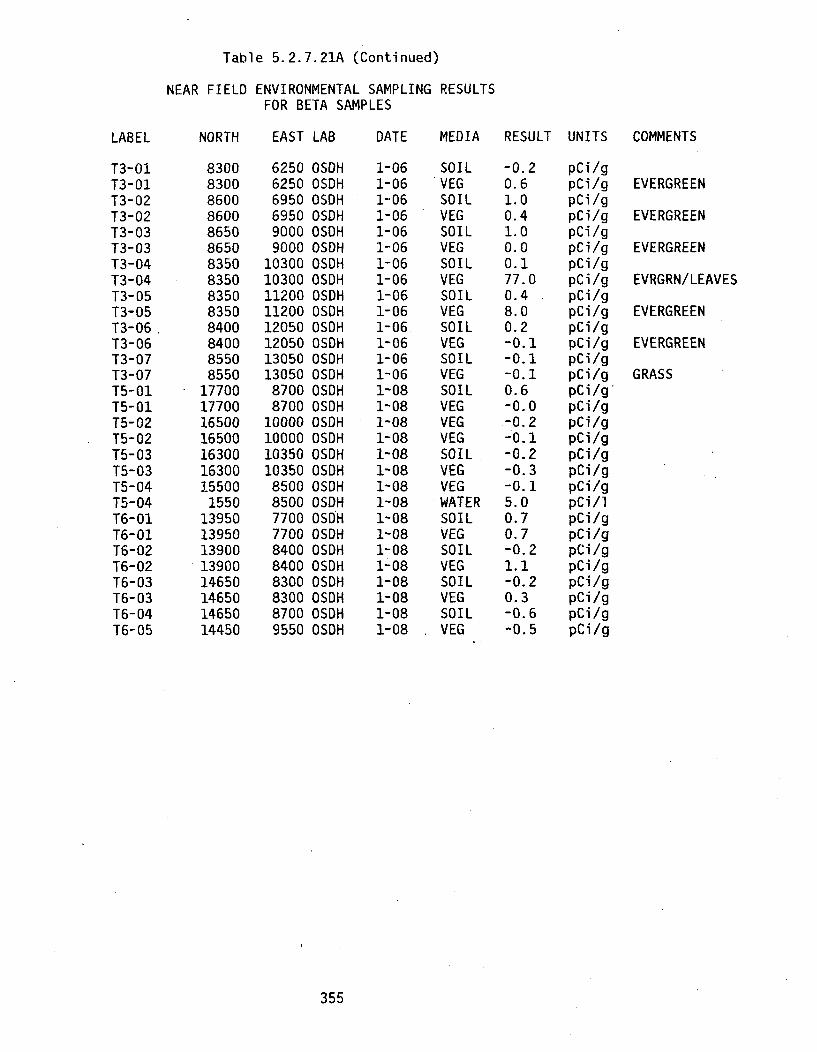
Table 5.2.7.21A (Continued)
NEAR FIELD ENVIRONMENTAL SAMPLING RESULTSFOR BETA SAMPLES
LABEL
T3-01T3-01T3-02T3-02T3-03T3-03T3-04T3-04T3-05T3-05T3-06T3-06T3-07T3-07T5-01T5-01T5-02T5-02T5-03T5-03T5-04T5-04T6-01T6-01T6-02T6-02T6-03T6-03T6-04T6-05
NORTH EAST LAB DATE MEDIA RESULT UNITS COMMENTS
83008300860086008650865083508350835083508400840085508550
17700177001650016500163001630015500
15501395013950139001390014650146501465014450
625062506950695090009000
1030010300112001120012050120501305013050
87008700
10000100001035010350
8500850077007700840084008300830087009550
OSDHOSDHOSDHOSDHOSDHOSDHOSDHOSDHOSDHOSDHOSDHOSDHOSDHOSDHOSDHOSDHOSDHOSDHOSDHOSDHOSDHOSDHOSDHOSDHOSDHOSDHOSDHOSDHOSDHOSDH
1-061-061-061-061-061-061-061-061-061-061-061-061-061-061-081-081-081-081-081-081-081-081-081-081-081-081-081-081-081-08
SOILVEGSOILVEGSOILVEGSOILVEGSOILVEGSOILVEGSOILVEGSOILVEGVEGVEGSOILVEGVEGWATERSOILVEGSOILVEGSOILVEGSOILVEG
-0.20.61.00.41.00.00.177.00.48.00.2-0.1-0.1-0.10.6-0.0-0.2-0.1-0.2-0.3-0.15.00.70.7-0.21.1-0.20.3-0.6-0.5
pCi/gpCi/gpCi/gpC i/gpci/gpci/gpCi/gpCi/gpCi/gpCilgpci/gpCi/gpCi/gpCi/gpCi/g*pCilgpCi/gpCi/gpC i/gpCi/gpCi/gpCi/ipCi/gpCi/gpCi/gpCi/gpCi/gpCi/gpCi/gpCi/g
EVERGREEN
EVERGREEN
EVERGREEN
EVRGRN/LEAVES
EVERGREEN
EVERGREEN
GRASS
355
FAR FIELD ENVIRONMENTAL SAMPLING RESULTS BY SAMPLE ANALYSIS SORTED BY LABEL
356
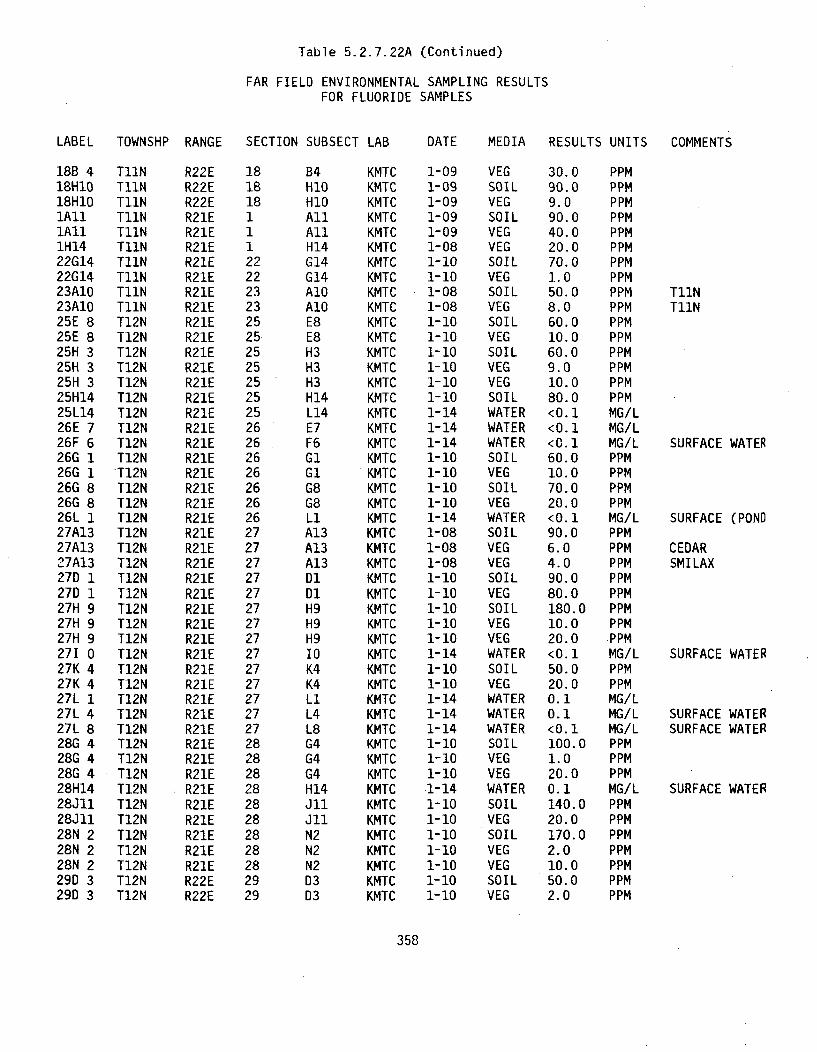
Table 5.2.7.22A (Continued)
FAR FIELD ENVIRONMENTAL SAMPLING RESULTSFOR FLUORIDE SAMPLES
LABEL TOWNSHP RANGE SECTION SUBSECT LAB DATE MEDIA RESULTS UNITS COMMENTS
18B 4 T11N18H10 T11N18H10 T11NlAll T11NlAll T11N1H14 T11N22G14 T11N22G14 T11N23A10 T11N23A10 T11N25E 8 T12N25E 8 T12N25H 3 T12N25H 3 T12N25H 3 T12N25H14 T12N25L14 T12N26E 7 T12N26F 6 T12N26G 1 T12N26G 1 T12N26G 8 T12N26G 8 T12N26L 1 T12N27A13 T12N27A13 T12N27A13 T12N27D 1 T12N27D 1 T12N27H 9 T12N27H 9 T12N27H 9 T12N271 0 T12N27K 4 T12N27K 4 T12N27L 1 T12N27L 4 T12N27L 8 T12N28G 4 T12N28G 4 T12N28G 4 T12N28H14 T12N28J11 T12N28J11 T12N28N 2 T12N28N 2 T12N28N 2 T12N29D 3 T12N29D 3 T12N
R22E 18R22E 18R22E 18R21E 1R21E 1R21E 1R21E 22R21E 22R21E 23R21E 23R21E 25R21E 25R21E 25R21E 25R21E 25R21E 25R21E 25R21E 26R21E 26R21E 26R21E 26R21E 26R21E 26R21E 26R21E 27R21E 27R21E 27R21E 27R21E 27R21E 27R21E 27R21E 27R21E 27R21E 27R21E 27R21E 27R21E 27R21E 27R21E 28R21E 28R21E 28R21E 28R21E 28R21E 28R21E 28R21E 28R21E 28R22E 29R22E 29
B4H1OH1OAllAllH14G14G14A1OAIOE8E8H3H3H3H14L14E7F6GlG1G8G8
LiA13A13A13D1DlH9H9H9I0K4K4LIL4L8G4G4G4H14
llll
N2N2N2D3D3
KMTC 1-09 VEG 30.0 PPMKMTC 1-09 SOIL 90.0 PPMKMTC 1-09 VEG 9.0 PPMKMTC 1-09 SOIL 90.0 PPMKMTC 1-09 VEG 40.0 PPMKMTC 1-08 VEG 20.0 PPMKMTC 1-10 SOIL 70.0 PPMKMTC 1-10 VEG 1.0 PPMKMTC 1-08 SOIL 50.0 PPM T11NKMTC 1-08 VEG 8.0 PPM T11NKMTC 1-10 SOIL 60.0 PPMKMTC 1-10 VEG 10.0 PPMKMTC 1-10 SOIL 60.0 PPMKMTC 1-10 VEG 9.0 PPMKMTC 1-10 VEG 10.0 PPMKMTC 1-10 SOIL 80.0 PPMKMTC 1-14 WATER <0.1 MG/LKMTC 1-14 WATER <0.1 MG/LKMTC 1-14 WATER <0.1 MG/L SURFACE WATERKMTC 1-10 SOIL 60.0 PPMKMTC 1-10 VEG 10.0 PPMKMTC 1-10 SOIL 70.0 PPMKMTC 1-10 VEG 20.0 PPMKMTC 1-14 WATER <0.1 MG/L SURFACE (PONDKMTC 1-08 SOIL 90.0 PPMKMTC 1-08 VEG 6.0 PPM CEDARKMTC 1-08 VEG 4.0 PPM SMILAXKMTC 1-10 SOIL 90.0 PPMKMTC 1-10 VEG 80.0 PPMKMTC 1-10 SOIL 180.0 PPMKMTC 1-10 VEG 10.0 PPMKMTC 1-10 VEG 20.0 PPMKMTC 1-14 WATER <0.1 MG/L SURFACE WATERKMTC 1-10 SOIL 50.0 PPMKMTC 1-10 VEG 20.0 PPMKMTC 1-14 WATER 0.1 MG/LKMTC 1-14 WATER 0.1 MG/L SURFACE WATERKMTC 1-14 WATER <0.1 MG/L SURFACE WATERKMTC 1-10 SOIL 100.0 PPMKMTC 1-10 VEG 1.0 PPMKMTC 1-10 VEG 20.0 PPMKMTC -1-14 WATER 0.1 MG/L SURFACE WATERKMTC 1-10 SOIL 140.0 PPMKMTC 1-10 VEG 20.0 PPMKMTC 1-10 SOIL 170.0 PPMKMTC 1-10 VEG 2.0 PPMKMTC 1-10 VEG 10.0 PPMKMTC 1-10 SOIL 50.0 PPMKMTC 1-10 VEG 2.0 PPM
358
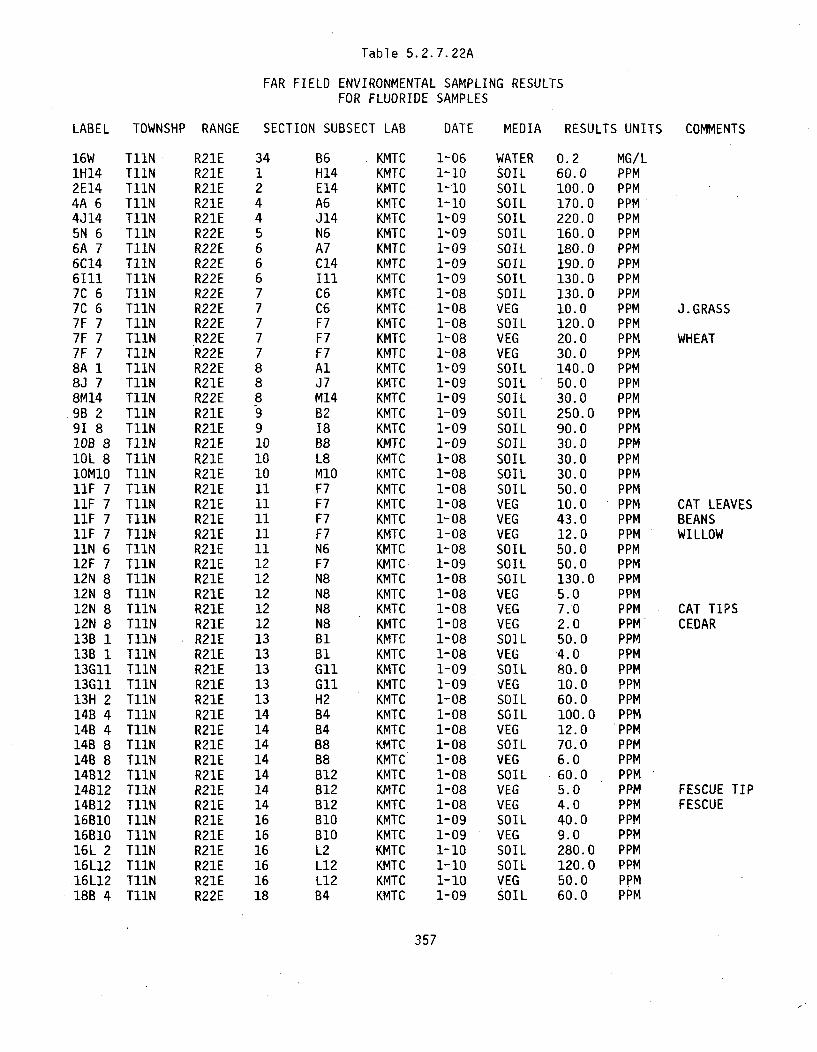
Table 5.2.7.22A
FAR FIELD ENVIRONMENTAL SAMPLING RESULTSFOR FLUORIDE SAMPLES
LABEL TOWNSHP RANGE SECTION SUBSECT LAB DATE MEDIA RESULTS UNITS COMMENTS
16W1H142E144A 64J145N 66A 76C1461117C 67C 67F 77F 77F 78A I8J 78M149B 291 810B 81OL 8IOMIO11F 711F 711F 711F 711N 612F 712N 812N 812N 812N 813B 113B 113G1113G1113H 214B 414B 414B 814B 814B1214B1214B1216B1016B1016L 216L1216L1218B 4
T11NT11NT11NT11NT11NT11NT11NT11NT11NT11NT11NT11NT11NT11NT11NT11NT11NT11NT11NT11NT11NT11NT11NT11NT11NT11NT11NT11NT11NT11NT11NT11NT11NT11NT11NT11NT11NT11NT11NT11NT11NT11NT11NT11NT11NT11NT11NT11NT11NT11N
R21ER21ER21ER21ER21ER22ER22ER22ER22ER22ER22ER22ER22ER22ER22ER21ER22ER21ER21ER21ER21ER21ER21ER21ER21ER21ER21ER21ER21ER21ER21ER21ER21ER21ER21ER21ER21ER21ER21ER21ER21ER21ER21ER21ER21ER21ER21ER21ER21ER22E
3412445666777778889910101011111111111212121212131313131314141414141414161616161618
B6H14E14A6J14N6A7C14illC6C6F7F7F7AlJ7M14B218B8L8MIOF7F7F7F7N6F7N8N8N8N8B1B1GIlG1lH2B4B4B8B8B12812B12B10B10L2L12L12B4
KMTCKMTCKMTCKMTCKMTCKMTCKMTCKMTCKMTCKMTCKMTCKMTCKMTCKMTCKMTCKMTCKMTCKMTCKMTCKMTCKMTCKMTCKMTCKMTCKMTCKMTCKMTCKMTCKMTCKMTCKMTCKMTCKMTCKMTCKMTCKMTCKMTCKMTCKMTCKMTCKMTCKMTCKMTCKMTCKMTCKMTCKMTCKMTCKMTCKMTC
1-061-101-101-101-091-091-091-091-091-081-081-081-081-081-091-091-091-091-091-091-081-081-081-081-081-081-081-091-081-081-081-081-081-081-091-091-081-081-081-081-081-081-081-081-091-091-101-101-101-09
WATERSOILSOILSOILSOILSOILSOILSOILSOILSOILVEGSOILVEGVEGSOILSOILSOILSOILSOILSOILSOILSOILSOILVEGVEGVEGSOILSOILSOILVEGVEGVEGSOI LVEGSOILVEGSOILSOILVEGSOILVEGSOILVEGVEGSOILVEGSOILSOILVEGSOIL
0.260.0100.0170.0220.0160.0180.0190.0130.0130.010.0120.020.030.0140.050.030.0250.090.030.030.030.050.010.043.012.050.050.0130.05.07.02.050.04.080.010.060.0100.012.070.06.060.05.04.040.09.0280.0120.050.060.0
MG/LPPMPPMPPMPPMPPMPPMPPMPPMPPMPPMPPMPPMPPMPPMPPMPPMPPMPPMPPMPPMPPMPPMPPMPPMPPMPPMPPMPPMPPMPPMPPMPPMPPMPPMPPMPPMPPMPPMPPMPPMPPMPPMPPMPPMPPMPPMPPMPPMPPM
J.GRASS
WHEAT
CAT LEAVESBEANSWILLOW
CAT TIPSCEDAR
FESCUE TIPFESCUE
357
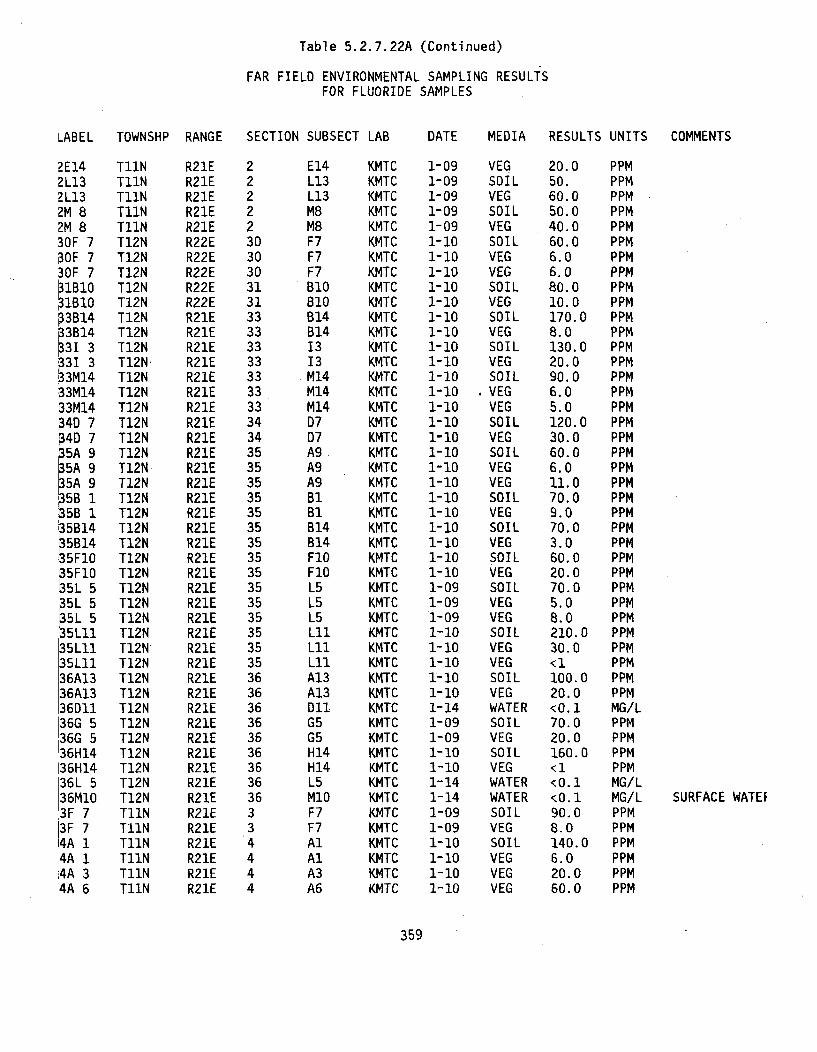
Table 5.2.7.22A (Continued)
FAR FIELD ENVIRONMENTAL SAMPLING RESULTSFOR FLUORIDE SAMPLES
LABEL TOWNSHP RANGE SECTION SUBSECT LAB DATE MEDIA RESULTS UNITS COMMENTS
2E142L132L132M 82M 830F 7aOF 73OF 7
l BlO
•3B14313B14
3M14
3M14.3M14Q4 7Q4 75A 95A 95A 95B 15B 15B145B145F105F105L 55L 5
35L 535L1135Lll35L1136A1336A1336D1136G 536G 536H1436H1436L 536M10.3F 73F 74A 14A 1;4A 34A 6
T11NT11NT11NT11NT11NT12NT12NT12NT12NT12NT12NT12NT12NT12NT12NT12NT12NT12NT12NT12NT12NT12NT12NT12NT12NT12NT12NT12NT12NT12NT12NT12NT12NT12NT12NT12NT12NT12NT12NT12NT12NT12NT12NT11NT11NT11NT11NT11NT11N
R21ER21ER21ER21ER21ER22ER22ER22ER22ER22ER21ER21ER21ER21ER21ER21ER21ER21ER21ER21ER21ER21ER21ER21ER21ER21ER21ER21ER21ER21ER21ER21ER21ER21ER21ER21ER21ER21ER21ER21ER21ER21ER21ER21ER21ER21ER21ER21ER21E
222223030303131333333333333333434353535353535353535353535353535363636363636363636334444
E14L13L13M8M8F7F7F7B1O810B14B141313M14M14M14D7D7A9A9A9B1B1B14B14FlOFIOL5L5L5LIiLIiLIIA13A13DllG5G5H14H14L5M1OF7F7AlAlA3A6
KMTCKMTCKMTCKMTCKMTCKMTCKMTCKMTCKMTCKMTCKMTCKMTCKMTCKMTCKMTCKMTCKMTCKMTCKMTCKMTCKMTCKMTCKMTCKMTCKMTCKMTCKMTCKMTCKMTCKMTCKMTCKMTCKMTCKMTCKMTCKMTCKMTCKMTCKMTCKMTCKMTCKMTCKMTCKMTCKMTCKMTCKMTCKMTCKMTC
1-091-091-091-091-091-101-101-101-101-101-101-101-101-101-101-101-101-101-101-101-101-101-101-101-101-101-101-101-091-091-091-101-101-101-101-101-141-091-091-101-101-141-141-091-091-101-101-101-10
VEGSOILVEGSOILVEGSOILVEGVEGSOILVEGSOILVEGSOILVEGSOILVEGVEGSOILVEGSOILVEGVEGSOILVEGSOILVEGSOILVEGSOILVEGVEGSOILVEGVEGSOILVEGWATERSOILVEGSOILVEGWATERWATERSOILVEGSOILVEGVEGVEG
20.050.60.050.040.060.06.06.080.010.0170.08.0130.020.090.06.05.0120.030.060.06.011.070.09.070.03.060.020.070.05.08.0210.030.0<1100.020.0<0.170.020.0160.0<1<0. 1<0.190.08.0140.06.020.060.0
PPMPPMPPMPPMPPMPPMPPMPPMPPMPPMPPMPPMPPMPPMPPMPPMPPMPPMPPMPPMPPMPPMPPMPPMPPMPPMPPMPPMPPMPPMPPMPPMPPMPPMPPMPPMMG/LPPMPPMPPMPPMMG/LMG/LPPMPPMPPMPPMPPMPPM
SURFACE WATEF
359
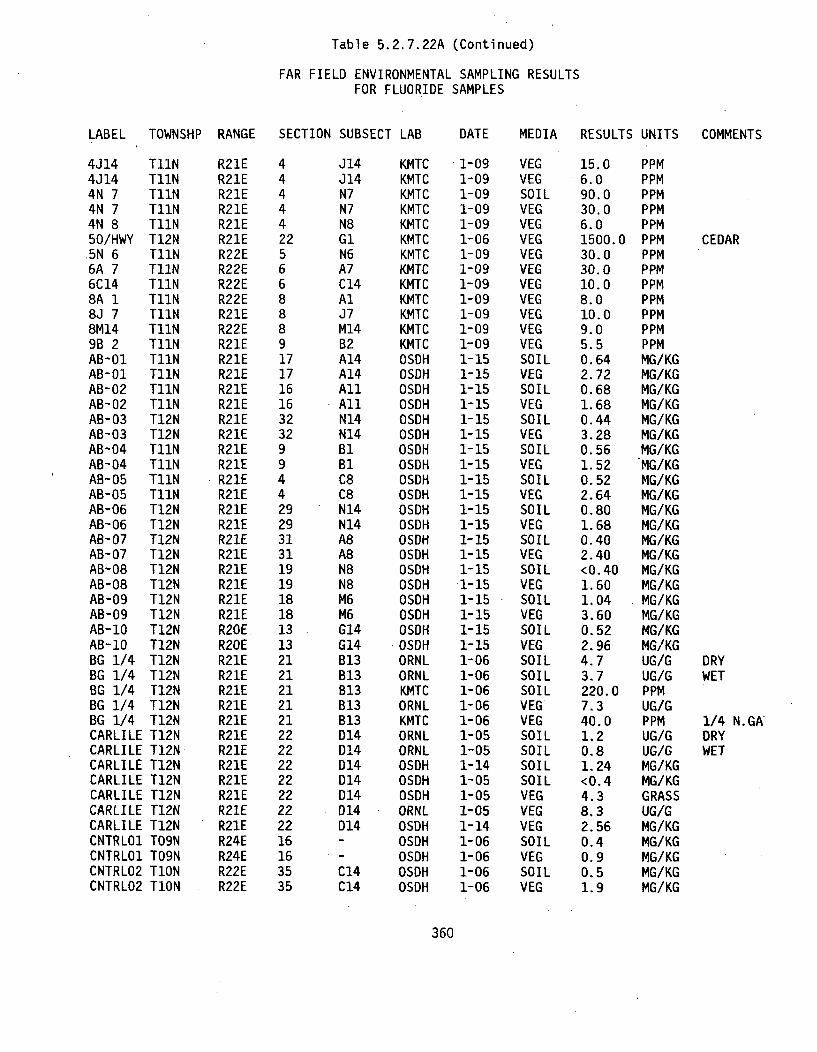
Table 5.2.7.22A (Continued)
FAR FIELD ENVIRONMENTAL SAMPLING RESULTSFOR FLUORIDE SAMPLES
LABEL TOWNSHP RANGE SECTION SUBSECT LAB DATE MEDIA
4J14 T11N4J14 T11N4N 7 T11N4N 7 T11N4N 8 T11N50/HWY T12N5N 6 T11N6A 7 T11N6C14 T11N8A 1 T11N8J 7 T11N8M14 T11N9B 2 T11NAB-Ol T11NAB-01 T11NAB-02 T11NAB-02 T1lNAB-03 T12NAB-03 T12NAB-04 T11NAB-04 T11NAB-O5 T1lNAB-05 T11NAB-06 T12NAB-06 T12NAB-07 T12NAB-07 T12NAB-08 T12NAB-08 T12NAB-09 T12NAB-09 T12NAB-IO T12NAB-1O T12NBG 1/4 T12NBG 1/4 T12NBG 1/4 T12NBG 1/4 T12NBG 1/4 T12NCARLILE T12NCARLILE T12NCARLILE T12NCARLILE T12NCARLILE T12NCARLILE T12NCARLILE T12NCNTRLO1 TO9NCNTRLO1 TO9NCNTRL02 TIONCNTRL02 TION
R21E 4R21E 4R21E 4R21E 4R21E 4R21E 22R22E 5R22E 6R22E 6R22E 8R21E 8R22E 8R21E 9R21E 17R21E 17R21E 16R21E 16R21E 32R21E 32R21E 9R21E 9R21E 4R21E 4R21E 29R21E 29R21E 31R21E 31R21E 19R21E 19R21E 18R21E 18R20E 13R20E 13R21E 21R21E 21R21E 21R21E 21R21E 21R21E 22R21E 22R21E 22R21E 22R21E 22R21E 22R21E 22R24E 16R24E 16R22E 35R22E 35
J14J14N7N7N8GiN6A7C14AlJ7M14B2A14A14AllAllN14N14B1B1C8C8N14N14A8A8N8N8M6M6G14G14B13B13B13B13B13D14D14D14D14D14D14D14
C14C14
KMTC 1-09 VEGKMTC 1-09 VEGKMTC 1-09 SOILKMTC 1-09 VEGKMTC 1-09 VEGKMTC 1-06 VEGKMTC 1-09 VEGKMTC 1-09 VEGKMTC 1-09 VEGKMTC 1-09 VEGKMTC 1-09 VEGKMTC 1-09 VEGKMTC 1-09 VEGOSDH 1-15 SOILOSDH 1-15 VEGOSDH 1-15 SOILOSDH 1-15 VEGOSDH 1-15 SOILOSDH 1-15 VEGOSDH 1-15 SOILOSDH 1-15 VEGOSDH 1-15 SOILOSDH 1-15 VEGOSDH 1-15 SOILOSDH 1-15 VEGOSDH 1-15 SOILOSDH 1-15 VEGOSDH 1-15 SOILOSDH 1-15 VEGOSDH 1-15 SOILOSDH 1-15 VEGOSDH 1-15 SOILOSDH 1-15 VEGORNL 1-06 SOILORNL 1-06 SOILKMTC 1-06 SOILORNL 1-06 VEGKMTC 1-06 VEGORNL 1-05 SOILORNL 1-05 SOILOSDH 1-14 SOILOSDH 1-05 SOILOSDH 1-05 VEGORNL 1-05 VEGOSDH 1-14 VEGOSDH 1-06 SOILOSDH 1-06 VEGOSDH 1-06 SOILOSDH 1-06 VEG
RESULTS UNITS COMMENTS
15.0 PPM6.0 PPM90.0 PPM30.0 PPM6.0 PPM1500.0 PPM CEDAR30.0 PPM30.0 PPM10.0 PPM8.0 PPM10.0 PPM9.0 PPM5.5 PPM0.64 MG/KG2.72 MG/KG0.68 MG/KG1.68 MG/KG0.44 MG/KG3.28 MG/KG0.56 MG/KG1.52 "MG/KG0.52 MG/KG2.64 MG/KG0.80 MG/KG1.68 MG/KG0.40 MG/KG2.40 MG/KG<0.40 MG/KG1.60 MG/KG1.04 MG/KG3.60 MG/KG0.52 MG/KG2.96 MG/KG4.7 UG/G DRY3.7 UG/G WET220.0 PPM7.3 UG/G40.0 PPM 1/4 N.GA'1.2 UG/G DRY0.8 UG/G WET1.24 MG/KG<0.4 MG/KG4.3 GRASS8.3 UG/G2.56 MG/KG0.4 MG/KG0.9 MG/KG0.5 MG/KG1.9 MG/KG
360

Table 5.2.7.22A (Continued)
FAR FIELD ENVIRONMENTAL SAMPLING RESULTSFOR FLUORIDE SAMPLES
ABEL TOWNSHP RANGE SECTION SUBSECT LAB DATE MEDIA RESULTS UNITS COMMENTS
:NTRL03 T11N'NTRL03 T11N:NTRL04 T11NANTRL04 T11N.NTRL05 T11N
NTRL05 T11N,NTRL06 T09N.NTRLO7 T11N'NTRL07 T11N:NTRL08 TION:NTRL08 TION'NTRL09 T11N,NTRL09 T11N'NTRL09 T11N'NTRL1O T11N'NTRLIO T11N:NTRL11 T12N'NTRL11 T12NNTRL12 T11N
.NTRL13 T11N
.NTRL13 T11N:NTRL14 T11N:NTRL15 TO9N:NTRL15 TO9N'RES T12N.RES T12N'RES T12N'RES T12NRES T12N
'RES T12N.RES08 T12NRES09 T12N:RESlO T12NIRTYCR T11N
)RES11 T12N)RES12 T12N)RES13 T12N3-01 T12N1-01 T12N3-02 T12N3-02 T12N3-03 T12N.- 03 T12N-04 T12N-04 T12NL-01 T12N
;L-01 T12N1-02 T12N-03 T12N
R22E 28R22E 28R22E 20R22E 20R22E 19R22E 19R22E 4R21E 13R21E 13R22E 8R22E 8R20E 21R20E 21R20E 21R20E 21R20E 21R19E 26R19E 26R20E 14R23E 3R23E 3R23E -
R20E 16R20E 16R21E 27R21E 27R21E 27R21E 27R21E 27R21E 27R21E 27R21E 27R21E 27R21E 6R21E 27R21E 27R21E 27R21E 8R21E 8R21E 8R21E 8R21E 7R21E 7R21E 7R21E 7R21E 16R21E 16R21E 27R21E 27
E1OE1ONION10F13F13113B7B7K8K8C12C12C12113113E3E3N6C2C2
G13G13K3K3K3K3K3K3K3K3K3F9K4K4K4L5L5B3B3B13B13K9K9F1F11212
OSDH 1-06 SOIL <0.4OSDH 1-06 VEG 2.4OSDH 1-06 SOIL 0.7OSDH 1-06 VEG 2.5OSDH 1-06 SOIL 0.9OSDH 1-06 VEG 2.2OSDH 1-06 VEG 1.4OSDH 1-06 SOIL <0.4OSDH 1-06 VEG 0.9OSDH 1-06 SOIL 0.6OSDH 1-06 VEG 2.7OSDH 1-06 SOIL 1.3OSDH 1-06 VEG 2.2OSDH 1-06 VEG 1.9OSDH 1-06 SOIL 1.3OSDH 1-06 VEG 3.0OSDH 1-06 SOIL 1.5OSDH 1-06 VEG 1.2OSDH 1-06 SOIL 0.7OSDH 1-06 SOIL 0.4OSDH 1-06 VEG 1.4OSDH 1-06 SOIL 0.5OSDH 1-06 SOIL 0.5OSDH 1-06 VEG 1.6OSDH 1-05 SOIL 0.6ORNL 1-05 SOIL 2.8ORNL 1-05 SOIL 1.9OSDH 1-05 VEG 32.0OSDH 1-05 WATER 0.19ORNL 1-05 WATER 0.09KMTC 1-04 VEG 42.0KMTC 1-04 S/V 90.0KMTC 1-04 SOIL 190.0OSDH 1-14 WATER 0.32KMTC 1-04 SOIL 40.0KMTC 1-04 VEG 160.0KMTC 1-04 SOIL 60.0OSDH 1-15 SOIL 0.72OSDH 1-15 VEG 4.00OSDH 1-15 SOIL 1.84OSDH 1-15 VEG 8.00OSDH 1-15 SOIL 0.64OSDH 1-15 VEG 2.08OSDH 1-15 SOIL 1.52OSDH 1-15 VEG 3.04OSDH 1-15 SOIL 0.52OSDH 1-15 VEG 2.16KMTC 1-04 VEG 24.0KMTC 1-04 VEG 80.0
MG/KGMG/KGMG/KGMG/KGMG/KGMG/KGMG/KGMG/KGMG/KGMG/KGMG/KGMG/KGMG/KGMG/KGMG/KGMG/KGMG/KGMG/KGMG/KGMG/KGMG/KGMG/KG S OF SALLISAWMG/KGMG/KGMG/KGUG/G DRYUG/G WETMG/KG GRASSMG/LUM/MLPPM CRESPPM MIX LEAVES/DIEPPM CRESMG/LPPM DRESPPM DRES/LEAVESPPM ORESMG/KGMG/KGMG/KGMG/KGMG/KGMG/KGMG/KGMG/KGMG/KGMG/KGPPM CEDARPPM HRES
361
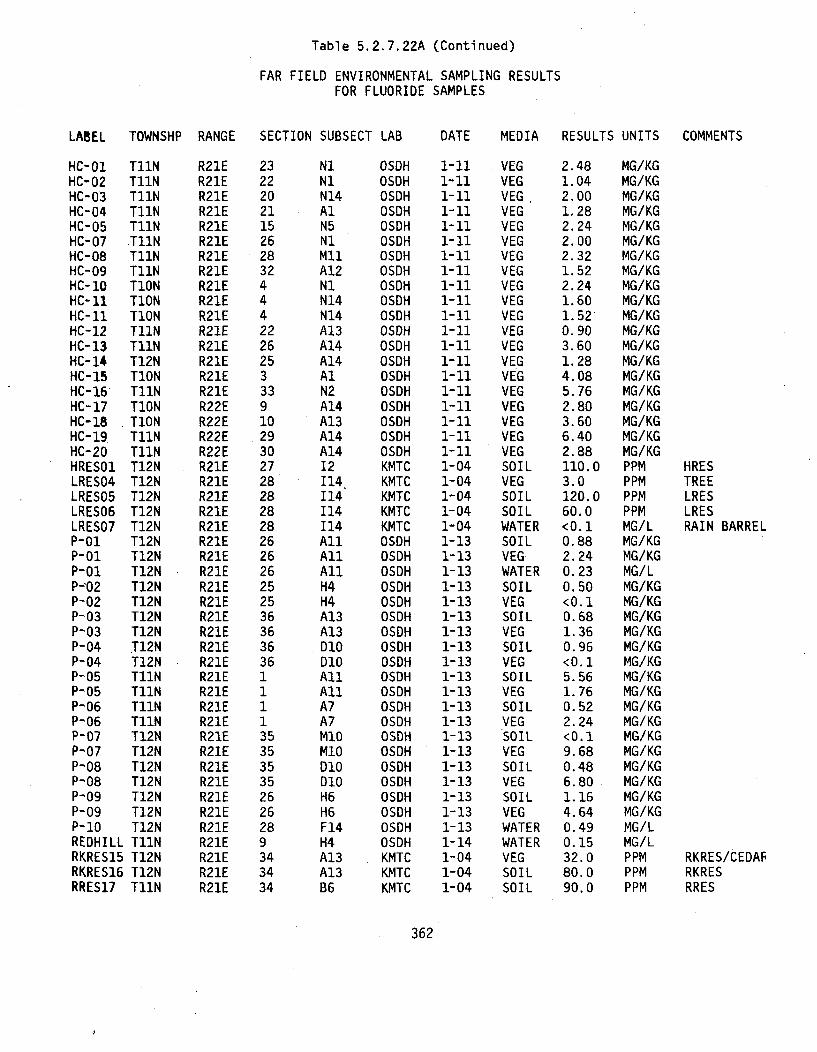
Table 5.2.7.22A (Continued)
FAR FIELD ENVIRONMENTAL SAMPLING RESULTSFOR FLUORIDE SAMPLES
LABEL TOWNSHP RANGE SECTION SUBSECT LAB DATE MEDIA RESULTS UNITS
HC-01 T11NHC-02 T11NHC-03 T11NHC-04 T11NHC-05 T11NHC-07 TJUNHC-08 T11NHC-09 T11NHC-10 TIONHC-11 TIONHC-11 TIONHC-12 T11NHC-13 T11NHC-14 T12NHC-15 TIONHC-16 T11NHC-17 TIONHC-18 TIONHC-19 T11NHC-20 T11NHRES01 T12NLRES04 T12NLRES05 T12NLRES06 T12NLRES07 T12NP-01 T12NP-01 T12NP-01 T12NP-02 T12NP-02 T12NP-03 T12NP-03 T12NP-04 T12NP-04 T12NP-05 T11NP-05 Tl1NP-06 T11NP-06 T11NP-07 TI2NP-07 T12NP-08 T12NP-08 T12NP-09 T12NP-09 T12NP-10 T12NREDHILL T11NRKRES15 T12NRKRES16 T12NRRES17 T11N
R21ER21ER21ER21ER21ER21ER21ER21ER21ER21ER21ER21ER21ER21ER21ER21ER22ER22ER22ER22ER21ER21ER21ER21ER21ER21ER21ER21ER21ER21ER21ER21ER21ER21ER21ER21ER21ER21ER21ER21ER21ER21ER21ER21ER21ER21ER21ER21ER21E
2322202115262832444222625333910293027282828282626262525363636361111353535352626289343434
NIN1N14AlN5N1MllA12NIN14N14A13A14A14AlN2A14A13A14A1412I14114114114AllAllAllH4H4A13A13D10DI1AllAllA7A7M1OM1OD10D10H6H6F14H4A13A13B6
OSDHOSDHOSDHOSDHOSDHOSDHOSDHOSDHOSDHOSDHOSDHOSDHOSDHOSDHOSDHOSDHOSDHOSDHOSDHOSDHKMTCKMTCKMTCKMTCKMTCOSDHOSDHOSDHOSDHOSDHOSDHOSDHOSDHDSDHOSDHOSDHOSDHOSDHOSDHOSDHOSDHOSDHOSDHOSDHOSDHOSDHKMTCKMTCKMTC
1-111-111-Il1-111-011-111-111-131-111-111-111-111-111-13
1-111-111-Il1-111-Il1-041-041-041-041-041-131-131-131-131-131-131-131-131-131-131-131-131-131-131-131-131-131-131-131-131-141-041-041-04
VEGVEGVEGVEGVEGVEGVEGVEGVEGVEGVEGVEGVEGVEGVEGVEGVEGVEGVEGVEGSOILVEGSOILSOILWATERSOILVEGWATERSOILVEGSOILVEGSOILVEGSOILVEGSOILVEGSOILVEGSOILVEGSOILVEGWATERWATERVEGSOILSOIL
2.481.042.001.282.242.002.321.522.241.601.520.903.601.284.085.762.803.606.402.88110.03.0120.060.0<0.10.882.240.230.50<0.10.681.360.96<0.15.561.760.522.24<0.19.680.486.801.164.640.490.1532.080.090.0
MG/KGMG/KGMG/KGMG/KGMG/KGMG/KGMG/KGMG/KGMG/KGMG/KGMG/KGMG/KGMG/KGMG/KGMG/KGMG/KGMG/KGMG/KGMG/KGMG/KGPPMPPMPPMPPMMG/LMG/KGMG/KGMG/ LMG/KGMG/KGMG/KGMG/KGMG/KGMG/KGMG/KGMG/KGMG/KGMG/KGMG/KGMG/KGMG/KGMG/KGMG/KGMG/KGMG/LMG/LPPMPPMPPM
COMMENTS
HRESTREELRESLRESRAIN BARREL
RKRES/CEDAFRKRESRRES
362

Table 5.2.7.22A (Continued)
FAR FIELD ENVIRONMENTAL SAMPLING RESULTSFOR FLUORIDE SAMPLES
LABEL TOWNSHP RANGE SECTION SUBSECT LAB DATE MEDIA RESULTS UNITS COMMENTS
RRES18 T11NRRES19 T11NS-01 T11NS-02 T11NS-03 T11NS-04 T11NS-05 T11NS-06 T11NS-07 TIONS-08 T11NS-09 TIONS-IO TIONS-11 TIONS-12 TiONS-13 T11NS-14 TIONS-15 TIONS-16 TIONSHRES14 T12NSMRES20 T12NSMRES21 T12NSTRM GH T11NSWR PND T1INT3-08 T12NT3-08 T12NT4-01E T11NT4-OIE T11NT4-OIE T11NT4-01E T11NT4-OIE T11NT4-OIW T12NT4-OIW T12NT4-01W T12NT4-02E T11NT4-02E TIINT4-02E T11NT4-02E Ti1NT4-02E T11NT4-02W T12NT4-02W T12NT4-02W T12NT4-03E T12NT4-03E T12NT4-03E T12NT4-03E T12NT4-03E T12NT4-03W T12NT4-03W T12NT4-03W T12N
R21E 34R21E 34R22E 34R22E 28R22E 30R21E 25R21E 36R21E 34R21E 2R22E 31R22E 6R22E 5R22E 9R22E 4R22E 33R22E 6R21E 2R21E 2R21E 27R21E 26R21E 26,R21E 4R21E 4R21E 26R21E 26R21E 2R21E 2R21E 2R21E 2R21E 2R21E 27R21E 27R21E 27R21E 2R21E 2R21E 2R21E 2R21E 2R21E 33R21E 33R21E 33R21E 35R21E 35R21E 35R21E 35R21E 35R21E 34R21E 34R21E 34
B6B6AlN1N14N14AlN14AlNIA14N1AlAlN14N1N14NIN6K6K6KOKOC12C12C11CIICIIcIlICIIN1N1N1B8B8B8B8B8L14L14L14N5N5N5N5N5B6B6B6
KMTC 1-04 VEGKMTC 1-04 SOILOSDH 1-11 VEGOSDH 1-11 VEGOSDH 1-11 VEGOSDH I-lI VEGOSDH 1-11 VEGOSDH I-Il VEGOSDH 1-11 VEGOSDH 1-11 VEGOSDH 1-i1 VEGOSDH 1-11 VEGOSDH 1-11 VEGOSDH I-II VEGOSDH 1-I1 VEGOSDH 1-11 VEGOSDH 1-11 VEGOSDH I-I1 VEGKMTC 1-04 SOILKMTC 1-04 SOILKMTC 1-04 VEGOSDH 1-16. WATEROSDH 1-14 WATEROSDH 1-14 SOILOSDH 1-14 VEGOSDH 1-06 SOILORNL 1-06 SOILORNL 1-06 SOILOSDH 1-06 VEGORNL 1-06 VEGOSDH 1-06 SOILORNL 1-06 SOILORNL 1-06 SOILOSDH 1-06 SOILORNL 1-06 SOILORNL 1-06 SOILOSDH 1-06 VEGORNL 1-06 VEGOSDH 1-06 SOILORNL 1-06 SOILORNL 1-06 SOILOSDH 1-06 SOILORNL 1-06 SOILORNL 1-06 SOILOSDH 1-06 VEGORNL 1-06 VEGOSDH 1-06 SOILORNL 1-06 SOILORNL 1-06 SOIL
7.0100.02.86.643.922.563.523.123.045.442.165.685.042.164.963.682.883.1280.040.05.07.000.181.242.401.11.21.02.63.11.10.70.6<0.80.60.52.72.12.30.70.6<0.8
1.33.52.91.60.80.7
PPM RRES/CEDARPPM RRESMG/KGMG/KGMG/KGMG/KGMG/KGMG/KGMG/KGMG/KGMG/KGMG/KGMG/KGMG/KGMG/KGMG/KGMG/KGMG/KGPPM SHRESPPM SMRESPPM SMRES/LEAVESMG/LMG/LMG/KGMG/KGMG/KGUG/G DRYUG/G WETMG/KG EVERGREENUG/GMG/KGUG/G DRYUG/G WETMG/KGUG/G DRYUG/G WETMG/KG EVERGREENUG/GMG/KGUG/G DRYUG/G WETMG/KGUG/G WETUG/G DRYMG/KG EVERGREENUG/GMG/KGUG/G DRYUG/G WET
363
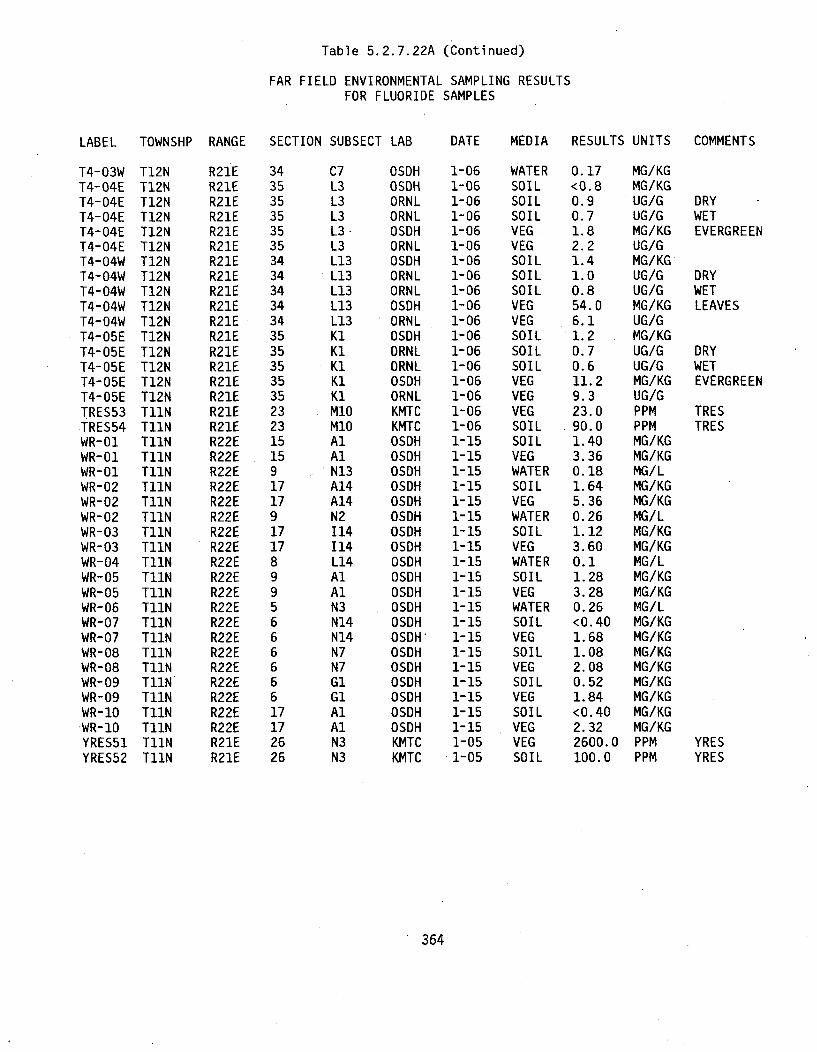
Table 5.2.7.22A (Continued)
FAR FIELD ENVIRONMENTAL SAMPLING RESULTSFOR FLUORIDE SAMPLES
LABEL TOWNSHP RANGE SECTION SUBSECT LAB DATE MEDIA RESULTS UNITS COMMENTS
T4-03W T12NT4-04E T12NT4-04E T12NT4-04E T12NT4-04E T12NT4-04E T12NT4-04W T12NT4-04W T12NT4-04W T12NT4-04W T12NT4-04W T12NT4-05E T12NT4-05E T12NT4-05E T12NT4-05E T12NT4-05E T12NTRES53 T11NTRES54 T11NWR-01 T11NWR-01 T11NWR-01 T11NWR-02 T11NWR-02 T11NWR-02 T11NWR-03 T11NWR-03 T11NWR-04 T11NWR-05 T11NWR-05 T11NWR-06 T11NWR-07 T11NWR-07 T11NWR-08 T11NWR-08 T11NWR-09 T11NWR-09 T11NWR-1O T11N'WR-1O T11NYRES51 T11NYRES52 T11N
R21E 34R21E 35R21E 35R21E 35R21E 35R21E 35R21E 34R21E 34R21E 34R21E 34R21E 34R21E 35R21E 35R21E 35R21E 35R21E 35R21E 23R21E 23R22E 15R22E 15R22E 9R22E 17R22E 17R22E 9R22E 17R22E 17R22E 8R22E 9R22E 9R22E 5R22E 6R22E 6R22E 6R22E 6R22E 6R22E 6R22E 17R22E 17R21E 26R21E 26
C7L3L3L3L3L3L13L13L13L13L13K1K1K1K1KIM1OM1OAlAlN13A14A14N2114114L14AlAlN3N14N14N7N7G1GIAlAlN3N3
OSDH 1-06 WATER 0.17 MG/KGOSDH 1-06 SOIL <0.8 MG/KGORNL 1-06 SOIL 0.9 UG/G DRYORNL 1-06 SOIL 0.7 UG/G WETOSDH 1-06 VEG 1.8 MG/KG EVERGREENORNL 1-06 VEG 2.2 UG/GOSDH 1-06 SOIL 1.4 MG/KGORNL 1-06 SOIL 1.0 UG/G DRYORNL 1-06 SOIL 0.8 UG/G WETOSDH 1-06 VEG 54.0 MG/KG LEAVESORNL 1-06 VEG 6.1 UG/GOSDH 1-06 SOIL 1.2 MG/KGORNL 1-06 SOIL 0.7 UG/G DRYORNL 1-06 SOIL 0.6 UG/G WETOSDH 1-06 VEG 11.2 MG/KG EVERGREENORNL 1-06 VEG 9.3 UG/GKMTC 1-06 VEG 23.0 PPM TRESKMTC 1-06 SOIL 90.0 PPM TRESOSDH 1-15 SOIL 1.40 MG/KGOSDH 1-15 VEG 3.36 MG/KGOSDH 1-15 WATER 0.18 MG/LOSDH 1-15 SOIL 1.64 MG/KGOSDH 1-15 VEG 5.36 MG/KGOSDH 1-15 WATER 0.26 MG/LOSDH 1-15 SOIL 1.12 MG/KGOSDH 1-15 VEG 3.60 MG/KGOSDH 1-15 WATER 0.1 MG/LOSDH 1-15 SOIL 1.28 MG/KGOSDH 1-15 VEG 3.28 MG/KGOSDH 1-15 WATER 0.26 MG/LOSDH 1-15 SOIL <0.40 MG/KGOSDH 1-15 VEG 1.68 MG/KGOSDH 1-15 SOIL 1.08 MG/KGOSDH 1-15 VEG 2.08 MG/KGOSDH 1-15 SOIL 0.52 MG/KGOSDH 1-15 VEG 1.84 MG/KGOSDH 1-15 SOIL <0.40 MG/KGOSDH 1-15 VEG 2.32 MG/KGKMTC 1-05 VEG 2600.0 PPM YRESKMTC 1-05 SOIL 100.0 PPM YRES
364
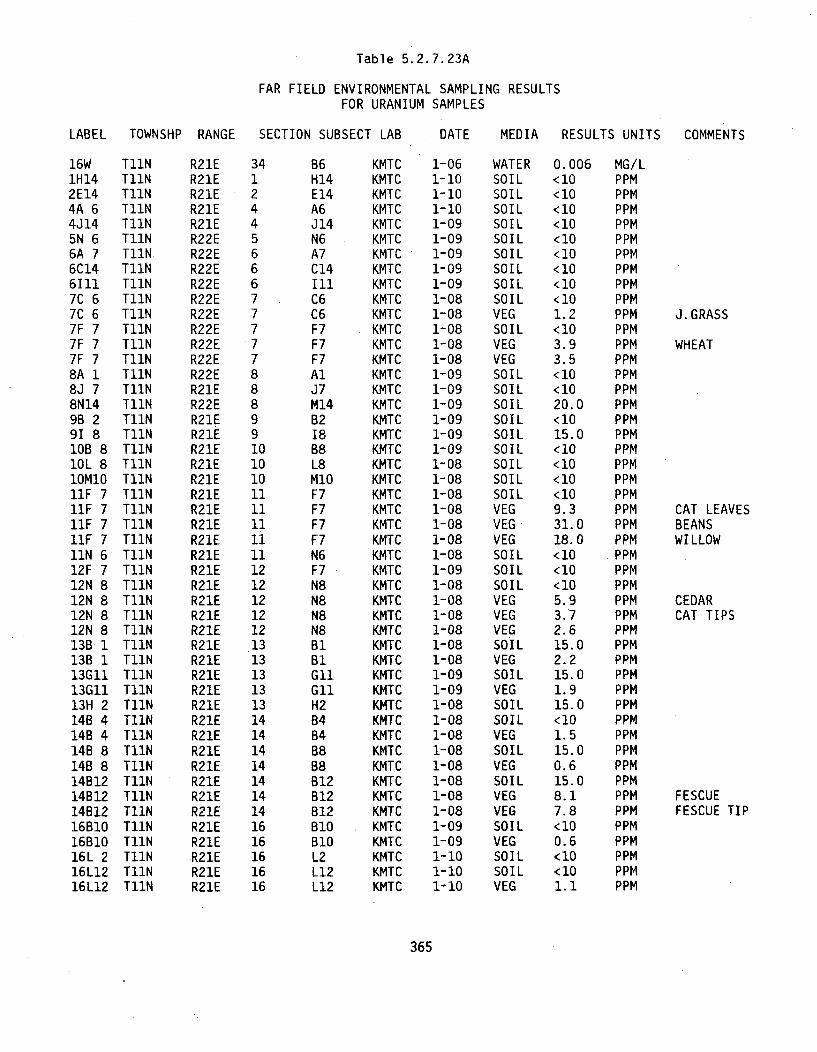
Table 5.2.7.23A
FAR FIELD ENVIRONMENTAL SAMPLING RESULTSFOR URANIUM SAMPLES
LABEL TOWNSHP RANGE SECTION SUBSECT LAB DATE MEDIA RESULTS UNITS COMMENTS
16W T11N1H14 T11N2E14 T11N4A 6 T11N4J14 T11N5N 6 T11N6A 7 T11N6C14 T11N6111 T11N7C 6 T11N7C 6 T11N7F 7 T11N7F 7 T11N7F 7 T11N8A 1 T11N8J 7 T11N8N14 T11N9B 2 T11N91 8 T11NlOB 8 T11N1OL 8 T11N1OM10 T11N11F 7 T11N11F 7 T11N11F 7 T11N11F 7 T11N11N 6 T11N12F 7 T11N12N 8 T11N12N 8 T11N12N 8 T11N12N 8 T11N13B 1 T11N13B 1 T11N13G11 T11N13G11 T11N13H 2 T11N14B 4 T11N14B 4 T11N14B 8 T11N14B 8 T11N14B12 T11N14B12 T11N14812 T11N16B10 T11N16B10 T11N16L 2 T11N16L12 T11N16L12 T11N
R21E 34R21E 1R21E 2R21E 4R21E 4R22E 5R22E 6R22E 6R22E 6R22E 7R22E 7R22E 7R22E 7R22E 7R22E 8R21E 8R22E 8R21E 9R21E 9R21E 10R21E 10R21E 10R21E 11R21E 11R21E IIR21E 11R21E 11R21E 12R21E 12R21E 12R21E 12R21E 12R21E .13R21E 13R21E 13R21E 13R21E 13R21E 14R21E 14R21E 14R21E 14R21E 14R21E 14R21E 14R21E 16R21E 16R21E 16R21E 16R21E 16
B6H14E14A6J14N6A7C14illC6C6F7F7F7AlJ7M14B218B8L8MIOF7F7F7F7N6F7N8N8N8N8BiB1G1lGilH2B4B4B8B8B12B12812B10B10L2L12L12
KMTC 1-06 WATER 0.006KMTC 1-10 SOIL <10KMTC 1-10 SOIL <10KMTC 1-10 SOIL <10KMTC 1-09 SOIL <10KMTC 1-09 SOIL <10KMTC 1-09 SOIL <10KMTC 1-09 SOIL <10KMTC 1-09 SOIL <10KMTC 1-08 SOIL <10KMTC 1-08 VEG 1.2KMTC 1-08 SOIL <10KMTC 1-08 VEG 3.9KMTC 1-08 VEG 3.5KMTC 1-09 SOIL <10KMTC 1-09 SOIL <10KMTC 1-09 SOIL 20.0KMTC 1-09 SOIL <10KMTC 1-09 SOIL 15.0KMTC 1-09 SOIL <10KMTC 1-08 SOIL <10KMTC 1-08 SOIL <10KMTC 1-08 SOIL <10KMTC 1-08 VEG 9.3KMTC 1-08 VEG 31.0KMTC 1-08 VEG 18.0KMTC 1-08 SOIL <10KMTC 1-09 SOIL <10KMTC 1-08 SOIL <10KMTC 1-08 VEG 5.9KMTC 1-08 VEG 3.7KMTC 1-08 VEG 2.6KMTC 1-08 SOIL 15.0KMTC 1-08 VEG 2.2KMTC 1-09 SOIL 15.0KMTC 1-09 VEG 1.9KMTC 1-08 SOIL 15.0KMTC 1-08 SOIL <10KMTC 1-08 VEG 1.5KMTC 1-08 SOIL 15.0KMTC 1-08 VEG 0.6KMTC 1-08 SOIL 15.0KMTC 1-08 VEG 8.1KMTC 1-08 VEG 7.8KMTC 1-09 SOIL <10KMTC 1-09 VEG 0.6KMTC 1-10 SOIL <10KMTC 1-10 SOIL <10KMTC 1-10 VEG 1.1
MG/LPPMPPMPPMPPMPPMPPMPPMPPMPPMPPMPPMPPMPPMPPMPPMPPMPPMPPMPPMPPMPPMPPMPPMPPMPPMPPMPPMPPMPPMPPMPPMPPMPPMPPMPPMPPMPPMPPMPPMPPMPPMPPMPPMPPMPPMPPMPPMPPM
J. GRASS
WHEAT
CAT LEAVESBEANSWILLOW
CEDARCAT TIPS
FESCUEFESCUE TIP
365

Table 5.2.7.23A (Continued)
FAR FIELD ENVIRONMENTAL SAMPLING RESULTSFOR URANIUM SAMPLES
LABEL TOWNSHP RANGE SECTION SUBSECT LAB DATE MEDIA RESULTS UNITS COMMENTS
18B 418B 418H1018H10lAlllAll1H1422G1422G1423A1023A1025E 825E 825H 325H 325H 325H1425L1426E 726F 626G 126G 126G 826G 826L I27A1327A1327A1327D 127D 127H 927H 927H 9271 027K 427K 427L 127L 427L 828G 428G 428G 428H1428J1128J1128N 228N 228N 229D 3
T11NT11NT11NT11NT11NT11NT11NT11NT11NT11NT11NT12NT12NT12NT12NT12NT12NT12NT12NT12NT12NT12NT12NT12NT12NT12NT12NT12NT12NT12NT12NT12NT12NT12NT12NT12NT12NT12NT12NT12NT12NT12NT12NT12NT12NT12NT12NT12NT12N
R22ER22ER22ER22ER21ER21ER21ER21ER21ER21ER21ER21ER21ER21ER21ER21ER21ER21ER21ER21ER21ER21ER21ER21ER21ER21ER21ER21ER21ER21ER21ER21ER21ER21ER21ER21ER21ER21ER21ER21ER21ER21ER21ER21ER21ER21ER21ER21ER22E
18181818111222223232525252525252526262626262626272727272727272727272727272728282828282828282829
B4B4H1OH10AllAllH14G14G14AIOA1OE8E8H3H3H3H14L14E7F6G1G1G8G8LlA13A13A13D1D1H9H9H910K4K4LiL4L8G4G4G4H14Jl1Jll
N2N2N2D3
KMTCKMTCKMTCKMTCKMTCKMTCKMTCKMTCKMTCKMTCKMTCKMTCKMTCKMTCKMTCKMTCKMTCKMTCKMTCKMTCKMTCKMTCKMTCKMTCKMTCKMTCKMTCKMTCKMTCKMTCKMTCKMTCKMTCKMTCKMTCKMTCKMTCKMTCKMTCKMTCKMTCKMTCKMTCKMTCKMTCKMTCKMTCKMTCKMTC
1-091-091-091-091-091-091-081-101-101-081-081-101-101-101-101-101-101-141-141-141-101-101-101-101-141-081-081-081-101-101-101-101-101-141-101-101-141-141-141-101-101-101-141-101-101-101-101-101-10
SOILVEGSOILVEGSOILVEGVEGSOILVEGSOILVEGSOILVEGSOILVEGVEGSOILWATERWATERWATERSOILVEGSOILVEGWATERSOILVEGVEGSOILVEGSOILVEGVEGWATERSOILVEGWATERWATERWATERSOILVEGVEGWATERSOILVEGSOILVEGVEGSOIL
<100.7<10<0. 5<100.71.4<10<0.510.028.015.01.215.0<0. 5<0. 515.0<0. 0020.0060.00315.0<0.510.01.10.00310. 04.55.715.052.0<102.31.1< 0. 00215..038.0<0. 002<O. 0020.004<101.2<0.5<0. 002<101.7<10<0. 56.615.0
PPMPPMPPMPPMPPMPPMPPMPPMPPMPPMPPMPPMPPMPPMPPMPPMPPMMG/LMG/LMG/LPPMPPMPPMPPMMG/LPPMPPMPPMPPMPPMPPMPPMPPMMG/LPPMPPMMG/LMG/LMG/LPPMPPMPPMMG/LPPMPPMPPMPPMPPMPPM
T11NT11N
SURFACE WATE
SMILAXCEDAR
SURFACE WATE
SURFACE WATE
SURFACE WATE
SURFACE WATE
366
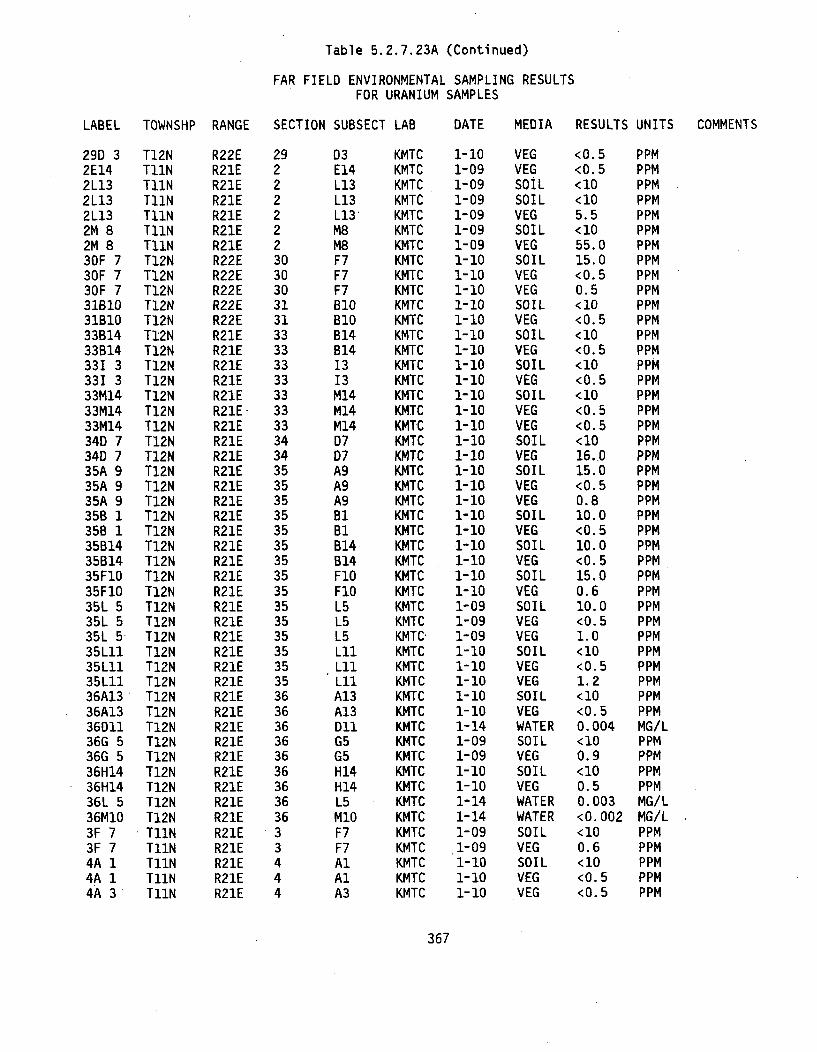
Table 5.2.7.23A (Continued)
FAR FIELD ENVIRONMENTAL SAMPLING RESULTSFOR URANIUM SAMPLES
LABEL TOWNSHP RANGE SECTION SUBSECT LAB DATE MEDIA RESULTS UNITS COMMENTS
290 3 T12N2E14 T11N2L13 T11N2L13 T11N2L13 T11N2M 8 T11N2M 8 T11N30F 7 T12N30F 7 T12N30F 7 T12N31B10 T12N31B10 T12N33B14 T12N33B14 T12N331 3 T12N331 3 T12N33M14 T12N33M14 T12N33M14 T12N34D 7 T12N34D 7 T12N35A 9 T12N35A 9 T12N35A 9 T12N35B 1 T12N35B 1 T12N35B14 T12N35B14 T12N35F10 T12N35F10 T12N35L 5 T12N35L 5 T12N35L 5 T12N35L11 T12N35L11 T12N35Lii T12N36A13 T12N36A13 T12N36011 T12N36G 5 T12N36G 5 T12N36H14 T12N36H14 T12N36L 5 T12N36M10 T12N3F 7 T11N3F 7 T11N4A 1 T11N4A 1 T11N4A 3 T11N
R22E 29R21E 2R21E 2R21E 2R21E 2R21E 2R21E 2R22E 30R22E 30R22E 30R22E 31R22E 31R21E 33R21E 33R21E 33R21E 33R21E 33R21E 33R21E 33R21E 34R21E 34R21E 35R21E 35R21E 35R21E 35R21E 35R21E 35R21E 35R21E 35R21E 35R21E 35R21E 35R21E 35R21E 35R21E 35R21E 35R21E 36R21E 36R21E 36R21E 36R21E 36R21E 36R21E 36R21E 36R21E 36R21E 3R21E 3R21E 4R21E 4R21E 4
03E14L13L13L13M8M8F7F7F7B10BIOB14B14I313M14M14M14D7D7A9A9A9BiBIB14B14F1OF1OL5L5L5L11L11L11A13A13Dl1G5G5H14H14L5M1OF7F7AlAlA3
KMTC 1-10 VEG <0.5 PPMKMTC 1-09 VEG <0.5 PPMKMTC 1-09 SOIL <10 PPMKMTC 1-09 SOIL <10 PPMKMTC 1-09 VEG 5.5 PPMKMTC 1-09 SOIL <10 PPMKMTC 1-09 VEG 55.0 PPMKMTC 1-10 SOIL 15.0 PPMKMTC 1-10 VEG <0.5 PPMKMTC 1-10 VEG 0.5 PPMKMTC 1-10 SOIL <10 PPMKMTC 1-10 VEG <0.5 PPMKMTC 1-10 SOIL <10 PPMKMTC 1-10 VEG <0.5 PPMKMTC 1-10 SOIL <10 PPMKMTC 1-10 VEG <0.5 PPMKMTC 1-10 SOIL <10 PPMKMTC 1-10 VEG <0.5 PPMKMTC 1-10 VEG <0.5 PPMKMTC 1-10 SOIL <10 PPMKMTC 1-10 VEG 16.,0 PPMKMTC 1-10 SOIL 15.0 PPMKMTC 1-10 VEG <0.5 PPMKMTC 1-10 VEG 0.8 PPMKMTC 1-10 SOIL 10.0 PPMKMTC 1-10 VEG <0.5 PPMKMTC 1-10 SOIL 10.0 PPMKMTC 1-10 VEG <0.5 PPMKMTC 1-10 SOIL 15.0 PPMKMTC 1-10 VEG 0.6 PPMKMTC 1-09 SOIL 10.0 PPMKMTC 1-09 VEG <0.5 PPMKMTC 1-09 VEG 1.0 PPMKMTC 1-10 SOIL <10 PPMKMTC 1-10 VEG <0.5 PPMKMTC 1-10 VEG 1.2 PPMKMTC 1-10 SOIL <10 PPMKMTC 1-10 VEG <0.5 PPMKMTC 1-14 WATER 0.004 MG/LKMTC 1-09 SOIL <10 PPMKMTC 1-09 VEG 0.9 PPMKMTC 1-10 SOIL <10 PPMKMTC 1-10 VEG 0.5 PPMKMTC 1-14 WATER 0.003 MG/LKMTC 1-14 WATER <0.002 MG/LKMTC 1-09 SOIL <10 PPMKMTC 1-09 VEG 0.6 PPMKMTC 1-10 SOIL <10 PPMKMTC 1-10 VEG <0.5 PPMKMTC 1-10 VEG <0.5 PPM
367
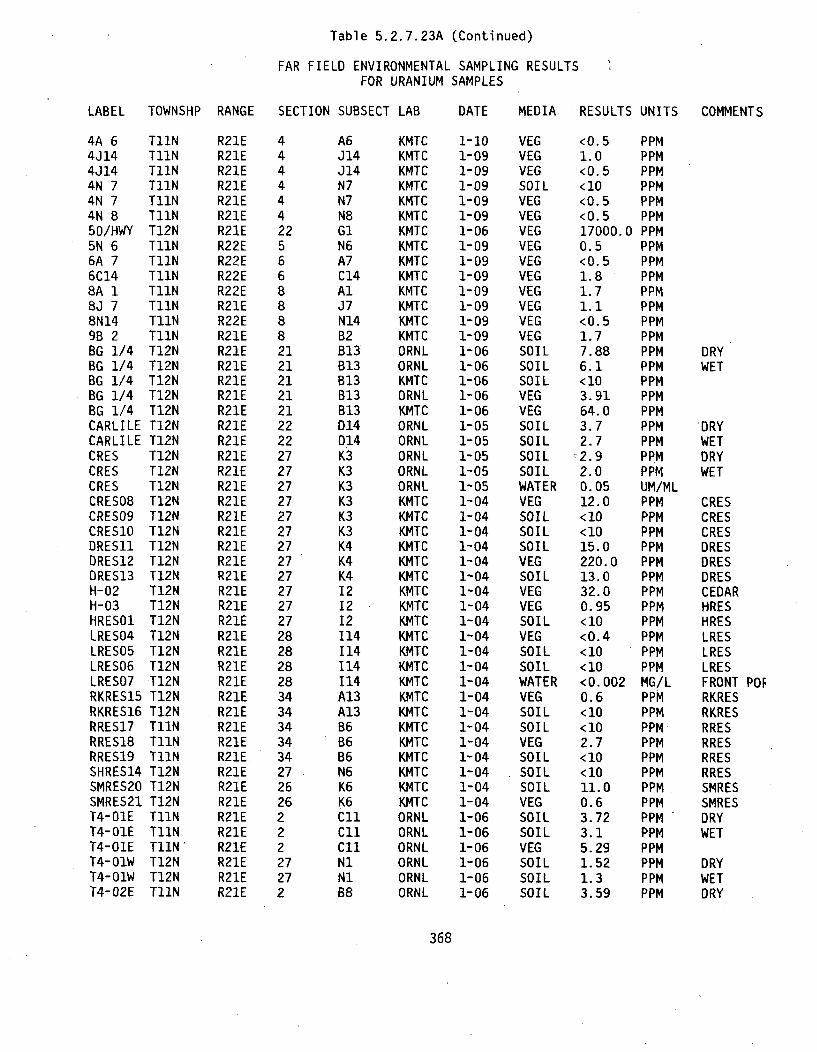
Table 5.2.7.23A (Continued)
FAR FIELD ENVIRONMENTAL SAMPLING RESULTSFOR URANIUM SAMPLES
LABEL TOWNSHP RANGE SECTION SUBSECT LAB DATE MEDIA RESULTS UNITS COMMENTS
4A 6 T11N4J14 T11N4J14 T11N4N 7 T11N4N 7 T11N4N 8 T11N50/HWY T12N5N 6 T11N6A 7 T11N6C14 T11N8A 1 T11N8J 7 T11N8N14 T11N9B 2 T11NBG 1/4 T12NBG 1/4 T12NBG 1/4 T12NBG 1/4 T12NBG 1/4 T12NCARLILE T12NCARLILE T12NCRES T12NCRES T12NCRES T12NCRES08 T12NCRES09 T12NCRESIO T12NDRESl1 T12NDRES12 T12NDRES13 T12NH-02 T12NH-03 T12NHRESO1 T12NLRES04 T12NLRES05 T12NLRES06 T12NLRES07 T12NRKRES15 T12NRKRES16 T12NRRES17 T11NRRES18 T11NRRES19 TllNSHRES14 T12NSMRES20 T12NSMRES21 T12NT4-01E T11NT4-O1E T11NT4-O1E T11N'T4-O1W T12NT4-O1W T12NT4-02E T11N
R21E 4R21E 4R21E 4R21E 4R21E 4R21E 4R21E 22R22E 5R22E 6R22E 6R22E 8R21E 8R22E 8R21E 8R21E 21R21E 21R21E 21R21E 21R21E 21R21E 22R21E 22R21E 27R21E 27R21E 27R21E 27R21E 27R21E 27R21E 27R21E 27R21E 27R21E 27R21E 27R21E 27R21E 28R21E 28R21E 28R21E 28R21E 34R21E 34R21E 34R21E 34R21E 34R21E 27R21E 26R21E 26R21E 2R21E 2R21E 2R21E 27R21E 27R21E 2
A6J14J14N7N7N8G1N6A7C14AlJ7N14B2B13B13B13B13B13D14D14K3K3K3K3K3K3K4K4K41212I2114114I14114A13A13B6B6B6N6K6K6CllCllCliN1N1B8
KMTC 1-10 VEGKMTC 1-09 VEGKMTC 1-09 VEGKMTC 1-09 SOILKMTC 1-09 VEGKMTC 1-09 VEGKMTC 1-06 VEGKMTC 1-09 VEGKMTC 1-09 VEGKMTC 1-09 VEGKMTC 1-09 VEGKMTC 1-09 VEGKMTC 1-09 VEGKMTC 1-09 VEGORNL 1-06 SOILORNL 1-06 SOILKMTC 1-06 SOILORNL 1-06 VEGKMTC 1-06 VEGORNL 1-05 SOILORNL 1-05 SOILORNL 1-05 SOILORNL 1-05 SOILORNL 1-05 WATERKMTC 1-04 VEGKMTC 1-04 SOILKMTC 1-04 SOILKMTC 1-04 SOILKMTC 1-04 VEGKMTC 1-04 SOILKMTC 1-04 VEGKMTC 1-04 VEGKMTC 1-04 SOILKMTC 1-04 VEGKMTC 1-04 SOILKMTC 1-04 SOILKMTC 1-04 WATERKMTC 1-04 VEGKMTC 1-04 SOILKMTC 1-04 SOILKMTC 1-04 VEGKMTC 1-04 SOILKMTC 1-04 SOILKMTC 1-04 SOILKMTC 1-04 VEGORNL 1-06 SOILORNL 1-06 SOILORNL 1-06 VEGORNL 1-06 SOILORNL 1-06 SOILORNL 1-06 SOIL
<0.5 PPM1.0 PPM<0.5 PPM<10 PPM<0.5 PPM<0.5 PPM17000.0 PPM0.5 PPM<0.5 PPM1.8 PPM1.7 PPM1.1 PPM<0.5 PPM1.7 PPM7.88 PPM6.1 PPM<10 PPM3.91 PPM64.0 PPM3.7 PPM2.7 PPM2.9 PPM2.0 PPM0.05 UM/ML12.0 PPM<10 PPM<10 PPM15.0 PPM220.0 PPM13.0 PPM32.0 PPM0.95 PPM<10 PPM<0.4 PPM<10 PPM<10 PPM<0.002 MG/L0.6 PPM<10 PPM<10 PPM2.7 PPM<10 PPM<10 PPM11.0 PPM0.6 PPM3.72 PPM3.1 PPM5.29 PPM1.52 PPM1.3 PPM3.59 PPM
DRYWET
DRYWETDRYWET
CRESCRESCRESDRESDRESDRESCEDARHRESHRESLRESLRESLRESFRONT POFRKRESRKRESRRESRRESRRESRRESSMRESSMRESDRYWET
DRYWETDRY
368
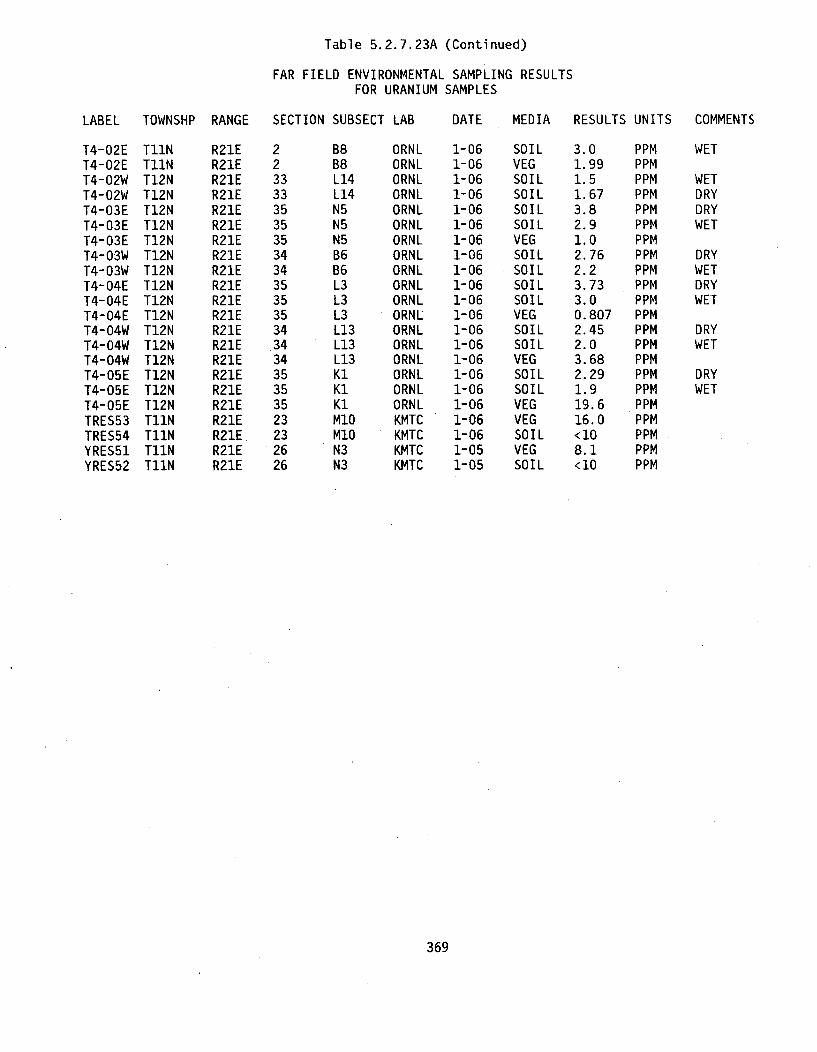
Table 5.2.7.23A (Continued)
FAR FIELD ENVIRONMENTAL SAMPLING RESULTSFOR URANIUM SAMPLES
LABEL TOWNSHP RANGE SECTION SUBSECT LAB DATE MEDIA RESULTS UNITS COMMENTS
T4-02E T11NT4-02E T11NT4-02W T12NT4-02W T12NT4-03E T12NT4-03E T12NT4-03E T12NT4-03W T12NT4-03W T12NT4-04E T12NT4-04E T12NT4-04E T12NT4-04W T12NT4-04W T12NT4-04W T12NT4-05E T12NT4-05E T12NT4-05E T12NTRES53 T11NTRES54 T11NYRES51 T11NYRES52 T11N
R21E 2R21E 2R21E 33R21E 33R21E 35R21E 35R21E 35R21E 34R21E 34R21E 35R21E 35R21E 35R21E 34R21E .34R21E 34R21E 35R21E 35R21E 35R21E 23R21E 23R21E 26R21E 26
B8B8L14L14N5N5N5B6B6L3L3L3L13L13L13K1K1K1MI0MI0N3N3
ORNL 1-06 SOIL 3.0 PPMORNL 1-06 VEG 1.99 PPMORNL 1-06 SOIL 1.5 PPMORNL 1-06 SOIL 1.67 PPMORNL 1-06 SOIL 3.8 PPMORNL 1-06 SOIL 2.9 PPMORNL 1-06 VEG 1.0 PPMORNL 1-06 SOIL 2.76 PPMORNL 1-06 SOIL 2.2 PPMORNL 1-06 SOIL 3.73 PPMORNL 1-06 SOIL 3.0 PPMORNL 1-06 VEG 0.807 PPMORNL 1-06 SOIL 2.45 PPMORNL 1-06 SOIL 2.0 PPMORNL 1-06 VEG 3.68 PPMORNL 1-06 SOIL 2.29 PPMORNL 1-06 SOIL 1.9 PPMORNL 1-06 VEG 19.6 PPMKMTC 1-06 VEG 16.0 PPMKMTC 1-06 SOIL <10 PPMKMTC 1-05 VEG 8.1 PPMKMTC 1-05 SOIL <10 PPM
WET
WETDRYDRYWET
DRYWETDRYWET
DRYWET
DRYWET
369
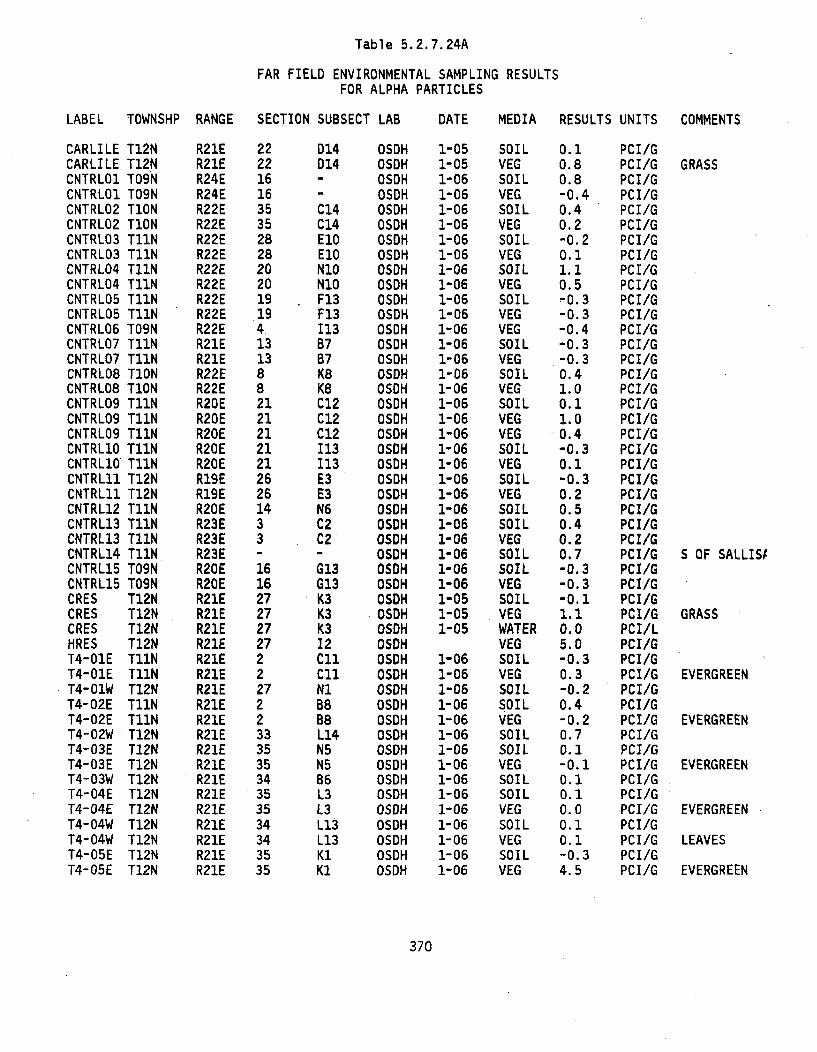
Table 5.2.7.24A
FAR FIELD ENVIRONMENTAL SAMPLING RESULTSFOR ALPHA PARTICLES
LABEL TOWNSHP
CARLILECARLILECNTRL01CNTRL01CNTRL02CNTRL02CNTRL03CNTRL03CNTRL04CNTRL04CNTRL05CNTRL05CNTRL06CNTRL07CNTRL07CNTRLO8CNTRL08CNTRL09CNTRL09CNTRL09CNTRL1OCNTRL1OCNTRL11CNTRL11CNTRL12CNTRL13CNTRL13CNTRL14CNTRL15CNTRL15CRESCRESCRESHREST4-O1ET4-O1ET4-O1WT4-02ET4-02ET4-02WT4-03ET4-03ET4-03WT4-04ET4-04ET4-04WT4-04WT4-05ET4-05E
T12NT12NTO9NTO9NTIONTIONT11NT11NT11NT11NT11NT11NTO9NT11NT11NTIONTIONT11NT11NT11NT11NT11NT12NT12NTliNT11NT11NT11NTO9NTO9NT12NT12NT12NT12NT11NT11NT12NT11NT11NT12NT12NT12NT12NT12NT12NT12NT12NT12NT12N
RANGE
R21ER21ER24ER24ER22ER22ER22ER22ER22ER22ER22ER22ER22ER21ER21ER22ER22ER20ER20ER20ER20ER20ER19ER19ER20ER23ER23ER23ER20ER20ER21ER21ER21ER21ER21ER21ER21ER21ER21ER21ER21ER21ER21ER21ER21ER21ER21ER21ER21E
SECTION SUBSECT LAB DATE MEDIA RESULTS UNITS COMMENTS
2222161635352828202019194131388212121212126261433
16162727272722272233353534353534343535
D14014
C14C14E1OEION1ONIOF13F13113B7B7K8K8C12C12C12113113E3E3N6C2C2
G13G13K3K3K312CliCliNIB8B8L14N5N5B6L3L3L13L13K1KI
OSDHOSDHOSDHOSDHOSDHOSDHOSDHOSDHOSDHOSDHOSDHOSDHOSDHOSDHOSDHOSDHOSDHOSDHOSDHOSDHOSDHOSDHOSDHOSDHOSOHOSDHOSDHOSDHOSDHOSDHOSDHOSDHOSDHOSDHOSDHOSDHOSDHOSDHOSDHOSDHOSDHOSDHOSDHOSDHOSDHOSDHOSDHOSDHOSDH
1-051-051-061-061-061-061-061-061-061-061-061-061-061-061-061-061-061-061-061-061-061-061-061-061-061-061-061-061-061-061-051-051-05
1-061-061-061-061-061-061-061-061-061-061-061-061-061-061-06
SOILVEGSOILVEGSOILVEGSOILVEGSOILVEGSOILVEGVEGSOILVEGSOILVEGSOILVEGVEGSOILVEGSOILVEGSOILSOILVEGSOILSOILVEGSOILVEGWATERVEGSOILVEGSOILSOILVEGSOILSOILVEGSOILSOILVEGSOILVEGSOILVEG
0.10.80.8-0.40.40.2-0.20.11.10.5-0.3-0.3-0.4-0.3-0.30.41.00.11.00.4-0.30.1-0.30.20.50.40.20.7-0.3-0.3-0.11.10.05.0-0.30.3-0.20.4-0.20.70.1-0.10.10.10.00.10.1-0.34.5
PCI/GPCI/GPCI/GPCI/GPCI/GPCI/GPCI/GPCI/GPCI/GPCI/GPCI/GPCI/GPCI/GPCI/GPCI/GPCI/GPCI/GPCI/GPCI/GPCI/GPCI/GPCI/GPCI/GPCI/GPCI/GPCI/GPCI/GPCI/GPCI/GPCI/GPCI/GPCI/GPCI/LPCI/GPCI/GPCI/GPCI/GPCI/GPCI/GPCI/GPCI/GPCI/GPCI/GPCI/GPCI/GPCI/GPCI/GPCI/GPCI/G
GRASS
S OF SALLISO
GRASS
EVERGREEN
EVERGREEN
EVERGREEN
EVERGREEN
LEAVES
EVERGREEN
370
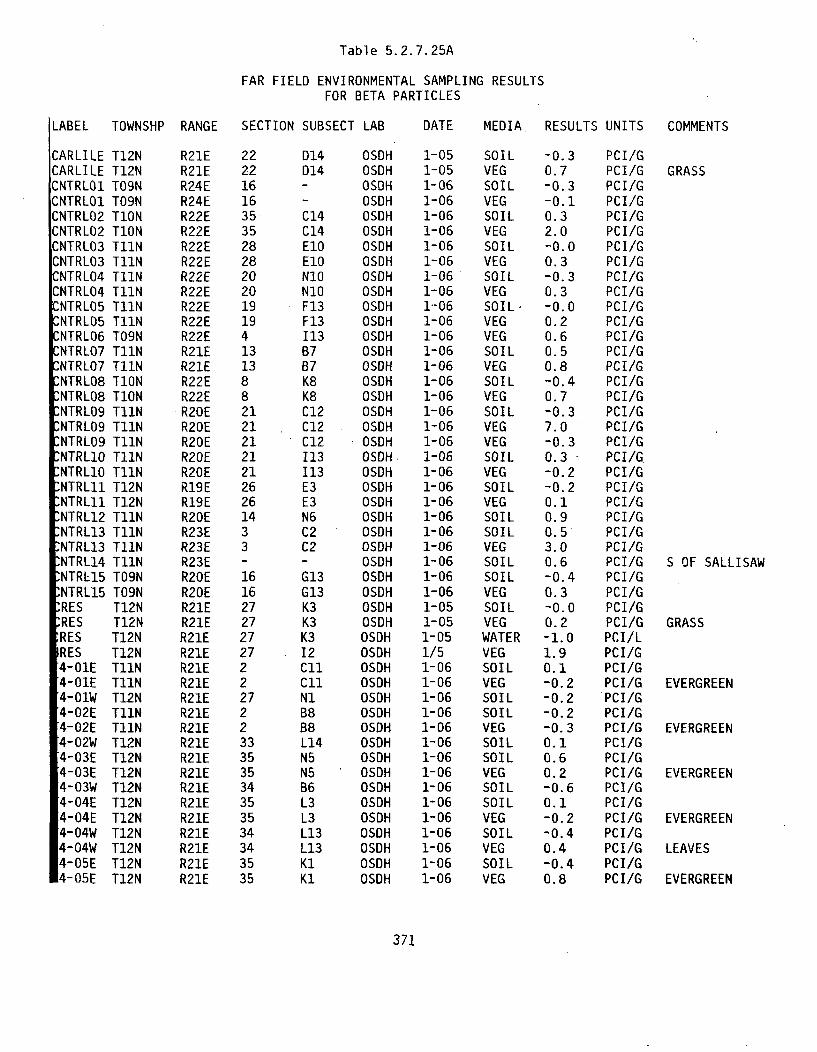
Table 5.2.7.25A
FAR FIELD ENVIRONMENTAL SAMPLING RESULTSFOR BETA PARTICLES
LABEL TOWN•
CARLILE T12NCARLILE T12NCNTRL01 TO9NCNTRL01 TO9NCNTRL02 TIONCNTRL02 TIONCNTRL03 T11NCNTRL03 T11N
NTRL04 T11NCNTRL04 T11N
NTRL05 T11NNTRL05 T11NNTRL06 TO9NNTRL07 T11NNTRL07 T11NNTRL08 TIONNTRL08 TIONNTRL09 T11NNTRL09 T11NNTRL09 T11NNTRLIO T11NNTRL1O T11NNTRL11 T12NNTRL11 T12NNTRL12 T11NNTRL13 T11NNTRL13 T11NNTRL14 T11NNTRL15 TO9NNTRL15 TO9NRES T12NRES T12NRES T12NRES T12N4-01E T11N4-01E T11N4-01W T12N4-02E T11N4-02E T11N4-02W T12N4-03E T12N4-03E T12N4-03W T12N4-04E T12N4-04E T12N4-04W T12N4-04W T12N4-05E T12N4-05E T12N
SHP RANGE SECTION SUBSECT LAB DATE MEDIA RESULTS UNITS COMMENTS
R21E 22R21E 22R24E 16R24E 16R22E 35R22E 35R22E 28R22E 28R22E 20R22E 20R22E 19R22E 19R22E 4R21E 13R21E 13R22E 8R22E 8R20E 21R20E 21R20E 21R20E 21R20E 21R19E 26R19E 26R20E 14R23E 3R23E 3R23E -
R20E 16R20E 16R21E 27R21E 27R21E 27R21E 27R21E 2R21E 2R21E 27R21E 2R21E 2R21E 33R21E 35R21E 35R21E 34R21E 35R21E 35R21E 34R21E 34R21E 35R21E 35
D14D14
C14C14E1OE1ON1ON10F13F13113B787K8K8C12C12C12113113E3E3N6C2C2
G13G13K3K3K312CliC1iN1B8B8L14N5N5B6L3L3L13L13KiK1
OSDH 1-05 SOIL -0.3 PCI/GOSDH 1-05 VEG 0.7 PCI/G GRASSOSDH 1-06 SOIL -0.3 PCI/GOSDH 1-06 VEG -0.1 PCI/GOSDH 1-06 SOIL 0.3 PCI/GOSDH 1-06 VEG 2.0 PCI/GOSDH 1-06 SOIL -0.0 PCI/GOSDH 1-06 VEG 0.3 PCI/GOSDH 1-06 SOIL -0.3 PCI/GOSDH 1-06 VEG 0.3 PCI/GOSDH 1-06 SOIL- -0.0 PCI/GOSDH 1-06 VEG 0.2 PCI/GOSDH 1-06 VEG 0.6 PCI/GOSDH 1-06 SOIL 0.5 PCI/GOSDH 1-06 VEG 0.8 PCl/GOSDH 1-06 SOIL -0.4 PCI/GOSDH 1-06 VEG 0.7 PCI/GOSDH 1-06 SOIL -0.3 PCI/GOSDH 1-06 VEG 7.0 PCI/GOSDH 1-06 VEG -0.3 PCI/GOSDH 1-06 SOIL 0.3 PCI/GOSDH 1-06 VEG -0.2 PCI/GOSDH 1-06 SOIL -0.2 PCI/GOSDH 1-06 VEG 0.1 PCI/GOSDH 1-06 SOIL 0.9 PCI/GOSDH 1-06 SOIL 0.5 PCI/GOSDH 1-06 VEG 3.0 PCI/GOSDH 1-06 SOIL 0.6 PCI/G S OF SALLISAWOSDH 1-06 SOIL -0.4 PCI/GOSDH 1-06 VEG 0.3 PCI/GOSDH 1-05 SOIL -0.0 PCI/GOSDH 1-05 VEG 0.2 PCI/G GRASSOSDH 1-05 WATER -1.0 PCI/LOSDH 1/5 VEG 1.9 PCI/GOSDH 1-06 SOIL 0.1 PCI/GOSDH 1-06 VEG -0.2 PCI/G EVERGREENOSDH 1-06 SOIL -0.2 PCI/GOSDH 1-06 SOIL -0.2 PCI/GOSDH 1-06 VEG -0.3 PCI/G EVERGREENOSDH 1-06 SOIL 0.1 PCI/GOSDH 1-06 SOIL 0.6 PCI/GOSDH 1-06 VEG 0.2 PCI/G EVERGREENOSDH 1-06 SOIL -0.6 PCI/GOSDH 1-06 SOIL 0.1 PCI/GOSDH 1-06 VEG -0.2 PCI/G EVERGREENOSDH 1-06 SOIL -0.4 PCI/GOSDH 1-06 VEG 0.4 PCI/G LEAVESOSDH 1-06 SOIL -0.4 PCI/GOSDH 1-06 VEG 0.8 PCI/G EVERGREEN
371

APPENDIX 5.3.1
RAW SURFACE WATER DATA
373


APPENDIX 5.3.1
Surface waters were sampled byshown in Appendix 5.2.1 and inare listed in the tables which
both SFC and OSDH. Sampling locations areSection 5.3.1. Sampling locations and resultsfollow.
375
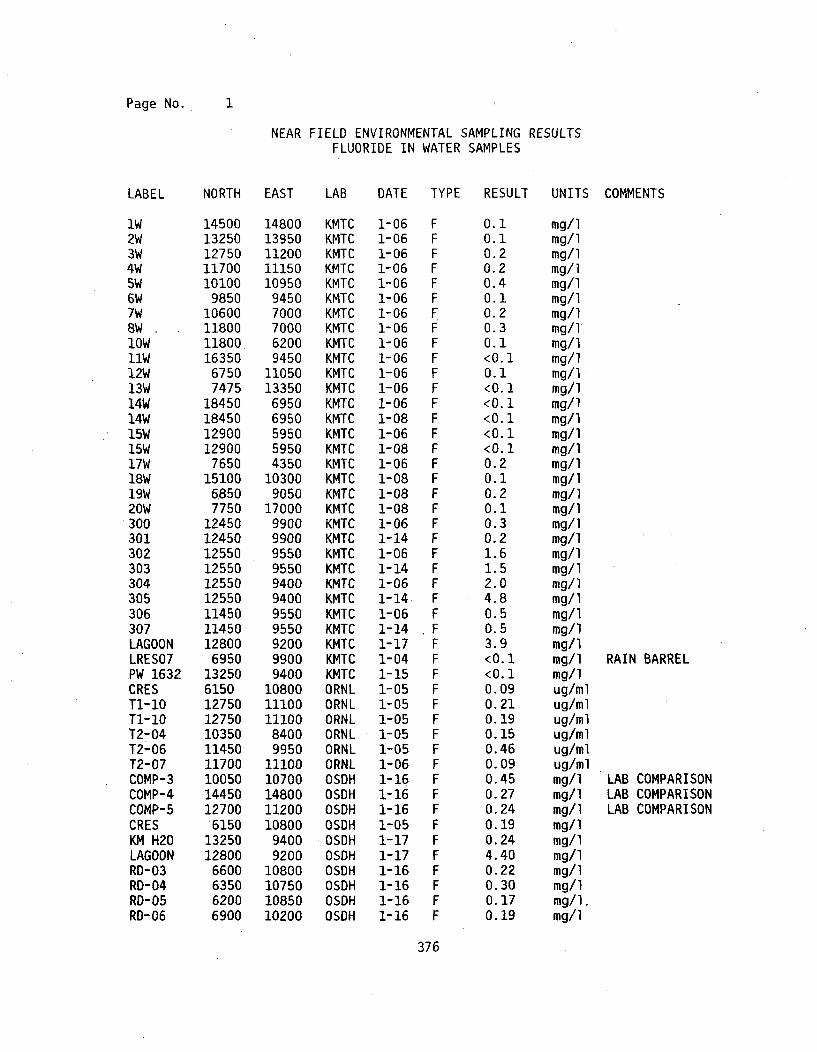
Page No. 1
NEAR FIELD ENVIRONMENTAL SAMPLING RESULTSFLUORIDE IN WATER SAMPLES
NORTH EAST LAB DATE TYPE RESULT UNITS COMMENTSLABEL
1W2W3W4W5W6W7W8WlOW11W12W13W14W14W15W15W17W18W19W20W300301302303304305306307LAGOONLRES07PW 1632CRESTl-10T1-10T2-04T2-06T2-07COMP-3COMP-4COMP-5CRESKM H20LAGOONRD-03RD-04RD-05RD-06
1450013250127501170010100
98501060011800118001635067507475
184501845012900129007650
1510068507750
1245012450125501255012550125501145011450128006950
1325061501275012750103501145011700100501445012700
6150
1325012800
6600635062006900
1480013950112001115010950
94507000700062009450
1105013350
69506950595059504350
103009050
1700099009900955095509400940095509550920099009400
108001110011100
84009950
1110010700148001120010800
94009200
10800107501085010200
KMTCKMTCKMTCKMTCKMTCKMTCKMTCKMTCKMTCKMTCKMTCKMTCKMTCKMTCKMTCKMTCKMTCKMTCKMTCKMTCKMTCKMTCKMTCKMTCKMTCKMTCKMTCKMTCKMTCKMTCKMTCORNLORNLORNLORNLORNLORNLOSDHOSDHOSDHOSDHOSDHOSDHOSDHOSDHOSDHOSDH
1-061-061-061-061-061-061-061-061-061-061-061-061-061-081-061-081-061-081-081-081-061-141-061-141-061-141-061-141-171-041-151-051-051-051-051-051-061-161-161-161-051-171-171-161-161-161-16
0.10.10.20.20.40.10.20.30.1<0.10.1<0. 1<0. 1<0.1<0.1<0.10.20.10.20.10.30.21.61.52.04.80.50.53.9<0.1<0.10.090.210.190.150.460.090.450.270.240.190.244.400.220.300.170.19
mg/lmg/Img/lmg/lmg/lmg/lmg/lmg/img/lmg/lmg/lmg/lmg/lmg/lmg/lmg/lmg/lmg/lmg/lmg/lmg/Img/lmg/lmg/lmg/lmg/lmg/lmg/lmg/lmg/lmg/lug/mlug/mlug/mlug/mlug/mlug/mlmg/lmg/lmg/img/lmg/lmg/lmg/lmg/lmg/lmg/l
RAIN BARREL
LAB COMPARISONLAB COMPARISONLAB COMPARISON
376
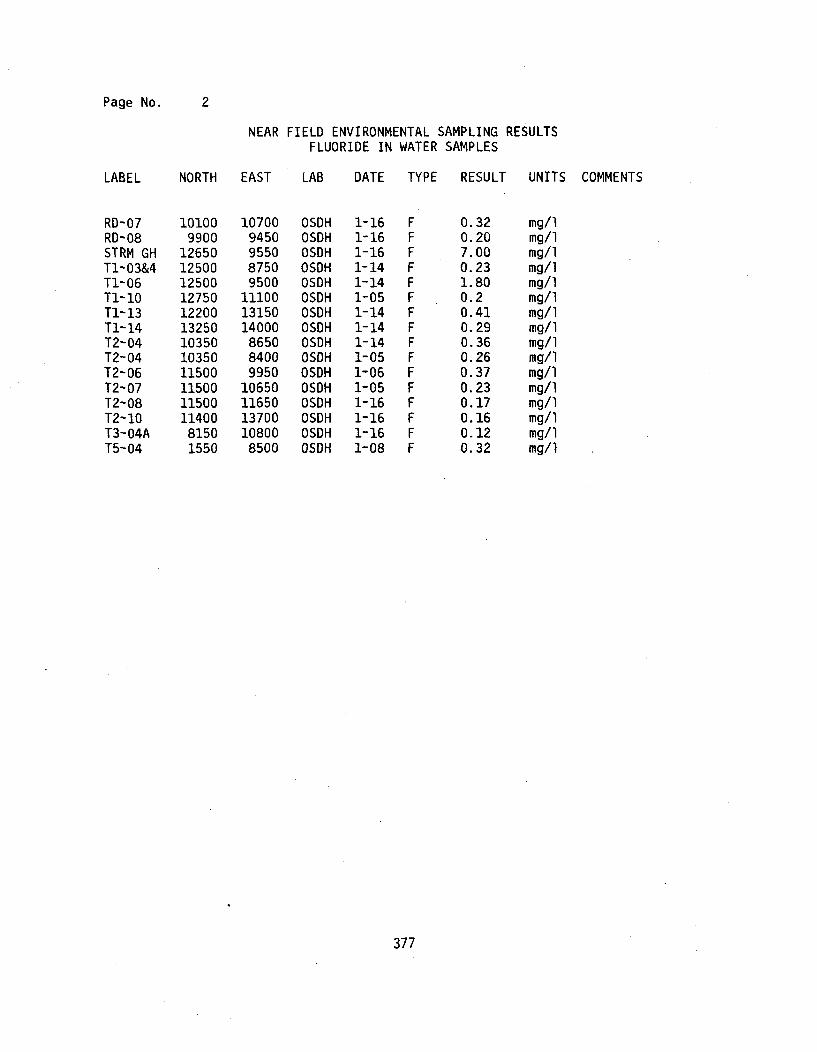
Page No. 2
NEAR FIELD ENVIRONMENTAL SAMPLING RESULTSFLUORIDE IN WATER SAMPLES
LABEL NORTH EAST LAB DATE TYPE RESULT UNITS COMMENTS
RD-07 10100 10700 OSDH 1-16 F 0.32 mg/lRD-08 9900 9450 OSDH 1-16 F 0.20 mg/lSTRM GH 12650 9550 OSDH 1-16 F 7.00 mg/lT1-03&4 12500 8750 OSDH 1-14 F 0.23 mg/lT1-06 12500 9500 OSDH 1-14 F 1.80 mg/lTl-10 12750 11100 OSDH 1-05 F 0.2 mg/lT1-13 12200 13150 OSDH 1-14 F 0.41 mg/lTl-14 13250 14000 OSDH 1-14 F 0.29 mg/lT2-04 10350 8650 OSDH 1-14 F 0.36 mg/lT2-04 10350 8400 OSDH 1-05 F 0.26 mg/lT2-06 11500 9950 OSDH 1-06 F 0.37 mg/lT2-07 11500 10650 OSDH 1-05 F 0.23 mg/lT2-08 11500 11650 OSDH 1-16 F 0.17 mg/lT2-10 11400 13700 OSDH 1-16 F 0.16 mg/lT3-04A 8150 10800 OSDH 1-16 F 0.12 mg/lT5-04 1550 8500 OSDH 1-08 F 0.32 mg/l
377

Page No. 1
NEAR FIELD ENVIRONMENTAL SAMPLING RESULTSURANIUM IN WATER SAMPLES
NORTH EAST LAB DATE TYPE RESULT UNITS COMMENTSLABEL
1W2W3W4W5W6W7W8Wlow11W12W13W14W.14W15W15W17W18W19W20W300301302303304305306306307COMB STCOMB STCOMB STCOMB STCOMB STCOMB STCOMB STLAGOONLRES07PW 1632CREST1-10Tl-10T2-04T2-06T2-07
1450013250127501170010100
985010600118001180016350
67507475
184501845012900129007650
1510068507750
1245012450125501255012550125501145011450114501260012600126001260012600126001260012800
695013250
61501275012750103501145011700
1480013950112001115010950
94507000700062009450
1105013350
69506950595059504350
103009050
170009900990095509550940094009550955095508650865086508650865086508650920099009400
1080011100111008400995011100
KMTCKMTCKMTCKMTCKMTCKMTCKMTCKMTCKMTCKMTCKMTCKMTCKMTCKMTCKMTCKMTCKMTCKMTCKMTCKMTCKMTCKMTCKMTCKMTCKMTCKMTCKMTCKMTCKMTCKMTCKMTCKMTCKMTCKMTCKMTCKMTCKMTCKMTCKMTCORNLORNLORNLORNLORNLORNL
1-061-061-061-061-061-061-061-061-061-061-061-061-061-081-061-081-061-081-081-081-061-141-061-141-061-141-141-061-141-071-061-051-041-031-021-011-171-041-151-051-051-051-051-051-06
0.110.230.19<0.0020.011<0. 0020.320.6<0.002< 0. 0020.003<0. 002<0.0020.0030.0180.0130.0060.0020.004<0. 0020.0420.0170.941.11.22.60.250.250.210.290.950.360.360.610.570.43I<0. 002<0.0020.050.150.0260.0030.270.03
mg/img/img/img/img/img/img/img/img/img/img/img/img/img/img/img/img/Img/img/img/img/img/img/img/img/img/img/img/img/img/img/img/Img/img/Img/img/img/img/Img/iug/mlug/mlug/mlug/mlug/mlug/ml
FRONT PORCH
378
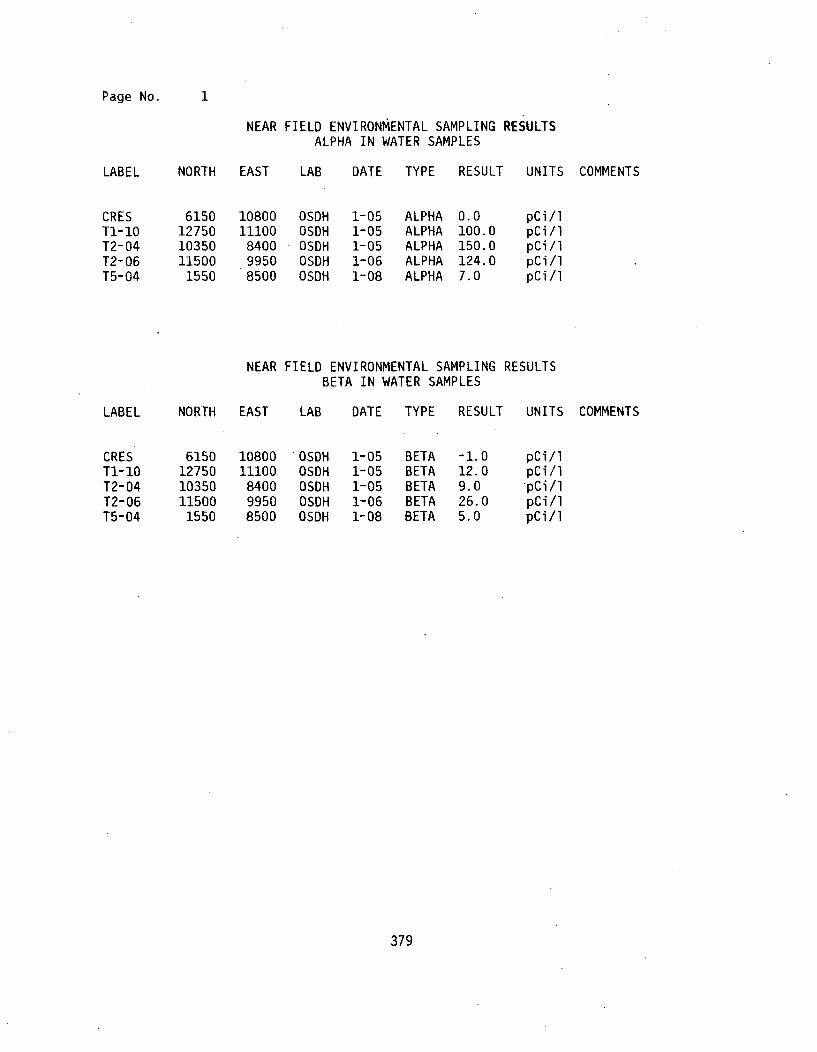
Page No. 1
NEAR FIELD ENVIRONMENTAL SAMPLING RESULTSALPHA IN WATER SAMPLES
LABEL NORTH EAST LAB DATE TYPE RESULT UNITS COMMENTS
CRESTl-10T2-04T2-06T5-04
6150127501035011500
1550
1080011100
840099508500
OSDHOSDHOSDHOSDHOSDH
1-051-051-051-061-08
ALPHAALPHAALPHAALPHAALPHA
0.0100.0150.0124.07.0
pCi/lpCi/lpCi/lpCi/lpCi/l
NEAR FIELD ENVIRONMENTAL SAMPLING RESULTSBETA IN WATER SAMPLES
LABEL
CREST1-10T2-04T2-06T5-04
NORTH EAST LAB DATE TYPE RESULT UNITS COMMENTS
61501275010350115001550
1080011100
840099508500
OSDHOSDHOSDHOSDHOSDH
1-051-051-051-061-08
BETABETABETABETABETA
-1.012..09.026.05.0
pCi/lpCi/lpCi/lpCi/lpCi/l
379
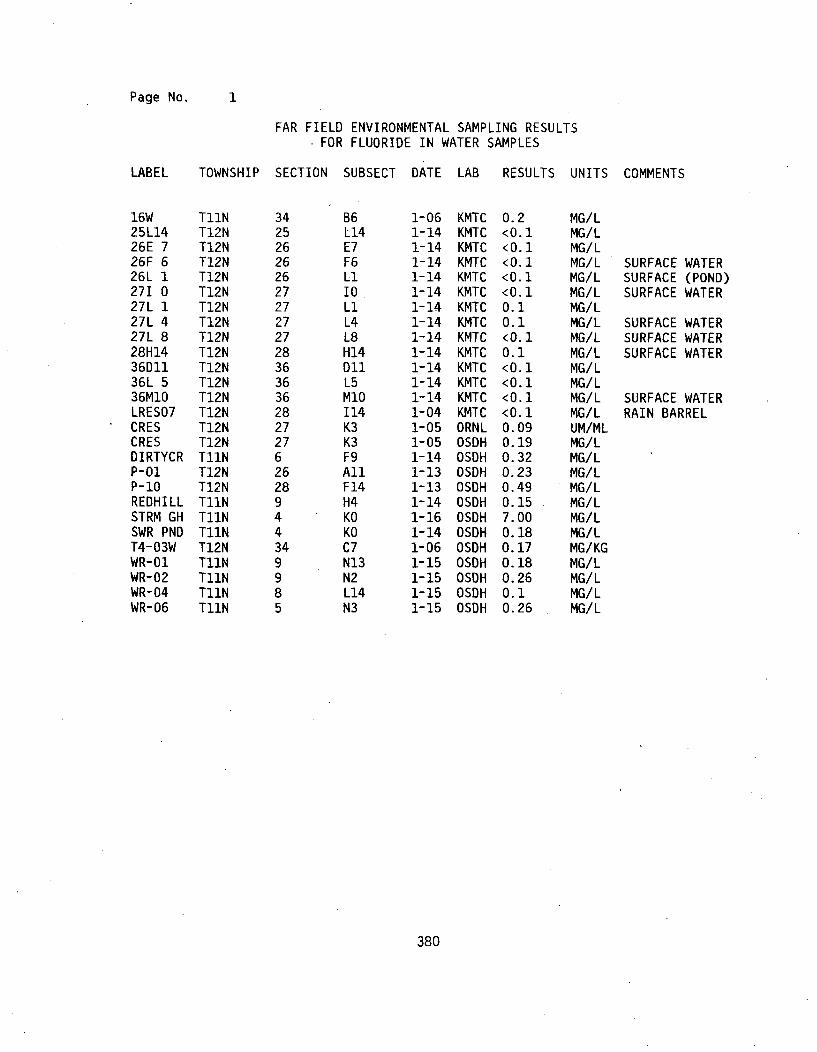
Page No.
FAR FIELD ENVIRONMENTAL SAMPLING RESULTSFOR FLUORIDE IN WATER SAMPLES
LABEL TOWNSHIP SECTION SUBSECT DATE LAB RESULTS UNITS COMMENTS
16W25L1426E 726F 626L 1271 027L 127L 427L 828H1436D1136L 536M10LRES07CRESCRESDIRTYCRP-01P-10REDHILLSTRM GHSWR PNDT4-03WWR-01WR-02WR-04WR-06
T11NT12NT12NT12NT12NT12NT12NT12NT12NT12NT12NT12NT12NT12NT12NT12NT11NT12NT12NT11NT11NT11NT12NT11NT11NT11NT11N
3425262626272727272836363628272762628944349985
B6L14E7F6LI10LiL4L8H14DI1L5MIO114K3K3F9AllF14H4KOKOC7N13N2L14N3
1-061-141-141-141-141-141-141-141-141-141-141-141-141-041-051-051-141-131-131-141-161-141-061-151-151-151-15
KMTCKMTCKMTCKMTCKMTCKMTCKMTCKMTCKMTCKMTCKMTCKMTCKMTCKMTCORNLOSDHOSDHOSDHOSDHOSDHOSDHOSDHOSDHOSDHOSDHOSDHOSDH
0.2<0.1<0.1<0.1<0. 1<0. 10.10.1<0. 10.1<0O. 1<0.1<0.1<0.10.090.190.320.230.490.157.000.180.170.180.260.10.26
MG/LMG/LMG/LMG/LMG/LMG/LMG/LMG/LMG/LMG/LMG/LMG/LMG/LMG/LUM/MLMG/LMG/LMG/LMG/LMG/LMG/LMG/LMG/KGMG/LMG/LMG/LMG/L
SURFACESURFACESURFACE
SURFACESURFACESURFACE
WATER(POND)WATER
WATERWATERWATER
SURFACE WATERRAIN BARREL
380
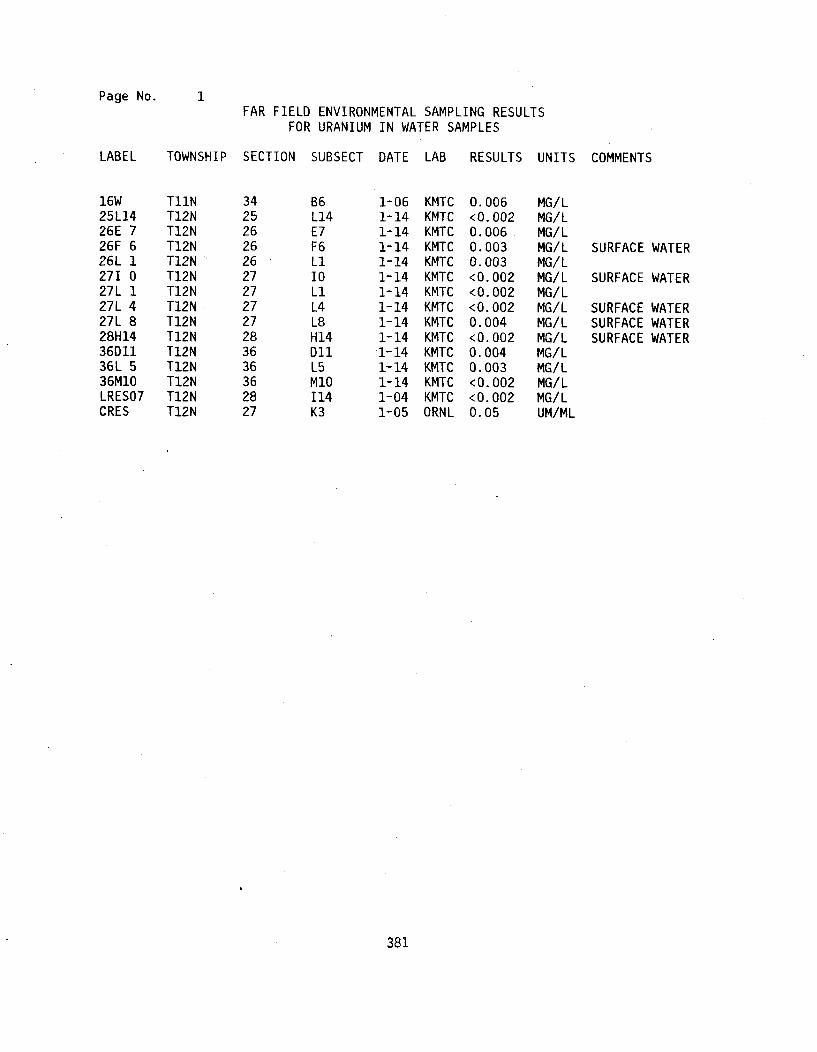
Page No. 1FAR FIELD ENVIRONMENTAL SAMPLING RESULTS
FOR URANIUM IN WATER SAMPLES
LABEL TOWNSHIP SECTION SUBSECT DATE LAB RESULTS UNITS COMMENTS
16W25L1426E 726F 626L I271 027L 127L 427L 828H143601136L 536M10LRES07CRES
T11NT12NT12NT12NT12NT12NT12NT12NT12NT12NT12NT12NT12NT12NT12N
342526262627272727283636362827
B6L14E7F6Li10LiL4L8H14DllL5M1O114K3
1-061-141-141-141-141-141-141-141-141-141-14
1-141-141-041-05
KMTCKMTCKMTCKMTCKMTCKMTCKMTCKMTCKMTCKMTCKMTCKMTCKMTCKMTCORNL
0.006<0.0020.0060.0030.003<0.002<0.002<0.0020.004<0. 0020.0040.003<0.002<0.0020.05
MG/LMG/LMG/ LMG/LMG/LMG/LMG/ LMG/LMG/LMG/LMG/LMG/LMG/ LMG/LUM/ML
SURFACE WATER
SURFACE WATER
SURFACESURFACESURFACE
WATERWATERWATER
381
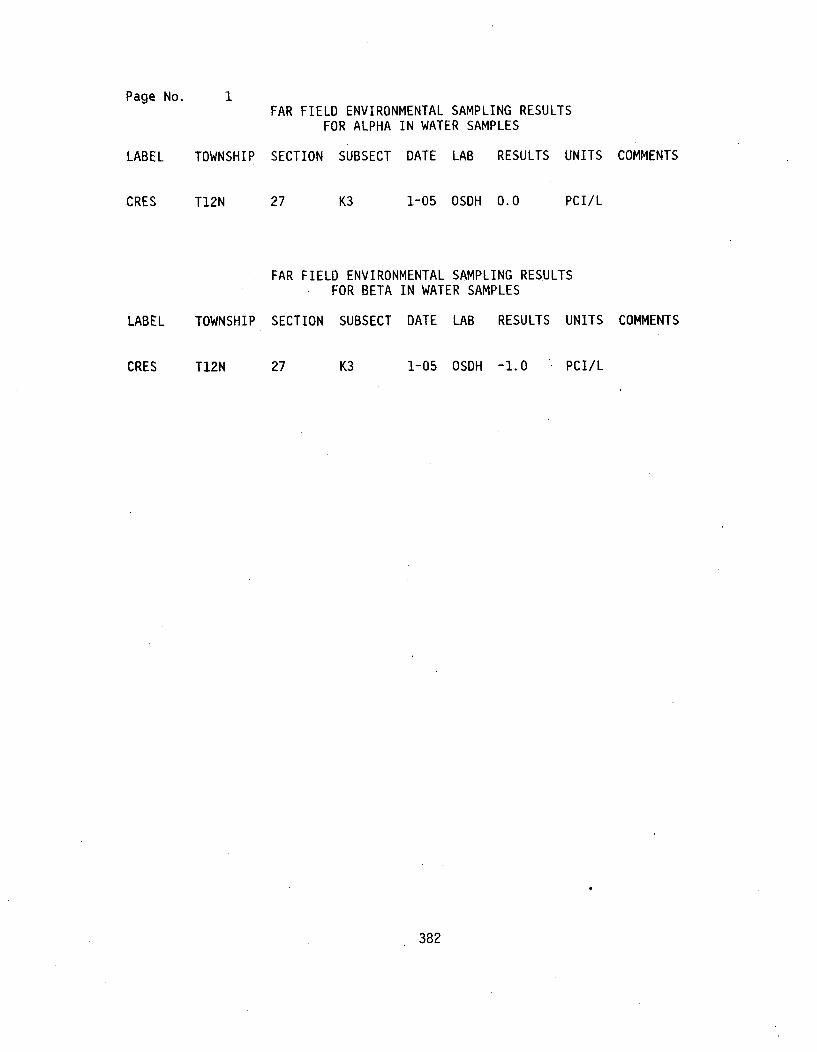
Page No. 1FAR FIELD ENVIRONMENTAL SAMPLING RESULTS
FOR ALPHA IN WATER SAMPLES
LABEL TOWNSHIP SECTION SUBSECT DATE LAB RESULTS UNITS COMMENTS
CRES T12N 27 K3 1-05 OSDH 0.0 PCI/L
FAR FIELD ENVIRONMENTAL SAMPLING RESULTSFOR BETA IN WATER SAMPLES
LABEL TOWNSHIP SECTION SUBSECT DATE LAB RESULTS UNITS COMMENTS
CRES T12N 27 K3 1-05 OSDH -1.0 PCI/L
382
APPENDIX 5.4.1
AN AERIAL RADIOLOGICAL SURVEY OF THE KERR-MCGEEFACILITY AND SURROUNDING AREA
383

ENERGY MEASUREMENTS GROUPTHE
REMOTESENSING
IADORATORYOF THE UNITED STATES
DEPARTMENT OF ENERGY
EG&G SURVEY REPORTNRC-8105JULY 1981
AN AERIAL RADIOLOGICAL SURVEY OF THE
KERR - McGEE FACILITYAND SURROUNDING AREA
GORE, OKLAHOMA DATES OF SURVEY: 25-30 JULY 1980
385

DISCLAIMER
This report was prepared as an account of work sponsored by the United States Government. Neither theUnited States nor the United States Department of Energy, nor any of their employees, makes any warranty,express or implied, or assumes any legal liability or responsibility for the accuracy, completeness, orusefulness of any information, apparatus, product, or process disclosed, or represents that its use wouldnot infringe privately owned rights. Reference herein to any specific commercial product, process, orservice by trade name, mark, manufacturer, or otherwise, does not necessarily constitute or imply itsendorsement, recommendation, or favoring by the United States Government or any agency thereof. Theviews and opinions of authors expressed herein do not necessarily state or reflect those of the United StatesGovernment, or any agency thereof.
Printed in the United States of America.
Available from:
National Technical Information ServiceU.S. Department of Commerce5285 Port Royal RoadSpringfield, Virginia 22161
Price:
Printed Copy $5.00Microfiche $3.50
386

EEG&RENERGY MEASUREMIENTS GROUP
EG&G Survey ReportNRC-8105
JULY 1981
AN AERIAL RADIOLOGICAL SURVEY OF THE
KERR - McGEE FACILITYAND SURROUNDING AREA
GORE, OKLAHOMA
DATES OF SURVEY: 25-30 JULY 1980
E. L. FeimsterProject Scientist
REVIEWED BY
W. J. Tipton, HeadRadiation Sciences Section
This Document is UNCLASSIFIED
G. P. StobieClassification Officer
This work was performed by EG&G for the United States Nuclear Regulatory Commission through an EAOtransfer of funds to Contract Number DE-AC08-76NVOI 183 with the United States Department of Energy.
387
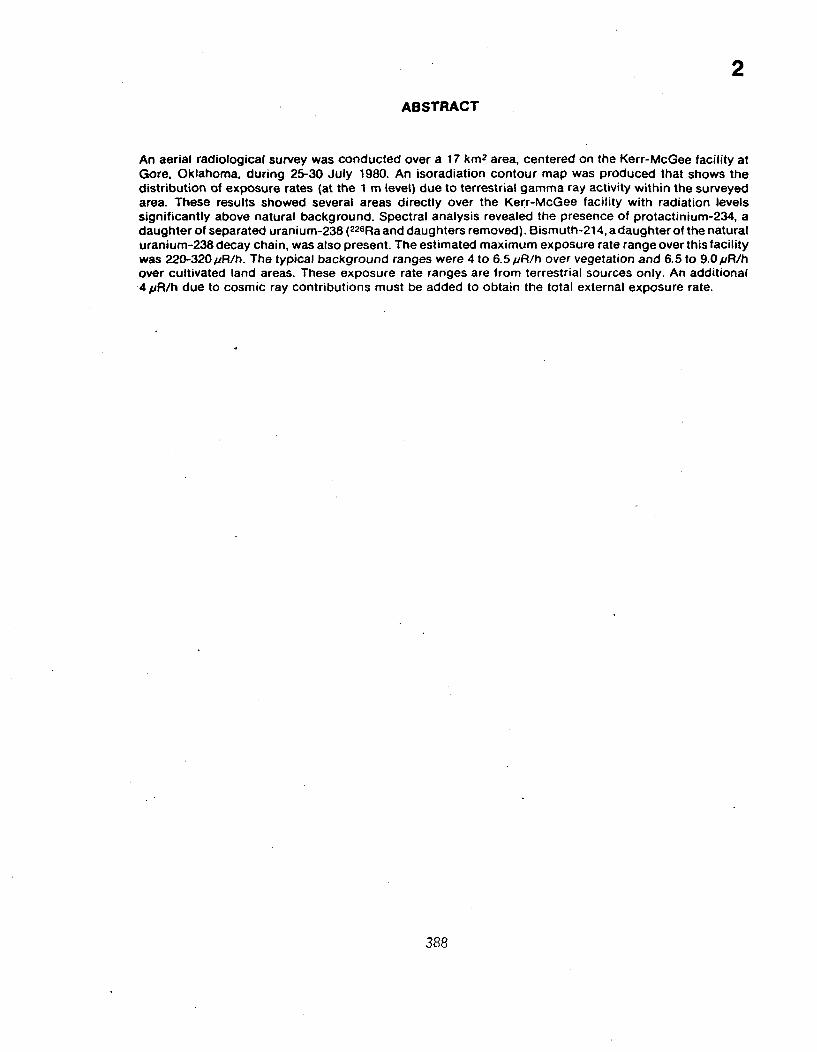
2
ABSTRACT
An aerial radiological survey was conducted over a 17 km 2 area, centered on the Kerr-McGee facility atGore, Oklahoma. during 25-30 July 1980. An isoradiation contour map was produced that shows thedistribution of exposure rates (at the 1 m level) due to terrestrial gamma ray activity within the surveyedarea. These results showed several areas directly over the Kerr-McGee facility with radiation levelssignificantly above natural background. Spectral analysis revealed the presence of protactinium-234, adaughter of separated uranium-238 ( 226Ra and daughters removed). Bismuth-214, a daughter of the naturaluranium-238 decay chain, was also present. The estimated maximum exposure rate range over this facilitywas 220-320 pR/h. The typical background ranges were 4 to 6.5 /JR/h over vegetation and 6.5 to 9.0 IR/hover cultivated land areas. These exposure rate ranges are from terrestrial sources only. An additional4 pR/h due to cosmic ray contributions must be added to obtain the total external exposure rate.
388
3
CONTENTS
2
4
4
4
5
Abstract
Sections
1.0 Introduction
2.0 Site Description
3.0 Survey Procedures and Equipment
4.0 Discussion and Results
Figures
1 Exposure Rate Isoradiation Contours Overlaid on an Aerial Photograph
2 Gamma Pulse Height Spectrum Typical of Natural Background
3 Gamma Pulse Height Spectrum Indicating the Presence of Anomalous Concentrationsof Separated U-238 and Radium Daughters from the Normal Uranium-238 Decay Chain
6
7
7
8
9
10
Appendix-Survey Parameters
References
Distribution
389
4
1.0 INTRODUCTION
The United States Department of Energy (DOE)maintains an aerial surveillance operation calledthe Aerial Measuring Systems (AMS). AMS isoperated for the DOE by EG&G, Inc. Thiscontinuing nationwide program, started in 1958,involves surveys to monitor and documentbackground radiation levels throughout theUnited States. At the request of the DOE or otherfederal and state agencies (such as the UnitedStates Nuclear Regulatory Commission), theAMS is deployed for various aerial surveyoperations. This report is the result of a surveyrequested by the NRC for the Kerr-McGee facilitylocated at Gore, Oklahoma.
Aerial radiological detection systems average theradiation levels due to gamma-emittingradionuclides existing over an area of severalacres. The systems are capable of detectinganomalous gamma count rates and determiningthe specific radionuclides causing the anomalies;however, because of averaging, they tend tounderestimate the magnitude of localizedsources as compared with ground-basedreadings. As such, the indicated radiation levelsin the vicinity of anomalies are not definitive.Ground surveys are required for accuratedefinition of the extent and intensity of suchanomalies.
The results of the survey are reported as radiationexposure rates in microroentgens per hour(pR/h) at 1 meter above the ground surface.Approximate ahKial radiation dose levelsexpressed as millirem per year (mrem/y) areobtained by multiplying uR/h by 8.76. Thisconversion number applies only to the externalradiation dose component.
Natural background radiation originates fromradioactive elements present in the earth andcosmic rays entering the earth's atmosphere fromspace. The terrestrial gamma rays originateprimarily from the uranium decay chain, thethorium decay chain, and radioactive potassium.Local concentrations of these nuclides produceradiation levels at the surface of the earth rangingfrom 1 to 15 #R/h (9 to 130 mrem/y). Some areaswith high uranium and thorium concentrations insurface minerals exhibit even higher radiationlevels, especially in the western states. Forexample, in the Colorado Plateau area theaverage radition level is above 200 mrem/y. Atsome locations in Brazil and India, the natural
radiation level is above 1000 mrem/y. Onemember of each of the uranium and thoriumdecay chains is a noble gas which can bothdiffuse through soil and be borne by air to otherlocations. Thus, the level of this airborneradiation depends on the meteorologicalconditions, the mineral content of the soil, the soilpermeability, and other conditions existing ateach location at any particular time. The airborneradiation contributes from 1 to 10% of the naturalbackground radiation levels.
Cosmic rays, the space component, interact in acomplicated manner with the elements of theearth's atmosphere and the soil. Theseinteractions produce an additional natural sourceof gamma radiation. Radiation levels due tocosmic rays vary with altitude and geomagneticlatitude: they range from 3.7 to 23 /R/h (up to 200mrem/y).'
2.0 SITE DESCRIPTION
The Kerr-McGee facility is located approximately4.5 km southeast of the towns of Webber Falls andGore, Oklahoma; its boundaries coverapproximately 2000 acres. Most of the land area iscovered with vegetation or cultivated foragricultural use. The site is bordered on the westby the Illinois River (Figure 1).
The, primary operation at _tbis facility is theconversion of the uranium compound U308(referred to as "yellow cake") to UF 6, uraniumhexaflouride. The raw material, U308, is stored onsite; however, the refined product, UF 6, is shippedimmediately to its various users.
3.0 SURVEY PROCEDURESAND EQUIPMENT
An aerial photograph was used to define the areato be surveyed. Parallel lines spaced at 76 mintervals were flown at 76 m altitude.
The survey vehicle, a Hughes H-500 helicopter,carried a pilot, an equipment operator and alightweight version of a specialized datarecording system. Two detector pods weremounted on the sides of the helicopter; each podcontained ten sodium iodide, Nal (TI), detectors.The crystal in each detector was 12.7 cm indiameter and 5.1 cm in height. Gamma ray signals
390
5
from the twenty detectors were summed androuted through an analog-to-digital converterand pulse height analyzer. Gamma ray countingrates and energy spectral data were accumulatedin 1-second intervals and recorded on magnetictape.
The helicopter position was established with twosystems: a Microwave Ranging System (MRS)and a radio altimeter. The MRS master station,mounted in the helicopter, interrogated tworemote transceivers mounted at stationarypositions overlooking the survey area. Bymeasuring the round trip propagation timebetween the master and remote stations, themaster computed the distance to each. Thesedistances were also recorded on magnetic tapeeach second. In subsequent computerprocessing, they were converted to positioncoordinates.
The radio altimeter determined the aircraftaltitude by connecting the time of a round trippulsed signal to distance between the aircraft andthe ground. These data were also recorded onmagnetic tape so that any variations in gammasignal strength caused by altitude fluctuationcould be compensated accurately.
The detectors and electronic systems thataccumulate and record the data are described Indetail in previous reports. 2,3
Data processing was done primarily with acomputer based analysis laboratory mounted in amobile van. An extensive collection of softwareroutines was available for data processing. Thefirst data processing that was accomplishedproduced terrestrial exposure rate isoradiationcontours. These contours were constructed fromgross count rate numbers, which refer to integralcount rates in that portion of the gamma rayenergy spectrum between 0.05 and 3.0 MeV.These count rates were converted to exposurerates at 1 m above the ground using a factor of 940counts per second per pR/h, a number obtainedfrom calibration data over a test range. The
exposure rate isoradiation contours shown inFigure 1 are from terrestrial sources only. A totalexposure rate can be obtained by adding anaverage cosmic ray value of 4 jR/h.
4.0 DISCUSSION AND RESULTS
Results of the aerial survey are shown in Figure 1in the form of exposure rate contourssuperimposed on a photograph of the surveyarea.
Several areas of localized 'activity significantlyhigher than background activity wereencountered directly over the Kerr-McGeefacility. The rapidly changing radiation levelsover the site preclude accurate extrapolation ofthe aerial data to ground level exposure rates inthe near vicinity of the site. The maximumestimated exposure rate (220-320 JR/h) over thelocalized areas may be an underestimate of theactual exposure rate as measured on the ground.In areas where heavy vegetation, such as trees,covered the terrain, the background exposurerate was In the range of 4-6.5 jR/h. In bare groundareas, cultivated fields, and areas with minimumvegetation the background was 6.5-9.0pR/h. Onesmall area of cultivated land on the westernboundary of the survey showed an exposure ratein the range of 9-13/pR/h. A gamma ray spectrumtypical of the area is shown in Figure 2.
Spectral analysis of the anomalous areasindicated the presence of large quantities ofnatural uranium and seperated uranium (226Raand daughters removed). Spectra accumulatedover all the elevated activity areas showedphotopeaks of protactinium-234 and bismuth-214 (Figure 3): these are daughter productsassociated with seperated uranium-238 andnormal uranium-238, respectively.
The exposure rates quoted here and shown inFigure 1 are from terrestrial sources only. Cosmicray radiation contributes an additional exposurerate of approximately 4pR/h to the total exposurerate.
391

392

7t.0
-jLiJzz
Ld
I-z0
-x 4 -Xj 03OX0
2142148iK y2148,2"Ac
2148124B+
+.0 +.S 1.0 1.5 2.0 2.S 3.C
ENERGY (MEV)
Figure 2. GAMMA PULSE HEIGHT SPECTRUM TYPICAL OF NATURAL BACKGROUND
1.0
Lino2
z
+.2
+.0 +.5 1.0 1.5 2.0
ENERGY (MEV)2,5 3.0
FIgure 3. GAMMA PULSE HEIGHT SPECTRUM INDICATING THE PRESENCE OF ANOMALOUS CONCENTRATIONS OFSEPARA TED U-238 AND RADIUM DAUGHTERS FROM THE NORMAL URANIUM-238 DECAY CHAIN
393

8APPENDIX: SURVEY PARAMETERS
Location: Gore, Oklahoma and surrounding area, centered on the Kerr-McGee facility
Survey Coverage: 17 km 2
Survey Date: 25-30 July 1980
Project Scientist: E. L. Felmster
Survey Altitude: 76 m (250 feet)
Line Spacing: 76 m (250 feet)
Detector Array: 20 Nal (TI)
Acquisition System: REDAR III
Aircraft: Hughes H-500 Helicopter
Data Processing:
A. Gross Counts
Window: 0.05 - 3.0 MeV
Conversion Factor: 940 cps//uR/h
Cosmic ray contribution: 4 /JR/h
394

9
REFERENCES
1. Klement. A.W.; Miller, C.R.; Min, R.P.; Shleren, B. August 1972. Estimate of Ionizing RadiationDoses in the United States 1960-2000. R.S. EPA Report ORP/CD72-1. Washington D.C.:Environmental Protection Agency.
2. Boyns, P.K. 1976. The Aerial Radiological Measuring System (ARMS): Systems, Procedures andSensitivity. Report No. EGG-1183-1691. Las Vegas, NV: EG&G.
3. Jobst. J.E. 1979. "The Aerial Measuring Systems Program." Nuclear Safety 20:136-47.
395
10
.DISTRIBUTION
NRC EG&G
L. K. Cohen (15)
DOE/OES
L. J. Deal (1)
Z. G. Burson, LVAO (1)J. F. Doyle,.LVAO (1)E. L. Feimster, WAMD (1)H. A. Lamonds, SBO (1)R. E. Lounsbury, WAMD (4)L. G. Sasso. LVAO (1)T. P. Stuart. LVAO (1)W.J. Tipton, LVAO (1)
LIBRARIES
DOE/NV
J. K. Magruder (1)
AMO (8)Las Vegas (1)Santa Barbara (1)
KERR-MCGEE FACILITYNRC-8105
DATES OF SURVEY: 25-30 JULY 1960DATE OF REPORT: JULY 1981
396
APPENDIX 5.5.1
RESULTS OF HPGE IN SITU MEASUREMENTS
397

APPENDIX 5.5.1
EG&G, Inc. performed a survey of locations using an intrinsic germaniumdetector, as described in Section 5.5.1. Results are shown in Figure 5.5.1.Figure 5.5.1A in this Appendix shows the measurement locations with theirlabels. Table 5.5.1A is a listing of the measurement results; it lists themas results for Pa-234m samples because Pa-234m peaks in the gamma spectrum wereused for the measurement.
399
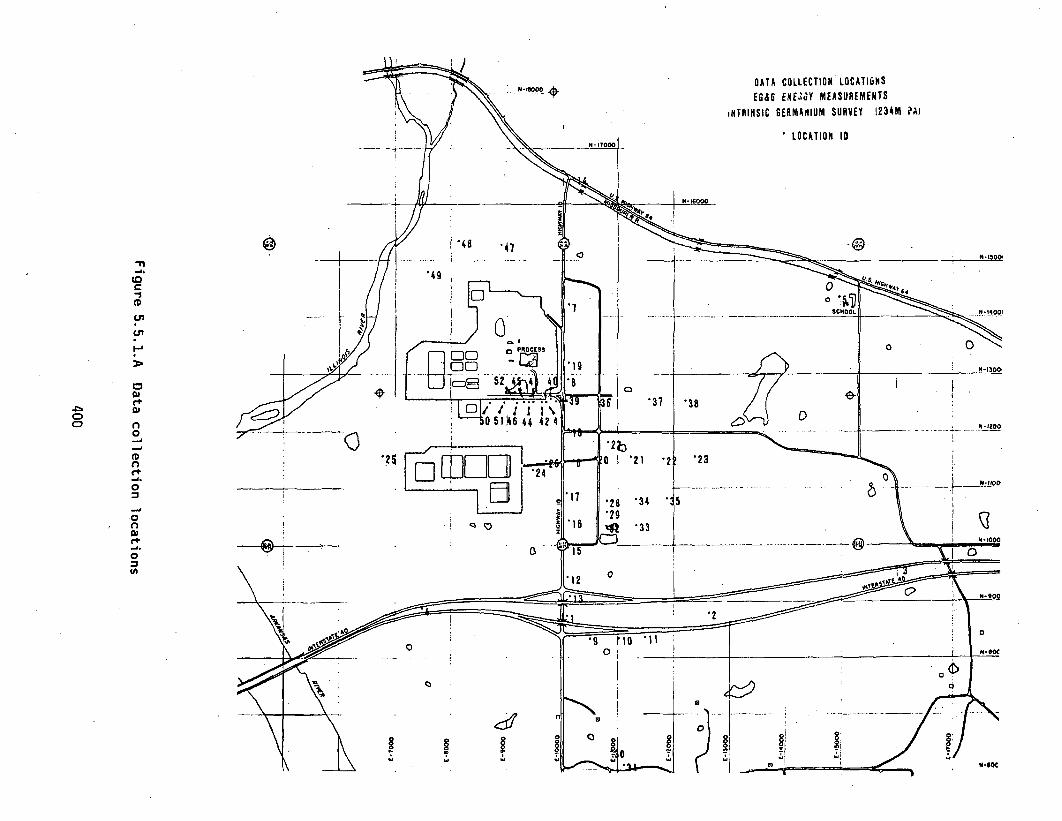
00
f-4
0
0in4
0

Page No.2/27/86
1
NEAR FIELD ENVIRONMENTAL SAMPLING RESULTSFOR Pa-234m SAMPLES
LABEL NORTH EAST
01020304050607080910111213141516171819202122232425262728293031323334353637383940414243444546
8750880095508850
14350115001420012900
83008350835094509100
165009950
1040010900120501320011550115501155011550113501160011500118001075010550
63006050
103501035010800108001255012600125501250012550125001250012500125001250012500
101001260016050745014950102001010010100105001105011450101001010010200101001010010050101001010010600112001180012350
945067509700
108001080010800108501110010800113001130011850106501155012200
98509750970096009450935092509150
LAB
EG&GEG&GEG&GEG&GEG&GEG&GEG&GEG&GEG&GEG&GEG&GEG&GEG&GEG&GEG&GEG&GEG&GEG&GEG&GEG&GEG&GEG&GEG&GEG&GEG&GEG&GEG&GEG&GEG&GEG&GEG&GEG&GEG&GEG&GEG&GEG&GEG&GEG&GEG&GEG&GEG&GEG&GEG&GEG&GEG&GEG&G
1-071-071-071-071-081-081-081-081-091-091-091-091-091-091-091-091-091-091-091-101-101-101-101-101-101-101-101-101-101-101-101-111-111-111-111-111-111-111-111-111-111-111-111-111-111-11
DEPODEPO
DEPODEPODEPODEPO
DEPODEPODEPODEPODEPODEPODEPODEPODEPODEPODEPODEPODEPODEPO
DEPODEPODEPODEPODEPO
DEPODEPODEPODEPODEPODEPODEPODEPODEPODEPODEPODEPODEPODEPODEPODEPODEPODEPO
DEPODEPODEPO
<90<90<90<90<90
95.3<90126.5<90<90<90<90<90<90<90
94.9106.8108.296.8
<90<90100.0<90107.5<90173.5<90
96.4100.85<90<90105.5103.3<90<90<90109.5106.0210.5297.0383.0652.5465.0332.5395.0465.5
DATE MEDIA RESULT UNITS COMMENTS
nCi/m2nCi/m2nCi/m2nCi/m2nCi/m2nCi/m2nCi/m2nCi/m2nCi/m2nCi/m2nCi/m2nCi/m2nCi/m2nCi/m2nCi/m2nCi/m2nCi/m2nCi/m2nCi/m2nCi/m2nCi/m2nCi/m2nCi/m2nCi/m2nCi/m2nCi/m2nCi/m2nCi/m2nCi/m2nCi/m2nCi/m2nCi/m2nCi/m2nCi/m2nCilrm2nCi/m2nCi/im2nCi/m2nCi/m2nCi/m2nCi/m2nCi/m2nCi /m2nCi /m2nCi/m2nCi/m2
401
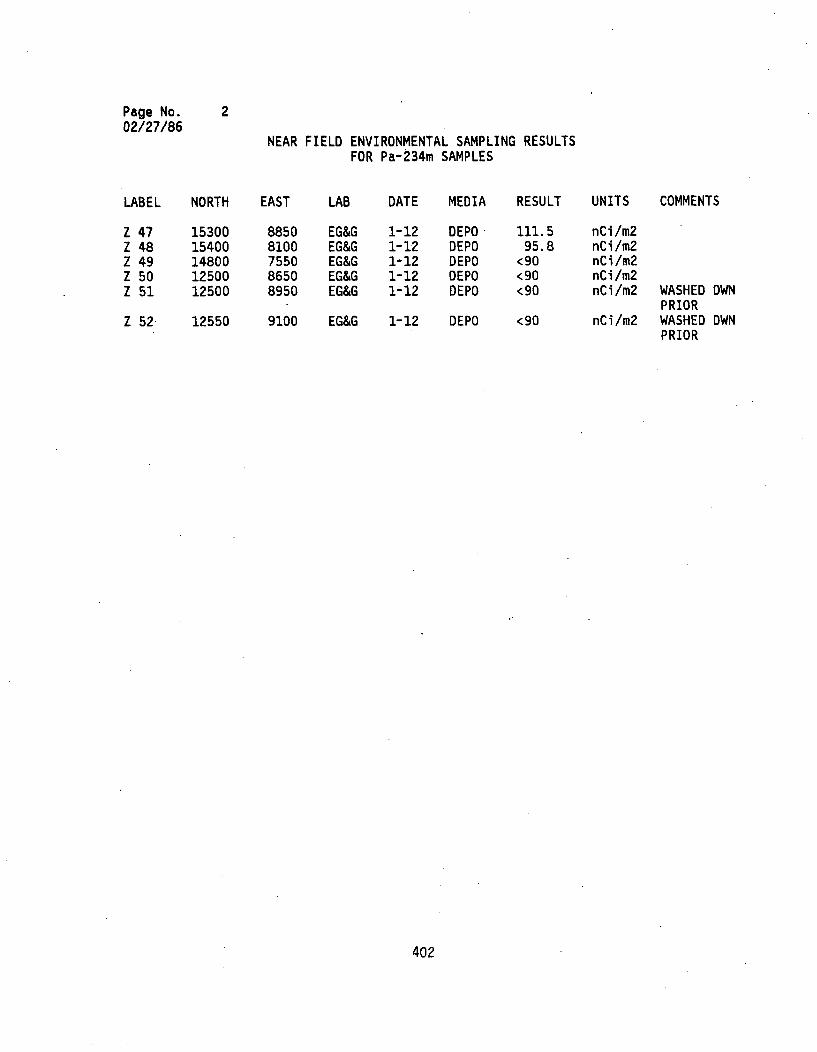
Page No.02/27/86
2
NEAR FIELD ENVIRONMENTAL SAMPLING RESULTSFOR Pa-234m SAMPLES
LABEL NORTH EAST LAB DATE MEDIA RESULT UNITS COMMENTS
zzzzz
4748495051
1530015400148001250012500
12550
88508100755086508950
EG&GEG&GEG&GEG&GEG&G
1-121-121-121-121-12
DEPODEPODEPODEPODEPO
111.595.8
<90<90<90
nCi/m2nCi/m2nCi/m2nCi/m2nCi/m2 WASHED OWN
PRIORnCi/m2 WASHED OWN
PRIORZ 52 9100 EG&G 1-12 DEPO <90
402

APPENDIX 5.6.1
MEDICAL EXAMINATION AND DIAGNOSIS FOR ONSITE WORKERS
403

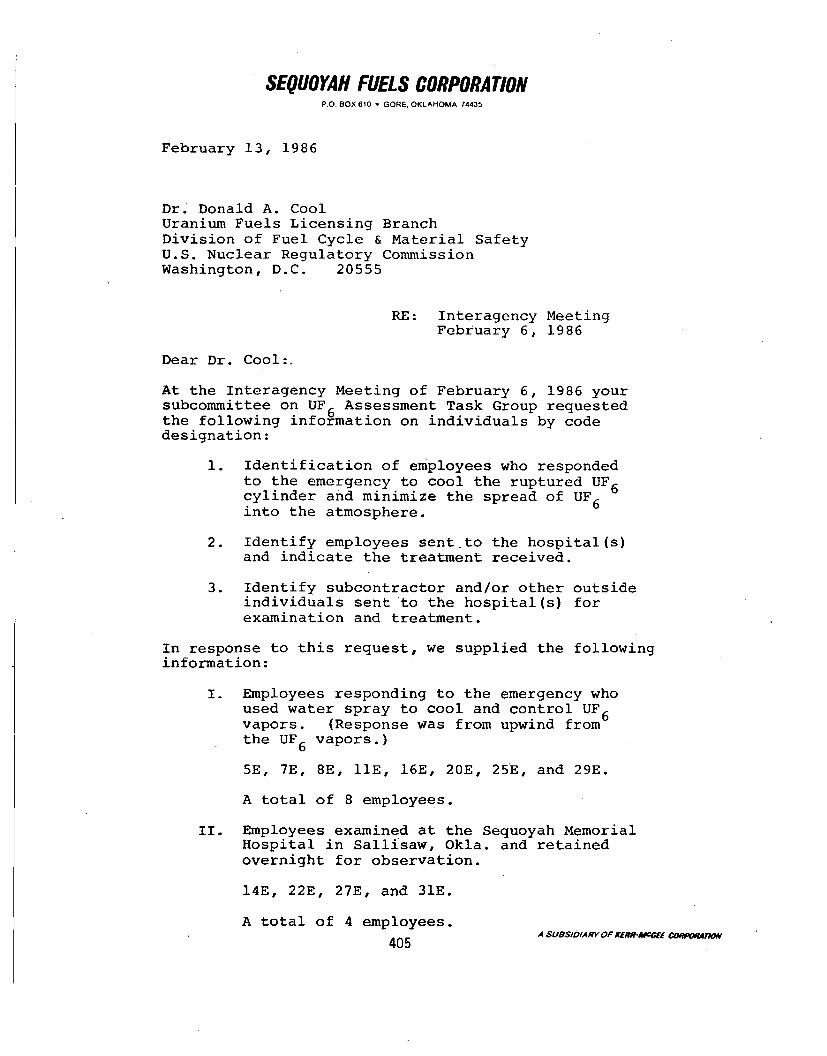
SEQUOYAH FUELS CORPORATIONP.O. BOX 610 * GORE, OKLAHOMA 74435
February 13, 1986
Dr. Donald A. CoolUranium Fuels Licensing BranchDivision of Fuel Cycle & Material SafetyU.S. Nuclear Regulatory CommissionWashington, D.C. 20555
RE: Interagency Meeting
February 6, 1986
Dear Dr. Cool:.
At the Interagency Meeting of February 6, 1986 yoursubcommittee on UF6 Assessment Task Group requestedthe following information on individuals by codedesignation:
1. Identification of employees who respondedto the emergency to cool the ruptured UF6cylinder and minimize the spread of UF6into the atmosphere.
2. Identify employees sentto the hospital(s)and indicate the treatment received.
3. Identify subcontractor and/or other outsideindividuals sent to the hospital(s) forexamination and treatment.
In response to this request, we supplied the followinginformation:
I. Employees responding to the emergency whoused water spray to cool and control UF6vapors. (Response was from upwind fromthe UF6 vapors.)
5E, 7E, 8E, lIE, 16E, 20E, 25E, and 29E.
A total of 8 employees.
II. Employees examined at the Sequoyah MemorialHospital in Sallisaw, Okla. and retainedovernight for observation.
14E, 22E, 27E, and 31E.
A total of 4 employees.A SUBSIO/ARY OF XERR-d4FCjF CO.R4IUa%
405
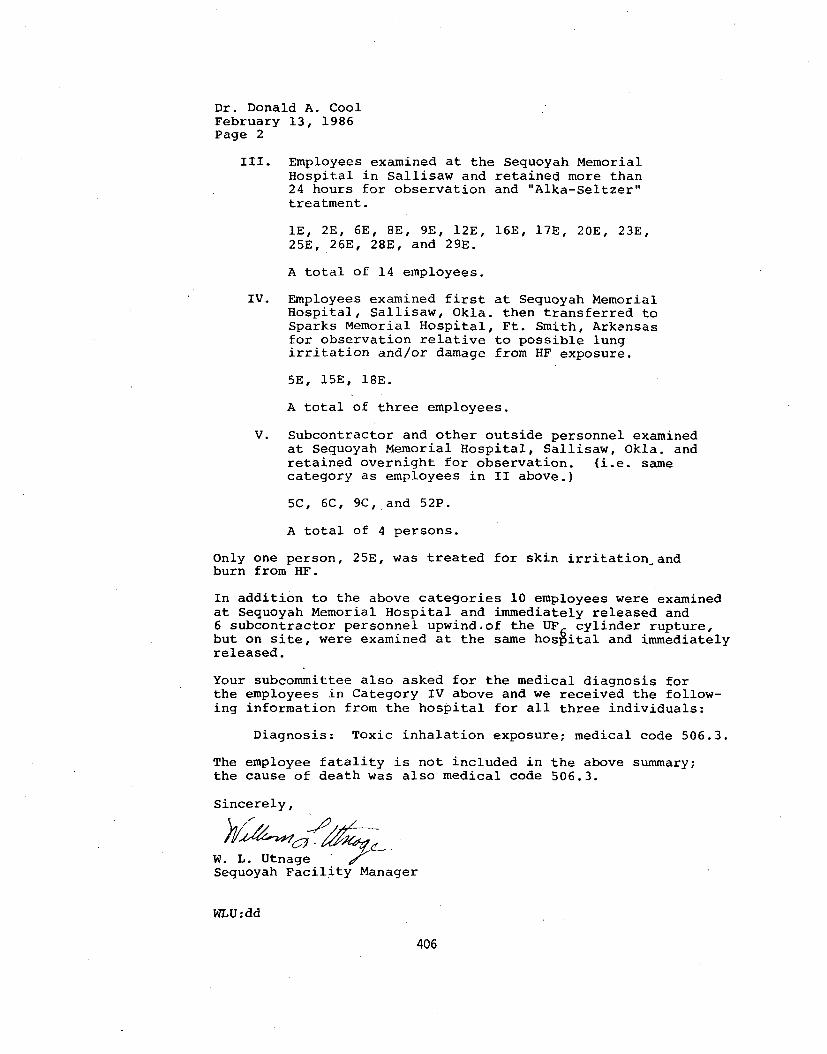
Dr. Donald A. CoolFebruary 13, 1986Page 2
III. Employees examined at the Sequoyah MemorialHospital in Sallisaw and retained more than24 hours for observation and "Alka-Seltzer"treatment.
1E, 2E, 6E, 8E, 9E, 12E, 16E, 17E, 20E, 23E,
25E, 26E, 28E, and 29E.
A total of 14 employees.
IV. Employees examined first at Sequoyah MemorialHospital, Sallisaw, Okla. then transferred toSparks Memorial Hospital, Ft. Smith, Arkansasfor observation relative to possible lungirritation and/or damage from HF exposure.
5E, 15E, 1BE.
A total of three employees.
V. Subcontractor and other outside personnel examinedat Sequoyah Memorial Hospital, Sallisaw, Okla. andretained overnight for observation. (i.e. samecategory as employees in II above.)
5C, 6C, 9C, and 52P.
A total of 4 persons.
Only one person, 25E, was treated for skin irritation andburn from HF.
In addition to the above categories 10 employees were examinedat Sequoyah Memorial Hospital and immediately released and6 subcontractor personnel upwind.of the UP cylinder rupture,but on site, were examined at the same hospital and immediatelyreleased.
Your subcommittee also asked for the medical diagnosis forthe employees in Category IV above and we received the follow-ing information from the hospital for all three individuals:
Diagnosis: Toxic inhalation exposure; medical code 506.3.
The employee fatality is not included in the above summary;the cause of death was also medical code 506.3.
Sincerely,
W. L. UtnageSequoyah Facility Manager
WLU:dd
406

APPENDIX 5.6.2
URANIUM BIOASSAY RESULTS FOR SFC WORKERS AND OFFSITE INDIVIDUALS
407

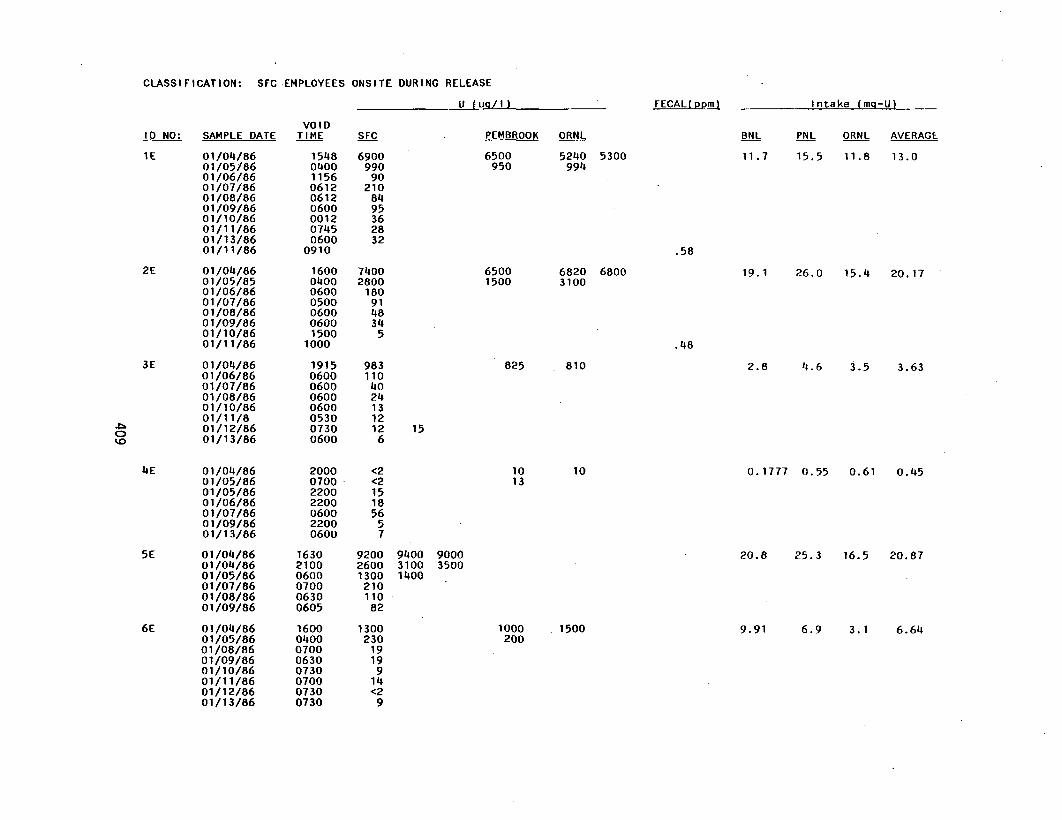
CLASSIFICATION: SFC EMPLOYEES ONSITE DURING RELEASE
U luall) FECAL( pm) Intake (ma-U)
I0 NO: SAMPLE DATE
lE 01/04/8601/05/8601/06/8601/07/8601/08/8601/09/8601/10/8601/11/8601/13/8601/11/86
2E 01/04/8601/05/8501/06/8601/07/8601/08/8601/09/8601/10/8601/11/86
3E 01/04/8601/06/8601/07/8601/08/8601/10/8601/11/801/12/8601/13/86
4E 01/04/8601/05/8601/05/8601/06/8601/07/8601/09/8601/13/86
5E 01/04/8601/04/8601/05/8601/07/8601/08/8601/09/86
6E 01/04/8601/05/8601/08/8601/09/8601/10/8601/11/8601/12/8601/13/86
VOIDTIME
154804001156061206120600001207450600
0910
1600040006000500060006001500
1000
19150600060006000600053007300600
2000070022002200060022000600
163021000600070006300605
16000400070006300730070007300730
SFC
690099090
2108495362832
74002800
180914834
5
98311040241312126
<2<2151856
57
92002600130021011082
1300230
19199
14<2
9
PEMBROOK ORNL BNL PNL ORNL AVERAGE
11.7 15.5 11.8 13.06500950
5240 5300994
.58
65001500
6820 68003100
19.1 26.0 15.4 20.17
825 810 2.8 4.6 3.5 3.63
04ti, 15
1013
10 0.1777 0.55 0.61 0.45
9400 90003100 35001400
20.8 25.3 16.5 20.87
1000200
1500 9.91 6.9 3.1 6.64
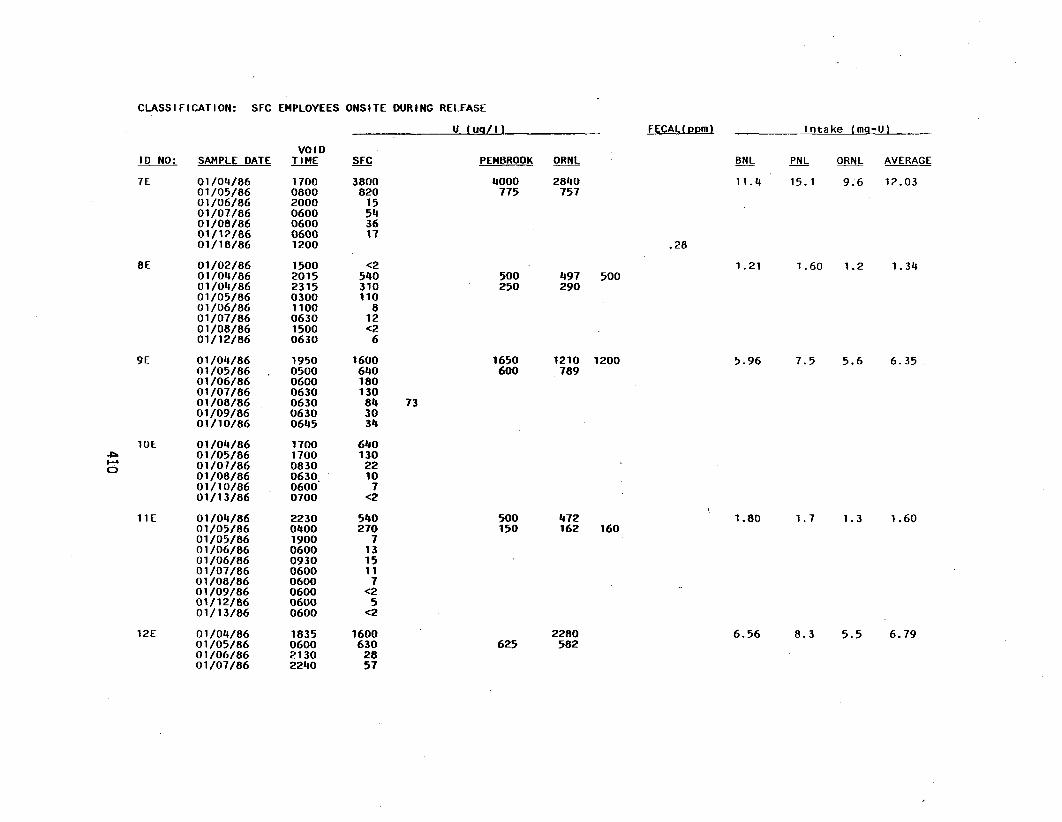
CLASSIFICATION: SFC EMPLOYEES ONSITE DURING RELEASE
U (uq/I) FECAL(ppml Intake (mo-U)
ID NO: SAMPLE DATE
7E 01/04/8601/05/8601/06/8601/07/8601/08/8601/12/8601/18/86
8E 01/02/8601/04/8601/04/8601/05/8601/06/8601/07/8601/08/8601/12/86
9E 01/04/8601/05/8601/06/8601/07/8601/08/8601/09/8601/10/86
1OE 01/04/8601/05/8601/07/8601/08/8601/10/8601/13/86
11E 01/04/8601/05/8601/05/8601/06/8601/06/8601/071/8601/08/8601/09/8601/12/8601/13/86
12E 01/04/8601/05/8601/06/8601/07/86
VOIDTIME
1700080020000600060006001200
15002015231503001100063015000630
1950050006000630063006300645
1700170008300630.06000700
2230040019000600093006000600060006000600
1835060021302240
SFC
3800820
15543617
<2540310110
812<2
6
1600640180130843034
6401302210
7<2
540270
71315117
<25
<2
1600630
2857
PEMBROOK
4000775
ORNL
2840757
BNL PNL ORNL AVERAGE
11.4 15.1 9.6 12.03
.28
500250
497 500290
1.21 1.60 1.2 1.34
5.96 7.5 5.6 6.351650 1210 1200600 789
73
4-.
C)
500150
472162 160
1.80 1.7 1.3 1.60
2280582
6.56 8.3 5.5 6.79625
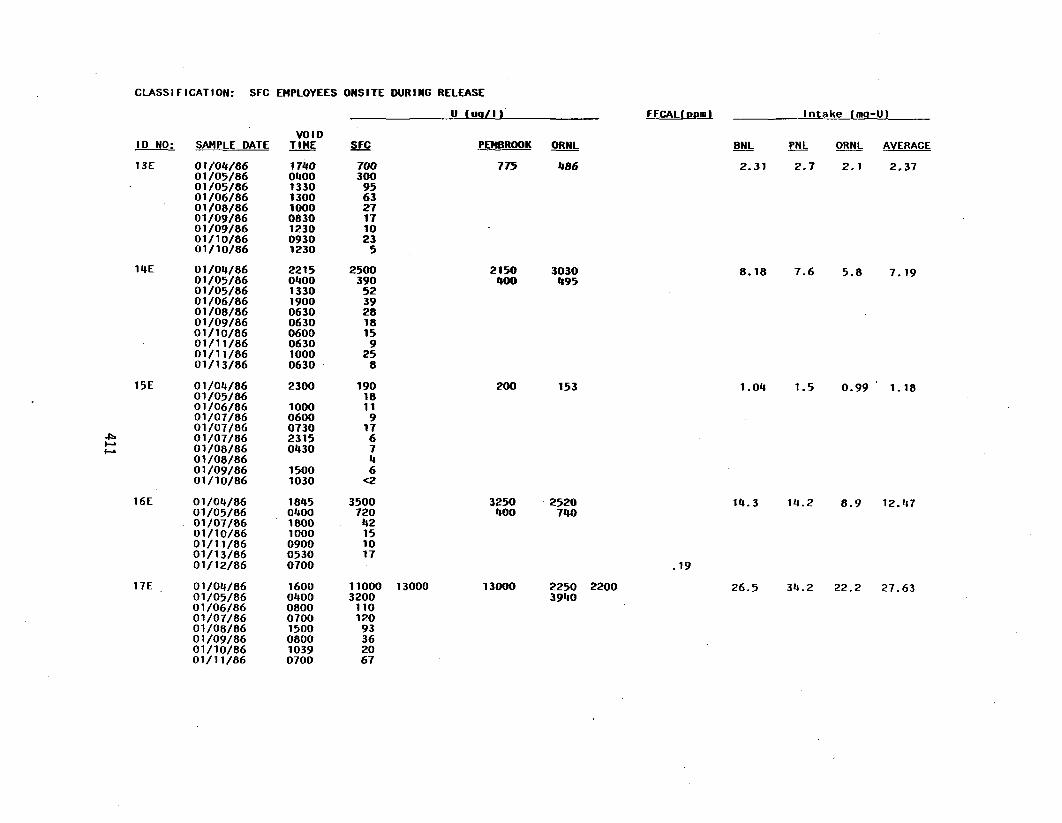
CLASSIFICATION: SFC EMPLOYEES ONSITE DURING RELEASE
U (uw/I) FECAL(ppm)
ID NO: SAMPLE DATE
13E 01/04/8601/05/8601/05/8601/06/8601/08/8601/09/8601/09/8601/10/8601/10/86
14E 01/04/8601/05/8601/05/8601/06/8601/08/8601/09/8601/10/8601/11/8601/11/8601/13/86
15E 01/04/8601/05/8601/06/8601/07/8601/071/8601/07/8601/08/8601/08/8601/09/8601/10/86
16E 01/04/8601/05/8601/07/8601/10/8601/11/8601/13/8601/12/86
17E 01/04/8601/05/8601/06/8601/07/8601/08/8601/09/8601/10/8601/11/86
VOIDTIME
174004001330130010000830123009301230
2215040013301900063006300600063010000630
2300
10000600073023150430
15001030
1845040018001000090005300700
16000400080007001500080010390700
SFC
700300956327171023
5
2500390
5239281815
925
8
19018119
176746
<2
350072042151017
110003200
11012093362067
PEMBROOK ORNL
775 486
2150 3030400 495
Intake (mq-U)
BNL PNL ORNL AVERAGE
2.31 2.7 2.1 2.37
8.18 7.6 5.8 7.19
1.04 1.5 0.99 1.18
14.3 14.2 8.9 12.47
200 153
!.t-
3250 2520400 740
.19
13000 13000 2250 22003940
26.5 34.2 22.2 27.63
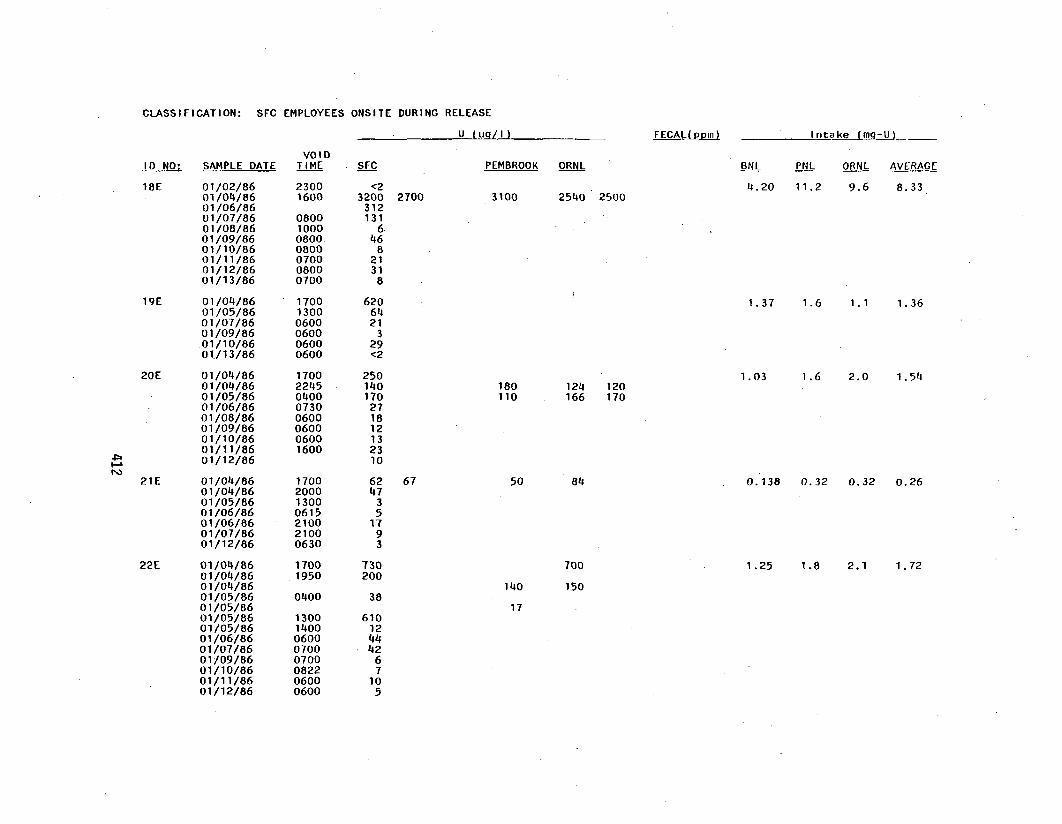
CLASSIFICATION: SFC EMPLOYEES ONSITE DURING RELEASE
U (ug/I) FECAL( ppm) Intake (mq-U)
ID NO, SAMPLE DATE
18E
19E
20E
21E
01/02/8601/04/8601/06/8601/07/8601/08/8601/09/8601/10/8601/11/8601/12/8601/13/86
01/04/8601/05/8601/07/8601/09/86.01/10/8601./13/86
01/04/8601/04/8601/05/8601/06/8601/08/8601/09/8601/10/8601/11/8601/12/86
01/04/8601/04/8601/05/8601/06/8601/06/8601/07/8601/12/86
01/04/8601/04/8601/04/8601/05/8601/05/8601/05/8601/05/8601/06/8601/07/8601/09/8601/10/8601/11/8601/12/86
VOIDTIME
23001600
0800100008000800070008000700
170013000600060006000600
17002245040007300600060006001600
1700200013000615210021000630
17001950
0400
13001400060007000700082206000600
SFC
<23200
312131
646
82131
8
6206421
329<2
PEMBROOK ORNL
2700 3100 2540 2500
BNL PNL ORNL AVERAGE
4.20 11.2 9.6 8.33
1.37 1.6 1.1 1.36
1.03 1.6 2.0 1.54
0.138 0.32 0.32 0.26
250140170271812132310
6247
35
1793
730200
38
610124442
67
105
180110
124 120166 170
67 50 84
22E 700
150
1.25 1.8 2.1 1.72
140
17
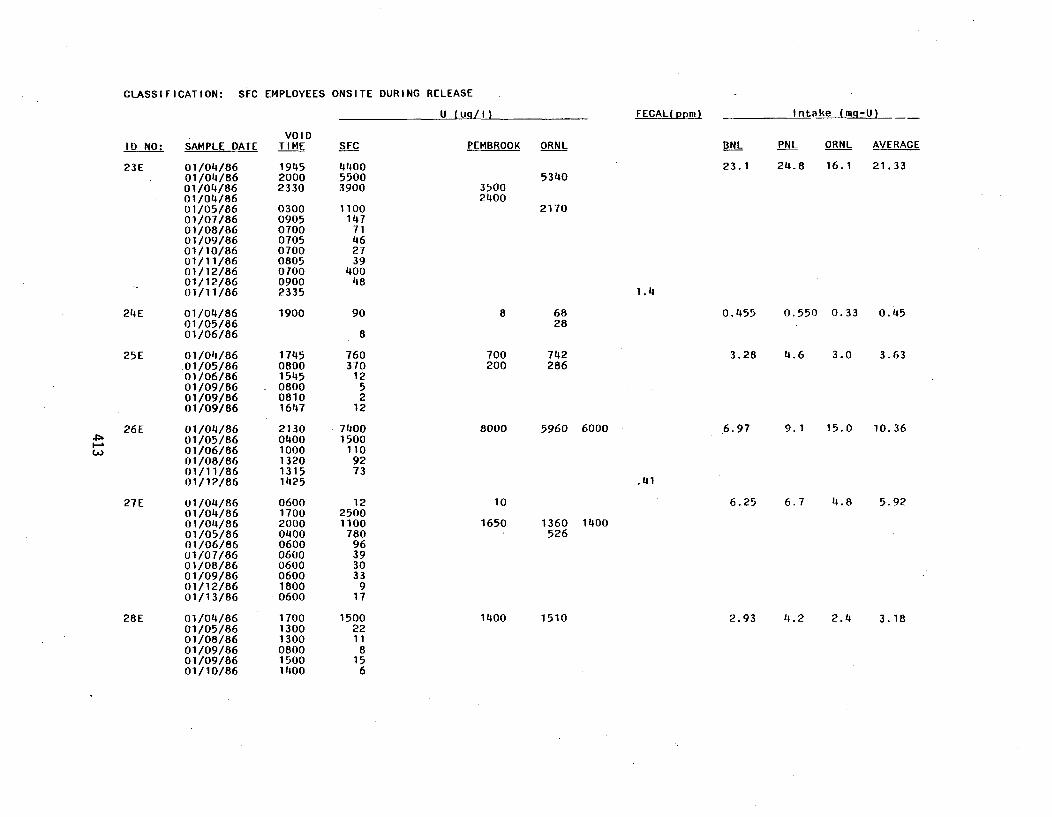
CLASSIFICATION: SFC EMPLOYEES ONSITE DURING RELEASE
U (uq/I) FECAL(ppm) Intake Ima-UlU (uq/I~ FECAL( r~m)
ID NO: SAMPLE DATE
23E 01/04/8601/04/8601/04/8601/04/8601/05/8601/07/8601/08/8601/09/8601/10/8601/11/8601/12/8601/12/8601/11/86
24E 01/04/8601/05/8601/06/86
25E 01/04/8601/05/8601/06/8601/09/8601/09/8601/09/86
26E 01/04/8601/05/8601/06/8601/08/8601/11/8601/12/86
27E 01/04/8601/04/8601/04/8601/05/8601/06/8601/07/8601/08/8601/09/8601/12/8601/13/86
28E 01/04/8601/05/8601/08/8601/09/8601/09/8601/10/86
VOIDTIME
194520002330
030009050700070507000805070009002335
1900
174508001545080008101647
213004001000132013151425
0600170020000400060006000600060018000600
170013001300080015001400
SFC
440055003900
110014771462739
40048
90
8
760370
1252
12
74001500
1109273
1225001100780
963930339
17
150022118
156
PEMBROOK ORNL BNL PNL ORNL AVERAGE
23.1 24.8 16.1 21.33
35002400
5340
2170
1.4
8 6828
0.455 0.550 0.33 0.45
700200
742286
3.28 4.6 3.0 3.63
6.97 9.1 15.0 10.368000 5960 6000CA)
.41
10
1650
6.25 6.7 4.8 5.92
1360 1400526
1400 1510 2.93 4.2 2.4 3.18
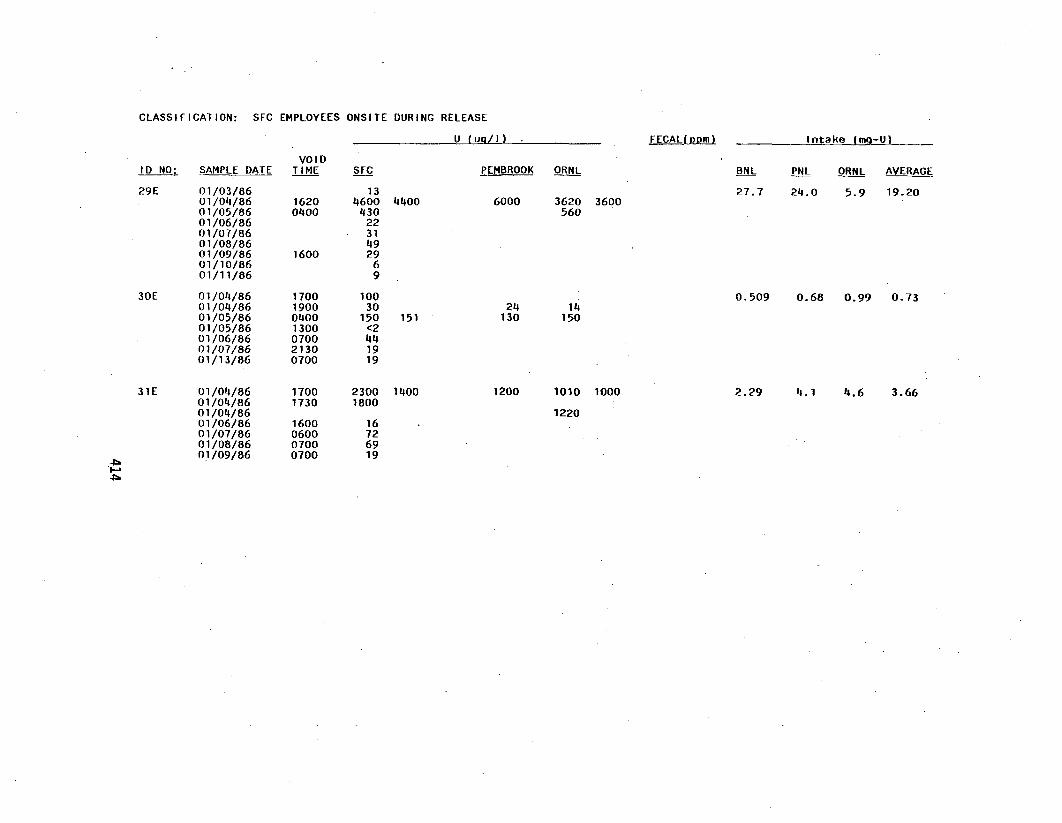
CLASSIFICATION: SFC EMPLOYEES ONSITE DURING RELEASE
U fuq/I)
ID NO:
29E
30E
31E
SAMPLE DATE
01/03/8601/04/8601/05/8601/06/8601/07/8601/08/8601/09/8601/10/8601/11/86
01/04/8601/04/8601/05/8601/05/8601/06/8601/07/8601/13/86
01/04/8601/04/8601/04/8601/06/8601/07/8601/08/8601/09/86
VOI DTIME
16200400
1600
1700190004001300070021300700
17001730
1600060007000700
SFC
134600
43022314929
69
10030
150<2441919
23001800
16726919
PEMBROOK
6000
FECALpOpm) Intake (mg-U)
BNL PNL ORNL AVERAGE
27.7 24.0 5.9 19.20
ORNL
3620 3600560
4400
0.509 0.68 0.99 0.7324
13015114
150
1400 1200 1010 1000
1220
2.29 4.1 4.6 3.66
3-:3

CLASSIFICATION: NON SFC EMPLOYEES ONSITE DURING RELEASE
U lug/I) FECAL(ppm) Intake (mQ-U)
ID NO: SAMPLE DATE
IC 01/04/8601/05/86
2C 01/04/8601/05/86
3C RESULTS PENDING
4C 01/04/8601/05/86
5C 01/04/8601/04/8601/05/86
6C 01/04/8601/05/8601/05/8601/05/86
7C 01/04/8601/05/86
8C 01/04/8601/04/86 101/05/8601/05/8601/06/86 101/07/86 101/11/86
9C 01/04/86 101/05/86
10C 01/04/86 101/05/86
VOI DTIME
19300400
SF0
<4<2
<25
PEMBROOK
<4<5
ORNL
<5<5
BNL
0.0201
PNL ORNL AVERAGE
0.0244 0.0154 0.0200
--- 0.0595 .0595<5
1547 2600470
0600 12301700690
1535 15001300
7560966
76001050
1400 1500
500
850
1250
14
5.78 7.748 9.66
0.0201 0.0245 0.0154
7.73
i.-U'1
1930A400
1700180004001300170015001330
1555
1515400
4<2
120984147
<27
23044
497 8
0.0200
230
7 <5 <5<2
0.0196 0.0768 0.0167 0.0377
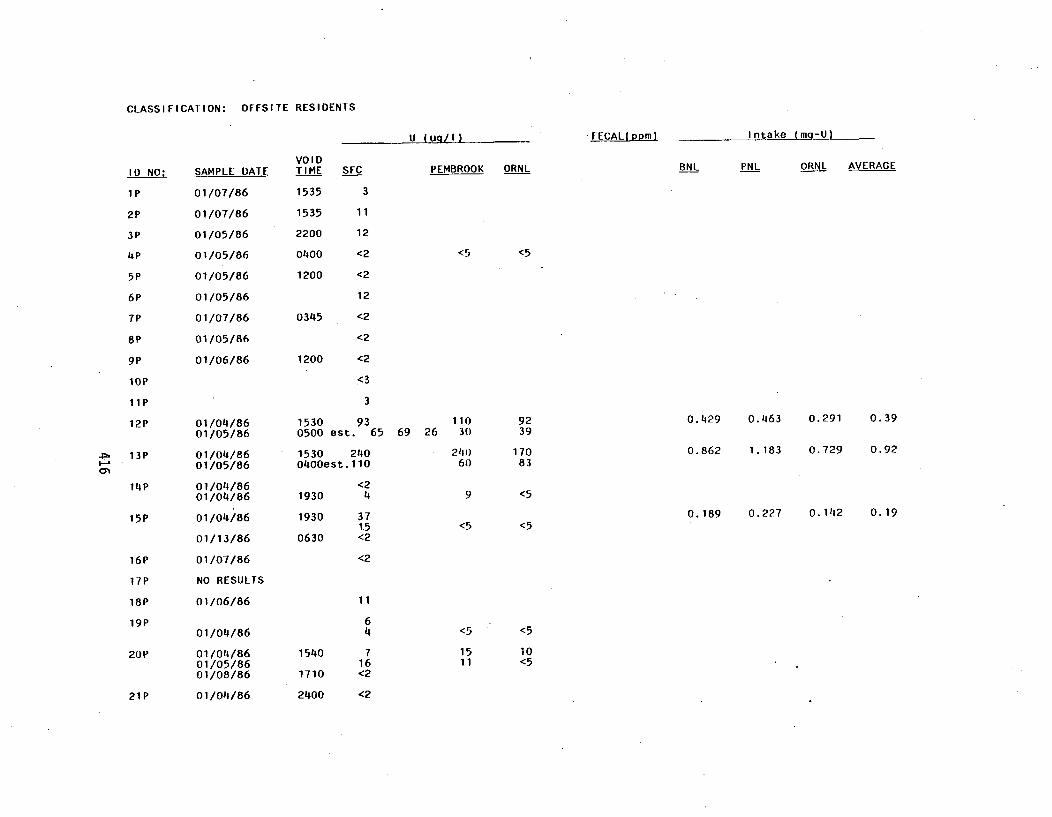
CLASSIFICATION: OFFSITE RESIDENTS
U (ug/I) FECAL(ppm) intake (rnci-!L
ID NO:
1p
2P
3P
4P
5P
6P
7P
8P
9P
lop
lip
SAMPLE DATE
01/07/86
01/07/86
01/05/86
01/05/86
01/05/86
01/05/86
01/07/86
01/05/86
01/06/86
VOI DTIME
1535
1535
2200
0400
1200
SFC
3
11
12
<2
<2
PEMBROOK ORNL BNL PNL ORNL AVERAGE
<5 <5
12
0345 <2
<2
1200 <2
<3
3
1530 930500 est. 65
1530 210O400est.1103-.
0•
12P 01/041/8601/05/86
13P 01/041/8601/05/86
14P 01/04/8601/04/86
15P 01/04/86
01/13/86
16P 01/07/86
17P NO RESULTS
18P 01/06/86
19P01/04/86
20P 01/04/8601/05/8601/08/86
21P 01/04/86
11069 26 30
24060
9239
17083
0.429 0.463 0.291 0.39
0.862 1.183 0.729 0.92
1930
1930
0630
<24
3715<2
<2
11
64
716<2
<2
9 <5
<5 <50.189 0.227 0.142 0.19
<5
1511
<5
10<5
1540
1710
2400
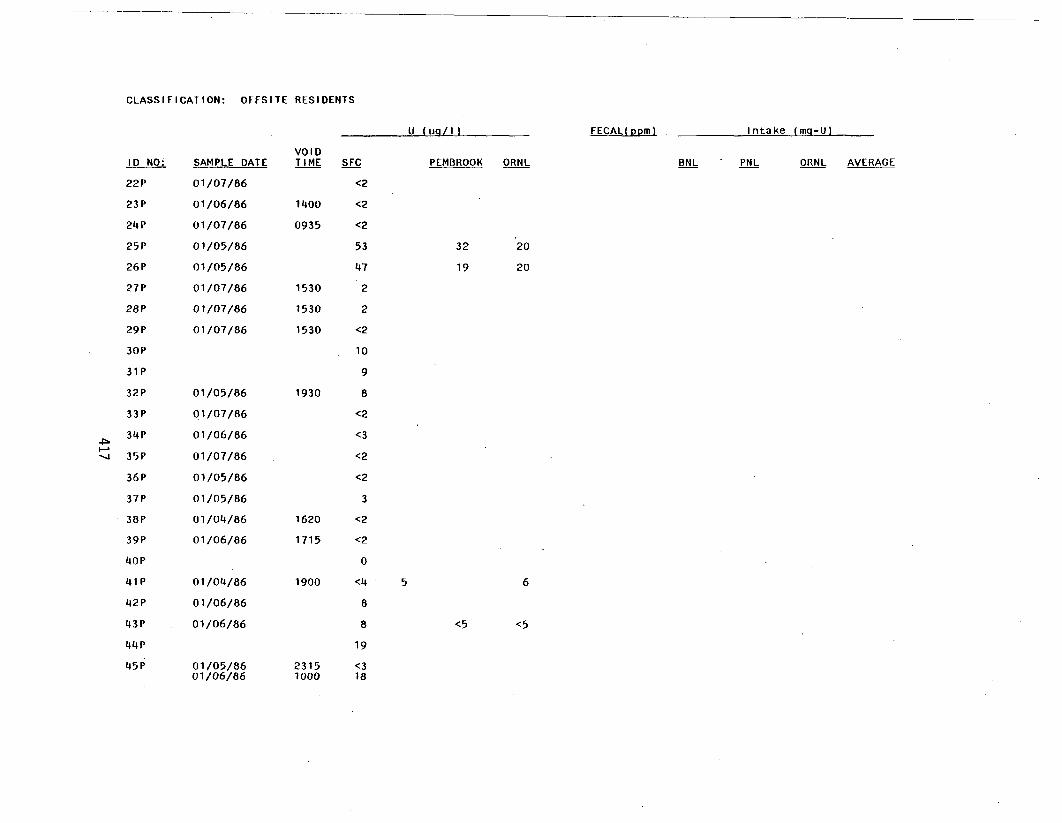
CLASSIFICATION: OFFSITE RESIDENTS
U (ug/Il FECAL(CDm) Intake (mq-U)
VOIDTIMEID NO SAMPLE DATE SFC
<2
PEMBROOK ORNL BNL PNL ORNL AVERAGE
22P
23P
24P
25P
26P
27P
28P
29P
30P
31P
32P
33P
34P
35P
36P
37P
38P
39P
40P
41P
42P
43P
44P
45P
01/07/86
01/06/86
01/07/86
01/05/86
01/05/86
01/07/86
01/07/86
01/07/86
01/05/86
01/07/86
01/06/86
01/07/86
01/05/86
01/05/86
01/04/86
01/06/86
01/04/86
01/06/86
01/06/86
01/05/8601/06/86
1400 <2
0935 <2
53
47
1530 2
1530 2
1530 <2
10
9
1930 8
<2
<3
<2
<2
3
1620 <2
1715 <2
0
1900 <4
8
8
19
2315 <31000 18
32
19
20
20
5 6
<5 <5

CLASSIFICATION: OFFSITE RESIDENTS
U (uq/I) FECAL(opm) Intake (mg-U)
ID NO: SAMPLE DATE
46P 01/05/8601/06/8601106/8601/07/86
47P 01/05/86
48P 01/08/8601/10/86
49P 01/06/86
50P 01/06/86
51P 01/05/86
52P 01/604/8601/04/86
53P 01/04/8601/05/86
54P
55P 01/05/86
56P 01/07/86
57P 01/07/86
58P 01/08/86
59P 01/06/86
60P NO RESULTS
61P NO RESULTS
62P 01/06/86
63P 01/06/86
64P 01/07/86
65P 01/06/8601/06/86
66P
VOl DTIME SFC
2330 <20900 <21830 <20615 3
1045 7
<2<2
1015 7
1015 <2
1630 6
1700 <71900 <7
2245 141600 15
0100 <22040 12
1845 10
1115 <2
1115 <2
<2
1455 <2
PEMBROOK ORNL
<5<5
<5 <5
<5 <5
<5 17<5
BNL PNL ORNL AVERAGE
I-O
1030 4
0030 6
<2
1520 <21520' <2
7
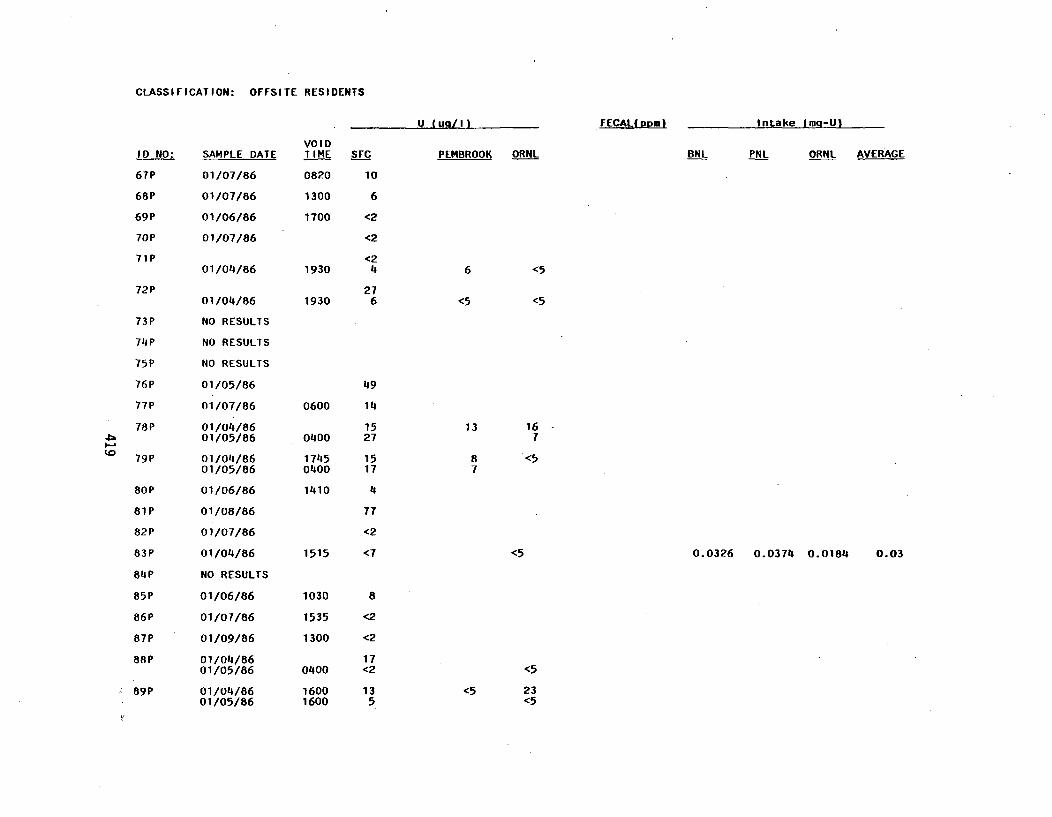
CLASSIFICATION: OFFSITE RESIDENTS
U tua/II FECAL(pom) Intake lmg-U)
ID NO: SAMPLE DATEVOIDTIM__E SFC PEMBROOK ORNL BNL PNL ORNL AVERAGE
67P
68P
69P
70P
71 P
72P
73P
74P
75P
76P
77P
78P
79P
80P
81P
82P
83P
84P
85P
86P
87P
88P
89P
01/07/86
01/07/86
01/06/86
01/07/86
01/04/86
0820 10
1300
1700
1930
1930
6
<2
<2
<24
276
6 <5
<5
I-.
01/04/86
NO RESULTS
NO RESULTS
NO RESULTS
01/05/86
01/07/86
01/04/8601/05/86
01/04/86
01/05/86
01/06/86
01/08/86
01/07/86
01/04/86
NO RESULTS
01/06/86
01/07/86
01/09/86
01/04/8601/05/86
01/04/8601/05/86
49
0600 14
0400
17450400
1410
1527
1517
4
<5
13 167
87
<5
77
<2
1515 <7 <5 0.0326 0.0374 0.0184 0.03
1030
1535
1300
0400
16001600
8
<2
<2
17<2
135
<5
<5 23<5

CLASSIFICATION: OFFSITE RESIDENTS
U Ii111H Intake (mg.-U)
ID NO:
90 P
91P
92P
93P
94P
95P
96P
97P
98P
99P
-I•, lOOP
-~loop0
101 P
.102P
103P
104P
105P
106P
107P
108P
109P
SAMPLE DATE
01/04/8601/04/86
01/08/86
01/04/8601/05/86
01/06/86
01/04/86
01/08/86
01/06/86
NO RESULTS
NO RESULTS
01/04/86
01/04/8601/04/86
01/04/8601/04/86
01/04/86
01/05/86
01/07/86
01/07/86
01/07/86
01/04/86
01/04/86
01/04/8601/04/86
01/04/8601/04/86
VOIDTIME
1650
2315
0420
1215
04001830
0950
SFC
<42
7
<2<2
7
13<4
<2
5
PEMBROOK ORNL
<5 <5
BNL PNL ORNL AVERAGE
<5 <5<5 <12
<2<2<4
<24
<24
1930 40400 <2
1440 <2
<2
1735 <2
1900 <4
1930 <4
<21900 8
<21900 8
<5
<5<5
<5
<582
<5 <5
14<5 <5
8
18
<5
<5
<5<5
11
<5
<5<5
<5 <5

CLASSIFICATION: OFFSITE RESIDENTS
U (ug/I) FECAL(ppm) Intake (mq-U)
ID NO: SAMPLE DATE
HlOP 01/04/8601/04/86
VOIDTIME
1930
SFC
<24
PEMBROOK ORNL BNL PNL ORNL AVERAGE
111 P
112P
113P
114P
.115P
116P
117P
118P
119P
120P
N'3121P
122P
123P
124P
125P
126P
127P
128P
129P
130P
131P
1 32P
01/04/86
01/07/86
01/04/8601/05/86
01/04/86
01/04/8601/05/86
01/04/86
01/05/86
01/05/86
01/07/86
01/014/86
01/04/86
01/04/86
01/05/86
01/05/86
01/06/86
01/07/86
01/04/86
01/04/86
01/06/8601/07/86
<21900 <4
6
<5 <5
<5 <5
<5 <5<5 <5
18180400
5<2
9
2230 106
2230 5
1000 19
16
1600 <5
<2
1600 43
1800 20
201645 40
15
12
4
1310 <2
<2
<2
<21920 6
1910 10
1600 <20800 6
<5<5
15
<5
<5<5
<5
<5
<5 <5
35 20
31
831
10
6
<5
14
20
1620
36
16
0.204
0.0988
0.192
0.229
0.122
0.213
0.116
0.0663
0.116
0.18
0.10
0.17
<5
<5

APPENDIX 5.6.3
INTAKE CALCULATION MODELS AND ASSUMPTIONS
423

I I- E~iI, IBROOKHAVEN NATIONAL LABORATORY
CE I N I ASSOCIATED UNIVERSITIES, INC.Upton. Long Island, New York 11973
(516) 282\
Safely & Environmental Protection Division FTS 666/4250
January 17, 1986
Dr. Allen BrodskySenior Health PhysicistDivision of Radiation Programs
and Earth SciencesOffice of Nuclear Regulatory ResearchWashington, D. C. 20555
SUBJECT: Estimate of Intake Post UF6 Release at Sequoyah Fuels Corporation
Dear Dr. Brodsky:
This is a letter to report results of estimates of intake, based on pre-liminary bioassay data sent to me on January 14, 1986. This letter brieflyoutlines the methods used to interpret the bioassay measurements, and addi-ttonal details will be reported in the monthly report for FIN No. A-3289. Thebioassay data are that reported to the Nuclear Regulatory Commission bySequoyah Fuels Corpo.ration, and the estimates of intake, which I computed fromthis bioassay data, are tabulated on the attachment.
In order to interpret the data, I assumed that urine was excreted at therate of 1.4 liters per day, and from this assumption, I estimated the accum-ulated amount of uranium in urine. I based this on the reported times ofsample, or the reported time of the single exposure to UF6, from which Iestimated the volume of urine in each sample. Based on this volume and thereported uranium concentration, I estimated the micrograms of uranium excret-ed, from the point in time of a previous urine sample, up to the time of thesample under consideration. From this, I estimated the total micrograms ofuranium excreted, from exposure up to the time of sample, and it was thisestimate which led me to compute the estimated intake, which is reported incolumn 5 of the attachment.
The estimate of intake, in column 5, was based on the fraction of intakeexcreted to urine, up to the time of sample, and the estimate of total uraniumexcreted through the urine pathway, up to the time of sample. The fraction ofintake was based on lung, GI tract, and systemic models, which were given inICRP Publication 30. An inhalation intake of class D aerosols, with an AMADof 1 micron, was assumed. An exposed person's estimate of intake showed somevariation from sample to sample. Some of this variation was due to biologicalvariables, and some was due to physical variables, such as those associatedwith sample collection and measurement, and those associated with computationand transcription of the results. The last column, on the attachment, repre-
425TELEK 96-7703 CABLE: BROOKLA8 UPTONNY
Lessard to Brodsky 2 January 17, 1986
sents the best estimate of intake, and it was based on the least squaresmethod of fitting data.
If you have any questions, please do not hesitate to call.
Sincerely,
Edward T. LessardProgram Manager,Interpretation of 3ioassay
Measurements
ETL/cjl.
cc: J. Baum
Attachment*
*Note: The data in this attachment has been summarized in Appendix 5.6.2.
426
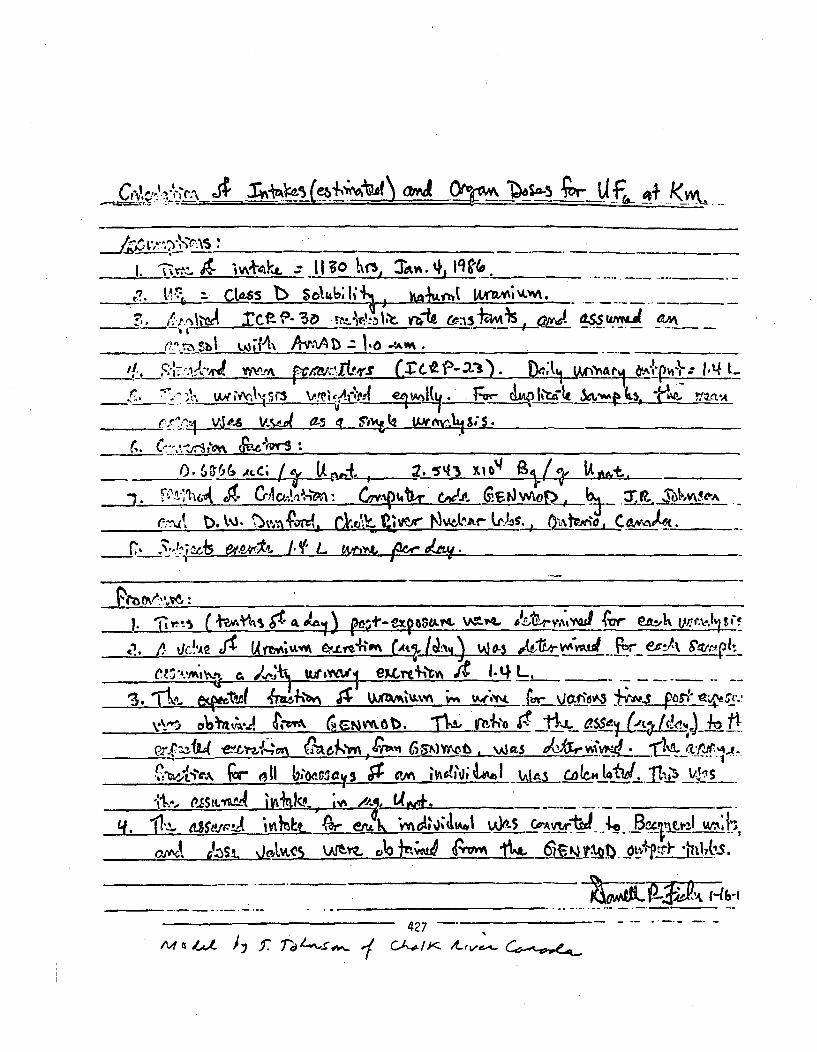
SIMI
__________5 xi' t2,~
j. J C~c~4~i )~4t#r '~c ~JZJF? Sb~~4OAk
loaf,& W4.c o" qS X P)~AM 4J~A
6-4 Cnd,~ /O l.'4L, ___3_ .*,&
S~ ~i ~M~OtAI, Wov.&3t _1 jteer
rvy- eAA f
~ (VAt itLb~ sqtfbsl. I V '4l
427~

IF t~.
ESTIMATES OF IN TAKE OF URANIUM BY PERSONS NEAR ( 1ACCIDENTAL RELEASE AT KERR-McGEE SITE
K. F. Eckerman and R. W. LeggettHealth and Safety Research Division
Oak Ridge National Laboratory
* Estimates of uranium intake have been made for several persons onor near the site of the recent accident at the Kerr-McGee plant inOklahoma. These estimates were based on uranium concentrations in urineof the subjects at times from a few hours to a few days after exposure.
Various excretion models have been applied to the general problemof estimating uranium uptake to blood based on the level of uranium inurine. Bernard and Struxuess (1957) determined a best-fitting powerfunction for urinary excretion data for patients injected with uraniumnitrate:
y (tW = 34.3 t-1 .5,
where Y Uis the excretion rate in %/h and t is measured in hours. Thisfunction is not a good approximation to the data for the first day afterinjection and hence is not suitable for the present analysis.
The alternate function
Y u = 0% first day)
Y uMt = 20%t-.
where t is in days. was later adopted by the ICRP (1968). This functionis not suitable for use in the present situation because of the lack ofdetail offered for the first dif after exposure. Moreover, this func-_tion may overestimate urinary excretion at early times.
A third approach is to combine the uranium retention functions andthe generic clearance rate from the transfer compartment as given inICRP 30 (1979). This approach yields seemingly reasonable excretionrates at early times when combined with the ICRP lung model for class Dmaterial (the classification for uranium hexafluoride given in ICRP 30).This is fortuitous, however, since the ICRP generic clearance rate fromthe transfer compartment appears to be a poor approximation for uranium,and the ICRP 30 retention models for uranium do not include considera-tion of the early times after exposure. .(Errors involved in the bloodclearance rate may be offset somewhat by errors in the lung model asapplied to soluble uranium.) In general, the use of ICRP 30 retentionmodels for estimation of excretion rates should be avoided becausetheICRP 30 retention models were not designed or intended for analysis, ofshort-term retention of radionuclides.
We appealed to the original injection data for the "Bostonpatients" considered by Bernard and Struxness (1957), combined withinjection data on healthy persons and persons with osteoporosis (seeBursh and Spoor 1973) to derive an excretion function for uranium thathas reached blood. The function
Y(t) =7.3 e-0.2t + 2.4 -0.07 5 t 1 0.08 *-O.O11t + 0.004 0-00 0 14t
where Y uis the SIh excreted in urine and t is in hours,. appears toapproximate these combined data closely for times from 30 minutes to
428.

several days after injection.The data provided to us on the Kerr-McGee subjects include only the
concentration of uranium and the date/time of the urias sample. Someassumptions had to be made in order to relate our theoretical blood-to-urine clearance curve to the concentrations of uranium in urine reportedfor various times of voiding. We assumed that the average urinaryexcretion rate for each subject is 1.4 liters of urine per day, or 0.058liters per hour. For a given sample it was assumed that the measuredconcentration represented an integrated value for all urine formed sincethe time of the preceding sample, unless that was more than 5 hours. Ifthe time since the preceding reported sample was more than 5 hours, weassumed that the measured concentration represented an integrated valuefor urine formed over the preceding 3 hours.
There remained the troublesome problem of determining the delaytime of UF 6 and resulting compounds in the respiratory tract. Analysisof data of Boback (1975), Chalabreysse (1970), and Moore and Kathren(1985) for persons accidentally exposed to uranium hexafluoride indioate*that any of three different patterns of excretion may be observed. Theexcretion rates for some persons appear to be the same as if there werealmost no delay of material in the lungs, since the pattern of urinaryexcretion was very similar to our blood-to-urine model given above.Other persons exhibited a slight extention of urinary excretion ofuranium, as if there were a brief delay (with T I/of perhaps 0.5 day orgreater) in the lungs. For a third small group oi persons, thereappeared .a nearly bimodal distribution of the uranium excretion rates,with high initial rates falling quickly toward zero after a few days andlater rising abruptly, sometimes to levels approaching the initialexcretion rates. The bimodel distribution of excretion rates appears tobe fairly unusual and was not considered in the present analysis.
In ICRP 30 it is recommended that inhaled uranium hexafluoride b6considered as a class D compound. The ICR? lung podel for class D com-pounds is int ended only as a first approximation for a large class ofsoluble materials that actually have a fairly wide distribution ofclearance times, varying up to several days. It is evident from thepublished data on uranium hexafluoride mentioned above that a substan-tial portion of inhaled uranium hexafluoride (much more than would bepredicted by the ICRP lung model) must reach the blood fairly rapidly.
We specialized the ICRP lung model for class D materials to uraniumhexafluoride and to the present exposure situation by choosing two frac-tions, one clearing rapidly and the other more slowly, in such a way asto "stabilize" our estimates of intake. (In agreement with the ICR?model for class D material, "rapid" was taken to mean T -/20.01 days and"more slowly" was taken to mean T~ /2=0.5 days.) Suppose, for example,that there are six urine samples or subject A, taken at various times.Given a lung retention model and our blood-to-urine model, the concen-tration of uranium in each sample can be used to estimate an intake attime 0. Uncertainties associated with our blood-to-urine model appearsmall compared with those associated with the delay in the lungs. Thus,a large variance in the six estimates would suggest to us that we haveincorrectly estimated delay in the respiratory tract, while stable esti-mates (a small variance) would suggest that the delay has been estimatedreasonably well. There is no single lung model that would yield moststable estimates for all subjects. For most subjects, estimates were
429
stabilized reasonably well by assuming that 30% of the activity entersblood with half-time 0.01 days and 20% enters blood with half-time 0.5days; the total amount assumed to enter blood (50%) agrees with the ICRPlung model for class D material. Our specialized lung model was usedfor all subjects. We note that estimates were stabilized nearly as welland fairly similar estimates were obtained by assuming no delay at allin the lungs and 50% clearance to blood. Estimates became very unstableif long-term delays in the lung were assumed.
Estimate's for all 45 subjects are summarized in the attached table.The best choice of a lung model, and the subsequent estimates of intake,are expected to vary somewhat as more data on urinary excretion are col-lected.
REFERENCES
Ell Bernard SR and Struxness EG. 1957, A& Study gL.1A& Distribution ~ARAExcrelion. 2LI ~Uranium 1A. Man.. 01UNL 2304.
[2] Boback b1W. 1975, A review of uranium excretion and clinical uri-nalysis data in accidental exposure cases, Report ERDA 93. Confer-ence 92A Occu~ationa~l Hegit Exveri-ence with Urnim 28-29 April1975. pp. 226-231.
[3] Eursk 3D and Spoor NL, 1973, Data on man. in Hodge HC, Stannard.IN, Harsh lB (eds.), Uranium, PluLton~ium, Transplutonic ElemetsaJNew York: Springer-Verlag, pp. 197-239.
[4] International Commission on Radiological Protection, 1968, Publi-cation 10, Report &&. Evalu~ationf 2.L RaLdi.tion. Doses. 1g. A9A Tissuesfrom .Internal Contamination Ag-L U Occupationfl fLPQJposur. Oxford:Permagon Press.
[5] International Commission on Radiological Protection, 1979, Publi-cation 30, L~imits. pj~ .XJgtake gL Radionuclides Im Yig.kizf, Oxford:Permagon Press.
16] Moore RD and Kathren RL. 1985, A World War 11 uranium hexafluorideinhalation event with pulmonary implications for today, 1. .ccu..&Ai. 27, 753-756.
(7] Chalabreysse X, 1970, Etude et resultats d'examens effectues a lasuite d'une inhalation de composes dits solubles d'uraniumnaturel, Radiotprotection 5, 1-17.
430
APPENDIX 5.6.4
CHEMICAL BIOASSAY RESULTS FOR SFC WORKERS
431


Name( ID)
Sex Weight Date Time Osmolality Creatinine___ (MOS/KG) (MG/DL)
Protein Glucose LDH Albumin(MG/DL) (MG/DL) (MU/214HR) _LMGLL
1E M 1145 01/23/8601/214/8601/25/86
2E N 208 01/23/8601/214/86
3E M 260 01/23/8601/214/8601/25/86
14E M 01/23/8601/214/860 1/25/85
5E M 207 01/23/860 1/214/860 1/25/86
6E F 202 01/23/860 1/214/860 1/25/86
7E M 170 01/23/860 1/214/8601/25/86
8~ E M 190 01/23/860 1/214/860 1/25/86
9E F 123 01/23/860 1/214/8601/25/86
IOE M 190 01/23/8601/214/860 1/25/86
111E 1 1145 01/23/8601/214/860 1/25/86
12E M4 210 01/23/8601/214/8601/25/86
114E 4 .178 01/23/8601/214/860 1/25/86
15E F 155 01/23/8601/214/860 1/25/86
16E 14 155 01/23/860 1/214/86
151007150800
08000600
090005300700
111512100900
080011200600
080007300730
1000
103011000900
081450905075.0
1114513571025
100011001000
10301010
153013001130
09200855
9655131467
562299
9987114728
258261629
1021858
1029
2371410228
1496605352
778361800
2811463398
87571431400
750
789
11114990890
2146371153
2153201433
10114982
1473.196.696.1
135.1483.6
182.91146.3152.5
314.536.5
1142.1
267.0161.12314.0
146.6314.138.2
137.011414.3100.0
268.0105.9312.6
31A.1314.6123.2
226.0253.669.14
1148.01146.0169.3
1446.0352.8181.0
35.565.215.6
35.5143.060.0
212.02144.14
5ND
ND
ND
1
4DND1
14ND.2
5492
59D9
2DND5
NDND
ND
3ND
3
ND
3.2
NDNDND
5
1
14
8
18142.9
614
966
225
717
911462
6
0.263.2
814.11
814.9
1311413.14
576
1397
350.14
2120.1
2018
2153
514
958
2
8
107
10
22
756
115
13
165
12113
878
191211
25
3214
11114
<68<68<68
<68<68
<68<68<68
<68<68<68
<68<68<68
<68<68<68
<68<68<68
<68<68<68
<68<68<68
<68<68<68
<68<68<68
<68<68<68
<68<68<68
<68<68<68
<68<68
(ng/mI)
2147278
16011414
(NAG)(nmol/minlml I
9.053.862.69
7.787.414
2144133173
~4057
1142
189156169
208020
1400889256
120814187
2028921414
10025651
120196187
1562201614
8025636
30109151
267700
10.235.026.38
1 .2141.7114.514
5.722.981.61
5.253.9114.06
7.14114.552.35
6.233.039.23
1 .0814.013.06
3.062.280.63
14.255.296.12
12.666.782.88
3.566.721.5
3 .6141 .981 .95
8.7813.65
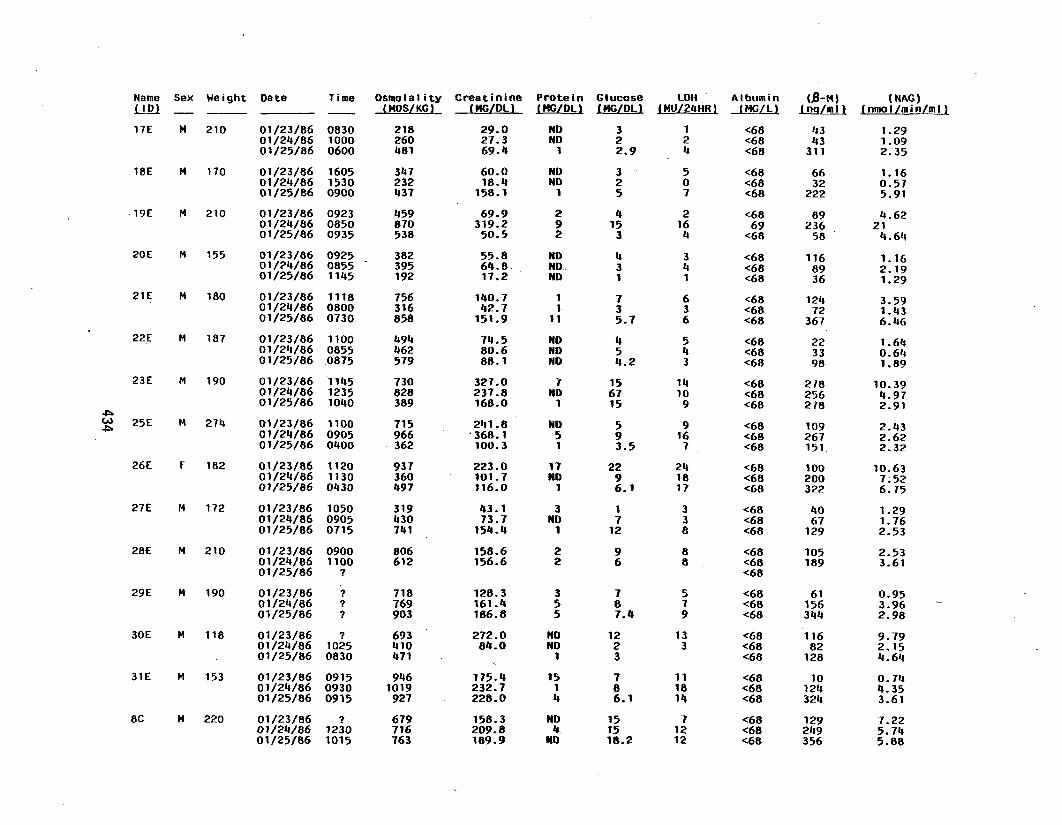
Name Sex Weight Date
17E M 210 01/23/8601/24/8601/25/86
18E N 170 01/23/8601/24/8601/25/86
ý19E M 210 01/23/8601/214/8601/25/86
20E N 155 01/23/8601/214/8601/25/86
21E N 180 01/23/8601/241/8601/25/86
22.E M 187 01/23/8601/24/860 1/25/86
23E t4 190 01/23/860 1/24/860 1/25/86
wA. 25E M4 274 01/23/864t,- 01/24/86
0 1/25/86
26E F 182 01/23/8601/24/8601/25/86
27E M 172 01/23/8601/24/8601/25/86
28E M 210 01/23/8601/24/8601/25/86
29E M 190 01/23/8601/24/8601/25/86
30E M 118 01/23/8601/24/86
- 01/25/86
31E M 153 01/23/860 1/24/8601/25/86
8C M 220 01/23/8601/24/8601/25/86
T i me
083010000600
160515300900
092308500935
092508551145
111808000730
110008550875
114512351040
110009050400
112011300430
105009050715
09001100
10250830
091509300915
12301015
OsmolIalI i tyf NOS/ KG
218260481
3472321437
1459870538
382395192
756316858
1494462579
730828389
715966362
9373601497
3194307141
806612
718769903
69314101471
9461019927
679716763
Creatinine(LG/LgL
29.027.369.14
60.018.4158.1
69.9319.250.5
55.864.8.17.2
1140.7142.7
151.9
74.580.688.1
327.0237.8168.0
241.8,368.1100.3
223.0101.7116.0
143.173.7
1514.14
158.6156.6
128.3161.14186.8
272.0814.0
175.14232.7228.0
158.3209.8189.9
P rote in(NG/DI)
RDND
I
NDND1
292
NDNDND
NDND
7ND
ND51
17ND1
3ND1
Glucose(MG/DL)
322.9
25
14153
1431
735.7
14514.2
156715
593.5
2296.1
1712
96
LOU(MU/2141R)
1214
507
21614
341
636
5143
14109
9167
241817
33
579
133
111814
71212
Albumin(MG/I)
<68<68<68
<68<68<68
<6869
<68
<68<68<68
<68<68<68
<68<68<68
<68<68<68
<68<68<68
<68<68<68
<68<68<68
<68<68<68
<68<68<68
<68<68<68
<68<68<68
<68<68<68
(A-M)
43143
311
6632
222
8923658
1168936
12472367
223398
278256278
109267151.
100200322
4067129
105189
611563414
11682128
101214324
1292149356
(NAG)(nmol/min/mi)l
1.291.092.35
1.160.575.91
14.62214.64
1.162.191.29
3.591.436.46
1.640. 641.89
10.394.972.91
2.432.622.32
10.637.526.75
1.291.762.53
2-.533.61
0.953.962.98
9.792.1514.64
0.7414.353.61
7.225.745.88
3 75 85 7.14
No 12RD 21 3
15 71 814 6.1
ND 154. 15
No 18.2

APPENDIX 5. 6. 5
CREATININE CORRECTION METHODOLOGY AND FACTORS
435

Creatinine Correction
The following calculations of 24-hour creatinine excretion values are
based on a 1.25 1/day average urine volume, the measured creatinine values,
and the body weight data provided. On the basis of the mg creatinine/day/kg
body weight estimates, all urinary indicator values were normalized by
determining the ratio of each estimate to a normal value of 23 mg
creatinine/day/kg body whenever the estimate lay outside a normal range of
creatinine excretion values, viz., 16 to 30 mg creatinine/day/kg. Each ratio
is listed as the creatinine correction. Two examples of the application of
the creatinine correction to the urinary-injury indicator measurements follow
the tabulation.
437
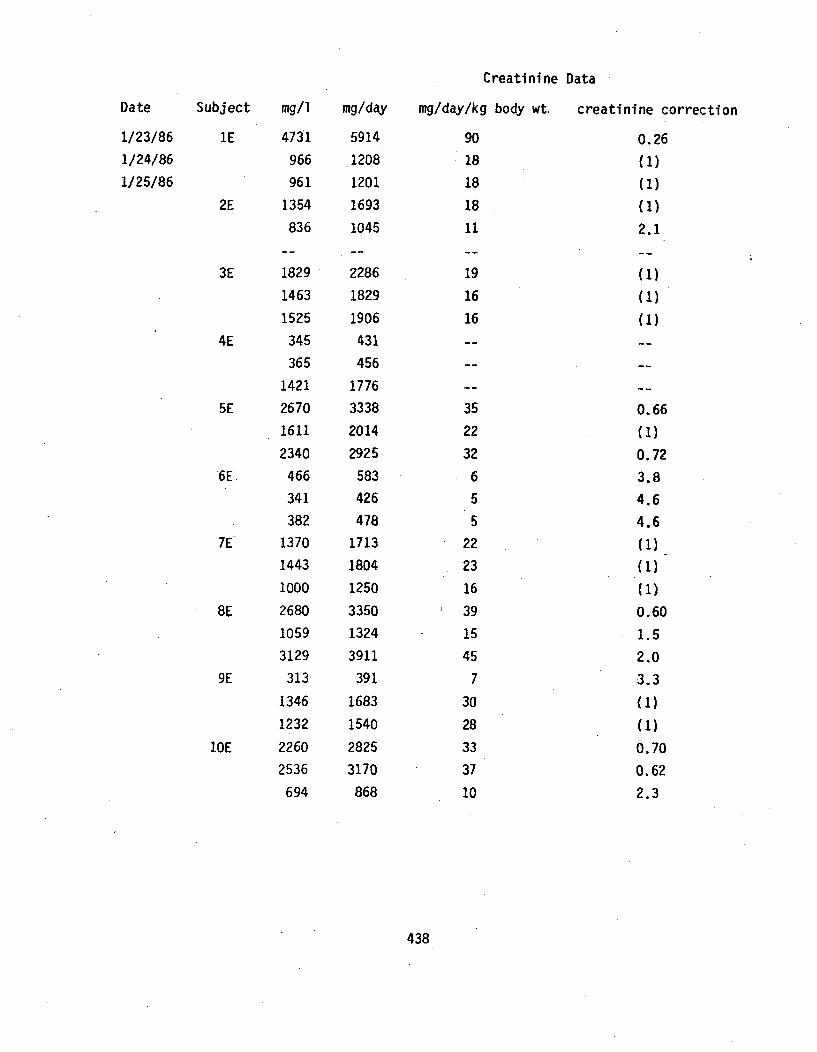
Creatinine Data
Date Subject mg/i mg/day mg/day/kg body wt. creatinine correction
1/23/86 1E 4731 5914 90 0.*26
1/24/86 966 1208 18 (1)1/25/86 961 1201 18 (1)
2E 1354 1693 18 (1)836 1045 11 2.1
3E 1829 2286 19 (1)1463 1829 16 (1)1525 1906 16 (1)
4E 345 431 -- - -
365 456 -- -
1421 1776 -- --
5E 2670 3338 35 0.661611 2014 22 (1)
2340 2925 32 0.726E. 466 583 6 3.8
341 426 5 4.6382 478 5 4.6
7E 1370 1713 22 (1)1443 1804 23 (1)1000 1250 16 (1)
8E 2680 3350 39 0.601059 1324 15 1.5
3129 3911 45 2.09E 313 391 7 3.3
1346 1683 30 (1)1232 1540 28 (1)
10E 2260 2825 33 0.70
2536 3170 37 0.62
694 868 10 2.3
438
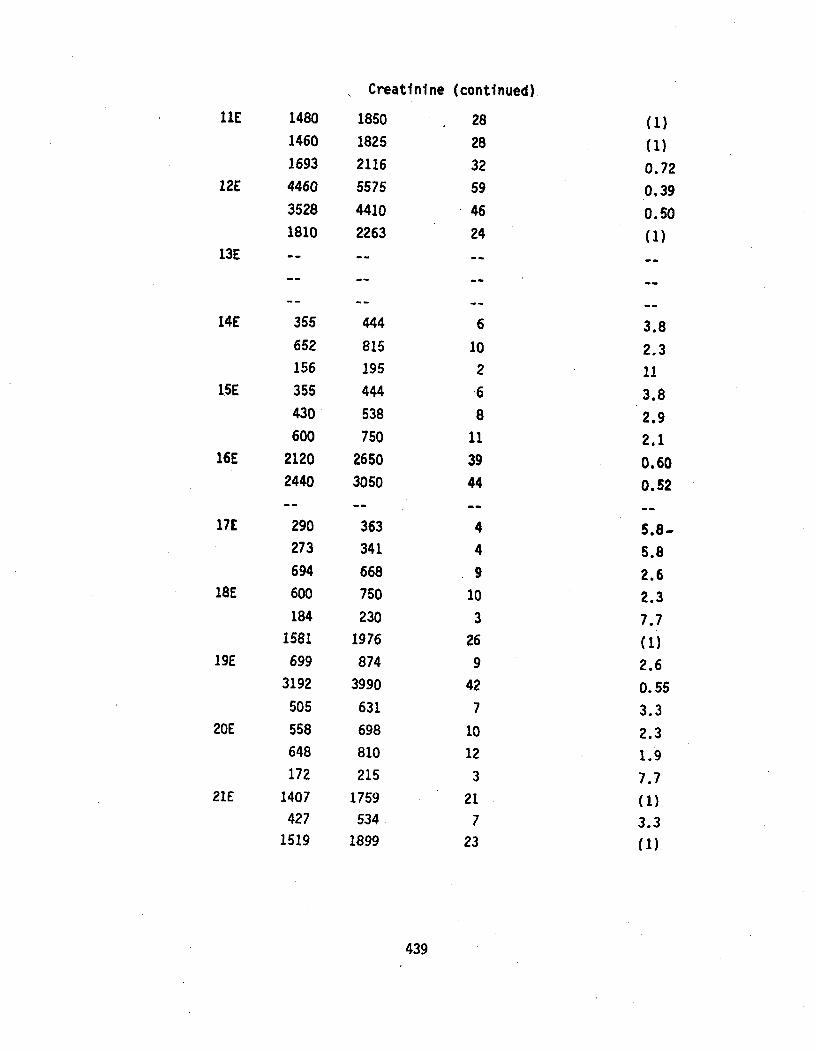
Creatinine (continued)
11E
12E
13E
14E
15E
16E
17E
18E
1 9E
20E
21 E
1480
1460
1693
4460
3528
1810
355
652
156
355
430
600
2120
2440
290
273
694
600
184
1581
6993192
505
558
648
172
1407
427
1519
1850
1825
2116
5575
4410
2263
444
815
195
444
538
750
2650
3050
363
341
668
750
230
1976
874
3990
631
698
810
215
1759
534
1899
6
10
2
8
11
39
44
4
4
910
3
26
9
42
7
10
12
3
21
7
23
28
28
32
59
46
24
0.72
0.39
0.50
3.8
2.3
11
3.8
2.9
2.1
0.60
0.52
5.8-
5.8
2.6
2.3
7.7
(1)
2.6
0.55
3.3
2.3
1.9
7.7
(1)
3.3
(1)
439
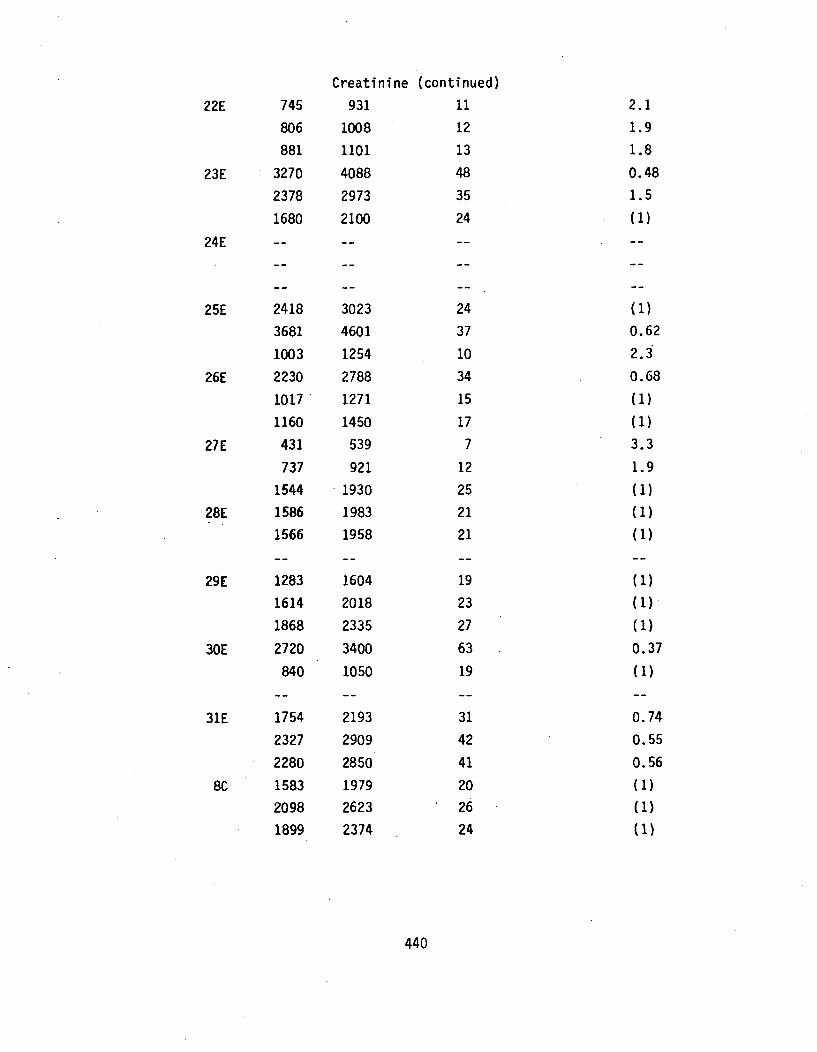
22E 745
806
881
23E 3270
2378
1680
24E --
25E 2418
3681
1003
26E 2230
1017
1160
27E 431
737
1544
28E 1586
1566
29E 1283
1614
1868
30E 2720
840
31E 1754
2327
2280
8C 1583
2098
1899
Creatinine (continued)
931 11
1008 12
1101 13
4088 48
2973 35
2100 24
3023 24
4601 37
1254 10
2788 34
1271 15
1450, 17
539 7
921 12
1930 25
1983 21
1958 21
1604 19
2018 23
2335 27
3400 63
1050 19
2193 31
2909 42
2850 41
1979 20
2623 26
2374 24
0.62
2.3j
0.68
(1)
(1)
3.3
1.9
(1)
(1)
(1)
(1)7
(1)
0.74
0.55
0.56
2.1
1.9
1.8
0.48
1.5
(1)
440
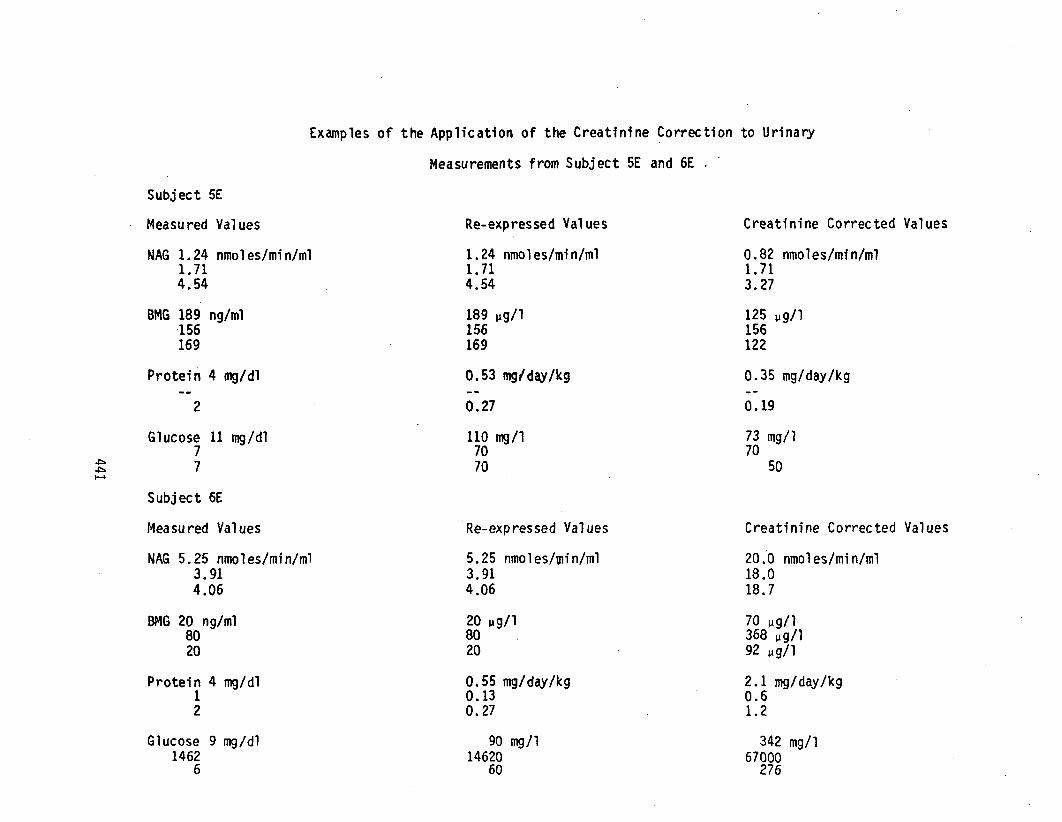
Examples of the Application of the Creatinine Correction to Urinary
Measurements from Subject 5E and 6E
I.P
Subject 5E
Measured Values
NAG 1.24 nmoles/min/ml1.714.54
BMG 189 ng/ml.156169
Protein 4 mg/dl
2
Glucose 11 rng/dl77
Subject 6E
Measured Values
NAG 5.25 nmoles/min/ml3.914.06
BMG 20 ng/ml8020
Protein 4 nig/di12
Glucose 9 nig/di1462
6
Re-expressed Val ues
1 .24 nmoi es/mi n/nil1.714.54
189 .vg/l156169
0.53 mg/day/kg
0.27
110 mg/i7070
Re-expressed Values
5. 25 nmol es/wiln/nil3.914.06
20 gg/l8020
0.55 mg/day/kg0.130.27
90 mg/i14620
60
Creatinine Corrected Values
0.82 nmoles/min/ml1.713.27
125 wg/i156122
0.35 mg/day/kg
0.19
73 mg/I70
50
Creatinine Corrected Values
20.0 nmoi es/mi n/mi18.018.7
70 gg/i368 vg/i92 gg/i
2.1 mg/day/kg0.61.2
342 mg/i67000276


APPENDIX 6.1.2.1
SUMMARY OF DOSE CONVERSION FACTORS AND INTAKE PARAMETERSUSED FOR RADIOLOGICAL DOSE CALCULATION
443


APPENDIX 6.1.2.1
External Dose Conversion Factors
Releases of radioactive gases and particulates to the atmosphere may res ult in:external doses by exposure to and/or immersion in the plume and by exposure tocontaminated land surfaces. The dose conversion factors are summarized byKocher in ORNL/MUREG-70, and those used in this report are shown inTable 6.1.2.1.1. Usage factors are given in Table 6.1.2.1.4.
Table 6.1.2.1.1 Dose conversion factors for externalexposure pathways
OrganRadionuclide Total body Bone Kidney Lungs
Exposure to ground surfaces (millirem/year per pCi/cm2)
23U7.1 X 102 3.0 X 10² 1.0 X 10² 1.7 X 10²
23U1.5 x 105 2.1 x 1O5 1.3 x 10⁵ 1.4 x 10⁵
238(U 5.7 x 10² 2.1 x 10² 5.9 x 101 1.2 x 10²
Immersion in air (millirem/year per pCi/cms)
23U6.8 x 105 7.1 x 10⁵ 3.7 x 10⁵ 4.1 x 10⁵
23u6.8 x 108 9.4 x 10⁸ 5.9 x 10⁸ 1.2 x 10⁸
23u4.6 x 105 4.5 x 10⁵ 2.2 X 10⁵ 2.5 x 10⁵
Source: D. C. Kocher, Dose-Rate Conversion Factors for External Exposure toPhotons and Electrons, ORNL/NUREG-79, Oak Ridge National Laboratory,August 1981.
445
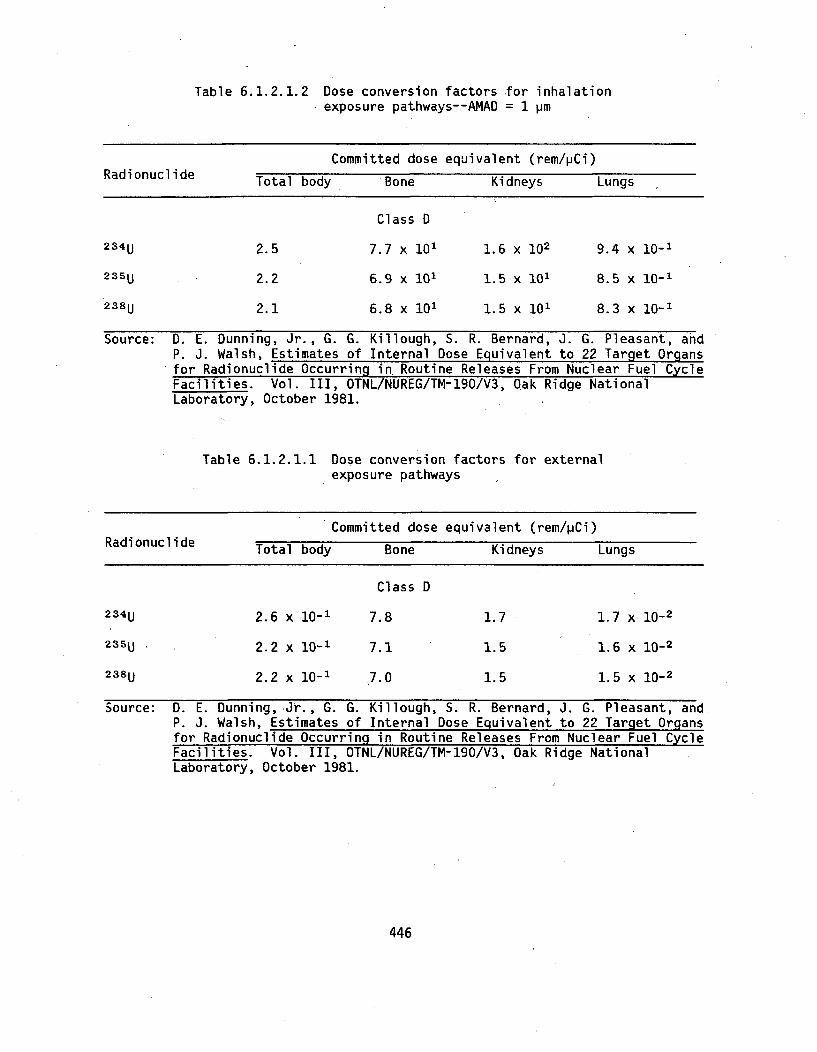
Table 6.1.2.1.2 Dose conversion factors for inhalationSexposure pathways- -AMAD = 1 pm
Committed dose equivalent (rem/pCi)Radionuclide Total body Bone Kidneys Lungs
Class D
23U2.5 7.7 x 101 1.6 x 10² 9.4 x 10⁻¹
23U2.2 6.9 x 101 1.5 x 101 8.5 x 10⁻¹
2SS8j 2.1 6.8 x 101 1.5 x 101 8.3 x 10⁻¹
Source: D. E. Dunning, Jr., G. G. Killough, S. R. Bernard, J. G. Pleasant, andP. J. Walsh, Estimates of Internal Dose Equivalent to 22 Target Organsfor Radionuclide Occurring in.Routine Releases From Nuclear Fuel CycleFacilities. Vol. III, OTNL/NUREG/TM-190/V3, Oak Ridge NationalLaboratory, October 1981.
Table 6.1.2.1.1 Dose conversion factors for externalexposure pathways
Committed dose equivalent (rem/pCi)Radionuclide Total body Bone Kidneys Lungs
Class D
23U2.6 x 10-' 7.8 1.7 1.7 X 10⁻²
235U 2.2 x 10⁻¹ 7.1 1.5 1.6 X 10⁻²
2381j 2.2 x 10⁻¹ 17.0 1.5 1.5 x 10⁻²
Source: D.. E. Dunning,.Jr., G. G. Killough, S. R. Bernard, J. G. Pleasant, andP. J. Walsh, Estimates of Internal Dose Equivalent to 22 Target Organsfor Radionuclide Occurring in Routine Releases From Nuclear Fuel CycleFacilities. Vol. III, OTNL/NUREG/TM-190/V3, Oak Ridge NationalLaboratory, October 1981.
446
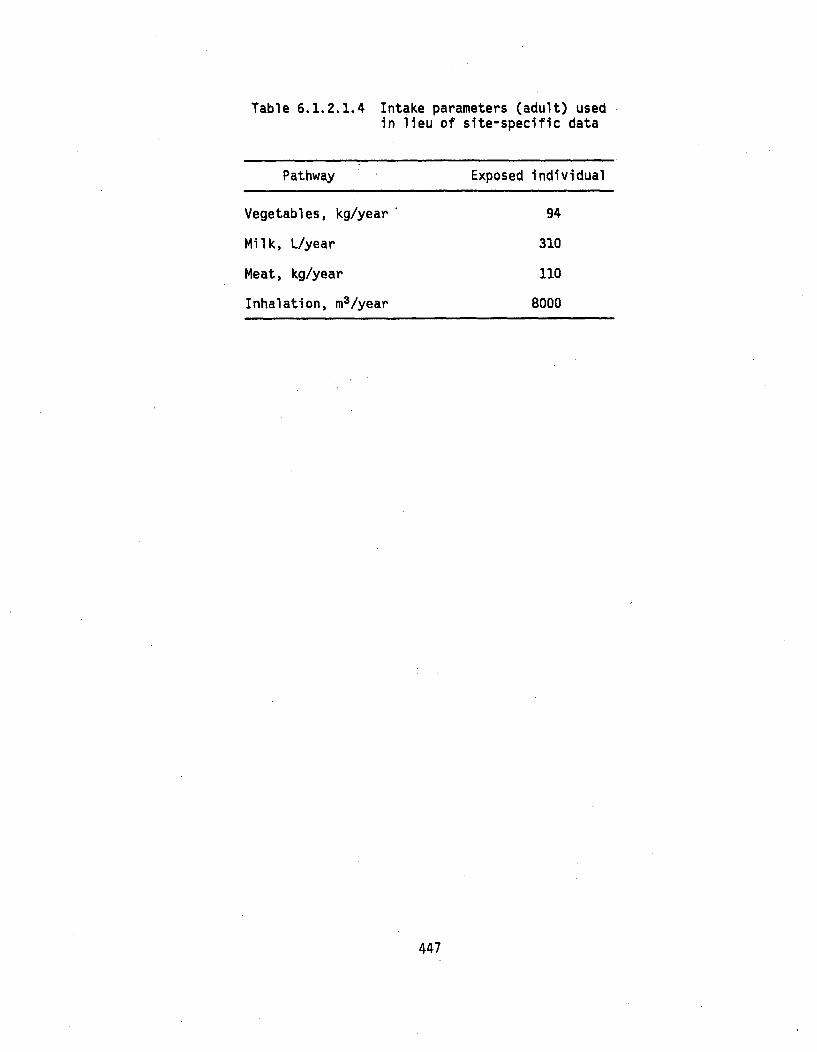
Table 6.1.2.1.4 Intake parameters (adult) usedin lieu of site-specific data
Pathway Exposed individual
Vegetables, kg/year 94
Milk, L/year 310
Meat, kg/year 110
Inhalation, m3/year 8000
447
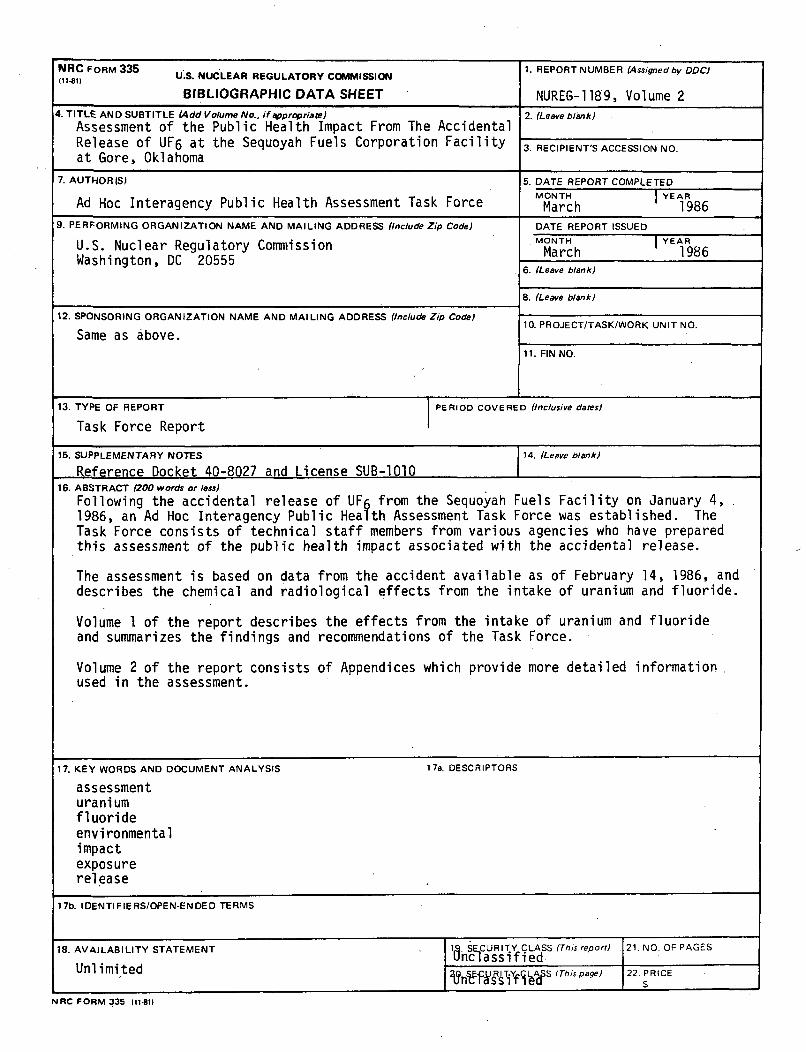
NRC FORM 335 U~.NCERRGLTR OMSIN1. REPORT N UMBER (A ssigned by DDC)
BIBLIOGRAPHIC DATA SHEET NUREG-1189, Volume 24. TITLE AND SUBTITLE (Add Volume No., if epropriate) 2. (Leave blank)
Assessment of the Public Health Impact From The AccidentalRelease of UF6 at the Sequoyah Fuels Corporation Facility 3. RECIPIENT'S ACCESSION NO.at Gore, Oklahoma
7. AUTHORIIS) 5. DATE REPORT COMPLETED
Ad Hoc Interagency Public Health Assessment Task Force MarcH 1986
9. PERFORMING ORGANIZATION NAME AND MAILING ADDRESS (Include Zip Code) DATE REPORT ISSUED
U.S. Nuclear Regulatory Commission MarcH 1986Washington, DC 20555 6.(Laveh blank
8. (Leave blank)
12. SPONSORING ORGANIZATION NAME AND MAILING ADDRESS (Include Zip Code) 1.POETTS/OKUI O
Same as above. ________________
11. FIN NO.
13. TYPE OF REPORT JPERIOD COVERED (Inclusive dates)
Task Force Report
I5. SUPPLEMENTARY NOTES 14. (Leave blank)
Reference Docket 40-8027 and License SUB-1010 I16. ABSTRACT (200 words or less)
Following the accidental release of UF6 from the Sequoyah Fuels Facility on January 4,1986, an Ad Hoc Interagency Public Health Assessment Task Force was established. TheTask Force consists of technical staff members from various agencies who have preparedthis assessment of the public health impact associated with the accidental release.
The assessment is based on data from the accident available as of February 14, 1986, anddescribes the chemical and radiological effects from the intake of uranium and fluoride.
Volume I of the report describes the effects from the intake of uranium and fluorideand summarizes the findings and recommendations of the Task Force.
Volume 2 of the report consists of Appendices which provide more detailed information.used in the assessment.
17. KEY WORDS AND DOCUMENT ANALYSIS 17a. DESCRIPTORS
assessmenturaniumfluorideenvironmental
iimpactexposurerel ease
17b. IDENTI FIE RS/OPEN-ENDE D TERMS
18. AVAILABILITY STATEMENT 1.SCRIY CLASS (This report) 21. NO. OF PAGES
Unlimilted 2h~fTATYfLAcP Ti ae 22. PRICEeCPS This age) S
NRIC FORM 335 11141)

THIS DOCUMENT WAS PRINTED USING RECYCLED PAPER


UNITED STATESNUCLEAR REGULATORY COMMISSION
WASHINGTON, DC 20555-000 1
OFFICIAL BUSINESS


![NUREG-75/087, [2:4] Chpt 4 - 7, "Standard Review Plan for ...](https://static.fdokumen.com/doc/165x107/631f39ec4573ad0c3e02f61b/nureg-75087-24-chpt-4-7-standard-review-plan-for-.jpg)