Gas Vesicles - NCBI
51
MICROBIOLOGICAL REVIEWS, Mar. 1994, p. 94-144 Vol. 58, No. 1 0146-0749/94/$04.00+0 Copyright C 1994, American Society for Microbiology Gas Vesicles ANTHONY E. WALSBY Department of Botany, University of Bristol, Bristol BS8 1UG, England INTRODUCTION ................................................ 95 Gas Vacuole and Gas Vesicle ................................................ 96 MOLECULAR STUDIES ON GAS VESICLE PROTEINS ................................................ 96 Gas Vesicle Proteins in Cyanobacteria ................................................ 97 The small rib protein, GvpA ................................................ 97 The encoding gene, gvpA ................................................ 98 The large outer surface protein, GvpC ................................................. 99 Function of GvpC: strengthening the gas vesicle ................................................ 100 GvpC in other cyanobacteria................................................ 100 Other gvp genes ................................................ 100 Relative proportions of gas vesicle proteins ................................................ 101 Gas Vesicle Proteins in Other Bacteria................................................ 102 Gas Vesicle Proteins in Halobacteria ................................................ 102 Halobacterium GvpA................................................ 102 Gas vesicle proteins encoded by other genes ................................................ 103 (i) GvpC ................................................ 103 (ii) GvpJ and GvpM ................................................ 104 (iii) GvpD ................................................ 104 CRYSTALLINE STRUCTURE OF THE GAS VESICLE WALL ................................................ 105 Wall Thickness ................................................ 105 Periodicities of the Ribs ................................................ 105 Periodicities along the Ribs................................................ 105 The Subunit ................................................ 105 Speculations on the Structure of GvpA ................................................ 106 Antiparallel I-sheet ................................................ 106 Extent of ,B-sheet ................................................ 106 Explanation for the angle of the 1-sheet................................................ 106 Length of the -chains ................................................ 107 Direction of I-chains in each layer................................................. 107 Other unresolved features ................................................ 107 Speculations on How GvpC Binds to Gas Vesicle Ribs ................................................. 107 MORPHOLOGY OF GAS VESICLES ................................................ 108 Description of Gas Vesicle Morphology ................................................. 108 Gas vesicle width ................................................ 108 Gas vesicle end caps ................................................ 108 How the Gas Vesicle Forms and Grows ................................................ 109 Growth from biconical initials ................................................ 109 Speculations on the assembly process ................................................ 110 What Determines Diameter and Length of the Gas Vesicle?................................................ 110 Diameter .................................................110 Length.................................................111 PHYSICAL PROPERTIES OF GAS VESICLES .................................................111 A Model for the Gas Vesicle: a Pair of Flowerpots ................................................ 111 Gas Permeability of Gas Vesicles ................................................ 112 Which gases can diffuse into the gas vesicle?................................................ 112 How quickly does gas get into the gas vesicle? ................................................ 112 Can the gas vesicle provide a gas diffusion channel? ................................................ 113 Pores in the gas vesicle wall................................................ 113 Mechanics of the Gas Vesicle ................................................ 114 Rigidity and elastic compressibility ................................................. 114 Young's modulus of the gas vesicle wall................................................ 115 Mode of gas vesicle collapse................................................. 116 Critical pressure ................................................ 116 Buckling pressure ................................................ 117 Yield stress: exploding gas vesicles ................................................. 117 94 Mechanical properties at the molecular level.................................. 117 Gas vesicle collapse in cells: turgor pressure .................................. 118
-
Upload
khangminh22 -
Category
Documents
-
view
2 -
download
0
Transcript of Gas Vesicles - NCBI
MICROBIOLOGICAL REVIEWS, Mar. 1994, p. 94-144 Vol. 58, No. 10146-0749/94/$04.00+0Copyright C 1994, American Society for Microbiology
Gas VesiclesANTHONY E. WALSBY
Department of Botany, University of Bristol, Bristol BS8 1UG, England
INTRODUCTION................................................ 95Gas Vacuole and Gas Vesicle................................................ 96
MOLECULAR STUDIES ON GAS VESICLE PROTEINS ................................................ 96Gas Vesicle Proteins in Cyanobacteria ................................................ 97The small rib protein, GvpA ................................................ 97The encoding gene, gvpA ................................................ 98The large outer surface protein, GvpC ................................................. 99Function of GvpC: strengthening the gas vesicle ................................................ 100GvpC in other cyanobacteria................................................ 100Other gvp genes................................................ 100Relative proportions of gas vesicle proteins ................................................ 101
Gas Vesicle Proteins in Other Bacteria................................................ 102Gas Vesicle Proteins in Halobacteria ................................................ 102
Halobacterium GvpA................................................ 102Gas vesicle proteins encoded by other genes ................................................ 103
(i) GvpC ................................................ 103(ii) GvpJ and GvpM................................................ 104(iii) GvpD................................................ 104
CRYSTALLINE STRUCTURE OF THE GAS VESICLE WALL................................................ 105Wall Thickness ................................................ 105Periodicities of the Ribs................................................ 105Periodicities along the Ribs................................................ 105The Subunit ................................................ 105Speculations on the Structure of GvpA................................................ 106
Antiparallel I-sheet................................................ 106Extent of ,B-sheet................................................ 106Explanation for the angle of the 1-sheet................................................ 106Length of the -chains................................................ 107Direction of I-chains in each layer................................................. 107Other unresolved features ................................................ 107
Speculations on How GvpC Binds to Gas Vesicle Ribs ................................................. 107MORPHOLOGY OF GAS VESICLES ................................................ 108
Description of Gas Vesicle Morphology ................................................. 108Gas vesicle width................................................ 108Gas vesicle end caps................................................ 108
How the Gas Vesicle Forms and Grows ................................................ 109Growth from biconical initials................................................ 109Speculations on the assembly process ................................................ 110
What Determines Diameter and Length of the Gas Vesicle?................................................ 110Diameter.................................................110Length.................................................111
PHYSICAL PROPERTIES OF GAS VESICLES.................................................111A Model for the Gas Vesicle: a Pair of Flowerpots ................................................ 111Gas Permeability of Gas Vesicles ................................................ 112Which gases can diffuse into the gas vesicle?................................................ 112How quickly does gas get into the gas vesicle? ................................................ 112Can the gas vesicle provide a gas diffusion channel? ................................................ 113Pores in the gas vesicle wall................................................ 113
Mechanics of the Gas Vesicle................................................ 114Rigidity and elastic compressibility ................................................. 114Young's modulus of the gas vesicle wall................................................ 115Mode of gas vesicle collapse................................................. 116Critical pressure ................................................ 116Buckling pressure ................................................ 117Yield stress: exploding gas vesicles ................................................. 117
94
Mechanical properties at the molecular level.................................. 117Gas vesicle collapse in cells: turgor pressure.................................. 118

GAS VESICLES 95
Surface Properties of the Gas Vesicle................................................................... 120Outer surface................................................................... 120Inner surface ................................................................... 120
Buoyant Density of the Gas Vesicle ................................................................... 121Packing fraction of gas vesicles ................................................................... 121
Interactions of Gas Vesicles with Light................................................................... 121Light scattering by isolated gas vesicles................................................................... 122Light interactions with gas vacuoles in cells ................................................................... 122Measurements of light scattering by gas-vacuolate cell suspensions..........................................................123Light scattering by gas-vacuolate cell suspensions and waterblooms .........................................................123
PHYSIOLOGY OF BUOYANCY REGULATION AND GAS VESICLE REGULATION.................................124Density of Bacterial Cells .................................................................... 124Measurement of cell density.................................................................... 124Amount of gas vesicles required for buoyancy ................................................................... 124
Regulation of Gas Vesicles and Buoyancy in Planktonic Cyanobacteria........................................................124Quantitative determination of the cause of buoyancy change................................................................... 124Regulation of gas vesicle production................................................................... 125Gas vesicle collapse by turgor pressure ................................................................... 126Accumulation of carbohydrate ballast ................................................................... 126
Gas Vesicle Formation in Hormogonia of Cyanobacteria.................................................................... 126Gas Vesicle Regulation in Other Bacteria ................................................................... 127
Regulation in heterotrophic bacteria ................................................................... 127Regulation in phototropic bacteria ................................................................... 127
ECOLOGICAL STUDIES ON GAS-VACUOLATE ORGANISMS ................................................................... 127Role of Buoyancy in Cyanobacteria................................................................... 127Buoyancy regulation by cyanobacteria in lakes ................................................................... 128
Role of Buoyancy in Other Gas-Vacuolate Microorganisms ................................................................... 129Photosynthetic bacteria ................................................................... 129Halobacteria ................................................................... 129Heterotrophic bacteria ................................................................... 131Obligate anaerobes ................................................................... 131
Adaptation of Gas Vesicles to Different Pressures ................................................................... 131Correlation between pressure in the natural habitat and p .................................................................. 132
(i) Shallow hypersaline pools ................................................................... 132(ii) A brine lake................................................................... 132(iii) Freshwater lakes ................................................................... 132(iv) Oceans................................................................... 132
VARIATION AND EVOLUTION OF GAS VESICLES................................................................... 133"How the Anabaena Got Her Gas Vesicle"................................................................... 133Phylogeny of Gas Vesicles................................................................... 133
Antiquity or lateral transfer9....................................................................133Possible origin from viruses or other structures ................................................................... 135
Speculations on Evolution of Gas Vesicle Morphology ................................................................... 135Modifications of GvpA ................................................................... 135Multiple copies of the gvpA gene .................................................................... 135Modifications of GvpC .................................................................... 136
Natural Selection of the Gas Vesicle................................................................... 136Natural selection of gas vesicles of different widths ................................................................... 136Gas vesicle versus flagellum................................................................... 137
(i) Occurrence ................................................................... 137(ii) Sustained upward movement................................................................... 137(iii) Cost ................................................................... 138
CODA ................................................................... 138ACKNOWLEDGMENTS ................................................................... 139REFERENCES ................................................................... 139
INTRODUCTION 242), from at least 5 of the 11 phyla of bacteria and 2 of thephyla of archaea described by Woese (276). In all of the
Of the many types of organelles and subcellular structures organisms investigated, gas vesicles have a similar morphologythat have evolved in procaryotic organisms, only one, the gas and are constructed from a homologous protein. They showvesicle, contains a gas-filled space. Gas vesicles occur almost considerable diversity, however, in one aspect, their width. Theexclusively in microorganisms from aquatic habitats, in which, understanding of this has required studies of the chemistry andby lowering the density of the cells, they provide buoyancy. mechanics of gas vesicles, the molecular biology of the proteinsThey have been found in over 150 species of procaryotes (241, that form them, their buoyancy-providing role, and the ecology
VOL. 58, 1994

96 WALSBY
of the organisms in which they occur. The purpose of thisreview is to describe these studies and explain how naturalselection has shaped the gas vesicle in various procaryotes.
In concentrating on the study of a small corner of biology,there is always the hope that one may uncover information thatcan be applied more widely in the subject. The studies on gasvesicles have made contributions to a number of fields inmicrobiology: they have explained how certain aquatic micro-organisms form surface waterblooms or position themselves inlakes (127, 231); they have provided a method of measuringcell turgor pressure in bacteria (178, 230, 239); and they haveprovided a means of determining the rate at which gasesdiffuse into cells (246).The studies on natural selection of the gas vesicle, rather
than establishing new principles, have drawn heavily on exist-ing ones from many other areas of science. In doing so, theyhave provided an account of each step in the process by whichselection for a specific trait in the phenotype may enrich theincidence of the genotype that specifies it. This approach mightbe used to analyze the evolution of other structures.
Gas Vacuole and Gas Vesicle
Gas vesicles are the components of gas vacuoles, which werediscovered in cells of waterbloom-forming cyanobacteria byGerman microbiologists nearly a century ago (3, 113, 208).Klebahn (113) showed that gas vacuoles contain gas andprovide cells with buoyancy (114-116). He found that theycould be distinguished from other cell constituents in the lightmicroscope by their disappearance under pressure (114).Structures with similar properties in other planktonic bacteriawere demonstrated by Lauterborn (146). These early studieson gas vacuoles were reviewed in 1941 by Fogg (62).The current era of research on gas vacuoles was launched in
1965, when Bowen and Jensen (20) found that the gas vacuolesin cyanobacteria were made up of stacks of cylindrical vesiclesmeasuring 75 nm in diameter and up to 1.0 ,um in length. Thecylinders, closed by conical ends, were formed by a single walllayer only 2 nm thick. Cells that had been subjected to apressure of 0.7 MPa (7 bars) had lost these cylindrical struc-tures; in their place were paired membranes, which werecorrectly interpreted as the collapsed vesicles. Bowen andJensen called the structures gas vesicles. Over the next 5 or 6years the principal properties and functions of gas vesicleswere determined, and I reviewed these findings for this journalin 1972 (231). Many of them were based on flimsy evidence,but, as this review will show, almost all of them remain tenable.The present state of knowledge can be summarized as follows.Gas vesicles are inert, hollow, gas-filled structures, formed
solely from protein (104, 256). The main constituent is a smallhydrophobic protein arranged in a linear crystalline array (15)along ribs that form the cylindrical shell and its conical caps(108). A second protein, which has a repeating amino acidsequence, adheres to the outside of the ribs and stabilizes thestructure (258). The genes that encode these proteins havebeen isolated and sequenced, first in cyanobacteria (37, 210)and then in halobacteria (39, 90). The gas vesicle is freelypermeable to gases and cannot be inflated by gas (228). Thegas space must be formed by the way in which the proteinsassemble; it rapidly fills with gas by diffusion. Liquid water iskept out by surface tension at the hydrophobic inner surface.Pressures on the gas vesicle are borne by the rigid wall and donot compress the gas inside the structure (244). The gas vesicleis capable of withstanding pressures of several bars, but at acertain critical pressure it collapses irreversibly (230). Thecritical pressure is determined by the mechanical properties of
the protein (252) and by the diameter of the cylindricalstructure (86, 254).Gas vesicles occur almost exclusively in procaryotes from
aquatic habitats. Their function is to provide buoyancy (231),which allows aerophilic bacteria to float into oxygenatedsurface waters (171, 234) and enables cyanobacteria to float uptoward the light; some cyanobacteria and photosynthetic bac-teria regulate buoyancy provided by their gas vacuoles and theystratify in layers below the water surface. The mechanisms ofbuoyancy regulation in cyanobacteria may involve modulationof gas vesicle gene expression and the destruction of gasvesicles by turgor pressure (which can be measured by usinggas vesicles as pressure probes); they also involve counteract-ing effects of changes in carbohydrates and other densesubstances. These mechanisms are affected by light, and thisexplains how these organisms regulate their vertical distribu-tion in natural waters (248).
It is in the natural environment of ponds, lakes, and seas thatgas vesicles have evolved; it is proposed that two counteractingfactors have been involved in the natural selection of theirwidth. The amount of gas space enclosed by gas vesicle proteinincreases with the width of a gas vesicle. There should there-fore have been selection for wide gas vesicles, which providebuoyancy with greater economy than narrow ones. For me-chanical reasons, however, the critical collapse pressure of agas vesicle varies inversely with its width. The highest pressureto which organisms will be exposed in their natural habitatmust therefore have set an upper limit on the width of their gasvesicles. Put simply, the greater the depth of the water columnin a lake or sea (and the higher the cell turgor pressure), thenarrower the gas vesicle must be to withstand the pressure.
Natural selection, the differential survival and perpetuationof phenotypes, requires inheritance through genotypes thatencode the phenotype in the next generation (55). The widthof the gas vesicle is genetically controlled; it is possiblydetermined by the sequence of the main gas vesicle protein,but it may be modulated by the products of some of the othergenes involved in gas vesicle production. The results of trans-formation experiments in halobacteria (58, 91) strongly suggestthat a cluster of only 14 genes carries all the informationrequired for the production and regulation of gas vesicles. Thenatural selection of the gas vesicle may therefore be limited tothe few phenotypic characters encoded by these genes. Thestory of the natural selection of gas vesicles is no longer openended but circumscribed; it is now necessary to consider thedetails. The account that follows deals mainly with gas vesiclesof cyanobacteria. Much of what has been learnt about theirstructure and properties must be applicable to gas vesicles inother procaryotes, but the way these organelles interact in thegrowth and ecology of other organisms is largely unexplored.
MOLECULAR STUDIES ON GAS VESICLE PROTEINS
There are at least two types of protein present in thecyanobacterial gas vesicle; a small hydrophobic protein(GvpA) forms the ribs of the main structure, and a larger,more hydrophilic protein (GvpC) stabilizes the structure.There may, in addition, be variants of the small proteinpresent. Genetic analysis of halobacteria gives evidence of thesame two classes of protein and indicates that there are asmany as 14 genes involved in gas vesicle formation. Theproducts of some of these genes may form minor componentsof the gas vesicle while others may be involved in assembly orregulation. A transformation system that provides the meansof investigating the role of these genes has recently beendeveloped.
MICROBIOL. REV.

GAS VESICLES 97
FIG. 1. Transverse section of a dividing cell of the cyanobacterium Microcystis sp. showing hexagonal stacking of the cylindrical gas vesicles.(Micrograph by H. S. Pankratz.) Magnification, x 31,500.
Gas Vesicle Proteins in CyanobacteriaThe small rib protein, GvpA. All cyanobacterial gas vesicles
so far analyzed contain a protein (GvpA) of about 7.4 kDa thatforms the main mass of the structure and must be responsiblefor many of its properties. The complete amino acid sequenceof this protein has been determined by performing automatedN-terminal analysis on samples of gas vesicles and peptidespurified from tryptic digests of gas vesicles. The first sequences,
from Microcystis aeruginosa gas vesicles (270), revealed the firstfour residues, Ala-Val-Glu-Lys, and short sequences of severalother nonoverlapping peptides. With improvements in auto-mated sequencing, we determined the first 64 residues fromthree overlapped peptides from the gas vesicles of Anabaenaflos-aquae (227) and then the final overlap with the 15-residueC-terminal peptide, indicating a 70-residue protein (87, 226).With gas phase sequencing it became possible to obtain
VOL. 58, 1994
98 WALSBY
Aphanizomenonflos-aquae ---.--8--SL I *X I t0X:PV VSL:V GAnabaenafios-aquae ...................
VCalothixsp.Pseudanabaenasp. :VZ:ES3SLIVE:.LK03t:~ AWV.........Oscillaloriaagardhi ................................ .......
Spirulinasp. R.4.yES85kV: ~ -:.V:::-WVAV$LVQMlcrocysis sp. X xC~BK xL:::: iiRL K ?r.VS VDactylococcopsissfilna AV 38BL1I:V I.V(.E-rV~V$LAmoebobacterpendens A-K A NS T D:f:S:S KLZ- .:K.::V..V ..............LHalobacteriumhalobium AQP D$ LAt.:VTLD:VDKVVRvLV
40 50 60 70
Ana. XIAK.'LAXtK: .KYL V0Z
Cnal. K .L........
wihprisionfroDteubiser
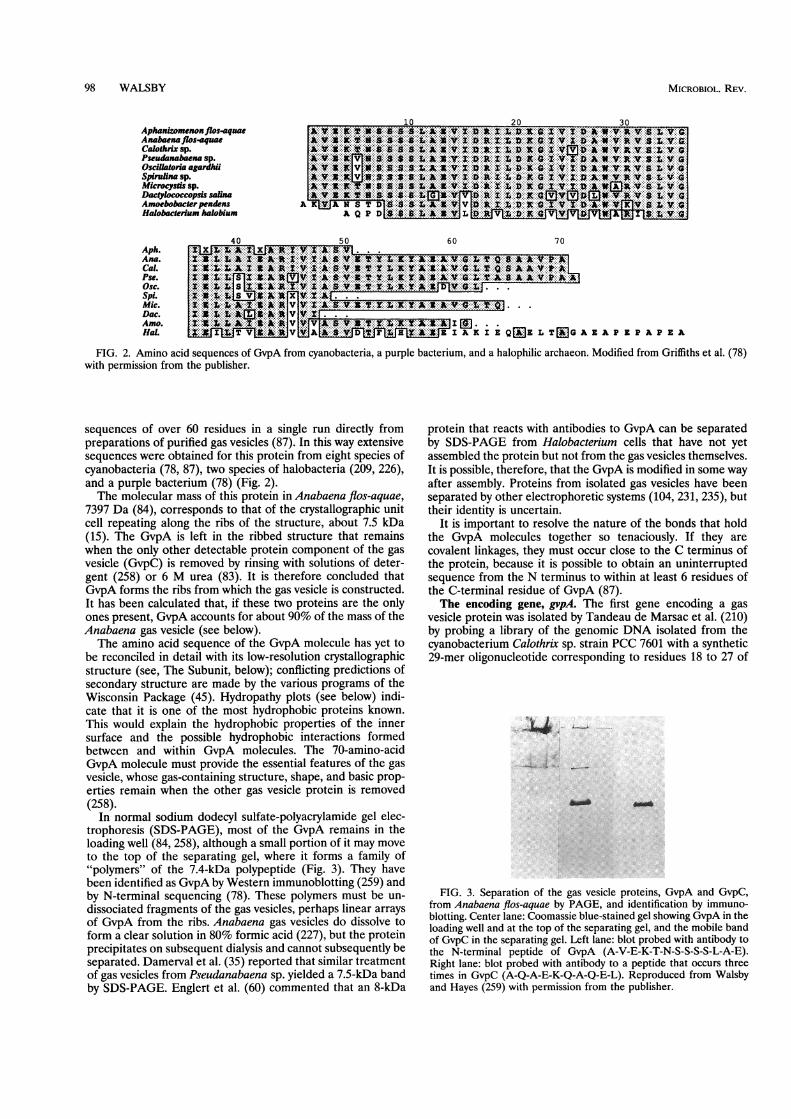
sequences of over 60 residues in a single run directly frompreparations of purified gas vesicles (87). In this way extensivesequences were obtained for this protein from eight species ofcyanobacteria (78, 87), two species of halobacteria (209, 226),and a purple bacterium (78) (Fig. 2).The molecular mass of this protein in Anabaena flos-aquae,
7397 Da (84), corresponds to that of the crystallographic unitcell repeating along the ribs of the structure, about 7.5 kDa(15). The GvpA is left in the ribbed structure that remainswhen the only other detectable protein component of the gasvesicle (GvpC) is removed by rinsing with solutions of deter-gent (258) or 6 M urea (83). It is therefore concluded thatGvpA forms the ribs from which the gas vesicle is constructed.It has been calculated that, if these two proteins are the onlyones present, GvpA accounts for about 90% of the mass of theAnabaena gas vesicle (see below).
The amino acid sequence of the GvpA molecule has yet tobe reconciled in detail with its low-resolution crystallographicstructure (see, The Subunit, below); conflicting predictions ofsecondary structure are made by the various programs of theWisconsin Package (45). Hydropathy plots (see below) indi-cate that it is one of the most hydrophobic proteins known.This would explain the hydrophobic properties of the innersurface and the possible hydrophobic interactions formedbetween and within GvpA molecules. The 70-amino-acidGvpA molecule must provide the essential features of the gasvesicle, whose gas-containing structure, shape, and basic prop-erties remain when the other gas vesicle protein is removed(258).
In normal sodium dodecyl sulfate-polyacrylamide gel elec-trophoresis (SDS-PAGE), most of the GvpA remains in theloading well (84, 258), although a small portion of it may moveto the top of the separating gel, where it forms a family of"polymers" of the 7.4-kDa polypeptide (Fig. 3). They havebeen identified as GvpA by Western immunoblotting (259) andby N-terminal sequencing (78). These polymers must be un-dissociated fragments of the gas vesicles, perhaps linear arraysof GvpA from the ribs. Anabaena gas vesicles do dissolve toform a clear solution in 80% formic acid (227), but the proteinprecipitates on subsequent dialysis and cannot subsequently beseparated. Damerval et al. (35) reported that similar treatmentof gas vesicles from Pseudanabaena sp. yielded a 7.5-kDa bandby SDS-PAGE. Englert et al. (60) commented that an 8-kDa
protein that reacts with antibodies to GvpA can be separatedby SDS-PAGE from Halobacterium cells that have not yetassembled the protein but not from the gas vesicles themselves.It is possible, therefore, that the GvpA is modified in some wayafter assembly. Proteins from isolated gas vesicles have beenseparated by other electrophoretic systems (104, 231, 235), buttheir identity is uncertain.
It is important to resolve the nature of the bonds that holdthe GvpA molecules together so tenaciously. If they arecovalent linkages, they must occur close to the C terminus ofthe protein, because it is possible to obtain an uninterruptedsequence from the N terminus to within at least 6 residues ofthe C-terminal residue of GvpA (87).The encoding gene, gvpA. The first gene encoding a gas
vesicle protein was isolated by Tandeau de Marsac et al. (210)by probing a library of the genomic DNA isolated from thecyanobacterium Calothrix sp. strain PCC 7601 with a synthetic29-mer oligonucleotide corresponding to residues 18 to 27 of
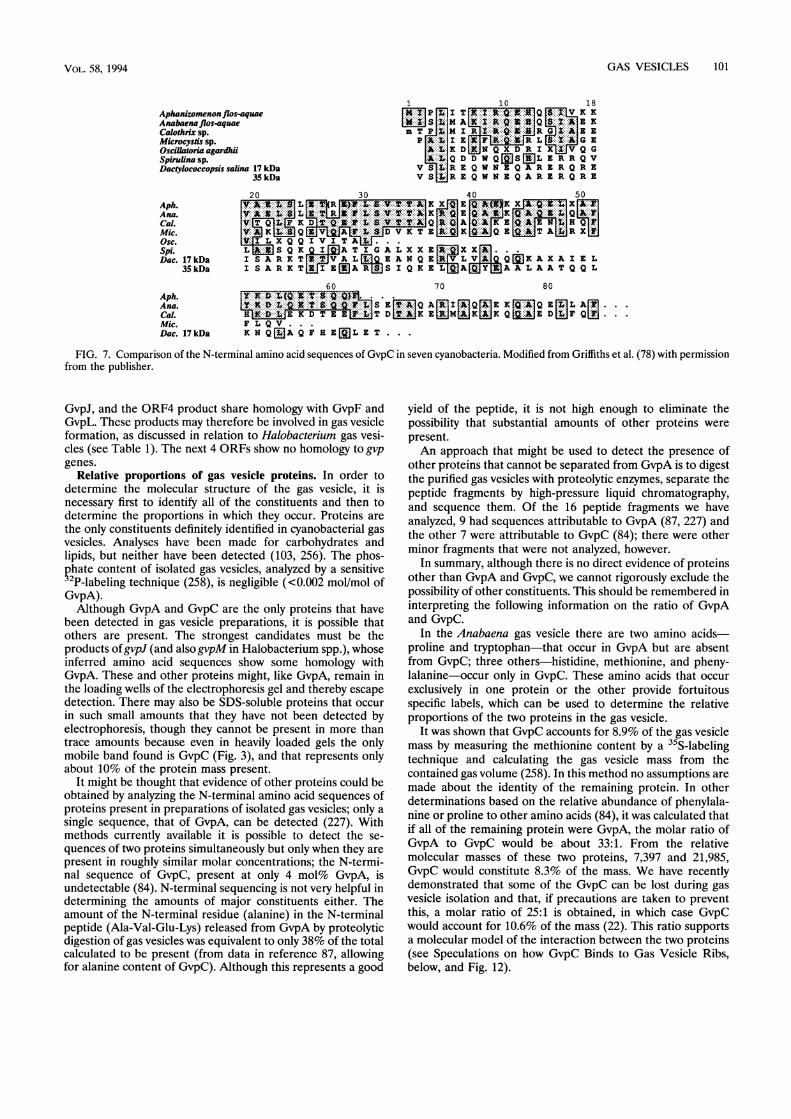
FIG. 3. Separation of the gas vesicle proteins, GvpA and GvpC,from Anabaena flos-aquae by PAGE, and identification by immuno-blotting. Center lane: Coomassie blue-stained gel showing GvpA in theloading well and at the top of the separating gel, and the mobile bandof GvpC in the separating gel. Left lane: blot probed with antibody tothe N-terminal peptide of GvpA (A-V-E-K-T-N-S-S-S-S-L-A-E).Right lane: blot probed with antibody to a peptide that occurs threetimes in GvpC (A-Q-A-E-K-Q-A-Q-E-L). Reproduced from Walsbyand Hayes (259) with permission from the publisher.
MICROBIOL. REV.

GAS VESICLES 99
a gvpA gvpB gvpC
WEDI
gvpA gvpA gvpA gvpA gvpC ORF1 ORF2 ORF3 ORF4
F_ZZZ UZZ EZZbFIG. 4. Arrangement of gvp genes in cyanobacteria. (a) The gvpABC operon of Calothrix sp. (37), showing the transcripts (arrows) from the
coding strand and an antisense transcript from the noncoding strand gvpB is renamed gvpA2. Redrawn from Csiszar et al. (33) with permissionfrom the publisher. (b) The cluster ofgvp genes in Anabaena fios-aquae, which contains an operon of at least five gvpA genes (four are shown) anda single gvpC gene that is followed by a cluster of four ORFs that show homology to the following gvp genes in Halobacterium halobium: ORF1(gvpN), ORF2 (gvpJ and gvpA), ORF3 (gvpK and gvpJ), ORF4 (gvpF and gvpL). Drawn to the same scale as panel a; the length shown is 6.25 kbp.Unpublished data of Kinsman and Hayes (109a).
the Anabaena amino acid sequence (Fig. 2). The gene, gvpA,encoded a 70-residue protein that showed very high homologyto the Anabaena gas vesicle protein (Fig. 2). By using theCalothrix gvpA gene as a probe, the homologous genes havenow been isolated and sequenced from two other cyanobacte-ria, Anabaena (259) and Pseudanabaena (35) species, a color-less bacterium, Ancylobacter aquaticus (21a), and two Halobac-terium species (39, 90, 209).
In Calothrix species there are two genes in tandem repeat,originally termed gvpA and gvpB (37) but now redesignatedgvpAl and gvpA2, respectively, because they encode identical70-residue GvpA proteins; i.e., there is no distinguishableGvpB protein product (Fig. 4).
In Pseudanabaena sp., a filamentous cyanobacterium thatproduces rather small amounts of gas vesicles next to the cellsepta, only one copy ofgvpA has been found (35). InAnabaenaflos-aquae, a planktonic cyanobacterium that constitutivelyproduces large numbers of gas vesicles, there is evidence of atleast five, and probably seven, copies of the gvpA gene intandem repeat (82a), but all four of those so far sequencedencode identical 70-residue proteins (179a).The large outer surface protein, GvpC. By sequencing
downstream from gvpAl and gvpA2 in Calothrix sp., a thirdopen reading frame (ORF), gvpC, was found by Damerval etal. (37). The deduced amino acid sequence indicated a proteinof 162 amino acid residues; its function was unknown. A gene
Anabaenaflos-aquae GvpCN-terninal sequenceI v.jX:,,SRVL I
IV L.WC-terniinalsequence R Q D L F V S I F C
Calothnrx sp. GvpCN-terminal sequenceIIIII l8gJIK MzAZ N:A'2.:.IV jQNNLQ T NC-teriinal sequence R Q D L F A S I F C
encoding a homologous but somewhat larger protein of 193residues was found downstream of gvpA in Anabaena flos-aquae (84) (Fig. 5).SDS-PAGE of purified Anabaena gas vesicles yielded only a
single mobile band indicating a protein of about 22 kDa.Because only a single amino acid sequence, that of GvpA, hadpreviously been obtained from intact gas vesicles, this band wasinitially confused with GvpA (227), but N-terminal amino acidanalysis of the eluted protein showed a sequence identical tothe deduced N-terminal sequence of the Anabaena gvpC geneproduct (84). Sequence analysis of seven peptides obtained bytrypsin digestion of the protein present in isolated gas vesiclesconfirmed that the product of this gene was a component of thegas vesicle. The size of the separated protein also correspondedto the molecular mass calculated from the inferred sequence ofthe 193-amino-acid gene product, 21,985 Da (Fig. 5).These GvpC proteins are quite different from GvpA. They
are rich in glutamine, alanine, and glutamic acid, whichtogether account for over 40% of the residues, and theycontain over 6% phenylalanine, which is absent from GvpA.Overall they contain a preponderance of hydrophilic residues;the contrasting natures of the two proteins are illustrated bythe hydropathy plots (Fig. 6). The most striking feature ofGvpC is the presence of a highly conserved motif of 33 aminoacid residues, which forms tandem repeats four times in theCalothrix GvpC and five times in the Anabaena protein. As
Anabaenaconsensus Eli E XQET S QiA *L Q A I AQ KK A Q E LLACalothrixconsensus EDQrJKKDjT EM Q
FIG. 5. Amino acid sequences of GvpC from Anabaena flos-aquae (84) and Calothrix sp. (37), showing the 33-amino-acid repeats. Identicalresidues are boxed; the consensus sequences are shaded and compared below. Modified from Walsby and Hayes (259) with permission from thepublisher.
VOL. 58, 1994

100 WALSBY
2
1
na01-
10 20 30 40 50residue number
60residue number
FIG. 6. Hydropathy plots of GvpA and GvpC from Anabaena flos-aquae. Modified from Walsby and Hayes (259) with permission from thepublisher.
discussed below (Speculations on How GvpC Binds to GasVesicle Ribs), they are believed to make a periodic interactionwith the crystalline structure of the ribs formed by GvpA (258).Flanking the tandem repeats are sequences of 18 residues atthe N-terminal end and 10 (in Anabaena flos-aquae) or 12 (inCalothrix sp.) residues at the C-terminal end. All three sectionsof the molecule show homologies between the two species (Fig.5).
Function of GvpC: strengthening the gas vesicle. We foundthat GvpC could be removed from intact gas vesicles isolatedfrom Anabaena flos-aquae; this was done by rinsing them witha 2% solution of the detergent SDS. What remained were thegas-filled shells (formed by the ribs of GvpA), which floatedand could be separated from the detergent solution by centrif-ugation. They resembled entire gas vesicles in most of theirgeneral properties, but they were weaker and collapsed at amuch lower critical pressure (258). The removal of GvpCindicated that this protein must be located on the outside ofthe structure. The weakening of the structure could, in theory,have been caused either by the effect of the detergent on theremaining GvpA or by the removal of GvpC (258).The outer protein could also be removed from isolated gas
vesicles with 6 M urea (83), which resulted in similar weaken-ing. GvpC could then be assembled back onto the stripped gasvesicle shells by dialyzing the urea away. Hayes et al. (83)synthesized Anabaena GvpC by recombinant technology: theprotein was formed in inclusion bodies inside the cells ofEscherichia coli containing the Anabaena gvpC gene on anexpression vector. When this purified recombinant protein wasassembled onto stripped gas vesicles containing only GvpA,the critical pressure of the gas vesicles increased from 0.19 to0.56 MPa, within 3% of its original value (see Critical Pressurebelow) (see Fig. 20). The weakening and recovery of strengthwere reversible and depended on the amount of GvpC that wasbound (83, 258). These experiments proved that the functionof GvpC is to increase the strength of the gas vesicle structure.Kinsman and Hayes (109a) have now used recombinant
techniques to produce a series of three modified GvpCscontaining the first 2, 3, and 4 of the 5 33-residue repeatsbetween the 18 N-terminal residues and 10 C-terminal residuesof the Anabaena protein (Fig. 5). These proteins will, like thecomplete GvpC, bind to and restrengthen stripped gas vesicles.We are now investigating how the number of repeats affectsthe efficiency of the protein.The GvpC must be indispensable to the survival of gas
vesicles in Anabaena sp. because without it all of the gasvesicles would be collapsed by the 0.4-MPa (4-bar) turgorpressure in the cells, even without the additional hydrostatic
pressure of the water column in a lake. As discussed below (seeBuckling Pressure), it might be feasible to make gas vesicles ofthe required strength without GvpC, but they would have to bemuch narrower and would therefore be less efficient in provid-ing buoyancy.The weakening caused by removal of GvpC has also been
demonstrated with the gas vesicles of Microcystis sp. (258) andAphanizomenon sp. They will bind recombinant AnabaenaGvpC, and this partially restores their strength (22).GvpC in other cyanobacteria. In a survey of 26 strains from
six genera of gas-vacuolate cyanobacteria, Damerval and hiscoworkers (34) detected genes that hybridized to the CalothrixgvpA gene in all of them; however, only 12 strains containedgenes hybridizing to the Calothrix gvpC gene. Those strainsthat did were said to make gas vesicles more abundantly. Thestrains that did not must either lackgvpC or possess a homolog(or functional analog) of the gvpC gene whose homology is toolow to permit hybridization (34).We have shown by direct electrophoretic analysis that the
gas vesicles isolated from two unicellular cyanobacteria, twofilamentous forms, and three heterocystous forms contain atleast one additional protein (78). Amino acid sequence anal-ysis showed that these proteins have a much lower homology toone another than do the GvpAs from the same organisms(compare Fig. 2 and 7). In one cyanobacterium investigated,Pseudanabaena sp., no GvpC has been detected on the isolatedgas vesicles and no gene homologous to gvpC has been found,either by hybridization studies or by sequencing downstreamfrom gvpA (35). It is conceivable that GvpC had been presentbut was lost during gas vesicle isolation and that the encodinggene is located further away from the gvpA. If these gas vesicleshave no strengthening GvpC, however, it would be interestingto know how their critical pressure compares with that of othergas vesicles with similar width (254).
Other gyp genes. Elsewhere in the Calothrix chromosome isa gene that encodes a 71-residue protein that differs in only 4residues from GvpA (33a). The amino acid sequence obtainedby gas phase sequencing of entire Calothrix gas vesicles isidentical to the sequence inferred from Calothrix gvpA (87),without any evidence of the four residues specified by the othergvpA-like gene.
Kinsman and Hayes (109a) have sequenced the 6.5-kbregion downstream of gvpC in Anabaena flos-aquae; the se-quence contains eight ORFs (ORF1 to ORF8), the first four ofwhich show homology to gvp genes in Halobacterium halobium:the ORF1 product shows 40% identity to HalobacteriumGvpN, the ORF2 product shares homology with GvpJ andGvpA, the ORF3 product shares homology with GvpK and
(a)'I
hb e A:¼'Wu IV-13 _ _
-2-I
MICROBIOL. REV.
GAS VESICLES 101
Aphanizomenonflos-aquaeAnabaenaflos.aquaeCalothrix sp.Microcysis sp.Oscillatoria agardhiiSpirulina sp.Dactylococcopsis saliuna 17 kDa
35 kDa
1 10 18:. PL I T ........ Q[:..V IK K
L.::2:iSL M A XQ. ......E K
m TjPH:G;M I R .:;QK:R G E1E E.K.: .t. I E | L .X:;G EA, X;I K D NQ X DRI XVQ G[..] Q D D W Q1S L E R R Q V
V SREQWNEQARERQREVS REQWNEQARERQRE
- L=;;- - v __w.:: _ _ _= _ =
N Q E IV L V A;. Q Q ]K A X A I E LQKE LjAgJY[MA AALAATQQL
70
FIG. 7. Comparison of the N-terminal amino acid sequences of GvpC in seven cyanobacteria. Modified from Griffiths et al. (78) with permissionfrom the publisher.
GvpJ, and the ORF4 product share homology with GvpF andGvpL. These products may therefore be involved in gas vesicleformation, as discussed in relation to Halobacterium gas vesi-cles (see Table 1). The next 4 ORFs show no homology to gvpgenes.
Relative proportions of gas vesicle proteins. In order todetermine the molecular structure of the gas vesicle, it isnecessary first to identify all of the constituents and then todetermine the proportions in which they occur. Proteins arethe only constituents definitely identified in cyanobacterial gasvesicles. Analyses have been made for carbohydrates andlipids, but neither have been detected (103, 256). The phos-phate content of isolated gas vesicles, analyzed by a sensitive32P-labeling technique (258), is negligible (<0.002 mol/mol ofGvpA).Although GvpA and GvpC are the only proteins that have
been detected in gas vesicle preparations, it is possible thatothers are present. The strongest candidates must be theproducts ofgvpJ (and alsogvpM in Halobacterium spp.), whoseinferred amino acid sequences show some homology withGvpA. These and other proteins might, like GvpA, remain inthe loading wells of the electrophoresis gel and thereby escapedetection. There may also be SDS-soluble proteins that occurin such small amounts that they have not been detected byelectrophoresis, though they cannot be present in more thantrace amounts because even in heavily loaded gels the onlymobile band found is GvpC (Fig. 3), and that represents onlyabout 10% of the protein mass present.
It might be thought that evidence of other proteins could beobtained by analyzing the N-terminal amino acid sequences ofproteins present in preparations of isolated gas vesicles; only asingle sequence, that of GvpA, can be detected (227). Withmethods currently available it is possible to detect the se-quences of two proteins simultaneously but only when they arepresent in roughly similar molar concentrations; the N-termi-nal sequence of GvpC, present at only 4 mol% GvpA, isundetectable (84). N-terminal sequencing is not very helpful indetermining the amounts of major constituents either. Theamount of the N-terminal residue (alanine) in the N-terminalpeptide (Ala-Val-Glu-Lys) released from GvpA by proteolyticdigestion of gas vesicles was equivalent to only 38% of the totalcalculated to be present (from data in reference 87, allowingfor alanine content of GvpC). Although this represents a good
yield of the peptide, it is not high enough to eliminate thepossibility that substantial amounts of other proteins were
present.An approach that might be used to detect the presence of
other proteins that cannot be separated from GvpA is to digestthe purified gas vesicles with proteolytic enzymes, separate thepeptide fragments by high-pressure liquid chromatography,and sequence them. Of the 16 peptide fragments we haveanalyzed, 9 had sequences attributable to GvpA (87, 227) andthe other 7 were attributable to GvpC (84); there were otherminor fragments that were not analyzed, however.
In summary, although there is no direct evidence of proteinsother than GvpA and GvpC, we cannot rigorously exclude thepossibility of other constituents. This should be remembered ininterpreting the following information on the ratio of GvpAand GvpC.
In the Anabaena gas vesicle there are two amino acids-proline and tryptophan-that occur in GvpA but are absentfrom GvpC; three others-histidine, methionine, and pheny-lalanine-occur only in GvpC. These amino acids that occur
exclusively in one protein or the other provide fortuitousspecific labels, which can be used to determine the relativeproportions of the two proteins in the gas vesicle.
It was shown that GvpC accounts for 8.9% of the gas vesiclemass by measuring the methionine content by a 35S-labelingtechnique and calculating the gas vesicle mass from thecontained gas volume (258). In this method no assumptions aremade about the identity of the remaining protein. In otherdeterminations based on the relative abundance of phenylala-nine or proline to other amino acids (84), it was calculated thatif all of the remaining protein were GvpA, the molar ratio ofGvpA to GvpC would be about 33:1. From the relativemolecular masses of these two proteins, 7,397 and 21,985,GvpC would constitute 8.3% of the mass. We have recentlydemonstrated that some of the GvpC can be lost during gasvesicle isolation and that, if precautions are taken to preventthis, a molar ratio of 25:1 is obtained, in which case GvpCwould account for 10.6% of the mass (22). This ratio supportsa molecular model of the interaction between the two proteins(see Speculations on how GvpC Binds to Gas Vesicle Ribs,below, and Fig. 12).
20L
X,......Ji .....i..x
IVAiKLk.;JIL XQQ
L .A1SQKI S A R K TISARKT
Aph.Ana.Cal.Mic.Osc.Spi.Dac. 17 kDa
35 kDa
Aph.Ana.Cal.Mic.Dac. 17 kDa
F L Q V . . .
K N Q(A Q F H E L E T...
80
VOL. 58, 1994
. .:.T:.:JL. It.'. Q A I A-. Q IL A . . .E K Q EF:T:::K. :vR: M.A K A: K Q [Q:i;'A' E D LI]1- --. IKEM M m
102 WALSBY
H. mediterranei(c-GvpA) V. _ _ _ _ _ _ _ _ __ _ _ _ _ _ _ _ _
H. halobium (c-GvpA) D.................Z B LYH. halobium (p-GvpA) VG V LvRvv.H.halobium(GvpJ) m S D P K P T R S Q G D .LA .R VEVGIDH.halobium(GvpM) LPTKDETEAIVFVaVLADVI AV
T AD
mc-GVPA : X:~ A t AA#VmTA F vXAD I T D
-GvpJ X.:: G. I X .X .... ....... .... .. ...
-PPTG T DM............................... Xp-GvpA 1.4I
GvpM P L I G I L A A I ZWDAA RQQ T A D R
GvpJ P A S Z T Q S Z T Z S T N P L S D D S TGvpM R E D
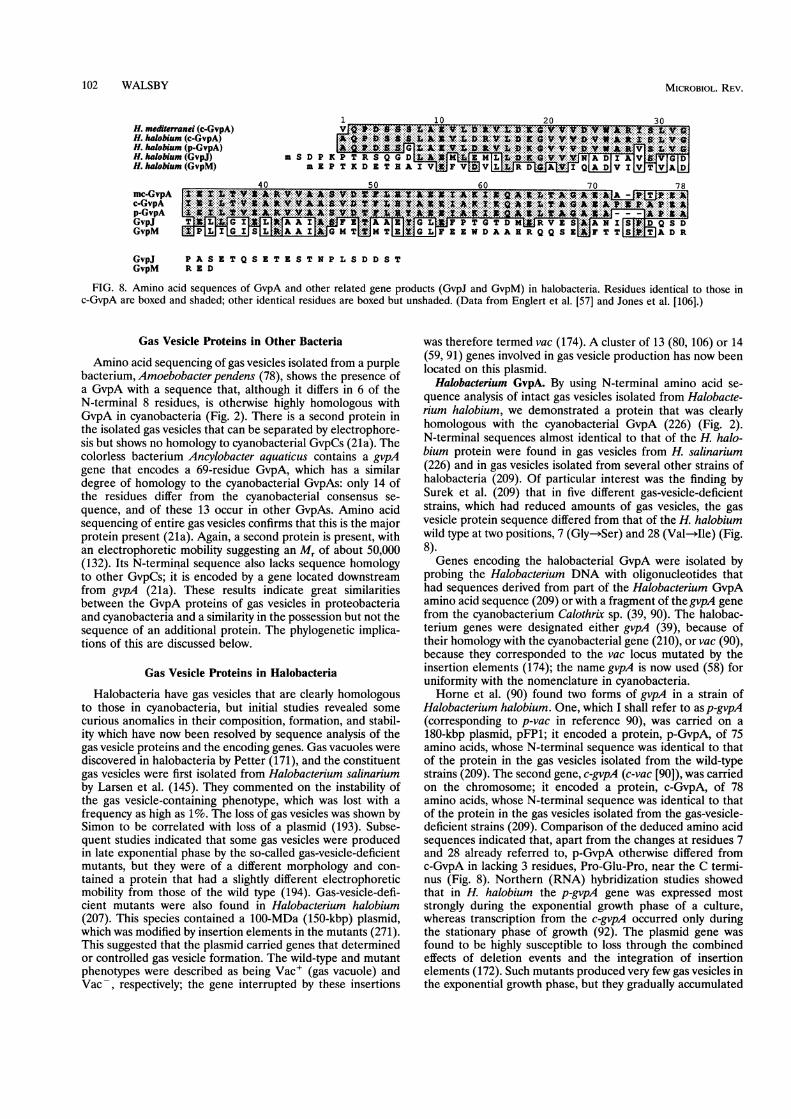
FIG. 8. Amino acid sequences of GvpA and other related gene products (GvpJ and GvpM) in halobacteria. Residues identical to those inc-GvpA are boxed and shaded; other identical residues are boxed but unshaded. (Data from Englert et al. [57] and Jones et al. [106].)
Gas Vesicle Proteins in Other Bacteria
Amino acid sequencing of gas vesicles isolated from a purplebacterium, Amoebobacterpendens (78), shows the presence ofa GvpA with a sequence that, although it differs in 6 of theN-terminal 8 residues, is otherwise highly homologous withGvpA in cyanobacteria (Fig. 2). There is a second protein inthe isolated gas vesicles that can be separated by electrophore-sis but shows no homology to cyanobacterial GvpCs (21a). Thecolorless bacterium Ancylobacter aquaticus contains a gvpAgene that encodes a 69-residue GvpA, which has a similardegree of homology to the cyanobacterial GvpAs: only 14 ofthe residues differ from the cyanobacterial consensus se-quence, and of these 13 occur in other GvpAs. Amino acidsequencing of entire gas vesicles confirms that this is the majorprotein present (21a). Again, a second protein is present, withan electrophoretic mobility suggesting an Mr of about 50,000(132). Its N-terminal sequence also lacks sequence homologyto other GvpCs; it is encoded by a gene located downstreamfrom gvpA (21a). These results indicate great similaritiesbetween the GvpA proteins of gas vesicles in proteobacteriaand cyanobacteria and a similarity in the possession but not thesequence of an additional protein. The phylogenetic implica-tions of this are discussed below.
Gas Vesicle Proteins in Halobacteria
Halobacteria have gas vesicles that are clearly homologousto those in cyanobacteria, but initial studies revealed somecurious anomalies in their composition, formation, and stabil-ity which have now been resolved by sequence analysis of thegas vesicle proteins and the encoding genes. Gas vacuoles werediscovered in halobacteria by Petter (171), and the constituentgas vesicles were first isolated from Halobacterium salinariumby Larsen et al. (145). They commented on the instability ofthe gas vesicle-containing phenotype, which was lost with afrequency as high as 1%. The loss of gas vesicles was shown bySimon to be correlated with loss of a plasmid (193). Subse-quent studies indicated that some gas vesicles were producedin late exponential phase by the so-called gas-vesicle-deficientmutants, but they were of a different morphology and con-tained a protein that had a slightly different electrophoreticmobility from those of the wild type (194). Gas-vesicle-defi-cient mutants were also found in Halobacterium halobium(207). This species contained a 100-MDa (150-kbp) plasmid,which was modified by insertion elements in the mutants (271).This suggested that the plasmid carried genes that determinedor controlled gas vesicle formation. The wild-type and mutantphenotypes were described as being Vac+ (gas vacuole) andVac-, respectively; the gene interrupted by these insertions
was therefore termed vac (174). A cluster of 13 (80, 106) or 14(59, 91) genes involved in gas vesicle production has now beenlocated on this plasmid.Halobacterium GvpA. By using N-terminal amino acid se-
quence analysis of intact gas vesicles isolated from Halobacte-rium halobium, we demonstrated a protein that was clearlyhomologous with the cyanobacterial GvpA (226) (Fig. 2).N-terminal sequences almost identical to that of the H. halo-bium protein were found in gas vesicles from H. salinarium(226) and in gas vesicles isolated from several other strains ofhalobacteria (209). Of particular interest was the finding bySurek et al. (209) that in five different gas-vesicle-deficientstrains, which had reduced amounts of gas vesicles, the gasvesicle protein sequence differed from that of the H. halobiumwild type at two positions, 7 (Gly->Ser) and 28 (Val->Ile) (Fig.8).Genes encoding the halobacterial GvpA were isolated by
probing the Halobacterium DNA with oligonucleotides thathad sequences derived from part of the Halobacterium GvpAamino acid sequence (209) or with a fragment of the gvpA genefrom the cyanobacterium Calothrix sp. (39, 90). The halobac-terium genes were designated either gvpA (39), because oftheir homology with the cyanobacterial gene (210), or vac (90),because they corresponded to the vac locus mutated by theinsertion elements (174); the name gvpA is now used (58) foruniformity with the nomenclature in cyanobacteria.Horne et al. (90) found two forms of gvpA in a strain of
Halobacterium halobium. One, which I shall refer to as p-gvpA(corresponding to p-vac in reference 90), was carried on a180-kbp plasmid, pFP1; it encoded a protein, p-GvpA, of 75amino acids, whose N-terminal sequence was identical to thatof the protein in the gas vesicles isolated from the wild-typestrains (209). The second gene, c-gvpA (c-vac [90]), was carriedon the chromosome; it encoded a protein, c-GvpA, of 78amino acids, whose N-terminal sequence was identical to thatof the protein in the gas vesicles isolated from the gas-vesicle-deficient strains (209). Comparison of the deduced amino acidsequences indicated that, apart from the changes at residues 7and 28 already referred to, p-GvpA otherwise differed fromc-GvpA in lacking 3 residues, Pro-Glu-Pro, near the C termi-nus (Fig. 8). Northern (RNA) hybridization studies showedthat in H. halobium the p-gvpA gene was expressed moststrongly during the exponential growth phase of a culture,whereas transcription from the c-gvpA occurred only duringthe stationary phase of growth (92). The plasmid gene wasfound to be highly susceptible to loss through the combinedeffects of deletion events and the integration of insertionelements (172). Such mutants produced very few gas vesicles inthe exponential growth phase, but they gradually accumulated
MICROBIOL. REV.
GAS VESICLES 103
M L K J I HG F E D A C N O
1 kbp
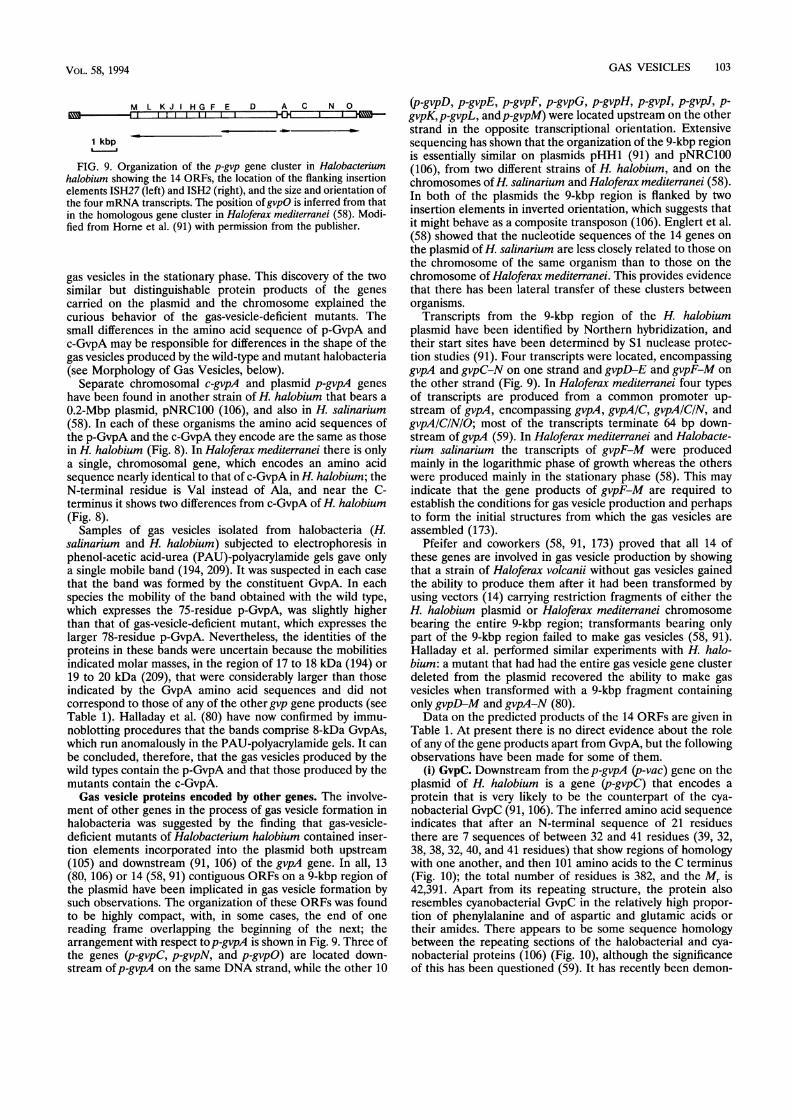
FIG. 9. Organization of the p-gvp gene cluster in Halobacteriumhalobium showing the 14 ORFs, the location of the flanking insertionelementsISH27 (left) andISH2 (right), and the size and orientation ofthe four mRNA transcripts. The position of gvpO is inferred from thatin the homologous gene cluster in Haloferax mediterranei (58). Modi-fied from Horne et al. (91) with permission from the publisher.
gas vesicles in the stationary phase. This discovery of the twosimilar but distinguishable protein products of the genes
carried on the plasmid and the chromosome explained thecurious behavior of the gas-vesicle-deficient mutants. Thesmall differences in the amino acid sequence of p-GvpA andc-GvpA may be responsible for differences in the shape of thegas vesicles produced by the wild-type and mutant halobacteria(see Morphology of Gas Vesicles, below).
Separate chromosomal c-gvpA and plasmid p-gvpA genes
have been found in another strain of H. halobium that bears a
0.2-Mbp plasmid, pNRC100 (106), and also in H. salinarium(58). In each of these organisms the amino acid sequences ofthe p-GvpA and the c-GvpA they encode are the same as thosein H. halobium (Fig. 8). In Haloferax mediterranei there is onlya single, chromosomal gene, which encodes an amino acidsequence nearly identical to that of c-GvpA in H. halobium; theN-terminal residue is Val instead of Ala, and near the C-terminus it shows two differences from c-GvpA of H. halobium(Fig. 8).Samples of gas vesicles isolated from halobacteria (H.
salinarium and H. halobium) subjected to electrophoresis inphenol-acetic acid-urea (PAU)-polyacrylamide gels gave onlya single mobile band (194, 209). It was suspected in each case
that the band was formed by the constituent GvpA. In eachspecies the mobility of the band obtained with the wild type,
which expresses the 75-residue p-GvpA, was slightly higherthan that of gas-vesicle-deficient mutant, which expresses thelarger 78-residue p-GvpA. Nevertheless, the identities of theproteins in these bands were uncertain because the mobilitiesindicated molar masses, in the region of 17 to 18 kDa (194) or
19 to 20 kDa (209), that were considerably larger than thoseindicated by the GvpA amino acid sequences and did not
correspond to those of any of the other gvp gene products (seeTable 1). Halladay et al. (80) have now confirmed by immu-noblotting procedures that the bands comprise 8-kDa GvpAs,which run anomalously in the PAU-polyacrylamide gels. It canbe concluded, therefore, that the gas vesicles produced by thewild types contain the p-GvpA and that those produced by themutants contain the c-GvpA.Gas vesicle proteins encoded by other genes. The involve-
ment of other genes in the process of gas vesicle formation inhalobacteria was suggested by the finding that gas-vesicle-deficient mutants of Halobacterium halobium contained inser-tion elements incorporated into the plasmid both upstream
(105) and downstream (91, 106) of the gvpA gene. In all, 13(80, 106) or 14 (58, 91) contiguous ORFs on a 9-kbp region ofthe plasmid have been implicated in gas vesicle formation bysuch observations. The organization of these ORFs was foundto be highly compact, with, in some cases, the end of one
reading frame overlapping the beginning of the next; thearrangement with respect top-gvpA is shown in Fig. 9. Three ofthe genes (p-gvpC, p-gvpN, and p-gvpO) are located down-stream ofp-gvpA on the same DNA strand, while the other 10
(p-gvpD, p-gvpE, p-gvpF, p-gvpG, p-gvpH, p-gvpI, p-gvpJ, p-gvpK,p-gvpL, and p-gvpM) were located upstream on the otherstrand in the opposite transcriptional orientation. Extensivesequencing has shown that the organization of the 9-kbp regionis essentially similar on plasmids pHH1 (91) and pNRC100(106), from two different strains of H. halobium, and on thechromosomes of H. salinarium and Haloferax mediterranei (58).In both of the plasmids the 9-kbp region is flanked by twoinsertion elements in inverted orientation, which suggests thatit might behave as a composite transposon (106). Englert et al.(58) showed that the nucleotide sequences of the 14 genes onthe plasmid of H. salinarium are less closely related to those onthe chromosome of the same organism than to those on thechromosome of Haloferax mediterranei. This provides evidencethat there has been lateral transfer of these clusters betweenorganisms.
Transcripts from the 9-kbp region of the H. halobiumplasmid have been identified by Northern hybridization, andtheir start sites have been determined by Si nuclease protec-tion studies (91). Four transcripts were located, encompassinggvpA and gvpC-N on one strand and gvpD-E and gvpF-M onthe other strand (Fig. 9). In Haloferax mediterranei four typesof transcripts are produced from a common promoter up-stream of gvpA, encompassing gvpA, gvpAIC, gvpA/CIN, andgvpA/CIN/O; most of the transcripts terminate 64 bp down-stream of gvpA (59). In Haloferax mediterranei and Halobacte-rium salinarium the transcripts of gvpF-M were producedmainly in the logarithmic phase of growth whereas the otherswere produced mainly in the stationary phase (58). This mayindicate that the gene products of gvpF-M are required toestablish the conditions for gas vesicle production and perhapsto form the initial structures from which the gas vesicles areassembled (173).
Pfeifer and coworkers (58, 91, 173) proved that all 14 ofthese genes are involved in gas vesicle production by showingthat a strain of Haloferax volcanii without gas vesicles gainedthe ability to produce them after it had been transformed byusing vectors (14) carrying restriction fragments of either theH. halobium plasmid or Haloferax mediterranei chromosomebearing the entire 9-kbp region; transformants bearing onlypart of the 9-kbp region failed to make gas vesicles (58, 91).Halladay et al. performed similar experiments with H. halo-bium: a mutant that had had the entire gas vesicle gene clusterdeleted from the plasmid recovered the ability to make gasvesicles when transformed with a 9-kbp fragment containingonly gvpD-M and gvpA-N (80).Data on the predicted products of the 14 ORFs are given in
Table 1. At present there is no direct evidence about the roleof any of the gene products apart from GvpA, but the followingobservations have been made for some of them.
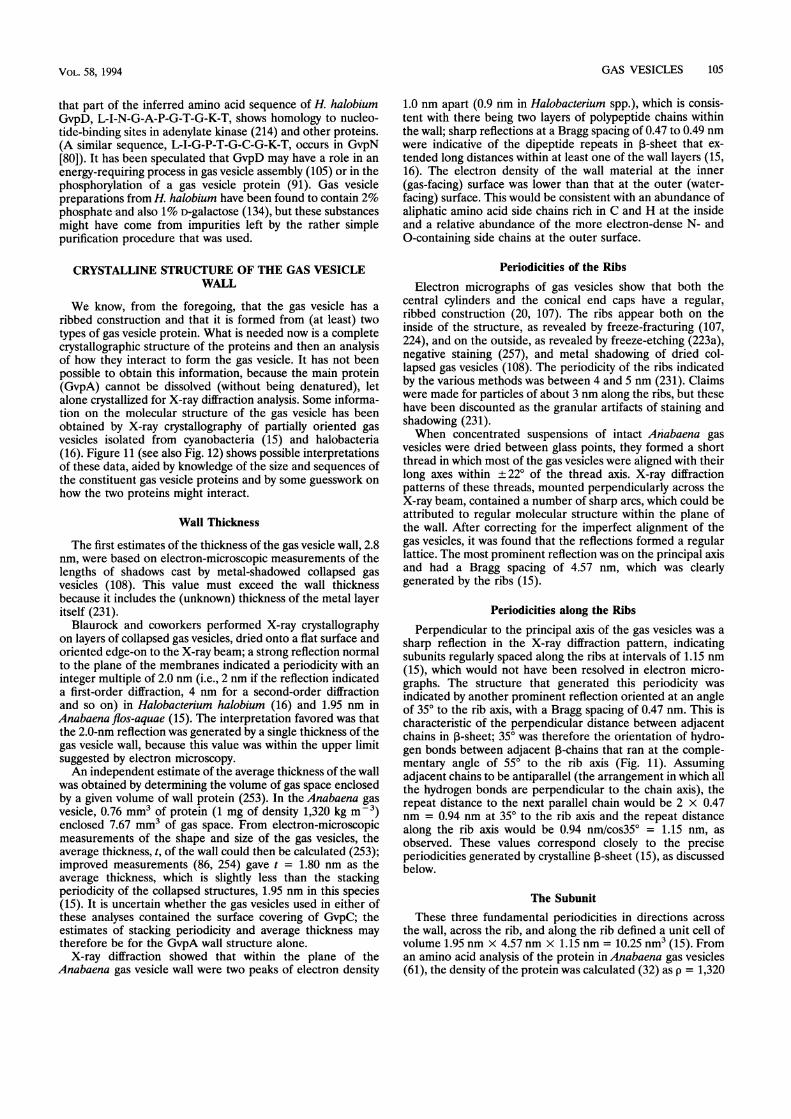
(i) GvpC. Downstream from the p-gvpA (p-vac) gene on theplasmid of H. halobium is a gene (p-gvpC) that encodes aprotein that is very likely to be the counterpart of the cya-nobacterial GvpC (91, 106). The inferred amino acid sequenceindicates that after an N-terminal sequence of 21 residuesthere are 7 sequences of between 32 and 41 residues (39, 32,38, 38, 32, 40, and 41 residues) that show regions of homologywith one another, and then 101 amino acids to the C terminus(Fig. 10); the total number of residues is 382, and the Mr is42,391. Apart from its repeating structure, the protein alsoresembles cyanobacterial GvpC in the relatively high propor-tion of phenylalanine and of aspartic and glutamic acids ortheir amides. There appears to be some sequence homologybetween the repeating sections of the halobacterial and cya-nobacterial proteins (106) (Fig. 10), although the significanceof this has been questioned (59). It has recently been demon-
VOL. 58, 1994
104 WALSBY
TABLE 1. Predicted products of gVp genes from Halobacterium halobium, Halobacterium salinarium, and Haloferax mediterraneia
No. of amino acidsb in:Gene Approx mol
product mass (kDa) H. halobium H. salinarium H. salinarium H. mediterranei Commentsplasmid gene plasmid gene chromosomal gene chromosomal gene
Strand 1GvpA 8.1 75 75 78 77 Principal component; forms ribsCGvpC 42.4 382 382 385 381 Outer protein, stabilizes structureCGvpN 39.2 347 346 345 347 Has a nucleotide binding siteGvpO ND ? 120 111 140
Strand 2GvpD 59.3 536 536 492 545 Has a nucleotide binding site, regulates
expression'GvpE 21.0 191 191 192 192GvpF 24.0 213 214 217 213GvpG 10.0 83 83 83 83GvpH 19.9 182 182 163 216GvpI 16.3 144 140 114 162 A basic proteinGvpJ 12.0 114 114 98 114 Partially homologous with GvpA and
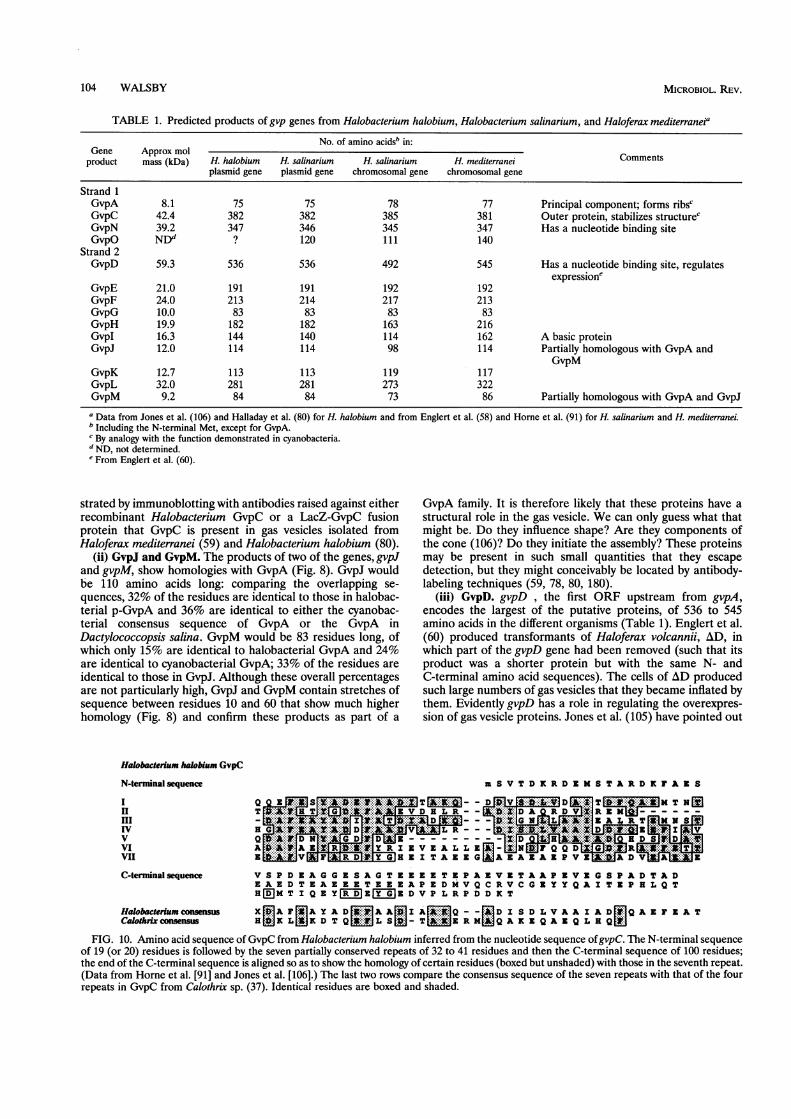
GvpMGvpK 12.7 113 113 119 117GvpL 32.0 281 281 273 322GvpM 9.2 84 84 73 86 Partially homologous with GvpA and GvpJa Data from Jones et al. (106) and Halladay et al. (80) for H. halobium and from Englert et al. (58) and Horne et al. (91) for H. salinarium and H. mediterranei.bIncluding the N-terminal Met, except for GvpA.c By analogy with the function demonstrated in cyanobacteria.dND, not determined.e From Englert et al. (60).
strated by immunoblotting with antibodies raised against eitherrecombinant Halobacterium GvpC or a LacZ-GvpC fusionprotein that GvpC is present in gas vesicles isolated fromHaloferax mediterranei (59) and Halobacterium halobium (80).
(ii) GvpJ and GvpM. The products of two of the genes, gvpJand gvpM, show homologies with GvpA (Fig. 8). GvpJ wouldbe 110 amino acids long: comparing the overlapping se-quences, 32% of the residues are identical to those in halobac-terial p-GvpA and 36% are identical to either the cyanobac-terial consensus sequence of GvpA or the GvpA inDactylococcopsis salina. GvpM would be 83 residues long, ofwhich only 15% are identical to halobacterial GvpA and 24%are identical to cyanobacterial GvpA; 33% of the residues areidentical to those in GvpJ. Although these overall percentagesare not particularly high, GvpJ and GvpM contain stretches ofsequence between residues 10 and 60 that show much higherhomology (Fig. 8) and confirm these products as part of a
Halobacterium halobium GvpC
N-terninal sequence
GvpA family. It is therefore likely that these proteins have astructural role in the gas vesicle. We can only guess what thatmight be. Do they influence shape? Are they components ofthe cone (106)? Do they initiate the assembly? These proteinsmay be present in such small quantities that they escapedetection, but they might conceivably be located by antibody-labeling techniques (59, 78, 80, 180).
(iii) GvpD. gvpD , the first ORF upstream from gvpA,encodes the largest of the putative proteins, of 536 to 545amino acids in the different organisms (Table 1). Englert et al.(60) produced transformants of Haloferax volcannii, AD, inwhich part of the gvpD gene had been removed (such that itsproduct was a shorter protein but with the same N- andC-terminal amino acid sequences). The cells of AD producedsuch large numbers of gas vesicles that they became inflated bythem. Evidently gvpD has a role in regulating the overexpres-sion of gas vesicle proteins. Jones et al. (105) have pointed out
mSVTDKRDxMSTARDKFAXS
H T W~~J~~f~~A ZVDHLR~~~~.:::~cXDARDVZRIM1T TQ~ ~~~~~~~~~~~~~~~~~S..............
........... .......T..,
III X.~~~~~~VD9 DA0RD-Lx: R
Aml
NS .11 TEM .... X>$ ..............1F 4MTN
IV D.t Iik L X.,? _ X j, VV Q *tDI*D DS-VI J#1% A Z R Y YRIXVZ A LL Zi D.-' G# RVII 1 ... V IrF A RD11Y" IZITAxZGWAZAZAZPVx AD VA
C-terminal sequence V S P D Z A G G Z S A G T Z Z Z Z T Z P A Z v Z T A A P Z V Z G 8 P A D T A DZAZDTEAEZZTZZZAPEDMVQCRVCGIYYQAI TxPBLQTH ]M T I Q I Y ZRD EX G D V P L R P D D x T
Halobacteiumconsensus XQAFAEISAY A D A A I A Q DI SDLVAA I AD QAZFxATCalotd,iXconsensus H X LS D T Q L S - T Z R Q AKXQAZQL X Q
FIG. 10. Amino acid sequence of GvpC from Halobacterium halobium inferred from the nucleotide sequence ofgvpC. The N-terminal sequenceof 19 (or 20) residues is followed by the seven partially conserved repeats of 32 to 41 residues and then the C-terminal sequence of 100 residues;the end of the C-terminal sequence is aligned so as to show the homology of certain residues (boxed but unshaded) with those in the seventh repeat.(Data from Horne et al. [91] and Jones et al. [106].) The last two rows compare the consensus sequence of the seven repeats with that of the fourrepeats in GvpC from Calothrix sp. (37). Identical residues are boxed and shaded.
MICROBIOL. REV.
GAS VESICLES 105
that part of the inferred amino acid sequence of H. halobiumGvpD, L-I-N-G-A-P-G-T-G-K-T, shows homology to nucleo-tide-binding sites in adenylate kinase (214) and other proteins.(A similar sequence, L-I-G-P-T-G-C-G-K-T, occurs in GvpN[80]). It has been speculated that GvpD may have a role in anenergy-requiring process in gas vesicle assembly (105) or in thephosphorylation of a gas vesicle protein (91). Gas vesiclepreparations from H. halobium have been found to contain 2%phosphate and also 1% D-galactose (134), but these substancesmight have come from impurities left by the rather simplepurification procedure that was used.
CRYSTALLINE STRUCTURE OF THE GAS VESICLEWALL
We know, from the foregoing, that the gas vesicle has aribbed construction and that it is formed from (at least) twotypes of gas vesicle protein. What is needed now is a completecrystallographic structure of the proteins and then an analysisof how they interact to form the gas vesicle. It has not beenpossible to obtain this information, because the main protein(GvpA) cannot be dissolved (without being denatured), letalone crystallized for X-ray diffraction analysis. Some informa-tion on the molecular structure of the gas vesicle has beenobtained by X-ray crystallography of partially oriented gasvesicles isolated from cyanobacteria (15) and halobacteria(16). Figure 11 (see also Fig. 12) shows possible interpretationsof these data, aided by knowledge of the size and sequences ofthe constituent gas vesicle proteins and by some guesswork onhow the two proteins might interact.
Wall Thickness
The first estimates of the thickness of the gas vesicle wall, 2.8nm, were based on electron-microscopic measurements of thelengths of shadows cast by metal-shadowed collapsed gasvesicles (108). This value must exceed the wall thicknessbecause it includes the (unknown) thickness of the metal layeritself (231).
Blaurock and coworkers performed X-ray crystallographyon layers of collapsed gas vesicles, dried onto a flat surface andoriented edge-on to the X-ray beam; a strong reflection normalto the plane of the membranes indicated a periodicity with aninteger multiple of 2.0 nm (i.e., 2 nm if the reflection indicateda first-order diffraction, 4 nm for a second-order diffractionand so on) in Halobacterium halobium (16) and 1.95 nm inAnabaena flos-aquae (15). The interpretation favored was thatthe 2.0-nm reflection was generated by a single thickness of thegas vesicle wall, because this value was within the upper limitsuggested by electron microscopy.An independent estimate of the average thickness of the wall
was obtained by determining the volume of gas space enclosedby a given volume of wall protein (253). In the Anabaena gasvesicle, 0.76 mm3 of protein (1 mg of density 1,320 kg m-3)enclosed 7.67 mm3 of gas space. From electron-microscopicmeasurements of the shape and size of the gas vesicles, theaverage thickness, t, of the wall could then be calculated (253);improved measurements (86, 254) gave t = 1.80 nm as theaverage thickness, which is slightly less than the stackingperiodicity of the collapsed structures, 1.95 nm in this species(15). It is uncertain whether the gas vesicles used in either ofthese analyses contained the surface covering of GvpC; theestimates of stacking periodicity and average thickness maytherefore be for the GvpA wall structure alone.
X-ray diffraction showed that within the plane of theAnabaena gas vesicle wall were two peaks of electron density
1.0 nm apart (0.9 nm in Halobacterium spp.), which is consis-tent with there being two layers of polypeptide chains withinthe wall; sharp reflections at a Bragg spacing of 0.47 to 0.49 nmwere indicative of the dipeptide repeats in n-sheet that ex-tended long distances within at least one of the wall layers (15,16). The electron density of the wall material at the inner(gas-facing) surface was lower than that at the outer (water-facing) surface. This would be consistent with an abundance ofaliphatic amino acid side chains rich in C and H at the insideand a relative abundance of the more electron-dense N- and0-containing side chains at the outer surface.
Periodicities of the Ribs
Electron micrographs of gas vesicles show that both thecentral cylinders and the conical end caps have a regular,ribbed construction (20, 107). The ribs appear both on theinside of the structure, as revealed by freeze-fracturing (107,224), and on the outside, as revealed by freeze-etching (223a),negative staining (257), and metal shadowing of dried col-lapsed gas vesicles (108). The periodicity of the ribs indicatedby the various methods was between 4 and 5 nm (231). Claimswere made for particles of about 3 nm along the ribs, but thesehave been discounted as the granular artifacts of staining andshadowing (231).When concentrated suspensions of intact Anabaena gas
vesicles were dried between glass points, they formed a shortthread in which most of the gas vesicles were aligned with theirlong axes within ± 220 of the thread axis. X-ray diffractionpatterns of these threads, mounted perpendicularly across theX-ray beam, contained a number of sharp arcs, which could beattributed to regular molecular structure within the plane ofthe wall. After correcting for the imperfect alignment of thegas vesicles, it was found that the reflections formed a regularlattice. The most prominent reflection was on the principal axisand had a Bragg spacing of 4.57 nm, which was clearlygenerated by the ribs (15).
Periodicities along the Ribs
Perpendicular to the principal axis of the gas vesicles was asharp reflection in the X-ray diffraction pattern, indicatingsubunits regularly spaced along the ribs at intervals of 1.15 nm(15), which would not have been resolved in electron micro-graphs. The structure that generated this periodicity wasindicated by another prominent reflection oriented at an angleof 350 to the rib axis, with a Bragg spacing of 0.47 nm. This ischaracteristic of the perpendicular distance between adjacentchains in n-sheet; 35° was therefore the orientation of hydro-gen bonds between adjacent 3-chains that ran at the comple-mentary angle of 550 to the rib axis (Fig. 11). Assumingadjacent chains to be antiparallel (the arrangement in which allthe hydrogen bonds are perpendicular to the chain axis), therepeat distance to the next parallel chain would be 2 x 0.47nm = 0.94 nm at 35° to the rib axis and the repeat distancealong the rib axis would be 0.94 nm/cos35° = 1.15 nm, asobserved. These values correspond closely to the preciseperiodicities generated by crystalline 3-sheet (15), as discussedbelow.
The SubunitThese three fundamental periodicities in directions across
the wall, across the rib, and along the rib defined a unit cell ofvolume 1.95 nm x 4.57 nm x 1.15 nm = 10.25 nm3 (15). Froman amino acid analysis of the protein in Anabaena gas vesicles(61), the density of the protein was calculated (32) as p = 1,320
VOL. 58, 1994

106 WALSBY
719
FIG. 11. Possible arrangement of GvpA molecules in the rib of the gas vesicle, based on X-ray crystallographic data of Blaurock and Walsby(15). Adjacent a-chains (of length 8 and 7 dipeptides) lie at a unique angle, a, to the rib axis. In the right-angled triangle shown, one side isproportional to the distance between pairs of chains (2a = 0.994 nm) and the other side is proportional to the dipeptide repeat (2h = 0.69 nm);the angle a is therefore given by tan - 1(2a12h) = 53.80; the hydrogen bonds perpendicular to the ,-chains lie at the complementary angle of j =36.20 to the rib axis (53.8° to the cylinder axis). The chirality of the structure could be opposite to that shown, i.e., with the chains sloping to theleft instead of right. Modified from Walsby (251) with permission from the publisher.
f1'0)
kg m-3. Multiplying by this and the Avogadro number givesthe molar mass of the subunit, 8,150 g mol-'. A slightlysmaller volume (9.46 nm3) and molar mass (7,500 g mol -l) areobtained if the average thickness (1.80 nm) of the gas vesiclewall is used instead of the stacking periodicity, which mayinclude some unoccupied space between layers.At the time these calculations were made, the size of the gas
vesicle proteins was unknown, but subsequent determinationof the amino acid sequence of the Anabaena GvpA (87, 226)revealed a molecular mass, 7,397 Da, close to that of the unitcell. This, combined with the fact that GvpA accounted for themajority of the protein present in the gas vesicle, supported theconclusion that GvpA formed the ribs of the structure.
Speculations on the Structure of GvpAThe foregoing is a synopsis of the structure that is supported
by hard evidence. In this section I discuss the speculations forwhich there is, as yet, no evidence. In this way I hope to keepfact separated from conjecture.
Antiparallel ,-sheet. The crystallographic data support themodel of antiparallel n-sheet in which the hydrogen bonds lieat the same angle. The data do not preclude parallel adjacent
chains, however, in which the alternate hydrogen bonds are atslightly different angles.
Extent of ,8-sheet. The sharpness of the reflections from the0.47-nm periodicities indicates that the 3-sheet extends forlong distances (15). It has been proposed but not proved thatalternate ,B-chains extend across the full width of the rib andare connected to the adjacent chains with a 1-turn. This wouldexplain the antiparallel direction of adjacent chains (Fig. 11).
Explanation for the angle of the "-sheet. The orientation ofthe 3-chains can be explained by an arrangement in which theadjacent antiparallel 1-chains differ in length by one dipeptide(Fig. 11). Adjacent pairs of chains would then be tilted at aunique angle to the rib axis, given by
ot = tan 1 (2a/2h) = 53.80 (1)
where a = 0.472 nm, the perpendicular distance between13-chains, and 2h = 0.69 nm, the dipeptide repeat in the chain.The H bonds will therefore lie at the complementary angle of36.2° to the rib axis (53.80 to the cylinder axis). This angle iswithin 1.20 of the measured value. Both the calculated angle aand the observed angle are very close to the "magic" angle of54.70, at which the transverse and longitudinal stresses are
MICROBIOL. REV.
JA k,A- AL
-IN
'V 111-
GAS VESICLES 107
I. GOO
1.15 nm
--4.57 nm -. N
rib 1'
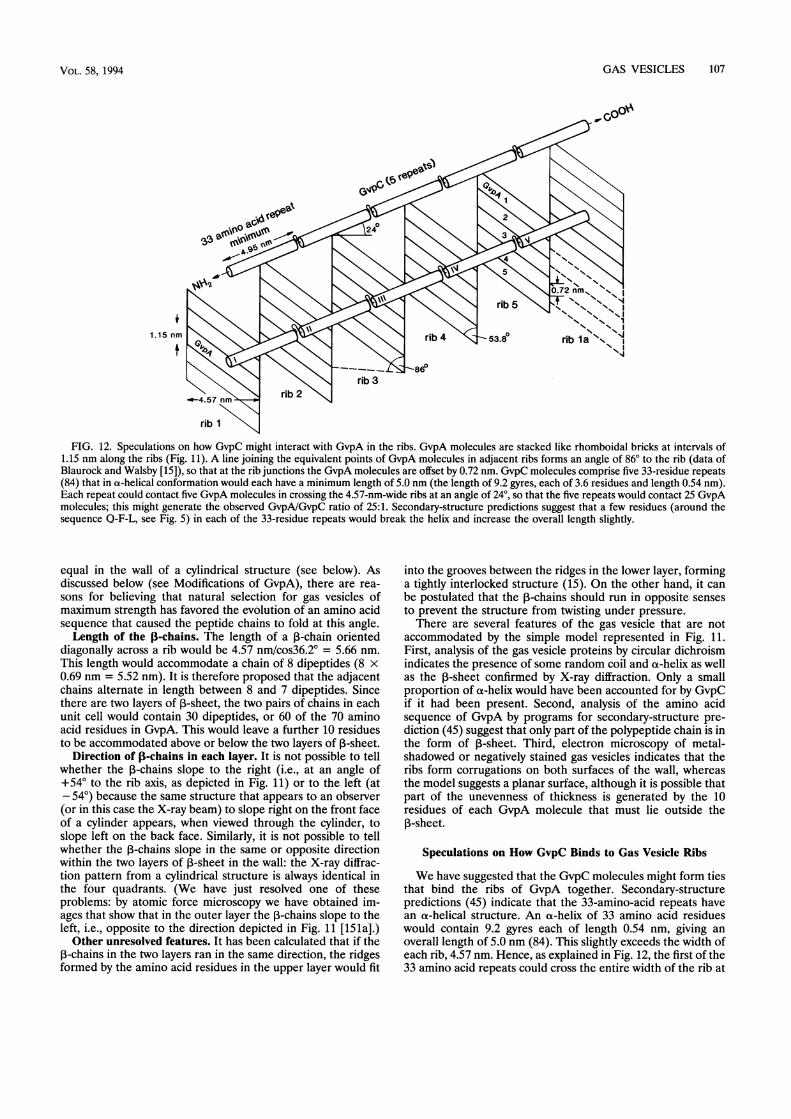
FIG. 12. Speculations on how GvpC might interact with GvpA in the ribs. GvpA molecules are stacked like rhomboidal bricks at intervals of1.15 nm along the ribs (Fig. 11). A line joining the equivalent points of GvpA molecules in adjacent ribs forms an angle of 860 to the rib (data ofBlaurock and Walsby [15]), so that at the rib junctions the GvpA molecules are offset by 0.72 nm. GvpC molecules comprise five 33-residue repeats(84) that in ao-helical conformation would each have a minimum length of 5.0 nm (the length of 9.2 gyres, each of 3.6 residues and length 0.54 nm).Each repeat could contact five GvpA molecules in crossing the 4.57-nm-wide ribs at an angle of 24°, so that the five repeats would contact 25 GvpAmolecules; this might generate the observed GvpA/GvpC ratio of 25:1. Secondary-structure predictions suggest that a few residues (around thesequence Q-F-L, see Fig. 5) in each of the 33-residue repeats would break the helix and increase the overall length slightly.
equal in the wall of a cylindrical structure (see below). Asdiscussed below (see Modifications of GvpA), there are rea-sons for believing that natural selection for gas vesicles ofmaximum strength has favored the evolution of an amino acidsequence that caused the peptide chains to fold at this angle.Length of the ,-chains. The length of a 1-chain oriented
diagonally across a rib would be 4.57 nm/cos36.2° = 5.66 nm.This length would accommodate a chain of 8 dipeptides (8 x0.69 nm = 5.52 nm). It is therefore proposed that the adjacentchains alternate in length between 8 and 7 dipeptides. Sincethere are two layers of 1-sheet, the two pairs of chains in eachunit cell would contain 30 dipeptides, or 60 of the 70 aminoacid residues in GvpA. This would leave a further 10 residuesto be accommodated above or below the two layers of 1-sheet.
Direction of ,B-chains in each layer. It is not possible to tellwhether the 1-chains slope to the right (i.e., at an angle of+54° to the rib axis, as depicted in Fig. 11) or to the left (at- 540) because the same structure that appears to an observer(or in this case the X-ray beam) to slope right on the front faceof a cylinder appears, when viewed through the cylinder, toslope left on the back face. Similarly, it is not possible to tellwhether the 1-chains slope in the same or opposite directionwithin the two layers of 1-sheet in the wall: the X-ray diffrac-tion pattern from a cylindrical structure is always identical inthe four quadrants. (We have just resolved one of theseproblems: by atomic force microscopy we have obtained im-ages that show that in the outer layer the ,B-chains slope to theleft, i.e., opposite to the direction depicted in Fig. 11 [15la].)Other unresolved features. It has been calculated that if the
13-chains in the two layers ran in the same direction, the ridgesformed by the amino acid residues in the upper layer would fit
into the grooves between the ridges in the lower layer, forminga tightly interlocked structure (15). On the other hand, it canbe postulated that the ,B-chains should run in opposite sensesto prevent the structure from twisting under pressure.There are several features of the gas vesicle that are not
accommodated by the simple model represented in Fig. 11.First, analysis of the gas vesicle proteins by circular dichroismindicates the presence of some random coil and cx-helix as wellas the 13-sheet confirmed by X-ray diffraction. Only a smallproportion of a.-helix would have been accounted for by GvpCif it had been present. Second, analysis of the amino acidsequence of GvpA by programs for secondary-structure pre-diction (45) suggest that only part of the polypeptide chain is inthe form of 13-sheet. Third, electron microscopy of metal-shadowed or negatively stained gas vesicles indicates that theribs form corrugations on both surfaces of the wall, whereasthe model suggests a planar surface, although it is possible thatpart of the unevenness of thickness is generated by the 10residues of each GvpA molecule that must lie outside the1-sheet.
Speculations on How GvpC Binds to Gas Vesicle Ribs
We have suggested that the GvpC molecules might form tiesthat bind the ribs of GvpA together. Secondary-structurepredictions (45) indicate that the 33-amino-acid repeats havean ao-helical structure. An ax-helix of 33 amino acid residueswould contain 9.2 gyres each of length 0.54 nm, giving anoverall length of 5.0 nm (84). This slightly exceeds the width ofeach rib, 4.57 nm. Hence, as explained in Fig. 12, the first of the33 amino acid repeats could cross the entire width of the rib at
VOL. 58, 1994
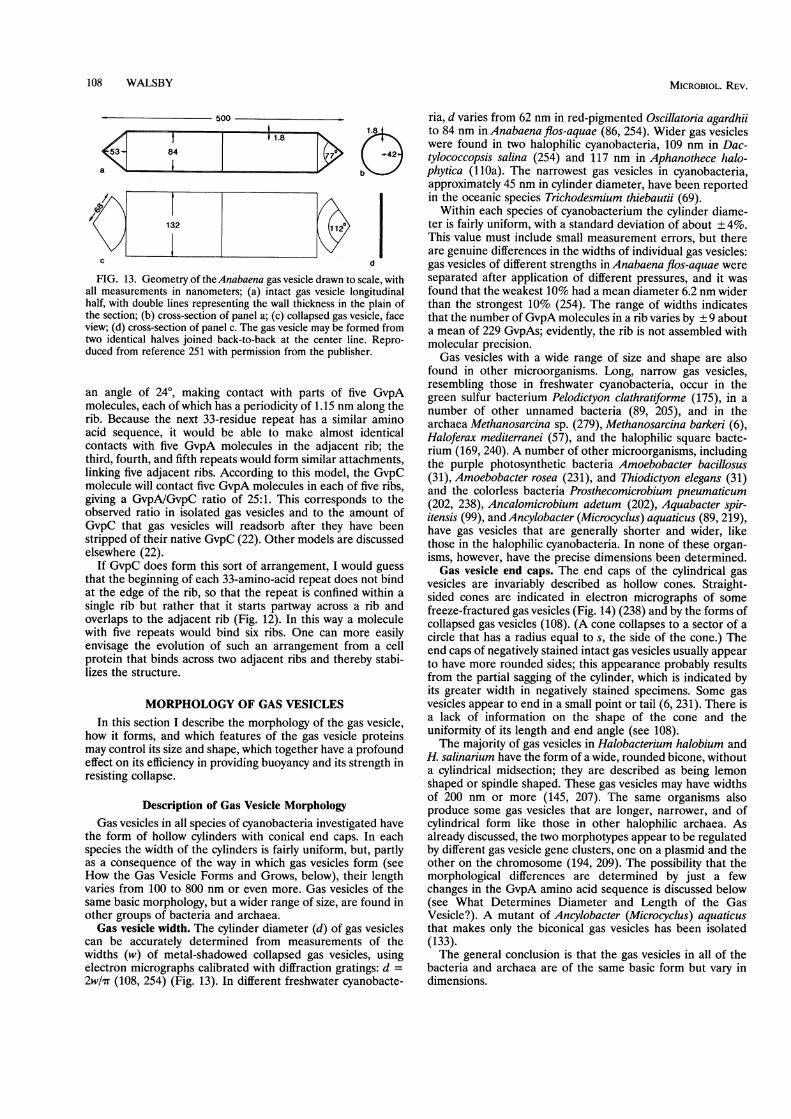
108 WALSBY
500
a
/c
1.8
77
I112
FIG. 13. Geometry of theAnabaena gas vesicle drawn to scale, withall measurements in nanometers; (a) intact gas vesicle longitudinalhalf, with double lines representing the wall thickness in the plain ofthe section; (b) cross-section of panel a; (c) collapsed gas vesicle, faceview; (d) cross-section of panel c. The gas vesicle may be formed fromtwo identical halves joined back-to-back at the center line. Repro-duced from reference 251 with permission from the publisher.
an angle of 240, making contact with parts of five GvpAmolecules, each of which has a periodicity of 1.15 nm along therib. Because the next 33-residue repeat has a similar aminoacid sequence, it would be able to make almost identicalcontacts with five GvpA molecules in the adjacent rib; thethird, fourth, and fifth repeats would form similar attachments,linking five adjacent ribs. According to this model, the GvpCmolecule will contact five GvpA molecules in each of five ribs,giving a GvpA/GvpC ratio of 25:1. This corresponds to theobserved ratio in isolated gas vesicles and to the amount ofGvpC that gas vesicles will readsorb after they have beenstripped of their native GvpC (22). Other models are discussedelsewhere (22).
If GvpC does form this sort of arrangement, I would guessthat the beginning of each 33-amino-acid repeat does not bindat the edge of the rib, so that the repeat is confined within a
single rib but rather that it starts partway across a rib andoverlaps to the adjacent rib (Fig. 12). In this way a moleculewith five repeats would bind six ribs. One can more easilyenvisage the evolution of such an arrangement from a cellprotein that binds across two adjacent ribs and thereby stabi-lizes the structure.
MORPHOLOGY OF GAS VESICLES
In this section I describe the morphology of the gas vesicle,how it forms, and which features of the gas vesicle proteinsmay control its size and shape, which together have a profoundeffect on its efficiency in providing buoyancy and its strength inresisting collapse.
Description of Gas Vesicle MorphologyGas vesicles in all species of cyanobacteria investigated have
the form of hollow cylinders with conical end caps. In eachspecies the width of the cylinders is fairly uniform, but, partlyas a consequence of the way in which gas vesicles form (seeHow the Gas Vesicle Forms and Grows, below), their lengthvaries from 100 to 800 nm or even more. Gas vesicles of thesame basic morphology, but a wider range of size, are found inother groups of bacteria and archaea.Gas vesicle width. The cylinder diameter (d) of gas vesicles
can be accurately determined from measurements of thewidths (w) of metal-shadowed collapsed gas vesicles, usingelectron micrographs calibrated with diffraction gratings: d =
2w/1r (108, 254) (Fig. 13). In different freshwater cyanobacte-
ria, d varies from 62 nm in red-pigmented Oscillatoria agardhiito 84 nm in Anabaena flos-aquae (86, 254). Wider gas vesicleswere found in two halophilic cyanobacteria, 109 nm in Dac-tylococcopsis salina (254) and 117 nm in Aphanothece halo-phytica (1lOa). The narrowest gas vesicles in cyanobacteria,approximately 45 nm in cylinder diameter, have been reportedin the oceanic species Trichodesmium thiebautii (69).
Within each species of cyanobacterium the cylinder diame-ter is fairly uniform, with a standard deviation of about ± 4%.This value must include small measurement errors, but thereare genuine differences in the widths of individual gas vesicles:gas vesicles of different strengths in Anabaena flos-aquae wereseparated after application of different pressures, and it wasfound that the weakest 10% had a mean diameter 6.2 nm widerthan the strongest 10% (254). The range of widths indicatesthat the number of GvpA molecules in a rib varies by ± 9 abouta mean of 229 GvpAs; evidently, the rib is not assembled withmolecular precision.Gas vesicles with a wide range of size and shape are also
found in other microorganisms. Long, narrow gas vesicles,resembling those in freshwater cyanobacteria, occur in thegreen sulfur bacterium Pelodictyon clathratiforme (175), in anumber of other unnamed bacteria (89, 205), and in thearchaea Methanosarcina sp. (279), Methanosarcina barkeri (6),Haloferax mediterranei (57), and the halophilic square bacte-rium (169, 240). A number of other microorganisms, includingthe purple photosynthetic bacteria Amoebobacter bacillosus(31), Amoebobacter rosea (231), and Thiodictyon elegans (31)and the colorless bacteria Prosthecomicrobium pneumaticum(202, 238), Ancalomicrobium adetum (202), Aquabacter spir-itensis (99), and Ancylobacter (Microcyclus) aquaticus (89, 219),have gas vesicles that are generally shorter and wider, likethose in the halophilic cyanobacteria. In none of these organ-isms, however, have the precise dimensions been determined.Gas vesicle end caps. The end caps of the cylindrical gas
vesicles are invariably described as hollow cones. Straight-sided cones are indicated in electron micrographs of somefreeze-fractured gas vesicles (Fig. 14) (238) and by the forms ofcollapsed gas vesicles (108). (A cone collapses to a sector of acircle that has a radius equal to s, the side of the cone.) Theend caps of negatively stained intact gas vesicles usually appearto have more rounded sides; this appearance probably resultsfrom the partial sagging of the cylinder, which is indicated byits greater width in negatively stained specimens. Some gasvesicles appear to end in a small point or tail (6, 231). There isa lack of information on the shape of the cone and theuniformity of its length and end angle (see 108).The majority of gas vesicles in Halobacterium halobium and
H. salinarium have the form of a wide, rounded bicone, withouta cylindrical midsection; they are described as being lemonshaped or spindle shaped. These gas vesicles may have widthsof 200 nm or more (145, 207). The same organisms alsoproduce some gas vesicles that are longer, narrower, and ofcylindrical form like those in other halophilic archaea. Asalready discussed, the two morphotypes appear to be regulatedby different gas vesicle gene clusters, one on a plasmid and theother on the chromosome (194, 209). The possibility that themorphological differences are determined by just a fewchanges in the GvpA amino acid sequence is discussed below(see What Determines Diameter and Length of the GasVesicle?). A mutant of Ancylobacter (Microcyclus) aquaticusthat makes only the biconical gas vesicles has been isolated(133).The general conclusion is that the gas vesicles in all of the
bacteria and archaea are of the same basic form but vary indimensions.
1 #11.884
132
MICROBIOL. REV.
1ol
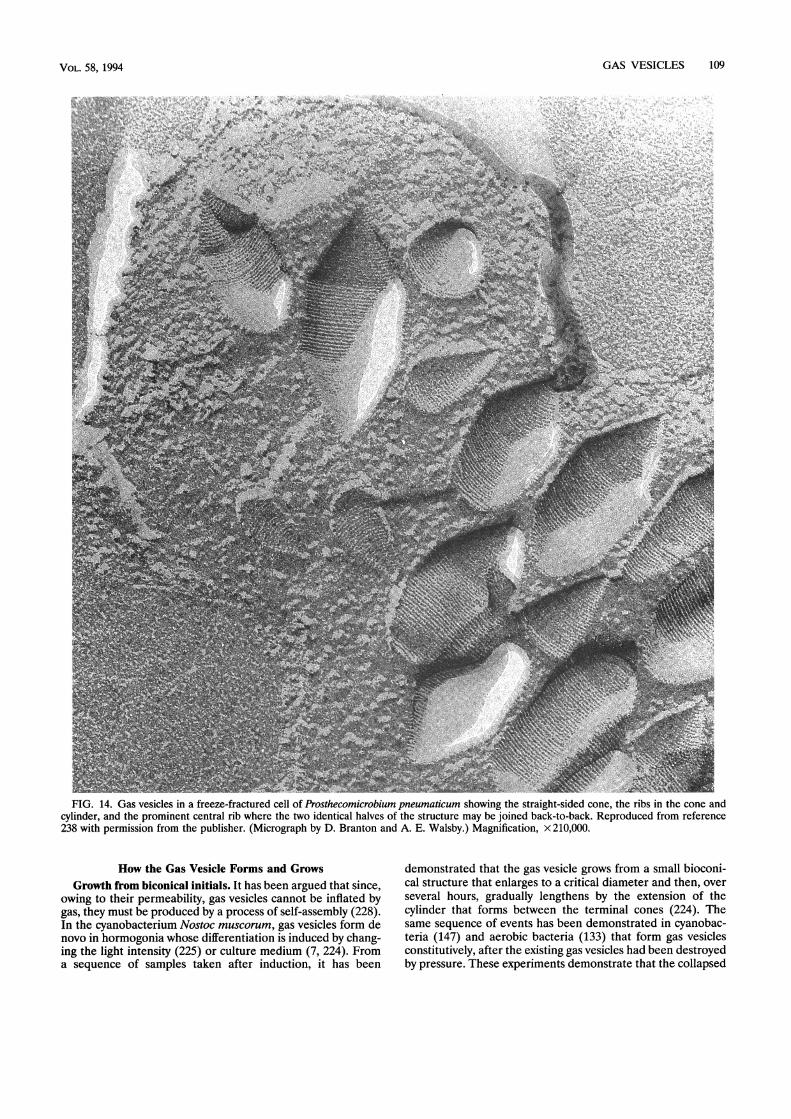
GAS VESICLES 109
FIG. 14. Gas vesicles in a freeze-fractured cell of Prosthecomicrobium pneumaticum showing the straight-sided cone, the ribs in the cone andcylinder, and the prominent central rib where the two identical halves of the structure may be joined back-to-back. Reproduced from reference238 with permission from the publisher. (Micrograph by D. Branton and A. E. Walsby.) Magnification, x 210,000.
How the Gas Vesicle Forms and GrowsGrowth from biconical initials. It has been argued that since,
owing to their permeability, gas vesicles cannot be inflated bygas, they must be produced by a process of self-assembly (228).In the cyanobacterium Nostoc muscorum, gas vesicles form denovo in hormogonia whose differentiation is induced by chang-ing the light intensity (225) or culture medium (7, 224). Froma sequence of samples taken after induction, it has been
demonstrated that the gas vesicle grows from a small bioconi-cal structure that enlarges to a critical diameter and then, overseveral hours, gradually lengthens by the extension of thecylinder that forms between the terminal cones (224). Thesame sequence of events has been demonstrated in cyanobac-teria (147) and aerobic bacteria (133) that form gas vesiclesconstitutively, after the existing gas vesicles had been destroyedby pressure. These experiments demonstrate that the collapsed
VOL. 58, 1994
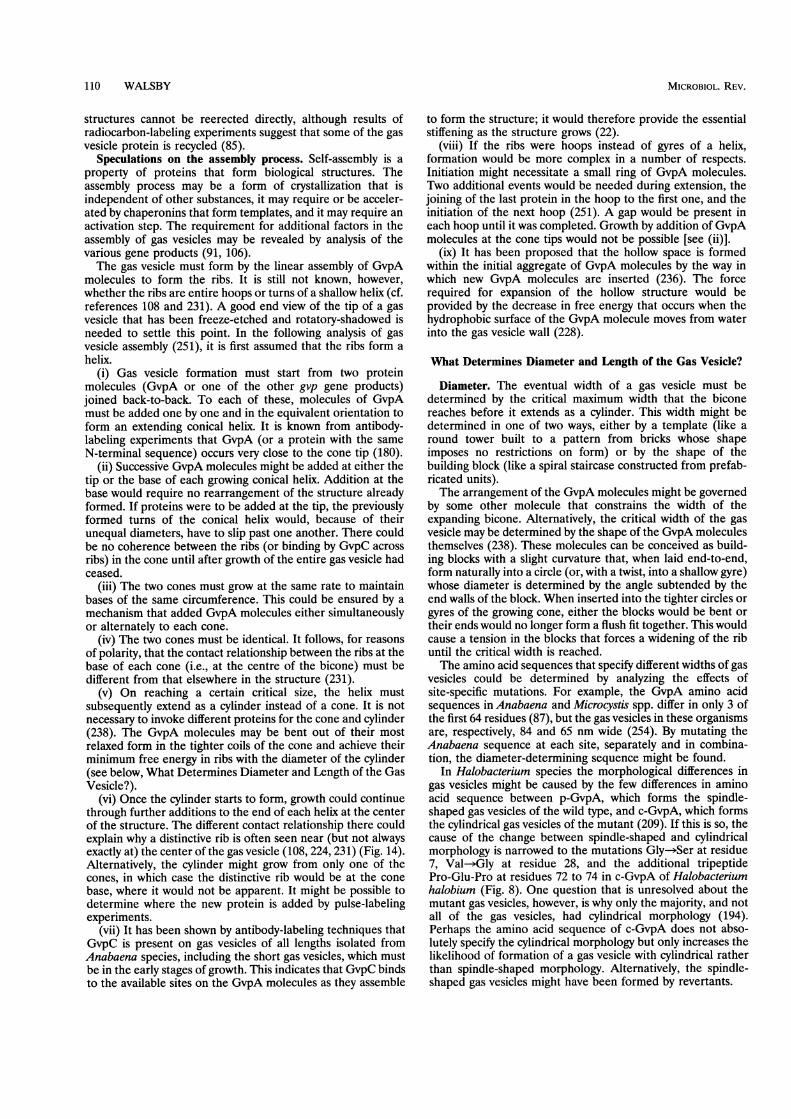
110 WALSBY
structures cannot be reerected directly, although results ofradiocarbon-labeling experiments suggest that some of the gasvesicle protein is recycled (85).
Speculations on the assembly process. Self-assembly is aproperty of proteins that form biological structures. Theassembly process may be a form of crystallization that isindependent of other substances, it may require or be acceler-ated by chaperonins that form templates, and it may require anactivation step. The requirement for additional factors in theassembly of gas vesicles may be revealed by analysis of thevarious gene products (91, 106).The gas vesicle must form by the linear assembly of GvpA
molecules to form the ribs. It is still not known, however,whether the ribs are entire hoops or turns of a shallow helix (cf.references 108 and 231). A good end view of the tip of a gasvesicle that has been freeze-etched and rotatory-shadowed isneeded to settle this point. In the following analysis of gasvesicle assembly (251), it is first assumed that the ribs form ahelix.
(i) Gas vesicle formation must start from two proteinmolecules (GvpA or one of the other gvp gene products)joined back-to-back. To each of these, molecules of GvpAmust be added one by one and in the equivalent orientation toform an extending conical helix. It is known from antibody-labeling experiments that GvpA (or a protein with the sameN-terminal sequence) occurs very close to the cone tip (180).
(ii) Successive GvpA molecules might be added at either thetip or the base of each growing conical helix. Addition at thebase would require no rearrangement of the structure alreadyformed. If proteins were to be added at the tip, the previouslyformed turns of the conical helix would, because of theirunequal diameters, have to slip past one another. There couldbe no coherence between the ribs (or binding by GvpC acrossribs) in the cone until after growth of the entire gas vesicle hadceased.
(iii) The two cones must grow at the same rate to maintainbases of the same circumference. This could be ensured by amechanism that added GvpA molecules either simultaneouslyor alternately to each cone.
(iv) The two cones must be identical. It follows, for reasonsof polarity, that the contact relationship between the ribs at thebase of each cone (i.e., at the centre of the bicone) must bedifferent from that elsewhere in the structure (231).
(v) On reaching a certain critical size, the helix mustsubsequently extend as a cylinder instead of a cone. It is notnecessary to invoke different proteins for the cone and cylinder(238). The GvpA molecules may be bent out of their mostrelaxed form in the tighter coils of the cone and achieve theirminimum free energy in ribs with the diameter of the cylinder(see below, What Determines Diameter and Length of the GasVesicle?).
(vi) Once the cylinder starts to form, growth could continuethrough further additions to the end of each helix at the centerof the structure. The different contact relationship there couldexplain why a distinctive rib is often seen near (but not alwaysexactly at) the center of the gas vesicle (108, 224, 231) (Fig. 14).Alternatively, the cylinder might grow from only one of thecones, in which case the distinctive rib would be at the conebase, where it would not be apparent. It might be possible todetermine where the new protein is added by pulse-labelingexperiments.
(vii) It has been shown by antibody-labeling techniques thatGvpC is present on gas vesicles of all lengths isolated fromAnabaena species, including the short gas vesicles, which mustbe in the early stages of growth. This indicates that GvpC bindsto the available sites on the GvpA molecules as they assemble
to form the structure; it would therefore provide the essentialstiffening as the structure grows (22).
(viii) If the ribs were hoops instead of gyres of a helix,formation would be more complex in a number of respects.Initiation might necessitate a small ring of GvpA molecules.Two additional events would be needed during extension, thejoining of the last protein in the hoop to the first one, and theinitiation of the next hoop (251). A gap would be present ineach hoop until it was completed. Growth by addition of GvpAmolecules at the cone tips would not be possible [see (ii)].
(ix) It has been proposed that the hollow space is formedwithin the initial aggregate of GvpA molecules by the way inwhich new GvpA molecules are inserted (236). The forcerequired for expansion of the hollow structure would beprovided by the decrease in free energy that occurs when thehydrophobic surface of the GvpA molecule moves from waterinto the gas vesicle wall (228).
What Determines Diameter and Length of the Gas Vesicle?
Diameter. The eventual width of a gas vesicle must bedetermined by the critical maximum width that the biconereaches before it extends as a cylinder. This width might bedetermined in one of two ways, either by a template (like around tower built to a pattern from bricks whose shapeimposes no restrictions on form) or by the shape of thebuilding block (like a spiral staircase constructed from prefab-ricated units).The arrangement of the GvpA molecules might be governed
by some other molecule that constrains the width of theexpanding bicone. Alternatively, the critical width of the gasvesicle may be determined by the shape of the GvpA moleculesthemselves (238). These molecules can be conceived as build-ing blocks with a slight curvature that, when laid end-to-end,form naturally into a circle (or, with a twist, into a shallow gyre)whose diameter is determined by the angle subtended by theend walls of the block. When inserted into the tighter circles orgyres of the growing cone, either the blocks would be bent ortheir ends would no longer form a flush fit together. This wouldcause a tension in the blocks that forces a widening of the ribuntil the critical width is reached.The amino acid sequences that specify different widths of gas
vesicles could be determined by analyzing the effects ofsite-specific mutations. For example, the GvpA amino acidsequences in Anabaena and Microcystis spp. differ in only 3 ofthe first 64 residues (87), but the gas vesicles in these organismsare, respectively, 84 and 65 nm wide (254). By mutating theAnabaena sequence at each site, separately and in combina-tion, the diameter-determining sequence might be found.
In Halobacterium species the morphological differences ingas vesicles might be caused by the few differences in aminoacid sequence between p-GvpA, which forms the spindle-shaped gas vesicles of the wild type, and c-GvpA, which formsthe cylindrical gas vesicles of the mutant (209). If this is so, thecause of the change between spindle-shaped and cylindricalmorphology is narrowed to the mutations Gly-*Ser at residue7, Val->Gly at residue 28, and the additional tripeptidePro-Glu-Pro at residues 72 to 74 in c-GvpA of Halobacteriumhalobium (Fig. 8). One question that is unresolved about themutant gas vesicles, however, is why only the majority, and notall of the gas vesicles, had cylindrical morphology (194).Perhaps the amino acid sequence of c-GvpA does not abso-lutely specify the cylindrical morphology but only increases thelikelihood of formation of a gas vesicle with cylindrical ratherthan spindle-shaped morphology. Alternatively, the spindle-shaped gas vesicles might have been formed by revertants.
MICROBIOL. REV.

GAS VESICLES 111
The three serine residues at positions near the N terminusmay be crucial in determining cylindrical morphology; theyalso occur in the only GvpA of Haloferax mediterranei, whichhas cylindrical gas vesicles, and in the GvpA of the bacteriaAmoebobacter pendens (78) and Ancylobacter aquaticus (21a),which have short, wide cylindrical gas vesicles. All cyanobac-teria, with cylindrical gas vesicles, have four ser residues there(Fig. 2). The differences at the two other positions (residues 28and 72 in Fig. 8) are not consistently correlated with eithermorphology.
Length. The gas vesicles of Nostoc muscorum may reach alength of 1,400 nm in 24 h (224), whereas those of Microcystisaeruginosa take about 12 h to grow to their maximum length ofabout 600 nm (147). The mean lengths of gas vesicles variesfrom 293 to 721 nm in seven genera of cyanobacteria (254).Those in Anabaena flos-aquae showed a length distributionwith a standard deviation of about 35% of the mean (230). Thelength distribution found at any instant reflects the balance ofthe numbers of gas vesicles being initiated, growing, reachingtheir maximum length, and being destroyed by collapse (230)or other means of disintegration (148).
It is not known what causes gas vesicles to stop growing.Konopka et al. (133) found that following gas vesicle collapsein the bacterium Ancylobacter (Microcyclus) aquaticus therewas a constant rate of gas vesicle membrane production;initially only 15 new gas vesicles were produced per cell, and nomore were produced until these ones had reached the lengthat which they began to add their cylindrical midsections.This suggests that there may be additional requirements forcylinder elongation. Alternatively it may indicate that there isa greater tendency for new GvpA molecules to assemble intoexisting bicones than into new ones and an approximatelyequal tendency to assemble into new bicones and existingcylinders.
PHYSICAL PROPERTIES OF GAS VESICLES
A Model for the Gas Vesicle: a Pair of Flowerpots
It is unavoidable that when we consider structures in bacte-ria, invisible to the naked eye, we draw analogies with everydayobjects that we can see and handle. Unfortunately the gasvesicle seems to evoke inappropriate comparisons, with bub-bles or balloons, which are misleading and a hindrance to theunderstanding of the structure. To drive them out of thereader's mind, I suggest an alternative: take a pair of thoseold-fashioned earthenware flowerpots (but without drainageholes in the bottoms), coat the inner surfaces with a film of oil,and glue them together rim to rim. This pot is permeable to gasand therefore contains air at atmospheric pressure, although itdoes not need the air inside to maintain the hollow space. Nowsubmerge the pots in water. Air continues to diffuse throughthe pores in the wall and can equilibrate to and fro between theenclosed gas space and the air dissolved in the surroundingmedium. Liquid water will seep into the pores in the outersurface but will be held back from entering the oil-coated poresof the inner surface by surface tension. If the oil-coated poresare small enough, surface tension will even prevent water frombeing forced inside the chamber when a hydrostatic pressure isapplied to the water. This pressure will be borne by the rigidwall with little decrease in volume. Of course, if sufficientpressure is applied, the wall will break and the gas-filled spacewill be lost. The flowerpot analogy is especially useful as an aidto understanding the mechanical properties of the gas vesicle,but with some of the other properties there are problems of
air or gas
water
Pn = Ph + Pf-Pg Pn = Ph + Pt + Pf-Pg(a) (b)
FIG. 15. Pressures acting on a gas vesicle suspended in water. (a)An isolated gas vesicle is subjected to pressures from the gas above thesuspension (pf) and hydrostatic pressure (ph). (b) A gas vesicle insidea cell is also subjected to cell turgor pressure (p,). The net pressure (pn)acting across the gas vesicle wall is given by the sum of these pressuresminus the gas pressure inside the gas vesicle (pg);pg is determined bythe concentration (c) of gas dissolved in the water, which is usually airat the ambient pressure (about 0.1 MPa, or 1 bar). The gas vesicle willcollapse if the net pressure, p, exceeds the critical pressure, pc.Modified from references 230 and 251 with permission from thepublisher.
scale. According to the laws of physics, surface tension will bemuch more effective in excluding liquid water from the minus-cule gas vesicle than from pores of the flowerpot, and gas willfill the gas vesicle very much faster.
In the following section I explain these physical properties ofthe gas vesicle in more detail. Several of them involve pres-sures acting on the structure, and it is first necessary to definethese pressures. The net pressure (ps) acting on an isolated gasvesicle suspended in water is given by
Pn = Ph + Pf - Pg (2)
(see Fig. 15) (230, 231). Ph iS the hydrostatic pressure of thewater column: Ph = zpg, where z is the depth (in meters) belowthe water surface and p is the density of the water (998 kg m-3
at 20°C); when g is the acceleration due to gravity (9.8 m -2),Ph rises by approximately 0.01 MPa m-1. In a test tube inwhich z is small, Ph is insignificant; in the centrifuge, in whichg can be large, Ph can be high and may cause collapse of gasvesicles during isolation procedures (230, 256). pf is thepressure of gas in the overlying gas phase. The atmosphericpressure is about 0.1 MPa (1 bar).pg is the gas pressure insidethe gas vesicles. The gas inside is always in equilibrium with thegas dissolved in the suspending water, of concentration c (245).pg is therefore usually 0.1 MPa and balances the atmosphericpressure. Note that the dissolved gas does not itself exert apressure on the gas vesicle. If the pressure of the overlying gas,
pf, is raised artificially, the pressure is immediately transmittedto the gas vesicles through the suspending water, and it maycollapse them. More gas will gradually diffuse into the suspen-sion, raising c and hencepg, but this occurs only very slowly andusually affects pg only in gas vesicles close to the gas-waterinterface (see below). Inside cells there is an additional sourceof pressure, the cell turgor pressure (Fig. 15); it can range from0 to 0.5 MPa in different organisms (see Gas Vesicle Collapsein Cells: Turgor Pressure, below). Surface tension at the gasvesicle surface and cell surface may generate additional pres-sures (230) (see Surface Properties of the Gas Vesicle, below).
VOL. 58, 1994
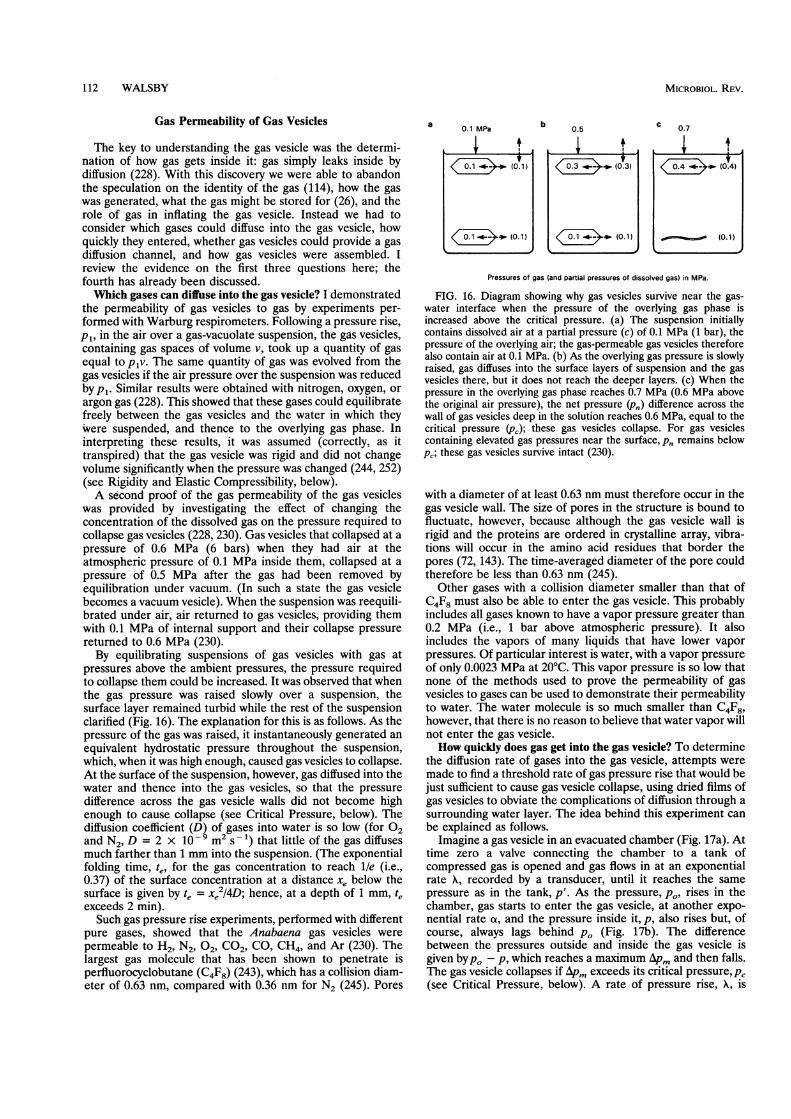
112 WALSBY
Gas Permeability of Gas Vesicles
The key to understanding the gas vesicle was the determi-nation of how gas gets inside it: gas simply leaks inside bydiffusion (228). With this discovery we were able to abandonthe speculation on the identity of the gas (114), how the gaswas generated, what the gas might be stored for (26), and therole of gas in inflating the gas vesicle. Instead we had toconsider which gases could diffuse into the gas vesicle, howquickly they entered, whether gas vesicles could provide a gasdiffusion channel, and how gas vesicles were assembled. Ireview the evidence on the first three questions here; thefourth has already been discussed.Which gases can diffuse into the gas vesicle? I demonstrated
the permeability of gas vesicles to gas by experiments per-formed with Warburg respirometers. Following a pressure rise,Pi, in the air over a gas-vacuolate suspension, the gas vesicles,containing gas spaces of volume v, took up a quantity of gasequal to p1v. The same quantity of gas was evolved from thegas vesicles if the air pressure over the suspension was reducedby Pi* Similar results were obtained with nitrogen, oxygen, orargon gas (228). This showed that these gases could equilibratefreely between the gas vesicles and the water in which theywere suspended, and thence to the overlying gas phase. Ininterpreting these results, it was assumed (correctly, as ittranspired) that the gas vesicle was rigid and did not changevolume significantly when the pressure was changed (244, 252)(see Rigidity and Elastic Compressibility, below).A second proof of the gas permeability of the gas vesicles
was provided by investigating the effect of changing theconcentration of the dissolved gas on the pressure required tocollapse gas vesicles (228, 230). Gas vesicles that collapsed at apressure of 0.6 MPa (6 bars) when they had air at theatmospheric pressure of 0.1 MPa inside them, collapsed at apressure of 0.5 MPa after the gas had been removed byequilibration under vacuum. (In such a state the gas vesiclebecomes a vacuum vesicle). When the suspension was reequili-brated under air, air returned to gas vesicles, providing themwith 0.1 MPa of internal support and their collapse pressurereturned to 0.6 MPa (230).By equilibrating suspensions of gas vesicles with gas at
pressures above the ambient pressures, the pressure requiredto collapse them could be increased. It was observed that whenthe gas pressure was raised slowly over a suspension, thesurface layer remained turbid while the rest of the suspensionclarified (Fig. 16). The explanation for this is as follows. As thepressure of the gas was raised, it instantaneously generated anequivalent hydrostatic pressure throughout the suspension,which, when it was high enough, caused gas vesicles to collapse.At the surface of the suspension, however, gas diffused into thewater and thence into the gas vesicles, so that the pressuredifference across the gas vesicle walls did not become highenough to cause collapse (see Critical Pressure, below). Thediffusion coefficient (D) of gases into water is so low (for 02and N2, D = 2 x 10-' m2 s-1) that little of the gas diffusesmuch farther than 1 mm into the suspension. (The exponentialfolding time, te, for the gas concentration to reach lie (i.e.,0.37) of the surface concentration at a distance xe below thesurface is given by te = xe2I4D; hence, at a depth of 1 mm, teexceeds 2 min).
Such gas pressure rise experiments, performed with differentpure gases, showed that the Anabaena gas vesicles werepermeable to H2, N2, 02, C02, CO, CH4, and Ar (230). Thelargest gas molecule that has been shown to penetrate isperfluorocyclobutane (C4F8) (243), which has a collision diam-eter of 0.63 nm, compared with 0.36 nm for N2 (245). Pores
a 0.1 MPa
KiIiii +~~ (0.1)
Zoii~3.~-" (0.1)
b 0.5 0.7
(0.4)
(0.1)
Pressures of gas (and partial pressures of dissolved gas) in MPa.
FIG. 16. Diagram showing why gas vesicles survive near the gas-water interface when the pressure of the overlying gas phase isincreased above the critical pressure. (a) The suspension initiallycontains dissolved air at a partial pressure (c) of 0.1 MPa (1 bar), thepressure of the overlying air; the gas-permeable gas vesicles thereforealso contain air at 0.1 MPa. (b) As the overlying gas pressure is slowlyraised, gas diffuses into the surface layers of suspension and the gasvesicles there, but it does not reach the deeper layers. (c) When thepressure in the overlying gas phase reaches 0.7 MPa (0.6 MPa abovethe original air pressure), the net pressure (pn) difference across thewall of gas vesicles deep in the solution reaches 0.6 MPa, equal to thecritical pressure (pc); these gas vesicles collapse. For gas vesiclescontaining elevated gas pressures near the surface, p, remains belowpc; these gas vesicles survive intact (230).
with a diameter of at least 0.63 nm must therefore occur in thegas vesicle wall. The size of pores in the structure is bound tofluctuate, however, because although the gas vesicle wall isrigid and the proteins are ordered in crystalline array, vibra-tions will occur in the amino acid residues that border thepores (72, 143). The time-averaged diameter of the pore couldtherefore be less than 0.63 nm (245).
Other gases with a collision diameter smaller than that ofC4F8 must also be able to enter the gas vesicle. This probablyincludes all gases known to have a vapor pressure greater than0.2 MPa (i.e., 1 bar above atmospheric pressure). It alsoincludes the vapors of many liquids that have lower vaporpressures. Of particular interest is water, with a vapor pressureof only 0.0023 MPa at 20°C. This vapor pressure is so low thatnone of the methods used to prove the permeability of gasvesicles to gases can be used to demonstrate their permeabilityto water. The water molecule is so much smaller than C4F8,however, that there is no reason to believe that water vapor willnot enter the gas vesicle.How quickly does gas get into the gas vesicle? To determine
the diffusion rate of gases into the gas vesicle, attempts weremade to find a threshold rate of gas pressure rise that would bejust sufficient to cause gas vesicle collapse, using dried films ofgas vesicles to obviate the complications of diffusion through asurrounding water layer. The idea behind this experiment canbe explained as follows.
Imagine a gas vesicle in an evacuated chamber (Fig. 17a). Attime zero a valve connecting the chamber to a tank ofcompressed gas is opened and gas flows in at an exponentialrate X, recorded by a transducer, until it reaches the samepressure as in the tank, p'. As the pressure, pC, rises in thechamber, gas starts to enter the gas vesicle, at another expo-nential rate oa, and the pressure inside it, p, also rises but, ofcourse, always lags behind p0 (Fig. 17b). The differencebetween the pressures outside and inside the gas vesicle isgiven byp0 - p, which reaches a maximum Af(m and then falls.The gas vesicle collapses if A/Pm exceeds its critical pressure, p,(see Critical Pressure, below). A rate of pressure rise, X, is
MICROBIOL. REV.

GAS VESICLES 113
(a)
2r
.- - _1/0.~~~~~~~
U,~~~~~~~~~~~~~~~~.0
@ / ~~/a / //
0
. /T~ __ 7-
0 0.1 0.2 0.3 0.4time (ms)
(b)
FIG. 17. (a) Representation of the method used to determine therate at which gas fills a gas vesicle (either isolated from a cell or insidea cell --- ]) enclosed in a chamber. (b) The pressure, p0, in thechamber rises at the exponential rate to the pressurep' in the tank;the pressurep in the gas vesicle rises at rate ox. If p0 rises fast enough,the difference between p0 and p reaches a maximum value Apm thatexceeds the critical pressure, pc, of the gas vesicle, which collapses; a
can then be determined. Modified from Walsby (245, 246) withpermission from the publisher.
found which causes half the gas vesicles in such a chamber tocollapse. It is then known that Apm = pc, and the onlyunknown, ao, can be calculated. The exponential filling time ofthe gas vesicle, te, is the reciprocal of this; i.e., t, = 1/a. Detailsof the method are given by Walsby (245, 246).
Dried Anabaena gas vesicles remained intact even after thefastest pressure rise investigated (0 to 4.6 MPa [46 bar] in 2ms). From this it could be calculated that a exceeded 22 x 103s1- and that the exponential filling time, te, was less than 46 ,us(245); as was later shown (264), it was nearly 100-fold less (seebelow, Can the Gas Vesicle Provide a Gas Diffusion Chan-nel?). This experiment can be adapted to determine howquickly gases diffuse inside gas-vacuolate cells, which, partlybecause they are much larger, fill much more slowly than gas
vesicles. (The method has been used to demonstrate that thefilling time of cyanobacterial heterocysts with oxygen was 3.3 s,
much longer than for vegetative cells [246]).Can the gas vesicle provide a gas diffusion channel? It has
been suggested that gas vesicles might provide gas diffusionchannels (211). Are they permeable enough to do this? For gas
to diffuse through a gas vesicle, it would have to pass in
through the wall on one side, across the negligible resistance ofthe gas space, and out through the opposite wall. Could it dothis faster than it would diffuse through a similar length ofwater? The permeability coefficient of the gas vesicle wall, K, iSrelated to the filling coefficient a by the expression
K = atV/A0
where Vis the volume of the gas space, 2.14 x 10⁶ nm3 for theAnabaena gas vesicle, and Ao is the area of the outer surface,0.120 x 106 nm2 (254); hence, from the lower limit of a = 22X 103 S-1, it can be calculated that the minimum value of Kwould be 392,um s-l. The length, L, of a water layer with thesame permeability as two gas vesicle walls would be 2D/K,where D is the diffusivity of 02 in water, 2,000 um2 s-5.Substituting the minimum value of K gives L = 10 ,um, muchlonger than the length of the Anabaena gas vesicle (about 0.5mm). Clearly, this minimum value of K would not allow the gasvesicle to function as a gas diffusion channel.What this analysis suggested, however, was that if the
diffusivity of gas through a gas vesicle suspension could bemeasured, it would be possible to work back through thesecalculations and derive the permeability coefficient, K (245).We have recently achieved this for oxygen gas by using oxygenmicroelectrodes (264). Stable concentration gradients of oxy-gen were allowed to develop across a concentrated suspensionof Microcystis gas vesicles supported over a layer of waterimmobilized in agar between pure oxygen gas below and air(20% oxygen) above (Fig. 18). The gradient of oxygen concen-tration (dCldx) was slightly steeper in the gas vesicle suspen-sion than in the water; since the oxygen flux across the twolayers would have been uniform, the diffusivity of oxygen musthave been slightly lower. From measurements of the volumefraction of gas vesicles in the suspensions, it was possible toobtain an estimate of the filling coefficient, a, and from this theexponential filling time, te = 0.4 [Ls, and the permeabilitycoefficient of the membrane, K = 32 mm s5-l (264). This valueis more than 1,000-fold higher than the gas permeabilitycoefficient of a C16 lipid monolayer, about 20 ,um s5-1 (13). Thefilling time for the larger Anabaena gas vesicle would be te =0.55 Rs, assuming the same value of K.
In the gas vesicle suspension the gas vesicles would havebeen randomly oriented. If they had been oriented parallel tothe diffusion gradient, however, it is calculated that they wouldhave provided a channel with a diffusivity about threefoldhigher than in water (264). Oriented bundles of gas vesiclesmight therefore increase gas permeabilities in cells, butwhether this would provide any benefit is another question. Idoubt it; the exponential folding time for gas diffusion acrossthe 5-,m diameter of a cell would be only 3.1 ms. Across a1-mm colony of such cells the folding time for diffusion is muchgreater, 125 s, but gas vesicles occupy too small a proportion ofthe volume of a colony to have much effect on diffusion rates.
Pores in the gas vesicle wall. Gas molecules permeating thegas vesicle must pass through pores, large enough to accom-modate them, that are located either between or within the gasvesicle proteins. From measurements of the gas permeabilitycoefficient, K, it is possible to determine the number of pores ofa given size (or, vice versa, the size of the pores if their numberwere known) by using the kinetic theory of gases. In summary,this is done by calculating the average time it would takebefore a gas molecule of known collision diameter, bouncingaround inside a gas vesicle at the speed of sound, finds atrajectory that leads out of a single pore in the wall (245).The pores in the gas vesicle wall probably occur alongside
other periodic structures. If there were one pore in each of the107 ribs of the averageAnabaena gas vesicle, for example, suchpores would have a time-averaged diameter of 1.2 nm, aboutthe size of one of the GvpA molecules; if there were a poreassociated with each of the 21,000 GvpA molecules, however,they would need a diameter of only 0.44 nm to account for theobserved value of K (264). It is noted that the molecular modelof the gas vesicle structure contains an opening of this sizeadjacent to the ,-turn of each GvpA (Fig. 11).
VOL. 58, 1994
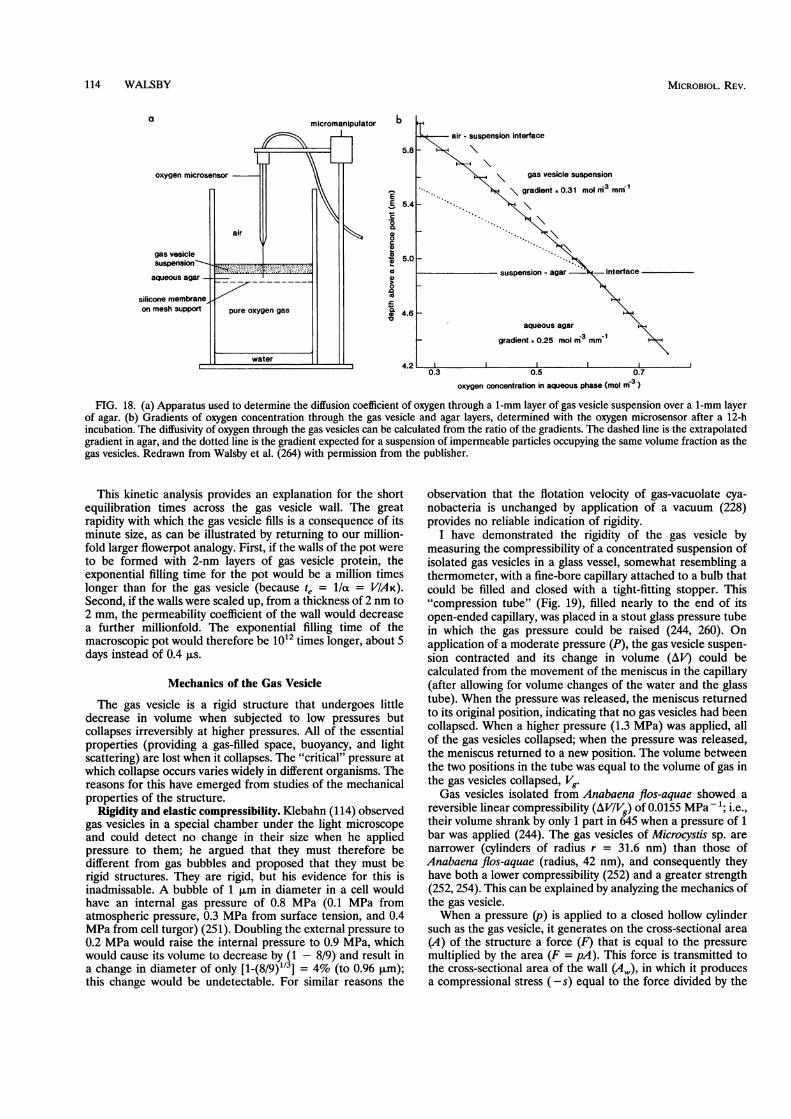
114 WALSBY
a
oxygen microsensor
gas vesiclesuspension~--
aqueous agar -
silicone membraneon mesh support
air
pure oxygen gas
water
micromanipulator b
5.
E
E 5
D
0e
c
a
-4'
oxygen concentration in aqueous phase (mol m3)
FIG. 18. (a) Apparatus used to determine the diffusion coefficient of oxygen through a 1-mm layer of gas vesicle suspension over a 1-mm layerof agar. (b) Gradients of oxygen concentration through the gas vesicle and agar layers, determined with the oxygen microsensor after a 12-hincubation. The diffusivity of oxygen through the gas vesicles can be calculated from the ratio of the gradients. The dashed line is the extrapolatedgradient in agar, and the dotted line is the gradient expected for a suspension of impermeable particles occupying the same volume fraction as thegas vesicles. Redrawn from Walsby et al. (264) with permission from the publisher.
This kinetic analysis provides an explanation for the shortequilibration times across the gas vesicle wall. The greatrapidity with which the gas vesicle fills is a consequence of itsminute size, as can be illustrated by returning to our million-fold larger flowerpot analogy. First, if the walls of the pot wereto be formed with 2-nm layers of gas vesicle protein, theexponential filling time for the pot would be a million timeslonger than for the gas vesicle (because te = 1/o = V/AK).Second, if the walls were scaled up, from a thickness of 2 nm to2 mm, the permeability coefficient of the wall would decreasea further millionfold. The exponential filling time of themacroscopic pot would therefore be 1012 times longer, about 5days instead of 0.4 us.
Mechanics of the Gas Vesicle
The gas vesicle is a rigid structure that undergoes littledecrease in volume when subjected to low pressures butcollapses irreversibly at higher pressures. All of the essentialproperties (providing a gas-filled space, buoyancy, and lightscattering) are lost when it collapses. The "critical" pressure atwhich collapse occurs varies widely in different organisms. Thereasons for this have emerged from studies of the mechanicalproperties of the structure.
Rigidity and elastic compressibility. Klebahn (114) observedgas vesicles in a special chamber under the light microscopeand could detect no change in their size when he appliedpressure to them; he argued that they must therefore bedifferent from gas bubbles and proposed that they must berigid structures. They are rigid, but his evidence for this isinadmissable. A bubble of 1 jim in diameter in a cell wouldhave an internal gas pressure of 0.8 MPa (0.1 MPa fromatmospheric pressure, 0.3 MPa from surface tension, and 0.4MPa from cell turgor) (251). Doubling the external pressure to0.2 MPa would raise the internal pressure to 0.9 MPa, whichwould cause its volume to decrease by (1 - 8/9) and result ina change in diameter of only [1-(8/9)1/3] = 4% (to 0.96 jim);this change would be undetectable. For similar reasons the
observation that the flotation velocity of gas-vacuolate cya-nobacteria is unchanged by application of a vacuum (228)provides no reliable indication of rigidity.
I have demonstrated the rigidity of the gas vesicle bymeasuring the compressibility of a concentrated suspension ofisolated gas vesicles in a glass vessel, somewhat resembling athermometer, with a fine-bore capillary attached to a bulb thatcould be filled and closed with a tight-fitting stopper. This"compression tube" (Fig. 19), filled nearly to the end of itsopen-ended capillary, was placed in a stout glass pressure tubein which the gas pressure could be raised (244, 260). Onapplication of a moderate pressure (P), the gas vesicle suspen-sion contracted and its change in volume (AlP) could becalculated from the movement of the meniscus in the capillary(after allowing for volume changes of the water and the glasstube). When the pressure was released, the meniscus returnedto its original position, indicating that no gas vesicles had beencollapsed. When a higher pressure (1.3 MPa) was applied, allof the gas vesicles collapsed; when the pressure was released,the meniscus returned to a new position. The volume betweenthe two positions in the tube was equal to the volume of gas inthe gas vesicles collapsed, Vg.Gas vesicles isolated from Anabaena flos-aquae showed a
reversible linear compressibility (AV/IVg) of 0.0155 MPa- ; i.e.,their volume shrank by only 1 part in 645 when a pressure of 1bar was applied (244). The gas vesicles of Microcystis sp. arenarrower (cylinders of radius r = 31.6 nm) than those ofAnabaena flos-aquae (radius, 42 nm), and consequently theyhave both a lower compressibility (252) and a greater strength(252, 254). This can be explained by analyzing the mechanics ofthe gas vesicle.When a pressure (p) is applied to a closed hollow cylinder
such as the gas vesicle, it generates on the cross-sectional area(A) of the structure a force (F) that is equal to the pressuremultiplied by the area (F = pA). This force is transmitted tothe cross-sectional area of the wall (A,), in which it producesa compressional stress (-s) equal to the force divided by the
I
I
T.."I
H
I
MICROBIOL. REV.

GAS VESICLES 115VOL. 58, 1994
| vernier microscope
a_ I
= P= 0.5MPa-_=I
, ...L.reversible elastic compressibility
11-~~~~~~~~~~~~~. ---b_IrP s1c3MPaonr-to
irrevrsible contract ion
FIG. 19. Principle of the compression tube used in making measurements of gas vesicle compressibility and gas volume. The inner compressiontube is filled with the gas vesicle suspension into the 0.1-mm precision bore capillary. The position of the meniscus in the capillary is located witha vernier microscope. When the gas pressure in the outer pressure tube is raised by a small amount, the pressure is transmitted to the suspensionin the open capillary. Volume changes are indicated by the change in position of the meniscus: (a) reversible changes due to elastic compressibilityof the gas vesicle; (b) irreversible changes due to collapse of the gas vesicle (the gas dissolves). Modified from Walsby (244) with permission fromthe publisher.
wall area (-s = FIA,); extensional stresses are conventionallyregarded as positive, and compressional stresses are negative.Hence -s = pAIA,. Two important consequences emerge.The first is that the stress in the wall of a compressed
cylinder is proportional to prit, where r is the cylinder radiusand t is the wall thickness. The gas vesicle wall is likely to be ofa similar thickness (t = 1.8 nm) in different species because itis made up of homologous proteins. The stress will thereforebe proportional to the radius; i.e., wider gas vesicles will havea higher wall stress and a higher compressibility.The second consequence is that because the ratio of AIA,
varies in different directions, the stress varies in differentdirections within the wall. For geometrical reasons, the longi-tudinal compressional stress (-s,) in the wall is
-SI = pffr2I2lTrt = prl2t (4)
whereas the same pressure generates a transverse stress (-s,)in the wall of
-st = p2rll2tl = prlt (5)Hence the transverse stress is twice the longitudinal stress. If acylindrical engineering structure is to be reinforced with rodsor fibers to withstand stresses, it is necessary to put twice asmany running transversely around the cylinder as longitudi-nally along it. Alternatively, fibers may be wound diagonally atsuch an angle that the resultant stresses set up in them fromthe two directions are equal; the unique angle to the long axisof the cylinder at which this happens, sometimes referred to asthe magic angle by engineers, is
+ = tan-1A/2 = 54.70 (6)
The reader may be familiar with hosepipes reinforced by nyloncord, which is ideally oriented at this angle. It has been noted(248) that the hydrogen bonds between the 13-chains of GvpAof the gas vesicle are oriented within 10 of the magic angle (i.e.,at 53.80 to the principal axis of the cylindrical gas vesicle). Insuch an orientation they will be subjected to the least distor-tion.The stresses in the gas vesicle wall determine how much the
structure is compressed and, ultimately, the pressure at which
it collapses. These two properties are now analyzed in furtherdetail (244, 252).
Young's modulus of the gas vesicle wall. The compressibilityof the gas vesicle is determined by two elastic properties of theprotein that constitutes its wall, Young's modulus and thePoisson ratio, which I will briefly explain.
Imagine a rod of length L and cross-sectional area a made ofgas vesicle protein. A small compressional force applied to theends of the rod induces in it a stress, - s, so that it changeslength by an amount - AL. The relative length change - AL/Lis the strain, and the ratio of the stress to the strain gives ameasure of the stiffness of the material, known as Young'smodulus (Y):
Y= -s/(-AL/L). (7)
As the force is applied, not only does the rod get shorter butalso its width, w, increases by an amount Aw. The ratio of thislateral strain (Aw/w) to the longitudinal strain (- AL/L) isknown as the Poisson ratio (or). We do not know its value forthe gas vesicle protein, but an average value for Newtoniansolids is 0.33.We now recast the protein in the rod into the shape of a gas
vesicle, with a cylinder of radius r and wall thickness t. Wesubject this gas vesicle to a pressure p and measure how muchit shrinks in volume. (Note that when we do this, the pressureof the gas remains at 1 bar because the gas remains inequilibrium with the air dissolved in the surrounding medium,whose concentration is not affected by the hydrostatic pressureper se.) The cylinder becomes narrower and shorter to adegree determined by its relative dimensions and by Y and a.The overall relative volume change can be calculated (157) tobe
AVIV = pr(4a - 5)/2Yt (8)
This equation can be used to determine Young's modulus ofthe gas vesicle from measurements of its cylinder radius, wallthickness, and compressibility. (Although a is not preciselyknown, the likely range of values gives only a 20% variation inY.) For the Microcystis gas vesicle protein, Y = 3.8 GPa (252).A somewhat lower value, 2.8 GPa, was found for the Anabaenagas vesicle protein (244); this may be explained by the deteri-
I - ..--
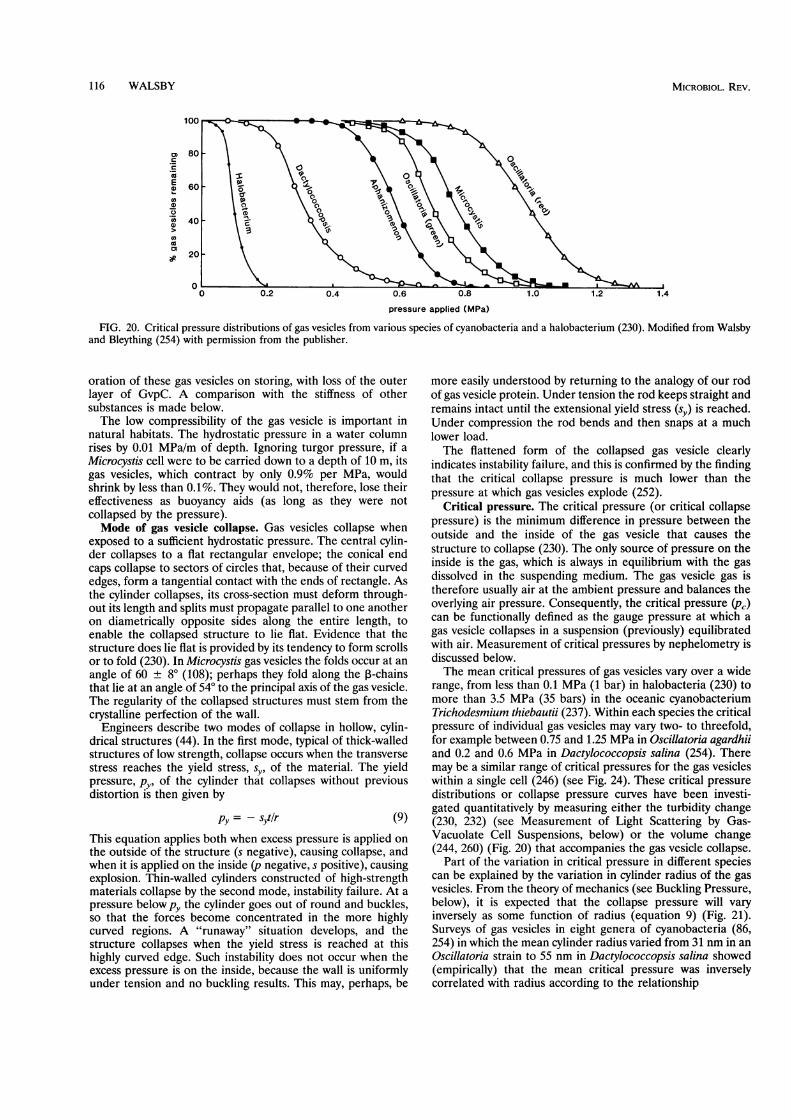
116 WALSBY
co
r-E
0.2co
(D
*
1.4
pressure applied (MPa)
FIG. 20. Critical pressure distributions of gas vesicles from various species of cyanobacteria and a halobacterium (230). Modified from Walsbyand Bleything (254) with permission from the publisher.
oration of these gas vesicles on storing, with loss of the outerlayer of GvpC. A comparison with the stiffness of othersubstances is made below.The low compressibility of the gas vesicle is important in
natural habitats. The hydrostatic pressure in a water columnrises by 0.01 MPa/m of depth. Ignoring turgor pressure, if aMicrocystis cell were to be carried down to a depth of 10 m, itsgas vesicles, which contract by only 0.9% per MPa, wouldshrink by less than 0.1%. They would not, therefore, lose theireffectiveness as buoyancy aids (as long as they were notcollapsed by the pressure).Mode of gas vesicle collapse. Gas vesicles collapse when
exposed to a sufficient hydrostatic pressure. The central cylin-der collapses to a flat rectangular envelope; the conical endcaps collapse to sectors of circles that, because of their curvededges, form a tangential contact with the ends of rectangle. Asthe cylinder collapses, its cross-section must deform through-out its length and splits must propagate parallel to one anotheron diametrically opposite sides along the entire length, toenable the collapsed structure to lie flat. Evidence that thestructure does lie flat is provided by its tendency to form scrollsor to fold (230). In Microcystis gas vesicles the folds occur at anangle of 60 ± 80 (108); perhaps they fold along the ,B-chainsthat lie at an angle of 540 to the principal axis of the gas vesicle.The regularity of the collapsed structures must stem from thecrystalline perfection of the wall.
Engineers describe two modes of collapse in hollow, cylin-drical structures (44). In the first mode, typical of thick-walledstructures of low strength, collapse occurs when the transversestress reaches the yield stress, sy, of the material. The yieldpressure, py, of the cylinder that collapses without previousdistortion is then given by
py =-syt/r (9)
This equation applies both when excess pressure is applied onthe outside of the structure (s negative), causing collapse, andwhen it is applied on the inside (p negative, s positive), causingexplosion. Thin-walled cylinders constructed of high-strengthmaterials collapse by the second mode, instability failure. At apressure below py the cylinder goes out of round and buckles,so that the forces become concentrated in the more highlycurved regions. A "runaway" situation develops, and thestructure collapses when the yield stress is reached at thishighly curved edge. Such instability does not occur when theexcess pressure is on the inside, because the wall is uniformlyunder tension and no buckling results. This may, perhaps, be
more easily understood by returning to the analogy of our rodof gas vesicle protein. Under tension the rod keeps straight andremains intact until the extensional yield stress (sy) is reached.Under compression the rod bends and then snaps at a muchlower load.The flattened form of the collapsed gas vesicle clearly
indicates instability failure, and this is confirmed by the findingthat the critical collapse pressure is much lower than thepressure at which gas vesicles explode (252).
Critical pressure. The critical pressure (or critical collapsepressure) is the minimum difference in pressure between theoutside and the inside of the gas vesicle that causes thestructure to collapse (230). The only source of pressure on theinside is the gas, which is always in equilibrium with the gasdissolved in the suspending medium. The gas vesicle gas istherefore usually air at the ambient pressure and balances theoverlying air pressure. Consequently, the critical pressure (pa)can be functionally defined as the gauge pressure at which agas vesicle collapses in a suspension (previously) equilibratedwith air. Measurement of critical pressures by nephelometry isdiscussed below.The mean critical pressures of gas vesicles vary over a wide
range, from less than 0.1 MPa (1 bar) in halobacteria (230) tomore than 3.5 MPa (35 bars) in the oceanic cyanobacteriumTrichodesmium thiebautii (237). Within each species the criticalpressure of individual gas vesicles may vary two- to threefold,for example between 0.75 and 1.25 MPa in Oscillatoria agardhiiand 0.2 and 0.6 MPa in Dactylococcopsis salina (254). Theremay be a similar range of critical pressures for the gas vesicleswithin a single cell (246) (see Fig. 24). These critical pressuredistributions or collapse pressure curves have been investi-gated quantitatively by measuring either the turbidity change(230, 232) (see Measurement of Light Scattering by Gas-Vacuolate Cell Suspensions, below) or the volume change(244, 260) (Fig. 20) that accompanies the gas vesicle collapse.
Part of the variation in critical pressure in different speciescan be explained by the variation in cylinder radius of the gasvesicles. From the theory of mechanics (see Buckling Pressure,below), it is expected that the collapse pressure will varyinversely as some function of radius (equation 9) (Fig. 21).Surveys of gas vesicles in eight genera of cyanobacteria (86,254) in which the mean cylinder radius varied from 31 nm in anOscillatoria strain to 55 nm in Dactylococcopsis salina showed(empirically) that the mean critical pressure was inverselycorrelated with radius according to the relationship
MICROBIOL. REV.
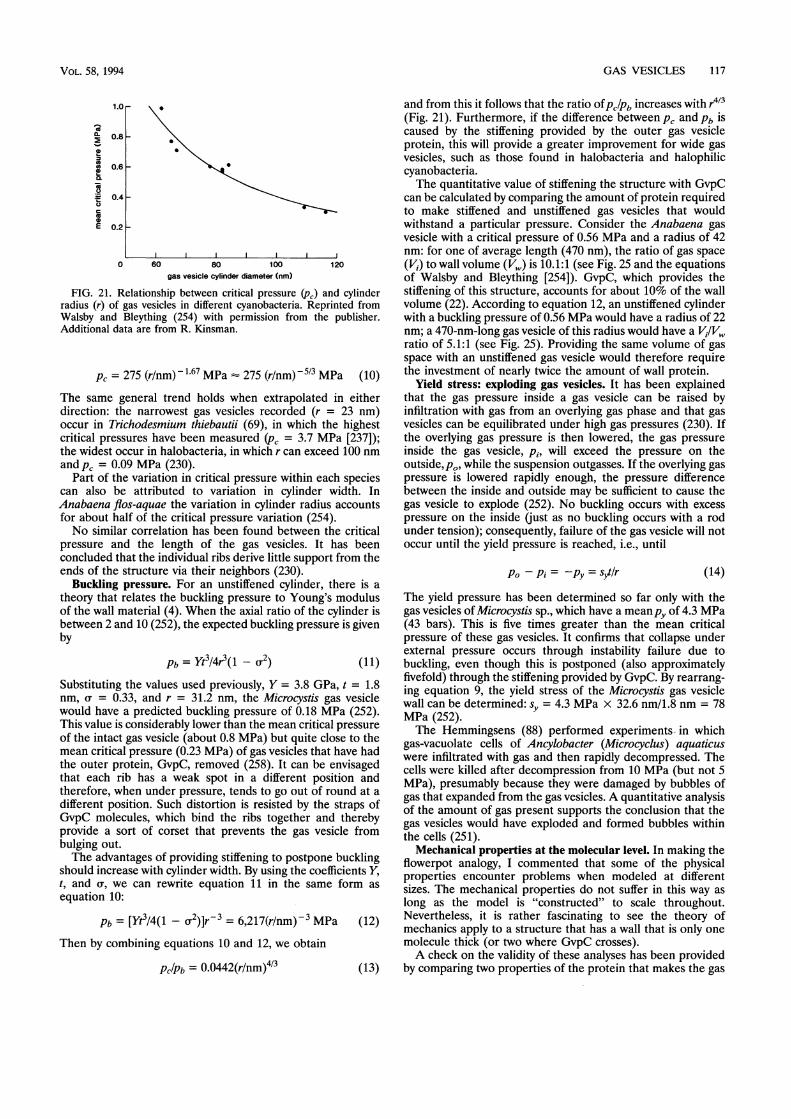
GAS VESICLES 117
0O.1
0
0EL
1.0 r
0.8 -
0.6 -
0.4k
0.2 ~
0 60 80 100gas vesicle cylinder diameter (nm)
120
FIG. 21. Relationship between critical pressure (p,) and cylinderradius (r) of gas vesicles in different cyanobacteria. Reprinted fromWalsby and Bleything (254) with permission from the publisher.Additional data are from R. Kinsman.
Pc = 275 (r/nm) -1.67 MPa 275 (r/nm) -5/3 MPa (10)The same general trend holds when extrapolated in eitherdirection: the narrowest gas vesicles recorded (r = 23 nm)occur in Trichodesmium thiebautii (69), in which the highestcritical pressures have been measured (pc = 3.7 MPa [237]);the widest occur in halobacteria, in which r can exceed 100 nmand pc = 0.09 MPa (230).
Part of the variation in critical pressure within each speciescan also be attributed to variation in cylinder width. InAnabaena flos-aquae the variation in cylinder radius accountsfor about half of the critical pressure variation (254).No similar correlation has been found between the critical
pressure and the length of the gas vesicles. It has beenconcluded that the individual ribs derive little support from theends of the structure via their neighbors (230).
Buckling pressure. For an unstiffened cylinder, there is atheory that relates the buckling pressure to Young's modulusof the wall material (4). When the axial ratio of the cylinder isbetween 2 and 10 (252), the expected buckling pressure is givenby
Pb = YtI/4r3(1 _ u2) (11)Substituting the values used previously, Y = 3.8 GPa, t = 1.8nm, a = 0.33, and r = 31.2 nm, the Microcystis gas vesiclewould have a predicted buckling pressure of 0.18 MPa (252).This value is considerably lower than the mean critical pressureof the intact gas vesicle (about 0.8 MPa) but quite close to themean critical pressure (0.23 MPa) of gas vesicles that have hadthe outer protein, GvpC, removed (258). It can be envisagedthat each rib has a weak spot in a different position andtherefore, when under pressure, tends to go out of round at adifferent position. Such distortion is resisted by the straps ofGvpC molecules, which bind the ribs together and therebyprovide a sort of corset that prevents the gas vesicle frombulging out.The advantages of providing stiffening to postpone buckling
should increase with cylinder width. By using the coefficients Y,t, and a, we can rewrite equation 11 in the same form asequation 10:
Pb = [Yt3/4(1 - 2)]r-3 = 6,217(r/nm) -3 MPa (12)Then by combining equations 10 and 12, we obtain
Pc/Pb = 0.0442(r/nm)4/3 (13)
and from this it follows that the ratio OfPC/Pb increases with r4e3(Fig. 21). Furthermore, if the difference between p, and Pb iscaused by the stiffening provided by the outer gas vesicleprotein, this will provide a greater improvement for wide gasvesicles, such as those found in halobacteria and halophiliccyanobacteria.The quantitative value of stiffening the structure with GvpC
can be calculated by comparing the amount of protein requiredto make stiffened and unstiffened gas vesicles that wouldwithstand a particular pressure. Consider the Anabaena gasvesicle with a critical pressure of 0.56 MPa and a radius of 42nm: for one of average length (470 nm), the ratio of gas space(Vi) to wall volume (V,) is 10.1:1 (see Fig. 25 and the equationsof Walsby and Bleything [254]). GvpC, which provides thestiffening of this structure, accounts for about 10% of the wallvolume (22). According to equation 12, an unstiffened cylinderwith a buckling pressure of 0.56 MPa would have a radius of 22nm; a 470-nm-long gas vesicle of this radius would have a VJ/V,ratio of 5.1:1 (see Fig. 25). Providing the same volume of gasspace with an unstiffened gas vesicle would therefore requirethe investment of nearly twice the amount of wall protein.
Yield stress: exploding gas vesicles. It has been explainedthat the gas pressure inside a gas vesicle can be raised byinfiltration with gas from an overlying gas phase and that gasvesicles can be equilibrated under high gas pressures (230). Ifthe overlying gas pressure is then lowered, the gas pressureinside the gas vesicle, pi, will exceed the pressure on theoutside, p0, while the suspension outgasses. If the overlying gaspressure is lowered rapidly enough, the pressure differencebetween the inside and outside may be sufficient to cause thegas vesicle to explode (252). No buckling occurs with excesspressure on the inside (just as no buckling occurs with a rodunder tension); consequently, failure of the gas vesicle will notoccur until the yield pressure is reached, i.e., until
Po - Pi = -py = syt/r (14)
The yield pressure has been determined so far only with thegas vesicles of Microcystis sp., which have a meanpy of 4.3 MPa(43 bars). This is five times greater than the mean criticalpressure of these gas vesicles. It confirms that collapse underexternal pressure occurs through instability failure due tobuckling, even though this is postponed (also approximatelyfivefold) through the stiffening provided by GvpC. By rearrang-ing equation 9, the yield stress of the Microcystis gas vesiclewall can be determined: sy = 4.3 MPa x 32.6 nm/1.8 nm = 78MPa (252).The Hemmingsens (88) performed experiments in which
gas-vacuolate cells of Ancylobacter (Microcyclus) aquaticuswere infiltrated with gas and then rapidly decompressed. Thecells were killed after decompression from 10 MPa (but not 5MPa), presumably because they were damaged by bubbles ofgas that expanded from the gas vesicles. A quantitative analysisof the amount of gas present supports the conclusion that thegas vesicles would have exploded and formed bubbles withinthe cells (251).
Mechanical properties at the molecular level. In making theflowerpot analogy, I commented that some of the physicalproperties encounter problems when modeled at differentsizes. The mechanical properties do not suffer in this way aslong as the model is "constructed" to scale throughout.Nevertheless, it is rather fascinating to see the theory ofmechanics apply to a structure that has a wall that is only onemolecule thick (or two where GvpC crosses).A check on the validity of these analyses has been provided
by comparing two properties of the protein that makes the gas
VOL. 58, 1994
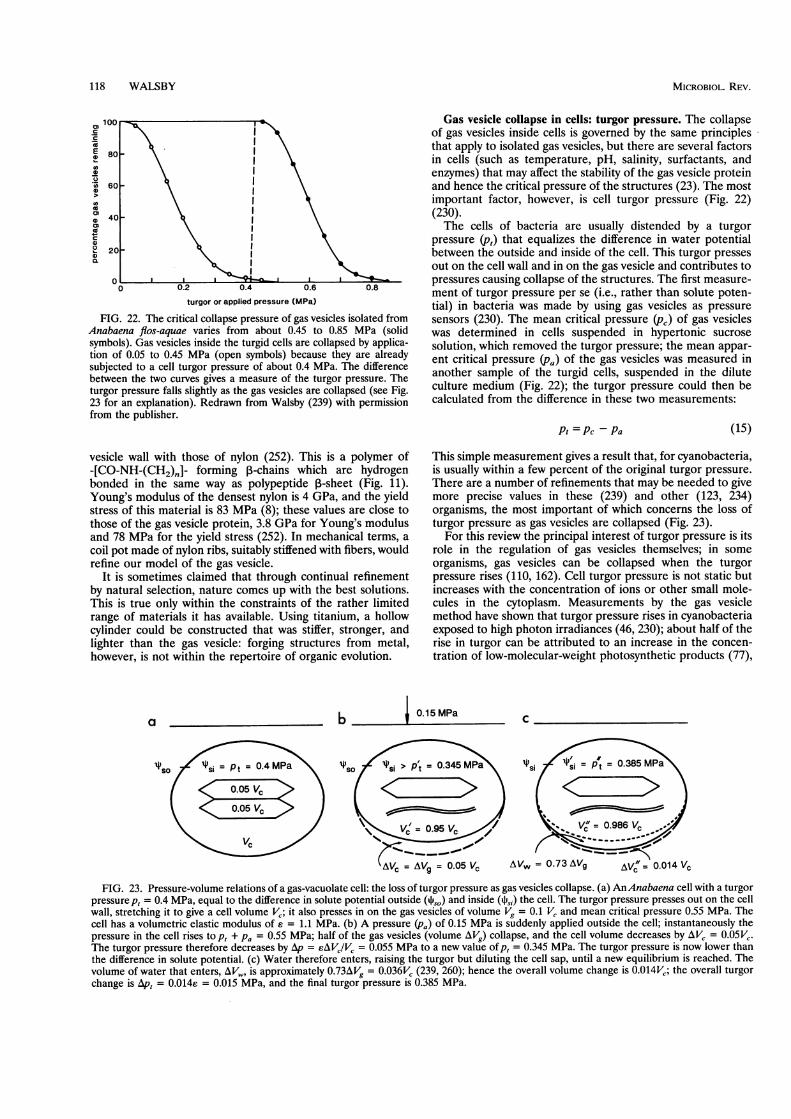
118 WALSBY
turgor or applied pressure (MPa)
FIG. 22. The critical collapse pressure of gas vesicles isolated fromAnabaena flos-aquae varies from about 0.45 to 0.85 MPa (solidsymbols). Gas vesicles inside the turgid cells are collapsed by applica-tion of 0.05 to 0.45 MPa (open symbols) because they are alreadysubjected to a cell turgor pressure of about 0.4 MPa. The differencebetween the two curves gives a measure of the turgor pressure. Theturgor pressure falls slightly as the gas vesicles are collapsed (see Fig.23 for an explanation). Redrawn from Walsby (239) with permissionfrom the publisher.
vesicle wall with those of nylon (252). This is a polymer of-[CO-NH-(CH2)n]- forming p-chains which are hydrogenbonded in the same way as polypeptide ,-sheet (Fig. 11).Young's modulus of the densest nylon is 4 GPa, and the yieldstress of this material is 83 MPa (8); these values are close tothose of the gas vesicle protein, 3.8 GPa for Young's modulusand 78 MPa for the yield stress (252). In mechanical terms, acoil pot made of nylon ribs, suitably stiffened with fibers, wouldrefine our model of the gas vesicle.
It is sometimes claimed that through continual refinementby natural selection, nature comes up with the best solutions.This is true only within the constraints of the rather limitedrange of materials it has available. Using titanium, a hollowcylinder could be constructed that was stiffer, stronger, andlighter than the gas vesicle: forging structures from metal,however, is not within the repertoire of organic evolution.
ba -
"so
Gas vesicle collapse in cells: turgor pressure. The collapseof gas vesicles inside cells is governed by the same principlesthat apply to isolated gas vesicles, but there are several factorsin cells (such as temperature, pH, salinity, surfactants, andenzymes) that may affect the stability of the gas vesicle proteinand hence the critical pressure of the structures (23). The mostimportant factor, however, is cell turgor pressure (Fig. 22)(230).The cells of bacteria are usually distended by a turgor
pressure (pt,) that equalizes the difference in water potentialbetween the outside and inside of the cell. This turgor pressesout on the cell wall and in on the gas vesicle and contributes topressures causing collapse of the structures. The first measure-ment of turgor pressure per se (i.e., rather than solute poten-tial) in bacteria was made by using gas vesicles as pressuresensors (230). The mean critical pressure (p,) of gas vesicleswas determined in cells suspended in hypertonic sucrosesolution, which removed the turgor pressure; the mean appar-ent critical pressure (pa) of the gas vesicles was measured inanother sample of the turgid cells, suspended in the diluteculture medium (Fig. 22); the turgor pressure could then becalculated from the difference in these two measurements:
Pt = Pc - Pa (15)
This simple measurement gives a result that, for cyanobacteria,is usually within a few percent of the original turgor pressure.There are a number of refinements that may be needed to givemore precise values in these (239) and other (123, 234)organisms, the most important of which concerns the loss ofturgor pressure as gas vesicles are collapsed (Fig. 23).
For this review the principal interest of turgor pressure is itsrole in the regulation of gas vesicles themselves; in someorganisms, gas vesicles can be collapsed when the turgorpressure rises (110, 162). Cell turgor pressure is not static butincreases with the concentration of ions or other small mole-cules in the cytoplasm. Measurements by the gas vesiclemethod have shown that turgor pressure rises in cyanobacteriaexposed to high photon irradiances (46, 230); about half of therise in turgor can be attributed to an increase in the concen-tration of low-molecular-weight photosynthetic products (77),
0.15MPa c
kAVc = AVg = 0.05 Vc
FIG. 23. Pressure-volume relations of a gas-vacuolate cell: the loss of turgor pressure as gas vesicles collapse. (a) AnAnabaena cell with a turgorpressure p, = 0.4 MPa, equal to the difference in solute potential outside (tIo) and inside (ir,,i) the cell. The turgor pressure presses out on the cellwall, stretching it to give a cell volume V,; it also presses in on the gas vesicles of volume Vg = 0.1 V, and mean critical pressure 0.55 MPa. Thecell has a volumetric elastic modulus of e = 1.1 MPa. (b) A pressure (pa) of 0.15 MPa is suddenly applied outside the cell; instantaneously thepressure in the cell rises to pt + Pa = 0.55 MPa; half of the gas vesicles (volume AVg) collapse, and the cell volume decreases by AV, = 0.05V,.The turgor pressure therefore decreases by Ap = sAVIV, = 0.055 MPa to a new value of pt = 0.345 MPa. The turgor pressure is now lower thanthe difference in solute potential. (c) Water therefore enters, raising the turgor but diluting the cell sap, until a new equilibrium is reached. Thevolume of water that enters, AVw, is approximately 0.73A1Vg = 0.036V, (239, 260); hence the overall volume change is 0.014V,; the overall turgorchange is Apt = 0.014s = 0.015 MPa, and the final turgor pressure is 0.385 MPa.
MICROBIOL. REV.

GAS VESICLES 119
- .........................~~~~ ~ ~~~~~~~~..... . ........ ........... e
(c)
e
*. .... .... : .... : ::.: ::: S: .......... ::: ~~~~~~~~~~~.........::...
(f)~ ~~~~~~ .:.: ..
... }.~~~~~~~~~~~~::""- ........... ..t_~~~~~~~~~~~~~~~~~~~~~~~~~~~. ....1 = ;zf,
Er.sl... ~ ~~~~.7 .. .. .. , .. .
....... .~~~~~~~~~~~~~~~~~~~~~~~~~~~~~~~~~~~~~~~~~~~~~~~~~~~~~~~~~~~~....
FIG. 24. Cells of the filamentous cyanobacterium Anabaena fibs-aquae each contain as many as 5,000 gas vesicles in aggregates-gasvacuoles-which are visible under the light microscope (a). The cells have a turgor pressure of about 0.38 MPa; the individual gas vesicles, whosecritical collapse pressures range mostly from 0.50 to 0.75 MPa, with a mean of 0.60 MPa, collapse when sufficient additional pressures are applied.They collapse independently of one another, and the gas vacuoles become less distinct. Serial photographs of a filament after application ofpressures of (a) 0 MPa above atmospheric pressure (no gas vesicle collapse), (b) 0.15 MPa (causing 21% gas vesicle collapse), (c) 0.2 MPa (41%collapse), (d) 0.25 MPa (66% collapse), (e) 0.30 MPa (82% collapse), (f) 0.35 MPa (92% collapse), (g) 0.70 MPa (100% collapse). Magnification,x 1,260. Note that the collapse sequences in the dividing cell (right) and the fully grown cell (left) are similar to those in the other cells; from thisit is concluded that the turgor pressure of the cells changes little during the cycle of cell growth and division. The central cell with a heavierenvelope is an immature heterocyst. Reproduced from Walsby (246) with permission from the publisher.
and about half can be attributed to the light-stimulated uptakeof potassium salts (5). Such light-dependent rises in turgor maybe an inevitable consequence of increased photosyntheticactivity and perhaps occur in all cyanobacteria. They have nowbeen demonstrated in a number of gas-vacuolate species ofAnabaena (46, 110, 230, 266),Aphanizomenon (128, 129, 137),Gloeotrichia (252a), Nostoc (7), Oscillatoria (125, 215, 262),and Microcystis (138, 184, 212). Gas vesicle regulation by cellturgor is discussed below (see Gas Vesicle Collapse by TurgorPressure).The measurement of turgor pressure is also relevant to a
number of other fields such as cell growth and extension of thecell wall under stress. Pinette and Koch (177) have madeobservations on the pressures at which gas vesicles started tocollapse in cells ofAncylobacter (Microcyclus) aquaticus viewedindividually under the microscope; from such measurements itis possible to infer the turgor pressure in the individual cell, aslong as the range of critical pressures of gas vesicles is similarin all cells. Koch (122) has commented that the turgor pressuremay remain nearly constant during cell growth and division
(under given conditions). Support for this idea can be found inobservations made on gas vesicle collapse in the chains of cellsin filaments of cyanobacteria (Fig. 24).Turgor pressure has also been implicated in osmoregulation
by bacteria which, stressed by a decrease in the external solutepotential, adjust their internal solute potential by active uptakeof potassium or by synthesis of compatible solutes. It ispostulated that the recovery of turgor pressure might becontrolled by turgor sensors; such changes in turgor pressurehave been demonstrated in gas-vacuolate cyanobacteria (183).The gas vesicle method of turgor pressure measurement hasalso provided a means of measuring the permeability tosolutes, the hydraulic conductivity (Lp), and the volumetricelastic modulus (s) of cells (239) (Table 2). In the cyanobac-teriaAnabaenaflos-aquae (239) and Microcystis sp. (183), thereis a linear change in relative cell volume (AVIVc) with increasesin turgor pressure (4A,), as predicted by the mechanics of apressure vessel (157), i.e.,
E = AptVC/AV (16)
VOL. 58, 1994
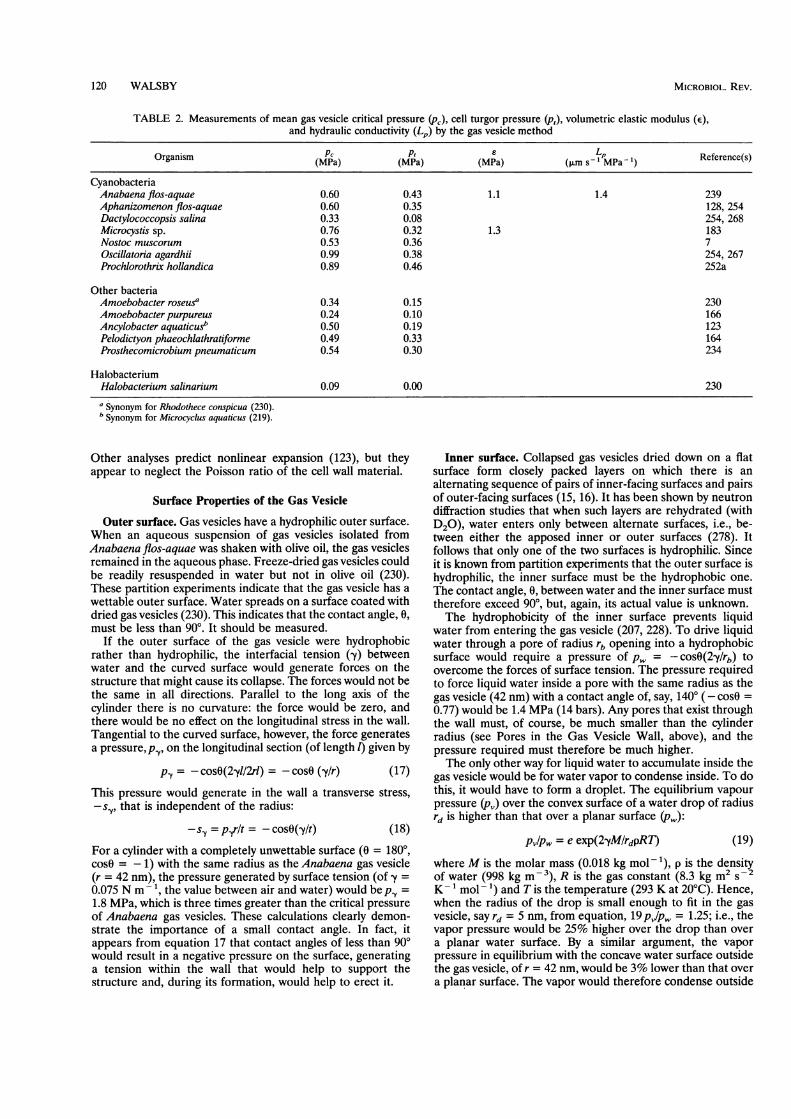
120 WALSBY
TABLE 2. Measurements of mean gas vesicle critical pressure (p,), cell turgor pressure (p,), volumetric elastic modulus (E),and hydraulic conductivity (L,p) by the gas vesicle method
Organism (MPa) (MPa) (MPa) (PM s' MNPa) Reference(s)
CyanobacteriaAnabaena flos-aquae 0.60 0.43 1.1 1.4 239Aphanizomenon flos-aquae 0.60 0.35 128, 254Dactylococcopsis salina 0.33 0.08 254, 268Microcystis sp. 0.76 0.32 1.3 183Nostoc muscorum 0.53 0.36 7Oscillatoria agardhii 0.99 0.38 254, 267Prochlorothrix hollandica 0.89 0.46 252a
Other bacteriaAmoebobacter roseus' 0.34 0.15 230Amoebobacter purpureus 0.24 0.10 166Ancylobacter aquaticusb 0.50 0.19 123Pelodictyon phaeochlathratiforme 0.49 0.33 164Prosthecomicrobium pneumaticum 0.54 0.30 234
HalobacteriumHalobacterium salinarium 0.09 0.00 230a Synonym for Rhodothece conspicua (230).b Synonym for Microcyclus aquaticus (219).
Other analyses predict nonlinear expansion (123), but theyappear to neglect the Poisson ratio of the cell wall material.
Surface Properties of the Gas Vesicle
Outer surface. Gas vesicles have a hydrophilic outer surface.When an aqueous suspension of gas vesicles isolated fromAnabaena flos-aquae was shaken with olive oil, the gas vesiclesremained in the aqueous phase. Freeze-dried gas vesicles couldbe readily resuspended in water but not in olive oil (230).These partition experiments indicate that the gas vesicle has awettable outer surface. Water spreads on a surface coated withdried gas vesicles (230). This indicates that the contact angle, 0,must be less than 900. It should be measured.
If the outer surface of the gas vesicle were hydrophobicrather than hydrophilic, the interfacial tension (,y) betweenwater and the curved surface would generate forces on thestructure that might cause its collapse. The forces would not bethe same in all directions. Parallel to the long axis of thecylinder there is no curvature: the force would be zero, andthere would be no effect on the longitudinal stress in the wall.Tangential to the curved surface, however, the force generatesa pressure, py, on the longitudinal section (of length 1) given by
py = - cos0(2y1/2r1) = - cosO (,y/r) (17)This pressure would generate in the wall a transverse stress,-sI, that is independent of the radius:
-s', = pyr/t = -cos0(-y/t) (18)
For a cylinder with a completely unwettable surface (0 = 1800,cosO = -1) with the same radius as the Anabaena gas vesicle(r = 42 nm), the pressure generated by surface tension (of -y =0.075 N m - 1, the value between air and water) would be p, =1.8 MPa, which is three times greater than the critical pressureof Anabaena gas vesicles. These calculations clearly demon-strate the importance of a small contact angle. In fact, itappears from equation 17 that contact angles of less than 900would result in a negative pressure on the surface, generatinga tension within the wall that would help to support thestructure and, during its formation, would help to erect it.
Inner surface. Collapsed gas vesicles dried down on a flatsurface form closely packed layers on which there is analternating sequence of pairs of inner-facing surfaces and pairsof outer-facing surfaces (15, 16). It has been shown by neutrondiffraction studies that when such layers are rehydrated (withD20), water enters only between alternate surfaces, i.e., be-tween either the apposed inner or outer surfaces (278). Itfollows that only one of the two surfaces is hydrophilic. Sinceit is known from partition experiments that the outer surface ishydrophilic, the inner surface must be the hydrophobic one.The contact angle, 0, between water and the inner surface musttherefore exceed 900, but, again, its actual value is unknown.The hydrophobicity of the inner surface prevents liquid
water from entering the gas vesicle (207, 228). To drive liquidwater through a pore of radius rb opening into a hydrophobicsurface would require a pressure of p, = -cosO(2-y/rb) toovercome the forces of surface tension. The pressure requiredto force liquid water inside a pore with the same radius as thegas vesicle (42 nm) with a contact angle of, say, 1400 (- cosO =0.77) would be 1.4 MPa (14 bars). Any pores that exist throughthe wall must, of course, be much smaller than the cylinderradius (see Pores in the Gas Vesicle Wall, above), and thepressure required must therefore be much higher.The only other way for liquid water to accumulate inside the
gas vesicle would be for water vapor to condense inside. To dothis, it would have to form a droplet. The equilibrium vapourpressure (p) over the convex surface of a water drop of radiusrd is higher than that over a planar surface (pj):
Pv/Pw = e exp(2-yM/rdpRT) (19)
where M is the molar mass (0.018 kg mol -l), p is the densityof water (998 kg m-3), R is the gas constant (8.3 kg m2 s-2K- l mol- l) and T is the temperature (293 K at 20°C). Hence,when the radius of the drop is small enough to fit in the gasvesicle, say rd = 5 nm, from equation, 19pV/pW, = 1.25; i.e., thevapor pressure would be 25% higher over the drop than overa planar water surface. By a similar argument, the vaporpressure in equilibrium with the concave water surface outsidethe gas vesicle, of r = 42 nm, would be 3% lower than that overa planar surface. The vapor would therefore condense outside
MICROBIOL. REV.
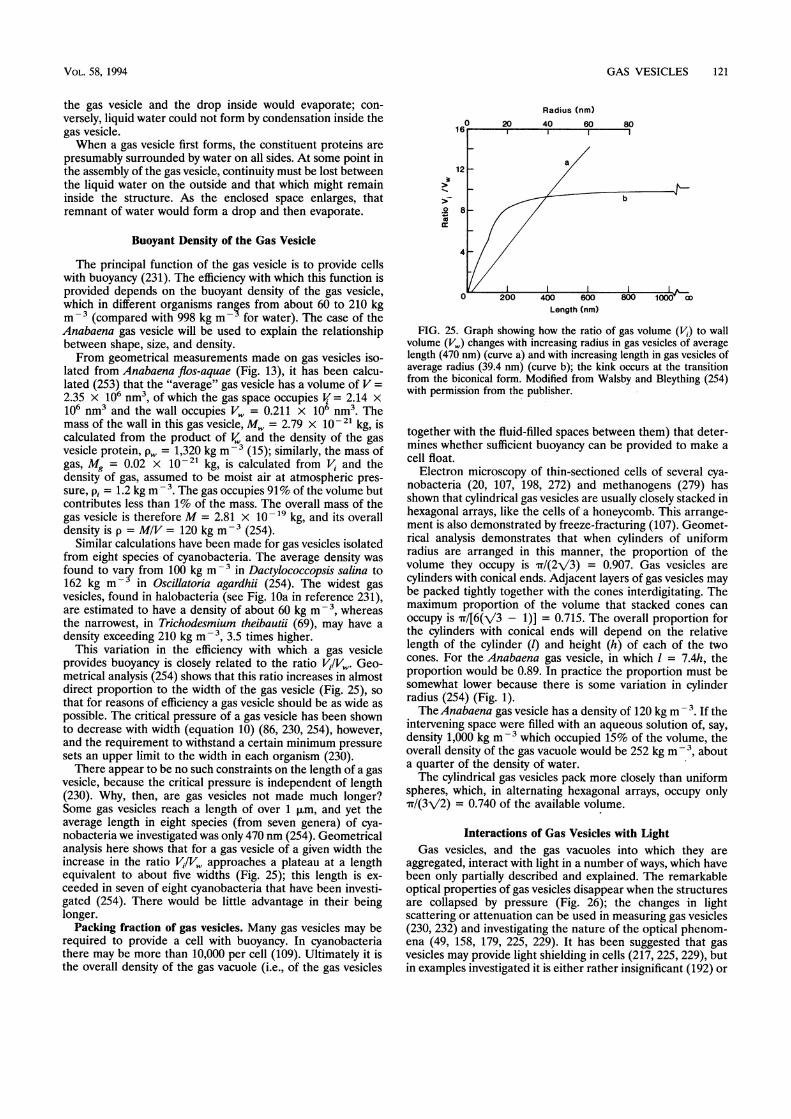
GAS VESICLES 121
the gas vesicle and the drop inside would evaporate; con-versely, liquid water could not form by condensation inside thegas vesicle.When a gas vesicle first forms, the constituent proteins are
presumably surrounded by water on all sides. At some point inthe assembly of the gas vesicle, continuity must be lost betweenthe liquid water on the outside and that which might remaininside the structure. As the enclosed space enlarges, thatremnant of water would form a drop and then evaporate.
Buoyant Density of the Gas Vesicle
The principal function of the gas vesicle is to provide cellswith buoyancy (231). The efficiency with which this function isprovided depends on the buoyant density of the gas vesicle,which in different organisms ranges from about 60 to 210 kgm - (compared with 998 kg m- for water). The case of theAnabaena gas vesicle will be used to explain the relationshipbetween shape, size, and density.From geometrical measurements made on gas vesicles iso-
lated from Anabaena flos-aquae (Fig. 13), it has been calcu-lated (253) that the "average" gas vesicle has a volume of V =2.35 x 10⁶ nm3, of which the gas space occupies I = 2.14 x10⁶ nm3 and the wall occupies V, = 0.211 x 10⁶ nm3. Themass of the wall in this gas vesicle, MW = 2.79 x 10 21 kg, iscalculated from the product of Vw and the density of the gasvesicle protein, pw = 1,320 kg m -3 (15); similarly, the mass ofgas, Mg = 0.02 x 10- 2 kg, is calculated from Vi and thedensity of gas, assumed to be moist air at atmospheric pres-sure, pi = 1.2 kg m-3. The gas occupies 91% of the volume butcontributes less than 1% of the mass. The overall mass of thegas vesicle is therefore M = 2.81 x 101-9 kg, and its overalldensity is p = M/V = 120 kg m-3 (254).
Similar calculations have been made for gas vesicles isolatedfrom eight species of cyanobacteria. The average density wasfound to vary from 100 kg m-3 in Dactylococcopsis salina to162 kg m- in Oscillatoria agardhii (254). The widest gasvesicles, found in halobacteria (see Fig. iQa in reference 231),are estimated to have a density of about 60 kg m-, whereasthe narrowest, in Trichodesmium theibautii (69), may have adensity exceeding 210 kg m-3, 3.5 times higher.
This variation in the efficiency with which a gas vesicleprovides buoyancy is closely related to the ratio VI,Vw. Geo-metrical analysis (254) shows that this ratio increases in almostdirect proportion to the width of the gas vesicle (Fig. 25), sothat for reasons of efficiency a gas vesicle should be as wide aspossible. The critical pressure of a gas vesicle has been shownto decrease with width (equation 10) (86, 230, 254), however,and the requirement to withstand a certain minimum pressuresets an upper limit to the width in each organism (230).There appear to be no such constraints on the length of a gas
vesicle, because the critical pressure is independent of length(230). Why, then, are gas vesicles not made much longer?Some gas vesicles reach a length of over 1 ,um, and yet theaverage length in eight species (from seven genera) of cya-nobacteria we investigated was only 470 nm (254). Geometricalanalysis here shows that for a gas vesicle of a given width theincrease in the ratio VIVw approaches a plateau at a lengthequivalent to about five widths (Fig. 25); this length is ex-ceeded in seven of eight cyanobacteria that have been investi-gated (254). There would be little advantage in their beinglonger.
Packing fraction of gas vesicles. Many gas vesicles may berequired to provide a cell with buoyancy. In cyanobacteriathere may be more than 10,000 per cell (109). Ultimately it isthe overall density of the gas vacuole (i.e., of the gas vesicles
._20ar
Radius (nm)0 20 40 60 80.1/ A I _ _
2-
8-
L200 400 600Length (nm)
FIG. 25. Graph showing how the ratio of gas volume (Vi) to wallvolume (Vw) changes with increasing radius in gas vesicles of averagelength (470 nm) (curve a) and with increasing length in gas vesicles ofaverage radius (39.4 nm) (curve b); the kink occurs at the transitionfrom the biconical form. Modified from Walsby and Bleything (254)with permission from the publisher.
together with the fluid-filled spaces between them) that deter-mines whether sufficient buoyancy can be provided to make acell float.
Electron microscopy of thin-sectioned cells of several cya-nobacteria (20, 107, 198, 272) and methanogens (279) hasshown that cylindrical gas vesicles are usually closely stacked inhexagonal arrays, like the cells of a honeycomb. This arrange-ment is also demonstrated by freeze-fracturing (107). Geomet-rical analysis demonstrates that when cylinders of uniformradius are arranged in this manner, the proportion of thevolume they occupy is ar/(2N/3) = 0.907. Gas vesicles arecylinders with conical ends. Adjacent layers of gas vesicles maybe packed tightly together with the cones interdigitating. Themaximum proportion of the volume that stacked cones canoccupy is fn/[6(/3 - 1)] = 0.715. The overall proportion forthe cylinders with conical ends will depend on the relativelength of the cylinder (1) and height (h) of each of the twocones. For the Anabaena gas vesicle, in which 1 = 7.4h, theproportion would be 0.89. In practice the proportion must besomewhat lower because there is some variation in cylinderradius (254) (Fig. 1).The Anabaena gas vesicle has a density of 120 kg m - If the
intervening space were filled with an aqueous solution of, say,density 1,000 kg m - which occupied 15% of the volume, theoverall density of the gas vacuole would be 252 kg m 3
, abouta quarter of the density of water.The cylindrical gas vesicles pack more closely than uniform
spheres, which, in alternating hexagonal arrays, occupy only7r/(3\/2) = 0.740 of the available volume.
Interactions of Gas Vesicles with LightGas vesicles, and the gas vacuoles into which they are
aggregated, interact with light in a number of ways, which havebeen only partially described and explained. The remarkableoptical properties of gas vesicles disappear when the structuresare collapsed by pressure (Fig. 26); the changes in lightscattering or attenuation can be used in measuring gas vesicles(230, 232) and investigating the nature of the optical phenom-ena (49, 158, 179, 225, 229). It has been suggested that gasvesicles may provide light shielding in cells (217, 225, 229), butin examples investigated it is either rather insignificant (192) or
VOL. 58, 1994
il
800 1000' Od

122 WALSBY
-. -FIG. 26. Phase-contrast light micrographs of filaments of the cyanobacteriumAnabaena flos-aquae before (a) and after (b) collapse of their gas
vesicles by application of a pressure of 1.0 MPa (10 bar). The cells are approximately 5 ,um wide.
quantitatively undefined (158). Gas vesicles do increase lightattenuation in suspensions (179, 220) and natural populations(68), and this can affect light penetration in lakes.
Light scattering by isolated gas vesicles. Suspensions ofisolated gas vesicles appear milky white. The intact gas vesiclesdo not absorb light in the visible spectrum, but they scatterlight strongly (Fig. 27a). Most of the light scattering is due tothe gas space rather than the enclosing gas vesicle wall; theamount of light scattered decreases by 98% (230) or more (Fig.27a) when gas vesicles are collapsed by pressure. Angularmeasurements show that gas vesicle suspensions scatter lightstrongly in forward and backward directions. The minimumintensity of the scattered light occurs at an angle of 105° to theincident beam (252a). The scattered light can be measureddirectly in a nephelometer to give a relative measure of gasvesicle content; such measurements can be made directly in apressure nephelometer in which the thick-walled sample tubeis connected to a supply of gas under pressure (232). Isolatedgas vesicles at a concentration of 1 ,ul of gas space per ml givea turbidity of 3.8 nephelometric turbidity units (NTU); thoseclustered into gas vesicles inside cells give a lower value, 2.0NTU (68), owing to different types of interaction with light.Gas vesicle suspensions show attenuance in a spectropho-
tometer because gas vesicles scatter light out of the collimatedlight beam directed into the photodetector (229). Suspensionsof Anabaena gas vesicles containing 1 p.l of gas space per mlgive a pressure-sensitive attenuance of 2.72 cm- at a wave-length of 500 nm (253). The attenuance of the gas spaces (thedifference in spectra obtained with intact and collapsed gasvesicles [Fig. 27a]), varies as A-2.8 (252a); this is the result ofthe way the scattering angle and intensity change with wave-length. Scattering by gas vesicles, with dimensions of 50 to 1000nm, falls in the region between Mie scattering (for particles ofdiameter similar to X) and Tyndall scattering (for particles of
diameter much smaller than X, when the scattering intensity ivaries as X-4).
Light interactions with gas vacuoles in cells. Gas vacuoles,the aggregates of gas vesicles in cells, interact rather differentlywith light. The change in attenuance after gas vesicle collapseis more uniform over the visible spectrum (49, 68, 192, 225),but the difference spectra show dips at the absorption peaks ofcell pigments (Fig. 27b). One cause of these dips is theproportion of light that passes through the spaces between thecells (for discussion of this sieve or package effect, see refer-ences 52 and 112). In cases when the difference spectrum dipsto a negative value (225), however, it seems that gas vacuolesmust direct some light away from underlying pigments. It hasbeen observed that gas vacuoles are distributed throughout thecells of Anabaena flos-aquae grown in low photon irradiancebut are located at the periphery of cells grown at highirradiance (192). Gas vacuoles must change the direction of thelight path through the cell, but it does not necessarily followthat they provide light shielding.
Direct evidence of light shielding in cells has been sought bycomparing the rates of photochemical reactions in cells withintact and collapsed gas vesicles. In Anabaena flos-aquae, gasvesicle collapse brought about no significant change in the rateof photoinactivation by UV radiation (indicating that noshielding occurs at these wavelengths) but gave an increase of4% in the rate of photosynthesis at limiting irradiances;shallow layers of dilute suspensions were used to minimizeself-shading effects (192). These experiments should be re-peated with filaments grown at high irradiance, which form gasvesicles at the cell periphery.Ogawa et al. (158) measured light absorption by concen-
trated suspensions of Microcystis cells in a cuvette placed at thecenter of a white reflecting spherical chamber and illuminatedby a narrow beam through a narrow aperture. A photocell in
MICROBIOL. REV.
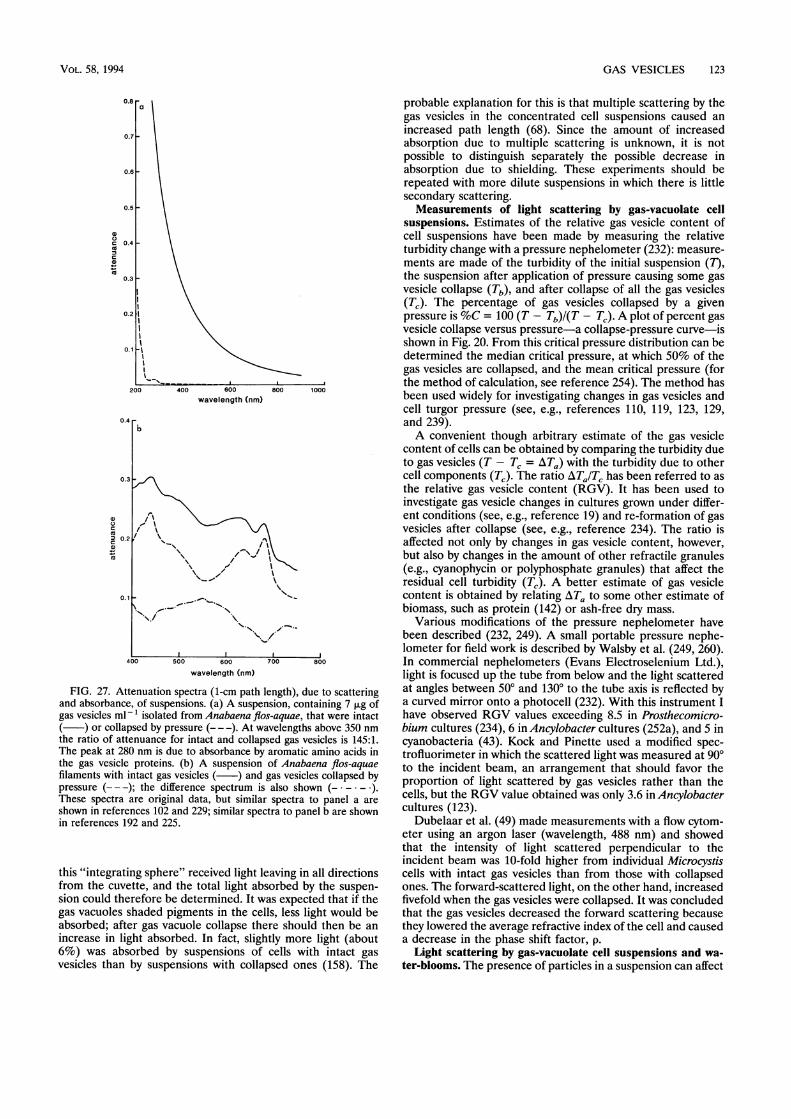
GAS VESICLES 123
U)
c 0.4to
a)
co0.3
0.2
0.1
200
U)
co
coa)(U
400 600
wavelength (nm)800 1000
wavelength (nm)
FIG. 27. Attenuation spectra (1-cm path length), due to scatteringand absorbance, of suspensions. (a) A suspension, containing 7 pug ofgas vesicles ml-' isolated from Anabaena flos-aquae, that were intact( ) or collapsed by pressure (--- ). At wavelengths above 350 nmthe ratio of attenuance for intact and collapsed gas vesicles is 145:1.The peak at 280 nm is due to absorbance by aromatic amino acids inthe gas vesicle proteins. (b) A suspension of Anabaena flos-aquaefilaments with intact gas vesicles ( ) and gas vesicles collapsed bypressure (--- ); the difference spectrum is also shown (- - - ).These spectra are original data, but similar spectra to panel a areshown in references 102 and 229; similar spectra to panel b are shownin references 192 and 225.
this "integrating sphere" received light leaving in all directionsfrom the cuvette, and the total light absorbed by the suspen-sion could therefore be determined. It was expected that if thegas vacuoles shaded pigments in the cells, less light would beabsorbed; after gas vacuole collapse there should then be anincrease in light absorbed. In fact, slightly more light (about6%) was absorbed by suspensions of cells with intact gasvesicles than by suspensions with collapsed ones (158). The
probable explanation for this is that multiple scattering by thegas vesicles in the concentrated cell suspensions caused anincreased path length (68). Since the amount of increasedabsorption due to multiple scattering is unknown, it is notpossible to distinguish separately the possible decrease inabsorption due to shielding. These experiments should berepeated with more dilute suspensions in which there is littlesecondary scattering.Measurements of light scattering by gas-vacuolate cell
suspensions. Estimates of the relative gas vesicle content ofcell suspensions have been made by measuring the relativeturbidity change with a pressure nephelometer (232): measure-ments are made of the turbidity of the initial suspension (I),the suspension after application of pressure causing some gasvesicle collapse (Tb), and after collapse of all the gas vesicles(Tj). The percentage of gas vesicles collapsed by a givenpressure is %C = 100 (T - Tb)I(T - Tj). A plot of percent gasvesicle collapse versus pressure-a collapse-pressure curve-isshown in Fig. 20. From this critical pressure distribution can bedetermined the median critical pressure, at which 50% of thegas vesicles are collapsed, and the mean critical pressure (forthe method of calculation, see reference 254). The method hasbeen used widely for investigating changes in gas vesicles andcell turgor pressure (see, e.g., references 110, 119, 123, 129,and 239).A convenient though arbitrary estimate of the gas vesicle
content of cells can be obtained by comparing the turbidity dueto gas vesicles (T - T, = AT,) with the turbidity due to othercell components (Ta). The ratio AITa/TC has been referred to asthe relative gas vesicle content (RGV). It has been used toinvestigate gas vesicle changes in cultures grown under differ-ent conditions (see, e.g., reference 19) and re-formation of gasvesicles after collapse (see, e.g., reference 234). The ratio isaffected not only by changes in gas vesicle content, however,but also by changes in the amount of other refractile granules(e.g., cyanophycin or polyphosphate granules) that affect theresidual cell turbidity (T1). A better estimate of gas vesiclecontent is obtained by relating ATTa to some other estimate ofbiomass, such as protein (142) or ash-free dry mass.
Various modifications of the pressure nephelometer havebeen described (232, 249). A small portable pressure nephe-lometer for field work is described by Walsby et al. (249, 260).In commercial nephelometers (Evans Electroselenium Ltd.),light is focused up the tube from below and the light scatteredat angles between 500 and 1300 to the tube axis is reflected bya curved mirror onto a photocell (232). With this instrument Ihave observed RGV values exceeding 8.5 in Prosthecomicro-bium cultures (234), 6 inAncylobacter cultures (252a), and 5 incyanobacteria (43). Kock and Pinette used a modified spec-trofluorimeter in which the scattered light was measured at 900to the incident beam, an arrangement that should favor theproportion of light scattered by gas vesicles rather than thecells, but the RGV value obtained was only 3.6 in Ancylobactercultures (123).
Dubelaar et al. (49) made measurements with a flow cytom-eter using an argon laser (wavelength, 488 nm) and showedthat the intensity of light scattered perpendicular to theincident beam was 10-fold higher from individual Microcystiscells with intact gas vesicles than from those with collapsedones. The forward-scattered light, on the other hand, increasedfivefold when the gas vesicles were collapsed. It was concludedthat the gas vesicles decreased the forward scattering becausethey lowered the average refractive index of the cell and causeda decrease in the phase shift factor, p.
Light scattering by gas-vacuolate cell suspensions and wa-ter-blooms. The presence of particles in a suspension can affect
VOL. 58, 1994
0.8ra

124 WALSBY
light absorption in two ways: by backscattering they mayreduce the amount of light that penetrates the suspension, andby increasing the length of the light path they increase theattenuation (112). In these ways gas vesicles will cause shadingin cell suspensions whether or not they provide shielding withinindividual cells. Measurements made in well-mixed layers ofcyanobacterial suspensions, approximately 10 cm deep, indi-cate that gas vesicles in the cells decrease the downwellingirradiance by about 13% and decrease the irradiance over allangles by about 29% (see Fig. 2.2 of reference 220). Theseshading effects would explain why, in concentrated Microcystissuspensions illuminated at limiting photon irradiances, thephotosynthetic rate was found to increase, by between 7 and30%, when gas vesicles were collapsed (179).Gas vacuoles in cells also contribute to light attenuation by
cyanobacteria in lake waterblooms. Ganf et al. (68) found thatthe gas vesicles in colonies of Microcystis aeruginosa accountedfor 80% of the light scattering in the water column of anAustralian reservoir. The increased attenuation by gas vesiclesin the near-surface water layers plays a part in the competitionbetween planktonic cyanobacteria and other nonbuoyant phy-toplankton (see Role of Buoyancy in Cyanobacteria, below).
PHYSIOLOGY OF BUOYANCY REGULATION AND GASVESICLE REGULATION
Gas vesicles provide cells with buoyancy and are alsoinvolved in regulating buoyancy (231). Dynamic buoyancyregulation may permit microorganisms to position themselvesnear a particular depth in a lake or to perform verticalmigrations.
Density of Bacterial Cells
Much of the stuff of living cells has a density greater thanthat of water (998 kg m-3 at 20°C): the density of protein isapproximately 1,330 kg m-3, that of carbohydrate is 1,550 kgm-3, that of nucleic acid is >1,660 kg m -3, and that ofglycolipid is 1,050 kg m-3 (212). A consequence of this is thatmost cells sink. Some phytoplankton cells may become buoyantby accumulating hydrocarbons, triglycerides, or (in seawater)solutions of "light" ions (95, 197, 265), but none of thesebuoyancy aids has such a low density as the gas vesicle.Measurement of cell density. The density of cyanobacteria
(after gas vesicle collapse) has been measured by centrifugingthem in density gradients of the silicone-covered colloid Per-coll. The cells band in the gradients at their isopycnic density(159). Filaments of Oscillatoria agardhii have a density of 1,076to 1,093 kg m - (215). The density of Anabaena flos-aquaeranges between 1,025 and 1,036 kg m-3 because the trichomesare covered by a sheath, of density 1,000 kg m- 3, that occupies58% of the total filament volume (162); without the sheath thetrichomes would have had a density range of 1,060 to 1,086 kgm-3The density of cells that are positively buoyant with intact
gas vesicles cannot be measured in the same way because theyfloat above the Percoll density gradient. Their density can bedetermined by collapsing measured proportions of the gasvesicles and then extrapolating to find the density of theoriginal gas-vacuolate cells (260). Densities of 975 and 992 kgm- 3 have been found in gas-vacuolate filaments of twoAnabaena species (260, 261); after allowing for the volume ofthe sheath, it is calculated that the densities were of thecorresponding cells were 942 and 975 kg m 3, respectively.Amount of gas vesicles required for buoyancy. The propor-
tion of the cell volume that the gas vesicles must occupy to
provide buoyancy varies from about 3 to 10%, depending onthe density of the gas vesicles and the other cell constituents(162, 212, 215). Take, for example, the cells of Anabaenaflos-aquae, without gas vesicles or sheath, with a minimumdensity of 1,060 kg m-3 (162): to become neutrally buoyant(i.e., to reach the same density as water), 6.2% of their cellvolume must be occupied by gas. Since the Anabaena gasvesicle has a ratio of gas space to wall volume of 10.1 and adensity of 119 kg m 3 (254), to provide this gas space requires8.1 kg of gas vesicle protein per m3 of cell volume. Thisrepresents 4.9% of the total protein content of these cells (165kg m-3) and 2.9% of the dry mass of the cells (278 kg m 3)(162). The cost is higher in species with narrower gas vesicles:in Oscillatoria argardhii (254) it would require the equivalent of7.0% of the cell protein to provide neutral buoyancy.
Cells often have substantially more gas vesicles than areneeded for neutral buoyancy (85, 160, 162, 212, 215). InAnabaena species, for example, they may have gas spaceequivalent to 9.8% of the cell volume and gas vesicle proteinequivalent to 7.1% of the total protein or 4.2% of the dry mass(162). The buoyancy provided by gas vesicles evidently has asubstantial cost in terms of the protein resources of the cell.
Regulation of Gas Vesicles and Buoyancy inPlanktonic Cyanobacteria
Buoyancy regulation of planktonic cyanobacteria in re-sponse to light was first demonstrated in cultures ofAnabaenaflos-aquae; buoyancy was gained at low irradiance (228) andlost at high irradiance (46, 230). It was suggested that thisresponse might explain how cyanobacteria positioned them-selves on the vertical light gradient in lakes (228) or performeddiel vertical migration to and from the lake surface (229) andthat it might be important in waterbloom formation (63, 64).Buoyancy loss at high photon irradiance (photon flux den-
sity) has since been demonstrated in a number of planktoniccyanobacteria including some species of Anabaena (46, 110,162, 201, 230, 266), Aphanizomenon (128, 129), Dactylococcop-sis (268), Gloeotrichia (262a), Microcystis (130, 142, 212, 213,263), Oscillatoria (215, 262, 267), and Trichodesmium (223).The mechanisms of buoyancy regulation, summarized here,involve changes in gas vesicles and dense cell components (Fig.28); they have been reviewed in detail elsewhere (120, 126, 185,187, 248, 250).
Quantitative determination of the cause of buoyancychange. The increase in density of a cell at high photonirradiance could, in theory, be explained by either a loss of gasvesicles or a gain in substances denser than water, such ascarbohydrate or protein (231). In a number of the early studies,correlations were found between the loss of buoyancy andeither loss of gas vesicles (5, 46, 77, 128) or a rise incarbohydrate content of the cells (142, 222), but in none ofthese studies was it established that these changes were thecause of the buoyancy change.The first quantitative analysis of what caused the density
change was made by Oliver et al., drawing up a balance sheetof the ballast contributed by each of the major classes ofcompounds, such as protein, carbohydrate, and lipid (161,162). Analyses were made of the mass, Mc, and density, pc, ofeach of these components; its volume was then given by Vc =
MC/pW. The mass of water, of density pw, it displaced wascalculated as MW = Vcpw, and the mass of the component notsupported by water, referred to as the ballast mass, was thenMC - MW. The sum of all the values of MC - MW gave the totalballast mass of the cells. There was an independent check onthe result obtained: the total ballast mass divided by the cell
MICROBIOL. REV.
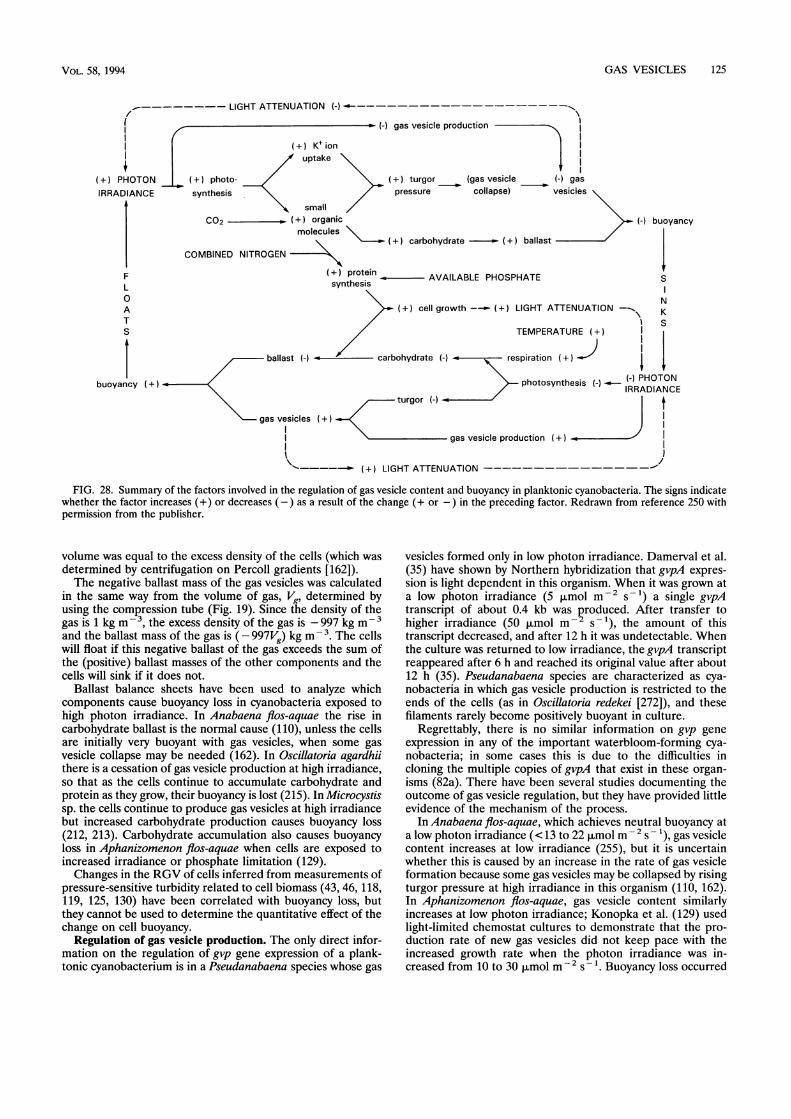
GAS VESICLES 125
.--LIGHT ATTENUATION (-) ---------- .
- (-) gas vesicle production I
I'(+) K+ ion
uptake
(+)photo- (+) turgor (gas vesiclesynthesis pressure collapse)
smallC02 .+) organic
molecules\(+ carbohydrate - (+) balla
COMBINED NITROGEN
( +) protein AVAILABLE PHOSPHATEsynthesis
I1-) gasvesicles
(-) buoyancy
st
S
0 N
A (+) cell growth-- (+) LIGHT ATTENUATION -> K
T K~~~~~~~~~~~~~~~~~~~~~~~~IS / ~~~~~~~~~~~~TEMPERATURE(+)
ballast ) carbohydrate ) respiration
buoyancy (+) photosynthesis () ~(R) PHOTONIRRADIANCE
turgor (-)
gas vesicles
gas vesicle production (+)
t-------~- (+) LIGHT ATTENUATION-- ---
FIG. 28. Summary of the factors involved in the regulation of gas vesicle content and buoyancy in planktonic cyanobacteria. The signs indicatewhether the factor increases (+) or decreases (-) as a result of the change (+ or -) in the preceding factor. Redrawn from reference 250 withpermission from the publisher.
volume was equal to the excess density of the cells (which wasdetermined by centrifugation on Percoll gradients [162]).The negative ballast mass of the gas vesicles was calculated
in the same way from the volume of gas, Vg, determined byusing the compression tube (Fig. 19). Since the density of thegas is 1 kg m- 3, the excess density of the gas is - 997 kg m - 3
and the ballast mass of the gas is ( - 997Vg) kg m-3. The cellswill float if this negative ballast of the gas exceeds the sum ofthe (positive) ballast masses of the other components and thecells will sink if it does not.
Ballast balance sheets have been used to analyze whichcomponents cause buoyancy loss in cyanobacteria exposed tohigh photon irradiance. In Anabaena flos-aquae the rise incarbohydrate ballast is the normal cause (110), unless the cellsare initially very buoyant with gas vesicles, when some gasvesicle collapse may be needed (162). In Oscillatoria agardhiithere is a cessation of gas vesicle production at high irradiance,so that as the cells continue to accumulate carbohydrate andprotein as they grow, their buoyancy is lost (215). In Microcystissp. the cells continue to produce gas vesicles at high irradiancebut increased carbohydrate production causes buoyancy loss(212, 213). Carbohydrate accumulation also causes buoyancyloss in Aphanizomenon flos-aquae when cells are exposed toincreased irradiance or phosphate limitation (129).Changes in the RGV of cells inferred from measurements of
pressure-sensitive turbidity related to cell biomass (43, 46, 118,119, 125, 130) have been correlated with buoyancy loss, butthey cannot be used to determine the quantitative effect of thechange on cell buoyancy.
Regulation of gas vesicle production. The only direct infor-mation on the regulation of gvp gene expression of a plank-tonic cyanobacterium is in a Pseudanabaena species whose gas
vesicles formed only in low photon irradiance. Damerval et al.(35) have shown by Northern hybridization that gvpA expres-sion is light dependent in this organism. When it was grown ata low photon irradiance (5 ,umol m -2 s'-) a single gvpAtranscript of about 0.4 kb was produced. After transfer tohigher irradiance (50 ,umol m- s-1), the amount of thistranscript decreased, and after 12 h it was undetectable. Whenthe culture was returned to low irradiance, the gvpA transcriptreappeared after 6 h and reached its original value after about12 h (35). Pseudanabaena species are characterized as cya-nobacteria in which gas vesicle production is restricted to theends of the cells (as in Oscillatoria redekei [272]), and thesefilaments rarely become positively buoyant in culture.
Regrettably, there is no similar information on gvp geneexpression in any of the important waterbloom-forming cya-nobacteria; in some cases this is due to the difficulties incloning the multiple copies of gvpA that exist in these organ-isms (82a). There have been several studies documenting theoutcome of gas vesicle regulation, but they have provided littleevidence of the mechanism of the process.
In Anabaena flos-aquae, which achieves neutral buoyancy ata low photon irradiance (< 13 to 22 umol m -2 S- 1), gas vesiclecontent increases at low irradiance (255), but it is uncertainwhether this is caused by an increase in the rate of gas vesicleformation because some gas vesicles may be collapsed by risingturgor pressure at high irradiance in this organism (110, 162).In Aphanizomenon flos-aquae, gas vesicle content similarlyincreases at low photon irradiance; Konopka et al. (129) usedlight-limited chemostat cultures to demonstrate that the pro-duction rate of new gas vesicles did not keep pace with theincreased growth rate when the photon irradiance was in-creased from 10 to 30 ,umol m- 2 s-1. Buoyancy loss occurred
1I(+) PHOTONIRRADIANCE
F
VOL. 58, 1994
i
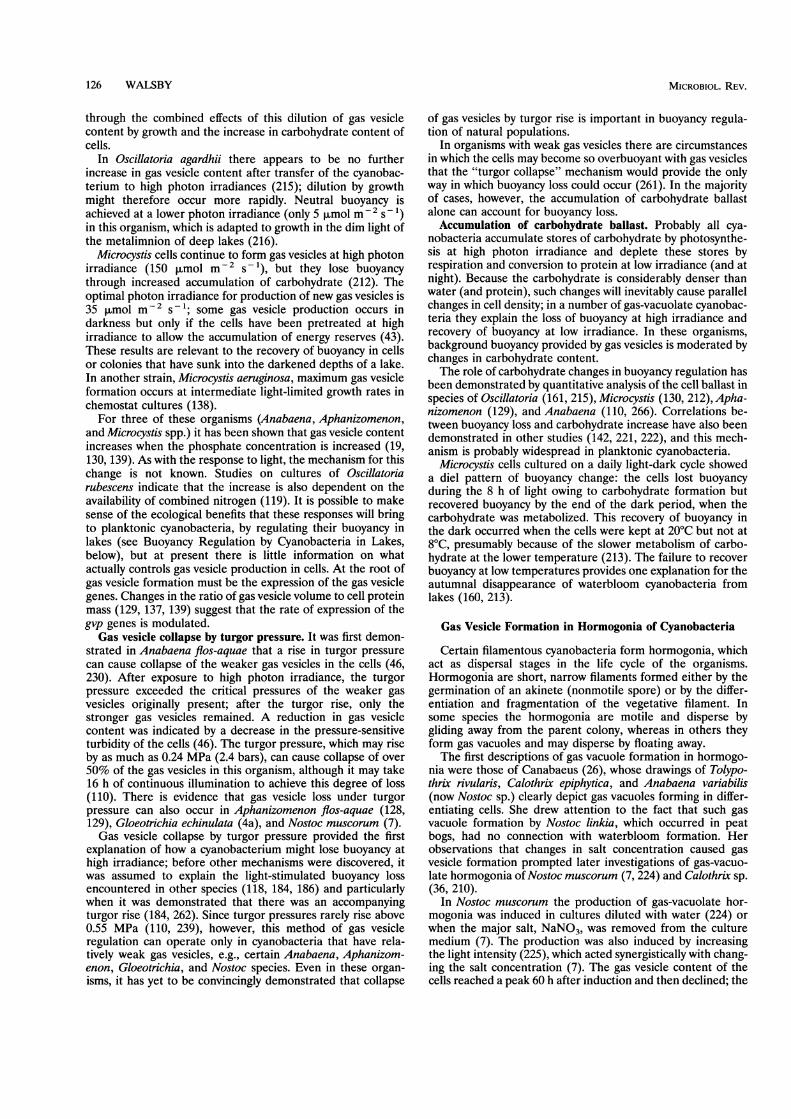
126 WALSBY
through the combined effects of this dilution of gas vesiclecontent by growth and the increase in carbohydrate content ofcells.
In Oscillatoria agardhii there appears to be no furtherincrease in gas vesicle content after transfer of the cyanobac-terium to high photon irradiances (215); dilution by growthmight therefore occur more rapidly. Neutral buoyancy isachieved at a lower photon irradiance (only 5 ,umol m - 2 S- 1)in this organism, which is adapted to growth in the dim light ofthe metalimnion of deep lakes (216).
Microcystis cells continue to form gas vesicles at high photonirradiance (150 ,umol m-2 s 1), but they lose buoyancythrough increased accumulation of carbohydrate (212). Theoptimal photon irradiance for production of new gas vesicles is35 ,umol m-2 S-1; some gas vesicle production occurs indarkness but only if the cells have been pretreated at highirradiance to allow the accumulation of energy reserves (43).These results are relevant to the recovery of buoyancy in cellsor colonies that have sunk into the darkened depths of a lake.In another strain, Microcystis aeruginosa, maximum gas vesicleformation occurs at intermediate light-limited growth rates inchemostat cultures (138).
For three of these organisms (Anabaena, Aphanizomenon,and Microcystis spp.) it has been shown that gas vesicle contentincreases when the phosphate concentration is increased (19,130, 139). As with the response to light, the mechanism for thischange is not known. Studies on cultures of Oscillatoriarubescens indicate that the increase is also dependent on theavailability of combined nitrogen (119). It is possible to makesense of the ecological benefits that these responses will bringto planktonic cyanobacteria, by regulating their buoyancy inlakes (see Buoyancy Regulation by Cyanobacteria in Lakes,below), but at present there is little information on whatactually controls gas vesicle production in cells. At the root ofgas vesicle formation must be the expression of the gas vesiclegenes. Changes in the ratio of gas vesicle volume to cell proteinmass (129, 137, 139) suggest that the rate of expression of thegvp genes is modulated.
Gas vesicle collapse by turgor pressure. It was first demon-strated in Anabaena flos-aquae that a rise in turgor pressurecan cause collapse of the weaker gas vesicles in the cells (46,230). After exposure to high photon irradiance, the turgorpressure exceeded the critical pressures of the weaker gasvesicles originally present; after the turgor rise, only thestronger gas vesicles remained. A reduction in gas vesiclecontent was indicated by a decrease in the pressure-sensitiveturbidity of the cells (46). The turgor pressure, which may riseby as much as 0.24 MPa (2.4 bars), can cause collapse of over50% of the gas vesicles in this organism, although it may take16 h of continuous illumination to achieve this degree of loss(110). There is evidence that gas vesicle loss under turgorpressure can also occur in Aphanizomenon flos-aquae (128,129), Gloeotrichia echinulata (4a), and Nostoc muscorum (7).Gas vesicle collapse by turgor pressure provided the first
explanation of how a cyanobacterium might lose buoyancy athigh irradiance; before other mechanisms were discovered, itwas assumed to explain the light-stimulated buoyancy lossencountered in other species (118, 184, 186) and particularlywhen it was demonstrated that there was an accompanyingturgor rise (184, 262). Since turgor pressures rarely rise above0.55 MPa (110, 239), however, this method of gas vesicleregulation can operate only in cyanobacteria that have rela-tively weak gas vesicles, e.g., certain Anabaena, Aphanizom-enon, Gloeotrichia, and Nostoc species. Even in these organ-isms, it has yet to be convincingly demonstrated that collapse
of gas vesicles by turgor rise is important in buoyancy regula-tion of natural populations.
In organisms with weak gas vesicles there are circumstancesin which the cells may become so overbuoyant with gas vesiclesthat the "turgor collapse" mechanism would provide the onlyway in which buoyancy loss could occur (261). In the majorityof cases, however, the accumulation of carbohydrate ballastalone can account for buoyancy loss.Accumulation of carbohydrate ballast. Probably all cya-
nobacteria accumulate stores of carbohydrate by photosynthe-sis at high photon irradiance and deplete these stores byrespiration and conversion to protein at low irradiance (and atnight). Because the carbohydrate is considerably denser thanwater (and protein), such changes will inevitably cause parallelchanges in cell density; in a number of gas-vacuolate cyanobac-teria they explain the loss of buoyancy at high irradiance andrecovery of buoyancy at low irradiance. In these organisms,background buoyancy provided by gas vesicles is moderated bychanges in carbohydrate content.The role of carbohydrate changes in buoyancy regulation has
been demonstrated by quantitative analysis of the cell ballast inspecies of Oscillatoria (161, 215), Microcystis (130, 212), Apha-nizomenon (129), and Anabaena (110, 266). Correlations be-tween buoyancy loss and carbohydrate increase have also beendemonstrated in other studies (142, 221, 222), and this mech-anism is probably widespread in planktonic cyanobacteria.
Microcystis cells cultured on a daily light-dark cycle showeda diel pattern of buoyancy change: the cells lost buoyancyduring the 8 h of light owing to carbohydrate formation butrecovered buoyancy by the end of the dark period, when thecarbohydrate was metabolized. This recovery of buoyancy inthe dark occurred when the cells were kept at 20°C but not at8°C, presumably because of the slower metabolism of carbo-hydrate at the lower temperature (213). The failure to recoverbuoyancy at low temperatures provides one explanation for theautumnal disappearance of waterbloom cyanobacteria fromlakes (160, 213).
Gas Vesicle Formation in Hormogonia of Cyanobacteria
Certain filamentous cyanobacteria form hormogonia, whichact as dispersal stages in the life cycle of the organisms.Hormogonia are short, narrow filaments formed either by thegermination of an akinete (nonmotile spore) or by the differ-entiation and fragmentation of the vegetative filament. Insome species the hormogonia are motile and disperse bygliding away from the parent colony, whereas in others theyform gas vacuoles and may disperse by floating away.The first descriptions of gas vacuole formation in hormogo-
nia were those of Canabaeus (26), whose drawings of Tolypo-thrix rivularis, Calothrix epiphytica, and Anabaena variabilis(now Nostoc sp.) clearly depict gas vacuoles forming in differ-entiating cells. She drew attention to the fact that such gasvacuole formation by Nostoc linkia, which occurred in peatbogs, had no connection with waterbloom formation. Herobservations that changes in salt concentration caused gasvesicle formation prompted later investigations of gas-vacuo-late hormogonia of Nostoc muscorum (7, 224) and Calothrix sp.(36, 210).
In Nostoc muscorum the production of gas-vacuolate hor-mogonia was induced in cultures diluted with water (224) orwhen the major salt, NaNO3, was removed from the culturemedium (7). The production was also induced by increasingthe light intensity (225), which acted synergistically with chang-ing the salt concentration (7). The gas vesicle content of thecells reached a peak 60 h after induction and then declined; the
MICROBIOL. REV.

GAS VESICLES 127
gas vesicles disappeared over the next 24 h. Collapse of gasvesicles under turgor pressure (see Gas Vesicle Collapse inCells: Turgor Pressure, above) may be involved in this disap-pearance (7).
In Calothrix sp. the production of gas-vacuolate hormogoniawas induced by simultaneously diluting the culture with waterand transferring it from white light to red light (37). In the first2 to 9 h, cells divided without elongation; trichome fragmen-tation led to hormogonium release at 24 h. Gas vesicleformation occurred between 3 and 24 h. After 3 to 4 days atroom temperature, the cells lost their gas vesicles and regainedtheir original vegetative morphology. The number of hormogo-nia formed decreased when the red light was supplementedwith green light, and no differentiation of hormogonia oc-curred in green light alone (36).
Hybridization with strand- and gene-specific DNA probesshowed that during hormogonium production mRNA tran-scripts were produced from (i) gvpAl; (ii) gvpAl and gvpA2;(iii) gvpAl, gvpA2, and gvpC; and (iv) antisense mRNAcovering all of gvpA2 and part of gvpAl (Fig. 4). The antisensemRNA would have been able to form a homologous duplexwith the other transcripts and prevent their translation (33).The first transcripts of the gvp genes were found at 2 to 3 hafter induction by red light. Transcripts of the genes and theantisense RNA reached a maximum after 6 h; the amount ofthe large transcripts decreased by 12 h, and the smaller ones
disappeared by 24 h. Transcription of the gvp genes was
stopped prematurely by exposure to green light 3 h afterinduction by red light (36).There has been no quantitative study of the buoyancy
changes of hormogonia. The dispersal of buoyant hormogoniamight be important in cyanobacteria that dwell in soils, muds,or rice paddies. The response to dilution might indicate that innature hormogonia would form after flooding or rainfall.Hormogonia buoyant with gas vesicles might float away in thefloodwater. Enough speculation; observations are needed.
Gas Vesicle Regulation in Other Bacteria
Regulation in heterotrophic bacteria. Van Ert and Staley(219) isolated a gas-vacuolate strain (Ml) of the ring-formingheterotrophic bacterium Ancylobacter (Microcyclus) aquaticus,in which the number of gas vesicles produced changed mark-edly in different media. Konopka (131) showed that gas vesicleproduction was completely inhibited by L-lysine at concentra-tions as low as 3 ,IM. L-Threonine and L-cysteine caused partialinhibition; these amino acids are produced on a branch of thesame biosynthetic pathway as L-lysine, and their addition maycause its accumulation in cells (40).Mutant strains that produced gas vesicles constitutively (i.e.,
even in the presence of lysine) were isolated (11, 132). Thegenes necessary for gas vesicle production could be transferredon broad-host-range plasmids from these strains into othermutants that had lost the ability for gas vesicle production(Ves -). In 90% of those which regained the Ves+ phenotype,lysine inhibited gas vesicle production. This indicated that geneloci for gas vesicle production and gas vesicle regulation bylysine were not strongly linked (11).
Regulation in phototropic bacteria. Pfennig and Cohen-Bazire (175) commented that gas vacuoles were formed by thegreen sulfur bacterium Pelodictyon clathratiforme when grown
in dim light and low temperature (4 to 8°C) but that none were
detected in cells grown at room temperature. In a brown strain(P. phaeoclathratiforme), gas vacuole formation was not af-fected by temperature (165) but was sensitive to light; gas
vesicles were formed only at photon irradiances lower than 5
jimol m-2 s-I (164). The purple sulfur bacterium Amoe-bobacter purpureus, isolated from the saline hypolimnion of ameromictic lake, accumulated gas vesicles in darkness and lostthem at high photon irradiance (200 ,umol m-2 s '). Thecause of the gas vesicle loss is unknown, but it could not beaccounted for by turgor pressure rise. The cells lost buoyancyat high irradiance partly because of the decrease in gas vesiclecontent and partly because of an increase in carbohydratecontent.
It appears that these photosynthetic bacteria may use aparallel mechanism of buoyancy regulation to that in cya-nobacteria, accumulating carbohydrate at higher irradiances tooffset the buoyancy provided by gas vesicles, although thethreshhold irradiance for buoyancy loss is lower (164). Suchresponses might enable these organisms to regulate theirvertical position in the dimly illuminated hypolimnia of strat-ified lakes (163).
ECOLOGICAL STUDIES ON GAS-VACUOLATEORGANISMS
There is an ecological aspect to the function of everybiological structure. It is in the natural environment that thestructures have arisen and been molded by natural selection,and it is in natural ecosystems that the functions they providehave determined the success of organisms.The buoyancy provided by gas vesicles will cause a microor-
ganism to sink less quickly or to float upward. Some planktonicmicroorganisms, e.g., the prochlorophyte Prochlorothrix hol-landica and the cyanobacteria variously classified as Oscillato-ria redekei (154), Pseudanabaena sp. (189), and Limnothrix sp.(152), appear to have too few gas vesicles for positive buoy-ancy, and it may be that the gas vesicles simply reduce theirsinking rates and so increase the probability of their remainingsuspended in the water column. A microorganism with suffi-cient gas vesicles for buoyancy may float out of a benthic layerof mud into the overlying water (29, 30, 233), it may float to thewater surface (114), or it may float up to a layer below thesurface (228). The buoyancy provided can therefore provide ameans of vertical positioning in natural water bodies, if this ispermitted by the stability of the water column. The chemicaland physical conditions change with depth in a lake, andorganisms may benefit if they are able to move up or downsuch vertical gradients.
Gas-vacuolate organisms may change their buoyancy duringthe day and perform vertical migrations. The velocity andextent of vertical movements of microorganisms by sinking orfloating are strongly size dependent; according to the Stokesequation, for a sphere the velocity varies as the square of theradius. A consequence of this is that single cells or smallfilaments will move up or down only a few centimeters per day(267), whereas large colonies may move tens or even hundredsof meters (237, 265).
Role of Buoyancy in Cyanobacteria
The importance of gas vesicles in providing buoyancy forplanktonic cyanobacteria in freshwater lakes, oceans, and brinepools has been investigated in some detail. Only a summary isgiven here because other reviews on this subject are available(120, 185, 187, 188, 265).
In natural waters the light (photon irradiance) decreasesexponentially with depth owing to absorption and scattering bythe water and substances dissolved or suspended in it (112).Net growth of cyanobacteria and other photosynthetic organ-isms occurs only if they spend sufficient time above the critical
VOL. 58, 1994
128 WALSBY
depth where photosynthesis only just compensates for respira-tory losses.
Buoyant cyanobacteria that float up in the intermittentlymixed epilimnion of a lake spend more time near the watersurface and receive a higher light dose than do other small-celled phytoplankton that circulate within the epilimnion (93,97, 188, 190, 281), and in this way they outcompete them. Thegas-vacuolate cyanobacteria also tend to shade out the phyto-plankton lower in the water column, a competitive strategyused by "canopy species" in terrestrial habitats. As discussedabove (see Light Scattering by Gas-Vacuolate Cell Suspen-sions and Waterblooms), light scattering by the gas vesicles inthe cyanobacteria can contribute significantly to this shadingeffect (68). The floating cyanobacteria might also derive otheradvantages from their proximity to the water surface (such asthe increased availability of CO2 diffusing in from the overlyingatmosphere [19, 168, 229] and the availability of nitrogenouscompounds there [149]), but competition for light is probablyof greatest importance.There are several genera of cyanobacteria that use their
buoyancy to occupy the euphotic zone of the epilimnion. Inlakes with a shallow euphotic zone and stable epilimnion, onefinds Oscillatoria species (or the heterocystous Anabaena spe-cies when nitrogen is limiting [266]) that occur as separatefilaments, which circulate within the surface mixed layer;because of their small size the filaments float up slowly andrarely form thick scums. In wind-exposed lakes, colony-form-ing Anabaena, Aphanizomenon, Gloeotrichia, Coelosphaerium,and Microcystis species are found. These faster-floating colo-nial forms rise up more quickly toward the surface duringintermittent periods of calm (97, 188). Over long periods ofcalm, however, there may be disadvantages in floating near thewater surface (63, 64). Prolonged exposure to the high irradi-ance at the surface may cause photooxidation (1), and theconcentrated accumulations of cells may lead to rapid deple-tion of nutrients, such as phosphate (191). By losing buoyancyin response to high irradiance, however, the colonies may sinkdown and avoid photooxidative damage (185, 188).Buoyancy regulation by cyanobacteria in lakes. Some plank-
tonic cyanobacteria form layers in stratified lakes whereasothers execute diel migration. These two phenomena can beexplained by the same sort of buoyancy regulation behavior byorganisms of different sizes. Stratification is performed byslowly moving separate filaments in clear, oligotrophic lakes. Inresponse to the vertical light gradient during the daytime,filaments nearer the water surface lose buoyancy whereasthose deeper on the gradient gain buoyancy, and they convergeon a depth (zn) in the metalimnion where the average irradi-ance supports neutral buoyancy (267). The filaments becomemore buoyant at night, but because of their small size theymove up only a few centimeters before the next day (262, 267,268). In this way certain Oscillatoria spp. (10, 117, 125, 127,267, 280) and Limnothrix spp. (153) may form metalimneticpopulations that persist for several months each summer indeep, well-stratified lakes. This sort of stratification can occuronly in relatively transparent lakes, where the light penetratesto a sufficient depth that z,, is below the surface water layersthat are mixed by wind or by nighttime convectional cooling. Inless transparent eutrophic waters, where zn is much nearer thesurface, the population is regularly dispersed by mixing andcannot stratify (266).
It has been demonstrated that buoyancy regulation is themechanism by which filaments stratify in metalimnetic layers;filaments suspended in containers above the layer sink down,while those suspended below it float up (262, 267). Evidence of
(U) % filaments floating0 20 40 60
-
E
80 100
fw
e 1)(o) filament length concentration (m I )
0.1 1 10 100(o) photon irradiance (pmol m-2 S-1 )
1000
FIG. 29. Vertical distribution and buoyancy state of a population ofOscillatoria aghardii filaments in lake Gjersj0en, Norway, in relation totemperature and photon irradiance. Redrawn from Walsby et al. (267)with permission from the publishers.
the direction of movement in the lake water can be collected byusing upward- and downward-facing traps (125).By the same buoyancy-regulating mechanisms, faster-mov-
ing colonies may migrate down below the metalimnion duringthe day and then return to the water surface at night (128, 263).This behavior can account for waterblooms that appear at alake surface in the morning and disappear by the afternoon.The same buoyancy-regulating behavior can account for bothstratification and vertical migration; this was confirmed by ourobservations at Lake Gjersj0en in Norway, when some of theOscillatoria filaments from the metalimnion formed coloniesthat then performed diel migration (Fig. 29) (267). It has beenshown by computer modeling techniques that differences in theamplitude of movement can be explained solely in terms of thedifferences in sinking or floating velocity due to colony size(140, 251).
Colonial cyanobacteria often form surface scums, which maypersist for days or even weeks (281). This suggests thatbuoyancy regulation sometimes fails. Several reasons havebeen suggested for the failure: the rate at which CO2 is takenup by the concentrated cyanobacteria may exceed the rate atwhich it is replenished from the air, so that carbohydratecannot be accumulated (19); photooxidation may damage thecells before they have had time to lose buoyancy (188); buoyant
MICROBIOL. REV.
GAS VESICLES 129
cells in the middle of the floating colonies may not respond,because they are shaded or prevented from having access toCO2 by the peripheral cells in the colony (167); or the cells maybecome so highly gas vacuolate that they are unable tocounteract the buoyancy by carbohydrate accumulation (261).Ibelings and Mur (96) studied scums formed in the laboratoryand showed that owing to the steep attenuation of light,photosynthetic activity was restricted to the upper few milli-meters. Although colonies there lost buoyancy, they were keptat the water surface by the blanket of buoyant, photosynthet-ically inactive colonies below them. The same occurs in thickhyperscums that form in lakes when floating colonies are
concentrated by wind action near lee shores (281).The presence of a persistent surface waterbloom does not
necessarily indicate that individual colonies are remaining atthe surface for prolonged periods; computer modeling indi-cates that waterblooms may result from an overlapping succes-
sion of colonies that each spend only a short time at the watersurface (140).During prolonged periods of calm weather, colonial cya-
nobacteria may become becalmed at the water surface andthen be further concentrated by drifting to leeward shores(185, 188). These noxious scums arouse interest because of thestench they make, the way they discolor the water, the harmthey do to fish, and the toxins they release into water supplies(27). A final consequence of the buoyancy provided by gas
vesicles is that when the population finally dies, the morbidremains are left at the water surface rather than sinking out ofsight at the bottom of a lake.Some Microcystis populations do sink to the lake bottom at
the end of the autumn. In Blelham Tarn in the English LakeDistrict, the floating colonies were weighed down by ironcompounds that precipitated when ferrous sulfide dissolved inthe anerobic hypolimnion became oxidized as the lake mixed atoverturn (160). In Abbots Pool, Avon, England, the Microcystiscolonies failed to regain their buoyancy at night because themetabolism of dense carbohydrate ceased when the tempera-ture fell below 11°C (213). It is possible that the colonies regainbuoyancy in the spring and float up to form the inoculum forthe subsequent season (186).
Role of Buoyancy in Other Gas-Vacuolate Microorganisms
The observation that gas-vacuolate organisms occur almostexclusively in aquatic habitats has been used to support theidea that buoyancy is their principal function (31, 231). Somegas-vacuolate bacteria have been described from aerobic water
layers (202, 219) and seawater (100, 204, 205). They are foundmost abundantly, however, in the anaerobic hypolimnia ofstratified lakes (24, 25, 29, 30, 50, 51, 74-76, 89, 124, 146, 195,196, 233). Surveys of such layers have revealed 20 or more
morphologically distinct gas-vacuolate forms in a single lake(29, 233). The gas-vacuolate organisms present include ironbacteria, purple and green sulfur bacteria (24, 25, 76, 233),Chloronema giganteum (76) (possibly a green nonsulfur bacte-rium), and a wide variety of appendaged, filamentous, colonial,sheathed, and other morphological forms, including severalconsortia in which one or both members contained gas vesicles(Fig. 30; see also Table 3) (see reference 242 for a review).The changes in vertical distribution of several gas-vacuolate
bacteria in Crose Mere, England, were monitored by serialsampling (Fig. 31). They remained confined to the anaerobichypolimnion for several months, and it was estimated that thebuoyancy provided by gas vesicles would have been necessary
to sustain these organisms in suspension over this time (30).Each organism formed a population maximum at a different
depth and different time. There are two possible explanationsfor this. First, the gas vesicles may simply have given theorganisms approximately neutral buoyancy so that they sedi-mented or floated only very slowly and had time to develop apopulation maximum where conditions most favored theirgrowth. Second, the organisms may have regulated theirbuoyancy in response to some factor that formed a verticalgradient, in the way that cyanobacteria stratify on light gradi-ents. The manner in which these various organisms regulatetheir positions at different depths would make a fascinatingstudy, but it first requires their isolation and culture. This hasbeen achieved in few instances, with the notable exceptions ofcertain green and purple sulfur bacteria isolated by Pfennigand coworkers (see reference 176 for a review) and someheterotrophic bacteria isolated by Staley and coworkers (see,e.g., references 99, 204, 205, 218, and 219).
Photosynthetic bacteria. The photosynthetic bacteria typi-cally occupy the anaerobic hypolimnia of stratified lakes. Gasvesicles are found in both the purple (members of the Chro-matiaceae and Ectothiorhodospiraceae) and green (members ofthe Chlorobiaceae) sulfur bacteria and the green (but not thepurple) nonsulfur bacteria. These groups of organisms harvestthe longer-wavelength far-red light that remains unabsorbedby the phytoplankton in the epilimnion. They are often foundin discrete layers (circumscribed above by the presence ofoxygen or absence of sulfide and below by the absence of light)(29, 54, 163).Some gas-vacuolate photosynthetic bacteria have been
shown (in cultures) to lose buoyancy when the photon irradi-ance is increased (see Regulation in Phototrophic Bacteria,above); they may use buoyancy regulation to stratify on verticallight gradients in lakes, although there has been no directdemonstration of this. Many of these organisms are killed byexposure to oxygen in the presence of light, and it is thereforeimportant that they do not stray up into the aerated waters ofthe epilimnion. A mechanism that might prevent this has beenobserved in Amoebobacterpurpureus: the dispersed cells aggre-gate and sink when sulfide is depleted by oxidation (166).Owing to their small size, individual bacteria float up orsediment down only very slowly: Pedros-Alio and Sala showedthat, in Lake Ciso, Spain, no migration could be detected bynonmotile gas-vacuolate cells of Amoebobacter sp. althoughmotile flagellate cells of Chromatium minus exhibited a dailyvertical migration over 35 cm (170).
Eichler and Pfennig (54) showed that a number of gas-vacuolate purple bacteria overwintered in flocs of organicmaterial on the benthic sediments in Schleinsee, a drumlin lakein southern Germany. After the lake stratified in the spring,these bacteria disappeared from the sediment and appearedthroughout the hypolimnion. Later they became concentratedtoward the top of the hypolimnion. These changes in verticaldistribution may depend on the buoyancy provided by gasvesicles. At the autumn overturn, the cells precipitated withoxidized iron and manganese and sank to the sediment, as hadbeen observed with cyanobacteria (160).
Halobacteria. There has been little ecological investigationof gas-vacuolate halobacteria. Gas vesicles occur in the generaHalobacterium (145, 171) and Haloferax (57) and in halophilicsquare bacteria (240), which may be related to the genusHaloarcula (206). These organisms occur in shallow brinepools, among salt-encrusted sabkhas (65), in solar salt evapo-ration ponds, and in large brine lakes of arid regions. They areaerobic heterotrophs, but under microaerobic and anaerobicconditions they respire anaerobically and produce purplemembranes that support a light-dependent proton pump driv-ing photophosphorylation (21).
VOL. 58, 1994

130 WALSBY
a
I
L L{FIG. 30. Phase-contrast micrographs of gas-vacuolate bacteria from stratified lakes, showing a range of morphological forms. Reproduced from
Clark and Walsby (29) with permission from the publisher. Magnification, x 1,680.
MICROBIOL. REV.
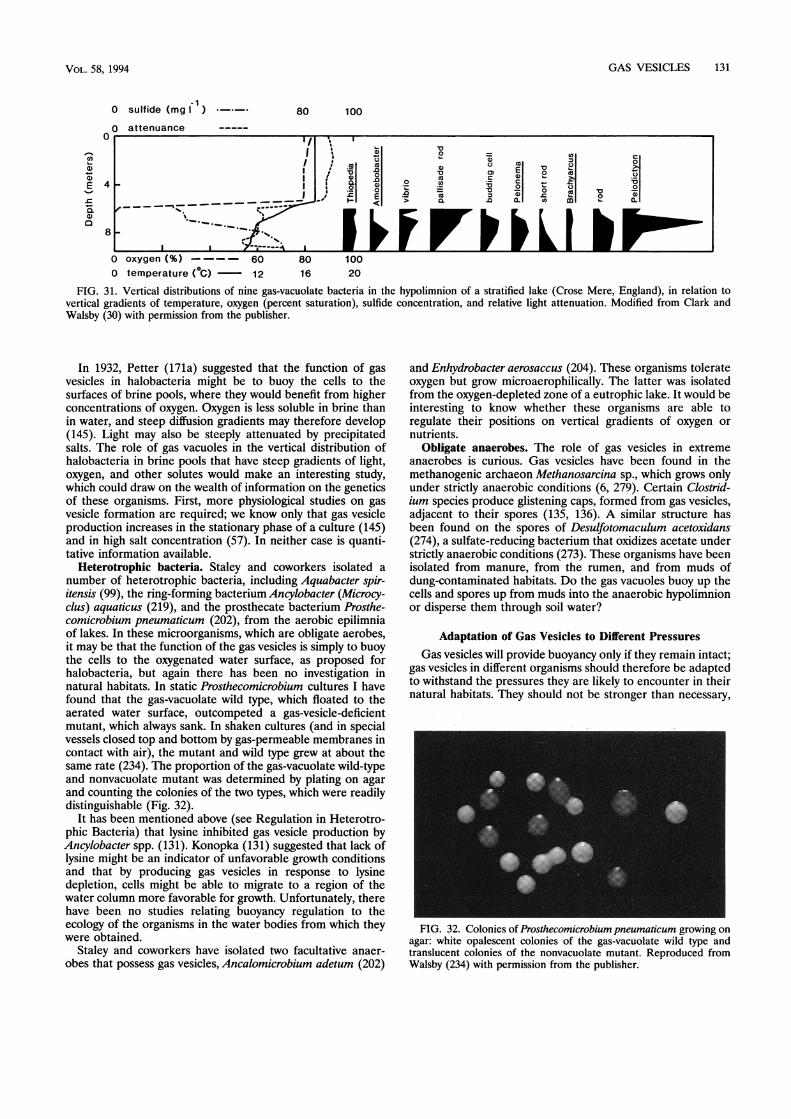
GAS VESICLES 131
0 sulfide (mg l-1)o attenuance
0 oxygen (%) ---- 600 temperature (0C) 12
80 100
8016
10020
FIG. 31. Vertical distributions of nine gas-vacuolate bacteria in the hypolimnion of a stratified lake (Crose Mere, England), in relation tovertical gradients of temperature, oxygen (percent saturation), sulfide concentration, and relative light attenuation. Modified from Clark andWalsby (30) with permission from the publisher.
In 1932, Petter (171a) suggested that the function of gasvesicles in halobacteria might be to buoy the cells to thesurfaces of brine pools, where they would benefit from higherconcentrations of oxygen. Oxygen is less soluble in brine thanin water, and steep diffusion gradients may therefore develop(145). Light may also be steeply attenuated by precipitatedsalts. The role of gas vacuoles in the vertical distribution ofhalobacteria in brine pools that have steep gradients of light,oxygen, and other solutes would make an interesting study,which could draw on the wealth of information on the geneticsof these organisms. First, more physiological studies on gasvesicle formation are required; we know only that gas vesicleproduction increases in the stationary phase of a culture (145)and in high salt concentration (57). In neither case is quanti-tative information available.
Heterotrophic bacteria. Staley and coworkers isolated anumber of heterotrophic bacteria, including Aquabacter spir-itensis (99), the ring-forming bacterium Ancylobacter (Microcy-clus) aquaticus (219), and the prosthecate bacterium Prosthe-comicrobium pneumaticum (202), from the aerobic epilimniaof lakes. In these microorganisms, which are obligate aerobes,it may be that the function of the gas vesicles is simply to buoythe cells to the oxygenated water surface, as proposed forhalobacteria, but again there has been no investigation innatural habitats. In static Prosthecomicrobium cultures I havefound that the gas-vacuolate wild type, which floated to theaerated water surface, outcompeted a gas-vesicle-deficientmutant, which always sank. In shaken cultures (and in specialvessels closed top and bottom by gas-permeable membranes incontact with air), the mutant and wild type grew at about thesame rate (234). The proportion of the gas-vacuolate wild-typeand nonvacuolate mutant was determined by plating on agarand counting the colonies of the two types, which were readilydistinguishable (Fig. 32).
It has been mentioned above (see Regulation in Heterotro-phic Bacteria) that lysine inhibited gas vesicle production byAncylobacter spp. (131). Konopka (131) suggested that lack oflysine might be an indicator of unfavorable growth conditionsand that by producing gas vesicles in response to lysinedepletion, cells might be able to migrate to a region of thewater column more favorable for growth. Unfortunately, therehave been no studies relating buoyancy regulation to theecology of the organisms in the water bodies from which theywere obtained.
Staley and coworkers have isolated two facultative anaer-obes that possess gas vesicles, Ancalomicrobium adetum (202)
and Enhydrobacter aerosaccus (204). These organisms tolerateoxygen but grow microaerophilically. The latter was isolatedfrom the oxygen-depleted zone of a eutrophic lake. It would beinteresting to know whether these organisms are able toregulate their positions on vertical gradients of oxygen ornutrients.
Obligate anaerobes. The role of gas vesicles in extremeanaerobes is curious. Gas vesicles have been found in themethanogenic archaeon Methanosarcina sp., which grows onlyunder strictly anaerobic conditions (6, 279). Certain Clostrid-ium species produce glistening caps, formed from gas vesicles,adjacent to their spores (135, 136). A similar structure hasbeen found on the spores of Desulfotomaculum acetoxidans(274), a sulfate-reducing bacterium that oxidizes acetate understrictly anaerobic conditions (273). These organisms have beenisolated from manure, from the rumen, and from muds ofdung-contaminated habitats. Do the gas vacuoles buoy up thecells and spores up from muds into the anaerobic hypolimnionor disperse them through soil water?
Adaptation of Gas Vesicles to Different PressuresGas vesicles will provide buoyancy only if they remain intact;
gas vesicles in different organisms should therefore be adaptedto withstand the pressures they are likely to encounter in theirnatural habitats. They should not be stronger than necessary,
FIG. 32. Colonies of Prosthecomicrobium pneumaticum growing onagar: white opalescent colonies of the gas-vacuolate wild type andtranslucent colonies of the nonvacuolate mutant. Reproduced fromWalsby (234) with permission from the publisher.
I0
a)
a)
E 4
0
8
0 co
a L 0 a)a a) 0F~~~~~~~. jX -1o°E o0 C''--,----g,iiF r t b L10) 1I- .00~~l. . 00a 0.5
VOL. 58, 1994

132 WALSBY
because, for the reasons already given, this would require themto be narrower and therefore less efficient in providing buoy-ancy (230, 248). In this section I review the evidence for theexpected correlation between gas vesicle critical pressure andpressure in the habitat, by examining examples of differenttypes of water body. Most of the examples involve cyanobac-teria, because there has been little investigation of othergroups.
As explained in Fig. 15, the net pressure (pn) on a gas vesiclein a cell is given by the expression
Pn =Ph +Pt + Pf-Pg (20)
In the context of natural habitats, Ph, the hydrostatic pressure
due to depth (z), rises by approximately 0.01 MPa m - 1; pf, theatmospheric pressure at sea level, is 0.1 MPa (1 bar); andpg isthe gas pressure in gas vesicles, usually the same as pf (0.1MPa) although it might be only 0.08 MPa in a hypolimnionlacking dissolved oxygen or even lower if dissolved nitrogen gas
had been depleted by nitrogenase activity (268). (Note that theconcentration of dissolved air does not increase with hydro-static pressure due to depth in a lake, and, hence, neither doespg.) The major determinants OfPn are therefore usuallyph andpt, the cell turgor pressure.
For all gas vesicles to survive, their minimum critical pres-sure must exceed pn. If cells are to float up from depth,sufficient gas vesicles must survive for buoyancy to be retained;the minimum proportion needed varies from 50% to >90%,but the more that are retained the faster the organism will float(160, 212).
Correlation between pressure in the natural habitat and p,I consider here the "case histories" of gas-vacuolate organismsin four types of habitat, in order of increasing pressure.
(i) Shallow hypersaline pools. Gas vesicles experience thelowest pressures in halobacteria that inhabit shallow hypersa-line pools such as those found in a sabhra (65). The depth isusually less than 1 m (Ph < 0.01 MPa), the cells may havenegligible turgor pressure (pt = 0 MPa) (230, 240), and thesaturated brine may become deoxygenated (pf - pg = 0.02MPa); the net pressure across the gas vesicle wall may there-fore be no more thanpn = 0.03 MPa. There has been no directdetermination of the pc of gas vesicles in halobacteria fromspecific pools, but these organisms have gas vesicles with thegreatest width and lowest critical pressure, ranging from only0.04 to 0.16 MPa, with a mean pc of 0.09 MPa (230). Thenarrower cylindrical gas vesicles of gas-vesicle-deficient mu-tants have a higher critical pressure (mean pc = 0.21 MPa[266a]). They could provide adaptation in deeper brine lakes,but there has been no ecological investigation of this.
(ii) A brine lake. Cells of the cyanobacterium Dactylococ-copsis salina are distributed throughout the depth of SolarLake, Sinai, which contains brine of density 1,200 kg m 3 to adepth of 5 m (Ph = 0.06 MPa). The hypolimnion of the lakebecomes anoxic during winter stratification (pf - pg = 0.02MPa). The cells taken from the lake water have a turgorpressure p, = 0.08 MPa. The gas vesicles therefore experiencepressures up to only Pn = 0.16 MPa (268). Critical pressuredistributions of gas vesicles from cultured cells indicate a mean
Pc = 0.33 MPa (254), whereas the weakest gas vesicles, pc =
0.18 MPa, are just strong enough to withstand the pressures inthe lake. The gas vesicles of this organism are among theweakest and widest of those found in cyanobacteria (254). Thecells ofAphanothece halophytica from the same lake (268) havegas vesicles of rather similar width and strength (llOa).
(iii) Freshwater lakes. Many freshwater lakes contain thecyanobacteria Anabaena, Aphanizomenon, Gloeotrichia, Micro-
cystis, and Oscillatoria spp., in which the mean critical pressuresof gas vesicles vary from 0.55 to 1.0 MPa. The lakes may varyin depth from 5 to 70 m or more (ph = 0.05 to >0.7 MPa). Cellturgor pressures are usually in the range p, = 0.3 to 0.4 MPa.The potential range of pressure therefore varies from 0.35 to>1.1 MPa, depending on the range of depth encountered.There is evidence that stronger gas vesicles are correlated withcyanobacteria from deeper lakes (216). Three examples areconsidered here.
In Lake Rotongaio, New Zealand, Anabaena minutissimahad gas vesicles with a mean pc = 0.62 MPa; the cells had amaximum turgor pressure p, = 0.43 MPa, and most of thepopulation were within the top 3 m (p,, = 0.03 MPa); thecombined pressure (pn = 0.46 MPa) was shown to collapse lessthan 2% of the gas vesicles. Analysis of the critical pressurecurves showed that circulation of filaments to the lake bottom(where, for 80% of the lake area, z = 15 m andph = 0.15 MPa)would have caused collapse of less than 30% of the gas vesiclesin the turgid cells, leaving 90% of the filaments buoyant (266).The rather weak gas vesicles were just strong enough towithstand the pressures in this lake.
In Lake Gjersj0en, Norway, Oscillatoria aghardii had gasvesicles with a mean pc = 1.0 MPa, apparently excessive forfilaments present mainly within the top 6 to 10 m of the watercolumn (Ph = 0.1 MPa;p, = 0.3 MPa;pn = 0.4 MPa [Fig. 29])during the summer months. In the autumn, however, overturnoccurs and the population is circulated through much of the70-m depth (when p, + Ph = 1 MPa). The filaments thatremain buoyant with intact gas vesicles are later able to floatup under the ice, where they persist during the winter (267).When the ice melts in spring, overturn occurs again and thefilaments with intact gas vesicles float up to form the inoculumof the metalimnetic summer population.
It might be wondered whether there is an ideal pc for eachparticular lake (although this is tantamount to wonderingwhether there should be one ideal cyanobacterium in eachlake, the sort of problem which has been addressed byHutchinson in his "paradox of the plankton" [94]). There isevidence against this. The strain of Anabaena flos-aquae fromWindermere in the English Lake District (18) has gas vesicleswith a mean pC of 0.60 MPa (254), which would generally beadequate to withstand the sum ofPh and pt encountered in theepilimnion; gas vesicles in Anabaena lemmermannii from thesame lake, however, have a mean pc of 0.93 MPa (261). Thetwo species behave differently. The weak gas vesicles of A.flos-aquae facilitate buoyancy loss at high irradiance, whichmight enable it to escape from surface waterblooms by sinking(46, 110). A. lemmermannii, with its stronger gas vesicles,cannot do this, and it can become overbuoyant and be stuck atthe water surface (261). Its strategy is to form akinetes thatlose gas vesicles and sink to the lake bottom (191), at a depthof >40 m in Windermere. The akinetes later germinate toproduce hormogonia. For them to float up into the epilimnion,their gas vesicles must be strong enough to withstand the totalpressure there (Ph + p, > 0.8 MPa).
(iv) Oceans. Several Trichodesmium species have been iden-tified in the oceans (200), where they form extensive surfacewaterblooms (9). They contain gas vesicles of greater strengththan any other organisms, with a mean pc of 1.2 to 3.7 MPa.Trichodesmium colonies have been found at depths exceeding200 m (28) (Ph > 2.0 MPa); their gas vesicles must withstandthese pressures if the colonies are to float back to the surfacelayers of the sea. The colonies may migrate over such depthsduring diel buoyancy regulation (141).
This brief survey supports the view that gas vesicles indifferent organisms have become adapted to withstand the
MICROBIOL. REV.
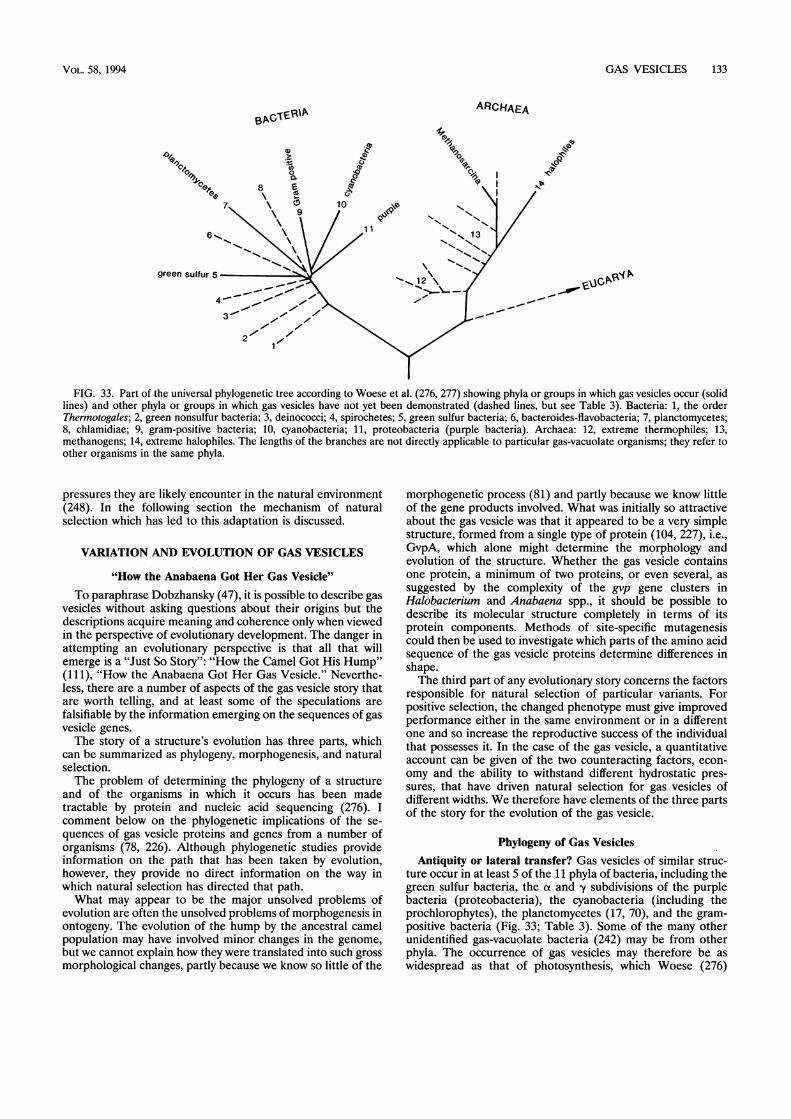
GAS VESICLES 133
ARCHAEABPCTEFO
-ozI
4.0
10
9
green
1 -
FIG. 33. Part of the universal phylogenetic tree according to Woese et al. (276, 277) showing phyla or groups in which gas vesicles occur (solidlines) and other phyla or groups in which gas vesicles have not yet been demonstrated (dashed lines, but see Table 3). Bacteria: 1, the orderThermotogales; 2, green nonsulfur bacteria; 3, deinococci; 4, spirochetes; 5, green sulfur bacteria; 6, bacteroides-flavobacteria; 7, planctomycetes;8, chlamidiae; 9, gram-positive bacteria; 10, cyanobacteria; 11, proteobacteria (purple bacteria). Archaea: 12, extreme thermophiles; 13,methanogens; 14, extreme halophiles. The lengths of the branches are not directly applicable to particular gas-vacuolate organisms; they refer toother organisms in the same phyla.
pressures they are likely encounter in the natural environment(248). In the following section the mechanism of naturalselection which has led to this adaptation is discussed.
VARLITION AND EVOLUTION OF GAS VESICLES
"How the Anabaena Got Her Gas Vesicle"To paraphrase Dobzhansky (47), it is possible to describe gas
vesicles without asking questions about their origins but thedescriptions acquire meaning and coherence only when viewedin the perspective of evolutionary development. The danger inattempting an evolutionary perspective is that all that willemerge is a "Just So Story": "How the Camel Got His Hump"(111), "How the Anabaena Got Her Gas Vesicle." Neverthe-less, there are a number of aspects of the gas vesicle story thatare worth telling, and at least some of the speculations arefalsifiable by the information emerging on the sequences of gasvesicle genes.The story of a structure's evolution has three parts, which
can be summarized as phylogeny, morphogenesis, and naturalselection.The problem of determining the phylogeny of a structure
and of the organisms in which it occurs has been madetractable by protein and nucleic acid sequencing (276). Icomment below on the phylogenetic implications of the se-quences of gas vesicle proteins and genes from a number oforganisms (78, 226). Although phylogenetic studies provideinformation on the path that has been taken by evolution,however, they provide no direct information on the way inwhich natural selection has directed that path.What may appear to be the major unsolved problems of
evolution are often the unsolved problems of morphogenesis inontogeny. The evolution of the hump by the ancestral camelpopulation may have involved minor changes in the genome,but we cannot explain how they were translated into such grossmorphological changes, partly because we know so little of the
morphogenetic process (81) and partly because we know littleof the gene products involved. What was initially so attractiveabout the gas vesicle was that it appeared to be a very simplestructure, formed from a single type of protein (104, 227), i.e.,GvpA, which alone might determine the morphology andevolution of the structure. Whether the gas vesicle containsone protein, a minimum of two proteins, or even several, assuggested by the complexity of the gvp gene clusters inHalobacterium and Anabaena spp., it should be possible todescribe its molecular structure completely in terms of itsprotein components. Methods of site-specific mutagenesiscould then be used to investigate which parts of the amino acidsequence of the gas vesicle proteins determine differences inshape.The third part of any evolutionary story concerns the factors
responsible for natural selection of particular variants. Forpositive selection, the changed phenotype must give improvedperformance either in the same environment or in a differentone and so increase the reproductive success of the individualthat possesses it. In the case of the gas vesicle, a quantitativeaccount can be given of the two counteracting factors, econ-omy and the ability to withstand different hydrostatic pres-sures, that have driven natural selection for gas vesicles ofdifferent widths. We therefore have elements of the three partsof the story for the evolution of the gas vesicle.
Phylogeny of Gas VesiclesAntiquity or lateral transfer? Gas vesicles of similar struc-
ture occur in at least 5 of the 11 phyla of bacteria, including thegreen sulfur bacteria, the ot and -y subdivisions of the purplebacteria (proteobacteria), the cyanobacteria (including theprochlorophytes), the planctomycetes (17, 70), and the gram-positive bacteria (Fig. 33; Table 3). Some of the many otherunidentified gas-vacuolate bacteria (242) may be from otherphyla. The occurrence of gas vesicles may therefore be aswidespread as that of photosynthesis, which Woese (276)
VOL. 58, 1994
NIF(I P,-Apo,,,
e%jo

134 WALSBY
TABLE 3. Genera of gas-vacuolate bacteria and archaeaa
BACTERIASection 3: Nonmotile curved bacteria
Ancylobacter (= Microcyclus) (219), Meniscus (98),Brachyarcus
Section 4: Aerobic rods and cocciAquabacter (99) (phylum lloa), Lampropedia
Section 5: Facultatively anaerobic rods; VibrionaceaeEnhydrobacter (204)
Section 13: Gram-positive endosporeforming rods and cocci(phylum 9)
Clostridium, Desulfotomaculum (274)Section 18: Anoxygenic photosynthetic bacteria
Purple bacteria (phylum 11y-1):ChromatiaceaeLamprobacter, Lamprocystis, Thiodictyon, Amoebobacter,
ThiopediaEctothiorhodospiraceae
Ectothiorhodospira (97a)Green bacteriaGreen sulfur bacteria (phylum 5)
Pelodictyon, Ancalochloris, Chloroherpeton (21), ClathrochlorisConsortia
Chlorochromatium, Chloroplana, CylindrogloeaFilamentous green bacteria (phylum 2 or 5?)Chloronema
Section 19: Oxygenic photosynthetic bacteriaGroup I: Cyanobacteria
Order: ChroococcalesDactylococcopsis, Microcystis, Coelosphaerium
Order: OscillatorialesSpirulina, Oscillatoria, Trichodesmium, Pseudanabaena
Order: NostocalesAnabaena, Anabaenopsis, Aphanizomenon, Nodularia,
Cylindrospermum, Nostoc, Calothrix, GloeotrichiaGroup II: Order Prochlorales
ProchlorothrixSection 20: Aerobic, chemolithotrophic, iron-depositing bacteria
Siderocapsa, OchrobiumSection 21: Budding and appendaged bacteria
Ancalomicrobium, Prosthecomicrobium, Stella (phylum 11ao),Isosphaera (17, 70) (phylum 7)
Section 22: Sheathed bacteriaLeptothrix
Section 23: Nonphotosynthetic gliding bacteriaPelonema, Peloploca, Achroonema
ARCHAEASection 25: ArchaeaGroup I: Methanogens; Order Methanomicrobiales
Methanosarcina, Methanothri&" (phylum 13)Group III: Extreme halophiles; Order Halobacteriales
Halobacterium, Haloferax (58), Natronobacterium (155a),square bacterium (240) (phylum 14)
a Classified according to Bergey's Manual of Systematic Bacteriology. Thephylogenetic positions of the groups or genera are indicated by the phylumnumbers used in Fig. 34, where known. References are given only to genera notlisted in the last edition of Bergey or by Walsby (241, 242).
b Gas vesicle content to be confirmed.
concluded must have its origin deep in the bacterial branch ofthe universal phylogenetic tree. The origins of gas vesicles maybe even deeper because these structures also occur in two ofthe archaeote phyla (203), the extreme halophiles (Halobacte-rium spp.) and methanogens (Methanosarcina spp.) (276, 277).
There are homologies in the amino acid sequences of bothGvpA and GvpC of cyanobacteria and the archaeote halobac-teria. The gvpA and gvpC genes in these organisms musttherefore have had a common origin. They must either havearisen in forms of life ancestral to bacteria and archaea or have
been distributed among unrelated organisms at some later dateby lateral genetic transfer (203, 226). Clues on which of thesepaths was taken might be found by comparing the sequences ofthese proteins in different organisms.The N-terminal amino acid sequences of GvpA in cyanobac-
teria, purple bacteria, and halophilic archaea (Fig. 2) showsuch a high degree of homology that it raises doubts aboutwhether this protein can have been evolving for as long as thetime that bacteria and archaea have been separated (276). Thenumber of differences in the sequences does increase, however,with the depth of phylogenetic separation. The lowest homol-ogy is between the halobacteria and cyanobacteria (rangingfrom 54 to 64% identical), and the next lowest is between thepurple sulfur bacteria and cyanobacteria (72 to 80%). Therange within the cyanobacteria is 79 to 100%, and within thisgroup the highest homologies are within the related groups,namely 98 to 100% within the three heterocystous forms(Anabaena,Aphanizomenon, and Calothrix spp.) and 95 to 98%within the Oscillatoriacean forms (Oscillatoria, Pseudan-abaena, and Spirulina spp.), which have a distinctive signatureof valine at residue 5 and serine at residue 40 (see the distancematrix in reference 78). The sequences that have divergedfarthest from these are those of the two unicellular halophiliccyanobacteria, Dactylococopsis salina and Aphanothece halo-phytica, which are identical to one another (78, 110a). Thus thepattern of homology is consistent with the probable phylogenyof these organisms (71) and supports the idea that the highhomology results from slow evolution of the gene.Some evidence about the evolution of GvpC can be gleaned
from comparisons of the N-terminal sequences of this proteinin cyanobacteria and halobacteria (78), from the repeatingmotifs in the complete GvpC sequences of three of theseorganisms (37, 84, 91, 106), and from an analysis of therepeating substructure within these motifs (37) (see below).The N-terminal sequences of GvpC in seven species of
cyanobacteria show much lower homology than those of GvpAin the same organisms (Fig. 7). Within the heterocystousspecies the range is 51 to 92% identical; Microcystis sp. has 42to 45% of residues identical to this group. In GvpC proteinsfrom Oscillatoria and Spirulina species, only 16 to 24% areidentical to those in the heterocystous species, but theirmembership of the same phylogenetic group is establishedthrough their higher homology, 31 to 36% identical (52 to 57%similar) to GvpC in Microcystis sp. In Dactylococcopsis salinathere are two additional proteins, one of 17 kDa and the otherof 35 kDa; remarkably, the first 24 amino acids in these twoproteins are identical to one another, while the subsequentsequences are different (78). Neither of the Dactyloccopsisproteins showed significant homology to the other GvpCproteins (Fig. 7).Both the comparisons, of GvpA and GvpC sequences,
indicate a pattern of homology that is consistent with what isknown of the phylogeny of these organisms. There is thereforeno direct evidence from the sequence data (e.g., of moresimilar sequences in less closely related organisms) that wouldsupport the idea that lateral transfer ofgvp genes has occurred.The large variation in GvpC sequences is compatible with an
ancient ancestry of this protein. GvpA must, then, haveevolved either more recently or more slowly. The original gasvesicles must have had GvpA, because that is what principallyforms them, but it is possible that they lacked GvpC. It followsthat GvpC cannot be an older constituent of the gas vesicle andthat the higher degree of similarity of GvpA in differentorganisms must be due to a higher level of sequence conser-vation (78). The small (70-residue) GvpA molecule has toprovide not only most of the structure of the gas vesicle but
MICROBIOL. REV.

GAS VESICLES 135
also most of its properties; this must have imposed manylimitations on its evolution. Another limitation has beenimposed by duplication of this gene, as discussed below (seeMultiple Copies of the gvpA Gene). The limitations on evolu-tion of GvpC, which "merely" has to form ties between GvpA,may be fewer. In summary, the limited sequence data suggestthat within the bacteria the genes encoding both proteins wereinherited linearly rather than acquired by lateral transfer.By an extension of the same argument, GvpA and GvpC in
halophilic archaea may have evolved in the same way: theirsequences are more divergent from the cyanobacterial ones, inkeeping with their deeper origins in the phylogenetic tree.There are, however, several features of the gvp genes inhalobacteria that suggest that we should keep open the possi-bility of acquisition by lateral transfer from a bacterium. First,the homology with cyanobacterial GvpA is high; second,although homology of the N-terminal sequence of Halobacte-rium GvpC is very low (<9% identical), the section containingthe 31- to 41-residue repeats may have significant homologywith the 33-residue repeats in cyanobacteria (106) (Fig. 10);third, the promoter of the gvpA gene is of the bacterial(Escherichia coli) type (39); and fourth, the gvpA, gvpC, andgvpN genes are in the same arrangement in the operon,although the gvpF, gvpJ, gvpK, and gvpL genes are not (cf. Fig.4 and 9). In some halobacteria, gvp operons are located onplasmids, which might have served as vehicles for lateraltransfer between organisms. There is evidence that such trans-fers have occurred between halobacteria (58).
Information is now needed on the homology of other gvpgenes in other groups of organisms; Gvp sequences fromMethanosarcina spp. would be particularly valuable. The phy-logenetic relationships of the gas-vacuolate organisms shouldbe established by sequencing their other proteins and rRNAs.Sadly, of the huge body of nucleotide sequence informationavailable, little is from organisms that possess gas vesicles.
Possible origin from viruses or other structures. Gas vesi-cles may have evolved by modification of the protein of someother structure, such as the coats of cylindrical viruses (199,231). A computer search of data bases has revealed that thereis a section of the vesicular stomatitis virus spike glycoproteinG in which the amino acid residues are 29% identical (49%similar) to those in Anabaena GvpA (66). There then remainsthe problem of determining which came first (the virus or thegas vesicle). Other structures that invite morphological com-parisons include spinae (53) and various tubular inclusionsfound in cyanobacteria (101).
Speculations on Evolution of Gas Vesicle Morphology
It can be argued that the first gas vesicles evolved inhalophilic microorganisms (either bacteria, archaea, or theirancestors) that lacked turgor pressure (230, 240) and lived inshallow brine pools, where they encountered little hydrostaticpressure. Under the low pressure in such organisms, thestructure formed would have required only a very low criticalpressure. From this primitive weak gas vesicle could haveevolved a stronger gas vesicle capable of withstanding higherpressure generated by either turgor or depth (see Modifica-tions of GvpA, below). Note that the argument for the originof gas vesicles in turgorless cells holds irrespective of whetherthere had subsequently been lateral transfer of the gas vesiclegene between groups of organisms. Had lateral transfer oc-curred, however, the gas vesicles encoded by the gene wouldhave survived only if they had been strong enough to withstandthe pressure encountered in the new recipient organism.Transfers would have been more likely to succeed from cells of
high turgor to those of lower turgor than would transfers in theopposite direction.
In passing, it is worth commenting that the same consider-ations apply to the evolution of the cell wall. A cell wall thatdeveloped in a turgorless halophile would have been free ofstress; more complex stress-bearing walls would have evolvedsubsequently in response to natural selection in brackish andthen freshwater environments (247).
Modifications of GvpA. The first, weak gas vesicles may havehad rib-forming proteins (precursors of GvpA) with alternate,-chains of the same length, which consequently crossed therib at right angles, a common arrangement in silks and otherfibrous proteins. A mutation that resulted in alternating3-chains differing in length by one dipeptide (e.g., by the
deletion of a dipeptide or the change in the position of a,-turn) would have caused the,B-chains to tilt at an angle of 540to the rib. With the chains thus oriented within 10 of theengineers' magic angle of 550, the strength of the structureshould have been increased. If the location of the ,B-turns wereknown, it would be possible to test the idea that the angle doesaffect strength, by making mutations of the protein that gavealternate chains of equal length. This would not, however,provide evidence that evolution proceeded by this route.
Subsequent changes in GvpA that resulted in wider gasvesicles, allowed by the proposed gain in strength, would havepermitted gains in the economy with which buoyancy wasprovided. Changes that resulted in narrower, stronger gasvesicles would have enabled gas vesicles to provide buoyancy incells that had higher turgor pressure or in cells that inhabiteddeeper lakes.
Multiple copies of the gvpA gene. The amount of GvpArequired to provide enough gas vesicles to make a cell buoyantmay exceed 5% of the total cell protein (see above). In a cellwith 2,000 genes, the average proportion of the total proteinproduced by each would be 0.05%, and the required transcrip-tion rate from a single gvpA gene would therefore exceed theaverage rate by 100 times or more, assuming a uniform rate ofturnover. If transcription had been the rate-limiting step in gasvesicle production, there would have been selection for indi-viduals with multiple copies of gvpA (234).From the cyanobacterium Anabaena flos-aquae and the
prosthecate bacterium Prosthecomicrobium pneumaticum, mu-tants have been isolated that produce fewer gas vesicles thanthe wild types and insufficient to make the cells buoyant. It wassuggested that the wild types might have two or more cistronsof the gas vesicle gene (234, 235). Evidence for multiple copiesofgvpA has now been provided by gene sequencing in Calothrixspp. (37), Anabaena spp. (82a), and Halobacterium spp. (209).
If a single gvpA gene provides insufficient protein to makegas vesicles fast enough to provide positive buoyancy, of whatselective value would have been the original single gvpA gene?The presence of some gas vesicles would have decreasedbuoyant density and decreased sedimentation velocity. Asdiscussed above (see Regulation of Gas Vesicle Production),there are examples of extant cyanobacteria with too few gasvesicles for buoyancy, e.g., Pseudanabaena sp., which is knownto possess only one gvpA gene (35). The general question ofselection of characters that provide only marginal advantages isdiscussed by Darwin (38) and Dawkins (42).There is an idea that after duplication of a gene has
occurred, the mutation of the two genes could occur at a higherrate because disadvantageous mutations in one gene would notprove lethal if the other were unchanged. Damerval et al. (37)pointed out that the two copies of the Calothrix gvpA genediffer in 18 nucleotides but none of these differences give riseto a change in amino acid sequence. The probability that none
VOL. 58, 1994
136 WALSBY
of 18 random mutations will affect the sequence of thetranslation product is extremely low. Gas vesicle assembly bythe wild-type protein might be adversely affected by thepresence of a mutated protein (37). Perhaps nonidenticalGvpA proteins stack to form a mechanically unstable structure,with the result that amino acid changes specified by only one oftwo or more gvpA genes prove lethal for the gas vesicle. Thismight explain the low rate of evolution of GvpA in differentcyanobacteria. Changes might occur more frequently in mu-tants having only a single functional GvpA. It is noted thatslightly different GvpAs are produced by plasmid and chromo-somal genes in halobacteria (209), although it is not knownwhether these proteins are produced simultaneously in thesame cell.
Modifications of GvpC. The outer protein, GvpC, may haveevolved from one of a number of proteins that, throughchance, adhered to sites on GvpA and formed ties betweenadjacent ribs. The likelihood of this happening is indicated bythe finding that lysozyme (which has a short region of aminoacid sequence that is similar to part ofAnabaena GvpC) bindsto cyanobacterial gas vesicles (78) and, in doing so, slightlyincreases their critical pressure (21a). GvpC proteins maytherefore be polyphyletic in origin.Changes in the primitive GvpC that improved its adhesion to
GvpA would have been selected if they had increased gasvesicle strength. The increase in the number of 33-residuerepeats presumably brought about improvements in thestrength or other properties of the gas vesicle. As mentionedabove (Function of GvpC: Strengthening the Gas Vesicle),such improvements can be investigated by experiments on gasvesicles reconstituted with recombinant GvpCs containingdifferent numbers of the 33-residue repeats. There are somepuzzling aspects to the origin of the repeats.The 33-residue repeats in GvpC are encoded by 99-nucle-
otide segments of gvpC that themselves comprise partiallyconserved repeats of 33 nucleotides (37); the 33-nucleotiderepeat (encoding 11 residues) might therefore have been theoriginal genetic element from which gvpC evolved. The four33-residue repeats of Calothrix GvpC show a homology of73%, whereas that among the five repeats of Anabaena fios-aquae GvpC is even higher, 84%. The homology among thethree 11-residue repeats within each 33-residue repeat is muchlower (Fig. 5). This indicates that the 33-residue repeats hadsome conserved property (such as their ability to span a rib)that was not present in the 11-residue repeats.The homology between the consensus sequences of the
33-residue repeats inAnabaena and Calothrix spp. is only 52%,considerably lower than the homology between the repeatswithin each species. This suggests that the sequence of eventsleading to the extant GvpC in each organism was (i) thepresence in the last common ancestor of a gene encoding aprotein containing a single 33-residue sequence, (ii) differentmutations in the gene giving modified sequences in the ances-tral branches of the two organisms, and (iii) replication to givefour or five repeats of the modified sequence. What is uncon-vincing about this scenario is the idea that there should havebeen no replication of the sequence in the common ancestorand then, independently, replication in both offspring. Analternative is that (i) the gene in the last common ancestor didhave repeats and (ii) different mutations occurred in the33-residue repeats in the two branches leading to Anabaenaand Calothrix spp. but, by some mechanism, particular muta-tions came to dominate in all of the repeats in each organism.There are other cases in which sequence identity is maintainedin tandem arrays of genes, e.g., the genes for rRNA.
Information is now needed on the full sequences of GvpCs
in other organisms. In particular, it is important to establishthe number of repeats in other organisms. It is noted that thereis a correlation between the number of repeats and gas vesiclewidth in the three organisms (Anabaena, Calothrix, andHalobacterium spp.) for which full sequences are known.
Natural Selection of the Gas Vesicle
There are two types of questions that can be raised about thenatural selection of gas vesicles providing a means of verticalmigration in aquatic microorganisms. The first concerns thedifferent forms of gas vesicles that have evolved in differentorganisms; the second concerns why some organisms evolvedgas vesicles, which provide buoyancy, while others evolvedflagella, which provide motility. An attempt will be made tosupply quantitative answers to these questions.
Natural selection of gas vesicles of different widths. Most ofthe elements of the natural selection of gas vesicle width havebeen discussed in earlier parts of this review, but they mustnow be drawn together. The sequence of events in this naturalselection is summarized in Fig. 34, which illustrates how thefrequency of genotypes that control particular widths may beenriched in a mixed population.
First, consider natural selection for wider gas vesicles thatare produced with more economy. Imagine two cells of cya-nobacteria in a shallow lake; one cell, W, has wide gas vesiclesof diameter 84 nm (as in Anabaena flos-aquae), and the other,N, has narrow ones of diameter 62 nm (as in Oscillatoriaagardhii). As a consequence of their diameters (equation 10;Fig. 20 and 21), these gas vesicles have critical pressures of 0.6and 1.0 MPa, respectively. The cells remain in the epilimnionby producing enough gas vesicles for neutral buoyancy, whichin W requires 5% of the cell protein in the form of Gvp and inN requires 7% (see Amount of Gas Vesicles Required forBuoyancy, above). This extra 2% of protein makes no directcontribution to cell growth; suppose the consequence of this isthat the cell generation time of W is 2% shorter than that of N,say 49 h instead of 50 h. After 50 generation times of W (i.e.,2,450 h or about 15 weeks, the length of the growing season),W could leave a maximum of 250 cells while N could leave 24,half as many. Assuming that cells of both types were subject tothe same loss processes (e.g., by predation) this W:N ratio of2:1 would be maintained until the next growth season in thefollowing year. (Adams and Carr [2] made a similar analysis ofthe burden of producing heterocysts.)
Next consider counteracting natural selection for narrowergas vesicles that have greater strength. Imagine the same twocells in the epilimnion of a 70-m-deep lake during the summerperiod of stratification. After 15 weeks the number of progenyof Wwould again be twice that of N. When the lake destratifiesin the winter, the stronger gas vesicles in the progeny ofN willsurvive circulation to all depths without collapse but theweaker gas vesicles in the progeny of Wwill collapse when theyare mixed to below a critical depth, zc = 20 m, where thecombination of hydrostatic pressure (Ph > 0.2 MPa) and turgorpressure (p1 = 0.4 MPa) exceeds their critical pressures. Whenthe lake restratifies in the following spring, all of the survivingprogeny of N could float into the epilimnion to form aninoculum for the next season's growth. Only a proportion ofthe surviving progeny of W, say 25% (depending on suchfactors as the proportion of water in the lake that is above zc),would remain floating in the epilimnion, while the rest wouldsink. The ratio of W:N in the inoculum for the following yearwould be 1:2, the reverse of that in the shallow lake.The numbers in this example are imaginary but feasible: the
method of quantitative analysis indicates that natural selection
MICROBIOL. REV.
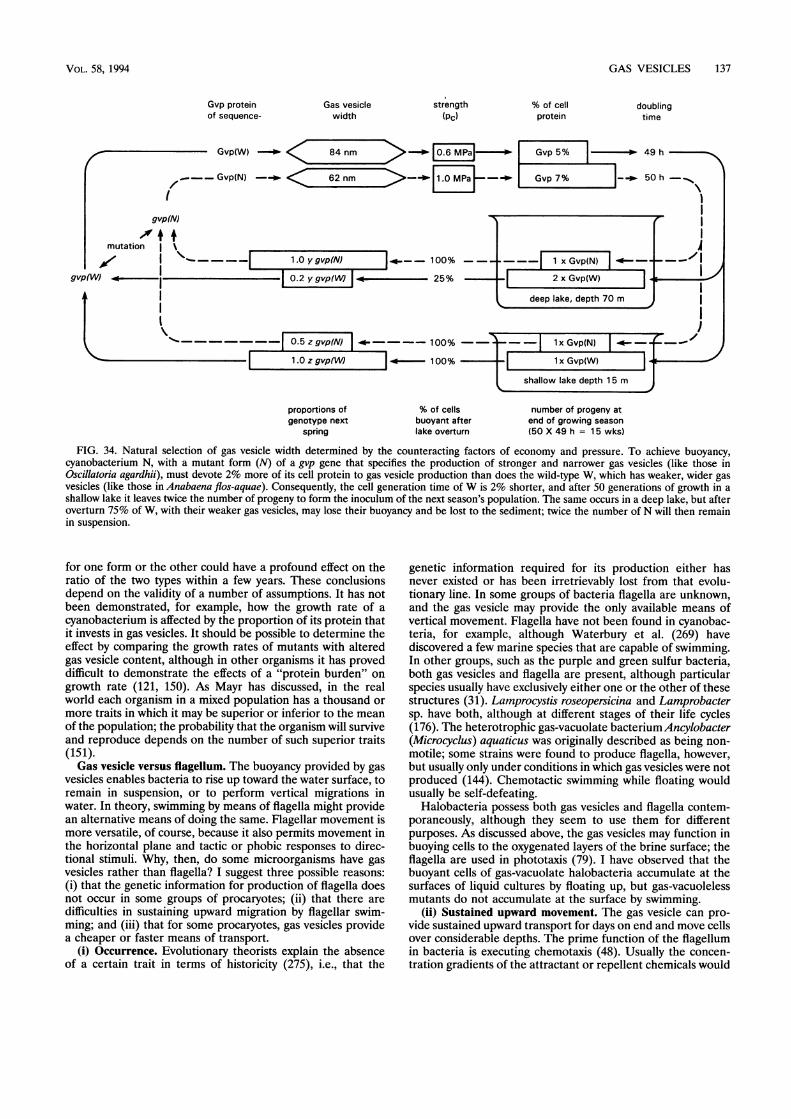
GAS VESICLES 137
Gvp proteinof sequence-
Gas vesiclewidth
strength(Pc)
% of cellprotein
doublingtime
Gvp(W) 10.6-MPa|>| Gvp5%7 o 495h
Gvp(N\ --m --O1.- MP-|01 Gvp 7% |- -oi 5 h -_l.
gvp(N)
'U'mutation I \
gvp(WJ .0 I-
t%_ I
1.0 y gvp(N) |- 100% --
*I 0.2 ygvppW I 25%I- 1 x Gvp(N) I|0 - -_ --/I
_2 x Gvp(W) | -
deep lake, depth 70 m I
-| 0.5z gvp(NI | --100%1.0 z gvp(W)
proportions ofgenotype next
spring
I|*/ 100%
% of cellsbuoyant afterlake overturn
-Z 1 x Gvp(N) | --
sho1 x Gvp(W)t lm
shallow lake depth 1 5 m
I
number of progeny atend of growing season(50 X 49 h = 15 wks)
FIG. 34. Natural selection of gas vesicle width determined by the counteracting factors of economy and pressure. To achieve buoyancy,cyanobacterium N, with a mutant form (N) of a gvp gene that specifies the production of stronger and narrower gas vesicles (like those inOscillatoria agardhii), must devote 2% more of its cell protein to gas vesicle production than does the wild-type W, which has weaker, wider gasvesicles (like those in Anabaena flos-aquae). Consequently, the cell generation time ofW is 2% shorter, and after 50 generations of growth in ashallow lake it leaves twice the number of progeny to form the inoculum of the next season's population. The same occurs in a deep lake, but afteroverturn 75% of W, with their weaker gas vesicles, may lose their buoyancy and be lost to the sediment; twice the number of N will then remainin suspension.
for one form or the other could have a profound effect on theratio of the two types within a few years. These conclusionsdepend on the validity of a number of assumptions. It has notbeen demonstrated, for example, how the growth rate of acyanobacterium is affected by the proportion of its protein thatit invests in gas vesicles. It should be possible to determine theeffect by comparing the growth rates of mutants with alteredgas vesicle content, although in other organisms it has proveddifficult to demonstrate the effects of a "protein burden" ongrowth rate (121, 150). As Mayr has discussed, in the realworld each organism in a mixed population has a thousand ormore traits in which it may be superior or inferior to the meanof the population; the probability that the organism will surviveand reproduce depends on the number of such superior traits(151).Gas vesicle versus flagellum. The buoyancy provided by gas
vesicles enables bacteria to rise up toward the water surface, toremain in suspension, or to perform vertical migrations inwater. In theory, swimming by means of flagella might providean alternative means of doing the same. Flagellar movement ismore versatile, of course, because it also permits movement inthe horizontal plane and tactic or phobic responses to direc-tional stimuli. Why, then, do some microorganisms have gasvesicles rather than flagella? I suggest three possible reasons:(i) that the genetic information for production of flagella doesnot occur in some groups of procaryotes; (ii) that there aredifficulties in sustaining upward migration by flagellar swim-ming; and (iii) that for some procaryotes, gas vesicles providea cheaper or faster means of transport.
(i) Occurrence. Evolutionary theorists explain the absenceof a certain trait in terms of historicity (275), i.e., that the
genetic information required for its production either hasnever existed or has been irretrievably lost from that evolu-tionary line. In some groups of bacteria flagella are unknown,and the gas vesicle may provide the only available means ofvertical movement. Flagella have not been found in cyanobac-teria, for example, although Waterbury et al. (269) havediscovered a few marine species that are capable of swimming.In other groups, such as the purple and green sulfur bacteria,both gas vesicles and flagella are present, although particularspecies usually have exclusively either one or the other of thesestructures (31). Lamprocystis roseopersicina and Lamprobactersp. have both, although at different stages of their life cycles(176). The heterotrophic gas-vacuolate bacteriumAncylobacter(Microcyclus) aquaticus was originally described as being non-motile; some strains were found to produce flagella, however,but usually only under conditions in which gas vesicles were notproduced (144). Chemotactic swimming while floating wouldusually be self-defeating.
Halobacteria possess both gas vesicles and flagella contem-poraneously, although they seem to use them for differentpurposes. As discussed above, the gas vesicles may function inbuoying cells to the oxygenated layers of the brine surface; theflagella are used in phototaxis (79). I have observed that thebuoyant cells of gas-vacuolate halobacteria accumulate at thesurfaces of liquid cultures by floating up, but gas-vacuolelessmutants do not accumulate at the surface by swimming.
(ii) Sustained upward movement. The gas vesicle can pro-vide sustained upward transport for days on end and move cellsover considerable depths. The prime function of the flagellumin bacteria is executing chemotaxis (48). Usually the concen-tration gradients of the attractant or repellent chemicals would
f
VOL. 58, 1994
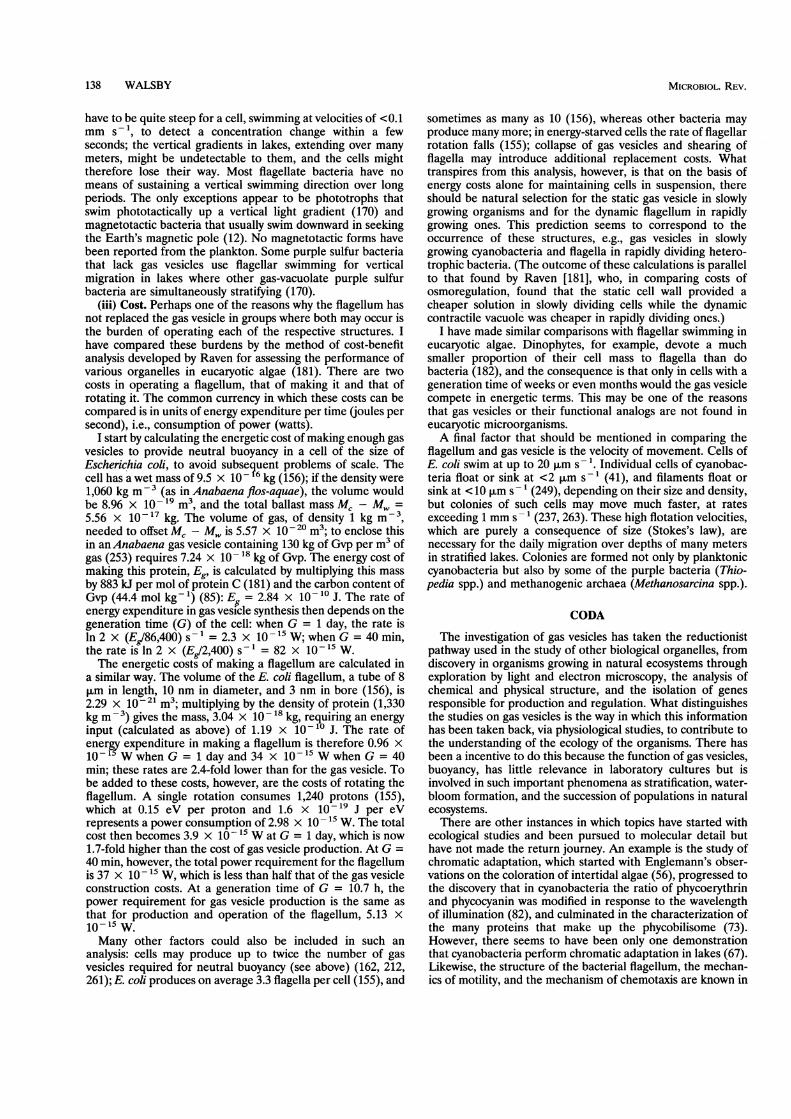
138 WALSBY
have to be quite steep for a cell, swimming at velocities of <0.1mm s-1, to detect a concentration change within a fewseconds; the vertical gradients in lakes, extending over manymeters, might be undetectable to them, and the cells mighttherefore lose their way. Most flagellate bacteria have nomeans of sustaining a vertical swimming direction over longperiods. The only exceptions appear to be phototrophs thatswim phototactically up a vertical light gradient (170) andmagnetotactic bacteria that usually swim downward in seekingthe Earth's magnetic pole (12). No magnetotactic forms havebeen reported from the plankton. Some purple sulfur bacteriathat lack gas vesicles use flagellar swimming for verticalmigration in lakes where other gas-vacuolate purple sulfurbacteria are simultaneously stratifying (170).
(iii) Cost. Perhaps one of the reasons why the flagellum hasnot replaced the gas vesicle in groups where both may occur isthe burden of operating each of the respective structures. Ihave compared these burdens by the method of cost-benefitanalysis developed by Raven for assessing the performance ofvarious organelles in eucaryotic algae (181). There are twocosts in operating a flagellum, that of making it and that ofrotating it. The common currency in which these costs can becompared is in units of energy expenditure per time (joules persecond), i.e., consumption of power (watts).
I start by calculating the energetic cost of making enough gasvesicles to provide neutral buoyancy in a cell of the size ofEscherichia coli, to avoid subseq1uent problems of scale. Thecell has a wet mass of 9.5 x 10 6 kg (156); if the density were1,060 kg m-3 (as in Anabaena flos-aquae), the volume wouldbe 8.96 x 10- 19 mi3, and the total ballast mass Mc - Mw =5.56 x 10⁻¹⁷ kg. The volume of gas, of density 1 kg m-3,needed to offset Mc - Mw is 5.57 x 10- 20 m3; to enclose thisin anAnabaena gas vesicle containing 130 kg of Gvp per m3 ofgas (253) requires 7.24 x 10⁻¹⁸ kg of Gvp. The energy cost ofmaking this protein, Eg, is calculated by multiplying this massby 883 kJ per mol of protein C (181) and the carbon content ofGvp (44.4 mol kg1) (85): Eg = 2.84 x 101- o J. The rate ofenergy expenditure in gas vesicle synthesis then depends on thegeneration time (G) of the cell: when G = 1 day, the rate isln 2 x (Eg/86,400) s = 2.3 x 10⁻¹⁵ W; when G = 40 min,the rate is ln 2 x (Eg/2,400) s-' = 82 x 10-15 W.The energetic costs of making a flagellum are calculated in
a similar way. The volume of the E. coli flagellum, a tube of 8pum in length, 10 nm in diameter, and 3 nm in bore (156), is2.29 x 10-21 m3; multiplying by the density of protein (1,330kg m 3) gives the mass, 3.04 x 10⁻¹⁸ kg, requiring an energyinput (calculated as above) of 1.19 x 10⁻¹⁰ J. The rate ofenergy expenditure in making a flagellum is therefore 0.96 x10 W when G = 1 day and 34 x 10- l W when G = 40min; these rates are 2.4-fold lower than for the gas vesicle. Tobe added to these costs, however, are the costs of rotating theflagellum. A single rotation consumes 1,240 protons (155),which at 0.15 eV per proton and 1.6 x 10-l' J per eVrepresents a power consumption of 2.98 x 10⁻¹⁵ W. The totalcost then becomes 3.9 x 10⁻¹⁵ W at G = 1 day, which is now1.7-fold higher than the cost of gas vesicle production. At G =40 min, however, the total power requirement for the flagellumis 37 x 10-15 W, which is less than half that of the gas vesicleconstruction costs. At a generation time of G = 10.7 h, thepower requirement for gas vesicle production is the same asthat for production and operation of the flagellum, 5.13 x10⁻¹⁵ W.Many other factors could also be included in such an
analysis: cells may produce up to twice the number of gasvesicles required for neutral buoyancy (see above) (162, 212,261); E. coli produces on average 3.3 flagella per cell (155), and
sometimes as many as 10 (156), whereas other bacteria mayproduce many more; in energy-starved cells the rate of flagellarrotation falls (155); collapse of gas vesicles and shearing offlagella may introduce additional replacement costs. Whattranspires from this analysis, however, is that on the basis ofenergy costs alone for maintaining cells in suspension, thereshould be natural selection for the static gas vesicle in slowlygrowing organisms and for the dynamic flagellum in rapidlygrowing ones. This prediction seems to correspond to theoccurrence of these structures, e.g., gas vesicles in slowlygrowing cyanobacteria and flagella in rapidly dividing hetero-trophic bacteria. (The outcome of these calculations is parallelto that found by Raven [181], who, in comparing costs ofosmoregulation, found that the static cell wall provided acheaper solution in slowly dividing cells while the dynamiccontractile vacuole was cheaper in rapidly dividing ones.)
I have made similar comparisons with flagellar swimming ineucaryotic algae. Dinophytes, for example, devote a muchsmaller proportion of their cell mass to flagella than dobacteria (182), and the consequence is that only in cells with ageneration time of weeks or even months would the gas vesiclecompete in energetic terms. This may be one of the reasonsthat gas vesicles or their functional analogs are not found ineucaryotic microorganisms.A final factor that should be mentioned in comparing the
flagellum and gas vesicle is the velocity of movement. Cells ofE. coli swim at up to 20 ,um s-l. Individual cells of cyanobac-teria float or sink at <2 ,um s-1 (41), and filaments float orsink at < 10 um s -1 (249), depending on their size and density,but colonies of such cells may move much faster, at ratesexceeding 1 mm s- l (237, 263). These high flotation velocities,which are purely a consequence of size (Stokes's law), arenecessary for the daily migration over depths of many metersin stratified lakes. Colonies are formed not only by planktoniccyanobacteria but also by some of the purple bacteria (Thio-pedia spp.) and methanogenic archaea (Methanosarcina spp.).
CODA
The investigation of gas vesicles has taken the reductionistpathway used in the study of other biological organelles, fromdiscovery in organisms growing in natural ecosystems throughexploration by light and electron microscopy, the analysis ofchemical and physical structure, and the isolation of genesresponsible for production and regulation. What distinguishesthe studies on gas vesicles is the way in which this informationhas been taken back, via physiological studies, to contribute tothe understanding of the ecology of the organisms. There hasbeen a incentive to do this because the function of gas vesicles,buoyancy, has little relevance in laboratory cultures but isinvolved in such important phenomena as stratification, water-bloom formation, and the succession of populations in naturalecosystems.There are other instances in which topics have started with
ecological studies and been pursued to molecular detail buthave not made the return journey. An example is the study ofchromatic adaptation, which started with Englemann's obser-vations on the coloration of intertidal algae (56), progressed tothe discovery that in cyanobacteria the ratio of phycoerythrinand phycocyanin was modified in response to the wavelengthof illumination (82), and culminated in the characterization ofthe many proteins that make up the phycobilisome (73).However, there seems to have been only one demonstrationthat cyanobacteria perform chromatic adaptation in lakes (67).Likewise, the structure of the bacterial flagellum, the mechan-ics of motility, and the mechanism of chemotaxis are known in
MICROBIOL. REV.
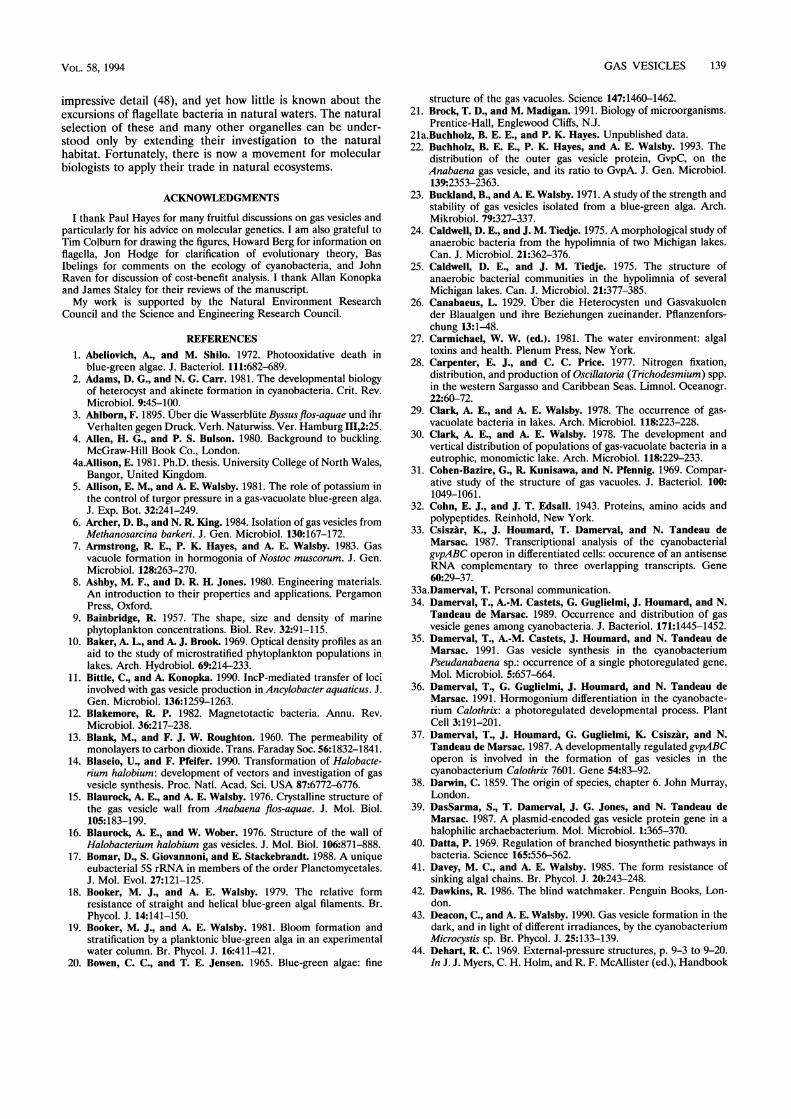
GAS VESICLES 139
impressive detail (48), and yet how little is known about theexcursions of flagellate bacteria in natural waters. The naturalselection of these and many other organelles can be under-stood only by extending their investigation to the naturalhabitat. Fortunately, there is now a movement for molecularbiologists to apply their trade in natural ecosystems.
ACKNOWLEDGMENTS
I thank Paul Hayes for many fruitful discussions on gas vesicles andparticularly for his advice on molecular genetics. I am also grateful toTim Colburn for drawing the figures, Howard Berg for information onflagella, Jon Hodge for clarification of evolutionary theory, BasIbelings for comments on the ecology of cyanobacteria, and JohnRaven for discussion of cost-benefit analysis. I thank Allan Konopkaand James Staley for their reviews of the manuscript.My work is supported by the Natural Environment Research
Council and the Science and Engineering Research Council.
REFERENCES1. Abeliovich, A., and M. Shilo. 1972. Photooxidative death in
blue-green algae. J. Bacteriol. 111:682-689.2. Adams, D. G., and N. G. Carr. 1981. The developmental biology
of heterocyst and akinete formation in cyanobacteria. Crit. Rev.Microbiol. 9:45-100.
3. Ahlborn, F. 1895. Uber die Wasserblute Byssusflos-aquae und ihrVerhalten gegen Druck. Verh. Naturwiss. Ver. Hamburg III,2:25.
4. Allen, H. G., and P. S. Bulson. 1980. Background to buckling.McGraw-Hill Book Co., London.
4a.Allison, E. 1981. Ph.D. thesis. University College of North Wales,Bangor, United Kingdom.
5. Allison, E. M., and A. E. Walsby. 1981. The role of potassium inthe control of turgor pressure in a gas-vacuolate blue-green alga.J. Exp. Bot. 32:241-249.
6. Archer, D. B., and N. R. King. 1984. Isolation of gas vesicles fromMethanosarcina barkeri. J. Gen. Microbiol. 130:167-172.
7. Armstrong, R. E., P. K. Hayes, and A. E. Walsby. 1983. Gasvacuole formation in hormogonia of Nostoc muscorum. J. Gen.Microbiol. 128:263-270.
8. Ashby, M. F., and D. R. H. Jones. 1980. Engineering materials.An introduction to their properties and applications. PergamonPress, Oxford.
9. Bainbridge, R. 1957. The shape, size and density of marinephytoplankton concentrations. Biol. Rev. 32:91-115.
10. Baker, A. L., and A. J. Brook. 1969. Optical density profiles as anaid to the study of microstratified phytoplankton populations inlakes. Arch. Hydrobiol. 69:214-233.
11. Bittle, C., and A. Konopka. 1990. IncP-mediated transfer of lociinvolved with gas vesicle production in Ancylobacter aquaticus. J.Gen. Microbiol. 136:1259-1263.
12. Blakemore, R. P. 1982. Magnetotactic bacteria. Annu. Rev.Microbiol. 36:217-238.
13. Blank, M., and F. J. W. Roughton. 1960. The permeability ofmonolayers to carbon dioxide. Trans. Faraday Soc. 56:1832-1841.
14. Blaseio, U., and F. Pfeifer. 1990. Transformation of Halobacte-rium halobium: development of vectors and investigation of gasvesicle synthesis. Proc. Natl. Acad. Sci. USA 87:6772-6776.
15. Blaurock, A. E., and A. E. Walsby. 1976. Crystalline structure ofthe gas vesicle wall from Anabaena flos-aquae. J. Mol. Biol.105:183-199.
16. Blaurock, A. E., and W. Wober. 1976. Structure of the wall ofHalobacterium halobium gas vesicles. J. Mol. Biol. 106:871-888.
17. Bomar, D., S. Giovannoni, and E. Stackebrandt. 1988. A uniqueeubacterial 5S rRNA in members of the order Planctomycetales.J. Mol. Evol. 27:121-125.
18. Booker, M. J., and A. E. Walsby. 1979. The relative formresistance of straight and helical blue-green algal filaments. Br.Phycol. J. 14:141-150.
19. Booker, M. J., and A. E. Walsby. 1981. Bloom formation andstratification by a planktonic blue-green alga in an experimentalwater column. Br. Phycol. J. 16:411-421.
20. Bowen, C. C., and T. E. Jensen. 1965. Blue-green algae: fine
structure of the gas vacuoles. Science 147:1460-1462.21. Brock, T. D., and M. Madigan. 1991. Biology of microorganisms.
Prentice-Hall, Englewood Cliffs, N.J.21a.Buchholz, B. E. E., and P. K. Hayes. Unpublished data.22. Buchholz, B. E. E., P. K. Hayes, and A. E. Walsby. 1993. The
distribution of the outer gas vesicle protein, GvpC, on theAnabaena gas vesicle, and its ratio to GvpA. J. Gen. Microbiol.139:2353-2363.
23. Buckland, B., and A. E. Walsby. 1971. A study of the strength andstability of gas vesicles isolated from a blue-green alga. Arch.Mikrobiol. 79:327-337.
24. Caldwell, D. E., and J. M. Tiedje. 1975. A morphological study ofanaerobic bacteria from the hypolimnia of two Michigan lakes.Can. J. Microbiol. 21:362-376.
25. Caldwell, D. E., and J. M. Tiedje. 1975. The structure ofanaerobic bacterial communities in the hypolimnia of severalMichigan lakes. Can. J. Microbiol. 21:377-385.
26. Canabaeus, L. 1929. Uber die Heterocysten und Gasvakuolender Blaualgen und ihre Beziehungen zueinander. Pflanzenfors-chung 13:1-48.
27. Carmichael, W. W. (ed.). 1981. The water environment: algaltoxins and health. Plenum Press, New York.
28. Carpenter, E. J., and C. C. Price. 1977. Nitrogen fixation,distribution, and production of Oscillatoria (Trichodesmium) spp.in the western Sargasso and Caribbean Seas. Limnol. Oceanogr.22:60-72.
29. Clark, A. E., and A. E. Walsby. 1978. The occurrence of gas-vacuolate bacteria in lakes. Arch. Microbiol. 118:223-228.
30. Clark, A. E., and A. E. Walsby. 1978. The development andvertical distribution of populations of gas-vacuolate bacteria in aeutrophic, monomictic lake. Arch. Microbiol. 118:229-233.
31. Cohen-Bazire, G., R. Kunisawa, and N. Pfennig. 1969. Compar-ative study of the structure of gas vacuoles. J. Bacteriol. 100:1049-1061.
32. Cohn, E. J., and J. T. Edsall. 1943. Proteins, amino acids andpolypeptides. Reinhold, New York.
33. Csiszar, K., J. Houmard, T. Damerval, and N. Tandeau deMarsac. 1987. Transcriptional analysis of the cyanobacterialgvpABC operon in differentiated cells: occurence of an antisenseRNA complementary to three overlapping transcripts. Gene60:29-37.
33a.Damerval, T. Personal communication.34. Damerval, T., A.-M. Castets, G. Guglielmi, J. Houmard, and N.
Tandeau de Marsac. 1989. Occurrence and distribution of gasvesicle genes among cyanobacteria. J. Bacteriol. 171:1445-1452.
35. Damerval, T., A.-M. Castets, J. Houmard, and N. Tandeau deMarsac. 1991. Gas vesicle synthesis in the cyanobacteriumPseudanabaena sp.: occurrence of a single photoregulated gene.Mol. Microbiol. 5:657-664.
36. Damerval, T., G. Guglielmi, J. Houmard, and N. Tandeau deMarsac. 1991. Hormogonium differentiation in the cyanobacte-rium Calothrix: a photoregulated developmental process. PlantCell 3:191-201.
37. Damerval, T., J. Houmard, G. Guglielmi, K. Csiszar, and N.Tandeau de Marsac. 1987. A developmentally regulated gvpABCoperon is involved in the formation of gas vesicles in thecyanobacterium Calothrix 7601. Gene 54:83-92.
38. Darwin, C. 1859. The origin of species, chapter 6. John Murray,London.
39. DasSarna, S., T. Damerval, J. G. Jones, and N. Tandeau deMarsac. 1987. A plasmid-encoded gas vesicle protein gene in ahalophilic archaebacterium. Mol. Microbiol. 1:365-370.
40. Datta, P. 1969. Regulation of branched biosynthetic pathways inbacteria. Science 165:556-562.
41. Davey, M. C., and A. E. Walsby. 1985. The form resistance ofsinking algal chains. Br. Phycol. J. 20:243-248.
42. Dawkins, R. 1986. The blind watchmaker. Penguin Books, Lon-don.
43. Deacon, C., and A. E. Walsby. 1990. Gas vesicle formation in thedark, and in light of different irradiances, by the cyanobacteriumMicrocystis sp. Br. Phycol. J. 25:133-139.
44. Dehart, R. C. 1969. External-pressure structures, p. 9-3 to 9-20.In J. J. Myers, C. H. Holm, and R. F. McAllister (ed.), Handbook
VOL. 58, 1994
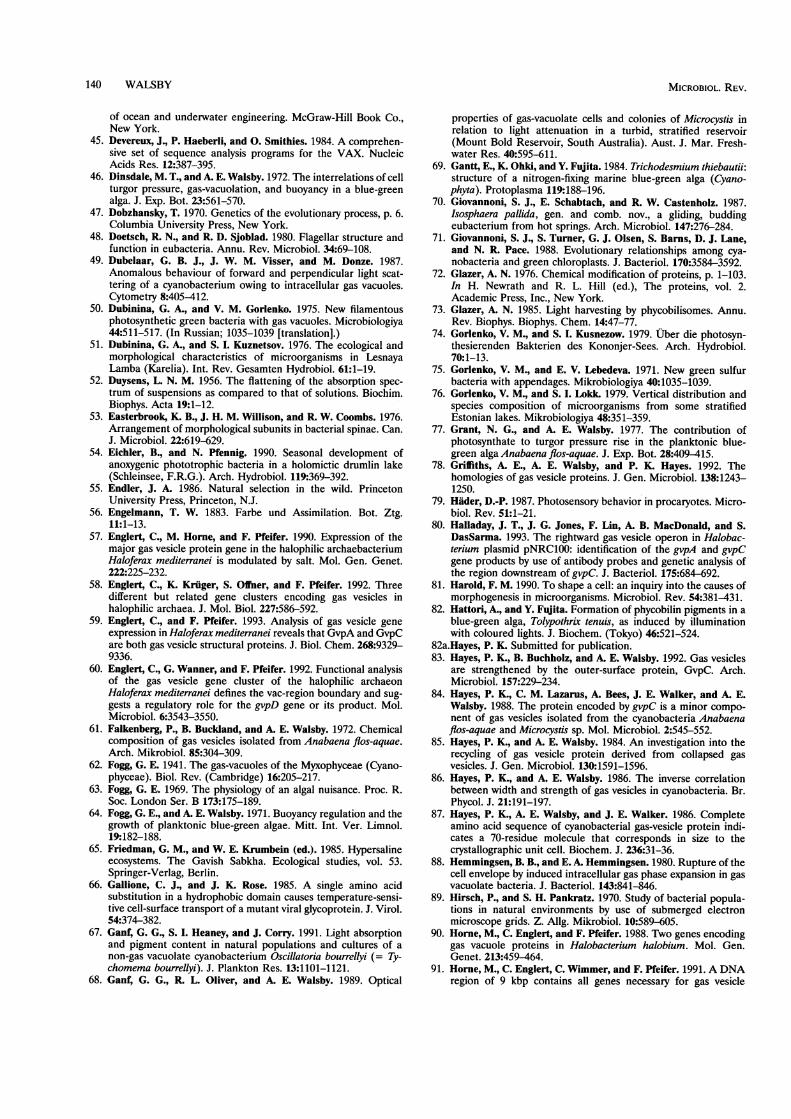
140 WALSBY
of ocean and underwater engineering. McGraw-Hill Book Co.,New York.
45. Devereux, J., P. Haeberli, and 0. Smithies. 1984. A comprehen-sive set of sequence analysis programs for the VAX. NucleicAcids Res. 12:387-395.
46. Dinsdale, M. T., and A. E. Walsby. 1972. The interrelations of cellturgor pressure, gas-vacuolation, and buoyancy in a blue-greenalga. J. Exp. Bot. 23:561-570.
47. Dobzhansky, T. 1970. Genetics of the evolutionary process, p. 6.Columbia University Press, New York.
48. Doetsch, R. N., and R. D. Sjoblad. 1980. Flagellar structure andfunction in eubacteria. Annu. Rev. Microbiol. 34:69-108.
49. Dubelaar, G. B. J., J. W. M. Visser, and M. Donze. 1987.Anomalous behaviour of forward and perpendicular light scat-tering of a cyanobacterium owing to intracellular gas vacuoles.Cytometry 8:405-412.
50. Dubinina, G. A., and V. M. Gorlenko. 1975. New filamentousphotosynthetic green bacteria with gas vacuoles. Microbiologiya44:511-517. (In Russian; 1035-1039 [translation].)
51. Dubinina, G. A., and S. I. Kuznetsov. 1976. The ecological andmorphological characteristics of microorganisms in LesnayaLamba (Karelia). Int. Rev. Gesamten Hydrobiol. 61:1-19.
52. Duysens, L. N. M. 1956. The flattening of the absorption spec-trum of suspensions as compared to that of solutions. Biochim.Biophys. Acta 19:1-12.
53. Easterbrook, K. B., J. H. M. Willison, and R. W. Coombs. 1976.Arrangement of morphological subunits in bacterial spinae. Can.J. Microbiol. 22:619-629.
54. Eichler, B., and N. Pfennig. 1990. Seasonal development ofanoxygenic phototrophic bacteria in a holomictic drumlin lake(Schleinsee, F.R.G.). Arch. Hydrobiol. 119:369-392.
55. Endler, J. A. 1986. Natural selection in the wild. PrincetonUniversity Press, Princeton, N.J.
56. Engelmann, T. W. 1883. Farbe und Assimilation. Bot. Ztg.11:1-13.
57. Englert, C., M. Horne, and F. Pfeifer. 1990. Expression of themajor gas vesicle protein gene in the halophilic archaebacteriumHaloferax mediterranei is modulated by salt. Mol. Gen. Genet.222:225-232.
58. Englert, C., K. Kruger, S. Offner, and F. Pfeifer. 1992. Threedifferent but related gene clusters encoding gas vesicles inhalophilic archaea. J. Mol. Biol. 227:586-592.
59. Englert, C., and F. Pfeifer. 1993. Analysis of gas vesicle geneexpression in Haloferax mediterranei reveals that GvpA and GvpCare both gas vesicle structural proteins. J. Biol. Chem. 268:9329-9336.
60. Englert, C., G. Wanner, and F. Pfeifer. 1992. Functional analysisof the gas vesicle gene cluster of the halophilic archaeonHaloferax mediterranei defines the vac-region boundary and sug-gests a regulatory role for the gvpD gene or its product. Mol.Microbiol. 6:3543-3550.
61. Falkenberg, P., B. Buckland, and A. E. Walsby. 1972. Chemicalcomposition of gas vesicles isolated from Anabaena flos-aquae.Arch. Mikrobiol. 85:304-309.
62. Fogg, G. E. 1941. The gas-vacuoles of the Myxophyceae (Cyano-phyceae). Biol. Rev. (Cambridge) 16:205-217.
63. Fogg, G. E. 1969. The physiology of an algal nuisance. Proc. R.Soc. London Ser. B 173:175-189.
64. Fogg, G. E., and A. E. Walsby. 1971. Buoyancy regulation and thegrowth of planktonic blue-green algae. Mitt. Int. Ver. Limnol.19:182-188.
65. Friedman, G. M., and W. E. Krumbein (ed.). 1985. Hypersalineecosystems. The Gavish Sabkha. Ecological studies, vol. 53.Springer-Verlag, Berlin.
66. Gallione, C. J., and J. K. Rose. 1985. A single amino acidsubstitution in a hydrophobic domain causes temperature-sensi-tive cell-surface transport of a mutant viral glycoprotein. J. Virol.54:374-382.
67. Ganf, G. G., S. I. Heaney, and J. Corry. 1991. Light absorptionand pigment content in natural populations and cultures of anon-gas vacuolate cyanobacterium Oscillatoria bourrellyi (= Ty-chomema bourrellyi). J. Plankton Res. 13:1101-1121.
68. Ganf, G. G., R. L. Oliver, and A. E. Walsby. 1989. Optical
properties of gas-vacuolate cells and colonies of Microcystis inrelation to light attenuation in a turbid, stratified reservoir(Mount Bold Reservoir, South Australia). Aust. J. Mar. Fresh-water Res. 40:595-611.
69. Gantt, E., K. Ohki, and Y. Fujita. 1984. Trichodesmium thiebautii:structure of a nitrogen-fixing marine blue-green alga (Cyano-phyta). Protoplasma 119:188-196.
70. Giovannoni, S. J., E. Schabtach, and R. W. Castenholz. 1987.Isosphaera pallida, gen. and comb. nov., a gliding, buddingeubacterium from hot springs. Arch. Microbiol. 147:276-284.
71. Giovannoni, S. J., S. Turner, G. J. Olsen, S. Barns, D. J. Lane,and N. R. Pace. 1988. Evolutionary relationships among cya-nobacteria and green chloroplasts. J. Bacteriol. 170:3584-3592.
72. Glazer, A. N. 1976. Chemical modification of proteins, p. 1-103.In H. Newrath and R. L. Hill (ed.), The proteins, vol. 2.Academic Press, Inc., New York.
73. Glazer, A. N. 1985. Light harvesting by phycobilisomes. Annu.Rev. Biophys. Biophys. Chem. 14:47-77.
74. Gorlenko, V. M., and S. I. Kusnezow. 1979. Uber die photosyn-thesierenden Bakterien des Kononjer-Sees. Arch. Hydrobiol.70:1-13.
75. Gorlenko, V. M., and E. V. Lebedeva. 1971. New green sulfurbacteria with appendages. Mikrobiologiya 40:1035-1039.
76. Gorlenko, V. M., and S. I. Lokk. 1979. Vertical distribution andspecies composition of microorganisms from some stratifiedEstonian lakes. Mikrobiologiya 48:351-359.
77. Grant, N. G., and A. E. Walsby. 1977. The contribution ofphotosynthate to turgor pressure rise in the planktonic blue-green alga Anabaena flos-aquae. J. Exp. Bot. 28:409-415.
78. Griffiths, A. E., A. E. Walsby, and P. K. Hayes. 1992. Thehomologies of gas vesicle proteins. J. Gen. Microbiol. 138:1243-1250.
79. Hader, D.-P. 1987. Photosensory behavior in procaryotes. Micro-biol. Rev. 51:1-21.
80. Halladay, J. T., J. G. Jones, F. Lin, A. B. MacDonald, and S.DasSarma. 1993. The rightward gas vesicle operon in Halobac-terium plasmid pNRC100: identification of the gvpA and gvpCgene products by use of antibody probes and genetic analysis ofthe region downstream of gvpC. J. Bacteriol. 175:684-692.
81. Harold, F. M. 1990. To shape a cell: an inquiry into the causes ofmorphogenesis in microorganisms. Microbiol. Rev. 54:381-431.
82. Hattori, A., and Y. Fujita. Formation of phycobilin pigments in ablue-green alga, Tolypothrnx tenuis, as induced by illuminationwith coloured lights. J. Biochem. (Tokyo) 46:521-524.
82a.Hayes, P. K. Submitted for publication.83. Hayes, P. K., B. Buchholz, and A. E. Walsby. 1992. Gas vesicles
are strengthened by the outer-surface protein, GvpC. Arch.Microbiol. 157:229-234.
84. Hayes, P. K., C. M. Lazarus, A. Bees, J. E. Walker, and A. E.Walsby. 1988. The protein encoded by gvpC is a minor compo-nent of gas vesicles isolated from the cyanobacteria Anabaenaflos-aquae and Microcystis sp. Mol. Microbiol. 2:545-552.
85. Hayes, P. K., and A. E. Walsby. 1984. An investigation into therecycling of gas vesicle protein derived from collapsed gasvesicles. J. Gen. Microbiol. 130:1591-1596.
86. Hayes, P. K., and A. E. Walsby. 1986. The inverse correlationbetween width and strength of gas vesicles in cyanobacteria. Br.Phycol. J. 21:191-197.
87. Hayes, P. K., A. E. Walsby, and J. E. Walker. 1986. Completeamino acid sequence of cyanobacterial gas-vesicle protein indi-cates a 70-residue molecule that corresponds in size to thecrystallographic unit cell. Biochem. J. 236:31-36.
88. Hemmingsen, B. B., and E. A. Hemmingsen. 1980. Rupture of thecell envelope by induced intracellular gas phase expansion in gasvacuolate bacteria. J. Bacteriol. 143:841-846.
89. Hirsch, P., and S. H. Pankratz. 1970. Study of bacterial popula-tions in natural environments by use of submerged electronmicroscope grids. Z. Allg. Mikrobiol. 10:589-605.
90. Horne, M., C. Englert, and F. Pfeifer. 1988. Two genes encodinggas vacuole proteins in Halobacterium halobium. Mol. Gen.Genet. 213:459464.
91. Horne, M., C. Englert, C. Wimmer, and F. Pfeifer. 1991. A DNAregion of 9 kbp contains all genes necessary for gas vesicle
MICROBIOL. REV.
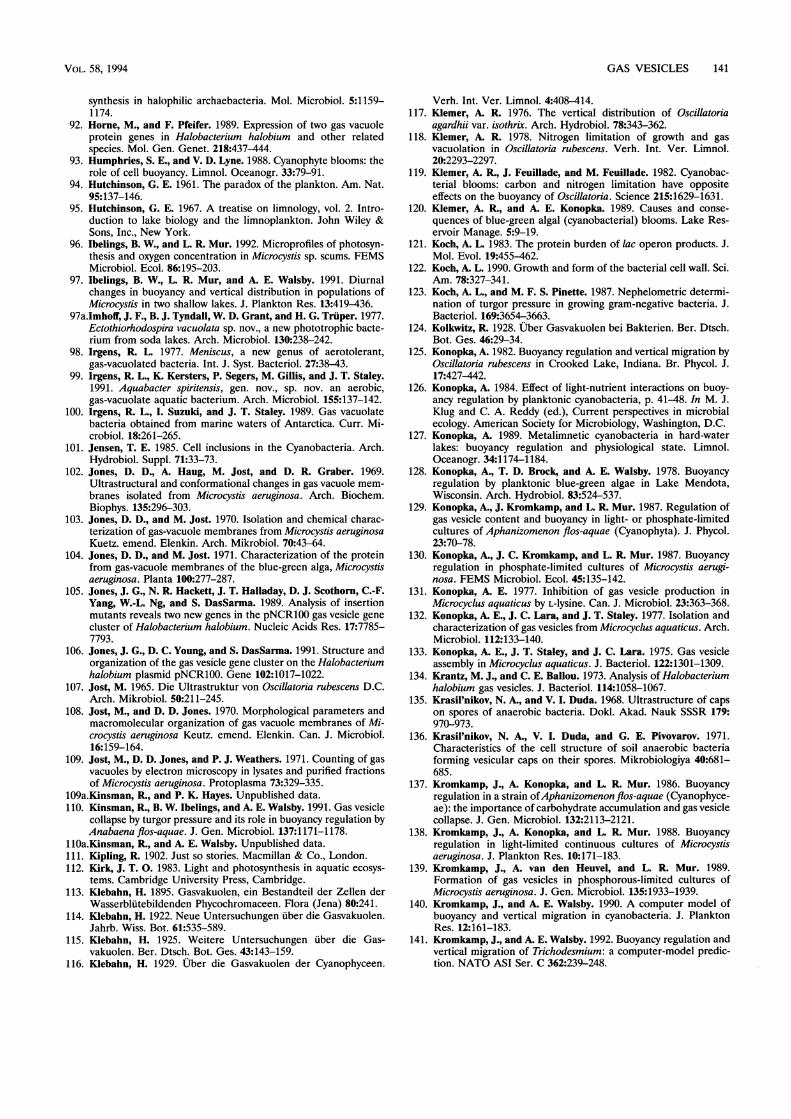
GAS VESICLES 141
synthesis in halophilic archaebacteria. Mol. Microbiol. 5:1159-1174.
92. Horne, M., and F. Pfeifer. 1989. Expression of two gas vacuoleprotein genes in Halobacterium halobium and other relatedspecies. Mol. Gen. Genet. 218:437-444.
93. Humphries, S. E., and V. D. Lyne. 1988. Cyanophyte blooms: therole of cell buoyancy. Limnol. Oceanogr. 33:79-91.
94. Hutchinson, G. E. 1961. The paradox of the plankton. Am. Nat.95:137-146.
95. Hutchinson, G. E. 1967. A treatise on limnology, vol. 2. Intro-duction to lake biology and the limnoplankton. John Wiley &Sons, Inc., New York.
96. Ibelings, B. W., and L. R. Mur. 1992. Microprofiles of photosyn-thesis and oxygen concentration in Microcystis sp. scums. FEMSMicrobiol. Ecol. 86:195-203.
97. Ibelings, B. W., L. R. Mur, and A. E. Walsby. 1991. Diurnalchanges in buoyancy and vertical distribution in populations ofMicrocystis in two shallow lakes. J. Plankton Res. 13:419-436.
97a.Imhoff, J. F., B. J. Tyndall, W. D. Grant, and H. G. Trtiper. 1977.Ectothiorhodospira vacuolata sp. nov., a new phototrophic bacte-rium from soda lakes. Arch. Microbiol. 130:238-242.
98. Irgens, R. L. 1977. Meniscus, a new genus of aerotolerant,gas-vacuolated bacteria. Int. J. Syst. Bacteriol. 27:38-43.
99. Irgens, R. L., K. Kersters, P. Segers, M. Gillis, and J. T. Staley.1991. Aquabacter spiritensis, gen. nov., sp. nov. an aerobic,gas-vacuolate aquatic bacterium. Arch. Microbiol. 155:137-142.
100. Irgens, R. L., I. Suzuki, and J. T. Staley. 1989. Gas vacuolatebacteria obtained from marine waters of Antarctica. Curr. Mi-crobiol. 18:261-265.
101. Jensen, T. E. 1985. Cell inclusions in the Cyanobacteria. Arch.Hydrobiol. Suppl. 71:33-73.
102. Jones, D. D., A. Haug, M. Jost, and D. R. Graber. 1969.Ultrastructural and conformational changes in gas vacuole mem-branes isolated from Microcystis aeruginosa. Arch. Biochem.Biophys. 135:296-303.
103. Jones, D. D., and M. Jost. 1970. Isolation and chemical charac-terization of gas-vacuole membranes from Microcystis aeruginosaKuetz. emend. Elenkin. Arch. Mikrobiol. 70:43-64.
104. Jones, D. D., and M. Jost. 1971. Characterization of the proteinfrom gas-vacuole membranes of the blue-green alga, Microcystisaeruginosa. Planta 100:277-287.
105. Jones, J. G., N. R. Hackett, J. T. Halladay, D. J. Scothorn, C.-F.Yang, W.-L. Ng, and S. DasSarma. 1989. Analysis of insertionmutants reveals two new genes in the pNCR100 gas vesicle genecluster of Halobacterium halobium. Nucleic Acids Res. 17:7785-7793.
106. Jones, J. G., D. C. Young, and S. DasSarma. 1991. Structure andorganization of the gas vesicle gene cluster on the Halobacteriumhalobium plasmid pNCR100. Gene 102:1017-1022.
107. Jost, M. 1965. Die Ultrastruktur von Oscillatoria rubescens D.C.Arch. Mikrobiol. 50:211-245.
108. Jost, M., and D. D. Jones. 1970. Morphological parameters andmacromolecular organization of gas vacuole membranes of Mi-crocystis aeruginosa Keutz. emend. Elenkin. Can. J. Microbiol.16:159-164.
109. Jost, M., D. D. Jones, and P. J. Weathers. 1971. Counting of gasvacuoles by electron microscopy in lysates and purified fractionsof Microcystis aeruginosa. Protoplasma 73:329-335.
109a.Kinsman, R., and P. K. Hayes. Unpublished data.110. Kinsman, R., B. W. Ibelings, and A. E. Walsby. 1991. Gas vesicle
collapse by turgor pressure and its role in buoyancy regulation byAnabaena flos-aquae. J. Gen. Microbiol. 137:1171-1178.
110a.Kinsman, R., and A. E. Walsby. Unpublished data.111. Kipling, R. 1902. Just so stories. Macmillan & Co., London.112. Kirk, J. T. 0. 1983. Light and photosynthesis in aquatic ecosys-
tems. Cambridge University Press, Cambridge.113. Klebahn, H. 1895. Gasvakuolen, ein Bestandteil der Zellen der
Wasserblutebildenden Phycochromaceen. Flora (Jena) 80:241.114. Klebahn, H. 1922. Neue Untersuchungen uber die Gasvakuolen.
Jahrb. Wiss. Bot. 61:535-589.115. Klebahn, H. 1925. Weitere Untersuchungen uber die Gas-
vakuolen. Ber. Dtsch. Bot. Ges. 43:143-159.116. Klebahn, H. 1929. Uber die Gasvakuolen der Cyanophyceen.
Verh. Int. Ver. Limnol. 4:408-414.117. Klemer, A. R. 1976. The vertical distribution of Oscillatoria
agardhii var. isothrix. Arch. Hydrobiol. 78:343-362.118. Klemer, A. R. 1978. Nitrogen limitation of growth and gas
vacuolation in Oscillatoria rubescens. Verh. Int. Ver. Limnol.20:2293-2297.
119. Klemer, A. R., J. Feuillade, and M. Feuillade. 1982. Cyanobac-terial blooms: carbon and nitrogen limitation have oppositeeffects on the buoyancy of Oscillatoria. Science 215:1629-1631.
120. Klemer, A. R., and A. E. Konopka. 1989. Causes and conse-quences of blue-green algal (cyanobacterial) blooms. Lake Res-ervoir Manage. 5:9-19.
121. Koch, A. L. 1983. The protein burden of lac operon products. J.Mol. Evol. 19:455-462.
122. Koch, A. L. 1990. Growth and form of the bacterial cell wall. Sci.Am. 78:327-341.
123. Koch, A. L., and M. F. S. Pinette. 1987. Nephelometric determi-nation of turgor pressure in growing gram-negative bacteria. J.Bacteriol. 169:3654-3663.
124. Kolkwitz, R. 1928. Uber Gasvakuolen bei Bakterien. Ber. Dtsch.Bot. Ges. 46:29-34.
125. Konopka, A. 1982. Buoyancy regulation and vertical migration byOscillatoria rubescens in Crooked Lake, Indiana. Br. Phycol. J.17:427-442.
126. Konopka, A. 1984. Effect of light-nutrient interactions on buoy-ancy regulation by planktonic cyanobacteria, p. 41-48. In M. J.Klug and C. A. Reddy (ed.), Current perspectives in microbialecology. American Society for Microbiology, Washington, D.C.
127. Konopka, A. 1989. Metalimnetic cyanobacteria in hard-waterlakes: buoyancy regulation and physiological state. Limnol.Oceanogr. 34:1174-1184.
128. Konopka, A., T. D. Brock, and A. E. Walsby. 1978. Buoyancyregulation by planktonic blue-green algae in Lake Mendota,Wisconsin. Arch. Hydrobiol. 83:524-537.
129. Konopka, A., J. Kromkamp, and L. R. Mur. 1987. Regulation ofgas vesicle content and buoyancy in light- or phosphate-limitedcultures of Aphanizomenon flos-aquae (Cyanophyta). J. Phycol.23:70-78.
130. Konopka, A., J. C. Kromkamp, and L. R. Mur. 1987. Buoyancyregulation in phosphate-limited cultures of Microcystis aerugi-nosa. FEMS Microbiol. Ecol. 45:135-142.
131. Konopka, A. E. 1977. Inhibition of gas vesicle production inMicrocyclus aquaticus by L-lysine. Can. J. Microbiol. 23:363-368.
132. Konopka, A. E., J. C. Lara, and J. T. Staley. 1977. Isolation andcharacterization of gas vesicles from Microcyclus aquaticus. Arch.Microbiol. 112:133-140.
133. Konopka, A. E., J. T. Staley, and J. C. Lara. 1975. Gas vesicleassembly in Microcyclus aquaticus. J. Bacteriol. 122:1301-1309.
134. Krantz, M. J., and C. E. Ballou. 1973. Analysis of Halobacteriumhalobium gas vesicles. J. Bacteriol. 114:1058-1067.
135. Krasil'nikov, N. A., and V. I. Duda. 1968. Ultrastructure of capson spores of anaerobic bacteria. Dokl. Akad. Nauk SSSR 179:970-973.
136. Krasil'nikov, N. A., V. I. Duda, and G. E. Pivovarov. 1971.Characteristics of the cell structure of soil anaerobic bacteriaforming vesicular caps on their spores. Mikrobiologiya 40:681-685.
137. Kromkamp, J., A. Konopka, and L. R. Mur. 1986. Buoyancyregulation in a strain ofAphanizomenonflos-aquae (Cyanophyce-ae): the importance of carbohydrate accumulation and gas vesiclecollapse. J. Gen. Microbiol. 132:2113-2121.
138. Kromkamp, J., A. Konopka, and L. R. Mur. 1988. Buoyancyregulation in light-limited continuous cultures of Microcystisaeruginosa. J. Plankton Res. 10:171-183.
139. Kromkamp, J., A. van den Heuvel, and L. R. Mur. 1989.Formation of gas vesicles in phosphorous-limited cultures ofMicrocystis aeruginosa. J. Gen. Microbiol. 135:1933-1939.
140. Kromkamp, J., and A. E. Walsby. 1990. A computer model ofbuoyancy and vertical migration in cyanobacteria. J. PlanktonRes. 12:161-183.
141. Kromkamp, J., and A. E. Walsby. 1992. Buoyancy regulation andvertical migration of Trichodesmium: a computer-model predic-tion. NATO ASI Ser. C 362:239-248.
VOL. 58, 1994

142 WALSBY
142. Kromkamp, J. C., and L. R. Mur. 1984. Buoyant density changesin the cyanobacterium Microcystis aeruginosa due to changes inthe cellular carbohydrate content. FEMS Microbiol. Lett. 25:105-109.
143. Lakowicz, J. R., and G. Weber. 1973. Quenching of fluorescenceby oxygen. Detection of structural fluctuations in proteins on thenanosecond time scale. Biochemistry 12:4171-4179.
144. Lara, J. C., and A. Konopka. 1977. Isolation of motile variantsfrom gas-vacuolate strains of Ancylobacter aquaticus. J. Gen.Microbiol. 133:1489-1494.
145. Larsen, H., S. Omang, and H. Steensland. 1967. On the gasvacuoles of the halobacteria. Arch. Mikrobiol. 59:197-203.
146. Lauterborn, R. 1915. Die sapropelische Lebewelt. Naturhist.Med. Ver. Heidelberg 3:395-481.
147. Lehmann, H., and M. Jost. 1971. Kinetics of the assembly of gasvacuoles in the blue-green alga Microcystis aeruginosa Kuetz.emend. Elekin. Arch. Mikrobiol. 79:59-68.
148. Lehmann, H., and C. Wiencke. 1980. Disappearance of gasvacuoles in the blue-green alga Microcystis aeruginosa. Plant CellEnviron. 3:319-324.
149. Lewis, W. M. 1983. Interception of atmospheric fixed nitrogen asan adaptive advantage of scum formation in blue-green algae. J.Phycol. 19:534-536.
150. Marr, A. G. 1991. Growth rate of Escherichia coli. Microbiol.Rev. 19:316-333.
151. Mayr, E. 1975. Evolution and the diversity of life, p. 26-29.Harvard University Press, Cambridge, Mass.
151a.McMaster, T. J., M. J. Miles, and A. E. Walsby. Submitted forpublication.
152. Meffert, M.-E. 1987. Planktic unsheathed filaments (Cyanophyce-ae) with polar and central gas-vacuoles. I. Their morphology andtaxonomy. Arch. Hydrobiol. Suppl. 76 4:315-346.
153. Meffert, M.-E. 1989. Biotope selection of Limnothrix rosea (Uter-mohl) Meffert (Cyanophyceae). Arch. Hydrobiol. 117:129-139.
154. Meffert, M.-E., and H.-J. KrambecL 1977. Planktonic blue greenalgae of the Oscillatoria redekei group. Arch. Hydrobiol. 79:149-171.
155. Meister, M., G. Lowe, and H. C. Berg. 1987. The proton fluxthrough the bacterial flagellar motor. Cell 49:643-650.
155a.Mwatha, W. E., and W. D. Grant. 1977. Natronobacteriumvacuolata sp. nov., a haloalkaliphilic archeon isolated from LakeNgadi, Kenya. Int. J. Syst. Bacteriol. 43:401-404.
156. Neidhardt, F. C., J. L. Ingraham, and M. Schaechter. 1990.Physiology of the bacterial cell. Sinauer Associates, Sunderland,Mass.
157. Newman, F. H., and V. H. L. Searle. 1957. The general propertiesof matter. Edward Arnold, London.
158. Ogawa, T., T. Sekine, and S. Aiba. 1979. Reappraisal of theso-called light shielding of gas vacuoles in Microcystis aeruginosa.Arch. Microbiol. 122:57-60.
159. Oliver, R. L., A. J. Kinnear, and G. G. Ganf. 1981. Measurementsof cell density of three freshwater phytoplankters by densitygradient centrifugation. Limnol. Oceanogr. 26:285-294.
160. Oliver, R. L., R. H. Thomas, C. S. Reynolds, and A. E. Walsby.1985. The sedimentation of buoyant Microcystis colonies causedby precipitation with an iron-containing colloid. Proc. R. Soc.London Ser. B 223:511-528.
161. Oliver, R. L., H. C. Utkilen, and A. E. Walsby. 1982. Mechanismsof buoyancy change in different types of planktonic cyanobacte-ria, abstr. C35. Proc. 4th Int. Symp. Photosynth. Prokaryotes.
162. Oliver, R. L., and A. E. Walsby. 1984. Direct evidence for the roleof light-mediated gas vesicle collapse in the buoyancy regulationof Anabaena flos-aquae (cyanobacteria). Limnol. Oceanogr. 29:879-886.
163. Overmann, J., J. T. Beatty, K. J. Hall, N. Pfennig, and T. G.Northcote. 1991. Characterization of a dense, purple sulphurbacterial layer in a meromictic salt lake. Limnol. Oceanogr.36:846-859.
164. Overmann, J., S. Lehmann, and N. Pfennig. 1991. Gas vesicleformation and buoyancy regulation in Pelodictyon phaeoclathrati-forme (green sulphur bacteria). Arch. Microbiol. 157:29-37.
165. Overmann, J., and N. Pfennig. 1989. Pelodictyon phaeoclathrati-forme sp. nov., a new brown-colored member of the Chlorobi-
aceae forming net-like colonies. Arch. Microbiol. 152:401-406.166. Overmann, J., and N. Pfennig. 1992. Buoyancy regulation and
aggregate formation in Amoebobacter purpureus from MahoneyLake. FEMS Microbiol. Ecol. 101:67-79.
167. Paerl, H. W. 1983. Partitioning of CO2 fixation in the colonialcyanobacterium Microcystis aeruginosa: mechanism promotingformation of surface scums. Appl. Environ. Microbiol. 46:252-259.
168. Paerl, H. W., and J. F. Ustach. 1982. Blue-green algal scums: anexplanation for their occurrence during freshwater blooms. Lim-nol. Oceanogr. 27:212-217.
169. Parkes, K., and A. E. Walsby. 1981. Ultrastructure of a gas-vacuolate square bacterium. J. Gen. Microbiol. 126:503-506.
170. Pedros-Aio, C., and M. M. Sala. 1990. Microdistribution and dielvertical migration of flagellated vs. gas-vacuolate purple sulfurbacteria in a stratified water body. Limnol. Oceanogr. 35:1637-1644.
171. Petter, H. F. M. 1931. On bacteria of salted fish. Proc. Acad. Sci.Amsterdam 34:1417-1423.
171a.Petter, H. F. M. 1932. Doctoral thesis. University of Utrecht,Utrecht, The Netherlands.
172. Pfeifer, F., U. Blaseio, and M. Horne. 1989. Genome structure ofHalobacterium halobium: plasmid dynamics in gas vacuole defi-cient mutants. Can. J. Microbiol. 35:96-100.
173. Pfeifer, F., and C. Englert. 1992. Function and biosynthesis of gasvesicles in halophilic Archaea. J. Bioenerg. Biomembr. 24:577-585.
174. Pfeifer, F., G. Weidinger, and W. Goebel. 1981. Characterizationof plasmids in halobacteria. J. Bacteriol. 145:369-374.
175. Pfennig, N., and G. Cohen-Bazire. 1967. Some properties of thegreen bacterium Pelodictyon clathratiforme. Arch. Mikrobiol.59:226-236.
176. Pfennig, N., and H. Truper. 1989. Anoxygenic phototrophicbacteria, p. 1635-1709. In J. T. Staley, M. P. Bryant, N. Pfennig,and J. G. Holt (ed.), Bergey's manual of systematic bacteriology,vol. 3. The Williams & Wilkins Co., Baltimore.
177. Pinette, M. F. S., and A. L. Koch. 1988. Turgor pressureresponses of a gram-negative bacterium to antibiotic treatment,measured by collapse of gas vesicles. J. Bacteriol. 170:1129-1136.
178. Pinette, M. F. S., and A. L. Koch. 1988. Biophysics of ampicillinaction on a gas-vacuolated Gram-negative rod, p. 157-163. In P.Actor, L. Daneo-Moore, M. Higgins, M. R. J. Salton, and G. D.Shockman (ed.), Antibiotic inhibition of bacterial cell surfaceassembly and function. American Society for Microbiology,Washington, D.C.
179. Porter, J., and M. Jost. 1976. Physiological effects of the presenceand absence of gas vacuoles in the blue-green alga, Microcystisaeruginosa Kuetz. emend. Elenkin. Arch. Microbiol. 110:225-231.
179a.Powell, R. S. 1991. Ph.D. thesis. University of Bristol, Bristol,United Kingdom.
180. Powell, R. S., A. E. Walsby, P. K. Hayes, and R. Porter. 1991.Antibodies to the N-terminal sequence of GVPa bind to the endsof gas vesicles. J. Gen. Microbiol. 137:2395-2400.
181. Raven, J. A. 1982. The energetics of freshwater algae: energyrequirements for biosynthesis and volume regulation. New Phy-tol. 92:1-20.
182. Raven, J. A., and K. Richardson. 1984. Dinophyte flagella: acost-benefit analysis. New Phytol. 98:259-276.
183. Reed, R. H., and A. E. Walsby. 1985. Changes in turgor pressurein response to increases in external NaCl concentration in thegas-vacuolate cyanobacterium Microcystis sp. Arch. Microbiol.143:290-296.
184. Reynolds, C. S. 1973. Growth and buoyancy of Microcystisaeruginosa Kutz. emend. Elenkin in a shallow eutrophic lake.Proc. R. Soc. London Ser. B 184:29-50.
185. Reynolds, C. S. 1987. Cyanobacterial water-blooms. Adv. Bot.Res. 13:67-143.
186. Reynolds, C. S., G. H. M. Jaworski, H. A. Cmiech, and G. F.Leedale. 1981. On the annual cycle of the blue-green algaMicrocystis aeruginosa Kutz. emend. Elenkin. Philos. Trans. R.Soc. London Ser. B 293:419-477.
187. Reynolds, C. S., R. L. Oliver, and A. E. Walsby. 1987. Cyanobac-
MICROBIOL. REV.

GAS VESICLES 143
terial dominance: the role of buoyancy regulation in dynamic lakeenvironments. N. Z. J. Mar. Freshwater Res. 21:379-390.
188. Reynolds, C. S., and A. E. Walsby. 1975. Water-blooms. Biol.Rev. (Cambridge) 50:437-481.
189. Rippka, R., J. Deruelles, J. B. Waterbury, M. Herdman, and R. Y.Stanier. 1979. Generic assignments, strain histories and proper-ties of pure cultures of cyanobacteria. J. Gen. Microbiol. 111:1-61.
190. Robarts, R D., and T. Zohary. 1984. Microcystis aeruginosa andunderwater light attenuation in a hypertrophic lake (Hart-beespoort Dam, South Africa). J. Ecol. 72:1001-1017.
191. Rother, J. A., and P. Fay. 1977. Sporulation and the developmentof planktonic blue-green algae in two Salopian meres. Proc. R.Soc. London Ser. B 196:317-332.
192. Shear, H., and A. E. Walsby. 1975. An investigation into thepossible light-shielding role of gas vacuoles in a planktonicblue-green alga. Br. Phycol. J. 10:241-251.
193. Simon, R. D. 1978. Halobacterium strain 5 contains a plasmidwhich is correlated with the presence of gas vacuoles. Nature(London) 273:314-317.
194. Simon, R. D. 1981. Morphology and protein composition of gasvesicles from wild type and gas vacuole defective strains ofHalobacterium salinarium strain 5. J. Gen. Microbiol. 125:103-111.
195. Skuja, H. 1956. Taxonomische und biologische Studien uber dasPhytoplankton schwedischer Binnengewasser. Nova Acta Reg.Soc. Sci. Upsaliensis Ser. IV 16(3):1-404.
196. Skuja, H. 1964. Grundzuge der Algenflora und Algenvegetationder Fjeldgegenden um Abisko in Schwedisch-Lappland. NovaActa Reg. Soc. Sci. Upsaliensis Ser. IV 18(3):1-465.
197. Smayda, T. J. 1970. The suspension and sinking of phytoplanktonin the sea. Oceanogr. Mar. Biol. Annu. Rev. 8:353-414.
198. Smith, R. V., and A. Peat. 1967. Comparative structure of thegas-vacuoles of blue-green algae. Arch. Mikrobiol. 57:111-122.
199. Smith, R. V., A. Peat, and C. J. Bailey. 1969. The isolation andcharacterization of gas-cylinder membranes and a-granules fromAnabaena flos-aquae D 124. Arch. Mikrobiol. 65:87-97.
200. Sournia, A. 1968. La Cyanophycee Oscillatoria (= Trichodes-mium) dans le plancton marin: taxinomie, et observations dans leCanal de Mozambique. Nova Hedwigia 15:1-12.
201. Spencer, C. N., and D. L. King. 1985. Interactions between light,NH4', and CO2 in buoyancy regulation of Anabaena flos-aquae(Cyanophyceae). J. Phycol. 21:194-199.
202. Staley, J. T. 1968. Prosthecomicrobium and Ancalomicrobium:new prosthecate freshwater bacteria. J. Bacteriol. 95:1921-1942.
203. Staley, J. T. 1980. The gas vacuole: an early organelle ofprokaryote motility? Origins Life 10:111-116.
204. Staley, J. T., R. L. Irgens, and D. J. Brenner. 1987. Enhydrobacteraerosaccus gen. nov., sp. nov., a gas-vacuolated, facultativelyanaerobic, heterotrophic rod. Int. J. Syst. Bacteriol. 37:289-291.
205. Staley, J. T., R. L. Irgens, and R P. Herwig. 1989. Gas vacuolatebacteria from the sea ice of Antarctica. Appl. Environ. Microbiol.55:1033-1036.
206. Stoeckenius, W. 1981. Walsby's square bacterium: fine structureof an orthogonal procaryote. J. Bacteriol. 148:352-360.
207. Stoeckenius, W., and W. H. Kunau. 1968. Further characteriza-tion of particulate fractions from lysed cell envelopes ofHalobac-terium halobium and isolation of gas vacuole membranes. J. CellBiol. 38:337-357.
208. Strodtmann, S. 1895. Die Ursache des Schwebvermogens bei denCyanophyceen. Biol. Centralbl. 15:113-115.
209. Surek, B., B. Pillay, U. Rdest, K. Beyreuther, and W. Goebel.1988. Evidence for two different gas vesicle proteins and genes inHalobacterium halobium. J. Bacteriol. 70:1746-1751.
210. Tandeau de Marsac, N., D. Mazel, D. A. Bryant, and J. Houmard.1985. Molecular cloning and nucleotide sequence of a develop-mentally regulated gene from the cyanobacterium Calothrix PCC7601: a gas vesicle protein gene. Nucleic Acids Res. 13:7223-7236.
211. Taylor, B. F., C. C. Lee, and J. S. Bunt. 1973. Nitrogen-fixationassociated with the marine blue-green alga, Trichodesmium, asmeasured by the acetylene-reduction technique. Arch. Mikrobiol.88:205-212.
212. Thomas, R. H., and A. E. Walsby. 1985. Buoyancy regulation in astrain of Microcystis. J. Gen. Microbiol. 131:799-809.
213. Thomas, R. H., and A. E. Walsby. 1986. The effect of temperatureon recovery of buoyancy by Microcystis. J. Gen. Microbiol.132:1665-1672.
214. Tomasselli, A. G., E. Mast, W. Janes, and E. Schlitz. 1989. Thecomplete amino acid sequence of adenylate kinase from baker'syeast. Eur. J. Biochem. 155:111-119.
215. Utkilen, H. C., R. L. Oliver, and A. E. Walsby. 1985. Buoyancyregulation in a red Oscillatoria unable to collapse gas vacuoles byturgor pressure. Arch. Hydrobiol. 102:319-329.
216. Utkilen, H. C., 0. M. Skulberg, and A. E. Walsby. 1985. Buoyancyregulation and chromatic adaptation in planktonic Oscillatoriaspecies: alternative strategies for optimising light absorption instratified lakes. Arch. Hydrobiol. 104:407-417.
217. Van Baalen, C., and R. M. Brown. 1969. The ultrastructure of themarine blue green alga, Trichodesmium erythraeum, with specialreference to the cell wall, gas vacuoles, and cylindrical bodies.Arch. Mikrobiol. 69:79-91.
218. Van Ert, M., and J. T. Staley. 1971. A new gas vacuolatedheterotrophic rod from freshwaters. Arch. Mikrobiol. 80:70-77.
219. Van Ert, M., and J. T. Staley. 1971. Gas-vacuolated strains ofMicrocyclus aquaticus. J. Bacteriol. 108:236-240.
220. Van Liere, L., and A. E. Walsby. 1982. Interactions of cyanobac-teria with light, p. 9-45. In N. G. Carr and B. A. Whitton (ed.),The biology of cyanobacteria. Blackwell Scientific Publications,Oxford.
221. Van Rijn, J., and M. Shilo. 1983. Buoyancy regulation in a naturalpopulation of Oscillatoria spp. in fishponds. Limnol. Oceanogr.28:1034-1037.
222. Van Rijn, J., and M. Shilo. 1985. Carbohydrate fluctuations, gasvacuolation, and vertical migration of scum-forming cyanobacte-ria in fishponds. Limnol. Oceanogr. 30:1219-1228.
223. Villareal, T. A., and E. J. Carpenter. 1990. Diel buoyancyregulation in the marine diazotrophic cyanobacterium Trichodes-mium theibautii. Limnol. Oceanogr. 35:1832-1837.
223a.Waaland, J. R. 1972. Ph.D. thesis. University of California,Berkeley.
224. Waaland, J. R., and D. Branton. 1969. Gas vacuole developmentin a blue-green alga. Science 163:1339-1341.
225. Waaland, J. R., S. D. Waaland, and D. Branton. 1971. Gasvacuoles. Light shielding in a blue-green alga. J. Cell Biol.48:212-215.
226. Walker, J. E., P. K. Hayes, and A. E. Walsby. 1984. Homology ofgas vesicle proteins in cyanobacteria and halobacteria. J. Gen.Microbiol. 130:2709-2715.
227. Walker, J. E., and A. E. Walsby. 1983. Molecular weight ofgas-vesicle protein from the planktonic cyanobacteriumAnabaena flos-aquae and implications for structure of the vesicle.Biochem. J. 209:809-815.
228. Walsby, A. E. 1969. The permeability of blue-green algal gas-vacuole membranes to gas. Proc. R. Soc. London Ser. B 173:235-255.
229. Walsby, A. E. 1970. The nuisance algae: curiosities in the biologyof planktonic blue-green algae. Water Treat. Exam. 19:359-373.
230. Walsby, A. E. 1971. The pressure relationships of gas vacuoles.Proc. R. Soc. London Ser. B 178:301-326.
231. Walsby, A. E. 1972. Structure and function of gas vacuoles.Bacteriol. Rev. 36:1-32.
232. Walsby, A. E. 1973. A portable apparatus for measuring relativegas vacuolation, the strength of gas vacuoles, and turgor pressurein planktonic blue-green algae and bacteria. Limnol. Oceanogr.18:653-658.
233. Walsby, A. E. 1974. The identification of gas vacuoles and theirabundance in the hypolimnetic bacteria of Arco Lake, Minne-sota. Microb. Ecol. 1:51-61.
234. Walsby, A. E. 1976. The buoyancy-providing role of gas vacuolesin an aerobic bacterium. Arch. Microbiol. 109:135-142.
235. Walsby, A. E. 1977. Absence of gas vesicle protein in a mutant ofAnabaena flos-aquae. Arch. Microbiol. 114:167-170.
236. Walsby, A. E. 1977. The gas vacuoles of blue-green algae. Sci.Am. 237(2):90-97.
237. Walsby, A. E. 1978. The properties and buoyancy-providing role
VOL. 58, 1994

144 WALSBY
of gas vacuoles in Trichodesmium Ehrenberg. Br. Phycol. J.13:103-116.
238. Walsby, A. E. 1978. The gas vesicles of aquatic prokaryotes. InRelations between structure and function in the prokaryotic cell.Symp. Soc. Gen. Microbiol. 28:327-358.
239. Walsby, A. E. 1980. The water relations of gas-vacuolate pro-karyotes. Proc. R. Soc. London Ser. B 208:73-102.
240. Walsby, A. E. 1980. A square bacterium. Nature (London)283:69-71.
241. Walsby, A. E. 1981. Cyanobacteria: planktonic gas-vacuolateforms, p. 224-235. In M. P. Starr, H. G. Stolp, H. Triiper, A.Balows, and H. G. Schlegel (ed.), The prokaryotes. Springer-Verlag, New York.
242. Walsby, A. E. 1981. Gas-vacuolate bacteria (apart from cyanobac-teria), p. 441-447. In M. P. Starr, H. G. Stolp, H. Truper, A.Balows, and H. G. Schlegel (ed.), The prokaryotes. Springer-Verlag, New York.
243. Walsby, A. E. 1982. Permeability of gas vesicles to perfluorocy-clobutane. J. Gen. Microbiol. 128:1679-1684.
244. Walsby, A. E. 1982. The elastic compressibility of gas vesicles.Proc. R. Soc. London Ser. B 216:355-368.
245. Walsby, A. E. 1984. Lower limit of the gas permeability coefficientof gas vesicles. Proc. R. Soc. London Ser. B 223:177-196.
246. Walsby, A. E. 1985. The permeability of heterocysts to the gasesnitrogen and oxygen. Proc. R. Soc. London Ser. B 226:345-366.
247. Walsby, A. E. 1986. The pressure relationships of halophilic andnon-halophilic prokaryotic cells determined by using gas vesiclesas pressure probes. FEMS Microbiol. Rev. 39:45-49.
248. Walsby, A. E. 1987. Mechanisms of buoyancy regulation byplanktonic cyanobacteria with gas vesicles, p. 377-392. In P. Fayand C. Van Baalen (ed.), The cyanobacteria. Elsevier SciencePublishers, Amsterdam.
249. Walsby, A. E. 1988. Determination of turgor pressure and othercell-solute relations by using gas vesicles as pressure probes.Methods Enzymol. 167:660-666.
250. Walsby, A. E. 1988. Homeostasis in buoyancy regulation byplanktonic cyanobacteria. FEMW Symp. 44:99-116.
251. Walsby, A. E. 1989. The gas vesicle: a stable gas-filled structure inbacteria, p. 69-103. In A. 0. Brubakk, B. B. Hemmingsen, and G.Sundnes (ed.), Supersaturation and bubble formation in fluidsand organisms. Tapir Publishers, Trondheim, Norway.
252. Walsby, A. E. 1991. The mechanical properties of the Microcystisgas vesicle. J. Gen. Microbiol. 137:2401-2408.
252a.Walsby, A. E. Unpublished data.253. Walsby, A. E., and R. E. Armstrong. 1979. Average thickness of
the gas vesicle wall. J. Mol. Biol. 129:279-285.254. Walsby, A. E., and A. Bleything. 1988. The dimensions of
cyanobacterial gas vesicles in relation to their efficiency inproviding buoyancy and withstanding pressure. J. Gen. Micro-biol. 134:2635-2645.
255. Walsby, A. E., and M. J. Booker. 1980. Changes in buoyancy of aplanktonic blue-green alga in response to light intensity. Br.Phycol. J. 15:311-319.
256. Walsby, A. E., and B. Buckland. 1969. Isolation and purificationof intact gas vesicles from a blue-green alga. Nature (London)224:716-717.
257. Walsby, A. E., and H. H. Eichelberger. 1968. The fine structure ofgas-vacuoles released from cells of the blue-green alga Anabaenaflos-aquae. Arch. Mikrobiol. 60:76-83.
258. Walsby, A. E., and P. K. Hayes. 1988. The minor cyanobacterialgas vesicle protein, GVPc, is attached to the outer surface of thegas vesicle. J. Gen. Microbiol. 134:2647-2657.
259. Walsby, A. E., and P. K. Hayes. 1989. Gas vesicle proteins.Biochem. J. 264:313-322.
260. Walsby, A. E., R. Kinsman, and K. I. George. 1992. The mea-surement of gas vesicle volume and buoyant density in planktonicbacteria. J. Microbiol. Methods 15:293-309.
261. Walsby, A. E., R. Kinsman, B. W. Ibelings, and C. S. Reynolds.1991. Highly buoyant colonies of the cyanobacterium Anabaenalemmermannii form persistent surface waterblooms. Arch. Hy-drobiol. 121:261-280.
262. Walsby, A. E., and A. R. Klemer. 1974. The role of gas vacuolesin the microstratification of a population of Oscillatoria agardhiivar. isothrix in Deming Lake, Minnesota. Arch. Hydrobiol. 74:375-392.
262a.Walsby, A. E., A. E. Konopka, B. W. Ibelings, and A. R. Klemer.Unpublished data.
263. Walsby, A. E., and G. K. McAllister. 1987. Buoyancy regulationby Microcystis in Lake Okaro. N. Z. J. Mar. Freshwater Res.21:521-524.
264. Walsby, A. E., N. P. Revsbech, and D. H. Griffel. 1991. The gaspermeability coefficient of the cyanobacterial gas vesicle wall. J.Gen. Microbiol. 138:837-845.
265. Walsby, A. E., and C. S. Reynolds. 1980. Sinking and floating, p.371-412. In I. Morris (ed.), The physiological ecology of phyto-plankton. Blackwell Scientific Publications, Oxford.
266. Walsby, A. E., C. S. Reynolds, R. L. Oliver, and J. Kromkamp.1989. The role of gas vacuoles and carbohydrate content in thebuoyancy and vertical distribution of Anabaena minutissima inLake Rotongaio, New Zealand. Arch. Hydrobiol. Beih. Ergebn.Limnol. 32:1-25.
266a.Walsby, A. E., and R. D. Simon. Unpublished data.267. Walsby, A. E., H. C. Utkilen, and I. J. Johnsen. 1983. Buoyancy
changes of a red coloured Oscillatoria agardhii in Lake Gjersj0en,Norway. Arch. Hydrobiol. 97:18-38.
268. Walsby, A. E., J. van Rijn, and Y. Cohen. 1983. The biology of anew gas-vacuolate cyanobacterium, Dactylococcopsis salina sp.nov., in Solar Lake. Proc. R. Soc. London Ser. B 217:417-447.
269. Waterbury, J. B., J. M. Willey, D. G. Franks, F. W. Valois, andS. W. Watson. 1985. A cyanobacterium capable of swimmingmotility. Science 230:74-76.
270. Weathers, P. J., M. Jost, and D. T. A. Lamport. 1977. The gasvacuole membrane of Microcystis aeruginosa. A partial aminoacid sequence. Arch. Biochem. Biophys. 178:226-244.
271. Weidinger, G., G. Klotz, and W. Goebel. 1979. A large plasmidfrom Halobacterium halobium carrying genetic information forgas vacuole formation. Plasmid 2:377-386.
272. Whitton, B. A., and A. Peat. 1969. On Oscillatoria redekei VanGoor. Arch. Microbiol. 68:362-376.
273. Widdel, F., and N. Pfennig. 1977. A new anaerobic, sporing,acetate-oxidising, sulfate-reducing bacterium, Desulfotomaculum(emend.) acetoxidans. Arch. Microbiol. 112:119-122.
274. Widdel, F., and N. Pfennig. 1981. Sporulation and further nutri-tional characteristics of Desulfotomaculum acetoxidans. Arch.Microbiol. 129:401-402.
275. Williams, G. C. 1992. Natural selection. Domains, levels andchallenges. Oxford Series in Ecology and Evolution. OxfordUniversity Press, Oxford.
276. Woese, C. R. 1987. Bacterial evolution. Microbiol. Rev. 51:221-271.
277. Woese, C. R., 0. Kandler, and M. L. Wheelis. 1990. Towards anatural system of organisms: proposal for the domains Archaea,Bacteria, and Eucarya. Proc. Natl. Acad. Sci. USA 87:4576-4579.
278. Worcester, D. L. 1975. Neutron diffraction studies of biologicalmembrane components. Brookhaven Symp. Biol. 27(III):37-57.
279. Zhilina, T. N. 1971. The fine structure of Methanosarcina. Mik-robiologiya 40:674-680.
280. Zimmermann, U. 1969. Okologische und physiologische Unter-suchungen an der planktischen Blaualge Oscillatoria rubescensD.C. unter besonderer Berucksichtigung von Licht und Tempera-tur. Schweiz. Z. Hydrol. 31:1-58.
281. Zohary, T., and R. D. Robarts. 1989. Diurnal mixed layers andthe long-term dominance of Microcystis aeruginosa. J. PlanktonRes. 11:25-48.
MICROBIOL. REV.