Adsorption behavior of PS-PEO diblock copolymers on silver and alumina surfaces: A surface plasmon...
12
Adsorption Behavior of PS-PEO Diblock Copolymers on Silver and Alumina Surfaces: A Surface Plasmon Resonance Study ALEXANDROS G. KOUTSIOUBAS, NIKOLAOS SPILIOPOULOS, DIMITRIOS L. ANASTASSOPOULOS, ALEXANDROS A. VRADIS, CHRIS TOPRAKCIOGLU, GEORGE D. PRIFTIS Department of Physics, University of Patras, GR 26 500, Greece Received 8 December 2005; revised 1 March 2006; accepted 1 March 2006 DOI: 10.1002/polb.20806 Published online in Wiley InterScience (www.interscience.wiley.com). ABSTRACT: In this work, the adsorption behavior at the silver/toluene and alumina/ toluene interface of polystyrene–polyethylene oxide (PS-PEO) diblock copolymers of various molecular weights was investigated by implementation of the surface plas- mon resonance (SPR) technique. This was accomplished under a careful choice of ex- perimental setup and the use of a suitable physical model for the interpretation of the experimental data. Comparison between polystyrene homopolymer and PS-PEO diblock copolymer adsorption measurements indicate that PS-PEO is anchored on the alumina surface via the PEO block, while on silver the copolymer is attached by vari- ous chain segments. The measured final adsorption amounts on alumina are typical of end-attached polymeric brush formation while the dynamics of the adsorption pro- cess present two clearly different evolution regimes. This work provides insight into the many advantages of the use of the SPR technique as a valuable tool for similar surface studies. V V C 2006 Wiley Periodicals, Inc. J Polym Sci Part B: Polym Phys 44: 1580–1591, 2006 Keywords: adsorption; block copolymers; kinetics; surface plasmons INTRODUCTION Surface plasmon resonance (SPR) Spectroscopy is an optical experimental technique that is cur- rently gaining wide recognition as a valuable tool for surface studies. Under certain conditions, it may offer real-time, in situ, nondestructive analy- sis of dynamic surface events and thus is capable of determining rates of adsorption and desorption for a range of interfacial processes. In recent years, the SPR technique has been used for in situ adsorption studies of self-assembled monolayers (SAM), 1 polymer adsorption on metal or chemi- cally altered surfaces, 2–6 and in many biological applications such as protein interactions, lipid bilayers, tissue engineering, cell adhesion on biomaterial surfaces, and antigen–antibody binding. 7 In many of the above applications and espe- cially the cases where SPR is used as a biosensor, 8 the experimental data have been interpreted in a semiqualitative or phenomenological manner. In this study, it is demonstrated that by a careful choice of experimental setup and with the use of a proper physical model, the SPR technique may accurately monitor copolymer adsorption phe- nomena with long-term stability and high-time resolution. Recently, Stroeve et al. 9,10 have used the SPR technique to follow the kinetics of assembly of amphiphilic block copolymers on SAM modified gold surfaces. Block copolymers represent an interesting group of materials for applications such as stabilization and flocculation of colloidal particles, 11 lubrication, enhancement of biocom- Correspondence to: A. A. Vradis (E-mail: vradis@physics. upatras.gr) Journal of Polymer Science: Part B: Polymer Physics, Vol. 44, 1580–1591 (2006) V V C 2006 Wiley Periodicals, Inc. 1580
Transcript of Adsorption behavior of PS-PEO diblock copolymers on silver and alumina surfaces: A surface plasmon...

Adsorption Behavior of PS-PEO Diblock Copolymerson Silver and Alumina Surfaces: A Surface PlasmonResonance Study
ALEXANDROS G. KOUTSIOUBAS, NIKOLAOS SPILIOPOULOS, DIMITRIOS L. ANASTASSOPOULOS,ALEXANDROS A. VRADIS, CHRIS TOPRAKCIOGLU, GEORGE D. PRIFTIS
Department of Physics, University of Patras, GR 26 500, Greece
Received 8 December 2005; revised 1 March 2006; accepted 1 March 2006DOI: 10.1002/polb.20806Published online in Wiley InterScience (www.interscience.wiley.com).
ABSTRACT: In this work, the adsorption behavior at the silver/toluene and alumina/toluene interface of polystyrene–polyethylene oxide (PS-PEO) diblock copolymers ofvarious molecular weights was investigated by implementation of the surface plas-mon resonance (SPR) technique. This was accomplished under a careful choice of ex-perimental setup and the use of a suitable physical model for the interpretation ofthe experimental data. Comparison between polystyrene homopolymer and PS-PEOdiblock copolymer adsorption measurements indicate that PS-PEO is anchored on thealumina surface via the PEO block, while on silver the copolymer is attached by vari-ous chain segments. The measured final adsorption amounts on alumina are typicalof end-attached polymeric brush formation while the dynamics of the adsorption pro-cess present two clearly different evolution regimes. This work provides insight into themany advantages of the use of the SPR technique as a valuable tool for similar surfacestudies. VVC 2006 Wiley Periodicals, Inc. J Polym Sci Part B: Polym Phys 44: 1580–1591, 2006
Keywords: adsorption; block copolymers; kinetics; surface plasmons
INTRODUCTION
Surface plasmon resonance (SPR) Spectroscopy isan optical experimental technique that is cur-rently gaining wide recognition as a valuable toolfor surface studies. Under certain conditions, itmay offer real-time, in situ, nondestructive analy-sis of dynamic surface events and thus is capableof determining rates of adsorption and desorptionfor a range of interfacial processes. In recentyears, the SPR technique has been used for in situadsorption studies of self-assembled monolayers(SAM),1 polymer adsorption on metal or chemi-cally altered surfaces,2–6 and in many biologicalapplications such as protein interactions, lipid
bilayers, tissue engineering, cell adhesion onbiomaterial surfaces, and antigen–antibodybinding.7
In many of the above applications and espe-cially the cases where SPR is used as a biosensor,8
the experimental data have been interpreted in asemiqualitative or phenomenological manner. Inthis study, it is demonstrated that by a carefulchoice of experimental setup and with the use of aproper physical model, the SPR technique mayaccurately monitor copolymer adsorption phe-nomena with long-term stability and high-timeresolution.
Recently, Stroeve et al.9,10 have used the SPRtechnique to follow the kinetics of assembly ofamphiphilic block copolymers on SAM modifiedgold surfaces. Block copolymers represent aninteresting group of materials for applicationssuch as stabilization and flocculation of colloidalparticles,11 lubrication, enhancement of biocom-
Correspondence to: A. A. Vradis (E-mail: [email protected])
Journal of Polymer Science: Part B: Polymer Physics, Vol. 44, 1580–1591 (2006)VVC 2006 Wiley Periodicals, Inc.
1580

patibility of artificial implants, and generally themanipulation of surface properties for nano-tech-nological uses. These applications are based onthe fact that the behavior of copolymers near asolid interface is quite different from their behav-ior in the bulk solution because of the existence ofentropic constraints concerning the copolymerchain conformations near a surface.12
Block copolymers tethered to a surface throughone or more blocks may form extended layers thatare known as polymer brushes. In the case of A–Btype diblock copolymer adsorption from selectivesolvents, one block (the ‘‘anchor’’) preferentiallytethers onto the surface via physical interactions,allowing the other block (‘‘buoy’’) to extend intosolution in a ‘‘brush-like’’ conformation.13–18 Thecharacteristics of such self-assembled polymerbrushes and their formation dynamics depend onthe copolymer structure and size, the interactionsbetween the blocks, the nature of the solvent andthe surface, and so forth. The equilibrium proper-ties of A–B type copolymer brushes are wellunderstood and have been extensively studied bya variety of experimental techniques includingsurface force measurements17–21 and neutron re-flectometry.21–24
Various experimental techniques have beenapplied to study block copolymer adsorptionkinetics, including ellipsometry,25–32 quartz crys-tal microbalance,33 attenuated total internalreflection infrared (Fourier transform infrared-ATR) spectroscopy,34 reflectometry,35,36 and thesurface forces apparatus.37 In this study, SPRspectroscopy is adopted to probe the kinetics andequilibrium properties of polystyrene–polyethyl-ene oxide (PS-PEO) block copolymers at the tolu-ene/alumina and toluene/silver interface. In com-parison with some experimental techniques (e.g.,quartz crystal microbalance), SPR has theadvantage that no calibration problems areencountered while the physical characteristics ofthe surface plasmons strongly enhance the over-all sensitivity.
Most SPR adsorption studies so far haveinvolved plasmon excitation on silver or gold thinfilms. In this work, in addition to silver, surfaceplasmons are also excited on thin aluminum filmswhile the copolymer adsorption is studied on theultrathin naturally occurring oxide layer (alu-mina-Al2O3). This oxide layer is formed on thethin, freshly evaporated aluminum films becauseof aluminum’s high reactivity toward atmosphericoxygen upon contact with air. It should be men-tioned that aluminum surfaces and their coatings
are very important in industrial applicationssince aluminum and its alloys are widely used inmany areas of interest.
The experimental results presented hereinclude the first in situ SPR adsorption kineticsmeasurements of five different PS-PEO blockcopolymers from nonmicellar toluene solutions onsilver and alumina surfaces. The results aredirectly compared with theoretical predictionsconcerning the various qualitative stages of theadsorption process and with previous studiesinvolving PS-PEO adsorption at different sur-faces. Moreover, ex situ SPR measurements havebeen carried out on the formed copolymer layersto check the consistency of the adopted experi-mental method and the stability of the adsorbedlayer under solvent rinse.
EXPERIMENTAL
SPR Spectroscopy
Free electrons near a metal boundary can, undercertain conditions, perform coherent oscillationswhich are called surface plasmons.38 These oscil-lations are electromagnetic surface waves thatpropagate along the interface between a metaland its dielectric environment. Their frequency xis related to their wavevector kx by a dispersionrelation x(kx)
39
kx ¼ xc
�e1e2
e1 þ e2
�12
ð1Þ
where e1 is the complex dielectric constant of themetal, e2 the dielectric constant of the mediumthat surrounds the metal, and c the speed of lightin vacuum.
Surface plasmons can be excited by light in theso-called Kretschmann configuration40,41 using ametal-coated prism. In this case, the evanescentwaves produced by total internal reflection of p-polarized light on the coated face of the prism arecoupled with the surface charges and when theprojection of their wavevector parallel to theprism face kx fulfils the dispersion relation (eq. 1),the surfaces charges oscillate collectively with afrequency x.
For a surface plasmon on a thin metal film, therelationship between frequency and wavelengthof the wave is not only influenced by the dielectricconstant and thickness of the metal film but alsodepends strongly on the dielectric constants of
ADSORPTION BEHAVIOR OF PS-PEO DIBLOCK COPOLYMERS ON SILVER AND ALUMINA SURFACES 1581
Journal of Polymer Science: Part B: Polymer PhysicsDOI 10.1002/polb

the materials in the vicinity of the film surface.These facts render SPR spectroscopy a very sensi-tive tool for surface studies, like the adsorption ofmolecules on a metal surface.
From an experimental point of view, theadjustment of the kx component of the evanescentwavevector is achieved by the rotation of themetal-coated prism at incidence angles above thecritical angle for total internal reflection. For acertain incidence angle, kx matches the surfaceplasmon wavevector and a sharp minimum in themeasured reflectivity is observed. The angularvariation of the reflectivity will be called here-after ‘‘reflectivity curve’’ (Fig. 1). Our effort in allexperiments concerns the monitoring of the modi-fications (shift and broadening) in the reflectivitycurve due to the changes in the dielectric environ-ment of the metal.
One important requirement for the optical ex-citation of surface plasmons is that the electronsof the metal film should exhibit a gas-like behav-ior. So there are only a few candidates for opticalexcitation of surface plasmons like silver, gold,and aluminum. The characteristics of the reflec-tivity curve strongly depend on the complexdielectric constant of the metal. For example, inFigure 1, two experimental reflectivity curves areplotted. The first one that is characterized by asharper minimum in the measured reflectivitycorresponds to a 50 nm silver film, while the sec-ond curve corresponds to a 20 nm aluminum film.Aluminum has a bigger real and imaginary part
of the dielectric constant in comparison to silver,leading to a quite wider reflectivity curve and to aless sharp drop in reflectivity.
Furthermore, the natural formation of a 2–3 nm aluminum oxide (Al2O3) layer on the alumi-num surface induces a small shift of the reflectiv-ity curve toward higher angles of incidence. Thisoxide layer is formed when freshly prepared alu-minum films are exposed to atmospheric oxygenwhile it protects the film from further oxidation.Our preliminary test experiments confirmed thatafter its formation, this oxide layer is perfectlystable in contact with air and toluene.
SPR Apparatus
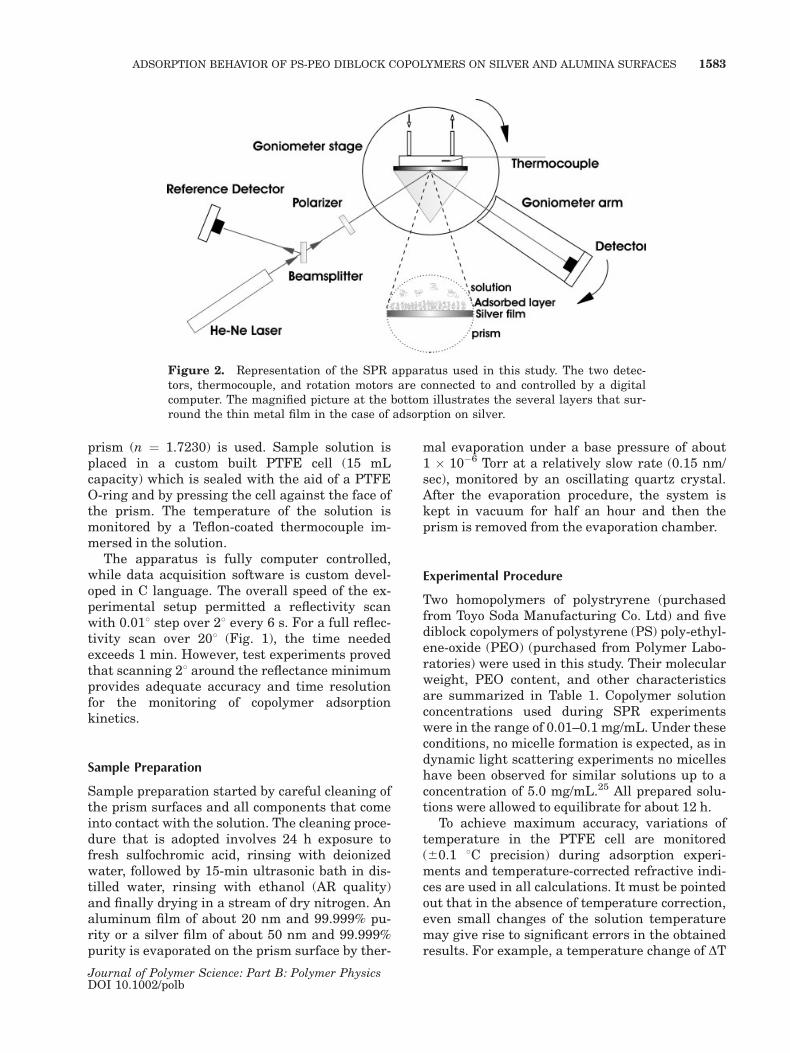
In this work, SPR spectroscopy measurementsare performed in the Kretschmann configuration.The apparatus consists of a horizontal h/2h goni-ometer based on two motorized, high precisionrotators mounted one on top of the other with acommon axis of rotation (Fig. 2). The lower rota-tor controls the angular position of the rotatingsample stage with reference to the light beam.This rotation permits the continuous variation ofincidence angle in a range of angles correspond-ing to kx values around the value that fulfills thedispersion relation (eq. 1). The upper rotator isequipped with a custom-built aluminum arm onwhich the light detector is attached. The move-ment of this rotator is programmed in a way thatensures that the detector is always in thereflected beam (h/2h movement). Both rotatorshave a precision in their movement, which per-mits an angular resolution of 0.018.
A He-Ne laser beam (k ¼ 632.8 nm) is used as alight source for the excitation of surface plas-mons. A beam splitter and a polarizer are placedbetween the light source and the sample in theprimary beam path. The beam splitter is used forthe formation of a secondary beam, which isrecorded by a second photodiode to monitor andnormalize the source light intensity. The polarizeris used for the p-polarization of the beam sincesurface plasmons are excited only by the p-compo-nent of electromagnetic waves, parallel to themetal surface. Both photodiode signals are mea-sured simultaneously using two digital GPIB con-trolled A/D devices with external triggering. Thisconfiguration allows the normalization of thelaser intensity and the suppression of the mea-sured noise below 0.2% of the signal.
For the Kretschmann configuration, a silver oraluminum-coated optically flat equilateral SF10
Figure 1. Typical experimental reflectivity curvesfor a 50 nm silver film and a 20 nm aluminum film incontact with toluene. The error of the measurement issmaller than the size of the experimental points inthe graph.
1582 KOUTSIOUBAS ET AL.
Journal of Polymer Science: Part B: Polymer PhysicsDOI 10.1002/polb
prism (n ¼ 1.7230) is used. Sample solution isplaced in a custom built PTFE cell (15 mLcapacity) which is sealed with the aid of a PTFEO-ring and by pressing the cell against the face ofthe prism. The temperature of the solution ismonitored by a Teflon-coated thermocouple im-mersed in the solution.
The apparatus is fully computer controlled,while data acquisition software is custom devel-oped in C language. The overall speed of the ex-perimental setup permitted a reflectivity scanwith 0.018 step over 28 every 6 s. For a full reflec-tivity scan over 208 (Fig. 1), the time neededexceeds 1 min. However, test experiments provedthat scanning 28 around the reflectance minimumprovides adequate accuracy and time resolutionfor the monitoring of copolymer adsorptionkinetics.
Sample Preparation
Sample preparation started by careful cleaning ofthe prism surfaces and all components that comeinto contact with the solution. The cleaning proce-dure that is adopted involves 24 h exposure tofresh sulfochromic acid, rinsing with deionizedwater, followed by 15-min ultrasonic bath in dis-tilled water, rinsing with ethanol (AR quality)and finally drying in a stream of dry nitrogen. Analuminum film of about 20 nm and 99.999% pu-rity or a silver film of about 50 nm and 99.999%purity is evaporated on the prism surface by ther-
mal evaporation under a base pressure of about1 � 10�6 Torr at a relatively slow rate (0.15 nm/sec), monitored by an oscillating quartz crystal.After the evaporation procedure, the system iskept in vacuum for half an hour and then theprism is removed from the evaporation chamber.
Experimental Procedure
Two homopolymers of polystryrene (purchasedfrom Toyo Soda Manufacturing Co. Ltd) and fivediblock copolymers of polystyrene (PS) poly-ethyl-ene-oxide (PEO) (purchased from Polymer Labo-ratories) were used in this study. Their molecularweight, PEO content, and other characteristicsare summarized in Table 1. Copolymer solutionconcentrations used during SPR experimentswere in the range of 0.01–0.1 mg/mL. Under theseconditions, no micelle formation is expected, as indynamic light scattering experiments no micelleshave been observed for similar solutions up to aconcentration of 5.0 mg/mL.25 All prepared solu-tions were allowed to equilibrate for about 12 h.
To achieve maximum accuracy, variations oftemperature in the PTFE cell are monitored(60.1 8C precision) during adsorption experi-ments and temperature-corrected refractive indi-ces are used in all calculations. It must be pointedout that in the absence of temperature correction,even small changes of the solution temperaturemay give rise to significant errors in the obtainedresults. For example, a temperature change of DT
Figure 2. Representation of the SPR apparatus used in this study. The two detec-tors, thermocouple, and rotation motors are connected to and controlled by a digitalcomputer. The magnified picture at the bottom illustrates the several layers that sur-round the thin metal film in the case of adsorption on silver.
ADSORPTION BEHAVIOR OF PS-PEO DIBLOCK COPOLYMERS ON SILVER AND ALUMINA SURFACES 1583
Journal of Polymer Science: Part B: Polymer PhysicsDOI 10.1002/polb
¼ 0.1 8C would produce a systematic error ofDG ¼ 0.07 mg/m2 on the measured adsorbedamount. Using the SPR apparatus, the refractiveindex temperature gradient of toluene was meas-ured by collecting reflectivity curves at varioustemperatures around 20 8C. The measured tem-perature gradient was found to be (dn/dT = �5.0� 10�4/8C), which is in excellent agreement withother reported experimental values.42
The first step in the experimental procedure isthe optical alignment of the laser beam normal tothe prism face, with an accuracy of 60.018. Theangular variation of the reflectivity (reflectivitycurve) of the metal film against air is recorded,leading to the determination of the thickness andcomplex dielectric constant of the film using a fit-ting procedure which is presented in the DataAnalysis section. In addition, since the refractiveindices of the prism and air are known very accu-rately, the measured position of the critical angleprovides a cross-check of the laser beam align-ment. Then the cell is filled with toluene (ARquality) and the reflectivity curve is recordedagain. The thicknesses and dielectric constants ofthe alumimum and silver films were determinedin contact with air (empty cell) and in contactwith toluene. The average dielectric constantfound was eAg ¼ �17.6 þ i0.70 for silver and eAl¼ �49.8 þ i19.7 for aluminum, in very goodagreement with values quoted in the literature.41
The determined thickness of each film and thethickness measured using the quartz crystal dur-ing evaporation were in agreement to within 5%.
In order to measure the polymer adsorption, thePS-PEO copolymer was dissolved in toluene andthen injected to pure solvent in the cell. In thisway, it is possible to achieve the desired concen-tration in the range 0.01–0.1 mg/mL. At the begin-ning of the adsorption process, the kinetics werefollowed by fixing the detector at a given angle,typically 1–28 less than the angle of the reflec-
tance minimum, and the reflected light intensitywas monitored as a function of time for about 1 or2 min. Changes in light intensity are then relatedto the curve shift via the fitting procedure de-scribed below. This procedure permitted the ac-quisition of time-resolved information about theinitial stages of the adsorption process with asampling time of 1 s. After that the apparatus wasprogrammed to scan continuously 2–48 aroundthe reflectance minimum for about 120 min andthen as the adsorption process slows down thesystem was switched to wider scans, covering 208(Fig. 1). At the end of the adsorption phenomenon,the polymer-coated film surface is rinsed with tolu-ene, dried, and measured in air (dry layer mea-surement). This procedure provides an independ-ent measurement of the total adsorbed amountwhich is directly compared with the in situ meas-urements. Moreover, in this way, the stability of theadsorbed layer against solvent rinse is revealed.
Data Analysis
Adsorption on the metal or oxide surface inducesa shift in the reflectance minimum toward higherangles and a slight broadening of the reflectiv-ity curve since the index of refraction of the PS-PEO copolymer is higher than that of toluene[Fig. 3(a)]. It should be mentioned that themagnitude of these changes depends on the dif-ference between solvent/polymer refractive indi-ces, which in our case is relatively small (Dn¼ npolystyrene � ntoluene ¼ 0.09). In all calculations,the PS-PEO refractive index is set equal to the re-fractive index of PS (n ¼ 1.582, k ¼ 632.8 nm)since the PS block of all used copolymers is muchlarger than the PEO block.
For the analysis of the experimental results,the reflectivity curves were fitted to a five-layermodel as (prism/metal/oxide layer/adsorbed layer/solution) for in situ adsorption measurements,
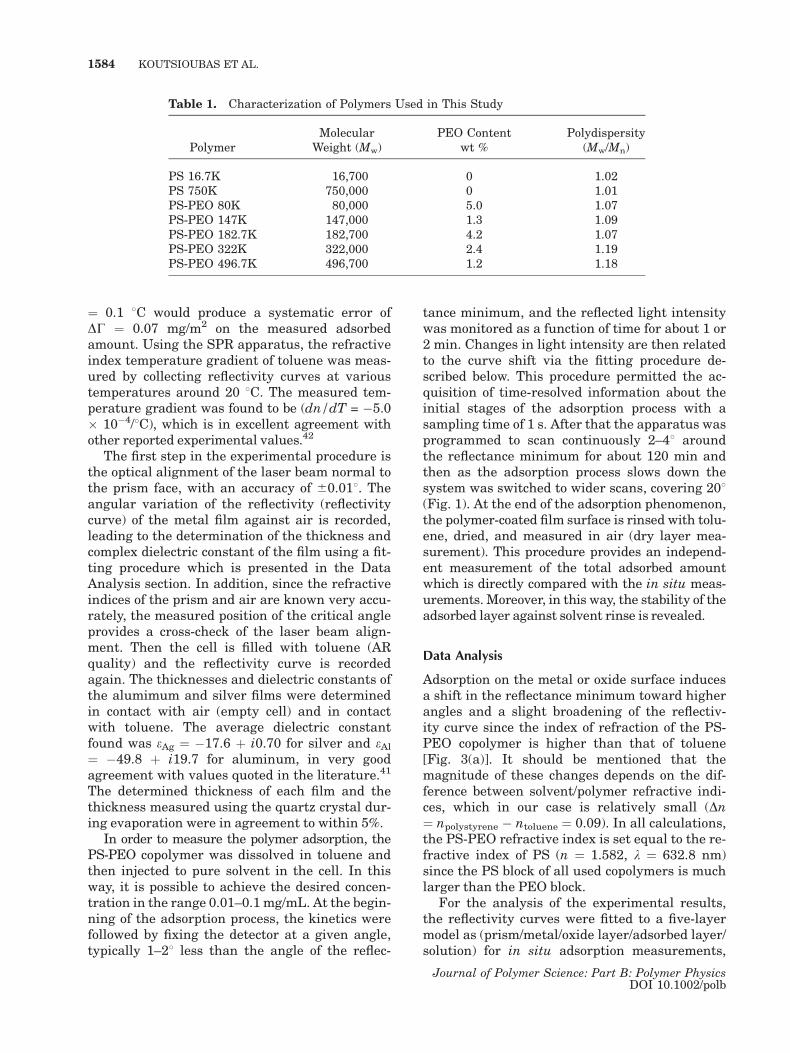
Table 1. Characterization of Polymers Used in This Study
PolymerMolecular
Weight (Mw)PEO Content
wt %Polydispersity
(Mw/Mn)
PS 16.7K 16,700 0 1.02PS 750K 750,000 0 1.01PS-PEO 80K 80,000 5.0 1.07PS-PEO 147K 147,000 1.3 1.09PS-PEO 182.7K 182,700 4.2 1.07PS-PEO 322K 322,000 2.4 1.19PS-PEO 496.7K 496,700 1.2 1.18
1584 KOUTSIOUBAS ET AL.
Journal of Polymer Science: Part B: Polymer PhysicsDOI 10.1002/polb
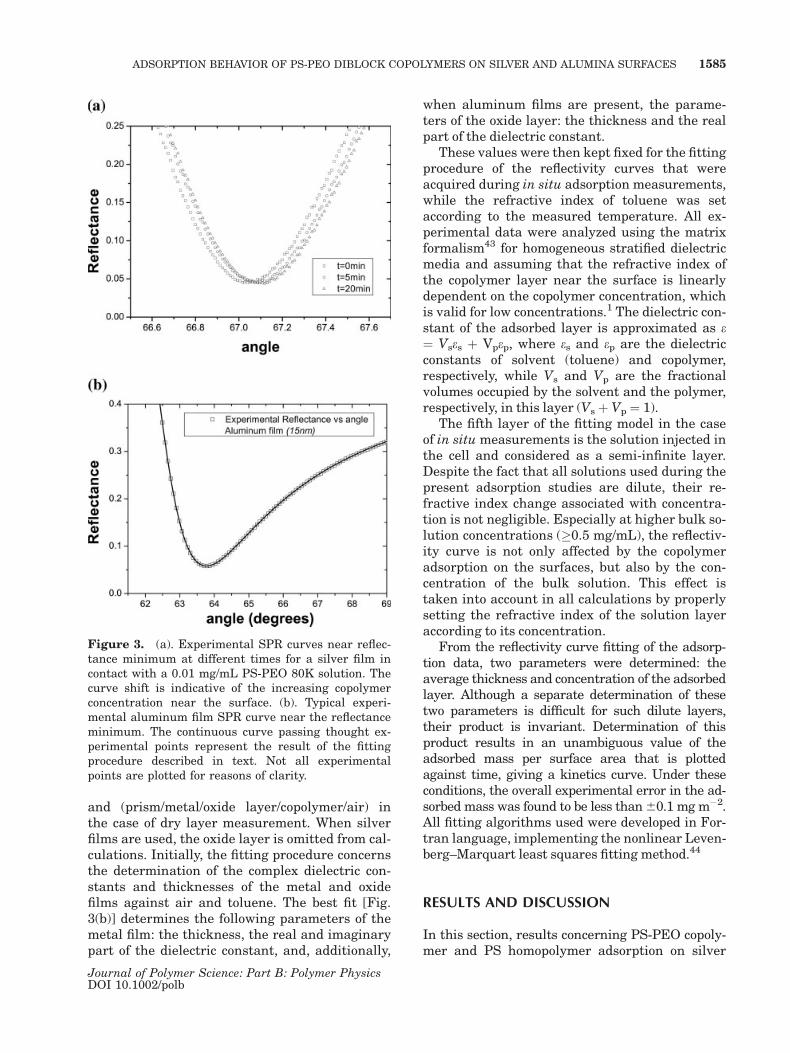
and (prism/metal/oxide layer/copolymer/air) inthe case of dry layer measurement. When silverfilms are used, the oxide layer is omitted from cal-culations. Initially, the fitting procedure concernsthe determination of the complex dielectric con-stants and thicknesses of the metal and oxidefilms against air and toluene. The best fit [Fig.3(b)] determines the following parameters of themetal film: the thickness, the real and imaginarypart of the dielectric constant, and, additionally,
when aluminum films are present, the parame-ters of the oxide layer: the thickness and the realpart of the dielectric constant.
These values were then kept fixed for the fittingprocedure of the reflectivity curves that wereacquired during in situ adsorption measurements,while the refractive index of toluene was setaccording to the measured temperature. All ex-perimental data were analyzed using the matrixformalism43 for homogeneous stratified dielectricmedia and assuming that the refractive index ofthe copolymer layer near the surface is linearlydependent on the copolymer concentration, whichis valid for low concentrations.1 The dielectric con-stant of the adsorbed layer is approximated as e¼ Vses þ Vpep, where es and ep are the dielectricconstants of solvent (toluene) and copolymer,respectively, while Vs and Vp are the fractionalvolumes occupied by the solvent and the polymer,respectively, in this layer (Vs þ Vp ¼ 1).
The fifth layer of the fitting model in the caseof in situ measurements is the solution injected inthe cell and considered as a semi-infinite layer.Despite the fact that all solutions used during thepresent adsorption studies are dilute, their re-fractive index change associated with concentra-tion is not negligible. Especially at higher bulk so-lution concentrations (�0.5 mg/mL), the reflectiv-ity curve is not only affected by the copolymeradsorption on the surfaces, but also by the con-centration of the bulk solution. This effect istaken into account in all calculations by properlysetting the refractive index of the solution layeraccording to its concentration.
From the reflectivity curve fitting of the adsorp-tion data, two parameters were determined: theaverage thickness and concentration of the adsorbedlayer. Although a separate determination of thesetwo parameters is difficult for such dilute layers,their product is invariant. Determination of thisproduct results in an unambiguous value of theadsorbed mass per surface area that is plottedagainst time, giving a kinetics curve. Under theseconditions, the overall experimental error in the ad-sorbed mass was found to be less than60.1 mgm�2.All fitting algorithms used were developed in For-tran language, implementing the nonlinear Leven-berg–Marquart least squares fitting method.44
RESULTS AND DISCUSSION
In this section, results concerning PS-PEO copoly-mer and PS homopolymer adsorption on silver
Figure 3. (a). Experimental SPR curves near reflec-tance minimum at different times for a silver film incontact with a 0.01 mg/mL PS-PEO 80K solution. Thecurve shift is indicative of the increasing copolymerconcentration near the surface. (b). Typical experi-mental aluminum film SPR curve near the reflectanceminimum. The continuous curve passing thought ex-perimental points represent the result of the fittingprocedure described in text. Not all experimentalpoints are plotted for reasons of clarity.
ADSORPTION BEHAVIOR OF PS-PEO DIBLOCK COPOLYMERS ON SILVER AND ALUMINA SURFACES 1585
Journal of Polymer Science: Part B: Polymer PhysicsDOI 10.1002/polb

and alumina surfaces are discussed. Figure 3(a)shows typical experimental silver film reflectivitycurves near the reflectance minimum at differenttime intervals, after the injection of 0.1 mg/mLPS-PEO 80K solution into the PTFE cell, reveal-ing some of the qualitative features of the adsorp-tion runs.
Initially, we considered the adsorption behav-ior of PS-PEO diblock copolymers on silver sur-faces. In Figure 4, representative adsorptionkinetics curves for the adsorption on silver of PS16.7K, PS 750K, and three PS-PEO copolymers ata bulk solution concentration of 0.1 mg/mL arepresented. The observed copolymer adsorptionrates do not seem to have any specific trendrelated to the molecular weight of the chains andwere found to be quite low even at high bulk solu-tion concentrations (80% of the final coverage isachieved after 2 h, and a final plateau is observedafter ca. 8 h).
The copolymer kinetics on silver are not char-acterized by two distinct kinetic steps25 whileadsorption rate factors are about three orders ofmagnitude lower than those that have been mea-sured for copolymer adsorption on silicon oxidesurfaces. In the very early stages of the applica-tion of the SPR technique in adsorption studies,Loulergue et al.45 have measured the adsorptionof PS from toluene solutions on silver gratings. In
agreement with the present findings, their resultsare characterized by relatively slow adsorptionrates even for quite high solution concentrationsas 10 mg/mL.
Furthermore, the measured final adsorbedamounts are lower than those that have beenfound on other surfaces like quartz and mica. Ascan be seen in Figure 4, the presence of a PEOblock on the polymer chain does not significantlyaffect the adsorption phenomenon, since PS andPS-PEO solutions of the same concentration pro-duce a comparable coverage, except for the lowmolecular weight PS 16.7K homopolymer. So wemay conclude that in the case of a silver surfacethe adsorption energy parameters vs relative tothe solvent toluene for the two blocks (PS andPEO) do not differ significantly. The general trendin the experimental data illustrates that longerchains tend to produce higher coverages on thesilver surface, which is typical of homopolymeradsorption from good solvents12 where chains areadsorbed by many chain segments.
On the contrary, all other PS-PEO adsorptionruns conducted on alumina surfaces (Figs. 5 and6), even at low bulk concentrations, (0.01 mg/mL)produced a surface coverage greater than 2.2 mg m�2,while all PS 16.7K and PS 750K adsorption runsresulted at best in a surface coverage of 0.5 mg m�2.In addition, the presence of a PEO block in thepolymer chain fully enhances the measured ad-sorption rate on alumina surfaces.
Figure 4. Adsorbed amounts on silver of PS-PEO80K, PS-PEO 182.7K, PS-PEO 322K copolymers andPS 16.7K, PS 750K hopolymers as a function ofadsorption time, as revealed from SPR measurements.The solution concentration is 0.01 mg/mL. All adsorp-tion curves reach a plateau about 8 h after the initia-tion of the experiment. The final adsorbed amountsmeasured after 24 h are PS 750K (2.0 mg/m2), PS-PEO 322K (2.0 mg/m2), PS-PEO 182.7K (1.8 mg/m2),PS-PEO 80K (1.1 mg/m2), and PS 16.7K (0.8 mg/m2).
Figure 5. Adsorbed amounts on alumina of four dif-ferent PS-PEO copolymers and two PS homopolymersas a function of time for 0.1 mg/mL bulk solution con-centration. Each curve refers to the kinetics of a dif-ferent copolymer or homopolymer that is noted on theright.
1586 KOUTSIOUBAS ET AL.
Journal of Polymer Science: Part B: Polymer PhysicsDOI 10.1002/polb

These findings indicate the critical role of thePEO block in the adsorption process and lead tothe conclusion that the PS-PEO copolymer isanchored to the alumina surface mainly via thePEO block. This same behavior is well establishedin other studies22,25 for the toluene/silicon oxideinterface, where it is shown that the adsorbed co-polymer forms an extended brush. In the follow-ing sections, the adsorption kinetics and equilib-rium properties of PS-PEO copolymers on alu-mina are discussed in detail.
Adsorption Kinetics
Adsorption kinetics data on alumina using theSPR technique were collected at room tempera-ture (24–26 8C) for five PS-PEO diblock copoly-mers and two PS homolymers (Table 1), for twodifferent bulk solution concentrations and aresummarized in Figures 5 and 6, where theadsorbed amount per unit area is plotted againsttime.
It is evident that the amount of the adsorbedcopolymer increases monotonically with time,while more than 80% of the final adsorption cov-erage is achieved within 10 min in the case of0.1 mg/mL concentration, and within 45 min inthe case of 0.01 mg/mL concentration. The adsorp-tion of the two homopolymers proceeds with anobviously slower rate. No overshoot phenomena26
have been observed. The slow adsorption up to1 min can be attributed to the initial loading of theconcentrated solution to the solvent. After that theadsorption proceeds at a faster rate.
A preliminary analysis showed that it is impos-sible to fit the entire adsorption kinetics curve toa simple model. This fact is not surprising sincecopolymer adsorption is a complicated processand is expected to have more than one stages. Inthe initial stage of the phenomenon, the aluminasurface is totally uncovered and available for ac-commodating the incoming molecules. Theoreti-cally under these conditions and until a certaincoverage is reached, the adsorption is governedby a Fickian law (diffusion-controlled regime),which states that the adsorbed amount has a lin-ear relation with the square root of the time.25,27–29
This can be shown by solving the diffusion equa-tion,
@cðz; tÞ@t
¼ D@2cðz; tÞ
@z2ð2Þ
where t is time, c is the concentration, z denotesthe direction normal to the surface, and D the dif-fusion coeffhcient of the copolymer in solution.Assuming that the alumina surface acts as a per-fect sink (i.e., every molecule that reaches thesurface is immediately attached) and that the so-lution has a homogeneous concentration, we mayimpose the following boundary conditions:
cðz ¼ 0; tÞ ¼ 0 and cðz; t ¼ 0Þ ¼ c0 ð3Þ
Where c0 is the solution concentration. Then theadsorbed amount may be derived by the relation
�ðtÞ ¼Z t
0
jðz ¼ 0; sÞds ð4Þ
where j is the flux to the surface that is deter-mined by the derivative of the concentration pro-file. Combination of the above equations leads tothe expression
�ðtÞ ¼ 2ffiffiffip
p c0ffiffiffiffiffiffiDt
pð5Þ
In Figure 7, the adsorbed amount as a function ofthe square root of time is plotted for a short timeinterval from the beginning of adsorption, for allfive copolymers from a bulk solution concentra-tion of 0.01 mg/mL. In this time interval, the ini-tial linear relation is clearly observed.
In the current regime, it is possible to deter-mine the diffusion coefficient D of the PS-PEO co-polymer in toluene from the slope of the graph ofthe adsorbed amount versus the square root of
Figure 6. Adsorbed amounts on alumina of five dif-ferent PS-PEO copolymers as a function of time for0.01 mg/mL bulk solution concentration. Each curverefers to the kinetics of a different copolymer that isnoted on the right.
ADSORPTION BEHAVIOR OF PS-PEO DIBLOCK COPOLYMERS ON SILVER AND ALUMINA SURFACES 1587
Journal of Polymer Science: Part B: Polymer PhysicsDOI 10.1002/polb

time in eq. 5. For all measured solution concen-trations, the diffusion coefficient obtained fromsuch calculations is of the order 10�7 cm2 s�1 ashas been reported for the case of PS-PEO adsorp-tion on the SiO2/toluene interface.25 Values of thediffusion coefficient for copolymers of similarmolecular weight that have been measured byphoton correlation spectroscopy are of the sameorder.
Dynamic scaling theory46 predicts that the dif-fusion coefficient of a polymer chain in a goodsolvent scales according to the law D � Mw
�mD,where mD ¼ 0.588. Dynamic light experimentsgive mD ¼ 0.55 6 0.02. The calculated values ofthe diffusion coefficients from the present experi-mental data are summarized in Table 2 and inFigure 8, where a plot of D versus Mw is pre-
sented.47 From the slope of the line in Figure 8,we find a scaling exponent mD ¼ 0.626 0.08 whichfalls within previously reported theoretical andexperimental results.
Beyond the diffusion-controlled regime, whena certain coverage ~� is reached and the aver-age distance between adsorbed chains becomessmaller, the preformed layer acts as a barrier forfurther molecules to reach the surface (brush-lim-ited regime). This is the reason for the observeddeviation from the initial Fickian behavior andfor the significant decrease of the adsorption rate.Further adsorption involves chain deformationand rearrangement, which results essentiallyfrom a balance between the energy gain due toadsorption and the energy cost associated withchain stretching. Local rearrangement of alreadyadsorbed chains to accommodate more incomingchains is clearly a slow process.
The increase of the adsorbed amount in this re-gime is expected to follow an exponential time de-pendence25,27 that describes the slowing down ofthe adsorption process. The relation of theadsorbed amount versus time may be written as
�ðtÞ ¼ �maxð1� e�ktÞ þ ~� ð6Þ
where Gmax is the final adsorbed amount and kthe rate constant of this regime. Figure 9 showsthe long time adsorption behavior of the lowerand higher molecular weight copolymers for aconcentration of 0.01 mg/mL, where the linearbehavior after the initial fast process is indicativeof the validity of eq. 6. The calculated values ofthe rate constants k for each copolymer rangefrom 0.10 to 0.27 h�1 and are summarized inTable 2. In general, we observe that the rate con-stant k decreases with increasing molecularweight of the PS block. This trend is explained by
Figure 7. Adsorbed amounts on alumina of five dif-ferent PS-PEO copolymers as a function of the squareroot of adsorption time for 0.01 mg/mL bulk solutionconcentration. The dashed lines indicate the fickianbehavior at small times. Each curve refers to thekinetics of a different copolymer that is noted on theright.
Table 2. Experimentally Determined Rate Factors and Equilibrium Characteristics of the AdsorbedPolymeric Layers on Alumina
PS-PEOcopolymer Mw
D(10�7 cm2/s)
k(hour�1)
Gin
(mg/m2)Gex
(mg/m2)RF
(nm) s (nm) Rg (nm) r* RF/s
80K 7.8 0.27 4.0 3.6 23.6 5.8 9.67 8.9 4.1147K 6.2 0.18 3.5 3.5 33.7 8.3 13.89 8.7 4.0182.7K 5.7 0.18 3.2 2.8 38.3 9.7 15.81 8.3 3.9322K 3.2 0.11 2.9 2.8 53.4 13.6 22.15 8.3 3.9496.7K 2.7 0.10 2.7 2.5 68.8 17.5 28.66 8.4 3.9
Diffusion coefficient D, brush-limited regime rate constant k, in situ final adsorbed amount Gin, ex situ final adsorbed amountGex, Flory radius RF, spacing between the anchoring blocks s, radius of gyration Rg, reduced coverage r*, as calculated from SPRexperiments on alumina at a 0.01 mg/mL bulk solution concentration.
1588 KOUTSIOUBAS ET AL.
Journal of Polymer Science: Part B: Polymer PhysicsDOI 10.1002/polb

the fact that it is more difficult for longer chainsto penetrate into the preformed polymeric layer,leading to an overall decrease in the adsorptionrate.
These results support the picture that diblockcopolymer adsorption from nonmicellar solutionsis essentially a two-stage process on a clearly sep-arated timescale. The initial diffusion-controlledregime lasts only for a relatively short period oftime, giving its place to a much slower exponen-tial process (brush-limited regime) until a plateauvalue for the adsorbed amount is reached, manyhours later. In any case, within experimentalerror, no significant change was observed in theadsorption amount after 24 h. Test experimentsat even higher time scales (3–4 days) supportedthe same conclusion.
Equilibrium Properties
All adsorbed amounts Gin that are presented inTable 2, were measured in situ 24 h after the ini-tiation of the adsorption procedure. After eachmeasurement, the alumina surface was rinsedwith toluene and the collapsed copolymer layerwas measured against air (dry layer measure-ment). These ex situ measurements gave copoly-mer adsorption masses Gex that were consistentwith the previous in situ measurements and theirdifference was found to be less than 15%. Thismeans that no appreciable desorption occurs afterthe solvent rinse of the surface, which is indica-
tive of the relatively strong attachment of the co-polymer on the alumina surface.
The term ‘‘brush’’ is usually used in the litera-ture when the mean distance between the anchor-ing blocks is significantly lower than the Flory ra-dius of the polymer in solution. The Flory radiusRF of PS may be evaluated from48 RF ¼ 0.032Mw
0.585 nm. The spacing between the PEO anchor-ing blocks is given by the expression22
s ¼ NA�
Mw
8>: 9>;�12
ð7Þ
where NA is Avogadro’s Number. We thus findthat the spacing s for the studied copolymersranges from about 5.8 to 17.5 nm (Table 2) whilethe ratio RF/s ranges from 3.9 to 4.1. So for allstudied copolymers, the Flory radius is about fourtimes higher than the interanchor spacing, a ratiotypical of a brush-like conformation for end-adsorbed chains, which is characterized by chainoverlap and stretching.
Furthermore, by evaluating the radius of gyra-tion of PS chains using Rg ¼ 0.0117 Mw
0.595 nm,49
we have calculated the ‘‘reduced coverage’’ r*¼ pRg
2/s2, which is a ratio of the cross-sectionalarea of a free chain in solution to the average areaper grafted chain. As seen in Table 2, the reduced
Figure 8. Plot of the diffusion coeficient versus co-polymer molecular weight. The exponential factor ofthe power law is determined by a linear fit to thedata.47
Figure 9. Long-time behavior of the adsorption forthe 80K and 496.7K PS-PEO copolymers. The solutionconcentration is 0.01 mg/mL. Gmax is the adsorbedamount at saturation (infinite time). In the initialstage, the diffusion-controlled regime is seen. At lon-ger times, the linear behavior is indicative of theincrease of the adsorbed amount according to an expo-nential law (eq. 6).
ADSORPTION BEHAVIOR OF PS-PEO DIBLOCK COPOLYMERS ON SILVER AND ALUMINA SURFACES 1589
Journal of Polymer Science: Part B: Polymer PhysicsDOI 10.1002/polb

coverage was found to reach values greater than8, well beyond the onset of chain stretching.49
The final adsorbed amount presents a decreaseas the molecular weight of the copolymer increasesfor both solution concentrations. A plot of the meas-ured adsorption against copolymer molecularweight (Fig. 10) reveals a power law G � Mw
�m,where m ¼ 0.21 6 0.02. In an ellipsometric study ofPS-PEO adsorption from toluene solutions on aSiO2 surface, where brush formation kinetics arediscussed, Motschmann et al.25 have found anexponent m ¼ 0.18, which is very close to the pres-ent result. This result is in agreement with a sim-ple scaling picture where the anchoring energy perchain is roughly equal for all diblock copolymers inour study. One would then expect that the numberof ‘‘blobs,’’ nb, per chain would also be the same forall diblocks (this is because at equilibrium theanchoring energy per chain must be balanced bythe osmotic repulsion per chain, which is of orderkT per blob). This in turn implies that the brushheight (given by the product of nb with the blobsize) is proportional to the blob size or the interan-chor spacing, s. Since the brush height also scaleswith Ns�2/3 while the adsorbance, G, is propor-tional toNs�2, it follows that G scales withN�1/5.
CONCLUSIONS
In conclusion, our results demonstrate that SPRSpectroscopy is a promising technique for in situmonitoring of macromolecular adsorption on a
solid metal or oxide surface. Under the adoptedexperimental conditions and data analysis scheme,the method is characterized by high accuracy,high-time resolution, and long-term stability. Itis important to note that the SPR techniquepresents certain advantages over some other sur-face measurement techniques. In particular, (a)there is no need of chemical modification of thepolymer structure to enhance measurement effi-ciency, (b) the technique is nondestructive, (c)measurements are performed easily in situ and exsitu on the same sample, (d) constant angle meas-urements fully enhance the overall time resolu-tion, permitting the study of fast processes.
The presented results concern PS-PEO diblockcopolymer adsorption on silver and alumina in thepresence of a selective solvent (toluene). On thebasis of the differences observed between PS andPS-PEO adsorption measurements, we concludethat the adsorbed PS-PEO copolymer is attachedon silver not only by the PEO blocks but also byvarious PS chain segments while on alumina it isend-grafted via the PEO block leading to adsorbedamounts typical of a polymer brush formation.
The kinetic study on silver surfaces revealedthat PS-PEO and PS adsorption proceeds with acomparable rate which is substantially lowerthan the observed rates of PS-PEO adsorption onalumina. When the copolymer is end-grafted byone block (as in the case of PS-PEO on alumina),the kinetics are characterized by two distinct timeregimes governed by a Fickian and an exponen-tial law respectively, in accordance with previousexperimental observations. The overall observedadsorption rates on alumina are similar to ad-sorption rates of similar copolymers on other sur-faces like quartz or glass. Very good agreementwith theory and other experimental observationswas found for the scaling behavior of the diffusioncoefficient and the final adsorbed amount versusmolecular weight.
For the first time, there is experimental evi-dence of PS-PEO self assembly on alumina sur-faces related to polymeric brush formation. Furtherinvestigations using the SPR technique involvingmore complex systems will provide informationabout their adsorption mechanisms while theymay serve as model applications for the use of theSPR technique as an analytical tool in a widerange of surface studies.
We would like to thank one of the reviewers for hissupportive and helpful comments on the interpreta-tion of our final adsorbed amount data.
Figure 10. Plot of the final adsorbed amount versuscopolymer molecular weight. The exponent of thepower law is determined by a linear fit to the data.
1590 KOUTSIOUBAS ET AL.
Journal of Polymer Science: Part B: Polymer PhysicsDOI 10.1002/polb

REFERENCES AND NOTES
1. Peterlinz, K. A; Georgiadis, R. Langmuir 1995,12, 4731–4740.
2. Green, R. J.; Tasker, S.; Davies, J.; Davies, M. C.;Roberts, C. J.; Tendler, S. J. B. Langmuir 1997,13, 6510–6515.
3. Tassin, J. F.; Siemens, R. L.; Tang, W. T.; Had-ziioannou, G.; Swalen, J. D.; Smith, B. J PhysChem 1989, 93, 2106–2111.
4. Yu-Wen, H., Gupta, V. K. Macromolecules 2001,34, 3757–3764.
5. Knoll, W. MRS Bull 1991, 16(7), 29–38.6. Advicula, R.; Aust, E.; Meyer, W.; Knoll, W. Lang-
muir 1996, 12, 3536–3540.7. Green, R. J.; Frazier, R. A.; Shakesheff, K. M.;
Davies, M. C.; Roberts, C. J.; Tendler, S. J. B. Bio-materials 2000, 21, 1823–1835.
8. Rich, R. L.; Myszka, D. Z. J Mol Recognit 2003,16, 351–382.
9. Brandani, P.; Stroeve, P. Macromolecules 2003,36, 9492–9501.
10. Brandani, P.; Stroeve, P. Macromolecules 2003,36, 9502–9509.
11. Napper, D. H. In Polymeric Stabilization of Colloi-dal Dispersions. Academic: London, 1983.
12. Fleer, G. J.; Cohen Stuart, M. A.; Scheutjens,J. M. H. M.; Cosgrove, T.; Vincent, B. In Polymersat Interfaces. Chapman & Hall: Bristol, 1993.
13. Taunton, H. J.; Toprakcioglu, C.; Fetters, L. J.;Klein, J. Nature 1988, 332, 712–714.
14. Alexander, S. J Phys 1977, 38, 983–987.15. de Gennes, P. G. Macromolecules 1980, 13, 1069–
1075.16. Halperin, A.; Tirrell, M.; Lodge, T. P. Adv Polym
Sci 1991, 100, 31–71.17. Taunton, H. J.; Toprakcioglu, C.; Fetters, L. J.;
Klein, J. Macromolecules 1990, 23, 571–580.18. Hadziioannou, G.; Patel, S.; Granick, S.; Tirrell,
M. J Am Chem Soc 1986, 108, 2869–2876.19. Balastre, M.; Li, F.; Schorr, P.; Yang, J.; Mays,
J. W.; Tirrell, M. V. Macromolecules 2002, 35,9480–9486.
20. Belder, G. F.; Ten Brinke, G.; Hadjiioannou, G.Langmuir 1997, 13, 4102–4105.
21. Cosgrove, T.; Phipps, J. S.; Richardson, R. M.;Hair, M. L.; Guzonas D. A. Macromolecules 1993,26, 4363–4367.
22. Field, J. B.; Toprakcioglu, C.; Ball, R. C.; Stanley,H. B.; Dai, L.; Barford, W.; Penfold, J.; Smith, G.;Hamilton, W. Macromolecules 1992, 25, 434–439.
23. Satija, S. K.; Majkrzak, C. F.; Russell, T. P.;Sinha, S. K.; Sirota, E. B.; Hughes, G. J. Macro-molecules 1990, 23, 3860–3864.
24. Field, J. B.; Toprakcioglu, C.; Dai, L.; Hadziioan-nou, G.; Smith, G.; Hamilton, W. J Phys II 1992,2, 2221–2235.
25. Motschmann, H.; Stamm, M.; Toprakcioglu, C.Macromolecules 1991, 24, 3681–3688.
26. Dorgan, J. R.; Stamm, M.; Toprakcioglu, C.; Jer-ome, R.; Fetters, L. J. Macromolecules 1993, 26,5321–5330.
27. Amiel, C.; Sikka, M.; Schneider, J. W.; Yi-Hua T.;Tirrell, M.; Mays, J. W. Macromolecules 1995, 28,3125–3134.
28. Siqueira, D. F.; Stamm, M.; Breiner, U.; Stadler,R. Polymer 1995, 36, 3229–3233.
29. Abraham, T. Polymer 2002, 43, 849–855.30. Dorgan, J. R.; Stamm, M.; Toprakcioglu, C. Poly-
mer 1994, 34, 1554–1557.31. Toomey R.; Mays J.; Tirrell M. Macromolecules
2004, 37, 905–911.32. Toomey R.; Mays J.; Wade Holley D.; Tirrell M.
Macromolecules 2005, 38, 5137–5143.33. Mi-Kyoung P; Ji Ho Y; Pispas, S.; Hadjichristidis,
N.; Advincula, R. Langmuir 2002, 18, 8040–8044.34. Gragson, D. E.; Manes, J. P.; Smythe, J. E.;
Baker, S. M. Langmuir 2003, 19, 5031–5035.35. Bijsterbosch, H. D.; Cohen Stuart, M. A.; Fleer,
G. J. Macromolecules 1998, 31, 9281–9294.36. Leermakers, F. A. M.; Gast, A. P. Macromolecules
1991, 24, 718–730.37. Pelletier, E.; Stamouli, A.; Belder, G. G.; Had-
ziioannou, G. Langmuir 1997, 13, 1884–1886.38. Ritchie, R. H. Phys Rev 1957, 106, 874–881.39. Abeles, F. Surf Sci 1976, 56, 237–251.40. Kretschmann, H.; Raether, H. Z Naturforsch
1968, 23a, 2135–2136.41. Raether, H. Surface Plasmons on Smooth and
Rough Surfaces and Gratings; Springer-Verlag:Hamburg, 1986.
42. El-Kashef, H. Rev Sci Instrum 1998, 69, 1243–1245.43. Born, M.; Wolf, M. Principles of Optics; Pergamon
Press: London, 1959.44. Press, W. H.; Teukolsky, S. A.; Vetterling, W. T.;
Flannery, B. P. In Numerical Recipes in Fortran:the art of scientific computing; Cambridge Uni-versity Press: Cambridge, 1992.
45. Loulerge, J. C.; Levy, Y.; Allain, C. Macromole-cules 1985, 18, 306–307.
46. de Gennes, P. G. Scaling Concepts in PolymerPhysics; Cornell University Press: Paris, 1979.
47. The D values presented in Figure 8 were ex-tracted from the 0.01 mg/ml data. This is becausediffusion is slower at this lower concentration,and measurement of the initial stages of adsorp-tion yields more reliable diffusion coefficientsthan in the high concentration case (0.1 mg/mL)where the experimental uncertainties at verysmall times are greater.
48. Roovers, J. E.; Toporowski, P. M. J Polym Sci PolPhys 1980, 18, 1907–1917.
49. Kent, M. S.; Lee, L. T.; Farnoux, B.; Rondelez, F.Macromolecules 1992, 25, 6240–6247.
ADSORPTION BEHAVIOR OF PS-PEO DIBLOCK COPOLYMERS ON SILVER AND ALUMINA SURFACES 1591
Journal of Polymer Science: Part B: Polymer PhysicsDOI 10.1002/polb