Interactions of Ionic Surfactants With PEO-PBO-PEO Triblock Copolymers in Aqueous Solutions
10
LDIS #561157, VOL 33, ISS 2 Interactions of Ionic Surfactants With PEO-PBO-PEO Triblock Copolymers in Aqueous Solutions Zaheer Ahmad, Abbas Khan, Zahoor H. Farooqi, and Mohammad Siddiq QUERY SHEET This page lists questions we have about your paper. The numbers displayed at left can be found in the text of the paper for reference. In addition, please review your paper as a whole for correctness. Q1: Au: Shortened, running title ok as provided? Q2: Au: Provide location for Sigma Aldrich. Q3: Au: Location correct as provided for White Electrical? Q4: Au: Location correct as provided for IRMECO? Q5: Au: Provide location for Perkin Elmer. Q6: Au: Give initial for Andrade in ref 5. TABLE OF CONTENTS LISTING The table of contents for the journal will list your paper exactly as it appears below: Interactions of Ionic Surfactants With PEO-PBO-PEO Triblock Copolymers in Aqueous Solutions Zaheer Ahmad, Abbas Khan, Zahoor H. Farooqi, and Mohammad Siddiq
-
Upload
independent -
Category
Documents
-
view
0 -
download
0
Transcript of Interactions of Ionic Surfactants With PEO-PBO-PEO Triblock Copolymers in Aqueous Solutions

LDIS #561157, VOL 33, ISS 2
Interactions of Ionic Surfactants With PEO-PBO-PEOTriblock Copolymers in Aqueous Solutions
Zaheer Ahmad, Abbas Khan, Zahoor H. Farooqi, and Mohammad Siddiq
QUERY SHEET
This page lists questions we have about your paper. The numbers displayed at left can be found in the text of the paper for reference. Inaddition, please review your paper as a whole for correctness.
Q1: Au: Shortened, running title ok as provided?Q2: Au: Provide location for Sigma Aldrich.Q3: Au: Location correct as provided for White Electrical?Q4: Au: Location correct as provided for IRMECO?Q5: Au: Provide location for Perkin Elmer.Q6: Au: Give initial for Andrade in ref 5.
TABLE OF CONTENTS LISTING
The table of contents for the journal will list your paper exactly as it appears below:
Interactions of Ionic Surfactants With PEO-PBO-PEO Triblock Copolymers in Aqueous Solutions
Zaheer Ahmad, Abbas Khan, Zahoor H. Farooqi, and Mohammad Siddiq

Interactions of Ionic Surfactants With PEO-PBO-PEOTriblock Copolymers in Aqueous Solutions
Zaheer Ahmad,1 Abbas Khan,1,2 Zahoor H. Farooqi,1 andMohammad Siddiq11Department of Chemistry, Quaid-I-Azam University Islamabad, Islamabad, Pakistan
52National Center of Excellence in Physical Chemistry, University of Peshawar, Peshawar, Pakistan
The interactions of triblock copolymers (TBP) with ionic surfactants were studied employingsurface tensiometry, electrical conductivity, steady-state fluorescence (SSF), and dynamic lightscattering (DLS) techniques. An increasing trend in the critical micelle concentration (CMC)of SDS/CTAB in the presence of triblock copolymers was observed especially at higher polymer
10 to surfactant ratio. The delay in the CMC of surfactants was more pronounced in the presence ofE48B10E48 possibly due to its less hydrophobic nature. The negative values of free energy of micel-lization (DGm) both in case of SDS and CTAB confirmed the spontaneity of the processes. Theaggregation number (Nagg) and hydrodynamic radius (Rh) of polymer/surfactant mixed systemswere determined by SSF and DLS. The suppression of the surfactant micelle size in the presence
15 of TBP was confirmed by SSF and DLS studies.
Keywords Block copolymer, critical micelle concentration, CTAB, DLS, Nagg, pyrene, Rh,SDS
INTRODUCTION
20 Block copolymers association in the presence of selectivesolvent is the subject of intense investigation in the recentdecades. The block copolymers were introduced as com-mercial product by the Dow Chemical Company in 1993with first description of this copolymer in the commercial[1]
25 and scientific[2] literature in 1994. The micellization ofblock copolymers covering a wide range of molecularweights (2900–14600) was studied by Alexandridis et al.[3]
Szymanowski and coworkers[4] described the preparationand the technological properties of diblock and triblock
30 E=B copolymers. Lee et al.[5] compared the surface activityof EmBnEm and EmPnEm block copolymers. Zana et al.[6]
studied the interaction between ethyl (hydroxyethyl) cellu-lose (EHEC) and two cationic surfactants hexadecyl
trimethylammonium chloride and bromide (CTAC and35CTAB) in aqueous solution as a function of temperature,
by means of electric conductivity and chloride ionself-diffusion measurement for CTAC and by time-resolvedfluorescence quenching for CTAC and CTAB. The resultsshowed a decrease in CMC in the presence of EHEC,
40increase in degree of micelle ionization and lowering ofthe micelle aggregation number upon elevation of tempera-ture.[6] Hecht and Hoffmann[7] studied the interaction ofABA block copolymers with ionic surfactants in aqueoussolution. They investigated the influence of SDS on the
45aggregation behavior of F127 by static and dynamic lightscattering, electric birefringence, and calorimetric methods.The results showed that SDS binds to monomers of F127and thereby suppresses completely the formation of F127micelles.[7]
50It has been reported in literature that the solubilizationpower and the viscosity of an aqueous solution of polymerbound micelles is higher than that of solutions of eitherpure polymer or pure surfactants.[8] Such properties arevery suitable for the formulation of paints, coating, cos-
55metics products and many other applications. Similarly,the polyelectrolytic nature of the polymer-ionic surfactantcomplexes make the multi component system more betterto control the aggregation behavior as compared to indi-vidual pure polymer or surfactant system and find use in
60a wide range of applications such as templates of thedevelopment of nanoscale materials, drug delivery, phar-maceutical, petroleum and detergent formulation.[9] The
Received 20 December 2010; accepted 18 January 2011.The authors are highly grateful to Dr. Peter M. Budd and Dr.
Carin Tattershall, University of Manchester, UK, for synthesis ofthe copolymers. Thanks is also extended to Prof. Dr. GuangzhaoZhang USTC for his kind cooperation and helpful discussion. A.Khan is grateful to the Higher Education Commission, H.E.C,Pakistan for its financial support under indigenous Ph.D. fellow-ship scheme and IPFP-program. He also wishes to acknowledgethe Third World Academy of Sciences for a split Ph.D. researchfellowship to work in the Department of Chemical Physics,University of Science and Technology, Hefei, China.
Address correspondence to Abbas Khan, National Center ofExcellence in Physical Chemistry, University of Peshawar,Peshawar 25120, Pakistan. E-mail: [email protected]
Journal of Dispersion Science and Technology, 33:1–9, 2012
Copyright # Taylor & Francis Group, LLC
ISSN: 0193-2691 print=1532-2351 online
DOI: 10.1080/01932691.2011.561157
3b2 Version Number : 7.51c/W (Jun 11 2001)File path : P:/Santype/Journals/TandF_Production/Ldis/v33n2/LDIS561157/ldis561157.3dDate and Time : 02/01/12 and 21:55
1
polymer-surfactant mixed system is also used in tertiary oilrecovery and in the separation of minerals.
65 Mostly diblock and triblock copolymers micellizationwere reported in aqueous solution. In the present studywe have investigated the effect of ionic surfactants, SDSand CTAB on the micellization=association behavior oftriblock copolymers, E30B10E30 and E48B10E48. Here, we
70 use E for an oxyethylene unit, OCH2CH2, and B for anoxybutylene unit, OCH2CH (C2H5).
In this work, we report on the association=aggregationproperties of aqueous solution containing both the ionicsurfactants and triblock copolymers. The surface and the
75 bulk properties of the mixed systems have been investi-gated using surface tensiometry. The polyelectrolytic nat-ure was also studied by conductivity measurements.Moreover, the micelle aggregation numbers and the hydro-dynamic radius were also investigated by steady-state fluor-
80 escence (SSF) and dynamic laser light scattering (DLS)techniques. The aim of the present study is to investigatethe effect of triblock copolymers on the micellar propertiesof SDS=CTAB. Similarly the effect of varying the copoly-mer to surfactant ratio on the behaviour and nature of
85 polymer-surfactant mixed micelles=aggregates.
EXPERIMENTAL
Materials
The triblock copolymers E30B10E30 and E48B10E48 wereprepared in the University of Manchester, UK, by sequen-
90 tial anionic polymerization in tetrahydrofuran of ethyleneoxide, followed by 1,2-butylene oxide, using as initiator2-dimethylaminoethanol, which was partially convertedto its potassium alkoxide salt. The average compositionwas determined from nuclear magnetic resonance (NMR)
95 and gel permeation chromatography (GPC) was used forthe molar mass distribution of the copolymer.[10] Sodiumdodecyl sulphate (SDS) and cetyl trimethyl ammoniumbromide (CTAB) with 99% were purchased from SigmaAldrichQ2 and were used without further purification. Stock
100 solutions of polymer as well as of surfactants and theirdilutions were prepared in deionized and doubled distilledwater. All measurements were performed at 303K.
Methods
Surface Tension
105 Surface tension of aqueous solution was measured withthe help of Torsion Balance (White Electrical InstrumentCo., Ltd., Malvern, UK)Q3 equipped with a platinum ring(4 cm circumference) along with temperature controlledwater circulating bath (IRMECO I-2400 GmbH,
110 Schleswig-Holstein, Germany).Q4 The device was well pro-tected from vibrations. The measurement were correctedwith respect to the surface tension of pure water
(c¼ 72.0� 10�3Nm�1). Each measurement was repeatedat least three times.
115Conductivity
The conductance data were recorded by a digital con-ductivity meter Jenway-4310. This instrument has autoranging from 1.0� 10�06 S �m�1 to 1.999� 10�05 S �m�1
and temperature control accuracy of 273.5� 0.01K. The120measurement cell was immersed in a water circulating bath
(IRMECO I-2400 GmbH Germany) in order to hold aconstant temperature. Conductivity of each solution wasmeasured at 303K and each experiment was carried outthree to four times. Prior to measurement calibration was
125made with KCl aqueous solution by using the normalconcentration data keeping the cell constant 1.04.
Steady-State Fluorescence Spectroscopy
Steady state fluorescence spectroscopy was performedusing a Perkin Elmer luminescence spectrometer model
130LS 55(serial number 73135). Q5The cell used for measuringfluorescence was 10mm path length quartz cell and wasclear in all dimensions. Luminescence spectrometer wasused in Fluor mode to perform the fluorescence spec-troscopy. The scan rate was kept at 600 nm minute�1, kexc
135was 340 nm and scan range was 350 to 600 nm. Excitationslit was fixed at 7 nm and emission slits were fixed at2.5 nm. Photomultiplier voltage was fixed at 65V. Polarizerwas kept clear and no cutoff was operating during scan.
Dynamic Laser Light Scattering
140Dynamic light scattering experiment was carried out bya commercial LLS spectrometer BI-200SM motor-drivengoniometer equipped with BI-9000AT digital autocorrela-tor and the BI-9025AT photon counter and a cylindrical22mW uniphase He–Ne laser (wave length¼ 637 nm).
145The spectrometer has a high coherence factor of b�0.95because of a novel single- mode fiber optic coupled withan efficient avalanche-photodiode.
The instrument is very sensitive to dust particle so as toavoid discrepancy, all glassware were washed with acetone
150before use and dried carefully in oven. Solutions analyzedcontain fixed amount of triblock copolymer (3 g dm�3)and varying concentrations of surfactant SDS (5.0� 10�6
mol dm�3 to 1.5� 10�1mol dm�3). The deionized waterwas first filtered through Millipore filters (0.10 mm) for
155solution preparation while again the binary as well asternary solutions were filtered through (0.10 mm, 0.22 mmand sometimes 0.45 mm) directly into the scattering cell.The experiment duration was 5–10 minutes. Each experi-ment was repeated three or more times. The dynamic light
160scattering, the measurements were carried out at a scatter-ing angle of 90�. Scattering intensities were measured at atemperature 303K for various concentrations. Other solu-tions were prepared by diluting the stock solutions for each
2 Z. AHMED ET AL.
copolymer-surfactant system, about eighteen solutions for165 each copolymer-surfactant system were studied by light
scattering at 303K.
RESULTS AND DISCUSSIONS
Surface Tensiometry
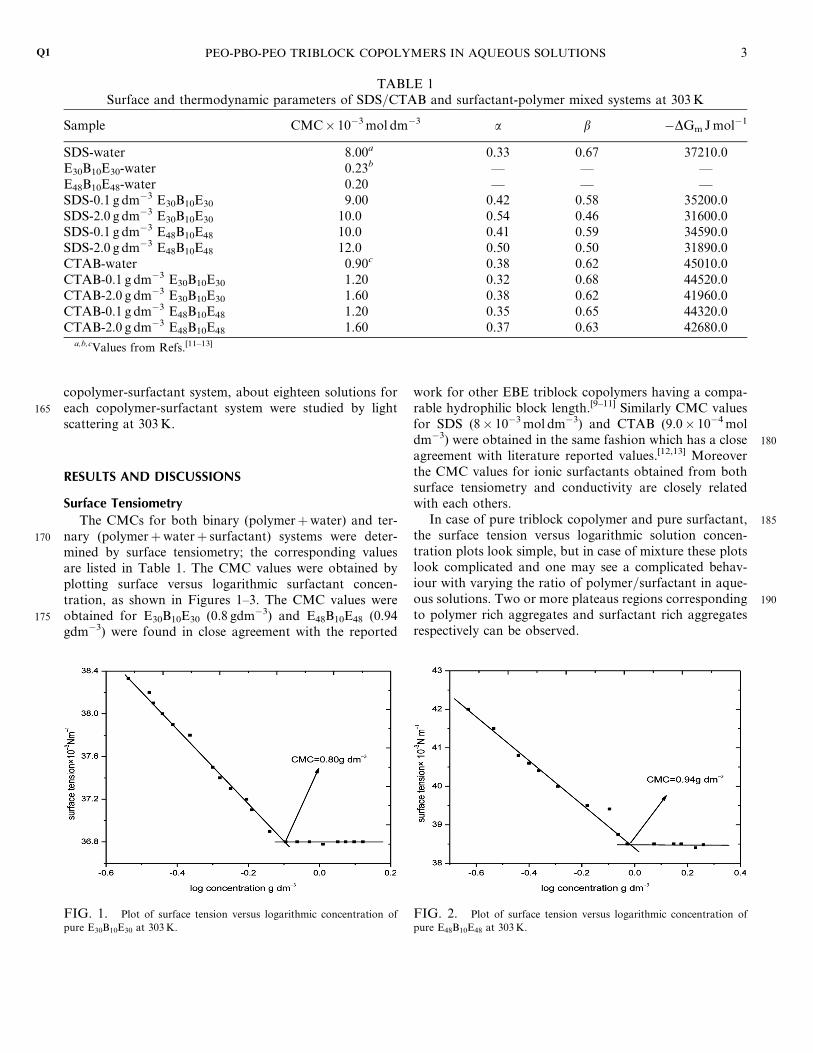
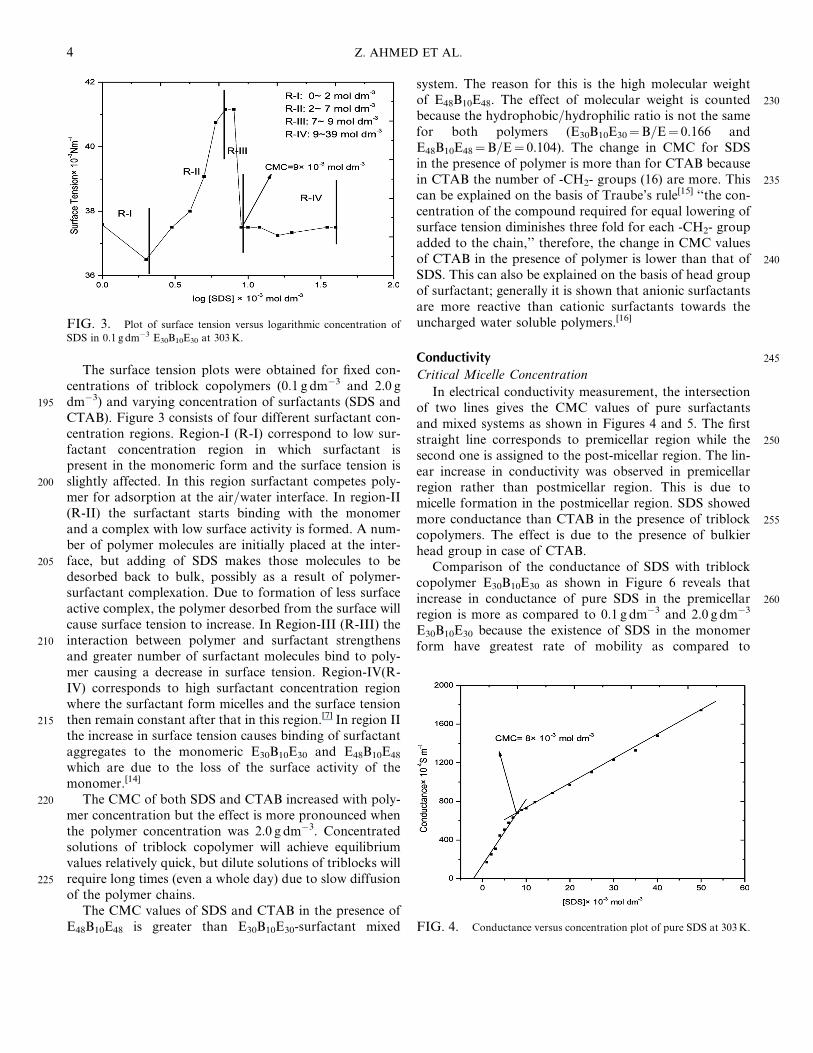
The CMCs for both binary (polymerþwater) and ter-170 nary (polymerþwaterþ surfactant) systems were deter-
mined by surface tensiometry; the corresponding valuesare listed in Table 1. The CMC values were obtained byplotting surface versus logarithmic surfactant concen-tration, as shown in Figures 1–3. The CMC values were
175 obtained for E30B10E30 (0.8 gdm�3) and E48B10E48 (0.94gdm�3) were found in close agreement with the reported
work for other EBE triblock copolymers having a compa-rable hydrophilic block length.[9–11] Similarly CMC valuesfor SDS (8� 10�3mol dm�3) and CTAB (9.0� 10�4mol
180dm�3) were obtained in the same fashion which has a closeagreement with literature reported values.[12,13] Moreoverthe CMC values for ionic surfactants obtained from bothsurface tensiometry and conductivity are closely relatedwith each others.
185In case of pure triblock copolymer and pure surfactant,the surface tension versus logarithmic solution concen-tration plots look simple, but in case of mixture these plotslook complicated and one may see a complicated behav-iour with varying the ratio of polymer=surfactant in aque-
190ous solutions. Two or more plateaus regions correspondingto polymer rich aggregates and surfactant rich aggregatesrespectively can be observed.
TABLE 1Surface and thermodynamic parameters of SDS=CTAB and surfactant-polymer mixed systems at 303K
Sample CMC� 10�3mol dm�3 a b �DGmJmol�1
SDS-water 8.00a 0.33 0.67 37210.0E30B10E30-water 0.23b — — —E48B10E48-water 0.20 — — —SDS-0.1 g dm�3 E30B10E30 9.00 0.42 0.58 35200.0SDS-2.0 g dm�3 E30B10E30 10.0 0.54 0.46 31600.0SDS-0.1 g dm�3 E48B10E48 10.0 0.41 0.59 34590.0SDS-2.0 g dm�3 E48B10E48 12.0 0.50 0.50 31890.0CTAB-water 0.90c 0.38 0.62 45010.0CTAB-0.1 g dm�3 E30B10E30 1.20 0.32 0.68 44520.0CTAB-2.0 g dm�3 E30B10E30 1.60 0.38 0.62 41960.0CTAB-0.1 g dm�3 E48B10E48 1.20 0.35 0.65 44320.0CTAB-2.0 g dm�3 E48B10E48 1.60 0.37 0.63 42680.0
a,b,cValues from Refs.[11–13]
FIG. 1. Plot of surface tension versus logarithmic concentration of
pure E30B10E30 at 303K.
FIG. 2. Plot of surface tension versus logarithmic concentration of
pure E48B10E48 at 303K.
PEO-PBO-PEO TRIBLOCK COPOLYMERS IN AQUEOUSQ1 SOLUTIONS 3
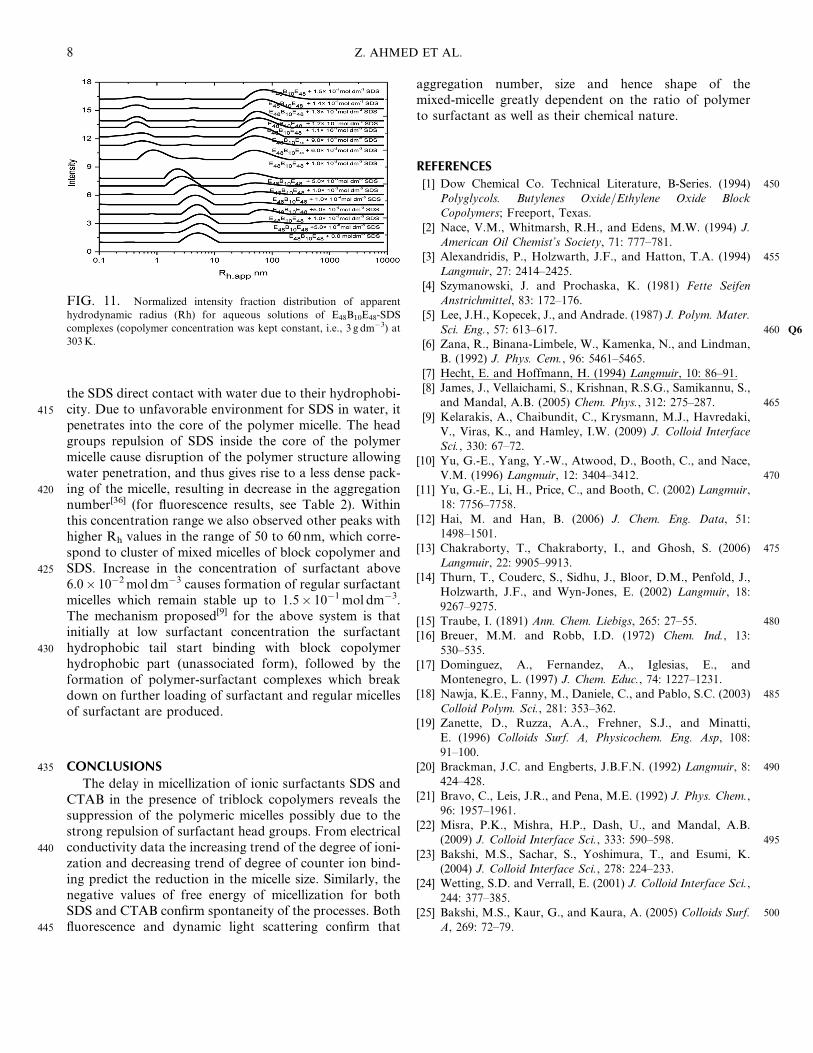
The surface tension plots were obtained for fixed con-centrations of triblock copolymers (0.1 g dm�3 and 2.0 g
195 dm�3) and varying concentration of surfactants (SDS andCTAB). Figure 3 consists of four different surfactant con-centration regions. Region-I (R-I) correspond to low sur-factant concentration region in which surfactant ispresent in the monomeric form and the surface tension is
200 slightly affected. In this region surfactant competes poly-mer for adsorption at the air=water interface. In region-II(R-II) the surfactant starts binding with the monomerand a complex with low surface activity is formed. A num-ber of polymer molecules are initially placed at the inter-
205 face, but adding of SDS makes those molecules to bedesorbed back to bulk, possibly as a result of polymer-surfactant complexation. Due to formation of less surfaceactive complex, the polymer desorbed from the surface willcause surface tension to increase. In Region-III (R-III) the
210 interaction between polymer and surfactant strengthensand greater number of surfactant molecules bind to poly-mer causing a decrease in surface tension. Region-IV(R-IV) corresponds to high surfactant concentration regionwhere the surfactant form micelles and the surface tension
215 then remain constant after that in this region.[7] In region IIthe increase in surface tension causes binding of surfactantaggregates to the monomeric E30B10E30 and E48B10E48
which are due to the loss of the surface activity of themonomer.[14]
220 The CMC of both SDS and CTAB increased with poly-mer concentration but the effect is more pronounced whenthe polymer concentration was 2.0 g dm�3. Concentratedsolutions of triblock copolymer will achieve equilibriumvalues relatively quick, but dilute solutions of triblocks will
225 require long times (even a whole day) due to slow diffusionof the polymer chains.
The CMC values of SDS and CTAB in the presence ofE48B10E48 is greater than E30B10E30-surfactant mixed
system. The reason for this is the high molecular weight230of E48B10E48. The effect of molecular weight is counted
because the hydrophobic=hydrophilic ratio is not the samefor both polymers (E30B10E30¼B=E¼ 0.166 andE48B10E48¼B=E¼ 0.104). The change in CMC for SDSin the presence of polymer is more than for CTAB because
235in CTAB the number of -CH2- groups (16) are more. Thiscan be explained on the basis of Traube’s rule[15] ‘‘the con-centration of the compound required for equal lowering ofsurface tension diminishes three fold for each -CH2- groupadded to the chain,’’ therefore, the change in CMC values
240of CTAB in the presence of polymer is lower than that ofSDS. This can also be explained on the basis of head groupof surfactant; generally it is shown that anionic surfactantsare more reactive than cationic surfactants towards theuncharged water soluble polymers.[16]
245Conductivity
Critical Micelle Concentration
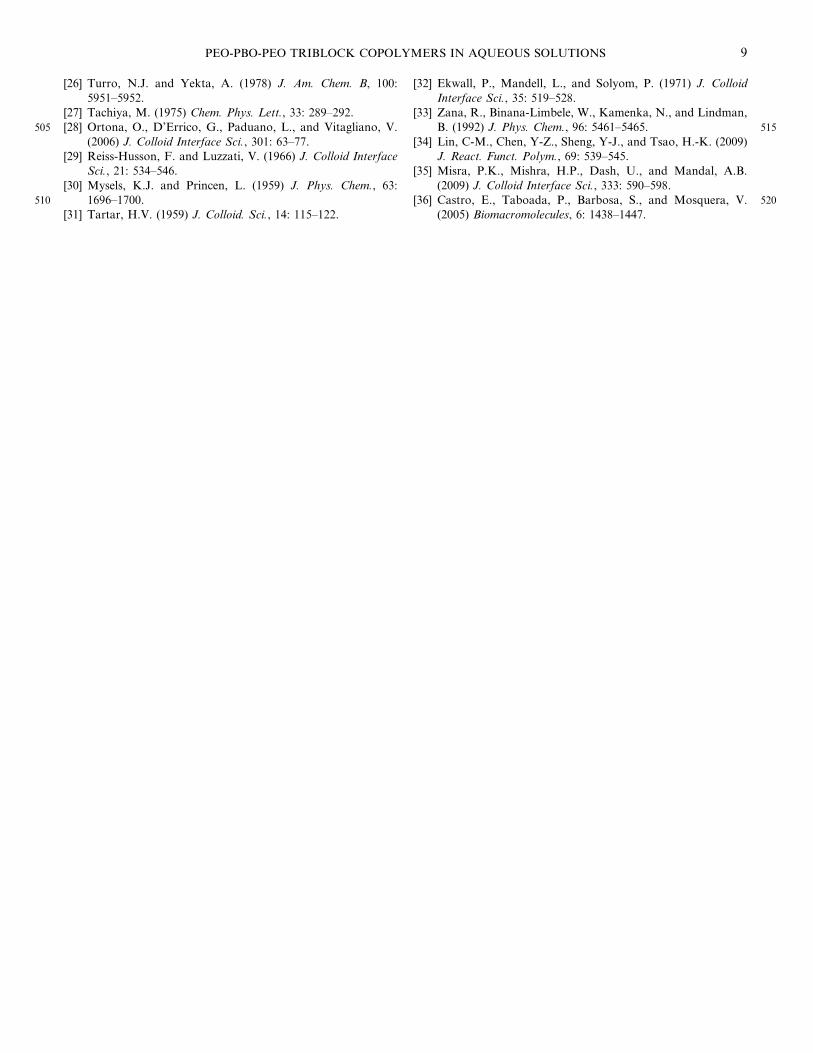
In electrical conductivity measurement, the intersectionof two lines gives the CMC values of pure surfactantsand mixed systems as shown in Figures 4 and 5. The first
250straight line corresponds to premicellar region while thesecond one is assigned to the post-micellar region. The lin-ear increase in conductivity was observed in premicellarregion rather than postmicellar region. This is due tomicelle formation in the postmicellar region. SDS showed
255more conductance than CTAB in the presence of triblockcopolymers. The effect is due to the presence of bulkierhead group in case of CTAB.
Comparison of the conductance of SDS with triblockcopolymer E30B10E30 as shown in Figure 6 reveals that
260increase in conductance of pure SDS in the premicellarregion is more as compared to 0.1 g dm�3 and 2.0 g dm�3
E30B10E30 because the existence of SDS in the monomerform have greatest rate of mobility as compared to
FIG. 3. Plot of surface tension versus logarithmic concentration of
SDS in 0.1 g dm�3 E30B10E30 at 303K.
FIG. 4. Conductance versus concentration plot of pure SDS at 303K.
4 Z. AHMED ET AL.

polymer-surfactant complex. On the other hand in the265 postmicellar region, the 2.0 g dm�3 E30B10E30 show more
conductance as compare to pure SDS and 0.1 g dm�3
E30B10E30. This is possibly due to high charge of the micelleshown by the degree of ionization (a) given in Table 1.
Degree of Ionization (a)270 Actually a is the ratio of the post micellar slope (S1) to
the pre micellar slope (S2).[8] The degrees of ionization
calculated for pure SDS and CTAB are in closed agreementwith literature reported values.[17,18] The higher valueobtained for triblock copolymer=SDS system as compared
275 to pure SDS as tabulated in Table 1 supports the expla-nation that SDS micelles are responsible for the strongerrate enhancement effect observed in the rate constant ver-sus [SDS] profile.[19] At higher micellar charge, the forma-tion of smaller polymer-bound micelles will be favored,
280since electrostatic repulsion is diminished and the increasein hydrocarbon-water contact area is stabilized by thepolymer.[20]
Degree of Counter Ion Binding (b)The degree of counter ion binding is obtained using the
285following equation.
b ¼ 1� a ½1�
The degree of micelle charge neutralization (b) for SDS andCTAB were calculated by using Equation (1) which is inclose agreement with literature reported values.[13,21] The
290values of b obtained for the mixtures of polymers andSDS were less than that of pure SDS, confirming thataddition of polymer increase micellar ionization.[21]
Free Energy of Micellization (DGm)
The free energy of micellization for pure surfactants and295mixed systems were obtained using the following equation.
DGom ¼ ð1þ bÞRT lnXcmc ½2�
According to Table 1, the negative values of free energyof micellization show spontaneity of the process. The freeenergy of micellization in the presence of higher con-
300centration of TBP is less negative as compared to puresurfactants. The free energy of micellization in the case ofCTABþTBP system is more negative as compare toSDSþTBP. Such values prefer association of TBP mole-cules among themselves rather than interacting with the sur-
305rounding CTAB monomers.[22] The interaction of SDS withTBP is stronger than that of CTAB; the trend is also con-firmed from free energy ofmicellization data given inTable 1.
Steady-State Fluorescence Spectroscopy
Microenvironment
310Pyrene is a spectroscopic probe that exhibits fluores-cence emission spectrum consisting of five peaks. The I1=I3 ratio of these vibronic fine structures indicates thepolarity of the pyrene micro environment, detection ofmicelle as well as polymer-surfactant interactions.[23] The
315value of I1=I3 is 1.9 in polar solvent and 0.6 in hydro-carbon. The bands I and III correspond to SV¼0
1 !Sv¼00 ð0; 0Þ and Sv¼0
0 ! Sv¼10 ð0; 1Þ transitions. The decrease
in the values of vibronic ratio (I1=I3) in the presence ofTBP as compared to aqueous polymer free surfactant
320(Table 2) provides strong evidence for interaction of surfac-tant and TBP.[24] The smaller I1=I3 value in case ofCTABþTBP as compared to pure CTAB, suggests thepresence of low micro polarity or higher hydrophobicenvironment. On the other hand I1=I3 values for SDSþ
325TBP are greater than SDSþH2O suggesting higher microFIG. 6. Conductance versus concentration plot of SDS in comparison
with 0.1 g dm�3 and 2.0 g dm�3 E30B10E30 at 303K.
FIG. 5. Conductance versus concentration plot of SDS in 0.1 g dm�3
E30B10E30 at 303K.
PEO-PBO-PEO TRIBLOCK COPOLYMERS IN AQUEOUSQ1 SOLUTIONS 5

polarity or higher hydrophilic environment.[25] In case ofeither SDS or CTAB, the pyrene resides in the hydrophobicenvironment of complexes as compared to water. The effectof quencher cetyl pyridinium chloride (CPC) concentration
330 on the fluorescence intensity of the pyrene was also studied.The plots of fluorescence intensity versus wavelength arepresented in Figure 7. The effect of adding and furthervarying the concentration of quencher can be clearly seenfrom Figure 7. These plots show that as the quencher
335 concentration increases the pyrene emission intensitiesdecrease. Similar plots were obtained for polymer-surfactant mixed systems (Figures are not shown here).
Aggregation Number
The aggregation numbers of surfactant micelles, both340 in binary and ternary systems was measured by static
fluorescence quenching through the general method pro-posed by Turro and Yekta in 1978.[26] On the assumptionsbased on Tachiya[27] model, the aggregation number isdetermined using the following equation.
lnI0I¼ ½Q�Nagg
ð½S� � cmsÞ ½3�
where Io and I are the emitted light intensities with zeroquencher concentration and at concentration [Q], respect-ively Nagg is the mean polymer-surfactant aggregationnumber and Cs is the total concentration of polymer
350and surfactant. From the slope of the plot of ln Io=Iversus [Q], the mean aggregation numbers for binary andternary systems were determined as shown in Figure 8.[28]
The aggregation number calculated for SDSþH2O was 62
TABLE 2Fluorescence parameters of the SDS=CTAB and surfactant-polymer mixed system at 303K
Sample I1=I3 Nagg n —DGb Jmol—1
SDS-water 1.04 62a,b 1.06 23060.0SDS-0.1 g dm�3 E30B10E30 — — — —SDS-2.0 g dm�3 E30B10E30 1.07 55 0.82 17170.0SDS-0.1 g dm�3 E48B10E48 1.07 54 1.19 25490.0SDS-2.0 g dm�3 E48B10E48 1.06 44 0.82 16510.0CTAB-water 1.20 87c,d 1.30 30460.0CTAB-0.1 g dm�3 E30B10E30 1.17 64 1.06 23700.0CTAB-2.0 g dm�3 E30B10E30 1.16 — 0.92 —CTAB-0.1 g dm�3 E48B10E48 1.20 68 1.08 24410.0CTAB-2.0 g dm�3 E48B10E48 1.15 62 1.10 24530.0
a,b,c,dValues from Refs.[30–33]
FIG. 7. Typical plots of spectral change of pyrene emission spectrum
in the presence of various concentrations of Quencher and fixed amount of
(2.5� 10�2mol dm�3) SDS at 303K.
FIG. 8. Plot of [Q] mol dm�3 versus ln Io=I for pure 2.5� 10�2mol
dm�3 SDS aqueous solution at 303K.
6 Z. AHMED ET AL.

that agree well with the literature reported values 57 and355 62.[29,30] Similarly, the values of aggregation number
calculated for CTABþH2O was 87, which is also in closeagreement with literature reported values 80 and 95.[31,32]
The aggregation number for ternary system was deter-mined in the same manner and its values are given in
360 Table 2. According to an expectation that for highly polarpolymers the aggregation numbers would be rather closeto those in the absence of polymer, while for a non-polarpolymer, the aggregation number is much lower.[33] Inboth case of SDS and CTAB, the aggregation numbers
365 decreased showing interaction of surfactant with TBP. Inthis study, the effect of block copolymer architecture wasalso observed. It was generally believed that the aggre-gation numbers is influenced by the length of hydrophilicblock. In our case the decrease in the aggregation number
370 in case of E48B10E48 is longer than E30B10E30 because inthe former case the hydrophilic block length is greater.This can also be explained on the basis of polymerhydrophobic=hydrophilic ratio. The aggregation numberdecreases with decrease in the hydrophobic=hydrophilic
375 ratio.[34] In case of E30B10E30; the hydrophobic=hydrophilic ratio is 0.166 which is greater than 0.104 forE48B10E48.
Binding Sites (n)
The binding sites were calculated using the following380 equation.
logI0 � I
I
� �¼ log kbþ n log½Q� ½4�
The values of n were calculated from the slope of the plotof log (Io�I)=I versus [Q] as shown in Figure 9. The values
of n were approximately equal to unity which indicates that385the association of surfactant monomer with TBP micelles
is in 1:1 ratio.[35] The positive values of n given in Table 2signifies that the interaction of surfactant with the corre-sponding TBP is by desorption process.[8]
Free Energy of Binding (dGb)
390The free energy of binding was calculated using thefollowing equation.
DGb ¼ �RT lnKb ½5�
The negative values of DGb given in Table 2 for all systemsindicate spontaneity of the processes.
395Dynamic Laser Light Scattering
Figures 10 and 11 show the intensity fraction distri-bution of the apparent hydrodynamic radius (Rh) of 3.0 gdm�3 E30B10E30 and E48B10E48 aqueous solution with dif-ferent SDS concentrations ranging from 5.0� 10�6mol
400dm�3 to 1.5� 10�1mol dm�3. Figure 11 shows multimodaldistribution of E48B10E48-SDS system.[9] The hydrody-namic radius of pure E48B10E48 micelles with Rh¼ 6.0 nm.nm. Initially at very low surfactant concentration(5.0� 10�6mol dm�3 to 1.0� 10�4mol dm�3), the appar-
405ent hydrodynamic radii of the polymer micelles remainsinvariable indicating weak interaction between polymermicelle and surfactant monomer with no disruption in theirstructures.[36] Further loading of SDS (1.0� 10�4mol dm�3
to 6.0� 10�2mol dm�3) leads to decrease in the Rh of the410polymeric micelles until 1.0 nm. This decrease in size is
due to increase in the amount of negatively charged headgroup (degree of ionization increases confirm from conduc-tivity data Table 1) in the copolymer micelles by avoiding
FIG. 10. Normalized intensity fraction distributions of apparent
hydrodynamic radius (Rh) for aqueous solutions of E30B10E30-SDS
complexes (copolymer concentration was kept constant, i.e., 3 g dm�3) at
303K.
FIG. 9. Plot of log [Q] mol dm�3 versus log (Io=I�1) for 2.5� 10�2
mol dm�3 pure SDS at 303K.
PEO-PBO-PEO TRIBLOCK COPOLYMERS IN AQUEOUS SOLUTIONS 7
the SDS direct contact with water due to their hydrophobi-415 city. Due to unfavorable environment for SDS in water, it
penetrates into the core of the polymer micelle. The headgroups repulsion of SDS inside the core of the polymermicelle cause disruption of the polymer structure allowingwater penetration, and thus gives rise to a less dense pack-
420 ing of the micelle, resulting in decrease in the aggregationnumber[36] (for fluorescence results, see Table 2). Withinthis concentration range we also observed other peaks withhigher Rh values in the range of 50 to 60 nm, which corre-spond to cluster of mixed micelles of block copolymer and
425 SDS. Increase in the concentration of surfactant above6.0� 10�2mol dm�3 causes formation of regular surfactantmicelles which remain stable up to 1.5� 10�1mol dm�3.The mechanism proposed[9] for the above system is thatinitially at low surfactant concentration the surfactant
430 hydrophobic tail start binding with block copolymerhydrophobic part (unassociated form), followed by theformation of polymer-surfactant complexes which breakdown on further loading of surfactant and regular micellesof surfactant are produced.
435 CONCLUSIONS
The delay in micellization of ionic surfactants SDS andCTAB in the presence of triblock copolymers reveals thesuppression of the polymeric micelles possibly due to thestrong repulsion of surfactant head groups. From electrical
440 conductivity data the increasing trend of the degree of ioni-zation and decreasing trend of degree of counter ion bind-ing predict the reduction in the micelle size. Similarly, thenegative values of free energy of micellization for bothSDS and CTAB confirm spontaneity of the processes. Both
445 fluorescence and dynamic light scattering confirm that
aggregation number, size and hence shape of themixed-micelle greatly dependent on the ratio of polymerto surfactant as well as their chemical nature.
REFERENCES
450[1] Dow Chemical Co. Technical Literature, B-Series. (1994)Polyglycols. Butylenes Oxide=Ethylene Oxide BlockCopolymers; Freeport, Texas.
[2] Nace, V.M., Whitmarsh, R.H., and Edens, M.W. (1994) J.American Oil Chemist’s Society, 71: 777–781.
455[3] Alexandridis, P., Holzwarth, J.F., and Hatton, T.A. (1994)Langmuir, 27: 2414–2425.
[4] Szymanowski, J. and Prochaska, K. (1981) Fette SeifenAnstrichmittel, 83: 172–176.
[5] Lee, J.H., Kopecek, J., and Andrade. (1987) J. Polym. Mater.460Sci. Eng., 57: 613–617. Q6
[6] Zana, R., Binana-Limbele, W., Kamenka, N., and Lindman,B. (1992) J. Phys. Cem., 96: 5461–5465.
[7] Hecht, E. and Hoffmann, H. (1994) Langmuir, 10: 86–91.[8] James, J., Vellaichami, S., Krishnan, R.S.G., Samikannu, S.,
465and Mandal, A.B. (2005) Chem. Phys., 312: 275–287.[9] Kelarakis, A., Chaibundit, C., Krysmann, M.J., Havredaki,
V., Viras, K., and Hamley, I.W. (2009) J. Colloid InterfaceSci., 330: 67–72.
[10] Yu, G.-E., Yang, Y.-W., Atwood, D., Booth, C., and Nace,470V.M. (1996) Langmuir, 12: 3404–3412.
[11] Yu, G.-E., Li, H., Price, C., and Booth, C. (2002) Langmuir,18: 7756–7758.
[12] Hai, M. and Han, B. (2006) J. Chem. Eng. Data, 51:1498–1501.
475[13] Chakraborty, T., Chakraborty, I., and Ghosh, S. (2006)Langmuir, 22: 9905–9913.
[14] Thurn, T., Couderc, S., Sidhu, J., Bloor, D.M., Penfold, J.,Holzwarth, J.F., and Wyn-Jones, E. (2002) Langmuir, 18:
9267–9275.480[15] Traube, I. (1891) Ann. Chem. Liebigs, 265: 27–55.
[16] Breuer, M.M. and Robb, I.D. (1972) Chem. Ind., 13:
530–535.[17] Dominguez, A., Fernandez, A., Iglesias, E., and
Montenegro, L. (1997) J. Chem. Educ., 74: 1227–1231.485[18] Nawja, K.E., Fanny, M., Daniele, C., and Pablo, S.C. (2003)
Colloid Polym. Sci., 281: 353–362.[19] Zanette, D., Ruzza, A.A., Frehner, S.J., and Minatti,
E. (1996) Colloids Surf. A, Physicochem. Eng. Asp, 108:
91–100.490[20] Brackman, J.C. and Engberts, J.B.F.N. (1992) Langmuir, 8:
424–428.
[21] Bravo, C., Leis, J.R., and Pena, M.E. (1992) J. Phys. Chem.,96: 1957–1961.
[22] Misra, P.K., Mishra, H.P., Dash, U., and Mandal, A.B.495(2009) J. Colloid Interface Sci., 333: 590–598.
[23] Bakshi, M.S., Sachar, S., Yoshimura, T., and Esumi, K.(2004) J. Colloid Interface Sci., 278: 224–233.
[24] Wetting, S.D. and Verrall, E. (2001) J. Colloid Interface Sci.,244: 377–385.
500[25] Bakshi, M.S., Kaur, G., and Kaura, A. (2005) Colloids Surf.A, 269: 72–79.
FIG. 11. Normalized intensity fraction distribution of apparent
hydrodynamic radius (Rh) for aqueous solutions of E48B10E48-SDS
complexes (copolymer concentration was kept constant, i.e., 3 g dm�3) at
303K.
8 Z. AHMED ET AL.
[26] Turro, N.J. and Yekta, A. (1978) J. Am. Chem. B, 100:
5951–5952.[27] Tachiya, M. (1975) Chem. Phys. Lett., 33: 289–292.
505 [28] Ortona, O., D’Errico, G., Paduano, L., and Vitagliano, V.(2006) J. Colloid Interface Sci., 301: 63–77.
[29] Reiss-Husson, F. and Luzzati, V. (1966) J. Colloid InterfaceSci., 21: 534–546.
[30] Mysels, K.J. and Princen, L. (1959) J. Phys. Chem., 63:510 1696–1700.
[31] Tartar, H.V. (1959) J. Colloid. Sci., 14: 115–122.
[32] Ekwall, P., Mandell, L., and Solyom, P. (1971) J. ColloidInterface Sci., 35: 519–528.
[33] Zana, R., Binana-Limbele, W., Kamenka, N., and Lindman,515B. (1992) J. Phys. Chem., 96: 5461–5465.
[34] Lin, C-M., Chen, Y-Z., Sheng, Y-J., and Tsao, H.-K. (2009)J. React. Funct. Polym., 69: 539–545.
[35] Misra, P.K., Mishra, H.P., Dash, U., and Mandal, A.B.(2009) J. Colloid Interface Sci., 333: 590–598.
520[36] Castro, E., Taboada, P., Barbosa, S., and Mosquera, V.(2005) Biomacromolecules, 6: 1438–1447.
PEO-PBO-PEO TRIBLOCK COPOLYMERS IN AQUEOUS SOLUTIONS 9


2[(Si,As,V,Mo)O4]2Cl10](https://static.fdokumen.com/doc/165x107/633fcccc3ae1575ab409dd0b/crystal-chemistry-of-layered-pb-oxychloride-minerals-with-pbo-related-structures.jpg)