Identification of a keratin-associated protein that localizes to a membrane compartment

European Polymer Journal 44 (2008) 2465–2475
Contents lists available at ScienceDirect
European Polymer Journal
journal homepage: www.elsevier .com/locate /europol j
Macromolecular Nanotechnology
Structure and properties of keratin/PEO blend nanofibres q
Annalisa Aluigi a,b, Claudia Vineis a, Alessio Varesano a, Giorgio Mazzuchetti a,Franco Ferrero b, Claudio Tonin a,*
a CNR-ISMAC, Institute for Macromolecular Studies, C.so G. Pella 16, 13900 Biella, Italyb Politecnico di Torino, Department of Materials Science and Chemical Engineering, C.so Duca degli Abruzzi 24, 10129 Torino, Italy
a r t i c l e i n f o a b s t r a c t
NA
NO
TECH
NO
LOG
Y
Article history:Received 9 November 2007Received in revised form 27 May 2008Accepted 7 June 2008Available online 18 June 2008Keywords:BiofibresBlendingElectrospinningKeratinProtein structure
0014-3057/$ - see front matter � 2008 Elsevier Ltddoi:10.1016/j.eurpolymj.2008.06.004
q Tables of contents: Electrospinning is a simple andthe fabrication of long filaments with diameters onnanofibres). Recently, a great attention has been focpinning of biopolymers. Among biopolymers, keraproperties such as biocompatibility and biodegradababsorbs heavy metal ions and VOCs. In this worelectrospun in nanofibres.
* Corresponding author. Tel.: +39 015 8493043; faE-mail address: [email protected] (C. Tonin
Keratin proteins are the major component of hair, feathers, wool and horns and representan important source of renewable raw materials for many applications. Regenerated kera-tin has useful properties such as biocompatibility and biodegradability. Moreover, keratinmaterials can absorb heavy metal ions, formaldehyde and other VOCs. In this work, regen-erated keratin was blended with aqueous solutions of poly(ethylene oxide) (PEO) in differ-ent proportion in order to improve its processability. Keratin/PEO nanofibres wereproduced by electrospinning the blend aqueous solutions. The chemical, physical and rhe-ological characteristics of the blend solutions were correlated with morphology, structural,thermal and mechanical properties of the electrospun mats.
� 2008 Elsevier Ltd. All rights reserved.
ULA
R
MACR
OM
OLE
C
1. IntroductionIn recent years, electrospinning has been extensivelyexplored because it has been recognized as an efficientmethod to manufacture nano-sized filaments (nanofibres)of many polymers, both from polymer solutions and melt[1–3]. The electrospinning apparatus is composed of threecomponents: a high voltage generator, a syringe feedingthe liquid-phase polymer (polymer solution or melt) to acapillary and a collecting screen. When a strong electricfield is generated between the capillary tip and the collec-tor, the charge induced on the polymer deforms the spher-ical pendant drop on the tip to a conical shape (Taylorcone). As the electrostatic forces overcome the surface ten-
. All rights reserved.
effective process fornanoscale (so-called
used on the electros-tin has many usefulility. Moreover, it cank, keratin has been
x: +39 015 8408387.).
sion, a charged jet is ejected from the capillary tip towardthe collecting screen. Before reaching the collecting screen,the jet solidification due to the solvent evaporation or meltcooling occurs and the polymer is collected as an intercon-nected web of nanofibres [4–6]. The nanofibres character-istics depend both on the operating conditions of thespinning process (flow rate, tension, time, temperatureand collector distance) and on the properties of the poly-mer fluid (concentration or density, viscosity, conductivity,etc.).
Because of their high specific surface area and highporosity [1], polymer nanofibres are attractive materialsfor a wide range of conventional and high-tech applica-tions such as filtration [7], sanitary textiles and medical de-vices (tissue engineering scaffolds [8] and wound dressing[9]).
Much attention has been focused on the electrospinningof biopolymers such as silk fibroin [10,11], collagen [12],fibrinogen [13] and gelatine [14], but keratin has receivedpoor attention even though it is one of the most abundantproteins, being the major component of hair, feathers,wool, nails and horns of mammals, reptiles and birds.Moreover, keratin wastes are an important source of

MA
CRO
MO
LECU
LAR
NA
NO
TECH
NO
LOG
Y
2466 A. Aluigi et al. / European Polymer Journal 44 (2008) 2465–2475
renewable raw material, since the disposal of organicwastes deriving from wool fibre by-products of the textileindustry, poor-quality raw wools not fit for spinning,horns, nails and feathers from butchery [15] have beenestimated more than 4 millions tons per year [16].
Keratin is a protein abundant in cysteine residues (7–20% of the total amino acid residues), which are oxidizedto give inter and intra-molecular disulphide bonds; theseare responsible of the high stability of keratin-based mate-rials. Extraction of keratin from wool requires chemicalmodification of cysteine because unreduced keratin solu-tions are instable [17,18]. The keratin extracted from woolcan be separated in two fractions: the low-sulphur contentkeratin (60% wt) at molecular weights ranging from 60 to45 kDa, the high-sulphur content keratin (26% wt) atmolecular weights ranging from 28 to 11 kDa [19].
Keratin regenerated from wool has many useful proper-ties such as biocompatibility and biodegradability (de-grades both in vitro and in vivo) and the mousefibroblast cells could proliferate well on the keratin films[20]. Thus, keratin is expected to be applicable for biomed-ical use in a similar manner to collagen and fibroin.
Moreover, keratin materials can absorb toxic sub-stances such as heavy metal ions, formaldehyde and otherVOCs [21,22], so that possible applications can be envis-aged also in water purification and air cleaning. Unfortu-nately, because of its low molecular weight (65–11 kDa)and its poor mechanical properties, regenerated keratin isvery fragile and difficult to handle. In this work, keratinaqueous solutions at different protein concentrations wereprepared and characterized by turbidity measurements.Then, poly(ethylene oxide) (PEO) with molecular weightof 400,000 was blended with aqueous solutions of keratinin different proportion; the polymer blend solutions werecharacterized by viscosity measurements, then electro-spun to produce mats of continuous, randomly oriented,nano-sized filaments.
Morphology, diameter distribution, thermal behaviourand mechanical properties of the mats were investigatedand correlated with the blending ratio with the aim ofhighlighting its effects on the nanofibre properties.
2. Experimental
2.1. Preparation and characterization of the blend solutions
Keratin was extracted from Australian Merino wool(£19.5 lm) by sulphitolysis [23,24]. Wool fibres werecleaned by Soxhlet extraction with petroleum ether to re-move fatty matter, washed with distilled water and condi-tioned at 20 �C, 65% r.h. for 24 h.
Five grams of cleaned and conditioned fibres were cutinto snippets of some millimetres, put in 100 ml of aque-ous solution containing urea (8 M), meta-bisulphite(0.5 M), sodium dodecyl sulphate (SDS, 0.05 M), adjustedto pH 6.5 with NaOH 5 N and treated by shaking for 2 hat 65 �C. Successively, the solution was dialyzed againstdistilled water in a cellulose tube (molecular cut off12,000–14,000) for 3 days at room temperature. The solu-tion was filtered through 5 lm pore-size filter under vac-
uum and then concentrated with a rotary vacuumevaporator (Buchi Rotavapor R-205) to 1–7 wt.%.
Keratin concentration was measured by the Bradfordprotein assay (Bio-Rad) using bovine serum albumin asstandard [25]. Turbidity was calculated measuring thetransmittance at 540 nm [26,27] with an UV–vis spectro-photometer (Perkin-Elmer Lambda 40), using the followingequation:
s ¼ �ðInTÞ=c ð1Þ
where s is the turbidity, T is the transmittance at 540 nmand c is the cell length (1 cm).
Keratin/PEO blend solutions were prepared by addingdifferent amounts of poly(ethylene oxide) (PEO 400,000from Sigma–Aldrich) directly into the keratin aqueoussolution, in order to obtain 7 wt.% of total polymericconcentration.
Shear rate-dependent viscosity measurements werecarried out with an Anton Paar Physica MCR 301 rheome-ter, equipped with a PTD 200 Peltier temperature controldevice at 25.0 (±0.1) �C, using cone-plate geometry(75 mm diameter, 1� angle and 45 lm truncation) in thecontrolled shear rate mode. The shear rate was logarithmi-cally increased from 1 to 10,000 s�1. Data were acquiredand elaborated with the Rheoplus v2.66 software. Mea-surements were carried out on the solutions of keratin/PEO in all the studied proportions and at 7 wt.% of totalpolymer concentrations.
To determine the intrinsic viscosity of PEO, keratin andkeratin/PEO blends, shear rate was varied logarithmicallyfrom 1 to 1000 s�1. Dilute solution of PEO were preparedin the concentration of 0.25, 0.20, 0.15 and 0.10 wt.%. Solu-tions of keratin were produced as previously reported andconcentrated between 1.0 and 3.5 wt.%. In order to evalu-ate the effect of keratin on the aqueous solutions of PEO,the concentration of keratin was fixed at 2.7 wt.% for eachblend solution and the concentration of PEO was set to0.25, 0.20, 0.15 and 0.10 wt.%.
Conductivity was measured with an Eutech Instru-ments multi-parameter tester PC300 calibrated with a1.413 mS cm�1 (at 25 �C) standard solution.
2.2. Nanofibre electrospinning and properties
About 3 ml of each keratin/PEO solution were loaded ina syringe linked to a capillary pipe with a metallic tip (in-side diameter 0.20 mm). The anode of the power supply(HVA b2 Electronics) was connected with the metallic tip.The cathode (collecting screen) is a rotating stainless diskof 5.5 cm diameter covered with an aluminium sheet. Avoltage of 20 kV was applied and a constant volume flowrate of 0.01 ml min�1 was maintained. The collectingscreen was placed at a distance of 20 cm from the syringetip to ensure the complete evaporation of the solvent.
Five nanofibre mats were produced from each solution,with a deposition time of 20 min; the thickness of the matsvaried from 12 to 30 lm.
The nanofibre morphology was examined by scanningelectron microscopy using a Leica Electron Optics 435 VPSEM with acceleration voltage of 15 kV, current probe50 pA and working distance of about 20 mm. The

OLE
CULA
RN
AN
OTE
CHN
OLO
GY
A. Aluigi et al. / European Polymer Journal 44 (2008) 2465–2475 2467
aluminium sheet with the nanofibres deposited on the sur-face was cut and mounted on aluminium specimen stubswith double-sided adhesive tape. Samples were sputter-coated with a gold layer 20–30 nm thick in rarefied argon,using an Emitech K550 sputter coater with a current of20 mA for 240 s.
Diameters of the nanofibres were acquired from SEMpictures randomly collected, using the image analysis soft-ware Opera Plus version 6.12. For each sample the diame-ter distribution was evaluated from 100 measurements.
FT-IR spectra with attenuated total reflectance tech-nique (ATR) were obtained using a Thermo Nicolet Nexusspectrometer. Before the spectra acquisition, samples weredried under vacuum for 5 h. Spectra were acquired from4000 to 650 cm�1 using 100 scans, 4 cm�1 band resolutionand 8.0 gain. All the spectra elaborations were carried outwith the GRAMS/386 software.
Thermal behaviour was studied by differential scanningcalorimetry (DSC) with a Mettler-Toledo DSC 821 calorim-eter, using Indium as calibration standard. About 1 mg ofsample was placed in the aluminium crucible; the runswere performed from 30 to 400 �C at the heating rate of10 �C/min, flushing the cell with 100 ml min�1 nitrogen.The data were collected on a computer with the Mettler-Toledo STARe system.
The mechanical properties of the mat samples, condi-tioned at 20 �C and 65% r.h., were tested determining theperforation resistance by the ball method (UNI-EN 5421)using a Persoz sphere mounted on a Instron AMTS SeriesIX Dynamometer (this test is used to evaluate mechanicalproperties of non-wovens with anisotropic fibres distribu-tion). Disks of 5 cm diameter cut from the mats were sub-jected to a pressure exercised by a steel sphere of 20 mmdiameter (Fig. 1) until perforation. The test provides theforce and the distance at break (0-A distance) named ‘‘per-foration indicator”. It is not simple to perform accuratemeasurements of tensile properties of nanofibre mats be-cause of the intrinsic weakness and difficulty to manage
Fig. 1. Perforator device.
this kind of material. Measurements were repeated onthree different samples.
3. Results and discussion
3.1. Stability of the keratin aqueous solutions
During sulphitolysis, cystine disulphide bonds arecleaved by sulphite to give cysteine thiol (reduced keratin)and Bunte salts residues, according to the followingreaction:
WSSWþ SO32� !WS� þWSSO3
� ð2Þ
where WSSW is the cross-linked keratin in the fibre, SO32�
is the sulphite, WS- is the reduced keratin and WSSO3� is
the Bunte salt [23,24]. This method gives a keratin extrac-tion yield of about 30% of the total protein content of theoriginal wool, with molecular weight distribution in therange of the original wool [28].
Stability of the aqueous solutions was studied monitor-ing the flocculation process versus time and concentration.The flocculation degree can be evaluated by turbidity mea-surements, since this property is correlated to the lightscattering induced by the particles in solution. In otherwords, turbidity reflects the state of the solute in the solu-tion [27].
Fig. 2 shows the turbidity trend versus time of keratinaqueous solutions at different protein concentrations. Ascan be observed, the solution with the lowest keratin con-centration (1.5 wt.%) does not show a significant increasein turbidity. On the other hand, turbidity of the solutionswith higher keratin concentration (3.7, 5 wt.%) increasesmore rapidly with time. This is due to aggregations be-tween keratin chains promoted by high protein concentra-tion. For this reason, all the solutions having a keratinconcentration higher than 1.5 wt.% were used within 4days, while the 7 wt.% keratin aqueous solution was dis-carded because it turned into gel state in a few hours.
Fig. 2. Turbidity versus time of keratin aqueous solutions.
MA
CRO
M

Fig. 4. Plot of zero-shear viscosity and onset of shear thinning as afunction of the keratin content.
MA
CRO
MO
LECU
LAR
NA
NO
TECH
NO
LOG
Y
2468 A. Aluigi et al. / European Polymer Journal 44 (2008) 2465–2475
3.2. Properties of the keratin/PEO blend solutions
The non-Newtonian shear rate-dependent viscosity ofthe keratin/PEO aqueous solutions is reported in Fig. 3.All the solutions behave like viscoelastic fluids, exceptthe pure keratin aqueous solution that turns into gel in afew hours as reported above. As shown, shear thinning in-creased with increasing the PEO amount, because long PEOchains form an entangled polymer network, while, in solu-tions with high keratin content, PEO macromolecules moveessentially independently each other. From the low-shearrate limiting value, there is a slight but definite drop in vis-cosity with increasing the shear rate.
In entangled polymer solutions, when the shear rate issufficiently low, break of entanglements (disentanglement)is balanced by formation of new entanglements. Thus, thefluid has a Newtonian behaviour, which corresponds to aconstant viscosity value (zero-shear viscosity, g0).
At higher shear rates disentanglement exceeds the rateof entanglement formation, therefore viscosity decreasesand the shear thinning behaviour is observed [29]. More-over, the zero-shear viscosity, estimated from the flowcurve, exponentially decreases with increasing the keratincontent, as reported in Fig. 4. Fig. 4 also reports the shearthinning onset that corresponds to the transition fromNewtonian to shear thinning. The shear thinning onset isfixed as the shear rate value in which the shear viscosityreach the 90% of the vanishing-shear viscosity value. Reci-procal can be used to evaluate the magnitude of the relax-ation times [30]. It is observed that this shear rate shifts tohigher value with increasing the keratin concentration.Both the shift of the shear thinning onset and the decreaseof the zero-shear viscosity are caused by the mixing of longPEO polymer chains with short keratin molecules, whichleads to reduction of the entanglement concentration andrelaxation time.
At low concentration, polymers form separate swollencoils that do not interpenetrate each other. The transitionfrom dilute solution of independently moving coils to
Fig. 3. Dependence of shear viscosity on the shear
entangled network is usually accompanied by a verymarked increase in the concentration-dependence of vis-cosity. The corresponding polymer concentration, markingthe onset of significant coil overlap and interpenetration, iscalled critical concentration, c*.
This is particularly important for PEO that is the compo-nent of the blend with the highest molecular weight. Fig. 5shows the concentration-dependence of the zero-shearviscosity of PEO. When the polymer concentration reachthe c* value, viscosity deviates from the linearity and theslope changes from 0.98 to 3.96, as a consequence of thegreat interpenetration of the polymer macromolecules.
Keratin exhibits gel formation when highly concen-trated solutions are produced by solvent evaporation fromlow concentrated aqueous solutions. Therefore, it is impos-sible to determine a fixed value of the critical concentra-tion for keratin solution, although keratin aqueoussolutions could be considered dilute solutions up to 5 wt.%.
The specific viscosity gsp of dilute solutions, that can beused to describe the macromolecular conformation ofpolymer solutions, is defined as:
rate for keratin/PEO blend solutions (7 wt.%).

Fig. 5. Dependence of the zero-shear viscosity vs PEO concentration.
Fig. 6. Variation of solutions conductivity as a function of keratin content.
MA
CRO
MO
LECU
LAR
NA
NO
TECH
NO
LOG
Y
A. Aluigi et al. / European Polymer Journal 44 (2008) 2465–2475 2469
gsp ¼g� gs
gsð3Þ
where g is the viscosity of the polymer solution and gs isthe viscosity of the solvent.
The specific viscosity of polymer solutions can be ex-panded in a Taylor series around the polymer concentra-tion c and the intrinsic viscosity [g] is defined as theratio between specific viscosity and concentration (e.g. re-duced viscosity) extrapolated to infinite dilution. Hence,mathematically the intrinsic viscosity can be determinedas:
½g� ¼ limc!0
gsp=c ð4Þ
The intrinsic viscosity is obtained by extrapolating datato zero concentration by using a linear regression [30]. Indilute solutions, polymers behave like separated swollencoils not interpenetrated, and their intrinsic viscosity de-pends only on the hydrodynamic volume of a single poly-mer chain surrounded from the solvent [31]. Therefore, themagnitude of [g] is suitable to evaluate the size of polymercoils.
The [g] obtained from dilute PEO solutions is3.239 dl g�1. This value is in good agreement with the liter-ature results [32]. Intrinsic viscosity of keratin in water is0.4673 dl g�1, whereas the [g] value of PEO in solution ofkeratin was found to be 24.06 dl g�1. This value is muchhigher than those of both pure PEO and keratin and, usu-ally, this means that the size of the polymer coils of molec-ular chains expanded [33] in the blend.
Fig. 6 shows that the conductivity of blend solutions in-creases with increasing the keratin content from 0.134 to1.747 mS cm�1 and this could be due to the presence ofthe polar amino acids of keratin.
3.3. Nanofibre morphology
Fig. 7 shows the SEM micrographs of nanofibres pro-duced electrospinning the keratin/PEO blend solutions.
The solution containing 90 wt.% of keratin produced drop-lets and bead-like defects (Fig. 7a) while the fibres betweenthe beads were very fine, about 95 ± 20 nm. This is dueto the low viscosity of this solution that gives rise breakof the jet at the capillary tip. The change in morphologyfrom beaded-fibres to continuous nanofilaments (Fig. 7b–e), which can be observed with decreasing the keratin con-tent, is the results of the increase of the solution viscosity.In other words, when the PEO amount is higher than 10wt.%, there are sufficient molecular chain entanglementsto prevent breaking of the electrically driven jet.
Moreover, nanofibres rich in keratin are more homoge-neous than nanofibres rich in PEO. This can be clearly seenin Fig. 8, where the fibre diameter distributions are re-ported. It is worth noting that the distributions of all thesamples can be fitted by a Gaussian band, which becomessignificantly narrow with increasing the keratin content.Therefore, the blend composition plays an important rolein determining the diameter distribution of the filaments.

Fig. 7. Scanning electron micrographs of keratin/PEO nanofibres: (a) 90/10, (b) 70/30, (c) 50/50, (d) 30/70, (e) 10/90.
MA
CRO
MO
LECU
LAR
NA
NO
TECH
NO
LOG
Y
2470 A. Aluigi et al. / European Polymer Journal 44 (2008) 2465–2475
In addition, the average diameter of the blend nanofibresgradually decreases from 268 to 95 nm as the keratin con-tent increases (Fig. 9). This can be due to the combinationof two effects: viscosity decrease and conductivity increasewith increasing the keratin amount. In fact, it is knownthat lower viscosity promotes the formation of finer nano-fibres [34] and higher charge density carried by the jetforms smoother and finer nanofibres because of the stron-ger whipping instability of the jet that enhances the fila-ment stretching [4,5].
3.4. FT-IR analysis of keratin/PEO nanofibres compared withcast films
Infrared spectroscopy has been extensively applied inthe study of the molecular conformation of keratin fibres[35–37]. Keratin proteins give rise to several characteristicabsorption bands known as amide A (3286 cm�1), amide B(3056–3075 cm�1), amide I (1600–1700 cm�1), amide II(1480–1580 cm�1) and III (1220–1300 cm�1) [36,38], butthe amide I absorption, that originates mainly from the
C@O stretching vibration, is especially sensitive to the sec-ondary structure of the proteins. Fortunately, the amide Iband of keratin falls in a region not disturbed by thepoly(ethylene oxide) absorptions. Therefore, it can be usedto study the structural conformation of keratin chains inthe nanofibres. In a previous work, keratin/PEO 50/50 filmsproduced by casting and keratin/PEO 50/50 nanofibresshowed differences in the amide I shape of keratin. Thiswas attributed to structural modifications in the naturalself-assembling of the protein chains [38] caused by the in-tense filament strain due to the strong drawing forces aris-ing in the electrospinning process.
In this work, the secondary structure of keratin in filmsand nanofibres was compared by the curve fitting of theamide I band. Particularly, this study was conducted forthe keratin/PEO 70/30 blend because it was the keratin-rich blend giving raise to regular diameter filaments, withfew bead-like defects.
Spectra were baseline corrected and smoothed usingthe Savitsky-Golay method (9 points) [39]. Afterwards,amide I was resolved in Gauss-shaped bands using the

Fig. 8. Diameters distributions of keratin/PEO nanofibres.
MA
CRO
MO
LECU
LAR
NA
NO
TECH
NO
LOG
Y
A. Aluigi et al. / European Polymer Journal 44 (2008) 2465–2475 2471
Marquardt’s method [40]. The number of amide I compo-nents was previously defined by second order derivativeanalysis. The absorption bands of the amide I band areshown in Fig. 10 and tabulated in Table 1. The predominantabsorption band at 1650 cm�1 is characteristic of thea-helical structures [41,42], while the band between 1610and 1633 cm�1 are typically seen for a-sheet structures[41,43]. Finally, the bands between 1675 and 1695 cm�1
are in the range observed for disordered conformations.
According to the literature data, the low-sulphur kera-tins have approximately 50% helix content in aqueoussolution; all other wool proteins have no helical character[19].
As can be seen, with respect to the film, nanofibresshow a decrease of the band area related to b-sheet struc-ture accompanied by an increase of the a-helix band area.This suggests that the rapid solvent evaporation hindersthe molecular rearrangement of the keratin chains and

Fig. 9. Mean diameter and standard deviation of keratin/PEO nanofibresversus the keratin content.
Fig. 10. Curve-fitted amide I region of keratin/PEO 70/30 film and nanofibres.
Table 1Amide I absorption bands of keratin/PEO film and nanofibres (1596 cm�1 His ring vibration)
Keratin/PEO 70/30 film Keratin/PEO 70/30 nanofibres
Band position (cm�1) Band assignments % Contenta Band position (cm�1) Band assignments % Contenta
1695 Disordered 30 1692 Disordered 241672 Disordered 1675 Disordered1650 a-Helix 38 1650 a-Helix 511624 b-Sheet 29 1621 b-Sheet 211596 Other 3 1597 Other 4
a Calculated from the bands area.
Fig. 11. DSC curves of 70/30 keratin/PEO film and nanofibres.
MA
CRO
MO
LECU
LAR
NA
NO
TECH
NO
LOG
Y
2472 A. Aluigi et al. / European Polymer Journal 44 (2008) 2465–2475
therefore, the electrospinning process seems to destabilizethe b-sheet structure. This behaviour was also pointed outby Chen et al. in a study on the electrospinning of silk-fi-broin [44].
3.5. Thermal analysis of keratin/PEO nanofibres and films
Fig. 11 shows the DSC curve of nanofibres producedelectrospinning the keratin/PEO 70/30 blend solution,compared with a film obtained by casting the same solu-
tion. The endothermal peak that occurs in the 200–250 �Ctemperature range is related to the a-helix denaturationand the area under the curve is a measure of the a-helixcontent [45], while the endothermal peak that falls at278 �C is caused by denaturation of b structures [46]. Thefirst remark is that in the nanofibres the area under thea-helix denaturation peak increases, while the peak re-lated to the b denaturation disappears. This is in agreementwith the previously reported hypothesis that the electros-pinning process destabilizes the b-sheet structure.
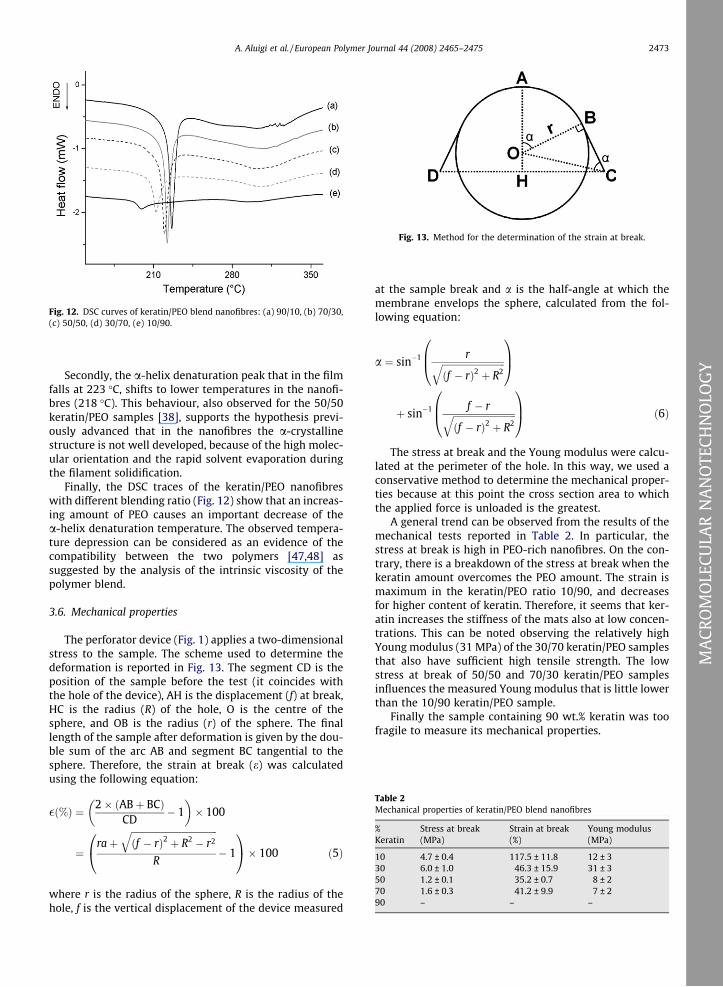
Fig. 12. DSC curves of keratin/PEO blend nanofibres: (a) 90/10, (b) 70/30,(c) 50/50, (d) 30/70, (e) 10/90.
Fig. 13. Method for the determination of the strain at break.
Table 2Mechanical properties of keratin/PEO blend nanofibres
%Keratin
Stress at break(MPa)
Strain at break(%)
Young modulus(MPa)
10 4.7 ± 0.4 117.5 ± 11.8 12 ± 330 6.0 ± 1.0 46.3 ± 15.9 31 ± 350 1.2 ± 0.1 35.2 ± 0.7 8 ± 270 1.6 ± 0.3 41.2 ± 9.9 7 ± 290 – – –
MA
CRO
MO
LECU
LAR
NA
NO
TECH
NO
LOG
Y
A. Aluigi et al. / European Polymer Journal 44 (2008) 2465–2475 2473
Secondly, the a-helix denaturation peak that in the filmfalls at 223 �C, shifts to lower temperatures in the nanofi-bres (218 �C). This behaviour, also observed for the 50/50keratin/PEO samples [38], supports the hypothesis previ-ously advanced that in the nanofibres the a-crystallinestructure is not well developed, because of the high molec-ular orientation and the rapid solvent evaporation duringthe filament solidification.
Finally, the DSC traces of the keratin/PEO nanofibreswith different blending ratio (Fig. 12) show that an increas-ing amount of PEO causes an important decrease of thea-helix denaturation temperature. The observed tempera-ture depression can be considered as an evidence of thecompatibility between the two polymers [47,48] assuggested by the analysis of the intrinsic viscosity of thepolymer blend.
3.6. Mechanical properties
The perforator device (Fig. 1) applies a two-dimensionalstress to the sample. The scheme used to determine thedeformation is reported in Fig. 13. The segment CD is theposition of the sample before the test (it coincides withthe hole of the device), AH is the displacement (f) at break,HC is the radius (R) of the hole, O is the centre of thesphere, and OB is the radius (r) of the sphere. The finallength of the sample after deformation is given by the dou-ble sum of the arc AB and segment BC tangential to thesphere. Therefore, the strain at break (e) was calculatedusing the following equation:
�ð%Þ ¼ 2� ðABþ BCÞCD
� 1� �
� 100
¼raþ
ffiffiffiffiffiffiffiffiffiffiffiffiffiffiffiffiffiffiffiffiffiffiffiffiffiffiffiffiffiffiffiffiffiffiffiffiffiðf � rÞ2 þ R2 � r2
qR
� 1
0@
1A� 100 ð5Þ
where r is the radius of the sphere, R is the radius of thehole, f is the vertical displacement of the device measured
at the sample break and a is the half-angle at which themembrane envelops the sphere, calculated from the fol-lowing equation:
a ¼ sin�1 rffiffiffiffiffiffiffiffiffiffiffiffiffiffiffiffiffiffiffiffiffiffiffiffiffiffiffiðf � rÞ2 þ R2
q0B@
1CA
þ sin�1 f � rffiffiffiffiffiffiffiffiffiffiffiffiffiffiffiffiffiffiffiffiffiffiffiffiffiffiffiðf � rÞ2 þ R2
q0B@
1CA ð6Þ
The stress at break and the Young modulus were calcu-lated at the perimeter of the hole. In this way, we used aconservative method to determine the mechanical proper-ties because at this point the cross section area to whichthe applied force is unloaded is the greatest.
A general trend can be observed from the results of themechanical tests reported in Table 2. In particular, thestress at break is high in PEO-rich nanofibres. On the con-trary, there is a breakdown of the stress at break when thekeratin amount overcomes the PEO amount. The strain ismaximum in the keratin/PEO ratio 10/90, and decreasesfor higher content of keratin. Therefore, it seems that ker-atin increases the stiffness of the mats also at low concen-trations. This can be noted observing the relatively highYoung modulus (31 MPa) of the 30/70 keratin/PEO samplesthat also have sufficient high tensile strength. The lowstress at break of 50/50 and 70/30 keratin/PEO samplesinfluences the measured Young modulus that is little lowerthan the 10/90 keratin/PEO sample.
Finally the sample containing 90 wt.% keratin was toofragile to measure its mechanical properties.

MA
CRO
MO
LECU
LAR
NA
NO
TECH
NO
LOG
Y
2474 A. Aluigi et al. / European Polymer Journal 44 (2008) 2465–2475
4. Conclusions
Keratin was extracted by sulphitolysis from wool, andblended in different proportions with PEO in aqueous solu-tions. Solutions with the lowest keratin concentration (1.5wt.%) are stable for about one week. A non-Newtonian flowbehaviour, with strong shear thinning correlated to the PEOamount, was shown by the keratin/PEO blend solutions. Itwas observed that the shear rate at which the shear thin-ning starts shifts to higher value with increasing the keratincontent. The intrinsic viscosity of PEO in solution of keratinis higher than those of both pure PEO and keratin.
Electrospinning of solutions containing high amount ofkeratin produced beaded nanofibres due to the low viscos-ity that gives rise to the jet break at the capillary tip. On thecontrary, solutions with a lower content of keratin could beelectrospun without defects. Moreover, SEM analysis re-vealed that the diameter distribution of keratin-rich nano-fibres was narrow and the average diameter of thefilaments decreased with increasing the keratin content.
FT-IR analysis indicated that electrospinning process in-duces structural modifications in the natural self-assem-bling of keratin chains; in particular, the electrospinningprocess seems to destabilize the a-sheet structure. Thisfinding has been confirmed by DSC analysis. Moreover,the decrease of the a-helix denaturation temperature fol-lowed by the increase of the PEO amount could be consid-ered as an evidence of the compatibility between the twopolymers, as suggested by the intrinsic viscosity analysis.As expected, the keratin/PEO nanofibre mats are solublein water and the keratin-rich nanofibres have poormechanical properties. However these blend nanofibrescan be used as filter for air cleaning from VOCs.
A further work is in progress to improve the mechanicalproperties and the water stability of keratin/PEO blendnanofibres by using keratin cross-linking agents, in orderto obtain interesting materials as scaffolds for cells growthor filter for air filtration.
Acknowledgements
This work has been carried out within the project ‘‘HI-TEX” with the financial support of REGION PIEDMONT.The authors also acknowledge the CASSA DI RISPARMIODI BIELLA Foundation (Biella, Italy) for the study grants.
References
[1] Min BM, Lee G, Kim SH, Nam YS, Lee TS, Park WH. Electrospinning ofsilk fibroin nano fibers and its effect on the adhesion and spreadingof normal human keratinocytes and fibroblast in vitro. Biomaterials2004;25:1289–97.
[2] Ki CS, Baek DH, Gang KD, Lee KH, Um IC, Park YH. Characterization ofgelatin nanofiber prepared from gelatin-formic acid solution.Polymer 2005;46:5094–102.
[3] Reneker DH, Chun I. Nanometer diameter fibers of polymer producedby electrospinning. Nanotechnology 1996;7:216–23.
[4] Reneker DH, Yarin AL, Fong H, Koombhongse S. Bending instability ofelectrically charged liquid jets of polymer solutions inelectrospinning. J Appl Phys 2000;87:4531–47.
[5] Hohman MM, Shin M, Rutledge G, Brenner MP. Phys Fluids2001;13:2201–20.
[6] Yarin AL, Koombhongse S, Reneker DH. Bending instability inelectrospinning of nanofibres. J Appl Phys 2001;89:3018–26.
[7] Gibson PW, Schreuder-Gibson H, Rivin D. Colloids Surf A2003;187:469–81.
[8] Boland ED, Bowlin GL, Simpson DG, Wnek GE. Polym Mater Sci EngPreprints 2001;85:51–2.
[9] U.S. 7193124 (2001), Battelle Memorial Institute (Columbus, OH),invs.: R.A. Coffee.
[10] Buchko CJ, Chen LC, Shen Y, Martin DC. Processing andmicrostructural characterization of porous biocompatible proteinpolymer thin films. Polymer 1999;40(26):7397–407.
[11] Ohgo K, Zhao C, Kobayashi M, Asakura T. Preparation of non-wovennanofibers of Bombyx mori silk, Samia cynthia ricini silk andrecombinant hybrid silk with electrospinning method. Polymer2003;44(3):841–6.
[12] Matthews JA, Wnek GE, Simpson DG, Bowlin GL. Preparation of non-woven mats from all-aqueous silk fibroin solution withelectrospinning method. Biomacromolecules 2002;3:232–8.
[13] Wnek GE, Carr ME, Simpson DG, Bowlin GL. Electrospinning ofnanofiber fibrinogen structures. Nano Lett 2003;3:213–6.
[14] Huang ZM, Zhang YZ, Ramakrishma S, Lim CT. Electrospinning andmechanical characterization of gelatin nanofibers. Polymer2004;45(15):5361–8.
[15] Salminen E, Rintala J. Anaerobic digestion of organic solid poultryslaughterhouse waste – a review. Bioresour Technol 2002;83:13–26.
[16] Yin J, Rastogi S, Terry AE, Popescu C. Self-organization ofoligopeptides obtained on dissolution of feather keratins insuperheated water. Biomacromolecules 2007;8(3):800–6.
[17] O’Donnel IJ, Thompson EOP. Reduced wool IV: the isolation of amajor component. Aust J Biol Sci 1964;17:973–9.
[18] Miyamoto T, Sakabe H, Inagaki H. Ordered structure of high-glycineproteins from reduced merino wool. Bull Inst Chem Res1987;65:109–19.
[19] Maclaren JA, Milligan B. Wool science, Fitzroy and Chapel StreetsMarrickville NSW 2204; 1981. p. 1–18.
[20] Yamauchi K, Maniwa M, Mori T. Cultivation of fibroblast cells onkeratin-coated substrata. J Biomater Sci Polym Ed 1998;9:259–70.
[21] Kar P, Misra M. Use of keratin fiber for separation of heavy metalsfrom water. J Chem Technol Biotechnol 2004;79:1313–9.
[22] Kokot S. Treated with aqueous solutions of chromium and copperions. Text Res J 1993;63:159–61.
[23] Maclaren JA, Milligan B. Wool science. Marrickville NSW: Sci Press;1981. p. 35.
[24] Katoh K, Shibama M, Tanabe T, Yamauchi K. Preparation andphysicochemical properties of compression-molded keratin films.Biomaterials 2004;25:2265–72.
[25] Bradford M. A rapid and sensitive method for the quantitation ofmicrogram quantities of protein utilizing the principle of protein–dye binding. Anal Biochem 1976;72:248–54.
[26] Schrooyen PMM, Dijkstra PJ, Oberthur RC, Bantjes A, Feijen J.Stabilization of solutions of feather keratins by sodium dodecylsulfate. J Colloid Interface Sci 2001;240(1):30–9.
[27] Um IC, Kweon HY, Park YH, Hudson S. Structural characteristics andproperties of the regenerated silk fibroin prepared from formic acid.Int J Biol Macromol 2001;29:91–7.
[28] Tonin C, Aluigi A, Vineis C, Varesano A, Montarsolo A, Ferrero F.Thermal and structural characterization of poly(ethylene-oxide)/keratin blend films. J Thermal Anal Calorimetry 2007;89:601–8.
[29] Mezger TG. The rheology handbook. 2nd ed. Hanover,Germany: Vincentz Network; 2006. p. 29.
[30] Ferry JD. Viscoelastic properties of polymers. 3rd ed. New York: JohnWiley & Sons; 1980. p. 224.
[31] Chee MJK, Ismail J, Kummerlöwe C, Kammer HW. Study onmiscibility of PEO and PCL in blends with PHB by solutionviscometry. Polymer 2002;43(4):1235–9.
[32] Kawaguchi S, Imai G, Suzuki J, Miyahara A, Kitano T, Ito K. Aqueoussolution properties of oligo- and poly(ethylene oxide) by static lightscattering and intrinsic viscosity. Polymer 1997;38(12):2885–91.
[33] Jinghua Y, Xue C, Alfonso GC, Turturro A, Pedemonte E. Study of themiscibility and thermodynamics of cellulose diacetate-poly(vinylpyrrolidone) blends. Polymer 1997;38(9):2127–33.
[34] Larrondo L, Manley R. Electrostatic fiber spinning from polymermelts. J Poly Sci Poly Phys Ed 1981;19:909–40.
[35] Wojciechowska E, Wlochowicz A, Weselucha-Birczynska A.Application of Fourier-transform infrared and Raman spectroscopyto study degradation of the wool fiber keratin. J Mol Struct1999;511(1):307–18.
[36] Lyman DJ, Murray-Wijelath J, Feughelman M. Effect of temperatureon the conformation of extended a-keratin. Appl Spectrosc2001;55:552–4.

A. Aluigi et al. / European Polymer Journal 44 (2008) 2465–2475 2475
[37] Tonin C, Aluigi A, Bianchetto Songia M, D’Arrigo C, Mormino M,Vineis C. Thermoanalytical characterisation of modified keratinfibres. J Thermal Anal Calorimetry 2004;77:987–96.
[38] Aluigi A, Varesano A, Montarsolo A, Vineis C, Ferrero F, MazzuchettiG. Electrospinning of keratin/poly(ethylene oxide)blend nanofibers. JAppl Polym Sci 2007;104:863–70.
[39] Savitsky A, Golay JE. Anal Chem 1984;36:1628–39.[40] Marquardt DW. An algorithm for least squares estimation of
nonlinear parameters. J Soc Ind Appl Math 1963;11:431–41.[41] Surewicz WK, Mantsch HH, Chapman D. Determination of protein
secondary structure by Fourier transform infrared spectroscopy: acritical assessment. Biochemistry 1993;32(2):389–94.
[42] Byler DM, Susi H. Examination of the secondary structure of proteinsby deconvolved FTIR spectra. Biopolymers 1986;25:469–87.
[43] Torii H, Tasumi M. In: Mantsch HH, Chapman D, editors. Infraredspectroscopy of biomolecules. New York: Wiley-Liss; 1996. p. 1–18.
[44] Chen C, Chuanbao C, Xilan M, Yin T, Hesun Z. Preparation of non-woven mats from all-aqueous silk fibroin solution withelectrospinning method. Polymer 2006;47(18):6322–7.
[45] Spei M, Holzem R. Thermoanalytical investigations of extended andannealed keratins. Colloid Polym Sci 1987;265:965–70.
[46] Yamauchi A, Yamauchi K. Formation and properties of wool keratinfilms and coatings. In: Aristippos G, editor. Protein-based films andcoatings. Boca Raton London New York, Washington, DC: CRC Press;2002. p. 253–73.
[47] Pracella M, Dainelli D, Galli C, Chiellini E. Polymer blends based onmesomorphic components, 1. Properties of poly(tetramethyleneterephthalate)/poly(decamethylene 4,4-terephthaloyldioxydibenzoate)blends. Makromol Chem 1986;187:2387.
[48] Chang-Chien GP, Denn MM. Isothermal crystallization kinetics ofpoly(ethylene terephthalate) in blends with a liquid crystallinepolyester (Vectra A). Polym Adv Tech 1995;7:168.
MA
CRO
MO
LECU
LAR
NA
NO
TECH
NO
LOG
Y
Copyright © 2022 FDOKUMEN