Supporting Information to accompany: Distillable protic ionic liquids for keratin dissolution and...
10
S1 Supporting Information to accompany: Distillable protic ionic liquids for keratin dissolution and recovery Azila Idris,* a,b R. Vijayaraghavan, a A. F. Patti a and D. R. MacFarlane a a School of Chemistry, Faculty of Science, Monash University, Clayton, VIC 3800, Australia. b Department of Chemistry, Faculty of Science, University of Malaya, 50603 Kuala Lumpur, Malaysia. *E-mail: [email protected], [email protected] Number of Pages: 10 Number of Schemes: 1 Number of Tables: 3 Number of Figures: 8
Transcript of Supporting Information to accompany: Distillable protic ionic liquids for keratin dissolution and...

S1
Supporting Information to accompany:
Distillable protic ionic liquids for keratin
dissolution and recovery
Azila Idris,*a,b R. Vijayaraghavan,
a A. F. Patti
a and D. R. MacFarlane
a
aSchool of Chemistry, Faculty of Science, Monash University, Clayton, VIC 3800, Australia.
bDepartment of Chemistry, Faculty of Science, University of Malaya,
50603 Kuala Lumpur, Malaysia.
*E-mail: [email protected], [email protected]
Number of Pages: 10
Number of Schemes: 1
Number of Tables: 3
Number of Figures: 8

S2
Preparation of ionic liquids [DMEA][CH3COO] and [DMEA]Cl
Y-H Y-
CH3COOH CH3COO-
HCl Cl-
Scheme S1: Preparation of [DMEA][ CH3COO] and [DMEA]Cl.
[DMEA][CH3COO]: (19.80 g, 99%); 1
H NMR (ppm, 400 MHz, CDCl3) δH: 8.67 (2H, s, +NH, OH), 3.74 (2H, q, CH2), 2.80 (2H, t, CH2), 2.54 (6H, s, 2 CH3), 1.95 (3H, s, CH3);
13C
NMR (ppm, 400 MHz, CDCl3) δC: 178.1, 60.6, 57.2, 43.8, 22.8; ES-MS: ES+ m/z 89.9
[DMEA] +
. ES- m/z 59.0 [acetate]
-.
[DMEA]Cl: (18.67 g, 93%); 1
H NMR (ppm, 400 MHz, DMSO) δH: 10.40 (1H, s, +NH), 3.71
(2H, q, CH2), 3.10 (2H, t, CH2), 2.49 (6H, s, 2CH3); 13
C NMR (ppm, 400 MHz, DMSO) δC:
58.3, 55.2, 42.4; ES-MS: ES+ m/z 90.0 [DMEA]
+. ES
- m/z 35.0 [Cl]
-.
Dissolution and regeneration of feather keratin in ionic liquid
Figure S1. Dissolved feather keratin in [DMEA][HCOO].
S3
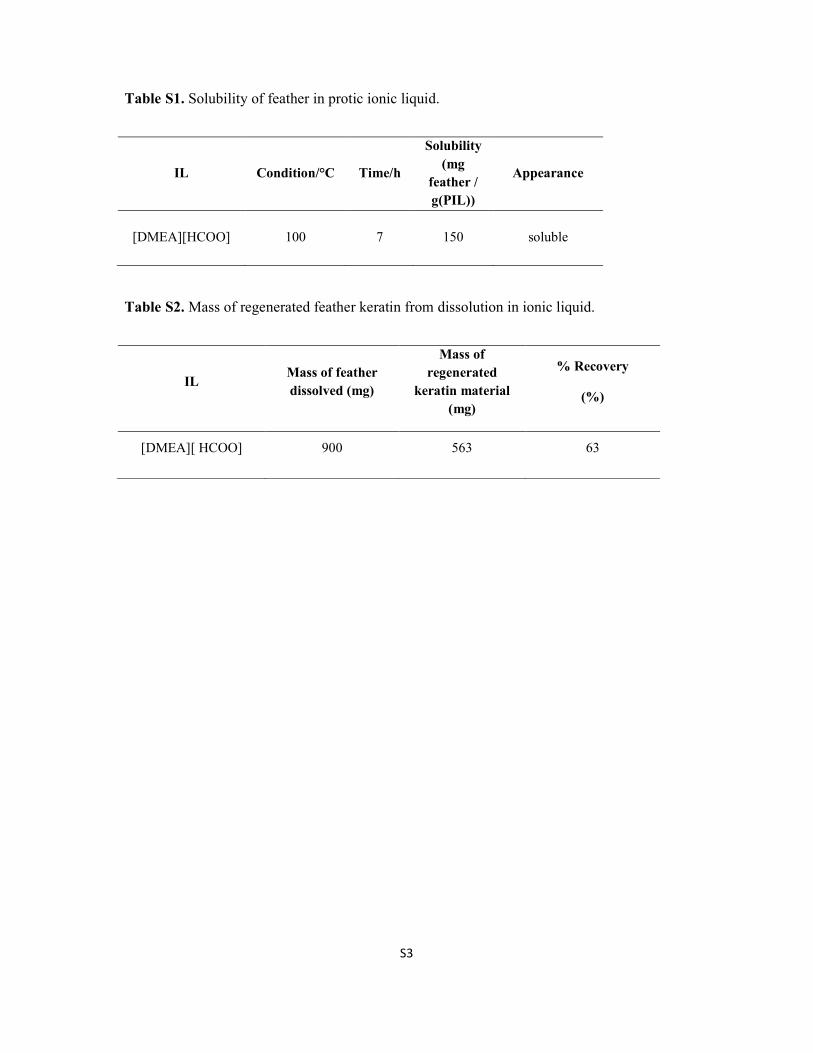
Table S1. Solubility of feather in protic ionic liquid.
IL Condition/°C Time/h
Solubility
(mg
feather /
g(PIL))
Appearance
[DMEA][HCOO] 100 7 150
soluble
Table S2. Mass of regenerated feather keratin from dissolution in ionic liquid.
IL Mass of feather
dissolved (mg)
Mass of
regenerated
keratin material
(mg)
% Recovery
(%)
[DMEA][ HCOO] 900 563 63

S4
Fourier self-deconvolution (FSD) of the infrared spectra (Amide I region)
Figure S2: The deconvolution of FTIR spectra in Amide I region of a) feather b) regenerated
keratin feather from [DMEA][formate] which were fitted using Gaussian fitting function.

S5
Table S3. The percentage fraction of α-helix and β-sheet + random coil of feather and
regenerated keratin feather, which were deduced after Fourier self-deconvolution and fitted
using OPUS software.1,2
Material
Wavenumber
(cm-1
) Assignment
% Fraction
Feather
1621 β-sheet + random coil 55
1656 α-helix 37
1685 Turns 8
Regenerated feather keratin
from [DMEA][HCOO]
1631 β-sheet + random coil 57
1659 α-helix 19
1679 Turns 24
Figure S2 shows the deconvoluted Amide I FTIR bands of feather and regenerated feather
from [DMEA]HCOO]. The secondary structure in protein which consists of α-helix, β-sheet,
random coil and turns can be estimated quantitatively by the deconvolution of the Amide I
band region (~1580cm-1
and 1720cm-1
).1,2
Table S3 displays the assignment of each
component that represent the secondary of protein structure. From Table S3, it can be seen
that the percentage fraction of α-helix decreased after dissolution and regeneration process.
The probable explanation of this observation could be due to the ability of the protic IL to to
disrupt the hydrogen bonded network of keratin. We also believe that some of the alpha helix
fraction were converted in the formation of higher degree of random coil and β-sheet fraction
during the dissolution and regeneration process.

S6
1H NMR of neat and distilled IL
Figure S3. NMR spectrum of neat [DMEA] HCOO].
Figure S4. NMR spectrum of recovered [DMEA][HCOO] after distillation.

S7
The spectra are substantially similar. However, the NH/OH peak has moved; D2O
confirming that this is an exchangeable proton. Therefore, shift is likely due to differing
amounts of residual water in the sample (or the CDCl3 solvent).
SDS Page
(a) (b)
Figure S5. SDS-PAGE pattern of (a) protein standard and (b) water soluble protein
remaining in dark resin after distillation.

S8
DSC traces of feather and keratin film
Figure S6. DSC of a) feather and b) film

S9
XRD of feather and keratin film
Figure S7. XRD of (a) feather and (b) film from dissolved feather in [DMEA][HCOO].

S10
FTIR of feather and keratin film
Figure S8. ATR-FTIR of (a) feather and (b) film from dissolved feather in [DMEA][HCOO].
References
(1) Hu, X.; Kaplan, D.; Cebe, P. Determining beta-sheet crystallinity in fibrous proteins by
thermal analysis and infrared spectroscopy. Macromolecules 2006, 39, 6161.
(2) Jung, C. Insight into protein structure and protein–ligand recognition by Fourier
transform infrared spectroscopy. Journal of Molecular Recognition 2000, 13, 325.