Evaluation of chondrogenesis within PEGT: PBT scaffolds with high PEG content
Upload
independentCategory
view
5download
0
This article appeared in a journal published by Elsevier. The attachedcopy is furnished to the author for internal non-commercial researchand education use, including for instruction at the authors institution
and sharing with colleagues.
Other uses, including reproduction and distribution, or selling orlicensing copies, or posting to personal, institutional or third party
websites are prohibited.
In most cases authors are permitted to post their version of thearticle (e.g. in Word or Tex form) to their personal website orinstitutional repository. Authors requiring further information
regarding Elsevier’s archiving and manuscript policies areencouraged to visit:
http://www.elsevier.com/copyright
Author's personal copy
International Journal of Pharmaceutics 393 (2010) 79–87
Contents lists available at ScienceDirect
International Journal of Pharmaceutics
journa l homepage: www.e lsev ier .com/ locate / i jpharm
A pharma-robust design method to investigate the effect of PEG and PEO onmatrix tablets
Jun Sang Parka,c, Ji Yeon Shima, Nguyen Khoa Viet Truongb, Jung Soo Parka, Sangmun Shinb,Young Wook Choic, Jaehwi Leec, Jeong-Hyun Yoond, Seong Hoon Jeongd,∗
a GL PharmTech Corp., Seongnam, Gyeonggi, 462-807, South Koreab Department of System Management & Engineering, Inje University, Gimhae, 621-749, South Koreac College of Pharmacy, Chung-Ang University, Seoul, 156-756, South Koread Collegel of Pharmacy, Pusan National University, Busan, 609-735, South Korea
a r t i c l e i n f o
Article history:Received 16 December 2009Received in revised form 5 April 2010Accepted 9 April 2010Available online 23 April 2010
Keywords:Matrix tabletSwellingPolyethyleneglycolPolyethyleneoxideDiffusionSustained releaseResponse surface methodologyRobust design
a b s t r a c t
Even though polyethyleneoxide (PEO)–polyethyleneglycol (PEG) blends have been used widely for sus-tained release matrix tablets, evaluations of the effects of PEG or PEO on the matrix properties have beenlimited. In order to evaluate gelling behavior and drug release profiles of PEG, various contents of thepolymers were investigated through a robust experimental design method. When exposed to an aqueousenvironment, the PEO–PEG matrix hydrated slowly and swelled, causing a thick gel layer to form on thesurface, the thickness of which increased significantly depending on the PEG contents. Since polyacrylateplates were used for the study, the matrix was not completely hydrated and gelled even after 5 h. How-ever, the results could be applied to the time-oriented responses RD (robust design) models to obtainoptimal settings and responses for the observed times. The optimal settings of PEO and PEG were 94.26and 140.04 mg, respectively (PEG rate of 148.57%). Moreover, as the amount of PEG increased, the releaserate also increased. When the formulation contained more than 150% of PEG, most of the drug loaded inthe tablet was released in about 12 h. When the amount of PEG was less than 100%, the drug release ratewas sustained significantly. Based on the RD optimization model for drug release, the optimal settingswere PEG and PEO of 124.3 and 110 mg, respectively (PEG rate of 88.50%). Therefore, PEG rate of about90–150% is suggested for matrix tablet formulations, and the exact ratio could be formulated accordingto the resulting tablet’s properties.
© 2010 Elsevier B.V. All rights reserved.
1. Introduction
Hydrophilic swellable polymers have been used widely inmatrix tablet formulations to control the release rate of a drug(Alderman, 1984; Ford et al., 1991; Juarez et al., 2001; Rao et al.,1990; Dhawan et al., 2005). The main goal of the matrix system isto extend drug release with zero-order release kinetics to main-tain a constant in vivo plasma drug concentration and a consistentpharmacological effect. To achieve a constant release rate, a num-ber of matrix devices have been developed with various typesof polymeric excipients, either alone or in a mixture, to modifytablet hydration and to change the release rate and mechanism(Ebube and Jones, 2004; Madhusudan et al., 2001; Neau et al., 1999;Nerurkar et al., 2005).
The matrix tablets are usually composed of active pharmaceuti-cal ingredients and hydrophilic swellable polymers that form gels
∗ Corresponding author. Tel.: +82 51 510 2812; fax: +82 51 513 6754.E-mail addresses: [email protected], [email protected] (S.H. Jeong).
when exposed to an aqueous environment. Among the varioustypes of polymers, hydroxypropyl methylcellulose (HPMC) is oneof the most common because of its safety, application, and com-patibility with many drugs (Conti et al., 2007a; Khurahashi et al.,1996; Reynolds et al., 1998). Moreover, blends of pharmaceuticallyapproved polymeric materials have been used extensively, includ-ing systems of Na CMC (carboxymethylcellulose)–HPMC (Contiet al., 2007a,b), PEO (polyethylene oxide)–carbopol (carboxyvinylpolymer) (Hong and Oh, 2008), and PEO–PEG (polyethylene glycol)(Kojima et al., 2008; Sako et al., 1996).
When administered, the surface of the matrix tablets is hydratedupon exposure to the gastrointestinal (GI) fluid, forming a viscous-gel layer that may hinder water penetration. Therefore, waterpenetration may be the rate-controlling step during gel formation.It is both the formation of the gel layer and its physicochemi-cal properties that can modify the drug release kinetics from thematrix system. Water penetration may be dependent on the poly-mers’ chemical structure, concentration, and viscosity. If the gellingrate or swelling is too slow, i.e., more than 5–6 h after administra-tion (incomplete gelation while passing through stomach and small
0378-5173/$ – see front matter © 2010 Elsevier B.V. All rights reserved.doi:10.1016/j.ijpharm.2010.04.009

Author's personal copy
80 J.S. Park et al. / International Journal of Pharmaceutics 393 (2010) 79–87
intestine), part of the tablet may not be fully wetted or hydrated,resulting in a ‘dry core’ and incomplete drug release. Moreover,the mechanical strength of the viscous-gel layer should be strongenough to maintain its integrity and release rate and mechanism.If too weak, most of the gel will disintegrate quickly without anysignificant sustained release effect.
Depending on the mechanical properties of the gel layer, drugrelease is controlled by different mechanisms with different kinet-ics (Conti et al., 2007a). In the case of low viscosity gelling agents,erosion of the swollen polymer is the major release factor thatgenerally leads to zero-order release kinetics. If high viscositypolymers are used, a mechanically stable gel can be formed andpolymer dissolution/disintegration will be minimal (Conti et al.,2007a). Therefore, the diffusion-controlled mechanism will be themajor mechanism for drug release from the swollen matrix. Bothmechanisms can be modulated by formulating different types ofpolymers.
Among the polymeric blends for the matrix tablet, combina-tion of PEO and PEG showed significant sustained release of a drugthroughout the GI tract, including the colon, where the amountof aqueous media is limited (Sako et al., 1996). In the blend, PEOwas incorporated as a gel-forming polymer and PEG was used as ahydrophilic agent to facilitate water uptake into the tablet matrix.The tablet showed stable drug release in the GI tract without anysignificant burst effect (Kojima et al., 2008).
Even though the PEO–PEG blend can be used for matrix tablets,most previous studies investigated a fixed ratio between bothexcipients and the effects of different ratios of PEO and PEG on thematrix tablets have not been quantitatively evaluated. The presentstudy investigates the properties of matrix systems containing var-ious ratios of the two polymers to find a correlation and optimumratio for a specific purpose. Among the tablet properties, gellingbehavior and drug dissolution profiles are evaluated together witha robust experimental design method.
Robust design (RD) is an enhanced process/product designmethodology to determine the best factor settings while mini-mizing process variability and bias (i.e., the deviation from thetarget value of a product). The primary procedure in RD includesexperimental design, estimation of model parameters, and opti-mization to obtain the optimal factor settings. By exploiting theinformation about the relationships between input factors and out-put responses from an experimental design, RD methods revealrobust solutions that are less sensitive to input variations. Giventhis fact, one of the main challenges is the optimal design of phar-maceutical formulations to identify better approaches to variousunmet clinical needs. Traditional design methods have often beenapplied to situations in which the primary characteristics of interestare time-insensitive. However, in pharmaceutical processes, time-oriented characteristics, such as drug release and gelation kinetics,are often of interest. In this study, a new ‘pharma-RD method’ isproposed and this method aims to apply RD techniques to thosetime-oriented characteristics. In each experimental run, mean andvariance values of drug release and gelation kinetics are measuredover time. In this situation, both responses are functions of controlfactors and observed time since the tentative relationship can be
analyzed according to both vertical and horizontal directions. Theresponse surface methodology (RSM) is utilized for both analysisdirections.
2. Materials and methods
2.1. Materials
The model drug, Terazosin HCl dihydrate (molecular weight459.93, free base 387.43, log P 1.4), was purchased from HanseoChemical (Seoul, Korea), which is freely soluble in water. PEO(Polyox WSR-303) of average molecular weight 7.0×10⁶ and vis-cosity 7,500–10,000 mPa (1% solution) was purchased from DowChemical (Midland, MI, USA). Polyethylene glycol 6000 (PEG 6000)was purchased from Sanyo Chemical Industries (Ibaraki, Japan).Magnesium stearate was purchased from Faci Asia (Jurong Island,Singapore). All other reagents used were of analytical grade.
2.2. Preparation of matrix tablets
The formulations of each tablet are shown in Table 1. All mate-rials were passed through a sieve (#40 mesh) before mixing toremove any aggregates. The model drug (Terazosin HCl dihy-drate) was mixed manually with PEO and PEG in a mortar andthen blended with magnesium stearate. The resultant mixture wascompressed on a single-punch hydraulic laboratory press usingplane-face punches with a diameter of 9.0 mm. The compressionforce was kept constant at 8.0 MPa and the total weight of eachtablet was around 241 mg. The thickness of the tablets was about4.0 mm.
2.3. Evaluation of tablet gelation
Gelation index might be a useful tool to represent the portion of atablet that has undergone gelation on time. Each tablet was insertedbetween two transparent polyacrylate plates (5 cm×5 cm) andheld tight with a rubber band. The polyacrylate plates and tabletwere immersed in 900 mL of dissolution medium (pH 6.8) andstirred with a magnetic bar (180 rpm/min). Due to the size of theplates, gelation study was performed in a different condition com-pared to drug release test. Test tablets were removed from themedium at predetermined time intervals (30, 60, 90, 120, 180,240, and 300 min) and the diameters of gelated tablets were mea-sured with a caliper. After the gel layer was carefully peeled off,the diameter of the non-gelated core was also measured (Dobs). Thegelation index was calculated using the following equation (Sakoet al., 1996).
gelation index (G, %) ={
1− (Dobs)3
(Dini)3
}× 100
Dobs is the diameter of the portion not gelled after the test; Dini isthe diameter of the tablet before the test.
Table 1Formulation compositions of the matrix tablets.
Components (mg) PEG 10% PEG 50% PEG 100% PEG 150% PEG 300% PEG 500%
Terazosin HCl, 2H2O 5.935 ← ← ← ← ←Polyox WSR 303 (PEO) 213.00 156.20 117.15 93.71 58.58 39.05PEG 6000 21.30 78.10 117.15 140.57 175.73 195.23Magnesium stearate 0.96 ← ← ← ← ←Total weight 241.2 ← ← ← ← ←Percentage of PEG to PEO 10% 50% 100% 150% 300% 500%

Author's personal copy
J.S. Park et al. / International Journal of Pharmaceutics 393 (2010) 79–87 81
2.4. Drug release test
Drug release tests were conducted according to USP 27 Appara-tus 2 guidelines (paddle method) (Vankel® VK 7000, Vankel, Edison,NJ) with 900 mL of dissolution medium maintained at 37±0.5 ◦Cand mixed at 100 rpm. Due to the high solubility of the model drug,simulated intestinal fluid (SIF) (pH = 6.8, 50 mM phosphate buffer)without any enzymes was selected as a dissolution medium inthis study. Samples were withdrawn at predetermined time inter-vals and analyzed for drug content using an HPLC system (Agilent1100 Series, Agilent Technologies, Waldbronn, Germany) at a wave-length of 254 nm. Samples were filtered with 30-�m PE filters, andthen 20 �L of each sample was injected. A �-Bondapak® C18 10 �m(3.9 mm×300 mm) (Waters, Milford, US) column was used. Themobile phase was a mixture of aqueous buffer (0.75% (w/w) sodiumcitrate and 0.54% (w/w) citric acid), methanol, and acetonitrile in avolume ratio of 80:5:15, respectively.
2.5. Analysis of drug release kinetics
The drug release data can be fitted to the well-known exponen-tial equation, which has been used extensively to describe the drugrelease behavior from polymeric systems (Korsmeyer et al., 1983)
Mt
M∞= ktn
where Mt/M∞ is the fraction of drug released at time t. k is theproportionality constant, which shows the structural and geomet-rical properties of the matrix. A higher k value may suggest burstdrug release from the matrix. The exponent, n, is the diffusionalexponent, which can indicate the mechanism of drug release anddepends on the polymer swelling characteristics and the relaxationrate at the swelling front. The equation is valid only for the earlystages (≤70%) of drug release. According to the criteria for releasekinetics from swellable systems of cylindrical geometry, a releaseexponent value, n = 0.45, 0.45 < n < 0.89, and 0.89 < n < 1.0 indicatesFickian (case I) diffusion, non-Fickian (anomalous) diffusion, andzero-order (case II) transport, respectively (Peppas, 1983; Ritgerand Peppas, 1987).
3. Robust design model development
3.1. Experimental framework and response surface methodology(RSM)
Robust design (RD) techniques are based on exploiting themean and variance information of responses. The concept buildingrobustness into a design is increasingly popular in the pharmaceuti-cal field because of its practicality. There have been many attemptsto integrate Taguchi’s RD principles with well-established statis-tical techniques in order to directly model responses as functionsof input factors (Vining and Myers, 1990; Shin and Cho, 2005). Inpractice, it is necessary to handle the responses (i.e., drug releaserate and gelation rates) as time series data, which are called “time-oriented responses” in this study. The associated experimentalformat is shown in Table 2. x, yi, s2
i, and ti represent the vector
of input control factors, mean, variance, and time of data sam-pling, respectively. At each time ti, mean response yi and varianceresponse s2
ibased on the number of replications are shown in
Table 3.Response surface methodology (RSM) is a collection of math-
ematical and statistical techniques useful for modelling andanalyzing problems when the response of interest is influenced byseveral factors, and the objective is to optimize (either minimizeor maximize) this response. RSM is typically used to optimize theresponse by estimating an input-response functional form when
Table 2Experimental format for time-oriented responses.
Runs Input factors, x t1 t2 . . . ti . . . tm
y1 s21 y2 s2
2 . . . . . . yi s2i
. . . . . . ym s2m
1 Control factors y11 s211 y21 s2
21 . . . . . . yi1 s2i1
. . . . . . ym1 s2m1
2 y12 s212 y22 s2
22 . . . . . . yi2 s2i2
. . . . . . ym2 s2m2
. . . . . . . . . . . . . . . . . . . . . . . . . . . . . . . . . . . . . . .u y1u s2
1uy2u s2
2u. . . . . . yiu s2
iu. . . . . . ymu s2
mu
. . . . . . . . . . . . . . . . . . . . . . . . . . . . . . . . . . . . . . .n y1n s2
1ny2n s2
2n. . . . . . yin s2
in. . . . . . ymn s2
mn
Targets Tt1 Tt2 Tti Ttn
the exact functional relationship is not known or is very com-plicated (Box and Draper, 1987; Khuri and Cornell, 1987; Myersand Montgomery, 2002; Shin and Cho, 2009). To a comprehensivepresentation of RSM, Shin and Cho (2005) provided insightful com-ments on the current status and future direction of RSM. Using theoutput responses (i.e., mean responses yi and variance responsess2
i), the estimated response functions of the process mean and vari-
ance are given as
�i(x) = ˆ 0 + xT a+ xT A x (1)
∧�2
i (x) = ˆ 0 + xT b+ xT B x (2)
where
x =
⎡⎢⎢⎣x1x2...xk
⎤⎥⎥⎦ , a =
⎡⎢⎢⎣ˆ 1ˆ 2...ˆ k
⎤⎥⎥⎦ , A =
⎡⎢⎢⎣ˆ 11 ˆ 12/2/2 · · · ˆ 1k/2ˆ 12/2 ˆ 22 · · · ˆ 2k/2...
.... . .
...ˆ 1k/2 ˆ 2k/2 · · · ˆ kk
⎤⎥⎥⎦ ,
b =
⎡⎢⎢⎢⎣ˆ 1ˆ 2...ˆ
k
⎤⎥⎥⎥⎦ , B =
⎡⎢⎢⎢⎣ˆ 11 ˆ 12/2 · · · ˆ
1k/2ˆ 12/2 ˆ 22 · · · ˆ
2k/2...
.... . .
...ˆ
1k/2 ˆ2k/2 · · · ˆ
kk
⎤⎥⎥⎥⎦and where vector a and matrix A are the estimated regressioncoefficients for the process mean, and vector b and matrix B arethe estimated regression coefficients for the process variance. Theeventual objective of RSM is to determine optimal operating con-ditions (i.e., optimal control factor levels) for a system.
3.2. Proposed RD models based on RSM and time-orientedresponses
The proposed RD procedure consists of three stages: modelbuilding, robust design model selection, and optimization. Withstatic responses, RSM is utilized in the model building stage asdiscussed in the previous section. In this study, the time-orientedresponses need to be handled and the empirical models need to
Table 3Experimental format for each time ti .
Runs Input factors, x yi (replications) yi s2i
12...u
.
.
.n
Control factors
y11 y12 . . . y1v . . . y1r
y21 y22 . . . y2v . . . y2r
.
.
....
. . ....
.
.
....
yu1 yu2 . . . yuv . . . yur
.
.
.... . . .
.
.
.. . .
.
.
.yn1 yn2 . . . ynv . . . ynr
yi1
yi2
.
.
.yiu
.
.
.yin
s2i1
s2i2
.
.
.s2
iu
.
.
.s2
in

Author's personal copy
82 J.S. Park et al. / International Journal of Pharmaceutics 393 (2010) 79–87
be developed in the model building stage. Because of the featureof time series data, an empirical relationship between the time-oriented responses and control factors must be established.
The proposed analysis combines two directional approaches,such as vertical and horizontal approaches, because the response Yis a function of control factors and time, and the tentative relation-ship can be analyzed by both directions. In the vertical directionalapproach, letting Y = [Yc1, Yc2, . . . Ycm], which is the matrix of meanresponses where Yc1, Yc2, . . ., and Ycm denote mean column vec-tors of y1, y2, . . ., ym or variance column vectors of s2
1, s22, . . ., s2
min Table 2, each column of Y can be a function of design matrix X.In the horizontal directional approach, each row of Y becomes afunction of time t.
In the vertical directional approach, the general vertical form ofthe relationship between Y and X can be expressed as
Y =[
1 x1 x2 · · ·]×Mc (3)
where Mc denotes a matrix of parameters vertical analysis given asfollows:
Mc =[
mc1 mc2 · · · mcm
]= (XT X)
−1XT Y (4)
While vertical analysis can express the relationship betweenresponses Y and input control factors x represented by designmatrix X, horizontal analysis is also proposed to build the relation-ship between responses Y and time t. In the horizontal directionalapproach, if Y = [Yr1, Yr2, . . . Yrn] is the matrix of mean responseswhere Yr1, Yr2, . . . and Yrn represent row vectors of mean responsesor row vectors of variance responses in Table 2, Yr indicates a func-tion of t as following:
Y r =mr ×[
1 t · · ·]T
(5)
where the mean vector mr, represented by rows, can be estimatedas
mr = (XT X)−1
XT Y r . (6)
As a result, the general horizontal form of the relationship can bederived as follows:
Y =Mr mean ×[
1 t · · ·]T
(7)
where Mr mean = [mr1, mr2, · · ·, mrn]T is the transposed matrix ofparameters for horizontal analysis. Using Eqs. (3), (4) and (7), thetwo directional approaches can be combined into the followinggeneral relationship of Y as a function of x and t given that
Y (x, t) =[
1 x1 x2 · · ·]× (XT X)
−1XT Mr mean
[1 t · · ·
]T. (8)
Similarly, the empirical relationships between variance and inputcontrol factors are then developed. The functional form of variancemodel can be obtained as
S(x, t) =[
1 x1 x2 · · ·]× (XT X)
−1XT Mr var
[1 t · · ·
]T. (9)
Based on the general functional relationships of mean and variance,the next stage of the RD procedure focuses on RD model develop-ment in order to find the robust optimal solutions (i.e., the optimalfactor settings, x). The proposed RD optimization model based onp-norm and MSE concepts can be formulated as follows:
minimizem∑
i=1
(∣∣Y (x, ti)− T ti
∣∣)p +m∑
i=1
(∣∣S (x, ti)∣∣)p
S.t. x ∈˝
(10)
where Tti denotes the target value of responses (i.e., drug releaserate and gelation) and norm p = 2 in this study.
4. Results and discussion
4.1. Effects of PEG on the gelation of PEO matrix tablets
Generally, water-soluble excipients such as PEG in the tabletdissolve quickly before a tight gel layer can form on the surface,allowing water to penetrate into the inner matrix of the tablet andthus causing most of the inner matrix to gel. In order to investigatethe effects of PEG on the gelation of PEO matrix tablets, the diam-eters of the gelated and non-gelated parts of tablets with varyingratios of PEG in the formulations were measured; the gelation indexwas then calculated together with a target value (Table 4). The tar-get was selected after a lot of ‘in-house’ investigations. The gelationindex is the percentage of the tablet that has undergone gelationafter immersion. When a matrix tablet is exposed to the dissolu-tion medium, swelling, macromolecular changes in gel networks,takes place and expands the tablet surface. However, the effectiveswelling was limited only to the horizontal side of the tablet by theapplication of polyacrylate plates in this study.
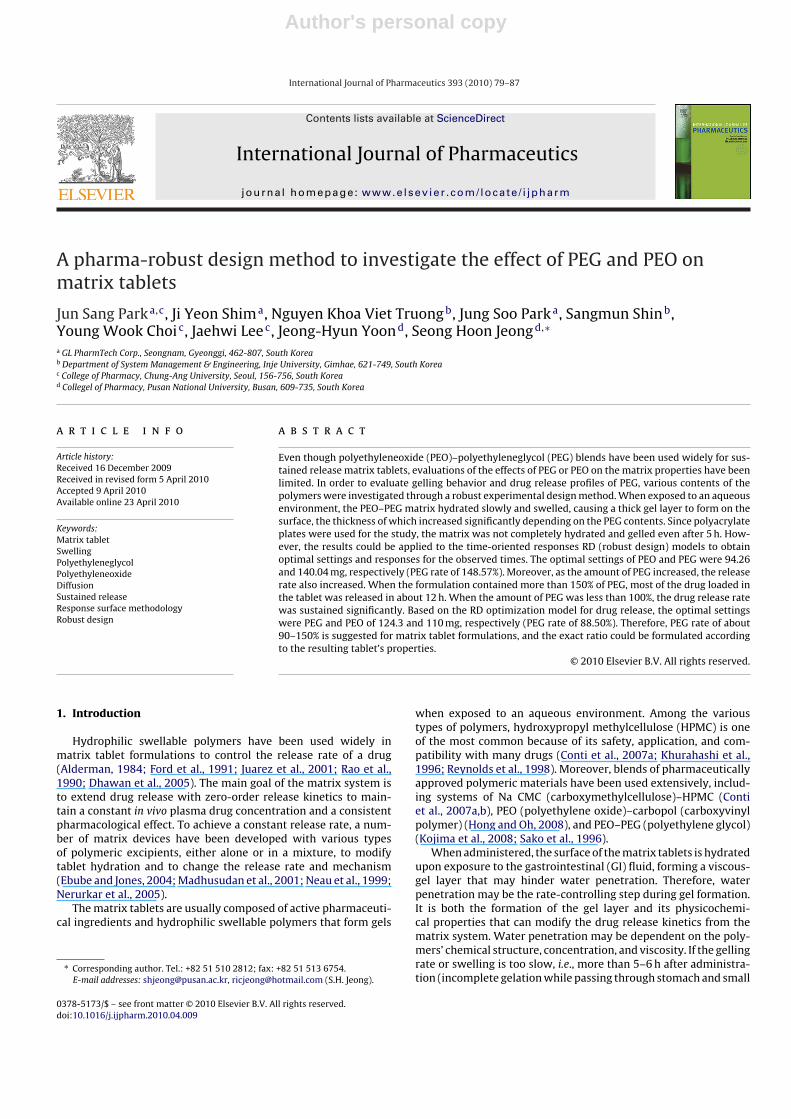
Upon contact with the medium, the matrix tablet hydratedslowly and swelled, causing a thick gel layer to form. Fig. 1 showspictures of the gelation using the polyacrylate plates from time 0 to4 h. The gel thickness increased significantly moving inward as thehydration progressed. Therefore, the dimensions of the solid coredecreased as shown in Fig. 2 and Table 4. However, due to the lim-ited area of actual swelling, the matrix was not completely hydratedor gelled, even after 5 h, in all the formulations (Figs. 1 and 2). Dueto the limited unidirectional contact of the dissolution medium,the gelation kinetics seemed to be very slow compared to thosein previous studies (Sako et al., 1996; Conti et al., 2007a,b). How-ever, it might be useful to understand and also differentiate variousformulations.
The swelling process took place rapidly after the first 30 min ofcontact with the dissolution medium (Fig. 2). However, after thefast initial swelling, the subsequent gelling kinetics was not fastenough for the tablets to gel completely. One plausible reason forthis was that the media penetration rate was faster at the beginningsince the fluid was in direct contact with the solid polymer. How-ever, once a viscous-gel layer had formed on the tablet surface, itcould serve as a barrier to media penetration, reducing disintegra-
Table 4Experimental results for the gelation study (gelation index, y, with standard deviation, s) depending on the amount of incorporated PEG in the matrix tablet formulations.
Runs PEG (%) PEO PEG 0.5 h 1 h 1.5 h 2 h 3 h 4 h 5 h
x1 x2 y1 s21 y2 s2
2 y3 s23 y4 s2
4 y5 s25 y6 s2
6 y7 s27
1 10 213.00 21.30 41.91 3.32 56.93 4.69 69.54 1.26 73.77 2.30 79.14 4.15 84.65 0.78 91.4 1.412 50 156.20 78.10 39.23 2.27 43.93 2.65 55.51 1.15 63.13 2.86 75.00 2.41 81.40 1.25 88.9 0.283 100 117.15 117.15 37.79 1.40 49.06 0.99 59.02 0.44 65.9 0.98 77.39 1.78 86.33 0.69 90.6 0.574 150 93.71 140.57 37.61 1.77 49.21 1.47 60.28 1.27 67.06 0.99 80.05 0.92 86.78 2.17 90.1 0.745 300 58.50 175.80 40.78 1.71 48.64 0.81 60.29 1.05 68.7 0.88 79.25 0.65 87.66 1.05 91.8 0.686 500 39.00 195.00 41.13 1.34 55.32 0.86 62.8 1.10 70.07 0.65 85.44 2.47 91.07 0.77 94.3 0.80
Targets 37.75 1.10 47.61 1.99 56.71 3.7 65.54 0.56 77.55 2.52 88.42 0.45 88.80 2.77
Author's personal copy
J.S. Park et al. / International Journal of Pharmaceutics 393 (2010) 79–87 83
Fig. 1. Pictures of the intact matrix tablet (A) in the polyacrylate plates and gelled tablets depending on time: (B) 1 h, (C) 2 h, and (D) 4 h.
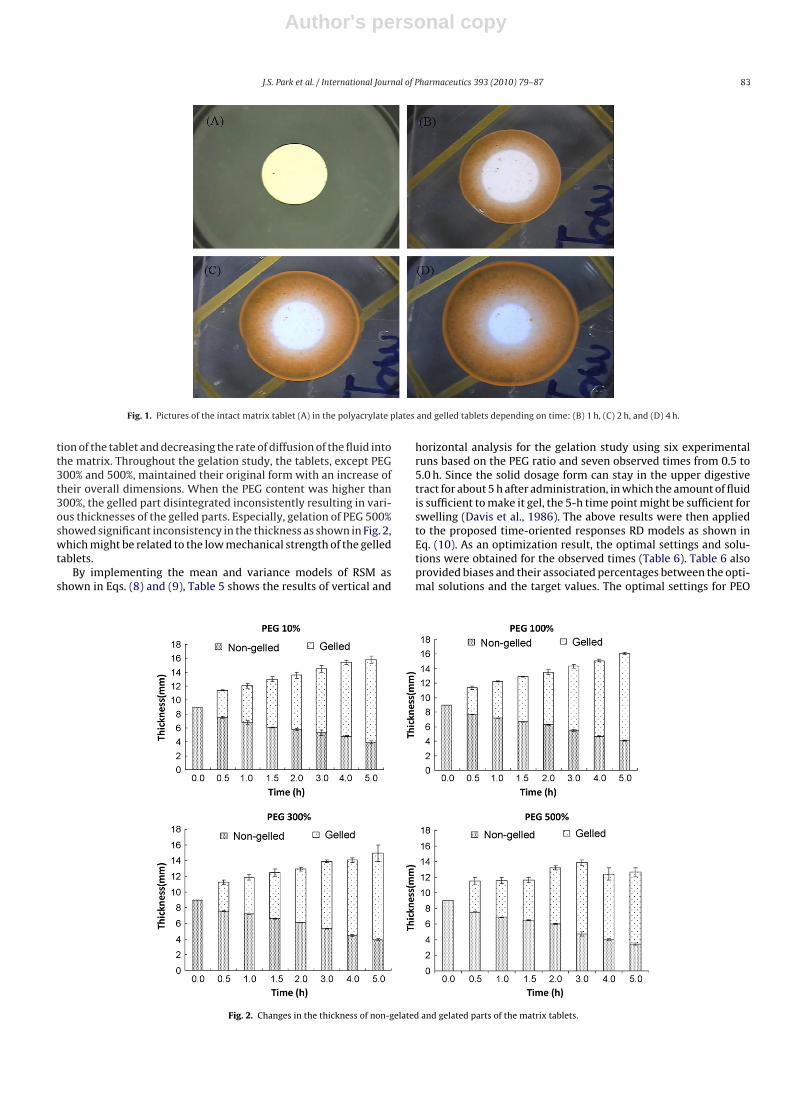
tion of the tablet and decreasing the rate of diffusion of the fluid intothe matrix. Throughout the gelation study, the tablets, except PEG300% and 500%, maintained their original form with an increase oftheir overall dimensions. When the PEG content was higher than300%, the gelled part disintegrated inconsistently resulting in vari-ous thicknesses of the gelled parts. Especially, gelation of PEG 500%showed significant inconsistency in the thickness as shown in Fig. 2,which might be related to the low mechanical strength of the gelledtablets.
By implementing the mean and variance models of RSM asshown in Eqs. (8) and (9), Table 5 shows the results of vertical and
horizontal analysis for the gelation study using six experimentalruns based on the PEG ratio and seven observed times from 0.5 to5.0 h. Since the solid dosage form can stay in the upper digestivetract for about 5 h after administration, in which the amount of fluidis sufficient to make it gel, the 5-h time point might be sufficient forswelling (Davis et al., 1986). The above results were then appliedto the proposed time-oriented responses RD models as shown inEq. (10). As an optimization result, the optimal settings and solu-tions were obtained for the observed times (Table 6). Table 6 alsoprovided biases and their associated percentages between the opti-mal solutions and the target values. The optimal settings for PEO
Fig. 2. Changes in the thickness of non-gelated and gelated parts of the matrix tablets.

Author's personal copy
84 J.S. Park et al. / International Journal of Pharmaceutics 393 (2010) 79–87
Table 5Results of vertical and horizontal analysis for the gelation study.
Observed times (h) Vertical analysis PEG/PEO (%) Horizontal analysis
R2 for mean model R2 for variance model R2 for mean model R2 for variance model
0.5 0.908(y1) 0.945(s21) 10(R1) 0.954 0.287
1.0 0.735(y2) 0.965(s22) 50(R2) 0.993 0.627
1.5 0.777(y3) 0.226(s23) 100(R3) 0.999 0.127
2.0 0.831(y4) 0.710(s24) 150(R4) 0.999 0.073
3.0 0.874(y5) 0.980(s25) 300(R5) 0.997 0.499
4.0 0.821(y6) 0.238(s26) 500(R6) 0.996 0.107
5.0 0.919(y7) 0.722(s27)
Table 6Optimal solutions for the gelation study.
RD model Optimal settings Optimal gelation rates (%) at observed times (h)
PEG/PEO (%) PEO (mg) PEG (mg) 0.5 h 1.0 h 1.5 h 2.0 h 3.0 h 4.0 h 5.0 h
MSE Model 148.57 94.26 140.04 38.06 48.25 57.34 65.32 77.99 86.25 90.10
Target values (%) 37.75 47.61 56.71 65.54 77.55 88.42 88.81
Bias 0.32 0.64 0.63 −0.21 0.44 −2.17 1.29
Bias (%) 0.84 1.34 1.11 −0.33 0.57 −2.46 1.45
and PEG were 94.26 and 140.04 mg, respectively, correspondingto a PEG rate of 148.57%. At these optimal settings, the optimalgelation rates can be estimated by utilizing the proposed modelfrom 0.5 to 5.0 h, in comparison to the target values. Fig. 3 clearlyillustrates that the optimal solutions had similar values comparedto the target values, which were internally selected after manyinvestigations over the observed times in this particular gelationstudy. In addition, Fig. 4 illustrates a three-dimensional relation-ship among gelation rates, PEG percentages, and observed times byusing a contour plot. Based on the contour lines representing three-dimensional surfaces of the gelation rates over time, dark diamonddots denote the optimal gelation rates.
4.2. In vitro drug release from matrix tablets
Fig. 5 shows the drug release profiles of the matrix tablets withvarying ratios of PEG to PEO. As the amount of PEG increased, therelease rate also increased. Both PEG and PEO can significantlyinfluence the dissolution rate of the system. When the formula-
Fig. 3. The optimal solutions vs. internal target values for the gelation study.
Fig. 4. Contour plot of gelation vs. PEG and time.
tion contained more than 150% PEG, most of the drug loaded in thetablet was released in about 12 h. Moreover, drug release profilesreached a plateau earlier as the amount of PEG increased. Whenthe amount of PEG was less than 100%, the drug release rate wassignificantly sustained near that of PEO. Since non-ionic PEO andPEG are independent of pH, the effect of pH in the release mediumwas insignificant (data not shown).
The mixture of the two polymers, used as a mechanical supportand a release modulator, enables easy modification of the systemdepending on the target release profiles. Interactions between PEOand PEG result in gel formation on the surface of the tablet, whichcan reduce the burst effect seen with typical matrix tablets. In thisstrategy, a combination of the two excipients can deliver the activeingredient at a nearly constant rate. The total amount of drug loadedin the matrices was released in about 24 h depending on the ratiobetween the two polymer excipients. The drug release rate wasnearly constant until 90% of the loaded drug was released and thekinetics of the release process were dependent on the amount ofPEG added.

Author's personal copy
J.S. Park et al. / International Journal of Pharmaceutics 393 (2010) 79–87 85
Fig. 5. Drug release profiles of the model drug in buffer at pH 6.8.
Both PEG and PEO can influence the dissolution rate of the sys-tem. In order to further investigate the dissolution profiles of theformulations, t20 and t80 were obtained and their values were t20(0.28, 1.25, 2.09, 2.10, 2.96, and 3.40 h) and t80 (2.08, 5.30, 9.50,11.98, 16.90, and 18.00 h) as the ratio of PEG increased from 10%to 500%. t20 and t80 were defined as the time needed by the sys-tems for the delivery of 20% and 80% of the total amount of drug
Table 7Evaluation of drug release kinetics.
PEG 10% PEG 50% PEG 100% PEG 300% PEG 500%
n 0.810 0.876 0.812 0.906 0.542k 0.605 7.650 11.170 17.013 52.268R2 0.998 0.999 0.999 0.997 1.000
incorporated into the tablet. As the amount of PEG increased, thet20 and t80 also increased. Unlike the PEG 300% and 500% formula-tions, tablets with PEG 10% and 50% showed similar release kineticsand the overall release rates of both were comparable. Moreover,formulations of PEG 100% and 150% showed comparable properties.
Similarity factor (f2 values) can be calculated to compare thedissolution profiles (Shah et al., 1998). The value ranges from 0 to100 and the higher values indicate more similarity between the twoprofiles. For example, when the two profiles are identical, f2 valuewill be 100. Taking PEG 10% as a reference batch, the f2 values ofPEG 50%, 100%, 150%, 300%, and 500% are 78.2, 41.7, 33.8, 22.0, and14.0, respectively. Compared to the data from the gelation study,differences among release profiles with changing ratios of PEG weremore significant. This might be related to the different effectivediffusion coefficients with different PEG and PEO contents, togetherwith disintegration of the gelled area. Further experiments on thediffusion properties are ongoing.
The mechanisms of drug release from the matrix system arecomplicated and might exhibit a combination of diffusion and/ormatrix erosion. Drug release from the system containing differ-ent ratio of PEG and PEO showed a good fit into the Korsmeyerrelationship (Table 7). For the tested formulations containing up
Table 8Experimental results of drug release study.
Hours 1 2 3 4 5 6 Internal targets
PEG 10%(100) PEG 50%(100) PEG 100%(100) PEG 150%(100) PEG 300%(100) PEG 500%(100)
y s y s y s y s y s y s
0.5 4.0 0.3 4.0 0.5 6.6 0.4 5.6 0.8 9.5 0.7 35.9 5.5 6.01.0 6.8 0.6 7.6 0.6 11.1 1.1 10.1 1.2 16.4 1.0 52.5 7.7 11.01.5 9.5 0.9 10.9 0.7 15.3 1.6 14.7 1.5 23.7 0.9 64.9 9.1 12.82.0 12.3 1.1 14.2 0.8 19.2 2.0 19.2 1.5 30.9 0.3 79.1 9.3 16.13.0 17.7 1.5 20.2 0.6 26.7 2.3 28.3 1.0 46.6 2.0 91.0 4.0 22.64.0 23.4 1.8 26.6 0.5 34.3 2.6 37.6 1.2 62.2 2.8 95.9 2.2 29.86.0 34.5 2.6 38.1 0.3 48.8 2.8 55.5 2.1 88.6 1.8 97.1 2.2 43.58.0 44.9 3.2 47.5 1.0 61.1 3.2 70.6 2.5 99.6 2.1 97.3 2.5 51.4
10.0 54.0 3.9 55.7 0.9 71.1 3.7 83.1 3.7 100.2 2.1 97.7 2.4 60.312.0 62.0 4.5 63.5 0.9 80.1 4.4 93.5 3.7 100.8 1.8 98.2 2.4 68.514.0 68.8 5.2 70.2 1.4 88.7 5.6 97.3 3.6 101.7 2.0 98.7 2.4 74.116.0 74.8 5.9 77.2 1.3 96.3 5.9 98.1 3.6 102.0 1.8 99.2 2.3 76.3
Table 9Results of vertical and horizontal analysis of the drug release study.
Observed times (h) Vertical analysis PEG/PEO (%) Horizontal analysis
R2 for mean model R2 for variance model R2 for mean model R2 for variance model
0.5 0.989(y1) 0.999(s21) 10(R1) 0.999 0.999
1.0 0.989(y2) 0.997(s22) 50(R2) 0.999 0.714
1.5 0.989(y3) 0.992(s23) 100(R3) 0.999 0.955
2.0 0.990(y4) 0.983(s24) 150(R4) 0.998 0.898
3.0 0.989(y5) 0.765(s25) 300(R5) 0.987 0.532
4.0 0.988(y6) 0.448(s26) 500(R6) 0.793 0.662
6.0 0.990(y7) 0.096(s27)
8.0 0.999(y8) 0.098(s28)
10.0 0.990(y9) 0.063(s29)
12.0 0.946(y10) 0.119(s210)
14.0 0.918(y11) 0.199(s211)
16.0 0.892(y12) 0.262(s212)

Author's personal copy
86 J.S. Park et al. / International Journal of Pharmaceutics 393 (2010) 79–87
Table 10Optimal solutions for drug release study.
RD model Optimal settings Optimal drug release rates (%) for observed times (h)
PEO (mg) PEG (mg) PEG/PEO (%) 0.5 h 1.0 h 1.5 h 2.0 h 3.0 h 4.0 h 6.0 h 8.0 h 10.0 h 12.0 h 14.0 h 16.0 h
MSE model 124.30 110.00 88.50 3.93 8.12 12.21 16.21 23.94 31.29 44.88 56.99 67.62 76.76 84.42 90.60
Targets values (%) 6.00 11.00 12.80 16.10 22.60 29.80 43.50 51.40 60.30 68.50 74.10 76.30
Bias 3.93 8.12 12.21 16.21 23.93 31.29 44.88 56.99 67.62 76.76 84.42 90.60
Bias (%) −34.45 −26.20 −4.60 0.70 5.91 4.99 3.17 10.87 12.13 12.06 13.93 18.74
to 300% PEG, the n exponent values ranged from 0.810 to 0.906,indicating that more than one release mechanism of the modeldrug from the matrices might be involved including matrix ero-sion and drug diffusion in the swollen area (Table 7). In these cases,the gel thicknesses were maintained constantly and the dissolutiontrend was close to zero-order transport. However, release profilesof PEG 500% showed an n-value of 0.542, indicating anomalous non-Fickian mechanism, suggesting that both diffusion of the drug in thegel layer and a macromolecular relaxation process affect the drugrelease profiles. Regarding the tablet structure, as the tablets swell,the drug diffusional path length increased and thus the drug releaserate decreased with time.
The experimental results of the drug release study are tabu-lated in Table 8 with mean and standard deviation values of sixdifferent PEG ratios and 12 observed time points. According to theobserved time points, the desired target values are also provided inthis table. Similar to Table 5 for the gelation study implementingthe mean and variance models of RSM, Table 9 shows the results ofboth vertical and horizontal analyses, including R2 values of meanand variance models for drug release. By using the RD optimiza-tion model for the drug release study as shown in Eq. (10), theoptimal PEO and PEG settings and the optimal drug release ratesbased on the specific times can be obtained (Table 10). Similar toTable 6, Table 10 provides that the optimal settings of PEG andPEO are 124.3 and 110 mg, respectively, which represent a PEGrate of 88.50%. Based on these optimal settings, the optimal drugrelease rates and their associated target values from the observedtimes from 0.5 to 16 h are given in Table 10, which also pro-vides biases and their associated percentages between the optimaldrug release rates and the target values. Fig. 6 shows the optimalresponses and the target values over the observed time points forthe drug release study. To illustrate the three-dimensional rela-
Fig. 6. The optimal solutions vs. target values for the drug release study.
Fig. 7. Contour plot of drug release rates vs. PEG and time.
tionship among drug release rate, PEG percentage, and observedtime, the associated contour plot is given in Fig. 7. Contour linesand dark diamond dots in Fig. 7 represent the surfaces of drugrelease rates and their associated optimal solutions over time. Con-trary to the optimum content of PEG (88.5%) based on the drugrelease study, the swelling study recommended an optimum con-tent of 148% PEG. Therefore, a PEG rate of 90–150% can safelybe suggested for matrix tablet formulations, and the formulationscientists would then be responsible for ‘fine-tuning’ the tablet for-mulations. Swelling kinetics and drug release profiles need to beconsidered simultaneously, together with the tablet’s mechanicalbehavior in vivo.
5. Conclusions
When exposed to an aqueous environment, PEO–PEG matrixtablets hydrated slowly and swelled, causing a thick gel layer toform on the surface. After swelling, the test tablets kept theiroverall integrity with an increase of their dimensions. As thecontent of soluble PEG increased, the swollen gel front disin-tegrated inconsistently due to the low mechanical strength ofthe gelled tablets. Since polyacrylate plates were applied forthe gelation study, the matrix was not completely hydratedand gelled even after 5 h. However, the gelation results wereapplied to the proposed time-oriented responses RD models, andthe optimal input control settings and responses for observedtimes were obtained. The optimal settings of PEO and PEG were94.26 and 140.04 mg, respectively, corresponding to a PEG rate of148.57%.
Moreover, as the amount of PEG increased, the release rate alsoincreased. When the formulation contained more than 150% PEG,most of the drug loaded in the tablet was released in about 12 h.When the amount of PEG was less than 100%, the drug release rate

Author's personal copy
J.S. Park et al. / International Journal of Pharmaceutics 393 (2010) 79–87 87
was significantly sustained near that of PEO. By using the RD opti-mization model for the drug release study, the optimal PEO andPEG settings and responses for the observed times were obtainedand the optimal settings of PEG and PEO were 124.3 and 110 mg,respectively, representing a PEG rate of 88.50%. Therefore, a PEGrate of 90–150% is suggested for matrix tablet formulations andthe exact ratio is dependent on the formulation’s properties.
Acknowledgements
This work was supported by the 2009 Specialization ProjectResearch Grant funded by Pusan National University. This workwas also supported by the Korea Science and Engineering Founda-tion (KOSEF) grant funded by the Korea government (MOST) (No.R01-2007-000-21070-0).
References
Alderman, D.A., 1984. A review of cellulose ethers in hydrophilic matrices for oralcontrolled release dosage forms. Int. J. Pharm. 5, 1–9.
Box, G.E.R., Draper, N.R., 1987. Empirical Model Building and Response Surfaces. JohnWiley & Sons Inc.
Conti, S., Maggi, L., Segale, L., Ochoa Machiste, E., Conte, U., Grenier, P., Vergnault,G., 2007a. Matrices containing NaCMC and HPMC 1. Dissolution performancecharacterization. Int. J. Pharm. 333, 136–142.
Conti, S., Maggi, L., Segale, L., Ochoa Machiste, E., Conte, U., Grenier, P., Vergnault, G.,2007b. Matrices containing NaCMC and HPMC 2. Swelling and release mecha-nism studies. Int. J. Pharm. 333, 143–151.
Davis, S.S., Hardy, J.G., Fera, J.W., 1986. Alimentary tract and pancreas: transit ofpharmaceutical dosage forms through the small intestine. Gut 27, 886–892.
Dhawan, S., Varma, M., Sinha, V.R., 2005. High molecular weight poly(ethyleneoxide)-based drug delivery systems. Part I: Hydrogels and hydrophilic systems.Pharm. Technol., 72–80.
Ebube, N.K., Jones, A.B., 2004. Sustained release of acetaminophen from hetero-geneous mixture of two hydrophilic non-ionic cellulose ether polymers. Int. J.Pharm. 272, 19–27.
Ford, J.L., Mitchell, K., Rowe, P., Armstrong, D.J., Elliott, P.N.C., Rostron, C., Hogan, J.E.,1991. Mathematical modeling of drug release from hydroxypropylmethylcellu-lose matrices: effect of temperature. Int. J. Pharm. 71, 95–104.
Hong, S.I., Oh, S.Y., 2008. Dissolution kinetics and physical characterization of three-layered tablet with poly(ethylene oxide) core matrix capped by carbopol. Int. J.Pharm. 356, 121–129.
Juarez, H., Rico, G., Villafuerte, L., 2001. Influence of admixed carboxymethylcellu-lose on release of 4-aminopyridine from hydroxypropyl methylcellulose matrixtablets. Int. J. Pharm. 216, 115–125.
Khurahashi, H., Kami, H., Sunada, H., 1996. Influence of physico-chemical proper-ties on drug release rate from hydroxypropylmethylcellulose matrices. Chem.Pharm. Bull. 44, 829–832.
Kojima, H., Yoshihara, K., Sawada, T., Kondo, H., Sako, K., 2008. Extended releaseof a large amount of highly water-soluble diltiazem hydrochloride by utilizingcounter polymer in polyethylene oxides (PEO)/polyethylene glycol (PEG) matrixtablets. Eur. J. Pharm. Biopharm. 70, 556–562.
Korsmeyer, R.W., Gurny, R., Doelker, E., Buri, P., Peppas, N.A., 1983. Mecha-nism of solute release from porous hydrophilic polymers. Int. J. Pharm. 15,25–35.
Khuri, A.I., Cornell, J.A., 1987. Response surface: design and analyses. Marcel Dekker,New York.
Madhusudan Rao, Y., Krishna Veni, J., Jayasagar, G., 2001. Formulation and evalua-tion of diclofenac sodium using hydrophilic matrices. Drug. Dev. Ind. Pharm. 27,759–766.
Myers, R.H., Montgomery, D.C., 2002. Response surface methodology, process andproduct optimization using design experiments. John Wiley & Sons Inc.
Neau, S.H., Howard, M.A., Claudius, J.S., Howard, D.R., 1999. The effect of aqueoussolubility of xanthine derivates on the release mechanism from ethylcellulosematrix tablets. Int. J. Pharm. 179, 97–105.
Nerurkar, J., Jun, H.W., Price, J.C., Park, M.O., 2005. Controlled release matrix tablet ofibuprofen using cellulose ethers and carrageenans: effect of formulation factorson dissolution rate. Eur. J. Pharm. Biopharm. 61, 56–68.
Peppas, N.A., 1983. A model of dissolution-controlled solute release from porousdrug delivery polymeric systems. J. Biomed. Mater. Res. 17, 1079–1087.
Rao, K.V.R., Devi, K.P., Buri, P., 1990. Influence of molecular size and water solubil-ity of the solute on its release from swelling and erosion controlled polymericmatrices. J. Control. Release 12, 133–141.
Reynolds, T.D., Gehrke, S.H., Hussain, A.S., Shenouda, L.S., 1998. Polymer erosionand drug release characterization of hydroxypropylmethylcellulose matrices. J.Pharm. Sci. 87, 1115–1123.
Ritger, P.L., Peppas, N.A., 1987. A simple equation for description of solute release.II. Fickian and anomalous release from swellable devices. J. Control. Release 5,37–42.
Sako, K., Nakashima, H., Sawada, T., Fukui, M., 1996. Relationship between gelationrate of controlled-release acetaminophen tablets containing polyethylene oxideand colonic drug release in dogs. Pharm. Res. 13, 594–598.
Shah, V.P., Tsong, Y., Sathe, P., Liu, J., 1998. In vitro dissolution profile comparison-statistics and analysis of the similarity factor, f2. Pharm. Res. 15, 889–896.
Shin, S.M., Cho, B.R., 2005. Bias-specified robust design optimization and an analyt-ical solutions. Comput. Ind. Eng. 48, 129–148.
Shin, S.M., Cho, B.R., 2009. Studies on a bi-objective robust design optimizationproblem. IIE Trans. 41, 957–968.
Vining, G.C., Myers, R.H., 1990. Combining Taguchi and response surface philoso-phies: a dual response design. J. Qual. Technol. 22, 38–45.
Copyright © 2022 FDOKUMEN