Technique de sécurité Monitoring technique - Powerautomation
Upload
khangminh22Category
view
1download
0
USING THE RANDOMIZED RESPONSE TECHNIQUE TO INVESTIGATE ILLEGAL FISHING AND CONTRIBUTE TO ABALONE MANAGEMENT IN
NORTHERN CALIFORNIA
by
Sara Grace Blank
Thesis
ENVIRONMENTAL STUDIES 593 [2008]
A 90 point thesis submitted to Victoria University of Wellington, as partial fulfilment for the degree of Master of Environmental Studies
School of Geography, Environment and Earth Sciences Victoria University of Wellington,
March, 2008


i
USING THE RANDOMIZED RESPONSE TECHNIQUE TO
INVESTIGATE ILLEGAL FISHING AND CONTRIBUTE TO ABALONE MANAGEMENT IN NORTHERN CALIFORNIA
Sara Grace Blank
ABSTRACT
Illegal fishing has detrimental environmental and social impacts, but these effects are difficult to mitigate without reliable estimates of fisher non-compliance. Methods used by fisheries managers to estimate illegal fishing often require indirect estimation of poaching using biological, economic, or sociological indicators. This study presents a unique application of the randomized response technique (RRT) for direct estimation of non-compliance in the Northern California recreational red abalone (Haliotis rufescens) fishery. Using an anonymous paper-based compliance and socio-demographic survey of recreational fishers in Sonoma and Mendocino Counties, I estimate 29% non-compliance with the daily take limit, 23% with the minimum size limit, 19% with licensing laws, and 15% with the annual take limit and among the general population. No significant relationship between the socio-demographic variables gathered (age, income, county of residence, fishing experience) and RRT survey responses indicates that no clear profile can be ascertained to help identify potential violators. However, visitors have higher non-compliance estimates for all regulations except daily take limits, for which an estimated 72% of locals violate vs. only 18% of visitors. These rule-specific violation estimates allow for the development of efficient management priorities, as managers may target specific measures or user groups. Further research should develop quantitative RRT estimates of illegal take, and explore violation drivers operating within the fisher population. Key words: randomized response technique (RRT); red abalone (Haliotis rufesens); illegal fishing; Northern California; environmental management

ii
Table of Contents Page Abstract Acknowledgments List of Figures List of Tables List of Equations
i iv v v vi
Chapter 1: Introduction 1.1 Introduction 1.2 Purpose of the Study 1.3 Conceptual Framework 1.4 Aims and Objectives
1.4.1 Aim 1.4.2 Objectives and Research Questions
1.5 Structure of Thesis
1 3 3 4 4 4 5
Chapter 2: Literature Review 2.1 Chapter Introduction 2.2 Illegal Abalone Fishing in Northern California
2.2.1 Non-Compliance Estimates 2.3 Introduction to the Red Abalone (Haliotis rufesens)
2.3.1 Biological Characteristics of H. rufesens 2.3.2 History of the California Abalone Fishery
2.4 Illegal Fishing 2.4.1 General Illegal Fishing Impacts 2.4.2 Means of Assessing Illegal Activities
2.5 Compliance Theory 2.5.1 Economic Management Theories
2.5.1.1 Deterrence Models 2.5.2 Normative Compliance Theories
2.5.2.1 Non-Monetary Compliance Incentives 2.5.3 Drivers of Illegal Behavior
2.6 Abalone Management Measures in Northern California 2.7 Information Gaps in Northern California
6 6 7 8
10 12 13 14 17 21 21 22 22 23 24 26 30
Chapter 3: Methodology
3.1 Chapter Introduction 3.2 Site Location 3.3 Survey – Objectives 1 and 2
3.3.1 Sample Design 3.3.2 The Randomized Response Technique 3.3.3 RRT Survey Data Collection
3.3.3.1 Recruitment 3.3.3.2 Survey Administration 3.3.3.3 Survey Instrument
3.3.4 Regulation Awareness Survey 3.4 Semi-Structured Interviews – Objective 3
3.4.1 Sample Design 3.4.2 Interview Data Collection
3.5 Data Analysis 3.5.1 Survey Data Analysis 5.5.2 Interview Data Analysis
32 32 35 35 36 39 39 41 43 45 46 46 47 48 48 50
iii
Chapter 4: Results and Analysis
4.1 Chapter Introduction 4.2 Outcomes From Semi-Structured Interviews 4.3 Fisher Survey Results
4.3.1 Response Rates 4.3.2 Respondent Socio-Demographics
4.3.2.1 Income 4.3.2.2 Ethnicity and Gender 4.3.2.3 Fishing Experience and Age
4.3.3 General RRT Results 4.3.4 Analysis of Variables
4.3.4.1 Locals vs. Visitors 4.3.4.2 Descriptive Statistics 4.3.4.3 Regression Analysis of Survey Variables
4.3.5 Fisher Awareness of Regulations
51 51 53 53 54 54 55 55 56 58 58 60 62 64
Chapter 5: Discussion and Conclusions
5.1 Chapter Introduction 5.2 Estimating Illegal Behavior to Prioritize Violations 5.3 Profiling Illegal Behavior to Aid Priority Setting
5.3.1 Fisher Awareness of Red Abalone Laws 5.3.2 Socio-Demographic Variables as Predictors of Non-Compliance 5.3.3 Locals vs. Visitor Illegal Behavior
5.4 Policy and Management Implications 5.4.1 Annual Limit Violations 5.4.2 Daily Limit Violations 5.4.3 Minimum Size Limit Violations
5.5 Recommendations for Management 5.5.1 Red Abalone Management in Northern California 5.5.2 Implications for Other Fisheries
5.6 Chapter Summary/Conclusions
67 67 70 70 72 73 74 74 76 77 78 79 81 81
Appendices
1. California Abalone Permit Report Card 2. Fisher Survey Site Schedule 3. Information Sheet for Survey Respondents 4. Example Fisher Survey 5. Semi-Structured Interview Information Sheet and Consent Form 6. Semi-Structured Interview Question Topics and Rating Question
84 85 86 87 89 91
References 92

iv
Acknowledgments
First and foremost I would like to thank my thesis advisor, Dr. Michael Gavin, for the tremendous amount of encouragement he has given me throughout this project. Success would not have been possible without your support. Thanks to Jennifer Solomon as well for helpful advice on the methodology.
I would also like to thank the wonderful people at the California Department of Fish and Game. In particular, I am grateful to Dr. Laura Rogers-Bennett, Peter Kalvass, and Gary Combes for sharing their time and expertise with me.
Furthermore, I could not have done this project without the help of my friends and loved ones. I am so grateful to my parents for being great role models, always encouraging me to set high goals for myself, and supporting me all the way. I would like to thank Chris, who was there for me throughout the whole emotional roller-coaster, and whose belief in me gave me strength. Special thanks to my two lovely research assistants, Kelly Thomasson and Joy Radecki, who made the research fun with great laughs and amazing food.
Finally, a big thanks to my friends and colleagues in the Environmental Studies program. Thanks to Hayley who put up with my endless complaints and questions in our office, and shared her astonishing expertise with MS Word. Thank you Amelie, Ernius, Grace, Kata, Nick, Patrick, and Tush, for the endless talks, laughs, rants, gossip, and cups of tea! And thanks to Odessa, whom I greatly missed this year.

v
List of Figures
Figure Figure Name Page
Figure 1.1 Conceptual Framework Illustration 4 Figure 1.2 Thesis Structure 5
Figure 2.1 Global Distribution of Haliotid Species 9
Figure 2.2 Haliotis rufescens 10 Figure 2.3 Fishing Compliance Drivers and Example Measures 25,75 Figure 3.1 California County Map 33 Figure 3.2 Survey Site Map 34 Figure 3.3 RRT Probability Grid 49 Figure 4.1 Average Incomes of Survey Respondents 54 Figure 4.2 Respondent Ethnicities 55
Figure 4.3 General RRT Results 57 Figure 4.4 RRT Results for “Locals” vs. “Visitors” 60 Figure 4.5 Fisher Awareness of Regulations 6
List of Tables
Table Table Name Page
Table 2.1 Biological Impacts of Illegal Fishing 15
Table 2.2 Social Impacts of Illegal Fishing 16
Table 2.3 Illegal Fishing Detection and Quantification Methods 19
Table 2.4 Deterrence-Based Tools for Managing Recreational Fisheries 28
Table 3.1 Survey Locations and Take Levels 35
Table 3.2 Randomized Response Technique Survey Questions 44,56
Table 4.1 Violation Encounter Frequencies of Warden Combes 52
Table 4.2 Respondent Age and Fishing Experience 56
Table 4.3 General Survey Results for RRT 57
Table 4.4 RRT Results for “Locals” vs. “Visitors” 59
Table 4.5 Descriptive Statistics of RRT Responses and Age 61
Table 4.6 Descriptive Statistics of RRT Responses and Seasons Fished 61
Table 4.7 Descriptive Statistics of RRT Responses and Times Fishing in 2006 62
Table 4.8 Backward Stepwise (Likelihood Ratio) Logistic Regression of RRT Variables
63
Table 4.9 Proportional Responses to Regulation Awareness Question 65 Table 4.10 Common Incorrect Responses to Limit Questions 65 Table 4.11 Source of Limit Information 66

vi
List of Equations
Equation Equation Name Reference Page
Equation 1 RRT Probability Equation Fox and Tracy (1986) 48
Equation 2 RRT Sample Variance Fox and Tracy (1986) 48

1
Chapter 1
Introduction
1.1 Introduction
Illegal and exploitative fishing practices are some of the greatest global threats
to marine ecosystems (New Zealand Ministry of Fisheries, 2006). Illegal fishing can
detrimentally affect affiliated species and habitats, reduce biodiversity, and jeopardize
the success of marine reserves (Pitcher et al., 2002; Turpie et al. 2003; Mak et al.,
2005; Fassen and Watts, 2007). Furthermore, social impacts may also result from
illegal take which can create tension in communities, threaten the livelihoods of law-
abiding fishers, and encourage crime (Tarr, 2000; Pitcher et al., 2002; Turpie et al.,
2003; Fassen and Watts, 2007) To counter this threat, different conservation
strategies have been implemented worldwide ranging from resource management
techniques based on traditional knowledge and customs to government-led Quota
Management Systems (McCay, 1980; da Silva, 2004). These conservation
mechanisms have various costs and benefits for marine biodiversity and must be
tailored specifically to each situation (Stefansson and Rosenberg, 2005). Fisheries
that manage only a single target species may overlook the impact of take on affiliated
species, while multi-species management is more complex and may require greater
enforcement and monitoring to ensure compliance (Hollowed et al., 2000).
Managers must weigh their conservation priorities to determine which management
tools are the most appropriate to the fishery.
One example of a fishery that continues to combat illegal fishing, despite
years of evolving management measures, is the North American red abalone (Haliotis
rufescens) fishery. Red abalone once extended from Mexico to Oregon, but due to
over-harvest and poor monitoring in the past, their range has been greatly reduced
(CDFG, 2005, 3-1). At present, the only red abalone fishery in California is the
recreational fishery north of San Francisco, but non-compliance with management
measures is adversely affecting the sustainability of the resource (CDFG, 2005). As
the Abalone Recovery and Management Plan (ARMP) states, “abalone poaching has

2
been a serious concern in California for decades and continues to have a major impact
on stocks” (CDFG, 2005, p. 3-9).
The main hurdle managers encounter when monitoring the recreational red
abalone fishery is the problem of estimating take, both legal and illegal. Legal take
estimates have wide confidence intervals due to low compliance with the requirement
to return abalone report-cards at the end of each season, and illegal take is only
roughly estimated based on enforcement data and periodic vehicle roadblocks
(CDFG, 2005; Rogers-Bennett, Sen. Biologist Specialist CDFG, pers. comm.,
December 21, 2007). Illegal take exacerbates the impact of the 35,000 recreational
fishers who legally take abalone each season in Northern California, yet there are
presently no limits to the number of fishers who may join the fishery (CDFG, 2005;
Kalvass and Geibel, 2006). Serial depletion has wiped out populations of several
abalone species around California throughout the last century (CDFG, 2005), and
there are already signs of depletion at heavily used red abalone sites (CDFG, 2007b).
As a result of increasing fishing pressure, legal take limits have been reduced several
times, which when combined with a high global market price for abalone meat, has
increased the incentive to poach (Karpov et al., 2000; CDFG, 2005). California
Department of Fish and Game (2005) states that, “poaching poses a threat to the
sustainable management of abalone because it cannot be quantified and has an impact
on both legally-fished and recovering stocks” (p. 3-9).
The problems faced by red abalone managers in Northern California are
typical of those faced by marine managers world-wide. As global pressure on marine
resources continues to grow, managers have often turned to economic models of
regulatory enforcement to combat the incentive to violate take limits (Hatcher et al.,
2000). These measures assume that stricter penalties and tighter enforcement of
environmental regulations will offset the economic incentives of illegal behavior
(Sumaila et al., 2006). Research has shown that these measures may work to deter
some individuals, but there will inevitably be violators if there is money to be made
from behaving illegally (Sumaila et al., 2006). Therefore, illegal resource use is
inseparably linked to marine management, and managers must seek methods for
estimating illegal activity which will give them the clearest information about its
extent and characteristics and allow them to set efficient priorities. Unfortunately,
there is no information available from the California red abalone fishery which
managers may use to gauge compliance with these measures.
3
1.2 Purpose of the Study
This thesis will present a case study of illegal fishing using the red abalone
(Haliotis rufescens) in Northern California as the focal species. It will seek to
contribute to the effectiveness of the tools available to resource managers for
estimating non-compliance, by presenting a unique application of the randomized
response technique to a marine fishery. Primary data estimating violation rates will
be presented for several regulatory measures, and these findings will be analyzed
against fisher socio-demographic variables. The results will suggest methods and
policies that may improve the ability of the California Department of Fish and Game
to assess and influence non-compliance, and could be generally used by resource
managers for priority setting, conservation, and monitoring.
1.3 Conceptual Framework
This thesis was designed using Creswell’s (2003) model of research
conceptualization. A problem-centered approach to method design was considered
the most appropriate towards investigating the problem of illegal marine resource use.
The research was approached from a pragmatic theoretical perspective which allowed
for the use of mixed methods research tools that could be readily put in to practice.
Pragmatism, which derives from the theoretical work of Peirce (1965), Mead (1938),
James (1907), and Dewey (1931) gives researchers freedom to choose tools from
quantitative and qualitative research in order to gain the best understanding of the
research problem (Cherryholmes, 1992; Creswell, 2003). The mixed methods format,
and the use of sequential procedures, allowed the study to begin with a quantitative
method where statistical analysis was conducted on survey data to examine levels of
compliance with current laws related to recreational red abalone fishing, and end with
the qualitative method of semi-structured interviews to examine expert opinions on
the implications of non-compliance for the management of the species.
The research and analysis is grounded in the literature surrounding illegal
marine resource use and detection, the history of the red abalone fishery of Northern
California, and the randomized response technique (see Figure 1.1). While there is
some literature which addresses both RRT and illegal resource use, this is the first
study to apply the method to an abalone fishery. The literature from these three areas

4
is used to ensure that any recommendations which result from the research are in line
with the physical limitations of the fishery and the abilities of the management
regime. In the context of this research it is accepted that managers have widely relied
on deterrence models of compliance, which are based on economic theories of
exclusion and property rights (Hardin, 1968; Hatcher et al., 2000; Sumaila et al.,
2006). Therefore, the analysis and recommendations of this thesis will seek to be
readily achievable under the most recently adopted regulatory framework: the
Abalone Recovery and Management Plan (CDFG, 2005).
Figure 1.1: Conceptual Framework Illustration
1.4 Aims and Objectives
1.4.1 Aim
Estimate rates of non-compliance with fishing regulations for red abalone
(Haliotis rufescens) in Northern California and discuss possible management
implications.
1.4.2 Objectives and Research Questions Objective 1: Utilize the Randomized Response Technique (RRT) to estimate
proportions of non-compliance of recreational fishers in the red abalone (Haliotis
rufescens) fishery of Northern California, and analyze socio-demographic variables
which may affect those proportions.
Research Question 1.1: How do local abalone fishers compare to visiting
fishers in terms of violation proportions?
Research Question 1.2: Does a certain sector of the recreational fishing
population engage in illegal red abalone take more than others?

5
Objective 2: Analyze the level of fisher awareness of abalone law.
Research Question 2.1: What is the level of awareness of red abalone
regulations amongst abalone fishers?
Research Question 2.2: How does awareness of abalone regulations affect the
likelihood of violation?
Objective 3: Address the policy and management implications of data on rates of
non-compliance for abalone management in Northern California.
1.5 Structure of the Thesis
This thesis is organized as illustrated in Figure 1.2. The aims and objectives
from this chapter inform the selection of material that is included in the literature
review. As the conceptual framework describes, literature from three focus areas is
explored to give context to the findings of this study. These areas are illegal resource
use and management, the methodological literature on the randomized response
technique, and the literature pertaining to red abalone (Haliotis rufescens) in Northern
California. The methods used in this study are tailored to the aims and objectives,
bearing in mind the methodologies used in previous fishery studies. Two methods are
used: a paper-based survey of recreational abalone fishers, and semi-structured
interviews with abalone experts. The findings of these two methods are presented in
Chapter 4: Results and Analysis. Finally, Chapter 5: Discussion and Conclusions,
presents the findings in the light of the objectives, providing interpretation and insight
from the literature review.
Figure 1.2 Thesis Structure
Chapter 1: Introduction
Chapter 2: Literature Review
Chapter 3: Methodology
Survey Semi-Structured Interview
Chapter 4: Results and Analysis
Chapter 5: Discussion and Conclusions

6
Chapter 2
Literature Review
2.1 Chapter Introduction
Previous research relevant to this study has focused on illegal resource and
fishing issues, management, and compliance. This chapter will begin by introducing
the issue of illegal abalone fishing in Northern California, discussing the problems
associated with creating estimates of illegal take, and presenting the benefits of such
an estimate for this and other fisheries. The life history of red abalone (Haliotis
rufescens) and a brief history of the California abalone fishery will be discussed,
illustrating the vulnerability of abalone to fishing pressure. The impacts of illegal
fishing on abalone fisheries will be discussed, and a discussion of the biological and
social impacts of illegal take in general will illustrate the importance of assessing and
controlling non-compliance. A brief description of the methods which have been
used by managers to estimate non-compliance, and the limitations of those methods,
will illustrate the complexity of the issues which managers must consider. Finally,
there will be a discussion of compliance theory, the drivers that affect the decision to
violate, and how these are affected by management. The chapter will conclude with a
description of the measures currently used to regulate red abalone in Northern
California, and management information gaps.
2.2 Illegal Abalone Fishing in Northern California According to the Abalone Recovery and Management Plan (ARMP) of the
California Department of Fish and Game (2005), illegal fishing “has been a serious
concern for decades and continues to have a major impact on abalone stocks” (p. 3-9).
The ARMP describes illegal take as being perpetrated by two groups of violators
(CDFG, 2005). The first type are commercial poachers, who take abalone to sell as
part of illegal commercialization rings (CDFG, 2005). The second group are

7
recreational fishers who violate abalone regulations unknowingly, for personal
consumption, or to give the animals to other individuals without engaging with the
market (CDFG, 2005). Enforcement personnel in northern California continue to
report encounters with both types of violators, indicating non-compliance with
abalone regulations is prevalent (CDFG, 2005). As a result, enforcement effort has
been increased in Northern California, and the Department of Fish and Game,
“expends considerable funding and effort towards enforcement of fishing regulations,
including abalone fishing” (CDFG, 2005, p. 3-10). Unfortunately, the success or
failure of enforcement effort is difficult to determine, because attempts to estimate the
level of illegal abalone fishing have been limited.
2.2.1 Non-Compliance Estimates
Efforts to examine illegal take levels are generally restricted by the difficulty
in contacting violators. Poachers who collect large quantities of abalone for illegal
commercialization make up an extremely small proportion of the fisher population
and are highly evasive (CDFG, 2005). Enforcement officers generally cannot observe
the illegal activities of commercial poachers in the field because they can not predict
“how, when and where they conduct their illegal activities” (CDFG, 2005, p. 3-10).
As a result of the difficulty in contacting this group “a reliable estimate of the amount
of [commercial] poaching is not available, though crude estimates have been made
from warden intercept data” (CDFG, 2005, p. F-12).
Encounters with recreational fishers who have violated for non-commercial
purposed are far more common than encounters with commercially-motivated
poachers (CDFG, 2005). Recreational fishers who fall under the second category of
violators are easily contacted, and frequently cited by wardens in the field and at
periodic vehicle checkpoints (Riske, 2003; Riske 2006). Data collected from the
roadblocks are used to calculate the percentage of violations on an annual basis, but as
the ARMP explains, “these contacts are not truly random (checkpoints, for example
are announced in the media ahead of time), thus they cannot be used to accurately
estimate illegal take” (CDFG, 2005, p 3-10). Therefore, though recreational fishers
can be readily accessed, no method has yet been developed to accurately estimate the
proportion of non-compliance in this fishery.

8
The development of a non-compliance estimate would enrich management’s
understanding of the characteristics of recreational fishing in Northern California
(Rogers-Bennett, Biologist Specialist, pers. comm., 2007). It would allow managers
to consider the possible impacts illegal take may have on the sustainability of red
abalone populations, and give them more information to draw from when setting
priorities and reviewing regulatory measures (Sumaila et al., 2006). Additionally,
data about what regulations are most subject to non-compliance could help the
managers in Northern California to better understand their fisher population, and
which management tools could help reduce illegal behavior (Furlong, 1991;
Hønneland, 1999).
Furthermore, the problems faced by managers in the red abalone fishery are
typical of those faced worldwide. In order to maintain take at sustainable levels, all
resource managers must attempt to assess the status of stocks by looking at catch and
effort statistics, but “the underreporting of illegal catches results in the absence of a
significant part of the annual catch that is not included in the assessment and [this]
results in distorted estimates of sustainable catches” (Sumaila et al., 2006, p. 296). As
a result, managers who cannot accurately estimate non-compliance must operate with
insufficient information, and stock estimates for their fisheries are plagued with high
levels of uncertainty (Stefansson and Rosenberg, 2005). In the case of abalone, which
inhabit largely similar habitats around the world, and exhibit many of the same
biological vulnerabilities to over-harvest, methods used in one location may be
effective internationally.
2.3 Introduction to the Red Abalone (Haliotis rufescens)
Abalone are a genus (Haliotis) which inhabit rocky shores in waters all over
the globe (Hahn, 1989; Geiger, 2000) (See Figure 2.1). Worldwide, there are over
100 species of abalone (Russell, 2004). These species serve an important role in
maintaining community structure within their habitats through herbivory and by
providing an important food source for fish, cephalopods, asteroids, and crustaceans
(Scheibling, 1994; Russell, 2004).

9
Figure 2.1 Global Distribution of Haliotid Species (From: Russell, 2004)
Abalone meat is widely consumed by humans, and is considered a delicacy in
many cultures, particularly in Asia (Lichfield, 2005; Green, 2007). The biggest
commercial catches and export figures for abalone come from South Africa, New
Zealand, and the Mediterranean (Tarr, 2000; Huchette and Clavier, 2004; Russell,
2004). However, nations around the world are restricting legal commercial catch with
quotas, in order to decrease fishing pressure on abalone species and avoid population
collapse (Sanders and Beinssen, 1998; Tarr, 2000; Huchette and Clavier, 2004;
Lichfield, 2005; Green, 2007). Unfortunately, as a result of reduced supply, the
global price of abalone meat and shell products has increased ten-fold in the last two
decades, and abalone meat now sells at a higher wholesale price than lobster
(Lichfield, 2005; Green, 2007). Illegal fishing is rampant, exacerbated by restrictive
quota systems, high demand, and black market incentives (Tarr, 2000). As a result,
the conservation status of abalone species is mixed, and decades after the closure of
several commercial fisheries, many species still suffer from serial depletion (Tarr,
2000; Huchette and Clavier, 2004; CDFG, 2005). Abalone have sensitive life cycles,
and require heavy monitoring by managers to avoid population collapses such as
those which have occurred in many historical commercial abalone fisheries (Tegner et
al., 1992; CDFG, 2005; Lichfield, 2005).

10
2.3.1 Biological Characteristics of H. rufescens
The red abalone (Haliotis rufescens) is one of eight species of abalone found
in Californian waters, and can grow to a maximum of 313 mm (see Figure 2.2)
(CDFG, 2005; Leaf et al., 2007; CDFG, 2007a). The Abalone Recovery and
Management Plan states, “the regular appearance of red abalone in the commercial
landings, as compared to some of the other species, may be a reflection of differences
in distribution and vulnerability to take” (CDFG, 2005, p. 3-3). However, even
though H. rufescens is the largest marine gastropod in California and has the broadest
depth range of commercially fished abalone (0-30 meters), their physiology and
reproductive strategy make them quite vulnerable to predation and fishing (CDFG,
2005). These biological vulnerabilities limit the ability of many abalone species to
withstand the impacts of poaching, or a commercial or recreational fishery (Brown,
1986; Ward, 1986; Clavier, 1992; Tarr, 2000).
Figure 2.2 Haliotis rufescens (From: Haaker et al., 1986)
The first biological trait of red abalone that makes them vulnerable to fishing
is their slow rate of growth. Red abalone can live in excess of 30 years, and are
characterized by slow growth throughout their life cycle (CDFG, 2007b, p. 1). They
feed by grazing on fragments of kelp that are delivered by currents or surge, and are
mainly associated with the giant kelp, Macrocystis pyrifera (Cox. 1962; Vilchis et al.,
2005). Vilchis et al. (2005) found the growth of red abalone is limited by water
temperature, because warm water reduces kelp densities and increases the prevalence
of Withering Syndrome (“Canidatus Xenohaliotids californiensis”), a fatal abalone

11
disease (Friedman et al, 2000; Bower, 2003). Abalone growth is also affected by
other external natural events such as the “frequency and intensity of El Niño Southern
Oscillation (ENSO) phenomena,” and anthropogenic effects such as pollution (Vilchis
et al., 2005, p. 469). As a result of the inherently slow growth rates of red abalone,
and their sensitivity to environmental conditions, it can take 6-8 years for an
individual to reach sexual maturity (Vilchis et al., 2005).
High mortality rates among young abalone reduce the number of recruits that
survive to adulthood, making the population vulnerable to further sources of mortality
(CDFG, 2007b, p. 1). Small abalone live in crevice habitats and are preyed upon by
benthic invertebrates such as octopus, sea stars, and crabs (Leaf et al., 2007).
Predation mortality decreases as individuals increase in size, but slow growth rates
mean red abalone are at a vulnerable size for many years (Leaf et al., 2007). Adults
enjoy less predation despite their choice of more exposed habitats, because they are
more mobile, better at adhering to substrates, and more difficult for predators to
handle (Leaf et al., 2007).
As natural predation tapers off, recreational fishing mortality begins to be a
major source of adult abalone mortality in Northern California, especially in southern
Sonoma County (Fanshawe et al., 2003; Leaf et al., 2007). Fishing can result in both
intentional and incidental abalone mortality. Abalone are vulnerable to incidental
fishing mortality because their blood does not clot, so cuts on the foot deeper than ½
inch are usually fatal, as are cuts around the head (CDFG, 2007b). Lacerations
commonly occur while the animals are being removed from rock, and abalone often
die even when a rounded pry iron is used (Cox, 1962; CDFG, 2007b). Improper
replacement of abalone not retained by fishers is another common cause of incidental
death (Cox, 1962; CDFG, 2007b). Abalone need a hard substrate to adhere to in order
to be mobile, and if they are knocked or dropped onto a soft surface (such as sand)
they will be unable to clamp down or right themselves, resulting in death or predation
(Cox, 1962; CDFG, 2007b).
Fishing mortality can also adversely impact abalone recruitment, because
abalone employ a reproductive strategy that is density-dependent (Vilchis et al.,
2005). Abalone are characterized by low reproductive success because they release
eggs and sperm into the water during synchronized spawning events, and if mating
individuals are more than one to two meters apart, fertilization is highly unsuccessful
(Tegner et al., 1996; CDFG, 2005). Abalone residing in shallow aggregations

12
generally have higher fertilization success than more dispersed deep water
populations, but these shallow aggregates are more vulnerable to fishing mortality
(Tarr, 2000). A management plan which incorporates recreational fishing must
maintain adequate adult densities to ensure larval production (Vilchis et al., 2005).
If fishing pushes the abalone population under a certain minimum density threshold,
the remaining abalone will not be able to produce enough recruits to replace the
individuals being removed and account for natural mortality rates, resulting in serial
depletion (CDFG, 2005). Red abalone managers must therefore perform frequent
biological surveys of abalone population densities at multiple locations in order to
prevent the rapid declines seen in the other California species (Tarr, 2000; CDFG,
2005).
Furthermore, managers must also consider the size of abalone being removed
from the fishery to ensure adequate recruitment, because the reproductive capacity of
an individual red abalone is linked to their size. As Rogers-Bennett et al. (2004, p.
553) explain, “management strategies such as minimum legal sizes depend on
reproduction occurring prior to the onset of fishing”, but the reproductive physiology
of red abalone makes setting an appropriate minimum size limit difficult, because size
is related to fertility. Egg production in females increases exponentially with size
from 50mm to 215 mm (Rogers-Bennett et al., 2004). This trait poses another
challenge to managers, because in the short term, the removal of large adults will have
a greater negative effect on recruitment than if fishers targeted the sub-adult
population. However, there will be fewer large adults in the future if sub-adults are
targeted by fishers now.
2.3.2 History of the California Abalone Fishery
Due to their sensitive physiology abalone populations can take decades to
recover from a fishery-induced collapse, as has been seen with the black and pink
abalone of California (CDFG, 2005). Long before colonization by Europeans,
abalones were an important source of food and trade for the native people of
California (Cox, 1962). During this time the abalones’ natural predator, the sea otter,
ranged the entire length of the California coastline keeping abalone populations down.
However, European colonization, and the subsequent boom in fur trading meant that
by the mid-1800’s there were virtually no sea otters remaining along the California

13
coast (Cox, 1962). The removal of the abalones’ main predator resulted in a
population boom of all the Californian abalone species throughout the fur trade era,
allowing a commercial fishery to develop (CDFG, 2005).
The commercial abalone fishery of California was unstable from very early
on, with landings of both green abalone (Haliotis fulgens) and black abalone (Haliotis
cracherodii) peaking in 1879 and collapsing by 1913 (Edwards, 1913; Cox, 1962).
Fishing data from mandatory landing receipts from 1950 to 1996 showed that the
1940’s were generally characterized by increased commercial landings (CDFG,
2005). However, “the patterns observed in combined landings mask[ed] patterns of
the individual species landings…[so that] apparent stability from 1952 to 1968 was in
fact an illusion composed of multiple species landings in multiple fishing areas”
(CDFG, 2005, p. 3-3).
The misinformation provided by combined landing reports masked the serial
decline of each of California’s abalone species (CDFG, 2005). There were also
occasional sharp increases and decreases in landings, but these coincided with
increased or decreased legal size limits, and did not reflect the status of the abalone
species (CDFG, 2005). In the last years of the commercial abalone fishery, from
1987-1997, most abalone species were at very low population levels (CDFG, 2005).
Fishers had joint sea urchin/abalone harvest permits, which allowed them to bolster
business by mainly landing urchins, while still taking abalone when they would find
them (Dugan & Davis, 1993; CDFG, 2005). The commercial abalone fishery in
California was finally closed in 1997 (CDFG; 2005).
2.4 Illegal Fishing
Throughout the many phases of abalone management in California there have
always been fishers engaging in illegal harvest. In one of the only articles to directly
address the severity of non-compliance in Northern California’s abalone fishery,
Daniels and Floren (1998) use anecdotal accounts from enforcement officers,
newspaper reports, and court documents to illustrate the level of illegal take just prior
to, and just after the commercial fishing ban took effect. These sources document the
pervasive illegal activity in Northern California. Daniels and Floren (1998) claim
“the one-day, tax-free earning potential of an unrestrained poacher easily exceeds

14
$3,000…[and in Northern California it] is common enough to be seen by any
interested observer” (p. 859). The most obvious displays of illegal fishing behavior
are those of recreational sport fishers who violate size and quantity limits, but more
elusive networks of poachers are also periodically busted by enforcement (Daniels
and Floren, 1998; CDFG, 2005). A decade after commercial fishing was outlawed in
all Californian waters, these poaching rings continue to have black market trade links
to local restaurants and seafood markets that will buy abalone meat from fishers with
sport licenses rather than paying more for legally farmed abalone meat (Daniels and
Floren, 1998; Rogers-Bennett and Melvin, 2007).
Unfortunately, illegal take of red abalone has not been sufficiently
documented in the literature beyond anecdotal accounts from the media and best-
guess estimates from enforcement (CDFG, 2005). As is the case in many nations
around the world, there are currently no reliable statistics for this fishery which allow
for the accurate estimation of illegal take (CDFG, 2005; Lichfield, 2005). Instead, the
most comprehensive quantitative study of illegal abalone take comes from Rob Tarr’s
(2000) research into poaching in South Africa.
South Africa suffers from extraordinarily high levels of illegal take, and Tarr
(2000) used economic modeling methods to estimate that up to twice as much abalone
was exported to Asia from South Africa as was allowed under the commercial quota.
This level of take is clearly unsustainable, and as a result marine biologists have
predicted abalone in South Africa will soon be all but extinct (Tarr, 2000; Lichfield,
2005). Tarr’s (2000), accounts of armed confrontations between poachers and
enforcement officers, and the extreme fishing effort in South Africa, reflect both the
high monetary benefits of abalone poaching, and the significant biological and social
impacts that often result from illegal fishing (Pauly et al., 2002). In order to better
understand the seriousness of these impacts in Northern California, it is useful to
examine the broader literature on the ramifications of illegal fishing in general.
2.4.1 General Illegal Fishing Impacts
Illegal fishing is widely viewed as a major threat to the sustainable
management of marine resources in general, because research has shown that illegal
fishing can have impacts on both the biological sustainability of ecosystems and
species, and on the social networks that rely on these resources (Tarr, 2000; Pauly et

15
al., 2002). While this discussion will not provide a comprehensive list of effects, it
discusses some illegal fishing impacts that are illustrative of the general trends of this
activity. These impacts are summarized in Tables 2.1 and 2.2 below.
Table 2.1: Biological Impacts of Illegal Fishing
Biological Impacts Example Case Studies
Transformation of natural vegetation
- Turpie et al., 2003 - multiple marine species, South Africa
- Estes and Duggins, 1995 – sea otters and giant kelp, Alaska, U.S.
Population reductions of target and affiliated marine species
- Turpie et al., 2003 - multiple marine species, South Africa
- Faasen and Watts, 2007 - multiple marine species, South Africa
- Tarr, 2000 - abalone (Haliotis midae), South Africa
Impacts on related species, ecosystem changes, and pollution.
- Pitcher et al., 2002 - multiple case studies - Edirisinghe, 2003 - reef fish, Sri Lanka - Mak et al., 2005 – reef fish, Philippines - Sterckx et al., 2006 - coral reefs, Indonesia
Reduced marine reserve success and threats to species sustainability
- Faasen and Watts, 2007 - multiple marine species, South Africa
- Fanshawe et al., 2003 – abalone and sea otters, California, U.S.
Reduction in option value of biodiversity
- Turpie et al., 2003 – multiple marine species, South Africa
- Edirisinghe, 2003 – reef fish, Sri Lanka
Illegal fishing has had enormous biological impacts on the marine
environment on both localized and global scales. On a local level, illegal take has
been blamed for undermining the success of marine reserves and sanctuaries, thereby
putting further pressure on recovering populations (Tarr, 2000; Faasen and Watts,
2007). Studies have found that fishing can have impacts similar to predation on
recovering species, effectively doubling mortality rates and impeding their recovery
(Fanshawe et al., 2003). Other localized events, such as habitat transformation, can
also result from the illegal exploitation of resources (Estes and Duggins, 1995).
Turpie et al. (2003) found that illegal resource use had transformed the natural
vegetation along a coastal area in South Africa. In addition, Tarr (1996) reported that
as abalone poaching increased, an ecological change occurred whereby large numbers
of rock lobsters moved into the kelp forest and consumed the entire population of sea
urchins. The loss of the sea urchins had further negative consequences for juvenile

16
abalone (H. midae), that use urchin spines for shelter in areas with few protective
crevice habitats (Tarr, 1996).
Illegal fishing can also result in biological impacts on a global level. Pitcher
et al. (2002) used case studies of Iceland and Morocco to describe instances where
large volumes of non-target species were being illegally discarded as bycatch, despite
laws prohibiting this practice. “High-grading”, as it is known, is meant to increase the
amount of high-value fish vessels can land, while still appearing to remain within the
limits of the legal catch quotas. The practice of discarding fish that are not of the
target species as bycatch is banned in many fisheries, and has been widely
documented to upset the food web and result in impacts on other species (Pauly et al.,
2002; Pitcher et al., 2002). Similar impacts are also seen with other illegal fishing
methods, such as using cyanide or dynamite, which also result in damage to
ecosystems, high mortality of non-target species, and pollution (Edirisinghe, 2003;
Mak et al., 2005; Sterckx et al., 2006).
Table 2.2: Social Impacts of Illegal Fishing
Social Impacts Example Case Study A declining natural environment
threatens regional economies based on eco-tourism.
- Turpie et al., 2003 - multiple marine species, South Africa
Massive poaching can lead to a reduction in the legal commercial quota,
reducing the income of legal abalone fishers.
- Turpie et al., 2003 - multiple coastal marine species, South Africa
- Tarr; 2000 – abalone (Haliotis midae), South Africa
Poaching creates conflict between managers and local people
- Faasen and Watts, 2007 - multiple marine species, South Africa
- Tarr, 2000 - abalone (Haliotis midae), South Africa - Hauck and Sweijd, 1999 – abalone (Haliotis
midae), South Africa
Illegal fishing is not monitored, and can result in poor food quality.
- Pitcher et al., 2002 - multiple case studies
Black market economies develop, creating further enforcement issues and
higher crime rates.
- Pitcher et al., 2002 - multiple case studies - Hauck and Sweijd, 1999 – abalone (Haliotis
midae), South Africa
Though the biological impacts are significant, it is important to note that
illegal fishing also has significant social impacts (See Table 2.2 above). The
communities that depend on marine resources are invariably affected when illegal
fishing degrades them (Turpie et al., 2003). In a case study from South Africa Faasen

17
and Watts (2007) found that social unrest and resentment toward conservation
officials has become a major problem. The local people have recently been excluded
from using marine resources because of the establishment of a marine reserve at
Tsitsikamma National Park. However, because the local community suffers from
racial discrimination and language barriers to employment, they rely on illegal fishing
to supplement their diet. This is just one of many examples of illegal fishing causing
social conflict between fishers, reserve managers, and compliant citizens (Tarr, 2000).
Beyond simply creating social tension, illegal fishing can also have severe
economic repercussions which can jeopardize the livelihoods of law-abiding citizens.
Turpie et al. (2003) describe the severity of illegal take of abalone in South Africa,
where over two times more abalone is illegally exported than the national quota. This
level of illegal take overpowered local management, and forced managers to reduce
the legal commercial take limit by over twenty-five percent (Tarr, 2000; Turpie et al.,
2003) Reductions in the total legal take has had a negative impact on the livelihoods
of law abiding fishers, which may induce more fishers to begin violating (Sumaila, et
al, 2006). In addition to this problem, illegal resource use can also jeopardize
economies that rely on eco-tourism, as reduced environmental quality causes tourists
to go elsewhere (Turpie et al., 2003).
Finally, since illegal fishing inevitably results in the development of a black
market, there are concerns that purchases from this unregulated market may result in
poor food quality and safety (Pitcher et al., 2002). As black markets develop, they
create more management issues, putting further pressure on enforcement budgets and
increasing crime rates (Hauck and Sweijd, 1999; Pitcher et al., 2002).
2.4.2 Means of Assessing Illegal Activities
Due to the severity and diversity of illegal fishing impacts, managers
worldwide have struggled for years to estimate illegal take, but it has proven to be
extremely difficult (Leader-Williams et al., 1990). In order to improve the quality of
stock estimates and set appropriate priorities, managers need accurate information
about the total catch, which includes both legal and illegal take (Tarr, 2000). While
managers have developed a wide range of techniques to quantify illegal fishing, none
of these methods are universally applicable. Table 2.3 lists several of the techniques

18
described in the literature which have been used to detect and estimate illegal fishing,
as well as their limitations.
Managers of both terrestrial and aquatic resources have often used direct
monitoring of stock numbers via techniques such as transects and aerial surveys to
assess the health of animal populations and watch for signs of poaching impacts
(Burton, 1999; CDFG, 2005). However, these methods are limited not only by the
migratory nature of many marine stocks, but also by the variability of marine habitats
and conditions, and the costs of data collection (Spencer and Collie, 1997). In the
case of California’s red abalone (Haliotis rufescens) the health of the population, and
the Total Allowable Catch for the whole recreational fishery, is estimated from
transect surveys conducted at only eight sites (Kashiwada and Taniguchi, 2007).
Management and enforcement assume that “the impact of poaching, like all forms of
mortality, would be evident in declining population densities during dive surveys”
(CDFG, 2005, p. F-12). However, while stock surveys have the benefit of being able
to measure the impact of illegal activity directly, time lags in conducting and
analyzing survey data, and the fact that counts are only conducted at a few sites, make
it likely that only extreme levels of abalone poaching, as seen in South Africa, would
be noticeable this way (Tarr, 2000, CDFG, 2005).
Enforcement-based estimation methods, such as counting the frequency of
encounters with poachers, making citation-based violation estimates, looking for signs
of illegal activity, or conducting on-board observer programs, have also been used in
fisheries with mixed results (Leader-Williams et al., 1990; Smith and Smeltzer, 1991;
Solomon et al., 2007). Citation based estimates are highly imprecise and widely
acknowledged to underestimate illegal take (CDFG, 2005). These techniques rely on
the frequency of enforcement contact with violators. Thus, higher violation estimates
generally result from more intense enforcement, giving the initial impression that
greater enforcement effort increases illegal take (Jachmann, 1998; Burton, 1999). In
addition, surveillance efforts are regularly used, but can be extremely expensive,
relying on high levels of human resources and equipment to catch evasive poachers
(Daniels and Floren, 1998; Tarr, 2000; Solomon et al., 2007). ICCAT (2000)
successfully used surveillance and tracking devices to estimate and monitor the illegal
take of Patagonian toothfish (Dissostichus eleginoides) and bluefin tuna (Thunnus
maccoyii) with support from the Australian government and fishing industry.
However, many fisheries management agencies around the world are insufficiently

19
Table 2.3: Illegal Fishing Detection and Quantification Methods
Method
Type Examples Advantages Limitations
Case Studies
D
irec
t Sto
ck
Ass
essm
ents
Transects
Aerial Surveys
- Measure impact of illegal activity directly
-Reduced accuracy with moving stocks
-High level of error in projecting population densities from one site
onto many
-Not sensitive enough to detect small stock
reductions
(Kashiwada and Taniguchi, 2007)
(CDFG, 2005)
Enfo
rcem
ent-b
ased
Est
imat
ion
Met
hods
Frequency of encounters with
poachers
On-board observers
Citation-based violation estimates
Counting signs of
illegal activity
Net confiscations
- Data collected during regular
enforcement duties, no need to hire
researchers
- Can give idea of changes in illegal take
- Enforcement both
discourages and records illegal action
- Rely on regularly contacting/catching
poachers
-Projections are imprecise
- Expensive (high cost
for staff and equipment)
- Safety Concerns for
Staff
(ICCAT, 2000)
(Jachmann, 2008)
Soci
al S
cien
ce M
etho
ds
Informants
Interviews
Decision tree analysis
Focus groups
- Can give insights into the extent and
cause of illegal take
- May provide “inside information”
-Must gain confidence of informants and
interviewees
-High levels of response bias
-May still be excluded
from some dealings
-No as appropriate for international studies
(Mann, 1995) (Bodigue, 2002)
Logb
ooks
- Provides information about fisher activities
-Regularly falsified so as not to report illegal
activities
-May not note discarded catch
(Raymakers and Lynham, 1999) (Harris, 1998)
Econ
omic
Mod
elin
g an
d M
arke
t Stu
dies
Input/Output Studies of Fish
Product Production
Comparisons Between Legal
Export Levels and Recorded Imports of Other Nations
- Can illustrate illegal take and markets
- Uses information
collected by businesses and other
nations
-Require extensive knowledge of market
streams
-Locally specific
-Require projections
-Difficult to apply to recreational fisheries
-Do not function well
with black market goods
(Patterson et al. 1990) (Pitcher and Stokes,
1990) (Lewis and Tweddle,
1990) (ISOFISH, 1999)
(Tarr, 2000)

20
staffed and under-funded, and thus could not afford to pay for the technology or man-
hours necessary to undertake enforcement at this level (Tarr, 2000).
Social science methods such as interviews, informants, decision tree analysis,
and focus groups have also been used to estimate illegal take (Damania et al., 2003;
Solomon et al., 2007). However, interview and informant-based methods of
estimating illegal activity generally suffer from bias due to the perception of risk
among informants who are asked to confess or report illegal behavior (Fox and Tracy,
1986; Pitcher et al., 2002). Biases against authorities or “outsiders” may exist,
making these methods inappropriate for estimating illegal behavior on a large scale,
because managers may have to invest considerable time and effort to gain the
confidence of their respondents (Mann, 1995).
Logbook reviews can be useful if they are accurate, but logbooks are
frequently falsified by vessel captains. Harris (1998) discussed a case in Spain where
a trawler contained a secret hold with unreported illegal and undersized catch. The
captain had been keeping “two sets of logbooks, each with different catch figures”
and a significant amount of the catch was recorded in the logbook of a different vessel
(Pitcher et al., 2002, p. 321). In addition, though catch discarded at sea should be
logged in the logbooks, vessels engaging in illegal catch or those who are high-
grading by dumping low value fish in favor of others are unlikely to report it.
Finally, economic modeling methods have been used to estimate illegal take
with market studies. Patterson et al. (1990) compared reported landings with fishmeal
production to illustrate that twice the legal limit of fish would be needed to produce
the current volume of fish meal. Lewis and Tweddle (1990) did a similar study
estimating illegal take by looking at fish sacks and fish sales. Market studies were
used by Tarr (2000) to estimate that up to two times more abalone was exported to
Asia than the legal take quotas of South Africa. Unfortunately, as these authors
recognize, economic modeling methods do not have a high degree of accuracy,
because they require extensive information about market streams, which may not be
available when dealing with illegal markets (Patterson et al, 1990; Tarr, 2000).
Additionally, several of these market-based methods can only be used to estimate
illegal take levels for specific areas, and would not be applicable to the complexity of
global markets (Lewis and Tweeddle, 1990). Economic methods are also difficult to
conduct when the target fishery is recreational, because often there is far less
information available about the activities of black markets (Hauck and Sweijd, 1999;

21
Pitcher et al., 2002). Furthermore, many fishers may not interact with the market at
all, and instead retain their illegal catch for personal use (CDFG, 2005).
As Solomon et al. (2007, p. 4) explain, “the effectiveness of these techniques
for quantifying illegal resource use is limited by methodological constraints. Often
the techniques do not account for the number of people violating the law and therefore
[they] have limited policy implications”. This claim is supported by other authors
who explain that in order to have the greatest impact on illegal fishing, management
must consider not only the scale of non-compliance, but also which sectors of the
population are violating most (Hønneland, 1999; Sumaila et al., 2006). With that
information, managers can efficiently prioritize problem areas to target with
enforcement resources, and design policies that effectively engage with compliance
theory and literature. Therefore, the contribution of this research will be to use the
randomized response technique to assess marine fisheries compliance and investigate
the sectors violating.
2.5 Compliance Theory
Managers have developed several models for managing marine resources
based on different theoretical assumptions about which factors are the most influential
in determining compliance. Here I briefly review deterrence models and non-
monetary compliance incentives.
2.5.1 Economic Management Theories
In order to establish the necessary social arrangements which would encourage
users to limit their take, governments have primarily focused on economic
management models which give managers “property rights” to marine resources via
national Exclusive Economic Zones (EEZ’s) (Hønneland, 1999). Managers may
establish take limits for marine species by setting a Total Allowable Catch (TAC) or
creating individual quotas or permits entitling each fisher to a given portion of the
resource. The California Department of Fish and Game defines Total Allowable
Catch as “the catch level, in number or weight of [animals], that is allowed each year
under sport or commercial fishery regulations” (CDFG, 2005, p. References - 17). As

22
managers are the “owners” of the resources they manage, they are also able to
establish economic deterrents for violations of the take regulations by enforcing
economic sanctions and other penalties.
Economic compliance models make two key assumptions. The first is that
fishers have access to information about the costs and benefits of behaving illegally.
If fishers have inadequate awareness of either of these factors, the choices they make
and the success of management measures will be affected (Hønneland, 1999). The
second assumption of economic compliance models is that if fishers have information
about possible financial gains or losses, they will make rational choices (Hønneland,
1999, Kahneman, 2003). Managers attempt to set fines and penalties so that the
decision to comply is the most rational choice. However, even when all the
information is provided, individuals often do not act rationally (Kahneman, 2003).
Irrational behavior may be the result of personal beliefs or intuitions, peer pressure,
failure to properly reason options, or social norms (Kahneman, 2003).
2.5.1.1 Deterrence models
Deterrence models of illegal behavior follow from economics-based
management theories of rational choice. As Hatcher et al. (2000) point out,
“economic models of regulatory compliance in fisheries usually assume an
instrumental determination of individual behavior in which the decision to comply or
to violate depends primarily on the expected monetary costs and benefits. Policy
implications tend, as a result, to focus only on deterrence [via] increasing the
monetary costs of violation” (p. 448). In these models, the deterrent effect provided
by the level of financial sanctions is thought to be the main determinant of compliance
(Sumaila et al., 2006). Authors such as Garrett Hardin believe that coercing resource
users to comply with the threat of power is the only way to implement management
(Hardin, 1968; Hønneland, 1999).
2.5.2 Normative Compliance Theories
Recently, there have been many compliance studies which illustrate the
importance of non-monetary factors for encouraging compliance with marine
regulations. These studies describe normative theories from the “co-management

23
literature [that] emphasize legitimacy or discursive measures as more effective [than
economic models] in securing compliance with management regulations”
(Hønneland, 1999, p. 700). Social contract and co-management models encourage
managers to engage in discourse with resource users prior to undertaking regulation,
because “compliance to such a system is secured not by the threat of power, but
through the acceptance by participants of the reasonability – or legitimacy – of the
system” (Hønneland, 1999, p. 703). Generally, a regulation is considered legitimate if
it complies with social norms, and is understood to serve an important purpose
(Hønneland, 1999; Sumaila et al., 2006). Proponents of these models often cite the
success of specific indigenous or self-managed fisheries to illustrate the effectiveness
of non-monetary compliance incentives as management tools (McCay, 1980;
McGoodwin, 1983; Heckathorn, 1990).
2.5.2.1 Non-Monetary Compliance Incentives
Normative theorists believe that non-monetary factors can have a greater
influence on compliance behavior than “threats of power” under traditional deterrence
systems, and that moral and social considerations play a vital role in whether an
individual decides to comply with fishing regulations (Hønneland, 1999; Sutinen and
Kuperan, 1999). Non-monetary factors such as social reciprocity can affect the
behavior of individuals by leveraging their social standing as a deterrent to non-
compliance (Bowles and Gintis, 2002). Bowels and Gintis (2002) describe the idea of
social capital as “trust, concern for one’s associates, a willingness to live by the norms
of one’s community and to punish those who do not” (p. F419). Particularly in small
communities, behavioral norms of the collective community can create pressure to
conform (Bowels and Gintis, 2002). The social capital within the community, the
behavior of other fishers, and the moral code of each individual all affect the decision
to comply or violate, and normative theorists believe these drivers can be influenced
by managers (Sutinen and Kuperan, 1999; Sumaila et al., 2006).

24
2.5.3 Drivers of Illegal Behavior
Sumaila et al. (2006) combine concepts from both economic and normative
models to describe five decision-making drivers for compliance (see Figure 2.2). The
first consideration regards the level of benefit the fisher would get from partaking in
the illegal activity. This driver reflects both economic and normative concerns
because the rewards of non-compliance could be social or financial. Factors such as
the black market value of the item, the time and availability of catch, the cost of
fishing, the financial status of the fisher, or any related social benefits of take will
influence the appeal of illegal action (Sumaila et al., 2006). Though there are limited
examples, managers typically cannot influence this driver, because international
cooperation and monitoring is required to intentionally suppress the global price of an
open access resource (Leader-Williams et al., 1990; Jachmann, 1998).
Drivers two through four are readily affected by the level of managerial
enforcement, and are based upon economic theories of compliance. The second
driver regards the probability of detection. This driver depends upon fisher
perceptions of the intensity of fishery enforcement and monitoring. The third driver,
also related to enforcement, is the level of penalty the fisher faces if caught. This
driver reflects economic deterrence models of enforcement that assume higher fines
will reduce the perceived benefit of illegal action. The fourth driver, the cost of
avoiding detection, is another expense fishers must consider. Managers hope that if
they can increase the disincentives associated with these three drivers, inform the
fishing community, and enforce regulations with more frequent patrols or higher
fines, they will reduce non-compliance.
Finally, the fifth driver speaks to the influence of normative concerns on fisher
behavior. This driver is also not typically targeted by regulatory bodies, because it
represents a combination of factors that are unique to an individual or community, and
therefore requires more extensive methods of data collection to be understood
(Hønneland, 1999). For instance, the social standing and moral outlook of a fisher
affects their willingness to risk getting caught participating in illegal fishing (Sumaila
et al., 2006). Additionally, research has shown that a persons’ age, household
income, employment status, and previous violation record may influence their
attitudes toward risk and crime (Furlong, 1991).
25
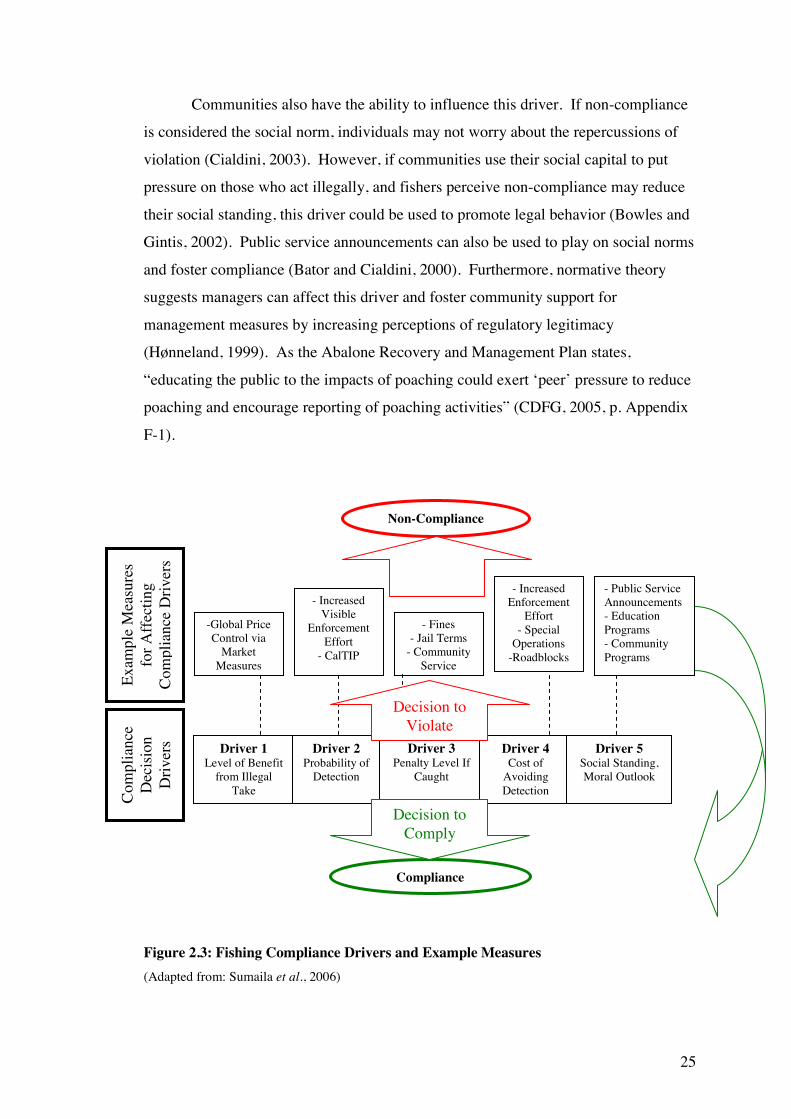
Communities also have the ability to influence this driver. If non-compliance
is considered the social norm, individuals may not worry about the repercussions of
violation (Cialdini, 2003). However, if communities use their social capital to put
pressure on those who act illegally, and fishers perceive non-compliance may reduce
their social standing, this driver could be used to promote legal behavior (Bowles and
Gintis, 2002). Public service announcements can also be used to play on social norms
and foster compliance (Bator and Cialdini, 2000). Furthermore, normative theory
suggests managers can affect this driver and foster community support for
management measures by increasing perceptions of regulatory legitimacy
(Hønneland, 1999). As the Abalone Recovery and Management Plan states,
“educating the public to the impacts of poaching could exert ‘peer’ pressure to reduce
poaching and encourage reporting of poaching activities” (CDFG, 2005, p. Appendix
F-1).
Figure 2.3: Fishing Compliance Drivers and Example Measures (Adapted from: Sumaila et al., 2006)
Driver 1 Level of Benefit
from Illegal Take
Driver 2 Probability of
Detection
Driver 3 Penalty Level If
Caught
Driver 4 Cost of
Avoiding Detection
Driver 5 Social Standing, Moral Outlook
-Global Price Control via
Market Measures
- Fines - Jail Terms
- Community Service
- Increased Enforcement
Effort - Special
Operations -Roadblocks
- Increased Visible
Enforcement Effort
- CalTIP
- Public Service Announcements - Education Programs - Community Programs
Exam
ple
Mea
sure
s fo
r Aff
ectin
g C
ompl
ianc
e D
river
s
Com
plia
nce
Dec
isio
n D
river
s
Compliance
Non-Compliance
Decision to Comply
Decision to Violate

26
2.6 Abalone Management Measures in Northern California
In the recreational red abalone (Haliotis rufescens) fishery of Northern
California, managers target compliance drivers two, three, and four with increased
enforcement effort and visibility, as illustrated in Figure 2.3. The chapter on “Abalone
Enforcement Activities” in the Abalone Recovery and Management Plan encourages
wardens to use “the most visible method” and patrol the tidal areas in uniform during
high-traffic minus tides (CDFG, 2005, p. 8-1). In addition to game wardens, some
regional, state, and national park personnel may also monitor abalone fishing activity
within their area, and report illegal activity to Fish and Game. The public has also
become involved in enforcement via the CalTIP (Turn In Poachers) Program, which
encourages them to report violations via a phone hotline (CDFG, 2005). These efforts
are combined with the use of video cameras, aircraft, boat patrols, and undercover
wardens to increase the deterrent effect of drivers two and four (CDFG, 2005).
The ARMP also reports “enforcement efforts have been augmented recently
by the justice system, which has been levying greater fines and penalties” to target the
third compliance driver (CDFG, 2005, p. 3-10). Penalties for illegal activity range
from citations and gear confiscation for minor infractions, to heavy fines with the
possibility of jail time for large or repeat offenses. Daniels and Floren (1998)
reported that “fines for petty sport violations in Sonoma County have been
standardized at $500 USD for a violation involving one abalone, with $250 USD
added for each additional abalone” (p. 861). Furthermore, if individuals are caught
trying to sell recreationally caught abalone, the punishments for first time offenders
have been known to include jail time and fines starting at $3,000 USD (Daniels and
Floren, 1998).
The level of fines and deterrents imposed on violators reflect efforts by
management to use drivers 2-4 to counteract the effects of the first driver and avoid
historical problems with resource over-exploitation. The ARMP states that “as
abalone stocks have become depleted, the world price has increased, escalating the
impetus to poach” (CDFG, 2005, 3-10). Abalone meat is highly sought after as a
delicacy and has a high value on the black market (CDFG, 2005). Local restaurants
and seafood markets are now the main purchasers of illegally sold red abalone, and
are known to trade or buy wild-caught red abalone from sport fishers (Rogers-Bennett

27
and Melvin, 2007; Daniels and Floren, 1998, CDFG, 2005). Furthermore, since
abalone is a delicacy it has non-market uses, as gifts or for personal consumption,
which also influence the first driver of compliance.
As illustrated in Figure 2.3, managers have at their disposal a range of
economic and normative measures for affecting the compliance drivers of recreational
fishers. Traditionally, government managed fisheries have focused on influencing
drivers two through four, and a range of deterrence model tools have been developed,
each with pro’s and con’s for sustainability and management (See Table 2.4).
Normative variables are not always considered when designing management, and
instead tools are selected based on the specific pressures and biological characteristics
of the fishery. Trade-offs between biological advantages and management limitations
must be weighed when managers decide which measures to implement. In the case of
the red abalone fishery of Northern California, managers have designed a range of
gear and take restrictions to keep the fishery sustainable (see green boxes in Table
2.4).
Gear restrictions have been in effect in this fishery for many years, beginning
with a ban on the use of SCUBA gear to collect abalone introduced over forty years
ago (Roger-Bennett et al., 2004). The ban has protected stocks from the over-
exploitation seen in Southern California that further decimated many declining
abalone species (Karpov and Tegner, 1992). Red abalone can survive at depths of 80
feet (24 meters), and as a result of the ban on SCUBA gear, abalone residing at deeper
depths are generally safe from recreational fishing mortality (CDFG, 2005). The use
of a blunt abalone pry-iron of specific dimensions is also required in order to
minimize injury to the abalone as they are removed from their substrate and prevent
them from bleeding to death (CDFG, 2005).
Further measures such as seasonal fishery closures during July and from
December thru March are intended to protect both the abalone stocks and fishers.
Northern California is prone to rough weather in winter months making fishing
particularly dangerous, and winter is also spawning season for red abalone (CDFG,
2005). The fishery is also closed in July to reduce the total take over the summer
months and to break up the period of highest fishing effort. The calm seas, warm
days, and frequent minus tides of July provide such favorable conditions for abalone
fishing that popular sites were being picked clean (CDFG, 2005).

28
Table 2.4: Deterrence-Based Tools for Managing Recreational Fisheries (Green boxes indicate measures used in the Northern CA Red Abalone Fishery)
Rule Example Advantages Disadvantages
Report Cards
Mon
itorin
g V
ia
Doc
umen
tatio
n
Logbooks
- Legal fishing effort statistics can be calculated
- Gives managers information about time, location, and quantity of take
- Report cards may have low return rates if penalties for not returning them are not enforced.
- Analyzing data is taxing on managerial resources
- Difficult for illiterate fishers and non-English speakers
- Illegal take generally not revealed with self-reporting methods
- Can illegally buy several report cards/year
Fishing Licensing
- Allows a database to be created of recreational fishers and contact info
Fish
ery
Entry
Re
stric
tion
Entry Cap - Limits maximum take when demand on fishery is too large
- Requires proper infrastructure to enforce - Difficult to determine the cap level, and how
fishers will be selected - Do not protect from illegal take
Min Size Limits
-Allows reproduction to occur before the onset of fishing pressure
- Relatively easy to detect with inspection
Maximum - Protects large fecund individuals - Relatively easy to detect with inspection
Size
Res
trict
ions
Slot-Limits
- Protects juveniles from fishing pressure until predation effects decline and also
protects highly fecund large adults from fishing pressure to encourage replenishment - Relatively easy to detect with inspection
- Min size not as effective at protecting reproduction if large adults have greatest
fecundity - Max size does not protect juveniles who may experience high levels of natural mortality as
well - Slot-limits may be resisted by fishers in a
trophy-fishery - All measures require adequate staff to enforce
over large geographical areas
Annual Limits
- Reduces total extraction from the resource - Reflects TAC
Daily Limits - Helps reduce impact of point-source
depletion because fishers can not collect their annual limit in a day
- Relatively easy to detect with inspection
Take
Res
trict
ions
Catch and Release
- Fishers enjoy resource without removing animals
- Annual limit violations are difficult to detect (particularly if they coincide with document
falsification) - Difficult to determine optimal annual limit
- All require adequate staff to enforce over large geographical areas
- Catch and Release is not as appropriate for invertebrate fisheries and often results in
mortality from fishing related injury
Fish
ing
Hou
rs
Sunrise to Sunset
- Easy to enforce as violations are obvious - May improve safety of fishers
- May reduce illegal take
- Requires adequate staff to enforce over large geographical areas
Fish
ing
Seas
ons
Spring/Fall
-Easy to enforce as violations are obvious - May improve safety of fishers
-Gives resources time to recover from fishing, and protection during vulnerable
periods such as spawning times
- Requires adequate staff to enforce over large geographical areas
Find and Replace
- Protects animals from incidental fishing mortality
Fish
ing
Beha
vior
M
easu
res
High-grading Ban
- Protects animals from incidental fishing mortality
- May be difficult to detect
No SCUBA - Protects individuals in deeper water from
fishing pressure to maintain a dense breeding stock
- May reduce illegal take Gea
r Re
stric
tions
Blunt Pry Iron required
- Reduces incidental fishing related mortality from injury
- May be difficult to detect - SCUBA ban does not deter all poachers

29
In addition to banning the use of SCUBA gear and enforcing seasonal
closures, many other management measures have been implemented in accordance
with the Abalone Recovery and Management Plan, which was adopted by California
Fish and Game in December of 2005 (Kashiwada and Taniguchi, 2007). These
measures include a daily take limit of three abalone, which is intended to reduce
point-source fishing impacts. An annual take limit of twenty-four abalone per fisher
has also been set in accordance with the TAC levels for the fishery (CDFG, 2005).
Furthermore, a minimum legal shell length limit of seven inches (178 mm) has been
introduced to allow abalone to reach sexual maturity and reproduce prior to being
subjected to fishing mortality (CDFG, 2005). There are also behavioral regulations
requiring fishers to replace abalone on the same rock they were taken from if they are
found to be undersized, and prohibiting the practice of high-grading legal-sized
abalone (CDFG, 2005). These measures are meant to reduce unreported fishing-
related mortality.
Furthermore, managers have also adopted measures which allow them to
monitor fisher activity. All abalone fishers are required to purchase an abalone permit
report card (a.k.a. punch-card) which provides managers with basic information on
the number of recreational fishers using the resource, where they are fishing, and their
annual level of take (see Appendix 1). The punch-card must be purchased in addition
to a California Fishing license, and it is only valid for one season. The report card
contains 24 spaces for fishers to document the date, time, and location code of every
abalone taken. Location codes for 56 common abalone collection sites in Marin,
Sonoma, Mendocino, Humboldt and Del Norte counties are provided on the card, as
well as instructions and a summary of abalone regulations. The cards are required by
law to be returned to the Fort Bragg office of the California Department of Fish and
Game no later than the 30th of December of the year of purchase. Managers use a
random sample of the returned abalone report cards in conjunction with a phone
survey of fishers who purchased report cards to estimate fisher effort, track the most
common locations and months of take, and estimate the total legal take for the fishery
(Kalvass and Geibel, 2006).
In addition to the data collected with the abalone report card and phone
survey, the Abalone Recovery and Management Plan states that managers should
monitor their success by looking at abalone density indicators from index sites in
northern and southern California (CDFG, 2005). This fishery-independent biological

30
survey looks at the abalone population at eight key locations, and attempts an estimate
of overall abalone density, health, mortality, and recruitment at all depths (Rogers-
Bennett et al., 2002; Rogers-Bennett et al., 2007). The survey uses densities
determined from transects, and “if densities drop below critical values the ARMP
either reduces the catch, closes areas, or the entire fishery” (Kashiwada and
Taniguchi, 2007, p. 713). The opposite also holds true, so that if densities rise and
there is good recruitment, the total allowable catch (TAC) could be increased
(Kashiwada and Taniguchi, 2007; CDFG, 2005). However as Kashiwada and
Taniguchi (2007) explain, “the TAC is a guideline rather than a trigger, because there
are no mechanisms for monitoring in-season catch and for closing the fishery in-
season when TAC is exceeded” (p. 713).
Currently, management is operating under the “interim plan”, which will last
until 2011. The general management strategy of the “interim plan” is to maintain the
red abalone population above the estimated minimum viable population (MVP) level
of 3,000 abalone/ha, under which recruitment would not be high enough to sustain the
population and the total numbers would decline to collapse (Kashiwada and
Taniguchi, 2007). A more zonal long-term management plan may be implemented in
2011 if further funds become available, which would require increased enforcement
and more detailed assessments of the stocks in order to become less precautionary
(CDFG, 2005).
2.7 Information Gaps in Northern California
The methods of assessment currently being used by management may be
adequate for estimating the annual levels of legal take from the abalone fishery, but
they are insufficient with respect to illegal take. Despite all enforcement efforts to
combat the drivers of non-compliance, and the encouragement of the Abalone
Recovery and Management Plan to include “estimates of illegal harvest as part of the
total fishery-related mortalities”, no method for accurately estimating non-compliance
is currently being used ( CDFG, 2005, p. Appendix F-12). While documenting catch
with the abalone report card system is required by law, individuals are usually wary of
confessing illegal behavior via self-reporting methods (Warner, 1965). The Abalone
Enforcement Report for 2006 stated that violations for wrongly reporting catch on
abalone report cards were the most commonly encountered at fishing sites and vehicle

31
checkpoints (Riske, 2006). In essence, the deterrence system in place to discourage
illegal behavior also discourages fishers from being honest on their abalone report
cards, for fear of penalties. As a result, this method for increasing the information
available to managers about legal take does not provide managers with information
about illegal take levels.
The shortage of information about the actual level of non-compliance
undermines management in several ways. Without non-compliance estimates or
estimates of illegal take, managers operate with imprecise estimates of Total Catch,
increasing their response time to potential threats (Sumaila et al., 2006). Management
is forced to rely on “crude estimates [of non-compliance]…made from warden
intercept data” and changes in red abalone “population densities during dive surveys”
(CDFG, 2005, p. Appendix F-12). These estimation methods are imprecise, costly,
take significant time to analyze, and still do not provide management with all the
information that would allow them to effectively influence the compliance drivers.
Furthermore, data collected from warden citation reports are not collated and made
available to managers, so even this imprecise gauge of the level of illegal activity is
not fully utilized (Combes, CDFG Warden, pers. comm., November, 2007).
As a result, managers do not currently have reliable estimates of which
regulations are experiencing the highest proportions of non-compliance, which would
allow them to assess the effectiveness of regulatory measures for protecting abalone
resources, and set efficient enforcement priorities. With information about what
proportion of fishers are non-compliant, what kinds of violations are most common,
which sectors violate, and how fisher awareness of regulations affects their decision
to violate, management can assess how best to tailor abalone measures to their
resource users (Hønneland, 1999). This thesis seeks to address this critical
information gap by collecting primary data on these questions for the red abalone
fishery of Northern California.

32
Chapter 3
Methodology
3.1 Chapter Introduction
This methodology section outlines the procedures used for data collection and
analysis. To obtain data for Objectives 1 and 2 I utilize a survey of abalone fishers.
The survey technique, called the randomized response technique (RRT), is unique in
that it allows researchers to attain a higher proportion of honest responses to sensitive
questions than direct surveying methods. Each objective and the methods used to
achieve it are described in some detail.
3.2 Site Location
Data collection for Objectives 1 and 2 was conducted in Mendocino and
Sonoma Counties in Northern California (shown in white in Figure 3.1). The eight
sites surveyed were chosen because they are commonly used coastal access points for
recreational abalone fishers along Highway 1 (See Figure 3.2). The Northern
Californian red abalone fishery provides an excellent area from which to draw this
case study for three reasons. The first is the high value of the red abalone as a species
both economically and for conservation purposes. Abalone meat fetches a high price
in domestic and international markets, leading to greater incentives to engage in
illegal recreational take, particularly in this fishery where there is no longer a
commercial industry (Daniels and Floren, 1998). Additionally, the red abalone is also
of great value for conservation purposes, as it is the only abalone species to maintain
relatively high abundance in California despite the collapse of almost all of the seven
other native abalone species (CDFG, 2005).

33
Figure 3.1 California County Map
The second reason this area was an ideal location for this study is the current
level of regulatory management, and the resulting information that exists on the status
of the species. The fishery is monitored by managers, enforcement officers and
biologists, who were able to provide me with information about the red abalone
fishery, including data on fishing effort biological indicators of stock health. This
information was useful because it showed that while the fishery may or may not be
sustainable, it certainly suffers from information gaps pertaining to estimating the
impact of illegal take, and thus would benefit from further study.

34
Figure 3.2 Survey Site Map (adapted from Kalvass and Geibel, 2006)
Finally, the accessibility of the fishery both topographically and socially made
it an ideal location to conduct a case study using the randomized response technique.
Sonoma and Mendocino counties represent 96% of the annual red abalone effort, and
due to the steep and rocky shoreline, that take is largely point source (CDFG, 1993).
This feature allowed for easy recognition of coastal access points by both fishers and
researchers, and provided facilities such as parking lots where fishers congregate and
surveys could easily be administered. Additionally, the area has a very high literacy
rate and is primarily English speaking, which made for ideal survey conditions (U.S.
Census Bureau, 2008, http://quickfacts.census.gov).

35
3.3 Survey – Objectives 1 and 2 3.3.1 Sample Design
Four sites were sampled in Mendocino County and four in Sonoma County.
Fifteen red abalone fishers were asked to give feedback on the survey method during
a week-long piloting phase, but their surveys were not analyzed. These fishers
thought non-compliant locals would not be likely to violate at the larger, more popular
sites, because they are more regularly patrolled by game wardens, and have more
people present who may report violators. On the other hand, it was thought visiting
fishers who were not as familiar with the coast would likely use and potentially
violate at the large sites. The large sites represented the areas with the highest overall
percentage of take, therefore they were expected to have a higher expected percentage
of violations than the small sites.
In order to get a complete cross section of the abalone fishing community, it
was important to sample from both the more accessible “high take” sites, as well as
the “low take” areas (see Table 3.1). To accomplish this I randomly selected four
“high take” sites from the top ten sites in 2002, as reported by fisher report cards.
Additionally, three “low take” sites that were rated between 10 and 25 in terms of
take were selected, as well as one “low take” site designated “miscellaneous small”
where several very small Mendocino sites (rated between 25 and 35 for take) were
surveyed in a day (Kalvass and Geibel, 2006).
Table 3.1: Survey Locations and Take Levels
(Adapted from Kalvass and Geibel, 2006)
Location Name County Annual Percentage Abalone Take Site Designation
Van Damme State Park Mendocino 6.83 “high take”
Reef Campground (Pedotti) Sonoma 6.02 “high take”
Sea Ranch Sonoma 5.49 “high take”
Arena Cove Mendocino 4.79 “high take”
Elk Mendocino 3.12 “low take”
Fisk Mill Cove Sonoma 2.67 “low take”
Stillwater Cove Sonoma 1.38 “low take”
Miscellaneous small Mendocino “low take”

36
The highest fishing effort in the red abalone (H. rufescens) fishery occurs in
the summer months, and the month of August has the second highest reported take
after June (CDFG, 2007b). However, recent studies are showing a shift in fishing
effort toward collecting in the later half of the season (August to November) rather
than April to June (Riske, 2006). Thus, the survey period was the five weeks from
Friday August 10th to Saturday September 8th, 2007, with a week of survey piloting
the last week of June.
The sites were assigned specific survey dates in advance by multi-strata semi-
random selection (see Appendix 2). Weekends experience higher fishing effort than
weekdays, so these days needed to be equitably distributed among low and high take
sites. This was accomplished by randomly assigning each site one of the eight
weekend days. Labor Day (a 3-day holiday weekend) fell on the second to last
weekend of the survey, and sites were randomly selected for that Monday. Fridays
were considered medium traffic days, and were randomly split between high and low
take sites. Mondays through Thursdays are characterized by low fishing effort, and
sites were randomly assigned for those days.
3.3.2 The Randomized Response Technique
The methods currently used to gather information on the level of illegal
abalone harvest in Northern California are insufficient. Managers have generally
relied upon data from conservation enforcement (e.g. number of arrests or fines), pre-
notified vehicle search roadblocks, or direct questioning via phone surveys to derive
estimates of illegal fishing activity (Kalvass and Geibel, 2006). Unfortunately, each
of these methods has been shown to greatly underestimate the actual amount of illegal
activity (Buchman and Tracy, 1982, Fox and Tracy, 1986).
The most straightforward way to determine the proportion of fishers who
illegally fish for abalone is to ask them directly using an anonymous survey.
However, when discussing illegal activity, the effectiveness of traditional direct
questioning techniques is reduced, because those being interviewed fear retribution or
punishment for admitting they have acted illegally (Locander et al., 1976, Fowler and
Mangione, 1990). As Buchman and Tracy (1982) explain, “researchers are faced with
two problems when posing sensitive questions to respondents…[either] they refuse to
respond,…[or] they will return misleading responses designed to conceal the

37
unacceptable behavior” (p. 264). Respondents who give evasive or dishonest
answers introduce response bias into the study, resulting in questionable data and poor
results (Warner, 1965; Solomon et al., 2007). When faced with this problem,
researchers using the traditional direct questioning survey method are likely to try to
gain the confidence of the respondent (Warner, 1965). However, this is unreliable,
because many people will not be inclined to confide certain things at all, and others
would not want their confessions written down or linked to them in any way (Warner,
1965).
The randomized response technique (RRT) was developed over forty years
ago to counter these problems with response bias, by increasing the number of honest
answers given to sensitive questions in a survey or interview. Sensitive questions
may be defined as “questions that demand answers that are too revealing” (Warner,
1965, p. 63). Solomon et al. (2007) describe them as those questions which
participants in the study perceive as having a cost, be it financial or personal. RRT
allows the responses of interviewees to remain anonymous, and gives respondents
control of the questions, thereby reducing the perceived costs (Buchman and Tracy,
1982). As Warner (1965) states, “the method is built on the premise that cooperation
should be naturally better if the questions allow answers which reveal less even to the
interviewer” (p. 63). This is accomplished through the design of the method, which
allows a “yes” response to either be the sensitive response the researcher seeks, or the
answer to an unrelated innocuous question (Buchman and Tracy, 1982; Fox and
Tracy, 1986). Thus, the interviewee responds with information that gives the
researcher data only on a probability basis (Warner, 1965).
The method begins with the respondent performing a randomizing process,
such as flipping a coin or rolling a die, prior to answering each of the questions. They
then randomly select one of two question cards, but do not reveal it to anyone else.
The question will either be the sensitive question, or an unrelated innocuous question
pertaining to the outcome of the randomizing process. The respondents’ reply of
“yes” or “no” is recorded either by themselves or the researcher. At the end of the
process, the researcher does not know which question was answered. However they
do know the probability of each outcome: the probability of flipping “heads” or
“tails” with a coin, and the probability of drawing each of the cards (Buchman and
Tracy, 1982). Therefore, the researcher can tally the number of “yes” replies to find
the proportion of sensitive questions the entire sample answered, but can not say with

38
any certainty whether an individual respondent who gave a positive reply was
answering the sensitive or innocuous question (Solomon et al., 2007). Solomon et al.
(2007, p. 6) state “in essence the technique is useful in developing aggregate estimates
of illegal behavior”.
Since RRT uses probability, it does have larger standard error than direct
questioning, requiring a larger sample size (Buchman and Tracy, 1982). As Buchman
and Tracy (1982) explain, “the larger standard error of RRT is caused by two sources
of sample error – the variation in the sample proportion that is directed to answer
yes…and the variation in the sample proportion that answers yes to the sensitive
question (which is the typical sample error problem)” (p. 266). However, even with a
larger standard error, Buchman and Tracy (1982) found “RRT questionnaires [show]
a tendency toward more honest answers” ( p. 268). A meta-analysis of 37 studies that
used the randomized response technique “indicated an overall positive effect for RRT
across studies compared to other methods” (Lensvelt-Mulders et al., 2005, p. 319).
Furthermore, others who have tested the method have also found it estimates a greater
proportion of sensitive behavior than standard survey and interview methods (Warner,
1965; I-Cheng et al., 1972; Dowling and Shachtman, 1975; Goodstadt and Gruson,
1975; Berrens et al., 1997; Chaloupka, 1985; Solomon et al., 2007).
This method has been used in a variety of studies of sensitive issues ranging
from abortion rates to tax evasion, and more recently, illegal resource use (I-Cheng et
al., 1972; Chaloupka, 1985; Schill and Kline, 1995; Solomon et al., 2007). It was
used in Australia by Chaloupka (1985) to look at shell collection permit compliance
within the Great Barrier Reef Marine Park, and resulted in an estimate of 17.5% non-
compliance with permit conditions. The study emphasized the validity of the
randomized response technique for this kind of research, and stressed the
recommendation that marine managers “should not unreservedly base management
decisions on usage data derived simply from permit[s]” (Chaloupka, 1985, p. 393).
The method was later used by Schill and Kline (1995) of the Idaho Department of
Fish and Game in the United States to look at angling gear compliance around several
rivers and lakes. These authors also concluded that RRT was a “viable method for
estimating rates of angler non-compliance with regulations” (Schill and Kline, 1995,
p. 721). More recently, it was used by Solomon et al. (2007) to estimate illegal
resource use in Kibale National Park, Uganda, who found it estimated significantly
more illegal resource use than traditional methods. Thus, this method seemed very

39
well suited to a study focusing on illegal fishing issues even though no marine
fisheries studies have been conducted using RRT thus far.
Furthermore, the randomized response technique is very well suited to the red
abalone (Haliotis rufescens) recreational fishery, because the high level of fines and
enforcement mean that respondents would perceive a high cost of honestly answering
sensitive questions with traditional survey methods. Thus, these methods would
doubtlessly be rendered useless by evasive answers and low response rates. As
discussed, RRT was chosen because it allows respondents to disclose sensitive
information without the interviewer knowing the exact response to the incriminating
question, and is thus, a unique way to attain much more accurate information
regarding the proportion of fishers illegally taking red abalone in California.
In addition to more accurately estimating proportions of sensitive behavior
than other methods, the randomized response technique has other unique benefits that
make it well suited to collecting data on illegal research use. For example, it is cost-
effective compared to many of the other illegal fishing estimation tools discussed in
the introduction section (Wahl, 1995). RRT uses very few materials so it may be
conducted on location by the resource collection area itself. The format of the survey
is technically simple and understandable, and the method can be taught quickly to
research aids. RRT also has the advantage of being easily adapted for areas and
populations with low literacy rates (Solomon et al., 2007).
A survey which uses the randomized response technique may also be easily
combined with a standard survey to collect further information about respondent
behavior and background. This study was designed to correlate RRT responses with
other questions about fishing experience and socio-demographics. This is the first
time RRT has been used to try to identify characteristics of the non-compliant section
of the population by linking variables collected with a standard paper-based survey to
RRT responses.
3.3.3 RRT Survey Data Collection 3.3.3.1 Recruitment
The average time spent at the sites each day was 4 hours, with effort focused
on the early morning low tide from sunrise to approximately 11:00am, when most
recreational fishers collect abalone.

40
Respondents were selected randomly on-site. The first person to exit their
vehicle and be identified as an abalone fisher was approached for the survey. If the
car contained more than three abalone divers every third person was also approached.
Fishers were identified by their clothing (e.g. wetsuits) or by their abalone fishing
gear (e.g. pry irons or inner-tubes). The respondents had no prior knowledge of the
survey and no identifying information was taken. They were recruited by myself or
an assistant with a predetermined procedure. That procedure was written in advance
and is reported here:
• Greet potential respondents with a smile: “Hi! I am (or My friend is) a student
in New Zealand doing a project on abalone fishing, are you going out for
abalone today?” (If YES continue)
-If NO then: “Do you go abalone fishing?” (If YES continue)
-If NO then thank them, note it, and move on to the next person.
• Explain yourself: “Would you mind filling out a quick survey for my school
project, it’s anonymous and will take less than 10 minutes?”
• If the respondent seems nervous or hesitant assure them you are not an official
or in any way there for enforcement. And stress how quick and anonymous it
will be. If they say NO that is okay, note it, and move on to the next person.
• If they say YES, make sure the respondent has not already been surveyed and
let them know you do NOT want to know their name at any point.
• Ask the respondent to walk over to the survey area and AWAY from other
members of their party and/or others being surveyed.
• Give them an information sheet on Victoria University letterhead.
• Thank them for agreeing to participate and hand them a pencil and survey.

41
The survey was administered as far away from other abalone divers or members
of the respondent’s group as possible in order to avoid introducing response bias by
allowing other divers to overhear the survey who may themselves be surveyed
afterwards. It was also important to keep the person being surveyed away from those
who might offer them help answering the questions.
Informed consent was attained verbally once the respondent had been given
information sheet about the study and had been directly asked if they would like to
participate (see Appendix 3). Attaining written consent to participate in the research
was impossible due to the sensitive nature of the questions and the necessity of
anonymity for RRT (Ethics Committee Approval #75/2007).
3.3.3.2 Survey Administration
The data were collected using a paper survey form that combined a
randomized response technique portion to collect data for Objective 1 as well as a
portion testing fisher awareness of abalone regulations and socio-demographic
information to collect data for the second objective (see Appendix 4). Once consent
to participate was attained, the respondent was given their copy of the survey form on
a clipboard, a U.S. quarter, a pencil with eraser, and seven numbered envelopes
containing the RRT and innocuous questions. The survey method was explained with
a set protocol to ensure all respondents were given the same information about how to
self administer the survey. The respondent was first told how to complete the RRT
section, because piloting showed that respondents were less inclined to complete the
RRT section if it was not administered first. The method was explained and
demonstrated to the respondent according to the following protocol:
1. Show them the RRT section of the survey first, and explain the procedure
as you demonstrate the method.
2. Show them the coin must be flipped BEFORE they begin EACH
QUESTION, and the result should NOT be revealed to anyone besides
themselves.
3. Show them the two question cards in the envelopes and let them see that
there is one question about the coin toss, and one question about abalone
fishing in each envelope, and all the cards are identical in appearance.

42
4. Explain that they have an equal chance of drawing either of the cards
and since they look the same, no one watching can tell which one they
have.
5. Let them watch you place the cards inside the empty numbered envelopes.
6. Tell them after they flip the coin they should randomly draw a question
card from the numbered envelope that corresponds to the question
number on the survey, but they must not show or read their question to
anyone else.
7. Tell them to answer the question by circling “yes” or “no” on the survey
form.
8. Instruct them to put the question back inside the envelope BEFORE
handing it back to you.
9. Explain before they begin the survey that no one can tell whether they
answered the sensitive question or not by looking only at their survey
form. Emphasize that they can be totally honest because their answers are
anonymous.
10. Ask if they have any questions about how to complete the RRT portion of
the survey.
11. Tell them to fold their survey when they have completed the RRT section
and continue with the questions inside.
12. Let them know they only need to complete the questions they feel
comfortable answering regarding ethnicity, income, age, etc. and may
leave things blank if they want to.
13. Tell them to deliver their form to the ballot box when they finish.
14. Ask them if they have any other questions. If not, tell them they may begin
the survey.
15. Walk a distance away, but casually observe them to ensure they are
flipping the coin each time and drawing questions randomly.
16. When they have completed the survey thank them for agreeing to
participate, and encourage them to take the information sheet if they are
interested in requesting the results of the study or contacting me.
Two research assistants, Kelly Thomasson and Joy Radecki, were trained by
myself on the survey technique. They administered surveys at the same site I was

43
administering them so that initially they could be supervised. The weekends had
significantly higher traffic at the sites than weekdays, so research assistants were
needed to keep up with the pace of vehicles and divers entering the sites and increase
efficiency.
The surveys were collected in a large clear plastic box, ballot-box style, in
order to provide respondents with even greater confidence in the anonymity of the
survey. They were able to see the other identical surveys inside, and could shake the
box to mix their survey in with the others. After the surveys were administered and
collected in the ballot box, fishers would frequently engage in informal conversation
about the topics raised by the survey. Notes were made at the end of each day
regarding the themes of these discussions.
3.3.3.3 Survey Instrument
The survey was composed of three sections: randomized response technique
(RRT) questions about illegal abalone fishing behavior; questions related to the
respondent’s awareness of regulations, and abalone collecting experience; and socio-
demographic and economic questions (see Appendix 4). The first thesis objective, to
utilize the RRT to determine proportions of illegal recreational fishing of red abalone
and analyze variables of the fishing population, was addressed using both the first
section, with RRT, and the last section of socio-demographic questions. RRT
responses have not previously been correlated to demographic or experience variables
in other RRT studies. The middle section, on fisher awareness of abalone regulations,
targeted my second thesis objective. Using data from all three sections, an estimate of
the proportion of violators would be analyzed against regulation awareness and
demographic questions to more clearly distinguish different characteristics of the
fishers surveyed. This allowed the specific research questions under the first and
second thesis objectives to be addressed via an analysis of trends of violation.
The Randomized Response Technique
It was decided that the RRT section was better if given first for several
reasons. RRT results were considered the most vital to the survey, and since
respondents were often in a rush, it made sense to get this information before fatigue

44
with the survey process set in and they ceased to read the questions as carefully.
Secondly, the RRT method only gives respondents a 50% chance of drawing each of
the sensitive questions about regulations, unlike the direct questions in the knowledge
section. Therefore, it is less leading than direct questions, because respondents may
draw the innocuous question and not be influenced by the limit numbers on the
sensitive question cards. Finally, the RRT section required respondents to flip a coin
and reach into several bags, while also writing down their responses; piloting showed
respondents more willing to go through the procedure if it came before they had filled
out the other sections. When the order of the sections was reversed in piloting, the
response rate fell, and several respondents only filled out half of the survey declining
to do the RRT portion.
I used the paired-alternative RRT format, that Fox and Tracy (1986) call the
“two unrelated questions” technique. The seven RRT questions and the innocuous
question were printed in English on plain white index cards and placed inside seven
identical large manila envelopes. When the question cards showed wear they were
replaced with identical new ones. The questions in the RRT section are listed in
Table 3.2.
Table 3.2: Randomized Response Technique Survey Questions
RRT 1 Do you have a valid fishing license for collecting abalone?
RRT 2 In the past year have you ever taken abalone under the minimum legal size limit?
RRT 3 Did you take more than 24 abalone total last season?
RRT 4 In the past year have you ever taken more than 3 abalone per day?
RRT 5 In the past year have you ever taken more than 6 abalone per day?
RRT 6 In the past year have you ever taken more than 9 abalone per day?
RRT 7 In the past year have you ever taken more than 12 abalone per day?
Innocuous Did you get heads on the coin toss?
Socio-Demographic Survey
The questions included in the Socio-demographic section of the survey
gathered further information about those who utilize the abalone resources in
California. This information provided a means of verifying how representative the
sample was of the total recreational abalone fishing population. The multiple-choice

45
options given for ethnicity and income were modeled on those in the California
Census, as well as those used by the California Department of Fish and Game for their
phone survey of abalone fishers (Kalvass and Geibel, 2006, U.S. Census Bureau,
2008, http://quickfacts.census.gov ). I provided fishers with more income ranges to
choose from than Fish and Game provide during their phone survey. Comparisons to
average fisher incomes estimated by Fish and Game are possible, but the ranges in my
survey provide the clearest possible picture of the income distribution of my
respondents.
Questions on county of residence and age were also included to establish
response trends, and address Research Question 1.1. These research questions
required the use of demographic information on county of residence, age, income, and
ethnicity to find out if they were significantly correlated to the likelihood of illegal
fishing. Logistic regression analysis on age, county of residence, and other
demographic information against RRT responses were to be used in the data analysis
to determine any trends. The ratio of locals to visitors would also be used for
verification of the data, because the California Department of Fish and Game collects
this information as well.
3.3.4 Regulation Awareness Survey
This section of the survey was included to address thesis Objective 2 and
establish whether there were any information gaps present between the California
Department of Fish and Game and the users of the resource itself. It sought to
establish firstly whether fishers knew there were regulations on size, daily take, and
annual take. Then, if they knew there were regulations, it sought to determine
whether they knew the specific limits. This information could illustrate if
management needs to make it a priority to improve the communication of regulations
to fishers.
Questions regarding fishing experience and fishing effort for the year 2006
were included in this section as well. These questions were intended to illustrate a
possible link between fishing experience, awareness of regulations, and illegal use.
This information could clarify if the regulation awareness of more seasoned fishers is
different to novice fishers. Fishing effort in the previous season could also be tied to
awareness in this way.

46
3.4 Semi-Structured Interviews – Objective 3
3.4.1 Sample Design
In order to get more information on the priorities and perspectives of red
abalone experts, three semi-structured individual interviews were conducted via
phone. The persons used for these interviews have direct roles in abalone
management, research, and enforcement.
Dr. Laura Rogers-Bennett is a Senior Biologist Specialist (Marine/Fisheries)
with the California Department of Fish and Game. Her research primarily
investigates the biology and ecology of abalone and urchins, and she was one of the
preparers of the Abalone Recovery and Management Plan (2005). She published six
articles in 2007, on topics ranging from red abalone (Haliotis rufesens) growth and
mortality, to an abalone enforcement method (Rogers-Bennett, Rogers, and Schultz,
2007; Rogers-Bennett and Melvin, 2007).
Peter Kalvass is a Senior Marine Biologist with the California Department of
Fish and Game who primarily focuses on invertebrate fisheries management. His
current role involves, amongst other things, deriving estimates of fisher catch and
effort for the recreational abalone fishery, through a combined abalone report card
and telephone survey (Kalvass and Geibel, 2006). He was also one of the preparers of
the Abalone Recovery and Management Plan (2005), and the information he collects
about the recreational fishery is vital to setting catch limits under that plan.
Gary Combes is a Warden for the California Department of Fish and Game.
He patrols Mendocino County, where he contacts resource users to enforce
regulations as well as to educate the public about coastal resources and management
provisions. His personal experience with abalone fishers, knowledge enforcement
techniques, and frequent contact with non-compliant individuals gives him a unique
perspective on the status of the fishery and the success of management measures.
When each individual was approached for the interview, they were emailed an
information sheet about the study, the general topics which would be addressed in the
interview, and a copy of the participation consent form (Appendix 5). Participation
with the interview was completely voluntary. Quotes were only attributed to
interviewees who specifically consented and initialed that they would allow it,

47
otherwise it was explained that all comments would be kept confidential. The consent
forms were signed prior to the interviews and were mailed back.
3.4.2 Interview Data Collection
The interviews lasted an average of 35 minutes, and covered topics
surrounding illegal abalone harvest and abalone management concerns. A semi-
structured interview method was chosen because it allows for some structure, while
not limiting the responses of the interviewees. In this way it gets the responses that
are at the fore-front of each person’s mind, without putting words in their mouth by
offering multiple-choice, or allowing the interviewer to exercise excessive control
(Bernard, 2002). In addition, the casual style of semi-structured interviews allows for
more relaxed responses and creativity, which was desirable when asking for suggested
improvements to management (Bernard, 2002). Furthermore, the experts interviewed
were very busy and so an expedient interview format was desirable. A semi-
structured method was therefore considered appropriate, because the literature
recommends it for interviewing “elite members of a community…who are
accustomed to efficient use of their time” (Bernard, 2002, p.205).
A question which asked the interviewees to rate a list of seven common
abalone violations according to that person’s perceptions of the greatest threats to
abalone in their region was emailed to the interviewees prior to their interview. They
were advised to rate them from high to low before the interview and to think about
those issues. Then, during the interview itself, their responses were recorded and
discussed as the interview progressed. The list of violations included behaviors such
as high-grading, failure to reattach abalone, daily take limit violations, annual take
limit violations, minimum size limit violations, failure to document take, and failure
to document location of take (see Appendix 6). Any quotes I wished to use were
authorized by interviewees via email prior to inclusion in this thesis.

48
3.5 Data Analysis
3.5.1 Survey Data Analysis
After the data were collected, a simple probability equation was used to
determine the number of users who answered “yes” to the sensitive question (see
Equation 1). Figure 3.2 indicates four possible responses to the standard two question
set. With the large sample size obtained the probability of getting heads on the coin
toss is 0.5. Similarly, the probability of drawing the innocuous question is also 0.5.
Therefore, the probability of “yes” responses to the innocuous question is 0.5 × 0.5 =
0.25. The study focuses on getting at the number of “yes” replies to the sensitive
question, but must first remove those who answered “yes” to the innocuous question.
The RRT formula from Fox and Tracy (1986) was used to calculate the proportion of
fishers engaging in illegal take:
Equation 1: RRT Probability Equation (Fox and Tracy, 1986)
Xx = ( [ – (1-p) y ] / p )
Equation 2: RRT Sample Variance Equation (Fox and Tracy, 1986)
Var(Xx) = (1-)/np2
y = known proportion of non-sensitive behavior = recorded proportion of “yes” responses p = probability of selecting the sensitive question n = number of respondents

49
Figure 3.3: RRT Probability Grid
Equations 1 and 2 were used to estimate violation proportions and variance for
the general population surveyed (Objective 1), and for local fishers versus visitors
(Research Question 1.1) with 95% confidence intervals. For Research Question 1.2, a
Mann-Whitney Test of significance was used to analyze the observed differences in
age, fishing experience, and frequency of fishing trips the previous season between
those who gave “yes” responses and those who did not. This method was the most
appropriate as RRT estimates proportions of violations, and is not designed to give the
researcher the exact number of respondents who answered with the target reply to the
sensitive question. Therefore, it can be informative to look at descriptive statistics to
help identify trends in the characteristics of respondents who answered positively
against those that gave a negative reply.
Further analysis of the RRT data against fisher traits for Research Question
1.2 used a backward stepwise likelihood ratio binary logistic regression to model non-
compliant behavior using socio-demographic variables. The variables included in the
analysis were fisher age, income, seasons fishing, times fishing in 2006, and county of
residence. This model was chosen because some of the variables, particularly income
and age, were correlated. Therefore a backward stepwise likelihood ratio regression

50
was the best option to help pick apart the influences of each variable, as opposed to a
backward Wald logistic regression (Field, 2005).
Research Question 2.1 was addressed by calculating the percentage of fishers
who answered the regulation awareness questions correctly, incorrectly, or
incompletely. Research Question 2.2 used a Mann-Whitney U test to illustrate any
significant differences in the mean awareness levels of fishers who replied “yes”
versus “no” to the RRT questions. A cross-tabulation was also used to look for
relationships between answering incorrectly to the regulation awareness questions and
the likelihood of answering with the target response to the RRT questions.
3.5.2 Interview Data Analysis
The information gathered during the semi-structured interviews contributes to
Objective 3. The responses of interviewees provide quotes regarding managerial
priorities within the abalone fishery, the effectiveness of current management
techniques for maintaining red abalone, and the impact and assessment of illegal
resource use. The responses of interviewees to the ranking question are used to
support this discussion, but due to the small number of experts interviewed, they are
not analyzed quantitatively.

51
Chapter 4
Results and Analysis
4.1 Chapter Introduction
This section presents information from three semi-structured interviews
regarding the priorities of abalone experts in Northern California, as well as
randomized response technique data and socio-demographic information from a fisher
survey.
4.2 Outcomes from Semi-Structured Interviews
Three semi-structured interviews were used to gain information regarding the
priorities of red abalone experts to inform the third objective. The interviewees were
given a rating question which was used to illustrate the importance they placed on
different types of violations. All three interviewees rated annual take limit violations
as a high threat, illustrating that it is the greatest concern of the violation types
provided. Daily limit violations were rated the second highest threat, followed by
minimum size limits, failure to reattach abalone, and high-grading. Failure to
document take was rated differently by each interviewee, but there was agreement
that failure to document take location was a low threat. Gary Combes added that
altering the abalone report card to under-represent take is a very low threat, but one he
regularly encounters. He went on to rank the violation types he most frequently
encounters in the field while patrolling (see Table 4.1).
Once the rating question had been discussed, the interviewees were asked to
describe the greatest threats to red abalone in Northern California. All three of them
agreed that poaching poses the greatest threat. Dr. Rogers-Bennett elaborated by
saying that there is not a big problem with disease in the north, because water
temperatures are low enough that symptoms of withering syndrome (“Canidatus
Xenohaliotids californiensis”) are not expressed (Friedman et al, 2000; Bower, 2003).
She also said natural predation by the California sea otter is not a problem at this time,

52
because otters have not made a good recovery in the northern part of the state.
Warden Gary Combes ruled out pollution as a major threat, stating that coastal waters
are in good condition in Northern California.
Table 4.1: Violation Encounter Frequencies of Warden Gary Combes
Frequency Violation Type
1 (Most) Daily Take Limit Violations
2 Failure to Re-Attach Abalone
3 Failure to Document Abalone Take
4 High Grading
5 Failure to Document Abalone Location
6 Minimum Size Limit Violations
7 Annual Take Limit Violations
8 (Least) Altering of Abalone Report Card
Overall, despite admitting that illegal take is having a negative impact on
abalone management, all three interviewees felt the current abalone limits are
working. Peter Kalvass stated “From what I can see it seems like [the abalone
population] is okay. There are no red flags from index dive stations and estimated
legal take is lower than historical levels”. Warden Gary Combes went on to say “I
feel that in terms of compliance the current system is pretty good”. However, the
interviewees were also in general agreement that the current methods for estimating
non-compliance are insufficient and inaccurate. Warden Gary Combes said the
current estimates “are just guesses from enforcement data and roadblocks”, and Peter
Kalvass stated that “estimates of illegal take only mean something to management if
they are accurate”. Dr. Laura Rogers-Bennett explained that an accurate illegal take
estimate would be very important to management, because it could be added on to the
legal take to estimate the Total Allowable Catch (TAC) and set management targets
that would be more sustainable.
In order to ascertain how management is currently monitoring illegal take, the
interviewees were asked which data collection methods are the most useful. The
responses given by interviewees varied widely. Dr. Laura Rogers-Bennett said
citation data from big busts of poachers gets at the commercial side of illegal take,

53
while roadblocks help managers get a feel for the more moderate low-level re-
occurring violations. Peter Kalvass said the fishery-independent biological surveys
are useful for looking at the overall health of the stocks, while the telephone surveys
gather information from the “cheaters”. Finally, Warden Combes thought experience
was one of the most important ways to monitor illegal activity. He feels the
familiarity wardens have with common locations of illegal take, rosters of known
violators, and communication with other wardens is important for staying on top of
violation levels. All three respondents agreed that new methods for gathering
information about illegal activity within the fishery would be very helpful.
Overall, the interviewees indicated that the framework of the current system is
good, but there are gaps where further information could improve the sustainable
management of red abalone. The rating question indicated that violations of fisher
take regulations (e.g. annual, daily, and size limits) threaten the resource and are
therefore of greatest interest to these abalone experts.
4.3 Fisher Survey Results
4.3.1 Response Rates
Three hundred and forty fishers were approached to participate in this survey.
The final response rate was 82% (279 of 340 approched). Approximately 0.8% of the
total abalone fishing population of 35,180 were surveyed (Kalvass, 2007). Response
rates for the survey were affected by the ability of the respondent to speak and read
English, and 8% of the abalone fishers who were approached, primarily those of
Asian descent, did not participate for language reasons. The lack of representative
data for this group introduced some cultural bias into the data, which could have been
remedied by conducting the survey with a translator to explain the procedure to
respondents and by translating the survey form. However, due to budget constraints
and the lack of available translators, translation was not possible for this project. The
survey took respondents an average of eight minutes to complete.

54
4.3.2 Respondent Socio-Demographics
Socio-demographic questions were included in the survey in order to assess
whether the survey respondents were representative of the overall abalone fisher
population, as well as to allow for an analysis of how these traits may affect reported
rates of violation.
4.3.2.1 Income
The distribution of fisher income from the survey is comparable to that found
in telephone surveys conducted by the California Department of Fish and Game
(Kalvass, 2007). The average annual income of fishers surveyed was $51,000-
$75,000, with over half of fishers reporting incomes between $26,000 and $75,000
(See Figure 4.1). Fish and Game report an average fisher income of $60,000-$90,000
(Kalvass, 2007). Both the survey and Fish and Game statistics estimate the average
income of abalone fishers to be above the California state average of $49,894 (U.S.
Census Bureau, 2008, http://quickfacts.census.gov ).
6%
25%
26%
19%
12%
6%5% 1%
0-$25,000
$26,000-$50,000
$51,000-$75,000
$76,000-$100,000
$101,000-$125,000
$126,000-$150,000
$150,000+
No Answ er
Figure 4.1 Average Incomes of Survey Respondents

55
4.3.2.2 Ethnicity and Gender
As discussed earlier, this study under-represents the Asian population because
of language barriers to participation in the survey. This shortage of data on Asian
fishers would result in inaccurate conclusions about the importance of ethnicity in
influencing the likelihood of illegal behavior. Thus, the data were not used for
statistical modeling. The ethnic composition of survey respondents is illustrated in
Figure 4.2.
Gender was also excluded from the analysis because there was an
overwhelming majority of 92% male respondents to the survey. This proportion
accurately represents the makeup of the abalone fishing community, but the small
sampling of female fishers made an isolated investigation of any gender effects on
RRT data patterns impossible.
74%
10%
5%
5%4% 2%
White
Asian (Chinese)
Asian (Japanese)
Asian (Other)
Hispanic
Native American
Figure 4.2: Respondent Ethnicities
4.3.2.3 Fishing Experience and Age
In order to target Research Question 1.2, and determine whether a certain
sector of the recreational fishing population engages in illegal red abalone take more
than others, several demographic and fishing experience questions were asked.
Questions were included in the survey about respondents’ ages, the number of seasons
they have been an abalone fisher, and how many times they fished during the previous

56
season in 2006 (see Table 4.2). California Fish and Game estimated a mean fisher
effort of 3.15 days in 2005 which is comparable to my mean answer of 4 days fished
in 2006 (Kalvass, 2007). The mean age of participants in the survey was 43.5 years,
which is comparable to the mean fisher age found by California Fish and Game of
45.8 (Kalvass, 2007).
Table 4.2 Respondent Age and Fishing Experience
Mean Median Maximum Minimum Standard Deviation
Fisher Age (years) 43.5 44 67 18 13
Seasons Fished (seasons)
13 10 41 0 11
Times Fished in 2006 (days) 4 3 30 0 4.6
4.3.3 General RRT Results
As discussed in the methodology chapter, the first section of the survey
completed by respondents used the randomized response technique to estimate levels
of non-compliance with regulations of the California recreational abalone fishery.
Table 3.2 below reviews the questions that were included in the RRT section. In all
of the randomized response questions the targeted sensitive reply was a response of
“yes”, except for RRT 1 where a “no” response was sensitive. The results are outlined
in Table 4.3.
Table 3.2: Randomized Response Technique Survey Questions
RRT 1 Do you have a valid fishing license for collecting abalone?
RRT 2 In the past year have you ever taken abalone under the minimum legal size limit?
RRT 3 Did you take more than 24 abalone total last season?
RRT 4 In the past year have you ever taken more than 3 abalone per day?
RRT 5 In the past year have you ever taken more than 6 abalone per day?
RRT 6 In the past year have you ever taken more than 9 abalone per day?
RRT 7 In the past year have you ever taken more than 12 abalone per day?
Innocuous Did you get heads on the coin toss?

57
Table 4.3: General Survey Results for RRT
RRT Question and Associated Target
Response
Tally of Total Target Responses
Estimated Proportion
Admitting to Sensitive Behavior
RRT 1 “No” 96 19% ± 0.006
RRT 2 “Yes” 102 23% ± 0.006
RRT 3 “Yes” 91 15%± 0.006
RRT 4 “Yes” 111 29% ± 0.006
RRT 5 “Yes” 85 11% ± 0.006
RRT 6 “Yes” 74 3% ± 0.006
RRT 7 “Yes” 73 2% ± 0.006
RRT1 RRT2 RRT3 RRT4 RRT5 RRT6 RRT70
0.05
0.1
0.15
0.2
0.25
0.3
0.35
RRT Questions
Estim
ated
Pro
porti
on o
f Ille
gal A
ctiv
ity
Figure 4.3: General RRT Survey Results
Using RRT, I estimate 19% of fishers do not have a valid fishing license to
collect abalone. This could mean they do not hold a valid fishing license in the state
of California, they do not have a 2007 abalone report card, or they have illegally
purchased a second report card in one abalone season. Thus, all of the abalone these
fishers collect would be considered illegal take.

58
Furthermore, an estimated 23% of fishers admit to taking abalone that were
under the seven inch minimum size limit, and 15% took more than the annual limit of
24 abalone in the previous season. Abalone take over the annual limit would not be
factored into management estimations of the Total Annual Catch, and would thus be
surplus take not being managed.
Additionally, an estimated 29% admitted to taking more than three abalone in
a single day in the last year. However, the positive response rates quickly drop when
asked if they have taken more than six, nine, or twelve red abalone in a day, as
illustrated in Figure 4.3.
4.3.4 Analysis of Variables
In order to uncover trends within the responses of the population surveyed, a
further analysis was conducted. RRT has the potential to aid managers in identifying
characteristics of violators when a traditional survey with socio-demographic
questions is linked to RRT responses. This section will present tables outlining the
results of a backward stepwise binary logistic regression, and other statistical tests
that make comparisons between RRT responses and socio-demographic strata, to
establish which factors have a significant effect on the RRT responses.
4.3.4.1 Locals vs. Visitors
To see violation trends within the fishing population surveyed the data were
broken down based on several demographic strata. The first was based on county of
residence and addressed Research Question 1.1. The 59 surveys that identified their
county of residence as Sonoma or Mendocino were termed “local”, and compared to
the 120 responses from “visitors”, living outside these counties (see Table 4.4).
Locals made up 21% of the surveys collected, which is comparable to the year 2000
estimate from the Abalone Recovery and Management Plan that local residents make
up 22% of the abalone fishing population (CDFG, 2005). Due to the small number of
surveys identified as locals, the RRT estimates for that group have much broader
confidence intervals.

59
Table 4.4: RRT Results for “Locals” vs. “Visitors”
Results for “Locals”
Results for “Visitors”
RRT Question
and
Associated
Target
Response
Tally of Total
Target Responses (n = 59)
Estimate of Proportion
Admitting to Sensitive Behavior
Tally of Total Target
Responses (n = 120)
Estimate of Proportion
Admitting to Sensitive Behavior
RRT 1
“No”
20
18% ± 3%
76
19% ± 1%
RRT 2
“Yes”
20
18% ± 3%
82
25% ± 1%
RRT 3
“Yes”
15
1% ± 3%
76
19% ± 1%
RRT 4
“Yes”
36
72% ± 3%
75
18% ± 1%
RRT 5
“Yes”
20
18% ± 3%
65
9% ± 1%
RRT 6
“Yes”
15
1% ± 3%
60
5% ± 1%
RRT 7
“Yes”
15
1% ± 3%
58
3% ± 1%
Less than one percent of locals admitted to taking more than the annual limit
of 24 in the 2006 season (Figure 4.4). This is a surprising result because locals have
easier access to the abalone simply by proximity, and so it would be understandable to
expect them to take more animals throughout the year. However, locals are
significantly more likely to take more than three abalone per day (Phi = 0.225, p <
0.001). Seventy-two percent of locals admitted to violating the daily limit during the
2006 season. Unfortunately, privacy laws prohibited me from gathering information
directly from returned punch-cards which may have helped validate these findings.
None of the other RRT questions were significant with county of origin.
These data show that 24% of visitors are estimated to have admitted to taking
abalone under the legal size, with 19% admitting to fishing without a license/punch-

60
card, taking more than twenty-four abalone a year in 2006, and taking more than three
in a day respectively.
RRT1b RRT2b RRT3b RRT4a RRT5b RRT6b RRT7b
-0.1
0
0.1
0.2
0.3
0.4
0.5
0.6
0.7
0.8
RRT Question
Estim
ated
Pro
porti
on o
f Ille
gal A
ctiv
ity
Figure 4.4: RRT Results for “Locals” vs. “Visitors” (Blue bars indicate locals, red visitors; “a” indicates difference between bars p < 0.05, “b” indicates no significance)
4.3.4.2 Descriptive Statistics
The descriptive statistics revealed in Tables 4.5 to 4.7 illustrate the mean and
median ages, seasons fished, and times fishing in 2006 of respondents who answered
“yes” versus “no” to the RRT questions. The raw data show a slight trend for the
younger, less experienced, and less frequent fishers to answer survey questions with
the sensitive target reply. However, when a Mann-Whitney test was performed, only
the first RRT question showed a significant difference between the ages of “yes”
respondents and “no” respondents. While these respondent traits did not prove to be
universally significant in these data, it is nonetheless worth noting such trends.

61
Table 4.5 Descriptive Statistics of RRT Responses and Age Age
Question Response Mean Median P Value Mann-Whitney U
Yes 44.0 42.7 RRT 1
No 42.7 41.0 0.428 7280
Yes 45.3 47.0 RRT 2
No 42.5 42.0 0.108 7027
Yes 43.2 44.0 RRT 3
No 43.7 43.0 0.672 7410
Yes 42.7 42.0 RRT 4
No 44.1 45.0 0.396 7855
Yes 42.0 40.0 RRT 5
No 44.3 46.0 0.187 6667.5
Yes 44.6 44.0 RRT 6
No 43.1 44.0 0.387 6457
Yes 43.3 42.0 RRT 7
No 43.7 44.5 0.867 6602
Table 4.6: Descriptive Statistics of RRT Responses and Seasons Fished
Seasons Fished Question Response Mean Median P Value Mann-
Whitney U Yes 14.5 12.5
RRT 1 No 10.4 8.0
*** 0.012 7175
Yes 13.7 10.0 RRT 2
No 12.8 10.0 0.568 8657
Yes 13.5 10.0 RRT 3
No 13.0 10.0 0.988 8544.5
Yes 12.5 9.0 RRT 4
No 13.5 10.0 0.287 8623
Yes 12.0 9.5 RRT 5
No 13.6 11.0 0.541 7866.5
Yes 13.8 14.0 RRT 6
No 12.8 10.0 0.251 6904
Yes 12.4 10.0 RRT 7
No 13.4 11.0 0.507 7126
Age was most significant for RRT 2 and RRT 5, but none of the questions was
95% significant with age (see Table 4.5). As illustrated in Table 4.6, a Mann-
Whitney test revealed a significant difference in the number of seasons fished by a
respondent who answered “yes” to one who answered “no” when asked if they had a
valid fishing license (RRT 1). This indicates that less experienced fishers are more

62
likely to answer with the target response of “no”, implying more of them violate.
There was no statistically significant difference in the number of times fishing the
previous season between the two response groups.
Table 4.7: Descriptive Statistics of RRT Responses and Times Fishing in 2006
Times Fished in 2006 Question Response Mean Median P Value Mann-
Whitney U Yes 4.0 3.0
RRT 1 No 4.6 3.0
0.353 8194.5
Yes 4.0 3.0 RRT 2
No 4.2 3.0 0.838 8895.5
Yes 3.4 3.0 RRT 3
No 4.6 3.0 0.218 7783
Yes 3.8 2.5 RRT 4
No 4.4 3.0 0.320 8674
Yes 4.4 3.5 RRT 5
No 4.0 3.5 0.469 7800
Yes 5.0 3.0 RRT 6
No 3.8 3.0 0.207 6840
Yes 3.3 2.0 RRT 7
No 4.5 3.0 0.185 6740
4.3.4.3 Regression Analysis of Survey Variables
In order to examine further if any of the demographic or experience variables
could be linked to the likelihood of answering with the sensitive response to specific
RRT questions, a backward stepwise likelihood ratio logistic regression was
performed to model observed responses. The variables included in the regression
were: seasons fished, times fishing in 2006, age, income, and status as a local or
visitor. The results of the analysis are described in Table 4.15 below. The regression
was performed for all seven RRT questions, but the results for RRT 5-7 did not
provide significant models or variables. Overall, the regression models for RRT 1-4
are significant, however the strength of fit of the models (R2 range from 0.021-0.119)
indicates that they are unable to describe much of the variance in RRT responses. In
other words, none of the socio-demographic variables are consistently good predictors
of violation, and there is no variable that was measured for this study that would allow
for the profiling of potential violators.

63
Table 4.8: Backward Stepwise (Likelihood Ratio) Logistic Regression of RRT Variables
RRT Question
Model Variable
Variable Sig.
Exp(B) Nagelkerke R2 of
Model
Sig. of Model
Times Fishing in
2006 0.050 1.057 RRT 1
Fishing License Seasons
Fished 0.002 0.956
0.064 0.002
Income ($101,000- 150,000+)
- 1.0
Income ($0-
50,000) 0.042 0.452
Income ($51,000- 75,000)
0.047 0.460
Income ($76,000-100,000)
0.642 0.819
RRT 2 Undersized
Take
Age 0.039 0.977
0.048 0.054
RRT 3 Violating
the Annual Limit
Times Fishing in
2006 0.067 1.065 0.021 0.046
Income ($101,000- 150,000+)
- 1.0
Income ($0-
50,000) 0.005 2.978
Income ($51,000- 75,000)
0.621 1.201
Income ($76,000-100,000)
0.106 1.951
Age 0.092 1.019
RRT 4 Taking >3 Abalone Per Day
Sonoma or Mendocino
County Resident
0.000 0.287
0.119 0.000

64
4.3.5 Fisher Awareness of Regulations
Several questions were asked in the survey about respondent’s awareness of
red abalone take regulations to address Objective 2. These data were collected in
order to establish whether a significant information gap may be contributing to
violation rates. However, Figure 4.5 and Table 4.9 illustrate that the vast majority of
fishers not only know that there are limits, but with the exception of the annual take
limit, most fishers can state the regulations from memory. Many fishers who did not
know the annual limit stated after the survey that they did not know it because they
never fished enough to reach it. Nonetheless, only 44.8% of respondents answered
the question about the annual limit completely and correctly, while 93.5% correctly
answered the daily limit question.
One limitation with the method used here should be identified. The survey
questions may have been leading questions, because the RRT portion of the survey
needed to be completed first, but it was composed of questions that contained
numbers relating to take limits. Several of the RRT questions asked fishers if they
had taken more than “x” number of abalone in “y” timeframe. Though respondents
were not told that the numbers and timeframes in the RRT questions reflected
regulation levels, it may have been implied. Thus, the estimates of fisher awareness
of regulations are over-estimates, a result which will be further addressed in the
discussion chapter.
Size Limits Daily Limit Annual Limit0%
10%
20%
30%
40%
50%
60%
70%
80%
90%
100%Answer Type
Pro
porti
on o
f Res
pons
es
No Answer
No
Don't Know
Yes, WroteWrong LimitYes, LeftSpace BlankYes, WroteCorrect Limit
Figure 4.5: Fisher Awareness of Regulations

65
Table 4.9: Proportional Responses to Regulation Awareness Questions
Question: Are there
minimum size limits
for abalone?
Question: Are there daily
Fishing quantity limits
for abalone?
Question: Are there
annual Fishing quantity
limits for abalone?
Answered “Yes” 92% 96% 74%
• Percent Who Answered Yes and Wrote Correct Limits
79% 93.5% 44.8%
• Percent Who Answered Yes but Wrote Incorrect Limits
10% 1.8% 15%
Gave Answer Above Limit
7% 0.8% 11%
Gave Answer Below Limit
3% 1% 4%
• Percent Who Answered Yes but Left Space Blank
2.5% 0% 24%
Answered “No” 0% 0% 0%
Answered “Don’t Know” 2.8% 0.7% 13.7%
No Answer 5.7% 4% 2.5%
Overall, respondents had a very high level of regulation awareness (Figure
4.5). However, the question asking fishers about the annual take limit received many
incorrect answers of 30 abalone/per year (Table 4.10), indicating that some fishers are
still not aware the limit has been reduced.
Table 4.10 Common Incorrect Responses To Limit Questions
Most Common Answer Below
Limit Actual Limit
Most Common Answer Above
Limit Size Limits 6 inches 7 inches 7.25 inches
Daily Limits 1 abalone/day 3 abalone/day 12 abalone/day Annual Limits 18 abalone/year 24 abalone/year 30 abalone/year
A Mann-Whitney U test found no significant difference in the mean awareness
level of fishers who replied “yes” versus “no” to the RRT questions. Furthermore, a

66
cross-tabulation of the data revealed no significant relationship between answering
incorrectly to the regulation awareness questions and the likelihood of answering with
the sensitive response to the RRT questions.
The survey also included questions regarding the sources of abalone regulation
information used by the fishers surveyed. This information is summarized in Table
4.11, and indicates that the two most common sources of information about abalone
take regulations are California Department of Fish and Game pamphlets, and word of
mouth among fishers. Option “a)” in Table 4.11, “NOAA”, was provided as a false
source, as they do not have involvement in setting regulations or distributing
information about recreational abalone take. A false source was provided in order to
see if people might select this option, which in effect would reveal that they did not
have the correct information, and may just be guessing.
Table 4.11: Source of Limit Information
a) NOAA 0.7%
b) CADFG website 16.5%
c) CADFG pamphlet 33.3%
d) CA fisheries officer 11%
e) A friend 26.5%
f) Other 12%
There were no respondents who circled more than one letter, but two people
circled “f” and then stated they gained information from all the sources except
NOAA. Seven of the respondents who selected “f” stated they gained their
information from the “Fish and Game Book”, which is distinct from pamphlets in that
is provides rules on many fishing activities and practices outside of abalone
collection. Of the responses marked as “f) other” the most common source was the
abalone report card itself, which suggests this could be provided as a survey choice in
the future.

67
Chapter 5
Discussion and Conclusions
5.1 Chapter Introduction
In this chapter the findings of the study will be discussed in the context of the
project objectives and research questions. The appropriateness of specific
methodologies to address the research question will be discussed, and potential
sources of bias identified. In addition, the aim of the project will be discussed and the
general policy and management implications of the study will be presented along with
supporting quotes from abalone experts in the Northern California fishery. The
chapter will conclude with a discussion of the implications of the results for the red
abalone fishery, other fisheries, and future research.
5.2 Estimating Illegal Behavior to Prioritize Violations
The first research objective of this thesis was to utilize the randomized
response technique (RRT) to estimate proportions of non-compliance for recreational
red abalone (Haliotis rufescens) fishers in Northern California, and analyze variables
which could influence those proportions. Non-compliance estimates allow for more
effective evaluation of the actual success or failure of management measures, and
provide insights into how the behavior of fishers may be impacting the resource
(Sumaila et al., 2006). Furthermore, estimates of violation rates for specific
regulations can be developed to help managers set priorities and manage enforcement
effort, to target the regulation types they see as essential to sustainability (Hughey et
al., 2003). Previous non-compliance estimates for the Northern California red
abalone fishery have not provided managers with reliable information about non-
compliance rates for specific regulations, or data regarding which socio-demographic
variables may affect violation behavior (Rogers-Bennett, Sen. Biologist Specialist
CDFG, pers. comm., December 21, 2007).

68
The results for the total sample have narrow confidence intervals and low
variance, indicating that they are quite reliable estimates for the overall population
(Figure 4.3). Cultural bias may have been introduced by the exclusion of 8% of
approached fishers due to language barriers. The Asian population was under-
represented in the data, and therefore, there is no way to predict the impact those
responses would have had on the estimates. However, given those fishers only
composed 8% of the fishers approached for this study, it is unlikely their responses
would have had a large impact on the results. Additionally, it must be noted that the
general RRT results are still likely to be under-estimates of actual illegal take, because
it is assumed that despite using the randomized response technique to reduce response
bias, there will still be participants who give evasive responses regardless of the
survey instrument (Chaloupka, 1985).
The general results of the RRT survey can be used to rank violation types and
illustrate compliance problems. I estimate that 29% of the fishers surveyed had
violated the daily limit of three abalone in the last season, while only 11% had taken
more than 6 abalone in a day, 3% had taken more than 9 abalone and 2% took over 12
abalone in a single fishing day. Minimum size limit violations were estimated to be
the second most common, at 23% non-compliance, followed an estimate of 19% non-
compliance with the fishing licensing laws. Finally, non-compliance with the annual
take limit of 24 abalone per year is ranked the fourth most common violation, at an
estimated 15%. With the ranked results of RRT, and their knowledge of the social
and ecological characteristics of the fishery, managers can prioritize certain violations
to reduce non-compliance.
Based on survey estimates and expert opinion, reducing non-compliance with
the daily take limit should become the top priority of red abalone managers in
Northern California. Though there are no data available to compare with the RRT
estimates, the personal experience of Warden Combes (pers. Comm., August, 2007)
supports the finding that daily take limits are the most common violation in this
fishery (see Table 4.1). Furthermore, the experts interviewed for this study rated daily
take limits the second highest threat to management. Concerns about daily limit
violations result from the important role of this measure in reducing point-source
depletion of the stocks and maintaining densities suitable for replenishment (Table
2.4).

69
The second priority of managers, as revealed by the results and interviews,
should be the reduction of annual take violations. All three experts interviewed for
this research felt annual limit violations posed a high threat to the sustainable
management of red abalone in Northern California. Despite the seemingly low non-
compliance estimate for this limit, managers are less willing to accept annual limit
violations because the rule serves a vital role in limiting legal extraction to within the
Total Allowable Catch (TAC) set by managers (CDFG, 2005). The TAC is designed
to maintain the stocks over the long term, and managers expressed concern that any
take above the annual limit of 24 abalone per fisher would not be included in the legal
catch estimates for the fishery, and would result in under-estimates of the Total Catch
(TC). Dr. Laura Rogers-Bennett explained, “If managers continually underestimate
take, the protective mechanisms outlined in the Abalone Recovery and Management
Plan which are designed to reduce the Total Allowable Catch (TAC) or even close the
recreational fishery if needed, may not come into effect in time to prevent long-lasting
reductions in abalone densities.”
Unfortunately, annual limit violations can be very difficult to detect with
conventional methods, particularly when they coincide with intentional falsification of
the abalone report card (G. Combes, CA Fish and Game Warden, pers. comm.,
November 15, 2007). These data show that RRT can help managers overcome the
challenge of estimating annual take limit violations, by allowing them to develop
violation estimates regardless of the evasive actions of violators.
As with annual limit violations, abalone removed by unlicensed fishers are
also not accounted for in management catch estimates. This violation type should
therefore be pursued in conjunction with annual take limit violations, as they both
have the same effect on the accuracy of catch estimations. As the Abalone Recovery
and Management Plan outlines, managers use estimates of the number of abalone
permit report cards purchased annually and effort statistics from the returned report
cards and phone surveys to estimate the annual total legal catch of red abalone
(CDFG, 2005). Thus, all take by the 19% percent of fishers who do not have valid
licenses will be excluded from these statistics.
Finally, the implications of the minimum size limit violation estimate for
management priorities are not clear. The experts interviewed disagreed about the
threat posed by this violation, because it impacts stocks differently in the long and

70
short term. Managers should discuss the proportion of non-compliance they consider
acceptable for this violation.
5.3 Profiling Illegal Behavior to Aid Priority Setting
The literature suggests managers need to expand on the non-compliance
estimates for the general population, by examining variables within the fishing
community that may be impacting violation rates (Hønneland, 1999; Sumaila et al.,
2006). For instance, ignorance of regulations and some socio-demographic variables
may affect an individual’s attitude towards risk and crime (Furlong, 1991).
Management agencies often struggle with limited staff and financial resources for
monitoring natural resources, and therefore must find ways to prioritize management
action (Davies, 1996; Mittermeier et al., 1998). Information about the regulatory
awareness and socio-demographic profile of a typical violator can aid managers with
priority setting by illustrating which sectors are the least compliant, and allowing
them to focus resources on encouraging compliance within that group (Hønneland,
1999; Sumaila et al., 2006).
5.3.1 Fisher Awareness of Red Abalone Laws
The RRT estimates from the general survey were first analyzed to establish
whether violation rates may be linked to low fisher awareness of specific regulations,
but the comparison revealed generally very high levels of knowledge regarding
abalone fishing regulations (Figure 4.6). The question regarding the limits on annual
take resulted in the highest proportion of incorrect and incomplete responses, because
while 74% were aware limits existed, only 45% of respondents answered completely
and correctly. The question on minimum size limits had the second lowest proportion
of correct answers with 79% answering completely and correctly out of the 92% that
indicated there were limits, followed by the daily take limit question which had 93.5%
out of 96%.
The generally high level of awareness of abalone regulations among the
fishers surveyed indicates that abalone control measures are being successfully
conveyed by managers to that group. However, the results of this part of the survey,
as with the RRT results, could be subject to cultural or language bias. The majority of

71
fishers accessed regulation information for abalone collection from written California
Fish and Game sources (e.g. pamphlets, websites, report card, books), and these
pamphlets are printed exclusively in English, despite the fact that many abalone
fishers may not speak or read English. Therefore, the 8% of fishers approached who
did not complete the survey due to language barriers may have had reduced regulation
awareness as compared to the English speaking fishers, due to their dependence on
non-written sources.
Response-order-bias may have also influenced this part of the survey (Israel
and Taylor, 1990). As mentioned in the methodology chapter, the RRT section was
always administered before the regulation awareness section. The RRT method may
have encouraged respondents to mark “yes” who otherwise would not have, by
suggesting through the line of questioning that the numbers used in the sensitive RRT
questions were based on regulations For example, the question “Did you take more
than 24 abalone total last season?” may have suggested to fishers that 24 is the annual
limit. While the word “regulation” was not used in the RRT questions, and there was
only a fifty percent probability of drawing the sensitive question and seeing the
numbers used, it is still possible the trends in the line of questioning may have
influenced some respondents. Response-order-bias may therefore account for some
of the fishers who indicated there was a limit but that left the space for writing the
limit levels empty, or answered with incorrect limits. It is possible this bias also may
have contributed to some of the fishers who answered the limit correctly and
completely if they assumed the numbers included in the RRT section were the limits
and wrote them on the survey.
I found no significant relationship between regulation awareness and RRT
responses, indicating that those fishers who knew the abalone regulations were just as
likely to admit to illegal behavior as those who did not know the regulations. In other
words, the estimated proportions of violations from these two groups were roughly
equal. This is an important finding in terms of management priority setting, because
it implies that ignorance of red abalone regulations is not a major cause of illegal
behavior in the area surveyed, and suggests that managers are succeeding in
communicating the regulations to fishers. Therefore, managers do not need to expend
more effort attempting to increase the regulatory awareness of fishers, but can instead
focus resources on increasing compliance among fishers who knowingly violate.

72
5.3.2 Socio-Demographic Variables as Predictors of Non-Compliance
Socio-demographic variables have been found in other studies to influence
fisher decisions relating to compliance (Furlong, 1991; Hatcher et al., 2000; Sumaila
et al., 2006). Furlong (1991) found that older fishers were generally more compliant
than younger fishers, as younger fishers were more prepared to risk getting caught.
Furthermore, fishers with more experience often have different violation rates to
novice fishers, and the present economic status of fishers, combined with the possible
gain from poaching, are key determinants of illegal behavior (Hatcher et al., 2000;
Sumaila et al., 2006). Several case studies have shown that low income individuals
are more likely to engage in illegal fishing behavior, because the marginal benefit
they would gain from violation is higher than that of someone with a high income
(Furlong, 1991; Faasen and Watts, 2007).
This study could not fully explore the effects of gender on compliance due to
the small number of female respondents, and ethnicity was excluded from the analysis
due to cultural and language barriers which would have biased the conclusions.
However, the socio-demographic variables that were analyzed with the survey (age,
income, local vs. visitor, seasons fished, and times fishing in 2006) could not form an
accurate demographic profile of non-compliant fishers with either the regression or
direct comparisons (see Tables 4.5-4.8). It can therefore be concluded that none of
these socio-demographic variables are good indicators of non-compliance in this
fishery.
It was expected that primarily demographic variables would not be adequate to
fully model all seven of the RRT questions. The compliance literature suggests socio-
demographic status may affect the decision to violate, but these variables are unlikely
to affect the degree of violation after the decision to act illegally has been made
(Furlong, 1991; Sutinen and Kuperan, 1999). Therefore, RRT questions 5-7 were
most likely influenced by other drivers, such as the level of enforcement and possible
social and financial costs and benefits, and did not result in significant models or
variables within the regression (Hatcher et al., 2000; Sumaila et al., 2006). Future
studies could focus an RRT survey on these alternate variables to improve the
predictive power of the regression models, but it appears that readily observable

73
demographic traits can not be correlated to an increase in illegal behavior at this time.
These results imply that management must spread enforcement effort evenly across
these socio-demographic sectors.
5.3.3 Locals vs. Visitor Illegal Behavior
The decision to violate environmental regulations is affected by moral and
social considerations, a fisher’s knowledge of the severity and intensity of
enforcement, and the financial incentives and penalties associated with violation
(Sutinen and Kuperan, 1999; Hatcher et al., 2000; Sumaila et al., 2006). In order to
illustrate any patterns in RRT responses, the surveys of fishers who live at close
proximity to the resource were examined against those residing at greater distances.
Compliance theory suggests management may be able to use this information when
setting enforcement priorities by focusing more resources on the group having the
greatest negative impact on the abalone (Hønneland, 1999; Hughey, Cullen and
Moran, 2003).
The results showed that visitors had higher estimated proportions of illegal
behavior for most RRT questions, which may partially reflect the higher fishing costs
they experience related to transportation and accommodation (Sumaila et al., 2006).
The only exception occurred when locals were asked if they had violated the daily
take limit. I estimate that 72% of locals took more than three abalone in a day the
previous season, and 18% took more than six abalone in a day. The estimation for
local violation of daily limits was significantly higher than for non-locals, 18% of
whom I estimate took more than three, and 9% over six in a day. This contrasts most
notably with the results of the question on annual take violations of locals and
visitors, for which an estimated 19% of visitors had violated the maximum take limit,
but less than 1% of locals had.
Overall, though local fishers may violate the daily limit to a greater extent than
visiting fishers, they are proportionally more compliant with the other regulations than
visitors. The literature suggests this trend could reflect different normative and
economic drivers operating between locals and visitors (Sumaila et al., 2006). The
non-compliance drivers of local fishers may be affected by the work of abalone
conservation groups and the general population who actively report illegal activities
to the California Turn in Poachers (CalTIP) program, and frequently run stories in

74
local papers about the court proceedings of poaching cases and details of large
abalone seizures (SCAN, 2008). Thus, locals may have a heightened perception of
government and community-based enforcement, and greater knowledge of the
penalties than visiting fishers. These findings have interesting implications for
managers when options are discussed in terms of the compliance literature.
5.4 Policy and Management Implications
Sumaila et al. (2006) suggest that the cost of fishing affects the perceived
benefit of illegal take, because fishers weigh the costs of fishing gear, accommodation
and transportation against the benefit of catch. They therefore assert that fishers with
higher fishing-related costs are more likely to want to take more catch as
compensation for their expenses (Sumaila et al., 2006). Warden Combes of the
California Department of Fish and Game confirmed that perceptions of fishing costs
can affect illegal take in the red abalone fishery when he described the mindset of
visiting fishers: “They’ve taken the time to come up here, spent the money, and
they’re not going home without their full limit of abalone. That mindset is part of the
reason we catch fishers filling their buddy’s bag limit in addition to their own”. These
fishing-related costs may partially explain why visitors have higher estimated
violation rates in most categories.
However, the literature suggests compliance is also affected by the possible
financial gains or losses associated with illegal action, as well as social norms, peer
pressure, and personal beliefs (see Figure 2.3). As the take limits and penalty levels
are the same for local and visiting fishers, and fishing-related costs vary from person
to person, it is likely that normative differences may also contribute to the observed
patterns of violation. The results of both the daily and annual limit questions could
reflect varying amounts of peer pressure amongst local and visiting fishers, and
different social norms regarding abalone limit compliance.
5.4.1 Annual Limit Violations

75
The compliance literature and normative theory would suggest that local
people may have a heightened awareness of abalone conservation issues in general,
simply due to proximity to the resource and community involvement (Sen and
Figure 2.3: Fishing Compliance Drivers and Example Measures (Adapted from: Sumaila et al., 2006)
Nielsen, 1996). This may play a role in Northern California as there are several
conservation groups in Sonoma and Mendocino counties, operating at both
community and regional levels, which support abalone compliance and education
projects (S.C.A.N., 2008, www.abalonenetwork.org ).
While this study did not ask respondents why they complied with regulations,
future studies could use RRT to investigate whether these conservation groups may
have successfully communicated the threat posed by annual take violations to local
communities, using social capital to increase the local perception of regulatory
legitimacy and enforcement (Heckathorn, 1990; Hønneland, 1999; Bowles and Gintis,
2002). Furthermore, the compliance literature suggests that households that are
financially dependent on a resource are generally more compliant (Furlong, 1991).
Local residents may see it as against their collective best interest to violate the annual
Driver 1 Level of Benefit
from Illegal Take
Driver 2 Probability of
Detection
Driver 3 Penalty Level If
Caught
Driver 4 Cost of
Avoiding Detection
Driver 5 Social Standing, Moral Outlook
-Global Price Control via
Market Measures
- Fines - Jail Terms
- Community Service
- Increased Enforcement
Effort - Special
Operations -Roadblocks
- Increased Visible
Enforcement Effort
- CalTIP
- Public Service Announcements - Education Programs - Community Programs
Exam
ple
Mea
sure
s fo
r Aff
ectin
g C
ompl
ianc
e D
river
s
Com
plia
nce
Dec
isio
n D
river
s
Compliance
Non-Compliance
Decision to Comply
Decision to Violate

76
limit, because the coastal economy is very dependent on red abalone to draw tourists
(Stone, 2002; LMID, 2007).
The estimates of local vs. visitor compliance, the general RRT estimate, and
the high level of concern about annual limit violations expressed by the experts
interviewed suggests that management may want to focus more effort on improving
compliance with this regulation. The estimate that only 1% of local fishers had
violated the annual limit implies that managers should prioritize efforts to reduce non-
compliance among visiting fishers, which may involve shifting resources to increase
the enforcement and education programs targeted at this group. As the compliance
literature suggests, increasing the level of enforcement effort at popular fishing sites
and letting more visitors know about the watchdog function of CalTIP and abalone
conservation groups such as SCAN, could help reduce violation levels among visitors
by increasing the perceived level of enforcement and affecting Drivers 2-4 (Sumaila
et al., 2006). Due to their disperse community origins, the literature suggest
economic-based tools may be more effective than normative measures in influencing
visitor behavior, but wider media coverage of abalone-related stories could affect
visitor consciousness of abalone conservation issues and the risks of violation (Bator
and Cialdini, 2000).
5.4.2 Daily Limit Violations
The first priority of management as revealed by the general RRT estimates,
should be improving compliance with the daily take limit. As previously discussed,
daily take limit violation rates of 29% among the general population, and 18% and
72% among visitors and locals respectively are of serious concern to management
because they represent the highest estimates of non-compliance found in the study
(see Figure 4.4). Furthermore, these estimates imply the effect of community
pressure to comply with regulations, which may be reducing annual limit violation
rates in the local community, is incomplete. These findings illustrate the need for
managers to focus greater attention on daily take limit compliance. With so many
fishers (especially locals) exceeding the daily take limit, red abalone populations
could suffer from point-source depletion, and adult densities could be reduced enough

77
to result in poor abalone recruitment in those areas for years to come (Karpov et al.,
2000).
However, during informal conversations with respondents who had just
completed the survey, over a dozen local fishers independently expressed the view
that local residents should be able to take more than three abalone in a day as long as
they complied with the annual limit and still reported their take to managers. These
comments seem to illustrate that local fishers do not consider the daily limit to be
legitimate in the context of their community, reducing their inclination to comply
(McCay, 1980; Hønneland, 1999).
Among other reasons, this perspective may stem from a lack of understanding
of the point-source depletion issues that the daily limit manages (CDFG, 2005).
Programs which raise awareness of the threats posed by point-source depletion could
help to increase compliance by boosting fishers’ perceptions of the legitimacy of daily
limit regulations (Hønneland, 1999). Though daily limit violation is not only a local
problem, these programs could be readily implemented along the coast with the help
of the community groups already operating, and could reduce the extreme levels of
daily limit non-compliance among local fishers. In addition, informing both local and
visiting fishers of the high fine levels for daily limit violations, and continuing to
patrol fishing areas may reduce the number of fishers who choose to violate by
increasing their perceptions of the costs of violation (Sumaila et al., 2006).
5.4.3 Minimum Size Limit Violations
Similar techniques could be used to combat violations of the minimum size
limit. While the results showed that 23% of the fishers had taken undersized abalone
(see Table 4.2), making it the second most common violation type, minimum size
limit violations may not be as urgent a problem for management as the other violation
types. Both Peter Kalvass, a Senior Marine Biologist, and Dr. Laura Rogers-Bennett,
a Senior Biologist Specialist, rated the taking of sub-legal sized abalone as a moderate
threat to red abalone management, but their explanations for their ratings differed.
Peter Kalvass noted that in the last decade fishery-independent dive surveys have
found fewer sub-legal abalones than in previous estimates. He is concerned that if
poor recruitment continues, the sustainability of the species could be threatened as

78
there may not be enough juvenile red abalone to replace the large adults being
removed by fishers and natural mortality. However, from the perspective of Dr.
Laura Rogers-Bennett, undersized take is not of high importance because small
abalone are not as prolifically reproductive as larger individuals. Red abalone are
slow growing, but the egg production of females increases exponentially with body
length until they reach a peak reproductive size of 215 mm (8.5 inches) (Rogers-
Bennett et al., 2004). Therefore, immature abalone, or those that have become
reproductive but are sub-legal in size, are not as important to replenishing the
population; and, Dr. Rogers-Bennett suggests, losing large females, rather than small
ones, is the most pressing threat to sustainable abalone management.
As with the other violation types, improved compliance with this measure may
result from the introduction of programs to educate fishers about the link between size
and reproduction in red abalones. This information may improve fisher perceptions
of regulatory legitimacy by helping fishers better understand how their actions affect
the future of the resource (Hønneland, 1999). Continued enforcement of the size limit
is also important to help control the take of sub-legal red abalone and ensure that
these animals reach legal size in the future, but expert opinion seems to suggest the
other violations are of more immediate concern to managers.
Over the long term, managers should also consider other regulatory tools
which have been designed and implemented in fisheries to address concerns about
maintaining a stock of large reproductive individuals over the long-term (Reef Fish
Stock Assessment Panel, 1992). The introduction of an upper size limit as well as a
minimum size limit (slot-size limits) secures the reproductive capacity of the abalone
population by maintaining the stock of large females (see Table 2.4) (Reef Fish Stock
Assessment Panel, 1992). Unfortunately, as Dr. Rogers-Bennett explained, such
regulations would be difficult to implement in a trophy fishery such as the
recreational red abalone fishery, because fishers enjoy competing for the biggest
animals. For that reason, regulations which would limit the maximum size of take
from this fishery would be difficult to implement, and would most likely encounter
stiff resistance from resource users. Nonetheless, a slot-size limit may be an option
worth serious consideration if there continues to be high levels of legal and illegal
take and reduced recruitment.

79
5.5 Recommendations for Management
This thesis has resulted in several key recommendations for managers in the
Northern California red abalone fishery, and fisheries worldwide.
5.5.1 Red Abalone Management in Northern California
Managers should continue to focus enforcement effort on the priority areas
revealed by the RRT estimates. Reducing the proportion of daily take violations by
locals should be a top priority, as should the overall reduction of annual take limit and
licensing violations. However, enforcement effort should be evenly spread across all
socio-demographic sectors of the fisher community, and not focused on one group.
Management may benefit from partnerships with local abalone/marine conservation
groups that can take advantage of social capital to increase awareness of point-source
depletion and violation penalties. Several conservation organizations presently lend
time to help with management efforts, so these relationships could be readily utilized
without much delay (SCAN, 2008, www.abalonenetwork.org ). Furthermore,
dialogue about the acceptable level of minimum size limit violations should be
undertaken, and alternate strategies for maintaining a breeding stock (such as slot-take
limits) should be explored.
The results of this study strongly suggest red abalone managers in Northern
California should continue to use the randomized response technique to estimate non-
compliance in their fishery. This method has resulted in estimates of proportional
violation rates for four regulation types, allowing management priorities to emerge
based on estimates and expert opinion. Managers did not previously have access to
reliable non-compliance estimates for individual violation types, which would have
allowed them to prioritize in this way, and this study provides baseline data with
which future estimates can be compared. Such comparisons could provide managers
with a reliable way to assess the impact of new measures on compliance, and could
therefore aid in monitoring compliance levels for adaptive management.
The use of RRT should also be expanded to allow for the quantification of
illegal recreational take. Quantitative RRT methods have already been developed,
and could be readily adapted to analyze the red abalone fishery (Fox and Tracy,

80
1986). At present management is estimating Total Catch (TC) by combining legal
take figures from abalone permit report cards and phone interviews, with very rough
illegal take estimates from roadblocks and citation figures. Using RRT would take
the guess-work out of estimating illegal take, and would result in a more precise TC
estimate. This estimate could be used when assessing the TAC and setting
management priorities.
Furthermore, quantitative RRT methods could also be used to estimate illegal
take for different regulation types, including other violation categories not included in
this study (e.g. high-grading, failure to reattach abalone, documentation violations) in
order for management to see all aspects of non-compliance and estimate the impact of
unreported fishing-related mortality (CDFG, 2005). Research could be conducted
which would tie violation proportions to specific locations in order to determine the
sites with the greatest level of daily limit violations. These data would allow
enforcement officers to target non-compliance more efficiently, and would give
managers additional information about which areas could be suffering from point
source depletion.
RRT methods should also be developed to investigate the non-compliance
drivers operating within the red abalone fishery, to help management set priorities and
targets for enforcement (Sumaila et al., 2006). The extent to which compliance is
affected by normative influences such as social norms and peer pressure could be
investigated to clarify some differences between local and visiting fishers
(Hønneland, 1999). Barriers to compliance that undermine managerial authority and
reduce conservation success, such as negative peer pressure, language barriers,
biological factors, or certain traditional practices and social norms, could be identified
with RRT (Hønneland, 1999).
While managers may consider some of these factors difficult to manipulate,
the literature suggests an understanding of the compliance barriers operating in a
fishery is essential (Hønneland, 1999). With this information managers could begin
investigating ways to increase perceptions of managerial legitimacy, which normative
theory suggests could greatly affect compliance (Hønneland, 1999; Sumaila et al.,
2006) Enforcement efforts and programs could be designed to counteract negative
social influences. For instance, persuasion theory could be used to develop signs or
public service announcements which would mobilize action against violation, and
could be specifically targeted at local or visitor demographics (Bator and Ciladini,
81
2000; Cialdini, 2003). These messages could both educate the public about abalone
issues, and emphasize the development of positive social norms and mutual
enforcement.
5.5.2 Implications for Other Fisheries
Studies utilizing the randomized response technique could be applicable to
many fisheries world-wide. RRT is a versatile method which could easily be adapted
to aid managers in estimating fisher non-compliance for many species. Other studies
have successfully used RRT to investigate compliance with shell collection permits
and freshwater fishing gear restrictions (Chaloupka, 1985; Schill and Kline, 1995). In
this study, RRT has shown itself to be an effective tool for highlighting compliance
concerns, analyzing associated variables, and helping managers set priorities.
Fisheries with a large number of users are best suited for this method, because
large sample sizes reduce variance and result in more robust estimates (Fox and
Tracy, 1986). Therefore, areas where resource users are aggregated and easily
contacted are best for allowing researchers to encounter enough respondents
(Chaloupka, 1985). It is also important that research is not conducted by individuals
who are in a position of power over respondents (e.g. wardens employed by the
management body), because fishers may have feelings of resentment or fear towards
these individuals which could bias results or lower response rates (Fox and Tracy,
1986). Finally, it would be advantageous to have translators available if required, and
to employ surveyors of similar social and cultural backgrounds to respondents in
order to reduce possible cultural biases.
5.6 Chapter Summary/Conclusions
This research has shed light on several of the issues surrounding illegal take in
the red abalone (Haliotis rufescens) fishery of Northern California. The randomized
response technique proved to be an effective tool for estimating recreational fisher
non-compliance with four major management measures. The daily take limit had the
highest estimated non-compliance (29%) followed by the minimum size limit (23%),
licensing laws (19%), and the annual take limit (15%). These estimates were
discussed in light of the priorities of three red abalone experts, who were asked which

82
violation types pose the greatest threat to sustainable red abalone management. Based
on the estimates and expert opinion, the first priority of management should be
reducing non-compliance with the daily take limit, in order to reduce the threat of
point-source depletion. The next priority should be reducing annual limit violations,
as these violation have direct repercussions on the ability of managers to accurately
estimate catch and set sustainable limits. The prioritization of minimum size limit
non-compliance is not clear, as these violations have different effects in the long and
short term, and should be discussed by management.
Variables regarding regulatory awareness and socio-demographic status were
also analyzed, as the literature suggests they may influence fisher decision-making
regarding violation, and further aid with priority setting. The results indicated high
levels of regulation awareness among fishers, and no significant relationship between
awareness and violation; indicating management is effectively communicating
regulations to fishers. Additionally, the socio-demographic variables analyzed with
the survey (age, income, local vs. visitor, seasons fished, and times fishing in 2006),
could not form an accurate demographic profile of a typical violator with either a
backward stepwise logistic regression, or direct comparisons. This finding indicates
enforcement effort should be equally distributed among all socio-demographic
sectors.
On the other hand, an analysis of local versus visitor compliance resulted in an
estimate of 72% local non-compliance with the daily take limit, but only 1% with the
annual take limit. This contrasts with estimates among visiting fishers of 18% daily
limit violation, and 19% non-compliance with the annual limit. These results
emphasize the importance of prioritizing daily limit compliance, particularly among
locals, and also suggest the drivers of non-compliance may differ between these
groups. The literature suggests both normative and economic factors may play a role
in influencing these groups, with local fishers having different perceptions of the costs
and benefits of violation due to proximity to the resource, different social norms,
heightened awareness of management effort, and lower-fishing related costs.
This study resulted in several implications for management. Firstly, the study
illustrated how RRT can be used to estimate non-compliance, and how those
estimates can be combined with management knowledge to set priorities among
violation types and user groups. Therefore, it is recommended that red abalone
managers continue to use RRT to estimate non-compliance in this fishery. Future
83
studies may use the estimates from this study as baseline figures for comparisons, and
also add additional violation types to the survey. Furthermore, quantitative RRT
techniques should be used to estimate the illegal catch, as these numbers could be
incorporated into management estimates for the Total Catch and used for setting a
sustainable Total Allowable Catch. Future research could also link RRT surveys to
specific locations, to reveal the sites with the greatest illegal take to managers. The
normative and economic drivers of non-compliance operating among local and
visiting fishers could be explored to identify areas managers may be able to influence.
The methods used in this study could also be successfully applied to other
fisheries and species. Though this is the first study to apply the randomized response
technique to a marine fishery, RRT has proven to be an excellent tool for evaluating
the extent of non-compliance and is uniquely capable of aiding managers in
prioritizing specific violation types. Linking the method to a simple socio-
demographic survey has further increased the potential analysis managers may
conduct. As this study has shown, there is enormous potential for the randomized
response technique to improve the sustainable management of marine resources.

84
Appendix 1: California Abalone Permit Report Card

85
Appendix 2: Fisher Survey Site Schedule
Friday August 10
Saturday August 11
Sunday August 12
Week 1
Site 1 Ft Ross &
Reef (Sonoma)
Site D Stillwater
Cove (Sonoma)
Monday August 13
Tuesday August 14
Wednesday August 15
Thursday August 16
Friday August 17
Saturday August 18
Sunday August 19
Week 2
Site 1 Ft Ross &
Reef (Sonoma)
Site B Fisk Mill-salt
pt. (Sonoma)
Site 4 Arena Cove (Mendocino)
Site 2 Van Damme (Mendocino)
Site 3 Sea Ranch
(Mendocino)
Site C Miscellaneous
Small (Mendocino)
Site 2 Van Damme (Mendocino)
Monday August 20
Tuesday August 21
Wednesday August 22
Thursday August 23
Friday August 24
Saturday August 25
Sunday August 26
Week 3 Site 4
Arena Cove (Mendocino)
Site 3 Sea Ranch
(Mendocino)
Site 2 Van Damme (Mendocino)
Site 1 Ft Ross &
Reef (Sonoma)
Site C Miscellaneous
Small (Mendocino)
Site 3 Sea Ranch
(Mendocino)
Site B Fisk Mill-
salt pt. (Sonoma)
Monday August 27
Tuesday August 28
Wednesday August 29
Thursday August 30
Friday August 31
Saturday September 1
Sunday September 2
Week 4 Site 2
Van Damme (Mendocino)
Site 1 Ft Ross &
Reef (Sonoma)
Site 3 Sea Ranch
(Mendocino)
Site A Elk
(Mendocino)
Site D Stillwater
Cove (Sonoma)
Site A Elk
(Mendocino)
Site 4 Arena Cove (Mendocino)
Monday September 3
Tuesday September 4
Wednesday September 5
Thursday September 6
Friday September 7
Saturday September 8
Sunday September 9
Week 5 Site 2
Van Damme (Mendocino)
Site C Miscellaneous
Small (Mendocino)
Site 4 Arena Cove (Mendocino)
Site D Stillwater
Cove (Sonoma)

86
Appendix 3: Information Sheet for Survey Respondents
Information Sheet for a Recreational Abalone Fishing Study Researcher: Sara Blank, School of Geography Environment and Earth Studies, Victoria University of Wellington, New Zealand. I am a Masters student in Environmental Studies at Victoria University of Wellington, New Zealand. As part of this degree I am undertaking a research project leading to a thesis. This study is designed to determine the usefulness of the Randomized Response Technique (RRT) when applied to illegal abalone fishing. The study attempts to provide an estimate of non-compliance within the recreational abalone fishery. This information could help improve the management of abalone to ensure sustainable harvests into the future. The University requires that ethics approval be obtained for research projects involving human participants. If you volunteer you will be asked to participate in a series of three RRT questioning sessions and a short survey. The entire process will be strictly anonymous. For the RRT portion you will flip a coin and look at it without revealing the result to the interviewer. Then you will randomly select one of two questions from a bag, without revealing which question you choose to the interviewer. One card asks “Did you get heads on the coin toss?”, and the other asks a question about abalone fishing. You simply record your response by circling “yes” or “no” on the survey form, and then place it with the other surveys in the collection box. The interviewer has no way of knowing which question you responded to or which form is yours, so anonymity is assured. Following the RRT’s you will be asked your age and ethnicity, as well as questions about your knowledge of regulations and how you acquired that knowledge. The whole interviewing session will take about 10 minutes. Participation is voluntary and notes on feedback will only be viewed by myself and my supervisor at the university. There is no penalty for not participating or for withdrawing from participation at any stage and your name will never be asked for or recorded. The results of the study will form the basis of my thesis, and copies will be given to the School of Geography Environment and Earth Sciences at Victoria, Victoria University Library, and possibly also published in academic journals. If you have any questions or would like to receive further information about the project, please contact Sara Grace Blank, Graduate Student, Victoria University of Wellington, PO Box 600, Wellington, NZ phone +64 021 048 7984 or US phone ________________. You may also contact my project advisor, Dr. Mike Gavin, Victoria University of Wellington, PO Box 600, Wellington, NZ phone 04 463 5195.


89
Appendix 5: Semi-Structured Interview Information Sheet and Consent Form
Information Sheet for a Recreational Abalone Fishing Study Interview
Researcher: Sara Blank, School of Geography Environment and Earth Studies, Victoria University of Wellington, New Zealand I am a Masters student in Environmental Studies at Victoria University of Wellington, New Zealand. As part of this degree I am undertaking a research project leading to a thesis. This study is designed to determine the usefulness of the Randomized Response Technique (RRT) when applied to illegal abalone fishing. The study attempts to provide an estimate of non-compliance within the recreational abalone fishery. This information could help improve the management of abalone to ensure sustainable harvests into the future. I would like to interview you in order to provide my thesis with more background discussion and expertise on the subject of abalone management in California. The interview session will take approximately 30 minutes. Questions will address topics such as the current effectiveness of abalone management, communication with the public, sources of illegal fishing, possible policy improvements, and managerial constraints. The interview will be confidential unless you sign a consent form and agree to be quoted. Quotes from the interviews will be included in my thesis, and copies of the thesis will be given to the School of Geography Environment and Earth Sciences at Victoria, Victoria University Library, and possibly also published in academic journals. I will provide you with transcripts of what will be quoted and ask you to sign off on these before publication of the thesis. If you have any questions or would like to receive further information about the project, please contact Sara Grace Blank, Graduate Student, Victoria University of Wellington, PO Box 600, Wellington, NZ phone +64 021 048 7984 or US phone ________________. You may also contact my project advisor, Dr. Mike Gavin, Victoria University of Wellington, PO Box 600, Wellington, NZ phone 04 463 5195.

90
(Note: To be used only with semi-structured interviews)
Using the Randomized Response Technique to Investigate Illegal Fishing and Contribute to Abalone Management in Northern California
I have been given and have understood an explanation of this research project. I have had an opportunity to ask questions and have them answered to my satisfaction. I understand that I may withdraw myself (or any information I have provided) from this project (before data collection and analysis is complete) without having to give reasons or without penalty of any sort. I understand that I will have an opportunity to check the transcripts of the interview before publication. I understand that the data I provide will not be used for any other purpose or released to others without my written consent. I would like to receive a summary of the results of this research when it is
completed. I consent to information or opinions which I have given being attributed to
me in any reports on this research. Initial:_______________
I agree to take part in this research
Signed:_________________________________ Date:_________________

91
Appendix 6: Semi-Structured Interview Question Topics and Rating Question
ABALONE THREATS:
• How would you describe the status of Red Abalone? • What are the greatest threats to abalone in your region?
-What ILLEGAL ACTIVITIES pose the greatest threat?
Threat Rating Question: Please rate these violations in terms of the threat they pose to sustainable abalone management. (very high, high, medium, low, very low)
High-grading Failure to re-attach Daily take limit violations Annual take limit violations Minimum size limit violations Failure to document take Failure to document location
(Discuss list.)
• How big a problem is ___*Insert Violation Type*___? • What illegal activities are (the most) acceptable?
-What levels are acceptable? ILLEGAL ACTIVITY ESTIMATES:
• How critical is the 12% illegal take to management? LIMITS/MANAGEMENT:
• What is the process for coming up with limits? • Do you feel they are working? Good enough?
INFORMATION COLLECTION:
• What type of data collection about illegal abalone take do you feel is most useful? • How might information collection about the stocks, fishers, or violations be
improved?

92
References Acheson, J. M. (1975). Fisheries management and social context: The case of the Maine
lobster fishery. Transactions of the American Fisheries Society, 104(4), 653-668. Alreck, P. L. and Settle R. B. (2004). The Survey Research Handbook. New York, New
York: McGraw-Hill Irwin. Bator, R. J. and Cialdini R. B. (2000). The Application of Persuasion Theory to the
Development of Effective Proenvironmental Public Service Announcements. Journal of Social Issues, 56(3), 527-541.
Becker, G. S. (1968). Crime and Punishment: An Economic Approach. Journal of Political Economy, 76(2), 169-212.
Berkes, F. (1985). Fishermen and the tragedy of the commons. Environmental Conservation, 12(3), 199-205.
Bernard, H. R. (2002). Interviewing: Unstructured and Semistructured. In Research Methods in Anthropology: Qualitative and Quantitative Methods (pp. 203-212). Walnut Creek, CA: Alta Mira Press.
Berrens, R. P., Bohara, A. K. and J. Kerkvliet (1997). A Randomized Response Approach to Dichotomous Choice Contingent Valuation. American Journal of Agricultural Economics, 79(1), 252-266.
Bodiguel, C. (2002). Fishermen facing the commercial lobster fishery licensing policy in the Canadian Maritime Provinces: origins of illegal strategies, 1960-2000. Marine Policy, 26(4), 271-281.
Bower, S. M. (2003). Update on emerging abalone diseases and techniques for health assessment. Journal of Shellfish Research, 22(3), 805-810.
Bowles, S. and Gintis, H. (2002). Social Capital and Community Governance. The Economic Journal, 112, F419-F436.
Brown, C. H. (1986). Conservation of the Paua Resource. Catch, 13(3), 3. Buchman, T. A. and Tracy, J. A. (1982). Obtaining Responses to Sensitive Questions:
Conventional Questionnaire versus Randomized Response Technique. Journal of Accounting Research, 20(1), 263-271.
Burton, M. (1999). An assessment of alternative methods of estimating the effect of the ivory trade ban on poaching effort. Ecological Economics, 30, 93-106.
California Department of Fish and Game (CDFG) (1995). The red abalone (Haliotis rufescens) sport fishery in central and northern California from creel 1975-94, aerial 1975-1985, and telephone based survey. Sacramento, CA: The Resources Agency.
California Department of Fish and Game (CDFG) (2001). Draft supplement to the environmental document - ocean sport fishing regulations concerning abalone sport fishing. Sacramento, CA: The Resources Agency.
California Department of Fish and Game (CDFG) (2005). Abalone Recovery and Management Plan (ARMP). Marine Region, California Department of Fish and Game: California Fish and Game Commission.
California Department of Fish and Game (CDFG) (2007a). Abalone Identification Guide. Retrieved May 12, 2007, from: http://www.dfg.ca.gov/mrd/ab_id.html
California Department of Fish and Game (CDFG) (2007b). California Abalone Information. Retrieved May 12, 2007, from: http://www.dfg.ca.gov/mrd/ab_info.html
California Department of Fish and Game (CDFG) (2007c). New Abalone Regulations. Retrieved May 12, 2007, from: http://www.dfg.ca.gov/mrd/ab_regs.html

93
Chaloupka, M. Y. (1985). Application of the Randomized Response Technique to Marine Park Management: an Assessment of Permit Compliance. Environmental Management, 9(5), 393-398.
Chan, K. M. A., Pringle, R. M., Ranganathan, J., Boggs, C. L., Chan, Y. L., Ehrlich, P.R., Haff, P. K., Heller, N. E., Al-Khafaji, K., and Macmynowski, D. P. (2007). When Agendas Collide: Human Welfare and Biological Conservation. Conservation Biology, 21(1), 59-68.
Cherryholmes, C. H. (1992). Notes on pragmatism and scientific realism. Educational Researcher, 14, 13-17.
Cialdini, R. B. (2003). Crafting Normative Messages to Protect the Environment. Current Directions in Psychological Science, 12(4), 105-109.
Clavier, J. (1992). The ormer (Haliotis tuberculata) fishery of France and the Channel Islands. Abalone of the World: biology, fisheries, and culture. Oxford, U.K., Fishing News Books, Blackwell Science Ltd., 454-457.
Cox, K. W. (1962). California abalones, family Haliotidae. Fish Bulletin, California Department of Fish and Game. 118, 133.
Creswell, J. W. (2003). Research Design: Qualitative, Quantitative, and Mixed Methods Approaches. Thousand Oaks, CA: Sage Publications Inc.
da Silva, P. P. (2004). From common property to co-management: lessons from Brazil's first maritime extractive reserve. Marine Policy, 28(5): 419-428.
Damania, R., Stringer, R., Karanth K. U. and Stith B. (2003). The economics of protecting tiger populations: Linking household behavior to poaching and prey depletion. Land Economics, 79, 198-216.
Daniels, R. and Floren, R. (1998). Poaching Pressures on Northern California's Abalone Fishery. Journal of Shellfish Research, 17(3), 859-862.
Davies, J. C. (1996). Comparing Environmental Risks: Tools for Setting Government Priorities. pp. 176,Washington DC: Resources for the Future.
Davis, G. E., Haaker, P., and Richards, D. (1998). The perilous condition of white abalone, Haliotis sorenseni, Bartsch, 1940. Journal of Shellfish Research, 17(3), 871-875.
Dewey, J. (1931). Philosophy and Civilization. New York, NY: Minton, Balch & Co. Dowling, T. A. and Shachtman, R. H. (1975). Relative Efficiency of Randomized Response
Models. Journal of the American Statistical Association, 70(349), 84-87. Dugan, J. E. and Davis, G. E. (1993). Applications of marine refugia to coastal fisheries
management. Canadian Journal of Fishing and Aquaculture Science, 50, 2029-2042. Edirisinghe, U. (2003). Sustainable aquatic resources management in the 21st century: some
important issues. Tropical Agriculture Research and Extension, 6, 122-127. Edwards, C. L. (1913). The Abalone Industry in California. Fish Bulletin California
Department of Fish and Game. 1, 5-15.. Estes, J. A. and Duggins, D. O. (1995). Sea otters and kelp forests in Alaska: Generality and
variation in a community ecological paradigm. Ecological Monographs, 65(1), 75-100.
Faasen, H. and Watts, S. (2007). Local community reaction to the `no-take' policy on fishing in the Tsitsikamma National Park, South Africa. Ecological Economics, 64(1), 36-46.
Fanshawe, S., VanBlaricom, G. R., and Shelly, A. A. (2003). Restored top carnivores as detriments to the performance of marine protected areas intended for fishery sustainability: A case study with red abalones and sea otters. Conservation Biology, 17(1), 273-283.
Field, A. (2005). Discovering Statistics Using SPSS. London, U.K.: SAGE Publications Ltd. Fowler, F. J. (1988). Survey Research Methods. Newbury Park, CA: Sage Publications, Inc.

94
Fowler, F. J. and Mangione, T. W. (1990). Standardized survey interviewing: Minimizing interviewer-related error. Newbury Park, CA: Sage Publications, Inc.
Fox, J. A. and Tracy, P. E. (1986). Randomized Response: A method for sensitive surveys. Beverly Hills, CA: Sage Publications, Inc.
Friedman, C. S., Andree, K. B., Beauchamp, K. A., Moore, J. D., Robbins, T. T., Shields, J. D., and Hedrick, R. P. (2000). 'Candidatus Xenohaliotis californiensis', a newly described pathogen of abalone, Haliotis spp., along the west coast of North America. International Journal of Systematic and Evolutionary Microbiology, 50, 847-855.
Furlong, W. J. (1991). The Deterrent Effect of Regulatory Enforcement in the Fishery. Land Economics, 67(1), 116-129.
Geiger, D. L. (2000). Distribution and biogeography of the recent Haliotidae (Gastropoda: Vetigastropoda) world-wide. Bollettino Malacologico 35, 57-120.
Giorgi, A. E. and De Martini, J. D. (1977). A study of the reproductive biology of the red abalone (Haliotis rufescens) near Mendocino, California. California Fish and Game, 63, 80-94.
Goodstadt, M. S. and Gruson, V. (1975). The randomised response technique: a test on drug use. Journal of the American Statistical Association, 70, 814-818.
Green, S. (2007). Poachers Killing paua fishery. The Dominion Post. Wellington, New Zealand, A13.
Greenberg, B. G., Abul-Ela, A. L. A., Simmons, W. R., and Horvitz, D. G. (1969). The unrelated question randomized response model: theoretical framework. Journal of the American Statistical Association, 64, 520-539.
Greenberg, B. G., Kuebler, R. R., Abernathy, J. R., and Horvitz, D. G. (1971). Application of Randomized Response Technique in Obtaining Quantitative Data. Journal of the American Statistical Association, 66(334), 243-250.
Haaker, P. L., Henderson, K. C., and Parker, D. O. Eds. (1986). California Abalone Marine Resources Leaflet No. 11. State of California, Department of Fish and Game, Marine Resources Division. Long Beach, CA: The Resources Agency.
Hahn, K. O. (1989). Survey of the commercially important abalone species in the world. In K. O. Hahn (Ed.), CRC handbook of culture of abalone and other marine gastropods. Boca Raton, FL: CRC Press.
Hardin, G. (1968). The tragedy of the commons. Science, 162, 1243-1248. Harris, M. (1998). Lament for an Ocean: the Collapse of the Atlantic Cod Fishery. Toronto,
Canada, McLelland and Stuart. 342. Hatcher, A. and Gordon, D. (2005). Further Investigations into the Factors Affecting
Compliance with U.K. Fishing Quotas. Land Economics, 81(1), 71-86. Hatcher, A., Jaffry, S., Thebaud, O., and Bennett, E. (2000). Normative and Social Influences
Affecting Compliance with Fishery Regulations. Land Economics, 76(3), 448-461. Hauck, M. and Sweijd, N. A. (1999). A case study of abalone poaching in South Africa and
its impact on fisheries management. ICES Journal of Marine Science, 56, 1024-1032. Heckathorn, D. D. (1990). Collective Sanctions and Compliance Norms: A Formal Theory of
Group-Mediated Social Control. American Sociological Review, 55(3), 366-384. Hobday, A. J. and Tegner, M. J. (2002). The warm and the cold: Influence of temperature and
fishing on local population dynamics of red abalone. California Cooperative Oceanic Fisheries Investigations Reports, 43, 74-96.
Hollowed, A. B., Bax, N., Beamish, R., Collie, J., Fogarty, M., Livingston, P., Pope, J., Rice, J. C. (2000). Are multispecies models an improvement on single-species models for measuring fishing impacts on marine ecosystems? ICES Journal of Marine Science, 57, 707-719.

95
Hønneland, G. (1999). A model of compliance in fisheries: theoretical foundations and practical application. Ocean and Coastal Management, 42, 699-716.
Hooker, S. (1988). Demography of paua (Haliotis iris) with special reference to juveniles. Unpublished Masters thesis, Auckland University, Auckland, New Zealand.
Huchette, S. M. H. and Clavier, J. (2004). Status of the ormer (Haliotis tuberculata L.) industry in Europe. Journal of Shellfish Research, 23(4), 951-955.
Hughey, K. F. D., Cullen, R. and Moran, E. (2003). Integrating Economics into Priority Setting and Evaluation in Conservation Management. Conservation Biology, 17(1), 93-103.
Hutchings, J. A. and Myers, R. A. (1994). What can be learned from the collapse of a renewable resource? Atlantic cod Gadus morhua, of Newfoundland and Labrador. Canadian Journal of Fishing and Aquaculture Science, 51, 2126-2146.
ICCAT (2000). Report of the ICCAT SCRS West Atlantic bluefin tuna stock assessment session. Madrid, Spain.
I-Cheng, C., Chow, L. P., and Rider, R. V. (1972). The Randomized Response Technique as Used in the Taiwan Outcome of Pregnancy Study. Studies in Family Planning, 3(11), 265-269.
Israel, G. D. and Taylor, C. L. (1990). Can Response Order Bias Evaluations? Evaluation and Program Planning, 13(4), 361-371.
ISOFISH (1999). The Chilean Fishing Industry: its involvement in and connections to the illegal, unreported and unregulated exploitation of Patagonian toothfish in the Southern Ocean. ISOFISH Occasional Report no. 2. Hobart, Tasmania, ISOFISH, 98.
Jachmann, H. (1998). Monitoring Illegal Wildlife Use and Law Enforcement in African Savannah Rangelands. Lusaka, Zambia: Environmental Council of Zambia
Jachmann, H. (2008). Monitoring law-enforcement performance in nine protected areas in Ghana. Biological Conservation, 141, 89-99.
James, W. (1907). Pragmatism. A new name for some old ways of thinking. New York, NY: Longmans, Green & Co.
Jenkins, G. P. (2004). The ecosystem effects of abalone fishing: a review. Marine and Freshwater Research, 55(6), 545-552.
Kahneman, D. (2003). Maps of Bounded Rationality: Psychology for Behavioral Economics. The American Economic Review, 93(5), 1449-1475.
Kalvass, P. E. (2006). 2005 Economic Summary Statistics from Telephone Survey conducted by CSU Chico. Fort Bragg, CA: California Department of Fish and Game.
Kalvass, P. E. (2007). 2006 Red Abalone Catch and Effort Statistics [unpublished work]. Fort Bragg, CA: California Department of Fish and Game.
Kalvass, P. E. and Geibel, J. J. (2006). California recreational abalone fishery catch and effort estimates for 2002 from a combined report card and telephone survey. California Fish and Game, 92(4), 157-171.
Kaplow, L. (1990). A Note on the Optimal Use of Nonmonetary Sanctions. Journal of Public Economics, 42, 245-247.
Karpov, K. A., Haaker, P. L., Taniguchi, I. K. and Rogers-Bennett, L. (2000). Serial depletion and the collapse of the California abalone (Haliotis spp.) fishery. Workshop on rebuilding abalone stocks in British Columbia. A. Campbell (Ed.) Special Publication of Fisheries Aquatic Science. 130, 11-24.
Karpov, K. A. and Tegner, M. J. (1992). Abalones. California's Living Marine Resources and Their Utilization. In W. S. Leet, C. M. Dewees and C. W. Haugen (Eds.), Sea Grant Extension Publication UCSGEP-92-12 (pp. 33-36).

96
Kashiwada, J. V. and Taniguchi, I. K. (2007). Application of recent red abalone Haliotis rufescens surveys to management decisions outlined in the California Abalone Recovery and Management Plan. Journal of Shellfish Research, 26(3), 713-717.
Kuperan, K. and. Jon, G. S (1998). Blue water crime: Deterrence, Legitimacy, and compliance in fisheries. Law & Society Review, 32(2), 309.
Labor Market Information Division (LMID) (2007). Mendocino County Snapshot. Retrieved January 15, 2008 from Employment Development Department of the State of California Website: www.calmis.ca.gov/file/cosnaps/mendosnap.pdf
Leader-Williams, N., Albon, S. D., and Berry, P. S. M. (1990). Illegal Exploitation of Black Rhinoceros and Elephant Populations: Patterns of Decline, Law Enforcement and Patrol Effort in Luangwa Valley, Zambia. The Journal of Applied Ecology, 27(3), 1055-1087.
Leader-Williams, N. and Milner-Gulland, E. J. (1993). Policies for the Enforcement of Wildlife Laws: The Balance between Detection and Penalties in Luangwa Valley, Zambia. Conservation Biology, 7(3), 611-617.
Leaf, R. T., Rogers-Bennett, L., and Haaker, P. L. (2007). Spatial, temporal, and size-specific variation in mortality estimates of red abalone, Haliotis rufescens, from mark-recapture data in California. Fisheries Research, 83(2-3), 341-350.
Lensvelt-Mulders, G. J. L. M., Hox, J. J., van der Heijden, P. G. M., and Maas, C. J. M. (2005). Meta-analysis of Randomized Response Research: 35 years of Validation. Sociological Methods Research, 33, 319-348.
Lewis, D. S. C. and D. Tweddle (1990). The yield of usipa (Engraulicypris sardella) from the Nankumba Peninsula, Lake Malawi (1985-1986). Collected Reports of Fisheries Research Malawi Occasional Papers, 1, 57-66.
Lichfield, J. (2005). Poachers could drive paua to extinction. The New Zealand Herald. Auckland, New Zealand.
Locander, W., Sudman, S., and Bradburn, N. M. (1976). An investigation of interview method, threat and response distortion. Journal of American Statistical Association, 71, 269-275.
Lorenzini, R. (2005). DNA forensics and the poaching of wildlife in Italy: A case study. Forensic Science International, 153, 218-221.
Mak, K. K. W., Yanase, H., and Renneberg, R. (2005). Cyanide fishing and cyanide detection in coral reef fish using chemical tests and biosensors. Biosensors and Bioelectronics, 20(12), 2581-2593.
Maliao, R. J., Webb, E. L., and Kathe, R. J. (2004). A survey of stock of the donkey's ear abalone, Haliotis asinia L. in the Sagay Marine Reserve, Philippines: evaluating the effectiveness of marine protected area enforcement. Fisheries Research, 66(2-3), 343-353.
Mann, B. Q. (1995). Quantification of Illicit Fish Harvesting in the Lake St-Lucia-Game-Reserve, South-Africa. Biological Conservation 74(2), 107-113.
McCay, B. (1980). A fisherman's cooperative limited: indigenous resource management in a complex society. Anthropological Quarterly, 53, 29-38.
McGoodwin, J. R. (1983). Some examples of self-regulatory mechanisms in unmanaged fisheries. FAO Fisheries Report No 289, Supplement 2. Rome.
Mead, G. H. (1938). Philosophy of the Act. Chicago, IL: University of Chicago Press. Mittermeier, R. A., Myers, N., Thomsen, J. B., da Fonseca, G. A. B., and Olivier, S. (1998).
Biodiversity Hotspots and Major Tropical Wilderness Areas: Approaches to Setting Conservation Priorities. Conservation Biology, 12(3), 516-520.
New Zealand Ministry of Fisheries (2006, 21 November 2006). The State of Our Fisheries Annual Summary 2006. Retrieved 24/3/2007, from http://www.fish.govt.nz/en-

97
nz/Publications/State+of+our+fisheries/Managing+Our+Catch/Paua.htm?wbc_purpose=Basic%26WBCMODE.
Orensanz, J. M. L., Armstrong, J., Armstrong, D., and Hiborn, R. (1998). Crustacean resources are vulnerable to serial depletion - the multifaceted decline of crab and shrimp fisheries in the Greater Gulf of Alaska. Reviews in Fish Biology and Fisheries, 8(2), 117-176.
Patterson, K. R. (1998). Assessing fish stocks when catches are misreported: Model, simulation tests, and application to cod, haddock, and whiting in the ICES area. ICES Journal of Marine Science, 55(5), 878-891.
Patterson, K. R., Castello, M., Santos, M, and Barcia, M. (1990). Validation and Recomputation of Catch and Effort Data in the Nearshore Fleet of Ecuador for the Period 1981-1989. Report to INP. Guayaquil, Ecuador, 47.
Pauly, D., Christensen, V., Guenette, S., Pitcher, T. J., Sumaila, U. R., Walters, C. J., Watson, R., and Zeller, D. (2002). Towards sustainability in world fisheries. Nature, 418, 689-695.
Peirce, C. S. (1965). Collected Papers Volume 5: Pragmatism and pramaticism. Cambridge: Harvard University Press.
Pitcher, T. J. and T. K. Stokes (1990). Assessment of Ecuadorean Commercial Pelagic Fisheries. Contract Report to the Overseas Development Administration, United Kingdom. Imperial College, London, Marine Resources Assessment Group.
Pitcher, T. J., Watson, R., Forrest, R., Valtysson, H., and Guenette, S. (2002). Estimating illegal and unreported catches from marine ecosystems: A basis for change. Fish and Fisheries, 3(4), 317-339.
Pollock, K. H. and Bek, Y. (1976). Comparison of 3 Randomized Response Models for Quantitative Data. Journal of the American Statistical Association, 71(356), 884-886.
Raymakers, C. and J. Lynham (1999). Slipping the net: Spain's compliance with ICCAT recommendations for swordfish and bluefin tuna. World Wildlife Fund Endangered Seas Campaign.
Reef Fish Stock Assessment Panel (RFSAP) (1992). Interim Report of the Reef Fish Stock Assessment Panel. C. P. Goodyear (Ed.), Tampa, FL: 1-4.
Riske, S. (2003). Abalone Enforcement Report 2002/03. Recreational Abalone Advisory Committee of the California Department of Fish and Game, 1-7.
Riske, S. (2006). Abalone Enforcement Report 2006. Recreational Abalone Advisory Committee of the California Department of Fish and Game, 1-7.
Rogers-Bennett, L., and Butler, J. (2002). Rebuilding California's abalone stocks. California Cooperative Oceanic Fisheries Investigations Reports, 43, 71-73.
Rogers-Bennett, L., Dondanville, R. F., and Kashiwada, J. V. (2004). Size Specific Fecundity of Red Abalone (HALIOTIS RUFESCENS): Evidence for Reproductive Senescence? Journal of Shellfish Research, 23(2), 553-560.
Rogers-Bennett, L., Haaker, P. L., Huff, T. O., and Dayton, P. K. (2002). Estimating baseline abundances of abalone in California for restoration. California Cooperative Oceanic Fisheries Investigations Reports, 43, 97-111.
Rogers-Bennett, L., Haaker, P. L., Huff, T. O., and Dayton, P. K. (2002). Estimating Historic Abundances of Abalone in California for Restoration. CalCOFI, 43, 63-74.
Rogers-Bennett, L., and Melvin, A. S. (2007). Size Differences in Wild and Farmed Red Abalone: Developing enforcement tools to combat illegal commercialization., California Department of Fish and Game.
Rogers-Bennett, L., and Pearse, J. (1998). Experimental seeding of hatchery-reared juvenile red abalone in northern California. Journal of Shellfish Research, 17(3), 877-880.

98
Rogers-Bennett, L., and Pearse, J. (2001). Indirect Benefits of Marine Protected Areas for Juvenile Abalone. Conservation Biology, 15(3), 642-647.
Rogers-Bennett, L., Rogers, D. W., and Schultz, S. A. (2007). Modeling growth and mortality of red abalone (Haliotis rufescens) in Northern California.(Report). Journal of Shellfish Research, 26(3), 719(9).
Russell, M. (2004). Population biology of paua (Haliotis iris and Haliotis australis). Unpublished Masters thesis, Biology Department, Victoria University of Wellington, Wellington, NZ.
Salas, S., Chuenpagdee, R., Seijo, J. C., and Charles, A. (2007). Challenges in the assessment and management of small-scale fisheries in Latin America and the Caribbean. Fisheries Research, 87, 5-16.
Sanders, M. J., and Beinssen, K. H. H. (1998). A comparison of management strategies for the rehabilitation of a fishery: applied to the fishery for blacklip abalone (Haliotis rubra) in the western zone of Victoria (Australia). Fisheries Research, 38(3), 283-301.
Scheibling, R. E. (1994). Molluscan grazing and macroalgal zonation of a rocky intertidal platform at Perth, Western Australia. Australian Journal of Ecology, 19, 141-149.
Schill, D. J., and Kline, P. A. (1995). Use of Random Response to Estimate Angler Noncompliance with Fishing Regulations. North American Journal of Fisheries Management, 15(4), 721-731.
Sen, S., and Nielsen, J. R. (1996). Fisheries co-management: a comparative analysis. Marine Policy, 20(5), 405-418.
Singh, S., Mangat, N. S., and Singh, R. (1997). Estimation of size and mean of a sensitive quantitative variable for a sub-group of a population. Communications in Statistics-Theory and Methods, 26(7), 1793-1804.
Smith, D. R. and Smeltzer, J. F. (1991). Occurrence of fishing without a license on the Cache la Poudre River, Colorado. North American Journal of Fisheries Management, 11, 109-112.
Solomon, J. N., Jacobson, S. K., Wald, K. D., and Gavin, M. C. (2007). Estimating illegal resource use at a Ugandan park with the randomized response technique. Human Dimensions of Wildlife, 12(2).
Sonoma County Abalone Network (SCAN) (2008). S.C.A.N. Homepage. Retrieved March 5, 2008, from: http://www.abalonenetwork.org
Spencer, P. D., and Collie, J. S. (1997). Patterns of population variability in marine fish stocks. Fisheries Oceanography, 6(3), 188-204.
Stefansson, G., and Rosenberg, A. A. (2005). Combining control measures for more effective management of fisheries under uncertainty: quotas, effort limitation and protected areas. Philosophical Transactions of the Royal Society B, 360, 133-146.
Stem, C., Margoluis, R., Salafsky, N., and Brown, M. (2005). Monitoring and Evaluation in Conservation: a Review of Trends and Approaches. Conservation Biology, 19(2), 295-309.
Sterckx, S., Bertels, L., Kempeneers, M., Debruyn, W., Vanderstraete, T., and Goossens, R. (2006). Hyperspectral monitoring of coral reefs- A case study: Fordate, Tanimbar, Indonesia. In A. Marcal (Ed.) Global Developments in Environmental Earth Observation From Space (pp. 603-610). Oporto, Portugal: Millpress Science Publishers.
Stone, B. (2002). Sonoma County Tourism Indicators Report 2002, Sonoma County Economic Development Board, 1-6.
Sumaila, U. R., Alder, J., and Keith, H. (2006). Global scope and economics of illegal fishing. Marine Policy, 30(6), 696-703.

99
Sutinen, J. G. (1993). Recreational and Commercial Fisheries Allocation with Costly Enforcement. American Journal of Agricultural Economics, 75, 1183-1187.
Sutinen, J. G., and Johnston, R. J. (2003). Angling management organizations: integrating the recreational sector into fishery management. Marine Policy, 27, 471-487.
Sutinen, J. G., and Kuperan, K. (1999). A socio-economic theory of regulatory compliance. International Journal of Social Economics, 26(1/2/3), 174.
Tarr, R. J. Q., P. V. G. Williams, et al. (1996). Abalone, sea urchins and rock lobster: a possible ecological shift that may affect traditional fisheries. South African Journal of Marine Science, 17, 319-323.
Tarr, R. J. Q. (2000). The South African abalone (Haliotis midae) fishery; a decade of challenge and change. Workshop on rebuilding Abalone Stocks in Brittish Columbia. A. Campbell. Canada, Special Publication of Fisheries Aquatic Science. 130, 32-40.
Tegner, M. J. (1992). Brood-stock transplants as an approach to stock enhancement. Abalone of the world: Biology, fisheries and culture. S. A. Shepherd, M. J. Tegner and S. Guzman del Proo. Oxford, U.K., Blackwell Scientific, 461-473.
Tegner, M. J., L. V. Basch and P. K. Dayton (1996). Near extinction of an exploited marine invertebrate. Trends in Ecology and Evolution, 11, 278.
Turpie, J. K., Heydenrych, B. J., and Lamberth, S. J. (2003). Economic value of terrestrial and marine biodiversity in the Cape Floristic Region: implications for defining effective and socially optimal conservation strategies. Biological Conservation, 112(1-2), 233-251.
Tutschulte, T. C. (1976). The comparative ecology of three sympatric abalones. San Diego, CA, University of California. Ph.D. dissertation.
U.S. Census Bureau. (2008). State and County QuickFacts. Retrieved February 7, 2008, from: http://quickfacts.census.gov
Vilchis, L. I., Tegner, M. J., Moore, J. D., Friedman, C. S., Riser, K. L., Robbins, T. T., and Dayton, P. K. (2005). Ocean warming effects on growth, reproduction, and survivorship of southern California abalone. . Ecology and Applications, 15, 469-480.
Wahl, T. (1995). Are radar satellites cost-effective for maritime surveillance? International Astronautical Congress, 46th, Oslo, Norway: IAF.
Ward, T. J. (1986). Abalone biology and fisheries in Australia: a review of research. Fisheries Paper No. 86-12. Canberra, Australia, Australian Fisheries Service, 36.
Warner, S. L. (1965). Randomized Response: A Survey Technique for Eliminating Evasive Answer Bias. Journal of the American Statistical Association, 60(309), 63-69.
Zimmerman, R. S. and Langer, L. M. (1995). Improving Estimates of Prevalence Rates of Sensitive Behaviors - the Randomized Lists Technique and Consideration of Self-Reported Honesty. Journal of Sex Research, 32(2), 107-117.
Copyright © 2022 FDOKUMEN