Hexagonal mesophases between lamellae and cylinders in a diblock copolymer melt
Structure of PS-PEO Diblock Copolymers in Solution andthe Bulk State Probed Using Dynamic Light-Scattering
and Small-Angle Neutron-Scattering and DynamicMechanical Measurements
Kell Mortensen,*,† Wyn Brown,‡ Kristoffer Almdal,† Elouafi Alami,‡ andAmane Jada§
Condensed Matter Physics and Chemistry Department, Risø National Laboratory,Roskilde, Denmark, Department of Physical Chemistry, Uppsala University, Sweden,
and Centre de Recherches sur la Physico-Chimie des Surfaces Solides, Mulhouse, France
Received October 1, 1996. In Final Form: April 18, 1997X
The phase behavior of a low molecular weight (MW ) 4000) diblock copolymer of polystyrene and poly-(ethylene oxide), PS-PEO, in the bulk as well in aqueous, D2O, solutions has been studied using small-angleneutron-scattering, dynamicandstatic light-scattering, and rheologicalmethods. At low temperaturethe pure block copolymer forms a lamellar mesophase driven by the crystallization of PEO. The meltingpoint of PEO, T ≈ 64 °C, is correspondingly accompanied by an order-to-disorder transition. The melt istypified by single-exponential depolarized correlation functions in the dynamic light-scattering spectra,observed in the temperature range60 to 100 °C. Neutron scattering fails to showconcentration fluctuationsin the amorphous, disordered phase due to lack of contrast. In aqueous solutions up to roughly 20%polymer concentration, PS-PEO self-associates into spherical micelles with a core size of Rc ≈ 56 Å andan interaction radius Rhs ≈ 115 Å, corresponding to an aggregation number of 470. The hydrodynamicradiusRh)140Åobtained fromdynamic light scattering is close tobut somewhat larger than the interactionradius, as expected. Extended clusters, displaying a small but significant anisotropy, form at above C )10% and coexist with the single spherical micelles. These clusters may be due to association of sphericalmicelles or micelles of different form attributed to residual aggregates of PS moities.
1. Introduction
The dynamics of diblock copolymermelts and solutionshave recently attracted extensive interest on account ofthe diversity of phase morphologies and the resultingphase transitions.While many block copolymers undergo order-disorder
transitions as a consequence of enthalpy-driven phaseseparation on the length scale of the polymer size,1ordering on the mesoscopic length scale may also occurwhen one of the blocks crystallizes. Block copolymersof poly(ethylene oxide) typically show such orderingphenomena.2-6
As for the relatively well-studied lowmolecular weightsurfactants, self-association of block copolymers is ob-served ondissolution in a selective solventwhich is a goodsolvent for oneblockbut apoor ornonsolvent for the other.Suchmaterials typicallyassociate intomicellaraggregateswhich may, for example, be spherical, rodlike, or disks
depending on the molecular makeup and the location inthephasediagram. Inaqueous systems, block copolymerswith poly(ethylene oxide) as the water-soluble part haverecentlyattractedgreat interest both for their applicationsand in basic research.9-12
The present paper describes small-angle neutron-scattering, light-scattering, and rheological studieswhichare used to elucidate the structural features of the bulkas well as D2O solutions of a relatively low molecularweight diblock copolymer of polystyrene (PS) and poly-(ethylene oxide) (PEO). On the basis of fluorescence-probing and light-scattering methods, Winnik and co-workers13,14 have earlier presented investigations ofaqueous solutions of PS-PEO diblock as well as PEO-PS-PEO symmetrical triblock structures, revealing mi-celle formation and giving some properties of themicellesin solution. The present study concerns a PS-PEO 1-3diblock copolymer with molecular weight MW ) 4000,where the 1-3 index denotes the PS and PEO block sizesof 1000 and 3000, respectively. Themeasurements covera broad range of temperature and encompass awide spanof concentration in the D2O solutions. In the bulk, thePS-PEO1-3 diblock copolymer at low temperature formsa lamellar phase induced by the PEO crystallization intoextended lamellae. At T ) 64 °C the material undergoesan order-disorder transition into a homogeneous phase.In D2O solutions up to roughly 20% copolymer, the PS-PEO 1-3 diblock copolymers form spherical micelles witha dense core of the PS moiety.
† Risø National Laboratory.‡ Uppsala University.§ Centre de Recherches sur la Physico-Chimie des Surfaces
Solides.X Abstract published in Advance ACS Abstracts, June 15, 1997.(1) Bates, F. S.; Fredrickson, G.H.Annu. Rev. Phys. Chem. 1990, 41,
525.(2) Viras, F.; Luo, Y.-Z.; Viras, K.; Mobbs, R. H.; King, T. A.; Booth,
C. Macromol. Chem. 1988, 189, 459.(3) Mortensen, K.; Brown, W.; Jørgensen, E.Macromolecules 1994,
27, 5654.(4) Mortensen, K.; Brown, W.; Jørgensen, E.Macromolecules 1995,
28, 1458.(5) Yang, Y.-W.; Tanodekaew, S.; Mai, S.-M.; Booth, C.; Ryan, A. J.;
Bras, W.; Viras, K. Macromolecules 1995 28, 6029.(6) Hillmyer, M.; Bates, F. S.; Almdal, K.; Mortensen, K.; Ryan, A.
Science 1996, 271, 976.(7) Takahashi, Y.; Tadokoro, H. Macromolecules 1973, 6, 881.
Tadokoro,H.Structure ofCrystallinePolymers;Wiley: NewYork, 1979.(8) Ryan, A. J.; Fairclough, P. A.; Hamley, I. W.; Mai, S.-M.; Booth,
C. Macromolecules, in press.
(9) Chu, B. Langmuir 1995, 11, 414.(10) Almgren,M.; Brown,B.;Hvidt, S.ColloidPolym.Sci.1995, 273,
2.(11) Alexandridis, P.; Athanassiou,V.;Hatton, T.A.Langmuir1995,
11, 2442.(12) Mortensen, K. J. Phys. Condens. Matter 1996, 8, A103.(13) Xu, R.; Winnik, M. A.; Hallett, F. R.; Riess, G.; Croucher, M. D.
Macromolecules 1991, 24, 87.(14) Wilhelm,M.; Zhao, C.-L.;Wang,Y.; Xu, R.;Winnik,M.A.;Mura,
J.-L.; Riess, G.; Croucher, M. D. Macromolecules 1991, 24, 1033.
3635Langmuir 1997, 13, 3635-3645
S0743-7463(96)00963-8 CCC: $14.00 © 1997 American Chemical Society
2. Experimental SectionA. Materials. The diblock copolymer polystyrene-poly-
(ethylene oxide), PS-PEO1-3 ([CH2CHC6H5]m-H[OCH2CH2]n),has a molecular weight of 4000, 1000 for the PS component and3000 for PEO (corresponding to the average degree of polym-erization m ) 9.6 and n ) 68.2). The copolymer was suppliedby Goldschmidt AG and was used without further purification.Thesamplesofbulkcopolymersweregentlypressed intopellets
and measured during both the initial heating and cooling andthe secondheating. While therewas amajor hysteresis betweenthe heating and cooling cycles, there was no difference betweendata of initial and later heating runs.The aqueous solutions of diblock copolymer were made by
mixing the copolymer with water at room temperature andheating to above 60 °C to form the thermodynamically stablemicelles. Deuterium oxide, D2O, which was used for both theneutron- and light-scattering experiments, was used in order toget good contrast and low background in the neutron scatteringexperiments. Prior to annealing, the dilute solutions formed anopaque dispersion. The solutions discussed below are all givenin weight percent (wt %).The critical micellation concentration, cmc, was obtained by
surface tension measurements and also by using a fluorescencemethod with pyrene as probe.B. Rheology. Dynamical mechanical measurements were
conductedusingaRheometricsRMS-800rheometer. Thesamplewas investigated using a 25 mm cone-and-plate geometry andheated in a stream of nitrogen. The elastic modulus wasmeasured as a function of temperature with heating and coolingat rates of 1.55 and 1.4 °C/min, respectively, while the samplewas being subjected to measurements at the angular frequencyω ) 10 rad/s and the strain amplitude γ ) 5%. Bulk viscositymeasurements were conducted using the same geometry withshear rates of 5-100 s-1.C. Small-AngleNeutronScattering. Small-angleneutron-
scattering experiments were performed using the Risø-SANSfacility. The bulk copolymer was mounted in a holder with a 1mm flight path and 1 mm thick Suprasil quartz windows. Theaqueousblock copolymersolutionsweremounted insealedquartzcontainers (Suprasil fromHellma,FRG),with 2mmflight paths.The results presented below were obtained using the combi-
nation of two or more of the scattering patterns obtained withdifferent instrumental settings, using 3, 6, and 14 Åwavelengthneutrons, and using a sample-to-detector distance of 1, 3, and6 m, respectively, giving scattering vectors within the range0.002-0.5 Å-1, where the scattering vector q is given by thescattering angle θ and the neutron wavelength λ:
The neutron wavelength resolution was ∆λ/λ ) 0.18, and theneutron beam collimation was determined by the pinhole sizesof 16 and 7 mm diameter at the source and sample positions,respectively, andwith the collimation lengthequal to the sample-to-detector distance. The smearing induced by the wavelengthspread, the collimation, and thedetector resolutionwas includedin the data analysis discussed below, using Gaussian ap-proximations for the different terms.The scattering datawere corrected for the background arising
from the quartz cell D2O and from other sources, as measuredwith the neutron beam blocked by plastic containing boron atthe sample position. The incoherent scattering from H2O wasused to determine deviations from a uniform detector responseand to convert the data into absolute units.The scattering patterns discussed in the present paper are all
azimuthally isotropic. The data have been reduced by azimuth-ally averaging to the one-dimensional I(q) scattering functions,which are only dependent on the absolute value of q.D. Static Light Scattering. Recent papers dealing with
light scattering in PS-PEO block copolymer systems are notedin refs 13 and 14, while a general review of scattering in blockcopolymer systems is given in ref 15. Static light-scatteringmeasurements were made at different temperatures using a
photon-counting apparatus supplied by Hamamatsu to registerthe polarized scattered signal. The light source was a 35 mWHe-Ne laser with λ ) 633 nm. The value of (dn/dc)) 0.15mL/gwas determined for the PS-PEO 1-3 diblock copolymer at 25 °Cusing a differential refractometer at the same wavelength.E. Dynamic Light Scattering. Dynamic light scattering,
DLS, measurements were made using the apparatus describedbriefly in ref 16. A wide-band, multi-tau, digital autocorrelatorof the ‘ALV’-type from Langer GmbH, Germany, was used fordata collection. Themeasured intensityautocorrelation function,g2(t), is related to the field correlation function, g1(t), by
whereâ′ is an instrumental factor accounting for deviations fromideal correlation and B is a baseline term.For a continuous distribution of relaxation times, A(τ),
corresponding to an infinite range of particle sizes, the inverseLaplace transform (ILT) may be used:
Such inverse Laplace transformation was performed using aconstrained regularization routine, REPES,17 which minimizesthe sum of the squared differences between the experimentaland calculated intensity-intensity autocorrelation functions g2-(t) using nonlinear programming and allows the selection of the“smoothingparameter”P (probability to reject). Analysis of dataencompassed 288 exponentially-spaced grid points and a griddensity of 12 per decade. Representation of the relaxation timedistributions in the form of τA(τ) versus log(τ) plots, with τA(τ)in arbitrary units, gives an equal area representation.
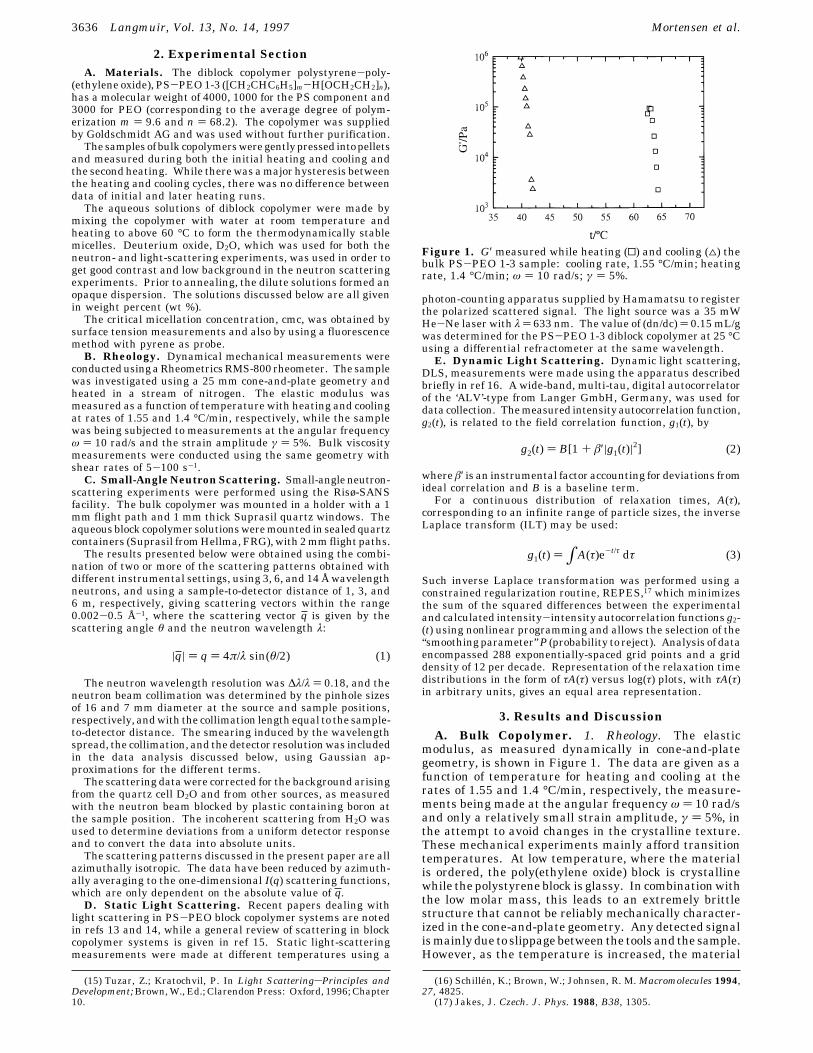
3. Results and DiscussionA. Bulk Copolymer. 1. Rheology. The elastic
modulus, as measured dynamically in cone-and-plategeometry, is shown in Figure 1. The data are given as afunction of temperature for heating and cooling at therates of 1.55 and 1.4 °C/min, respectively, the measure-ments being made at the angular frequency ω ) 10 rad/sand only a relatively small strain amplitude, γ ) 5%, inthe attempt to avoid changes in the crystalline texture.These mechanical experiments mainly afford transitiontemperatures. At low temperature, where the materialis ordered, the poly(ethylene oxide) block is crystallinewhile thepolystyreneblock is glassy. In combinationwiththe low molar mass, this leads to an extremely brittlestructure that cannot be reliably mechanically character-ized in the cone-and-plate geometry. Any detected signalismainlydue to slippagebetween the toolsand thesample.However, as the temperature is increased, the material
(15) Tuzar, Z.; Kratochvil, P. In Light ScatteringsPrinciples andDevelopment;Brown,W., Ed.; ClarendonPress: Oxford, 1996; Chapter10.
(16) Schillen, K.; Brown, W.; Johnsen, R. M.Macromolecules 1994,27, 4825.
(17) Jakes, J. Czech. J. Phys. 1988, B38, 1305.
|q| ) q ) 4π/λ sin(θ/2) (1)
Figure 1. G′ measured while heating (0) and cooling (4) thebulk PS-PEO 1-3 sample: cooling rate, 1.55 °C/min; heatingrate, 1.4 °C/min; ω ) 10 rad/s; γ ) 5%.
g2(t) ) B[1 + â′|g1(t)|2] (2)
g1(t) )∫A(τ)e-t/τ dτ (3)
3636 Langmuir, Vol. 13, No. 14, 1997 Mortensen et al.

becomes a paste and a mechanical response can bedetected. The modulus drops in a narrow temperatureinterval (64 ( 1 °C) to a very low level. The sampledisorders into a Newtonian liquid with a viscosity closeto 1 Pa s. Thus at ω ) 10 rad/s, G′′ is expected to be 10Pa s, which is below the sensitivity of the instrument.However, the sharpdrop in themodulus canbe associatedwith thedisorderingprocess. On cooling, a correspondingsharp rise in modulus is observed at 43 ( 1 °C. This risein modulus signals the ordering of the sample possiblysimultaneously with crystallization of the poly(ethyleneoxide) block and glassification of the polystyrene block.Bulkviscosity results, asmeasuredutilizing shear rates
of 5-100 s-1, are given in Figure 2. At all temperaturesthe sample exhibits Newtonian behavior. The measure-ments at 63 and 61 °C were conducted after previousheating to 90 °C. The viscosity is nearly proportional tothe inverse temperature in the disordered state. Abarelysignificant break in the viscosity is observed on crossingthe order-disorder transition temperature, TODT. How-ever, the ordered state data were obtained after coolingfrom high temperature, and the sample is disorderedaccording to the dynamical mechanical measurements.2. Small-Angle Neutron Scattering. Figure 3 shows
the scattering function of thePS-PEO1-3bulk copolymeras observed at the temperaturesT) 20 °C,T) 63 °C, andT ) 67 °C. The scattering function clearly reveals alamellar structure at low temperature, with both first-and second-order peaks. The lamellar periodicity is
where q10 ) 0.0424Å-1 is the scatteringmomentumof thefirst-order Bragg peak. The thickness dPS or dPEO of therespectively PS or PEO lamellae must fulfil
where f is thevolume fractionofPS. With themassdensity1.05 and 1.01 g/cm3 of respectively PS or PEO, themolecular configuration of PS-PEO 1-3 gives f ) 0.24and thus a PEO lamellae thickness of dPEO ) 112 Å.The lamellar structure is most likely a result of
crystallization of the PEO blocks, as observed in relatedPEO systems,2-6 even though wide-angle scattering hasstill not been made on PS-PEO 1-3 to verify this.The observed PEO lamellae thickness dPEO ) 112 Å is
significantly less than the expected value of an unfoldedPEO chain with 68 units, irrespective of the helical orzigzag polymorph. In the helical form, the chain lengthis 2.78 Å per repeat unit (19.48 Å per pitch of 7 units7).In the zigzag form, the chain length is 3.56 Å per unit(7.12 per repeat of two units7). In the unfolded config-uration the PEO block thus should have the length d1helix) 195 Å and d1zz ) 242 Å for respectively the helical orzigzag configuration. RelatedPEOblock copolymershavebeen shown to be in the helical conformation, with thenumber of chain folds depending on both moleculararchitecture and crystallization temperature.8 It is mostlikely that the PEO block in the PS-PEO 1-3 materialbehaves similarly. With the values given above, we findthat the ratio between the thickness of the PEO lamellaeand the length of the unfolded chain is close to 2, thusstrongly indicating a single fold in the PEO chain.Uponheating, the lamellar structure remains basically
unaffectedup toT)50 °C,where thepeak intensity startsto decrease and approaches zero at around T ) 70 °C,which is slightly higher than theTODT ) 64 °Cdeterminedfrom the rheological measurements. These findingsindicate that the true ODT is broad and that ordered anddisordered domains coexist over a wide temperatureinterval, in agreement with the strong first-order phasetransition. TheODTdeterminedrheologicallymayreflectthe percolation of ordered domains, which would explainthe very sharp transition compared to that observed inscattering experiments.Figure 4 shows the peak intensity as a function of
temperature. The values were obtained by fitting aGaussian function to the experimental data, includinginstrumental smearing. Simultaneously with the de-
Figure2. Newtonianviscosity of thebulkPS-PEO1-3 sampleas a function of inverse temperature above TODT (O) and belowTODT (0). The line is a linear fit to the disordered data.
Figure 3. Small-angle neutron-scattering data of bulk PS-PEO 1-3, as obtained at the temperatures 20, 63, and 67 °C.
Figure 4. Peak intensity of the lamellar first-order BraggreflectionofPS-PEO1-3 (Figure3) asa functionof temperatureduring heating and cooling.
d ) 2π/q10 ) 148 Å
dPS ) f‚d10 or dPEO ) (1 - f)‚d10
Structure of PS-PEO Diblock Copolymers Langmuir, Vol. 13, No. 14, 1997 3637
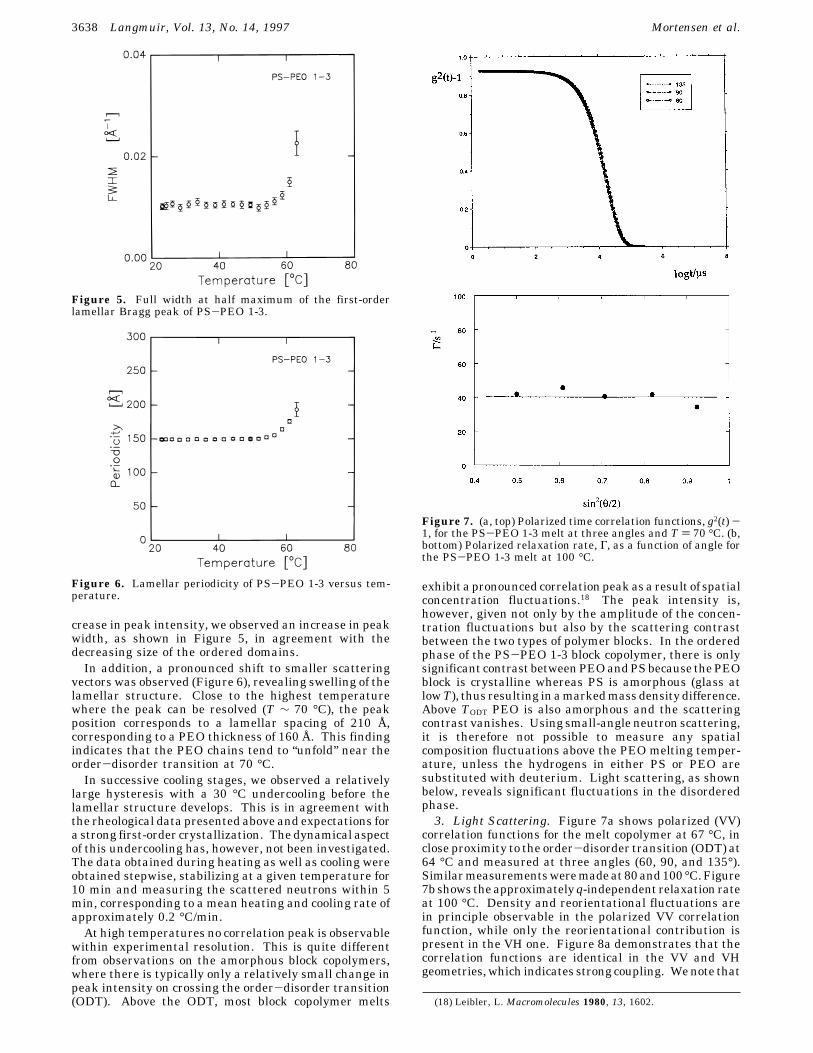
crease in peak intensity, we observed an increase in peakwidth, as shown in Figure 5, in agreement with thedecreasing size of the ordered domains.In addition, a pronounced shift to smaller scattering
vectors was observed (Figure 6), revealing swelling of thelamellar structure. Close to the highest temperaturewhere the peak can be resolved (T ∼ 70 °C), the peakposition corresponds to a lamellar spacing of 210 Å,corresponding to a PEO thickness of 160 Å. This findingindicates that the PEO chains tend to “unfold” near theorder-disorder transition at 70 °C.In successive cooling stages, we observed a relatively
large hysteresis with a 30 °C undercooling before thelamellar structure develops. This is in agreement withthe rheological data presented above and expectations fora strong first-order crystallization. Thedynamical aspectof this undercooling has, however, not been investigated.The data obtained during heating as well as cooling wereobtained stepwise, stabilizing at a given temperature for10 min and measuring the scattered neutrons within 5min, corresponding to a mean heating and cooling rate ofapproximately 0.2 °C/min.At high temperatures no correlation peak is observable
within experimental resolution. This is quite differentfrom observations on the amorphous block copolymers,where there is typically only a relatively small change inpeak intensity on crossing the order-disorder transition(ODT). Above the ODT, most block copolymer melts
exhibit apronounced correlationpeakasa result of spatialconcentration fluctuations.18 The peak intensity is,however, given not only by the amplitude of the concen-tration fluctuations but also by the scattering contrastbetween the two types of polymer blocks. In the orderedphase of the PS-PEO 1-3 block copolymer, there is onlysignificant contrastbetweenPEOandPSbecause thePEOblock is crystalline whereas PS is amorphous (glass atlowT), thus resulting inamarkedmassdensitydifference.Above TODT PEO is also amorphous and the scatteringcontrast vanishes. Using small-angleneutron scattering,it is therefore not possible to measure any spatialcomposition fluctuations above the PEO melting temper-ature, unless the hydrogens in either PS or PEO aresubstituted with deuterium. Light scattering, as shownbelow, reveals significant fluctuations in the disorderedphase.3. Light Scattering. Figure 7a shows polarized (VV)
correlation functions for the melt copolymer at 67 °C, inclose proximity to the order-disorder transition (ODT) at64 °C and measured at three angles (60, 90, and 135°).Similarmeasurementsweremadeat80and100°C.Figure7bshows theapproximatelyq-independent relaxation rateat 100 °C. Density and reorientational fluctuations arein principle observable in the polarized VV correlationfunction, while only the reorientational contribution ispresent in the VH one. Figure 8a demonstrates that thecorrelation functions are identical in the VV and VHgeometries,which indicates strong coupling. Wenote that
(18) Leibler, L. Macromolecules 1980, 13, 1602.
Figure 5. Full width at half maximum of the first-orderlamellar Bragg peak of PS-PEO 1-3.
Figure 6. Lamellar periodicity of PS-PEO 1-3 versus tem-perature.
Figure 7. (a, top) Polarized time correlation functions, g2(t)-1, for the PS-PEO 1-3 melt at three angles and T ) 70 °C. (b,bottom) Polarized relaxation rate, Γ, as a function of angle forthe PS-PEO 1-3 melt at 100 °C.
3638 Langmuir, Vol. 13, No. 14, 1997 Mortensen et al.

theVHrelaxation time is temperaturedependentwhereastheVVsignalhasan insignificantdependence, as is shownin Figure 8b. The slope of the VH line corresponds to anactivation energy of 8 kcal/mol. The relative intensitiesVH:VV are almost constant at about (IVH/IVV) ) 14% overthe temperature range 60-100 °C.The relatively large VV intensities suggest that there
are pronounceddensity fluctuationswhich are associatedwith the anisotropy component in the present case. Thusit may be concluded that the single-exponential modeobserved in the present experiments is a composite modereflecting the lamellar domains and their structuralanisotropy.The correlation functions are closely single-exponential
with aWilliams-Watts (KWW) stretched exponent (â) ofapproximately unity. The pure single-exponential relax-ation essentially eliminates identification of this decaywith the segmental motions: the latter would only beobservable at the extremely fast limit of the correlatorwindow and are characteristically extremely broad withaKWWexponent in the region 0.2-0.3. It is also unlikelythat this relaxation corresponds to the theoreticallypredicted internal mode, since the latter should also beof short relaxation time and furthermore should not havesignificant amplitude in the polarized geometry and alsoshould not give rise to depolarized scattering.19 It shouldalso not be observable for a low MW copolymer.
Onepossible interpretation for theVH-active componentis that it corresponds to the stretchingmode. It has beenestablished both experimentally20,21 and theoretically22that in thedisordered state close to theODTthe copolymerchains are oriented and stretched. In DLS, such a modewas apparently first observed by Hoffmann et al.,23 whofound that, in diblock melts of polystyrene/polyisopreneclose to the ODT, the depolarized spectrum becamebimodal: the faster component having â ) 0.2 was dueto segmental relaxation, and a slower component havingâ )1wassuggested tobedue toorientationandstretching.Jian et al.24 and Papadakis et al.25 drew similar conclu-sions. We note in the present case that the scatteredintensitydecreases stronglywith increasing temperature,which is anexpectedproperty of the stretchingmode, sincethe homogeneity of the system increases with increasingtemperature. A contribution from the stretchingmode inconjunction with reorientation may be expected over anextended temperature range (for a Flory-Huggins pa-rameter above approximately øN≈ 520) andwas observedto be still present far above the fluctuation-induced ODTtemperature in a symmetric low molar mass PS-PBdiblock copolymer.25 In the PS-PEO 1-3 diblock copoly-mer studied here, we should emphasize, however, thatthe ODT is not driven by composition fluctuations butinstead is a result of PEO crystallization into lamellae.Due to the lackofneutroncontrast in thedisorderedphase,we cannot determine the value of the øN parameter.Analternative explanation inviewof the long relaxation
time seen in Figure 7a is that advanced by Stepanek etal.26 The latter suggest that a VH-active mode seen inthe low molar mass diblock copolymer melt of poly-(ethylenepropylene)-poly(dimethylsiloxane) results fromthe reorientational dynamics of local regions of lamellarorder.One may use the Stokes-Einstein relationship for the
rotational diffusion coefficient (Θ ) (6/Γ)-1), written interms of the correlation length êr:
where êr will reflect the longest length scale of theanisotropic particle and η is the measured macroscopicviscosity. For the present system, this relationship givesêr ) 460 Å at 100 °C and 580 Å at 67 °C, just above theODT. For comparison, the value of the static correlationlength, ê evaluatedby fitting theVV intensitiesmeasuredat different q-vectors to the Ornstein-Zernike equation
gives a value ê ) 1120 Å for the data at 67 °C. The latteris of the same order as êr. The intensities of the VHmodeare8.2kHz (67 °C)and5.6kHz (100 °C); i.e., theamplitudedecreases with increasing temperature.B. Aqueous Solutions. 1. Critical Micelle Concen-
tration. The value of the cmc)2.48×10⁻⁵ g/mLobtained
(19) Stepanek, P.; Lodge, T. P. Light ScatteringsPrinciples andDevelopment;Brown,W., Ed.; ClarendonPress: Oxford, 1996; Chapter11.
(20) Almdal, K.; Rosedale, J. H.; Bates, F. S.; Wignall, G. D.;Fredrickson, G. H. Phys. Rev. Lett. 1990, 65, 1112.
(21) Bartels, V. T.; Stamm, M.; Abetz, V.; Mortensen, K. Europhys.Lett. 1995, 31, 81.
(22) Vilgis, T. A.;Weyersberg, A.; Brereton,M.G.Phys. Rev. E 1994,49, 3031.
(23) Hoffmann, A.; Koch, T.; Stuhn, B. Macromolecules 1993, 26,7288.
(24) Jian, T.; Semenov, A. N.; Anastasiadis, S. H.; Fytas, G.; Yeh,F.-J.; Chu, B.; Vogt, S.;Wang, F.; Roovers, J. E. L. J. Chem. Phys. 1994,100, 3286.
(25) Papadakis, C. M.; Brown, W.; Johnsen, R. M.; Posselt, D.;Almdal,K. J. Chem. Phys. 1996, 104, 1611.
(26) Stepanek, P.; Almdal, K.; Lodge, T. P. J. Polym. Sci., Polym.Phys. Ed., submitted.
Figure 8. (a, top) Polarized and depolarized correlograms forthe melt PS-PEO 1-3 diblock copolymer at 60 °C (order-disorder transition TODT ≈ 64 °C). (b, bottom) Arrhenius plotsof polarized (0) and depolarized (b) relaxation times for thePS-PEO 1-3 melt.
Θ ) kT/(8πηêr3) (4)
I(q) ∼ I(0)/(1 + ê2q2) (5)
Structure of PS-PEO Diblock Copolymers Langmuir, Vol. 13, No. 14, 1997 3639

by surface tensionmeasurements (Figure9a) is somewhatlarger than the value reported by Wilhelm et al.14 ((0.1-0.5) × 10-5 g/mL) using a fluorescence method. Using asimilar method using pyrene as probe, we obtained the
value cmc ) 1.27× 10⁻⁵ g/mL. These data are depictedin Figure 9b.27
2. Small-Angle Neutron Scattering. In dilute aqueoussolutions of PS-PEO 1-3, the scattering function isdominatedby the form factor of the copolymeraggregates.For copolymer concentrations ofmore than a few percent,correlations between the aggregates start to be thedominant feature. Figure10showsthescattering function(I(q)/concentration) for aqueous solutions of PS-PEO1-3diblock copolymer in the concentration regime 0.5-50%in D2O, as obtained at 20 °C (after being annealed above60 °C).The dilute systems (up to roughly 2%) are dominated
by the pure form factor of the micelles. For copolymerconcentrations up to approximately 20%, the effect ofincreasing concentration on the scattering function is thedevelopment of a correlation hole corresponding to sig-nificant intermicellar correlations. For copolymer con-centrations above approximately 20%, the scatteringfunction also changes in the high-q regime (q> 0.05 Å-1),suggestingchangesof theaggregates toamoreasymmetricform.
(27) Jada, A.; Hoffstetter, J.; Siffert, B. Proceedings of Short andLong Chain Interfaces; Editions Frontiers: 1995; pp 41-46.
Figure 9. Determination of the critical micelle concentrationfor the PS-PEO 1-3 diblock copolymer in D2O at 25 °C using(a, top) surface tension cmc ) 2.48 × 10⁻⁵ g/mL and (b)fluorescence probing with pyrene; cmc ) 1.27 × 10⁻⁵ g/mL.
Figure 10. Small-angle neutron-scattering data of aqueous(D2O) solutions of PS-PEO 1-3, as obtained for concentrationsbetween 0.5% and 50%.
Figure11. Small-angleneutron-scatteringdataof 1%aqueoussolutions of PS-PEO 1-3, as obtained at (a, top) T ) 20 °C and(b, bottom) T ) 95 °C. The solid lines represent the best fit tothe micellar form factor. The broken lines represent the fitobtained in the indirect Fourier transformation.
3640 Langmuir, Vol. 13, No. 14, 1997 Mortensen et al.
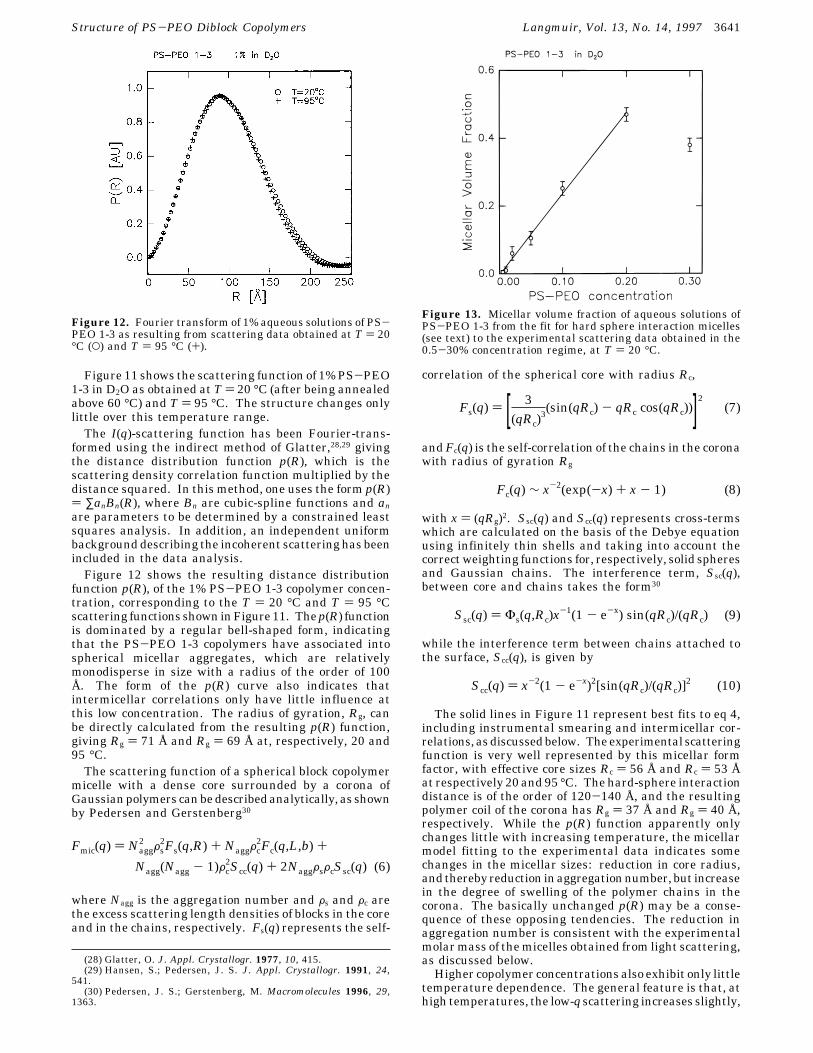
Figure 11 shows the scattering function of 1%PS-PEO1-3 in D2O as obtained at T) 20 °C (after being annealedabove 60 °C) and T ) 95 °C. The structure changes onlylittle over this temperature range.The I(q)-scattering function has been Fourier-trans-
formed using the indirect method of Glatter,28,29 givingthe distance distribution function p(R), which is thescattering density correlation function multiplied by thedistance squared. In this method, one uses the form p(R)) ∑anBn(R), where Bn are cubic-spline functions and anare parameters to be determined by a constrained leastsquares analysis. In addition, an independent uniformbackgrounddescribing the incoherent scatteringhasbeenincluded in the data analysis.Figure 12 shows the resulting distance distribution
function p(R), of the 1% PS-PEO 1-3 copolymer concen-tration, corresponding to the T ) 20 °C and T ) 95 °Cscattering functionsshown inFigure11. Thep(R) functionis dominated by a regular bell-shaped form, indicatingthat the PS-PEO 1-3 copolymers have associated intospherical micellar aggregates, which are relativelymonodisperse in size with a radius of the order of 100Å. The form of the p(R) curve also indicates thatintermicellar correlations only have little influence atthis low concentration. The radius of gyration, Rg, canbe directly calculated from the resulting p(R) function,giving Rg ) 71 Å and Rg ) 69 Å at, respectively, 20 and95 °C.The scattering function of a spherical block copolymer
micelle with a dense core surrounded by a corona ofGaussianpolymers canbedescribedanalytically, as shownby Pedersen and Gerstenberg30
where Nagg is the aggregation number and Fs and Fc arethe excess scattering length densities of blocks in the coreand in the chains, respectively. Fs(q) represents the self-
correlation of the spherical core with radius Rc,
andFc(q) is the self-correlation of the chains in the coronawith radius of gyration Rg
with x ) (qRg)2. Ssc(q) and Scc(q) represents cross-termswhich are calculated on the basis of the Debye equationusing infinitely thin shells and taking into account thecorrectweighting functions for, respectively, solid spheresand Gaussian chains. The interference term, Ssc(q),between core and chains takes the form30
while the interference term between chains attached tothe surface, Scc(q), is given by
The solid lines in Figure 11 represent best fits to eq 4,including instrumental smearing and intermicellar cor-relations,asdiscussedbelow. Theexperimental scatteringfunction is very well represented by this micellar formfactor, with effective core sizes Rc ) 56 Å and Rc ) 53 Åat respectively 20and95 °C. Thehard-sphere interactiondistance is of the order of 120-140 Å, and the resultingpolymer coil of the corona has Rg ) 37 Å and Rg ) 40 Å,respectively. While the p(R) function apparently onlychanges little with increasing temperature, the micellarmodel fitting to the experimental data indicates somechanges in the micellar sizes: reduction in core radius,andtherebyreduction inaggregationnumber,but increasein the degree of swelling of the polymer chains in thecorona. The basically unchanged p(R) may be a conse-quence of these opposing tendencies. The reduction inaggregation number is consistent with the experimentalmolarmass of themicelles obtained from light scattering,as discussed below.Higher copolymer concentrations also exhibit only little
temperature dependence. The general feature is that, athigh temperatures, the low-q scattering increases slightly,
(28) Glatter, O. J. Appl. Crystallogr. 1977, 10, 415.(29) Hansen, S.; Pedersen, J. S. J. Appl. Crystallogr. 1991, 24,
541.(30) Pedersen, J. S.; Gerstenberg, M. Macromolecules 1996, 29,
1363.
Figure 12. Fourier transform of 1% aqueous solutions of PS-PEO 1-3 as resulting from scattering data obtained at T ) 20°C (O) and T ) 95 °C (+).
Fmic(q) ) Nagg2 Fs
2Fs(q,R) + NaggFc2Fc(q,L,b) +
Nagg(Nagg - 1)Fc2Scc(q) + 2NaggFsFcSsc(q) (6)
Figure 13. Micellar volume fraction of aqueous solutions ofPS-PEO 1-3 from the fit for hard sphere interaction micelles(see text) to the experimental scattering data obtained in the0.5-30% concentration regime, at T ) 20 °C.
Fs(q) ) [ 3(qRc)
3(sin(qRc) - qRc cos(qRc))]2 (7)
Fc(q) ∼ x-2(exp(-x) + x - 1) (8)
Ssc(q) ) Φs(q,Rc)x-1(1 - e-x) sin(qRc)/(qRc) (9)
Scc(q) ) x-2(1 - e-x)2[sin(qRc)/(qRc)]2 (10)
Structure of PS-PEO Diblock Copolymers Langmuir, Vol. 13, No. 14, 1997 3641
whereas the scattering at q > 0.05 Å-1 remains roughlyunchanged.When the copolymer concentration is increased to
between 5 and 10%, the only effect on the scatteringfunction is the formation of a correlation hole due tointermicellar correlations. The scattering function canbe well fitted by fixing the micellar parameters at thevalues for the 1% solution, leaving the micellar volumefraction and interaction radius as the only remainingparameters to be obtained.Such fits give a linear increase in the micellar volume
fraction φ with copolymer concentration c in the range0-20%, effectively corresponding to a critical micellationconcentration, cmc ≈ 0, in agreement with the cmcdetermined from fluorescence and surface tension mea-surementsdiscussedabove, andaslope ofφ/c)2.4 (Figure13). The linear relationship is self-consistent with theassumption that the micellar form is independent ofcopolymer concentration. Figure 13 includes fits up to30%. For thesehigh-concentration suspensions, however,there are somediscrepancies between the fittedanalyticalfunction and the experimental data, possibly indicatingthat themicellesarenonspherical for c larger thanroughly
20%. Dynamic light scattering, as discussed below, alsoindicates formation of larger, possibly asymmetric ag-gregates and shows coexistence of the spherical micellesand larger aggregates for concentrations above 10%.From the resulting core size, one can estimate the
aggregation number of the spherical micelles assumingthat the core consists solely of polystyrene:
where VPS ) 1.65 × 10³ Å3 is the volume of the PS block,givingNagg)470atambient temperature. Independently,the aggregation number can be evaluated by combininginformation on the hard sphere radius and the volumefraction:
where VPS-PEO ) 6.59× 10³ Å3 is the volume of the wholeblock copolymer, givingNagg)460, inverygoodagreementwith the calculation from the core size.3. Static Light Scattering. The molar mass of the
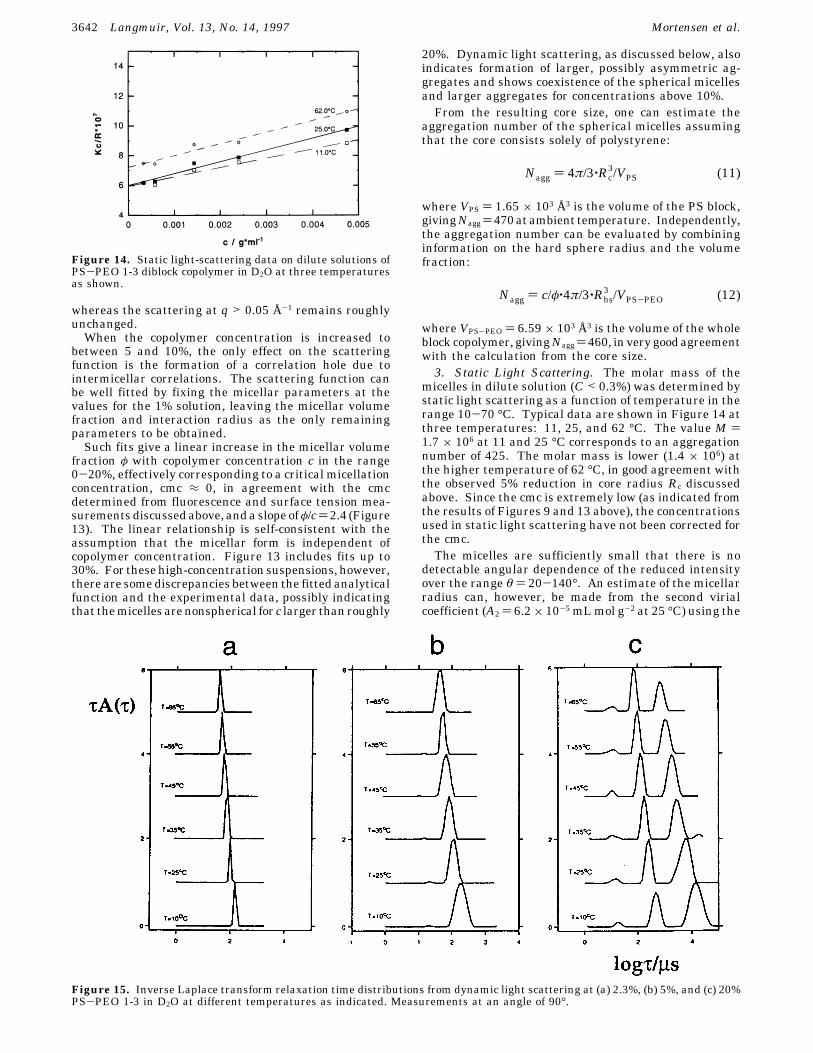
micelles in dilute solution (C < 0.3%) was determined bystatic light scattering as a function of temperature in therange 10-70 °C. Typical data are shown in Figure 14 atthree temperatures: 11, 25, and 62 °C. The value M )1.7 × 10⁶ at 11 and 25 °C corresponds to an aggregationnumber of 425. The molar mass is lower (1.4 × 10⁶) atthe higher temperature of 62 °C, in good agreement withthe observed 5% reduction in core radius Rc discussedabove. Since the cmc is extremely low (as indicated fromthe results of Figures 9 and 13 above), the concentrationsused in static light scattering have not been corrected forthe cmc.The micelles are sufficiently small that there is no
detectable angular dependence of the reduced intensityover the range θ ) 20-140°. An estimate of the micellarradius can, however, be made from the second virialcoefficient (A2 ) 6.2× 10⁻⁵ mLmol g-2 at 25 °C) using the
Figure 14. Static light-scattering data on dilute solutions ofPS-PEO 1-3 diblock copolymer in D2O at three temperaturesas shown.
Figure 15. Inverse Laplace transform relaxation time distributions from dynamic light scattering at (a) 2.3%, (b) 5%, and (c) 20%PS-PEO 1-3 in D2O at different temperatures as indicated. Measurements at an angle of 90°.
Nagg ) 4π/3‚Rc3/VPS (11)
Nagg ) c/φ‚4π/3‚Rhs3 /VPS-PEO (12)
3642 Langmuir, Vol. 13, No. 14, 1997 Mortensen et al.
relationship31
The obtained value, RA2 ) 170 Å, corresponds to theeffective radius of interaction and should coincide withthe hard sphere radius, Rhs ) 120-140 Å. The RA2 valueis also somewhat larger than the hydrodynamic radius(Rh ) 140 Å) derived from the translational diffusioncoefficient extrapolated to infinite dilutionssee below.Alternatively, onemay estimate the dimensions from theintrinsic viscosity [η] using the relationship for thevolume,Vh, of a spherical particle:
Using the measured value of the intrinsic viscosity [η] )12.9 mL/g leads to Rh ) 120 Å.These values are of the same magnitude as those
reported by Xu et al.13 (Rh ) 200 Å) using DLS and are(31) Yamakawa, H.Modern theory of polymers solutions; Harper &
Row: New York, 1971.
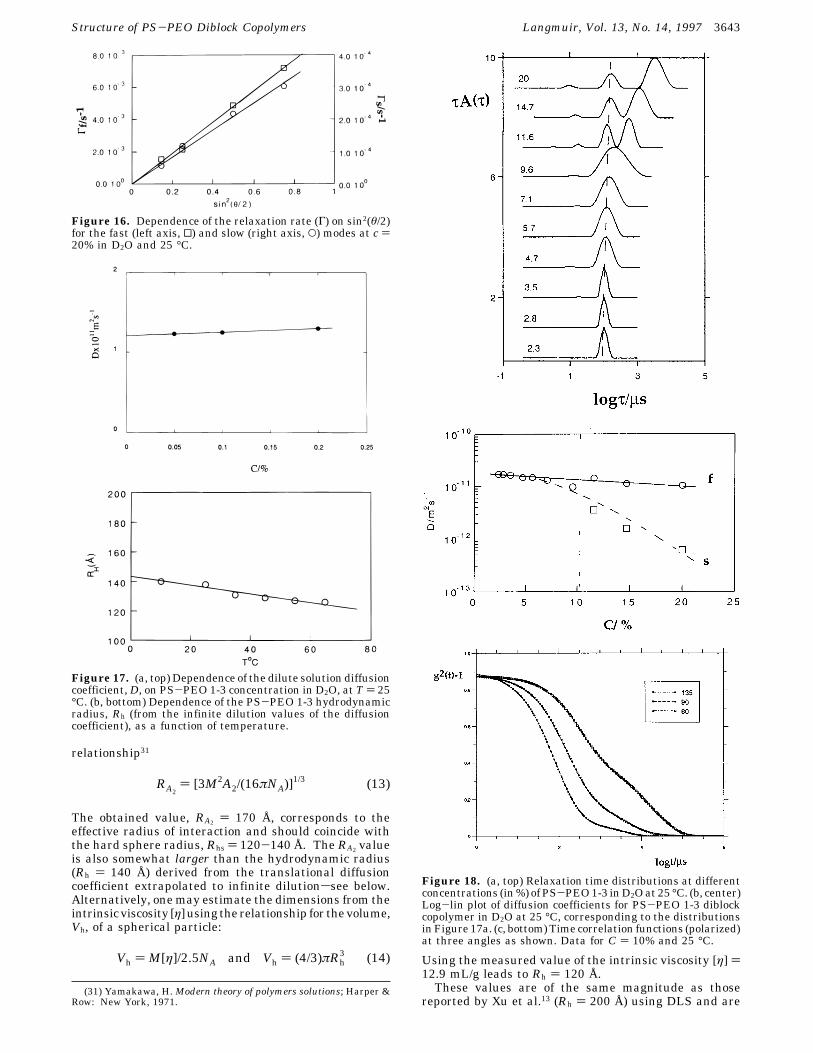
Figure 16. Dependence of the relaxation rate (Γ) on sin2(θ/2)for the fast (left axis, 0) and slow (right axis, O) modes at c )20% in D2O and 25 °C.
Figure 17. (a, top) Dependence of the dilute solution diffusioncoefficient,D, on PS-PEO 1-3 concentration in D2O, at T ) 25°C. (b, bottom) Dependence of the PS-PEO 1-3 hydrodynamicradius, Rh (from the infinite dilution values of the diffusioncoefficient), as a function of temperature.
RA2) [3M2A2/(16πNA)]
1/3 (13)
Vh ) M[η]/2.5NA and Vh ) (4/3)πRh3 (14)
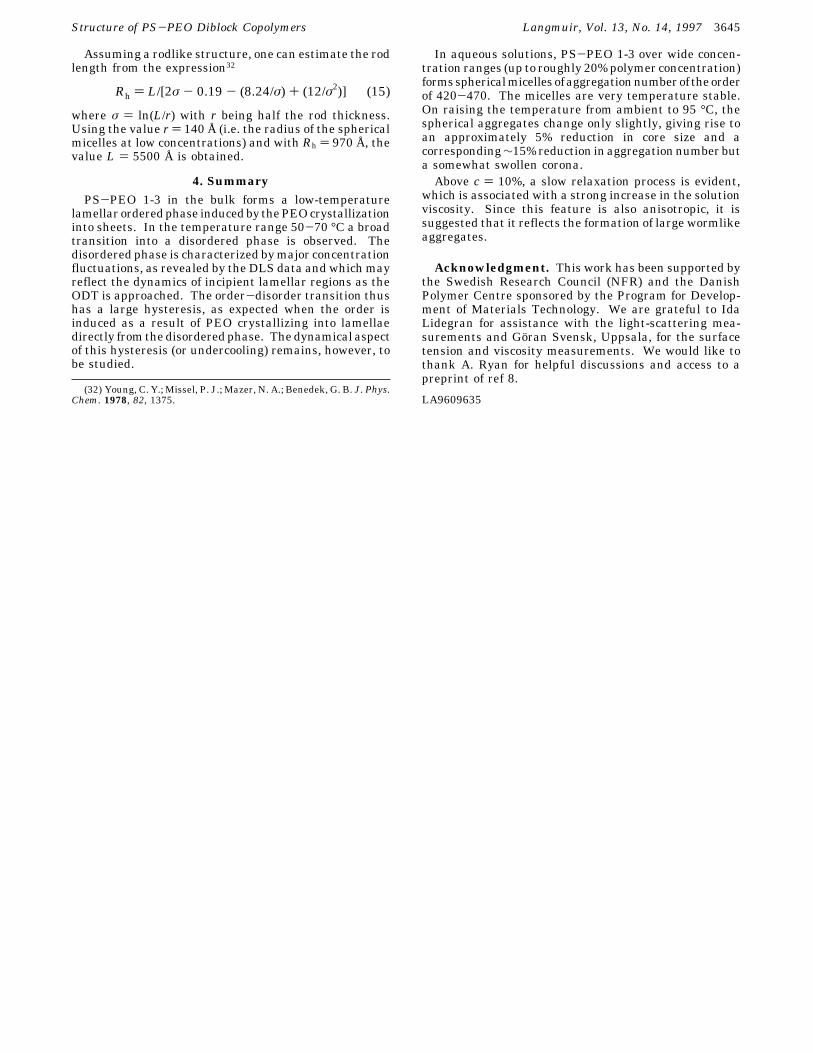
Figure 18. (a, top) Relaxation time distributions at differentconcentrations (in%) ofPS-PEO1-3 inD2Oat 25 °C. (b, center)Log-lin plot of diffusion coefficients for PS-PEO 1-3 diblockcopolymer in D2O at 25 °C, corresponding to the distributionsinFigure 17a. (c, bottom)Time correlation functions (polarized)at three angles as shown. Data for C ) 10% and 25 °C.
Structure of PS-PEO Diblock Copolymers Langmuir, Vol. 13, No. 14, 1997 3643

also in good agreement with the SANS data describedabove.4. Dynamic Light Scattering. In dynamic light-scat-
tering studies, the autocorrelation functions in the diluterange (c<5%)were close to single exponential. Examplesof the relaxation time distributions obtained using theLaplace inversion routine REPES (see ExperimentalSection) are given at three concentrations [(a) 2.3%; (b)5%; (c) 20%] for different temperatures in Figure 15. Thedependence of the relaxation rate on the square of thescattering vector (q)was linear (Figure 16) for bothmodesin part c, passing through the origin, denoting diffusiveprocesses. The concentration dependence of the diffusioncoefficient is small; see Figure 17a. Use of the Stokes-Einstein equation (Rh ) kT/6πη0D0) together with theinfinite dilution value, D0, and the solvent viscosity, η0,gave Rh ) 140 Å at 25 °C. The temperature dependenceof Rh is shown in Figure 17b.With increasing concentration the relaxation time
distribution broadens and eventually becomes doubleexponential above about c ) 10% as shown in Figure 18aand b. Polarized correlation functions are shown for c )10% at three angles in Figure 18c.The inverse intrinsic viscosity corresponds to an ap-
proximate value of the “overlap” concentration of c* ) 8%.The concentration dependence of the slow mode is muchstronger and may correspond to the development ofmicellar clusters above the overlap concentration. On thebasis of the neutron scattering data discussed above,however, it seems more likely that differently shapedmicelles are formed, possibly in the form of wormlikeaggregates with significant anisotropy (see below). Thepresent structural data cannot, however, give unambigu-ousdetail on thestructureof these largeaggregates.Figure19a shows how the reduced viscosity ηred varies as afunction of concentration. There is a slow increase above
c* and then a strong increase above about 10%. Figure19b shows the temperature dependence of the reduceddiffusion coefficient for fast and slow modes at c ) 20%.The appearance of the slow mode at about 10% is seen
clearly in Figure 20a, which shows the depolarizedcorrelation functions. The correlation functionat c)10%is bimodal whereas that for c ) 20% is dominated by theslower relaxing process.A comparison with the corresponding polarized cor-
relation functions is provided by Figure 20b for the threeconcentrations. The enhanced depolarized scattering forthe slower part reflects a small but significant anisotropyassociated with the slowmode (IVH/IVV)) 2%. At c) 20%the VV and VH correlation functions are again verysimilar, due to strong coupling between the relaxationalmodes.The appearance of the slow mode most likely reflects
residualaggregation into larger,wormlikemicelles. Largeaggregates have correspondingly been noted in the light-scattering study of Winnik et al.13 The driving force isthe interaction between the PS blocks and water, whichpromotes segregation of the PS blocks. From the slowmode diffusion coefficients (D(25 °C ) 5.3 × 10⁻¹⁴ m2 s-1
(20%) and 2.9 × 10⁻¹³ m2 s-1 (10%)) and the determinedmacroscopic viscosities (η(25 °C ) 42.9× 10⁻³ Pa s (20%)and 7.75 × 10⁻³ Pa s (10%)), Rh for the slow mode equals970Åatboth10%and20%. Fromthestrongconcentrationdependence of the slow relaxation, it is thus concludedthat the number density of the aggregates increasesbut their size does not change significantly with concen-tration.
Figure 19. (a, top) Concentration dependence of reducedviscosity (T ) 25 °C) for PS-PEO 1-3 diblock copolymer inD2O. (b, bottom) Temperature dependence of the reduceddiffusion coefficient for the fast (upper) and slow (lower)modesat C ) 20%.
Figure20. (a, top)Depolarized (VH) time correlation functionsat three concentrations as shown for PS-PEO 1-3 diblockcopolymer at T ) 25 °C. (b, bottom) Corresponding polarized(VV) correlograms corresponding to part a.
3644 Langmuir, Vol. 13, No. 14, 1997 Mortensen et al.
Assuming a rodlike structure, one can estimate the rodlength from the expression32
where σ ) ln(L/r) with r being half the rod thickness.Using the value r ) 140 Å (i.e. the radius of the sphericalmicelles at low concentrations) and with Rh ) 970 Å, thevalue L ) 5500 Å is obtained.
4. SummaryPS-PEO 1-3 in the bulk forms a low-temperature
lamellar orderedphase inducedby thePEOcrystallizationinto sheets. In the temperature range 50-70 °C a broadtransition into a disordered phase is observed. Thedisordered phase is characterized bymajor concentrationfluctuations, as revealed by the DLS data and whichmayreflect the dynamics of incipient lamellar regions as theODT is approached. The order-disorder transition thushas a large hysteresis, as expected when the order isinduced as a result of PEO crystallizing into lamellaedirectly fromthedisorderedphase. Thedynamical aspectof this hysteresis (or undercooling) remains, however, tobe studied.
In aqueous solutions, PS-PEO 1-3 over wide concen-tration ranges (up to roughly 20%polymer concentration)formssphericalmicellesofaggregationnumberof theorderof 420-470. The micelles are very temperature stable.On raising the temperature from ambient to 95 °C, thespherical aggregates change only slightly, giving rise toan approximately 5% reduction in core size and acorresponding∼15%reduction inaggregationnumberbuta somewhat swollen corona.Above c ) 10%, a slow relaxation process is evident,
which is associated with a strong increase in the solutionviscosity. Since this feature is also anisotropic, it issuggested that it reflects the formation of large wormlikeaggregates.
Acknowledgment. This work has been supported bythe Swedish Research Council (NFR) and the DanishPolymer Centre sponsored by the Program for Develop-ment of Materials Technology. We are grateful to IdaLidegran for assistance with the light-scattering mea-surements and Goran Svensk, Uppsala, for the surfacetension and viscosity measurements. We would like tothank A. Ryan for helpful discussions and access to apreprint of ref 8.
LA9609635(32) Young, C. Y.; Missel, P. J.; Mazer, N. A.; Benedek, G. B. J. Phys.
Chem. 1978, 82, 1375.
Rh ) L/[2σ - 0.19 - (8.24/σ) + (12/σ2)] (15)
Structure of PS-PEO Diblock Copolymers Langmuir, Vol. 13, No. 14, 1997 3645
Copyright © 2022 FDOKUMEN