Scattering properties of ordered mesoporous silica films
11
Scattering properties of ordered mesoporous silica films P. Cheyssac a, * , M. Klotz b , E. Sønderga ˚rd b , V.A. Sterligov c a Laboratoire de Physique de la Matie `re Condense ´e, Universite ´ de Nice, 06108 Nice Cedex 2, France b Unite ´ Mixte de Recherche CNRS/Saint-Gobain, Surface du Verre et Interfaces, Saint-Gobain, 39 Quai Lucien Lefranc, BP 135, 93303 Aubervilliers Cedex, France c Institute of Semiconductor Physics, Prosp. Nauki 45, 03028 Kiev-28, Ukraine Received 22 December 2004; received in revised form 25 March 2005; accepted 12 April 2005 Abstract Light scattering created by ordered mesoporous and non-porous silica films has been studied. The angular distribu- tion of the intensity scattered by mesoporous films differs from that of non-porous films. It shows a minimum, which has been interpreted as an interference pattern produced by the beams scattered by the mesopores distributed into the volume. Ó 2005 Elsevier B.V. All rights reserved. Keywords: Scattering; Rayleigh; Thin flims; Optical properties; Materials and process characterization 1. Introduction Ordered mesoporous materials differ from bulk matter, exhibiting a highly ordered, monodi- spersed porosity in the range 2–50 nm, giving rise to a new class of materials. Due to their unique properties, they have received increasing interest from the scientific community since the pioneering work of Beck et al. [1] in 1992. Initially obtained as powders, the synthesis of thin mesoporous films is now achieved [2–4]. These ordered films can be represented as a periodic lattice of holes in an amorphous dielectric matrix, creating an artificial material. The porous films show an effective dielec- tric constant [5,6] that may be tuned through the amount of pores and their content [7]. In particu- lar, if holes are filled with air or vacuum, this effec- tive dielectric constant will be lower than that of the same non-porous films. They also strongly scatter light. Their high specific area opens the door to catalytic or filtering processes in industrial world or environment problems [8–14]. Further- more, such films are of interest for many optical applications, including the creation of devices [15] ranging from optical sensors [16] to laser 0030-4018/$ - see front matter Ó 2005 Elsevier B.V. All rights reserved. doi:10.1016/j.optcom.2005.04.032 * Corresponding author. E-mail address: [email protected] (P. Cheyssac). Optics Communications 252 (2005) 344–354 www.elsevier.com/locate/optcom
Transcript of Scattering properties of ordered mesoporous silica films

Optics Communications 252 (2005) 344–354
www.elsevier.com/locate/optcom
Scattering properties of ordered mesoporous silica films
P. Cheyssac a,*, M. Klotz b, E. Søndergard b, V.A. Sterligov c
a Laboratoire de Physique de la Matiere Condensee, Universite de Nice, 06108 Nice Cedex 2, Franceb Unite Mixte de Recherche CNRS/Saint-Gobain, Surface du Verre et Interfaces, Saint-Gobain, 39 Quai Lucien Lefranc, BP
135, 93303 Aubervilliers Cedex, Francec Institute of Semiconductor Physics, Prosp. Nauki 45, 03028 Kiev-28, Ukraine
Received 22 December 2004; received in revised form 25 March 2005; accepted 12 April 2005
Abstract
Light scattering created by ordered mesoporous and non-porous silica films has been studied. The angular distribu-
tion of the intensity scattered by mesoporous films differs from that of non-porous films. It shows a minimum, which
has been interpreted as an interference pattern produced by the beams scattered by the mesopores distributed into the
volume.
� 2005 Elsevier B.V. All rights reserved.
Keywords: Scattering; Rayleigh; Thin flims; Optical properties; Materials and process characterization
1. Introduction
Ordered mesoporous materials differ from bulk
matter, exhibiting a highly ordered, monodi-
spersed porosity in the range 2–50 nm, giving rise
to a new class of materials. Due to their unique
properties, they have received increasing interestfrom the scientific community since the pioneering
work of Beck et al. [1] in 1992. Initially obtained as
powders, the synthesis of thin mesoporous films is
now achieved [2–4]. These ordered films can be
0030-4018/$ - see front matter � 2005 Elsevier B.V. All rights reserv
doi:10.1016/j.optcom.2005.04.032
* Corresponding author.
E-mail address: [email protected] (P. Cheyssac).
represented as a periodic lattice of holes in an
amorphous dielectric matrix, creating an artificial
material. The porous films show an effective dielec-
tric constant [5,6] that may be tuned through the
amount of pores and their content [7]. In particu-
lar, if holes are filled with air or vacuum, this effec-
tive dielectric constant will be lower than that ofthe same non-porous films. They also strongly
scatter light. Their high specific area opens the
door to catalytic or filtering processes in industrial
world or environment problems [8–14]. Further-
more, such films are of interest for many optical
applications, including the creation of devices
[15] ranging from optical sensors [16] to laser
ed.

P. Cheyssac et al. / Optics Communications 252 (2005) 344–354 345
sources with promising characteristics [17,18]. Re-
cently, mesoporous films were suggested for three
dimensional optical recording using visible light
[19]. To develop such applications, visible light
properties need be investigated. The mechanismsbehind the formation of mesostructured materials
are still not completely understood. Therefore,
the development of such materials for applications
implies the iteration of cycles formulation–
optimization–material characterization. Unfortu-
nately, the process is often slowed down by the
use of very heavy characterization techniques like
grazing incidence X-ray scattering and electronmicroscopy. A good insight into the potential abil-
ities of these new materials to the suggested appli-
cations is gained when characterizing their
structure at various scales, from grazing X-rays
to visible wavelengths. Visible light properties,
for which possible applications are expected, are
usually described by a set of refractive indices
and absorption obtained through reflectance mea-surements or spectroscopic ellipsometry, this last
procedure being time consuming and expensive.
In the case of a composite medium such as a mes-
oporous film, an effective dielectric constant has
been used for pore size characterization by adsorp-
tion of organic vapor and application of the
Bruggeman Effective Medium Approximation
[20]. Reflectance as given by Fresnel relations doesnot take scattering into account and so does no
longer give all optical properties of the sample.
Then, measurements of scattering from mesopor-
ous films add a new insight into the optical proper-
ties of new materials built from mesoporous layers.
In this paper, we deal with some of the optical
characterization of mesoporous materials in order
to characterize their light scattering properties,their refractive index if it carries a physical mean-
ing, but also to determine to what extent optical
techniques can bring insight into the materials
structure. We present the reflectivity spectra and
the angular distribution of the intensity scattered
by non-porous and ordered mesoporous silica
films. Reflectivity has been applied to the determi-
nation of indices of a given sample as long as it hasa physical meaning. To our knowledge, light scat-
tering of a mesoporous film and new features,
especially an interference pattern in the angular
distribution of scattered light, have not yet been
reported. Scattering occurs whatever the wave-
length to pore�s size ratio is. The coherent scatter-
ing created by the mesoporous film has been linked
to the structure of the film and interpreted as tak-ing place inside the mesoporous layer.
2. Preparation and structure of the samples
Each sample consists of a silicon wafer with a
thermally oxidized layer, covered by either a
non-porous or mesoporous film. Three differentsamples were realized: the first one is Si + thermal
SiO2 (labeled later as Th), the second is Si +
SiO2 + a non-porous layer (NPor) and the third
one is Si + SiO2 + a mesoporous layer (Por).
The thickness of the different samples was char-
acterized by SEM, as shown in Fig. 1. They are
d = 525 ± 10 nm for the thermal SiO2 film,
d = 240 ± 10 nm for the non-porous part of theNPor film and d = 495 ± 10 nm for its porous part.
The mesoporous films were obtained by hydro-
lysis and condensation of silica alcoxydes in the
presence of a templating mesophase. An extended
description of the synthesis and ordered structure
of these films have been reported earlier [21,22].
The films studied in this work are prepared by
adjunction of an ethanolic solution of a cationicsurfactant (CTAB: CH3(CH2)15N
+(CH3)3Br�) to
an acidic silica sol. This silica sol was prepared
by mixing TEOS (Si(OC2H5)4), acidic water (pH
1.25 adjusted by HCl) and ethanol in the molar ra-
tio 1:5:3.8 and refluxing this sol for 1 h at 60 �C.The final composition of the solution was
TEOS:Ethanol:water:CTAB in the ratio 1:3.9:5:
0.1. Thin films were deposited by spin-coating at4000 rpm on silicon wafers covered by a thermal
SiO2 oxide layer (Th film). The as-prepared films
were thermally treated at 450 �C to remove the or-
ganic template. In contrast, an amorphous silica
film was obtained by spinning the silica sol without
adjunction of the template. The obtained film is
denominated non-porous because it does not pres-
ent mesoporosity. It should be noticed that sol–gelfilms contain strong internal constraints due to the
evaporation and drying process [23]. Furthermore,
due to the sol–gel synthesis and low thermal

Fig. 1. Structure of the various samples shown by SEM. (a) Si
covered by a thermal SiO2 layer: Th sample. (b) Th sample
covered by a non-porous silica film. (c) Th sample covered by a
mesoporous silica film.
346 P. Cheyssac et al. / Optics Communications 252 (2005) 344–354
treatment, this film is not as dense as a thermally
created SiO2.
The ordered structure of the mesoporous film
has been characterized by grazing incidence smallangle X-ray diffraction. The analysis was per-
formed with a home built diffractometer [4] and
recorded on image plates. A rotating copper anode
was used and the distance between the thin film
and the image plate was 290 mm, acquisition time
15 min.
The diffraction pattern of the mesoporous thinfilm presented in Fig. 2(a) is characteristic of a
P63/mmc structure; Fig. 2(b) shows such structure
with its c-axis perpendicular to the substrate and
its a-axis randomly oriented in the substrate plane
[22]. The cell parameters are: a = 5.8 nm and
c = 6.9 nm. The ratio c/a = 1.2 differs from the the-
oretical value of 1.63 obtained for a close packed
hexagonal structure. This is consistent with a27% unidirectional shrinkage of the film perpen-
dicular to the substrate [4,22].
The thin film can best be imagined as composed
of grains approximately 0.5 lm. Inside each grain,
the mesopores form a unidirectional compressed
close packed hexagonal structure. They all have
their c-axis perpendicular to the substrate; how-
ever, they are randomly oriented in the substrateplane. No possible birefringence was detected.
The size of the mesopores was estimated to be
3.6 nm [24,25]. Through AFM shown in Fig. 3, a
typical 3.8 nm r.m.s. roughness has been obtained
for a mesoporous surface.
3. Reflection spectra
Specular reflection spectra Rexp(k) have been
measured from k = 400 up to 800 nm, close to nor-
mal incidence with a dedicated apparatus [26]. The
spectral width of the beam is 1 nm and its angular
divergence is ± 3.9�. These spectra are given in
Fig. 4; all show characteristic interference fringes.
Actually, interpretation of experimental reflec-tance in terms of optical indices and thicknesses
through Fresnel relations means that the film un-
der study satisfies related assumptions: mainly,
reflectance should measure the whole energy re-
flected by an abrupt interface. The NPor and Por
samples scatter; then, analysing their reflectance
by means of Fresnel relations that do not take
the scattered energy into account would be uselessand not physically meaningful. For these last sam-
ples, such a resolution is out of the scope of the
present paper and will not be presented here,

Fig. 2. (a) Grazing incidence small angle X-ray diffraction pattern of the mesoporous film. The film is ordered in a P63/mmc structure
with the c-axis perpendicular to the substrate. (b) Schematic presentation of the porous film structure. Spheres represent mesopores in
SiO2 matrix.
Fig. 3. AFM view of the surface.
P. Cheyssac et al. / Optics Communications 252 (2005) 344–354 347
although a paragraph in the discussion will give
more details about this point.
On the contrary, the indices nTh = mTh + ijThof the SiO2 layer created by thermal oxydization
onto Si have been determined using two indepen-
dent procedures.
On one hand, a commercial software dedicated
to ellipsometry [27] has been used to extract nTh.The input are the indices of Si taken from tabu-
lated values [28] and a physically meaning model
of nTh is the output. On the other hand, the reflec-
tion coefficients of each interface air–SiO2 and
SiO2–Si have been combined in order to give the
reflection of the Th sample. In this case, a Cau-
chy�s-type relation [29] is used for nTh. Both pro-
cedures use the thickness d = 525 ± 10 nm of
SiO2 given by scanning electron microscopy and
both get nTh through a minimization of the differ-
ence between experiment and theory.
The same values and behaviour of the refractive
index mTh of SiO2 are obtained: a monotonousdecrease when the wavelength k increases as it is
expected for a transparent medium.
Because a non-negligible although small part of
energy is scattered, a perfect agreement between
calculated and published refractive indices mTh of
SiO2 cannot be realized. The best agreement with
[29], better than 2%, is obtained when the thick-
ness of the sample is taken as d0 = 521 nm andwhen one introduces a faint absorption jTh (lower
than 2%) that accounts for the scattered energy
which is lost for the reflectance measurements.
The calculated mTh and jTh that insure the best
fit with published values of nTh [29] are given in
Fig. 5, together with nTh [29].
For the Npor sample, we encountered difficul-
ties when modeling the system. Effective mediumtheories would lead to a decrease of the effective
index when the density of pores increases,
although it should remain higher than 1. This film
does not present a significant amount of scattering,
but the discrepancy may stem from its large inter-
nal constraints and its low density.
For the porous sample, scattering takes so an
important part of energy that trying to solve

Fig. 4. Reflection spectra Rexp(k) of: (a) Th sample: continuous line; (b) Npor sample: dots; (c) Por sample: triangles.
Fig. 5. Calculated index nTh = mTh + ijTh of SiO2.
348 P. Cheyssac et al. / Optics Communications 252 (2005) 344–354
Fresnel relations loose any physical meaning. Por
films have less internal constraints than Npor sam-
ple due to the templating. Using an effective med-
ium dielectric constant, one finds numericalsolutions for the real and imaginary parts of index
and localized absorption bands. They prove to be
not Kramers–Kronig related as they should be.
Therefore, we consider the main mechanism is that
strong scattering, as recalled earlier, renders the
previous procedures inappropriate.
Numerical computations of indices and thick-
nesses from reflection spectra have been and still
are the subject of many publications [30–33]. Solu-
tions are not unique, an intrinsic difficulty of thiskind of calculation; although knowing the thick-
ness removes one unknown of the problem, the
calculated solutions must present a physical mean-
ing. The real part of the index should decrease
when k increases, a behaviour compatible with
that of a transparent medium; if a small absorp-

P. Cheyssac et al. / Optics Communications 252 (2005) 344–354 349
tion is present, the index takes complex values and
its imaginary part should be related to its real part
through a Kramers–Kronig relation.
With both our procedures, none trial to fit
Rcalc(k) and Rexp(k) succeeded; of course numer-ical values were obtained but none retained physi-
cal meaning in the previous sense.
4. Scattering properties
An original patented installation [34] has been
used for the measurements of light scattered bynon-porous and mesoporous films deposited onto
Si. It allows also obtaining an optical image of
the scattering area under study (Fig. 6), a valuable
possibility to estimate the presence of defects of all
kind on the surface and simplify the interpretation
of scattering data. The light source is a He–Ne la-
ser switchable at k = 594 and 632.8 nm, with an
optical power of �3 mW. The laser beam impingesat normal incidence onto the sample and is focused
down to �100 lm diameter while remaining quasi-
parallel. Focalization determines the angular reso-
lution, the order of 1� in our case, and enables
choosing the area that exhibits the lowest possible
contamination.
Geometrical images of NPor and Por scattering
areas, Fig. 6(a) and (b), shows the origin of back-ground scattering. For non-porous film, scatter is
produced by a weak background and is present
at grazing incidence; few point-like contaminated
centers located on the surface are then iluminated
and scatter light efficiently. The high sensitivity of
Fig. 6. Image of scattering area. (a) NPor sample,
the camera allows them to be recorded although
the spot size is the order of 100 lm. The well visi-
ble speckle structure Fig. 6(b) is created by inter-
ferences originating from these centers.
For mesoporous film, with an homogeneousand very dense space distribution of mesopores,
the level of background scattering that comes from
clear places is increased.
The bidirectional scatter distribution function
BSDF, function of the polar and azimuthal angles
h and u, is defined as the scattered intensity dI nor-
malized to the incident intensity I0, the solid angle
of the receptor dX and cos h: BSDF = 1/(I0 cos h)dI/dX. This BSDF is represented in a 2D diagram
as a function of the sample�s spatial frequencies fx,fy; at normal incidence, f = sin h/k for any scatter-
ing plane. Due to the range of scattered intensities,
Fig. 7 shows log BSDF(fx, fy), scaled with grey lev-
els on a disc: its center gives the intensity scattered
normally to the sample�s surface, its borderline thegrazing scattering. Average scattered intensitiesmay be obtained in two ways: through the total
integrated scatter TIS or an azimuthal averaging
of BSDF, Fig. 8, performed for a u-range in which
scattering data represents all samples. The TIS due
to the three kinds of sample are given as ratios
using the data shown in Fig. 7: TISNPor/TISTh =
0.39 ± 0.29, while TISPor/TISTh = 21 ± 8 and TIS-
Por/TISNPor = 54 ± 20. Both TIS or azimuthalaveraging of BSDF show that scattering increases
from Npor to Por samples.
The angular distribution of the intensity scat-
tered by a Por sample exhibits well-pronounced
minima given by sin hmin(632.8 nm) = 0.582 ± 0.02
(b) Por sample. Image size is 700 · 500 lm2.

Fig. 7. log BSDF(fx, fy) as a function of the spatial frequencies: (a) Th film; (b) NPor film; (c) Por film: k = 638.8 nm, (d) k = 594 nm.
350 P. Cheyssac et al. / Optics Communications 252 (2005) 344–354
and sin hmin(594 nm) = 0.721 ± 0.02. A modula-tion of the azimuthal dependence of scattered light
also exists for the Npor sample, due to an increase
Fig. 8. Azimuthally averaged cross-section of BSDF(fx, fy) as a functi
NPor films at 632.8 nm. Simulated minima (Sim) are also drawn.
in the speckle structure. Of course, the angularminimum is still present in the azimuthal averaging
of BSDF.
on of sin h, for a Por film at 594 and 632.8 nm, and for Th and

P. Cheyssac et al. / Optics Communications 252 (2005) 344–354 351
Fig. 7(c) and (d) also shows that the spatial fre-
quency modulus associated with BSDF�s minimum
is significantly shifted when k varies from 632.8 to
594 nm.
The differences in the levels of scattering fromone kind of layer to the other have to be explained.
We have to question the physical process able to
create and shift significantly this angular minimum
for so small a change of k. Interference is a good
candidate for such a process and its origin may
lay in surface relief and scattering centers. The
pores are homogeneously distributed inside the
film and exhibit order. They can act as coherentscatterers, giving rise to interference.
5. Interpretation and discussion
The determination of film thickness is crucial
when optimizing the synthesis and deposition of
mesoporous films. In general, this quantity isdetermined by SEM, a heavy technique compared
to reflectance, and it drastically limits the number
of characterized samples. Therefore, it would be
interesting if a fairly simple and inexpensive tech-
nique, contrary to SEM, would lead to similar re-
sult, opening a way for a simple table top
apparatus for direct use in the laboratory. In what
preceeds, the limits of such procedures appearsclearly for our samples.
For the thermal layer of SiO2 onto Si, its optical
indices have been determined and turned out to be
very close to that already published. The thickness
d0 of SiO2 controls the position of the interference
peaks and the best agreement between Rcalc(k)and Rexp(k) has been obtained with d0 =
521 nm, a value very close to d = 525 ± 10 nmmeasured by SEM.
The analytical model [29] of SiO2 index we used
has been established from double side polished and
oxidized wafers, and there are no reflective or
absorptive phenomena associated with surface
roughness, damage, or anomalies. Then, it corre-
sponds closely to our experimental situation. How-
ever, due to fabrication process, our Si wafer andits associated thermal SiO2 layer are not perfect:
chemical and thermal treatments open the way to
some remaining impurities of the template. As
well, surface roughness is present, see AFM imag-
ing in Fig. 3 and scattering results in Fig. 7(a).
Hence, a small imaginary part jTh, has been
added to the index of SiO2, usually a pure real
number at least in our visible range under study.jTh increases monotonically with k but remains
lower than 0.02. No absorption band appears so
the impurity level is very small and jTh simulates
the energy scattered by the roughness of the outer
interface of the sample.
For NPor and Por films, the analytic treatment
of reflectance data does not lead to any physically
meaningful values of the real and imaginary partsof the indices that describe their optical properties.
Even with the known thicknesses of the layers as
input, it turns out that the set of values that may
realize a fit between Rcalc(k) and Rexp(k) cannotbe represented by a series development of a Cau-
chy�s-type model of dielectric. On one hand, one
would expect that the output of calculations could
be interpreted as an effective dielectric functionadequate as a description of the optical properties
of the samples. On the other hand, it comes out
that this absorption, imaginary part j of the
layer�s index, is not Kramers–Kronig related to
the real part m of the index as it should be. The
samples scatter so strongly in all directions, as
shown in Figs. 7 and 8, that absorption previously
introduced in order to represent the scattered lightis useless and so no physical meaning can be
attached to its numerical value and wavelength
behaviour.
A part of the problem with the interpretation of
the data can come from the variation in the density
of the materials. Thermal SiO2, Npor and Por lay-
ers are realized from the same material, only their
density differs and a common behaviour as a func-tion of wavelength may be expected. For different
mesoporous samples, ellipsometric data [35–37]
show that the pores are empty and filled by air
immediately after preparation: a characteristic vol-
ume ratio �0.43 between air and matrix had been
determined previously [38]; then the density of Por
samples is much lower than that of Th ones. If
materials would remain perfect dielectrics, theirrefractive index would decrease with the same
ratio as density, the same if one applies an
effective medium theory: this should lead to
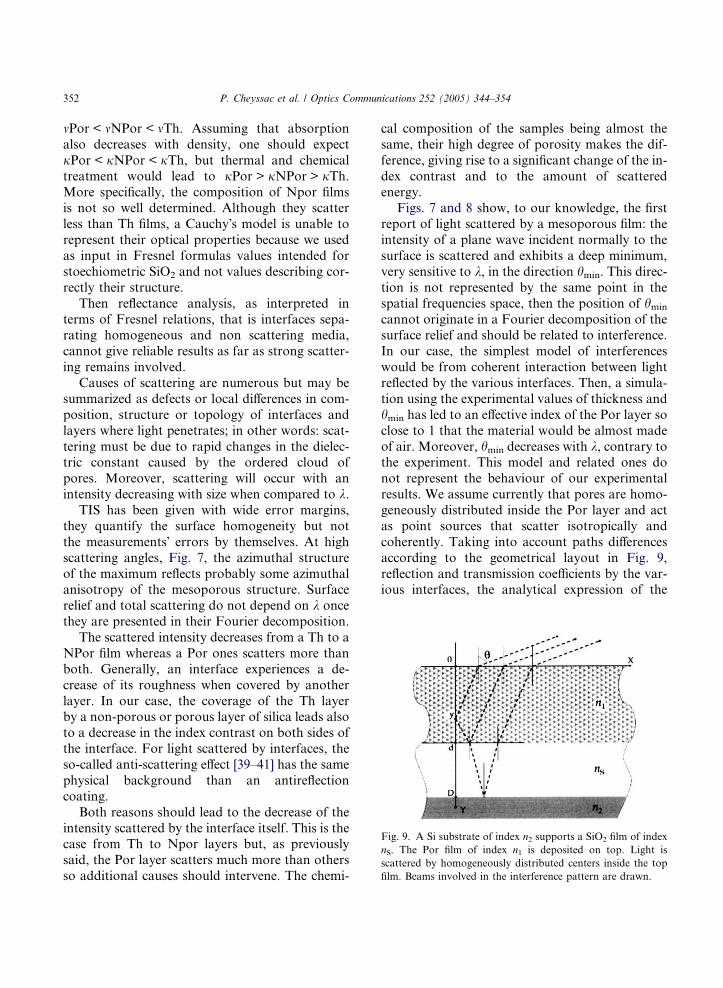
Fig. 9. A Si substrate of index n2 supports a SiO2 film of index
nS. The Por film of index n1 is deposited on top. Light is
scattered by homogeneously distributed centers inside the top
film. Beams involved in the interference pattern are drawn.
352 P. Cheyssac et al. / Optics Communications 252 (2005) 344–354
mPor < mNPor < mTh. Assuming that absorption
also decreases with density, one should expect
jPor < jNPor < jTh, but thermal and chemical
treatment would lead to jPor > jNPor > jTh.More specifically, the composition of Npor filmsis not so well determined. Although they scatter
less than Th films, a Cauchy�s model is unable to
represent their optical properties because we used
as input in Fresnel formulas values intended for
stoechiometric SiO2 and not values describing cor-
rectly their structure.
Then reflectance analysis, as interpreted in
terms of Fresnel relations, that is interfaces sepa-rating homogeneous and non scattering media,
cannot give reliable results as far as strong scatter-
ing remains involved.
Causes of scattering are numerous but may be
summarized as defects or local differences in com-
position, structure or topology of interfaces and
layers where light penetrates; in other words: scat-
tering must be due to rapid changes in the dielec-tric constant caused by the ordered cloud of
pores. Moreover, scattering will occur with an
intensity decreasing with size when compared to k.TIS has been given with wide error margins,
they quantify the surface homogeneity but not
the measurements� errors by themselves. At high
scattering angles, Fig. 7, the azimuthal structure
of the maximum reflects probably some azimuthalanisotropy of the mesoporous structure. Surface
relief and total scattering do not depend on k once
they are presented in their Fourier decomposition.
The scattered intensity decreases from a Th to a
NPor film whereas a Por ones scatters more than
both. Generally, an interface experiences a de-
crease of its roughness when covered by another
layer. In our case, the coverage of the Th layerby a non-porous or porous layer of silica leads also
to a decrease in the index contrast on both sides of
the interface. For light scattered by interfaces, the
so-called anti-scattering effect [39–41] has the same
physical background than an antireflection
coating.
Both reasons should lead to the decrease of the
intensity scattered by the interface itself. This is thecase from Th to Npor layers but, as previously
said, the Por layer scatters much more than others
so additional causes should intervene. The chemi-
cal composition of the samples being almost the
same, their high degree of porosity makes the dif-
ference, giving rise to a significant change of the in-
dex contrast and to the amount of scattered
energy.Figs. 7 and 8 show, to our knowledge, the first
report of light scattered by a mesoporous film: the
intensity of a plane wave incident normally to the
surface is scattered and exhibits a deep minimum,
very sensitive to k, in the direction hmin. This direc-
tion is not represented by the same point in the
spatial frequencies space, then the position of hmin
cannot originate in a Fourier decomposition of thesurface relief and should be related to interference.
In our case, the simplest model of interferences
would be from coherent interaction between light
reflected by the various interfaces. Then, a simula-
tion using the experimental values of thickness and
hmin has led to an effective index of the Por layer so
close to 1 that the material would be almost made
of air. Moreover, hmin decreases with k, contrary tothe experiment. This model and related ones do
not represent the behaviour of our experimental
results. We assume currently that pores are homo-
geneously distributed inside the Por layer and act
as point sources that scatter isotropically and
coherently. Taking into account paths differences
according to the geometrical layout in Fig. 9,
reflection and transmission coefficients by the var-ious interfaces, the analytical expression of the

P. Cheyssac et al. / Optics Communications 252 (2005) 344–354 353
amplitude of all beams scattered in the direction hhas been calculated as a function of h, indices andthicknesses of the layers. This amplitude is inte-
grated along the mesoporous film thickness. The
scattered intensity I(k sinh) is deduced and goesthrough a minimum hmin, its analytic complexity
does not enable expressing hmin in terms of optical
parameters of the layer. The simulated positions
hmin, relative values of I(k sinh) and behaviour
with k, presented in Fig. 8, are close to the exper-
imental ones, although a perfect agreement is not
obtained.
As surprising as it may appear, we did not findany other explanation of such minimum of the
scattered intensity in a given direction so sensitive
to the wavelength. We are led to conclude that the
mesoporous structure gives rise to an inside coher-
ent scattering detected outside by a minimum of
intensity in a direction hmin very sensitive to k.
6. Conclusion
In this paper, we have studied the reflection and
light scattering properties of a Si substrate covered
by different layers of silica with a non-porous or
mesoporous structure. We have showed that Th
layers created by thermal oxydization of Si pres-
ent, from an optical point of view, very similarproperties to bulk SiO2. We have also shown that
porous layers present specific optical properties
such that interpretation of reflectance using Fres-
nel relations is not straightforward. Therefore,
the Bruggeman effective medium approximation
is generally not directly applicable. As far as scat-
tering and reflectance occur from all positions in-
side a porous layer, a devoted theory taking intoaccount reflectance and scattering should be used
but this was not the purpose of this paper. If such
a theory was to be used, one would expect possible
to estimate a very important parameter for meso-
porous systems namely the filling factor. Then,
simple optical equipment has shown limits during
the optimization of mesoporous film. Complicated
tools like SEM, TEM, GISAXS remain, in thepresent state of the art, necessary for a non-ambig-
uous characterization of thickness and structure of
mesoporous films.
The intensity scattered by mesoporous film
proved to be one order of magnitude higher than
homogeneous films. Most surprisingly, its angular
distribution exhibits a well-marked minimum
characteristic of interferences. These interferenceshave been related with the film structure and ex-
plained by coherent scattering taking place in the
thickness of the film. Future work may settle if
the mesopores or the texture of the films is the ori-
gin of the phenomenon. In all cases, these studies
will enhance the insight in the structure and forma-
tion of mesoporous films.
Acknowledgements
The authors thank Pierre-Antoine Albouy
(Laboratoire des Solides, Universite de Paris
Sud, France) for the acquisition of the diffraction
pattern.
References
[1] J.S. Beck, J.C. Vartuli, W.J. Roth, M.E. Leonowicz, C.T.
Kresge, K.D. Schmitt, C.T.W. Chu, D.H. Olson, E.W.
Sheppard, S.B. McGullen, J.B. Higgins, J.L. Schlenk, J.
Am. Chem. Soc. 114 (1992) 10834.
[2] Y. Lu, R. Ganguli, C.A. Drewien, M.T. Anderson, C.J.
Brinker, W. Gong, Y. Guo, H. Soyez, B. Dunn, M.H.
Huang, J.I. Zink, Nature 389 (1997) 364.
[3] M. Klotz, A. Ayral, C. Guizard, L. Cot, J. Mater. Chem.
10 (2000) 663.
[4] M. Klotz, P.-A. Albouy, A. Ayral, C. Menager, D. Grosso,
A. Van der Lee, V. Cabuil, F. Babonneau, C. Guizard,
Chem. Mater. 12 (2000) 1721.
[5] H. Fan, H.R. Bentley, K.R. Kathan, P. Clem, Y. Lu, C.J.
Brinker, J. Non-Cryst. Solids 285 (2001) 79.
[6] C.-M. Yang, A.-T. Cho, F.-M. Pan, T.-G. Tsai, K.-J.
Chao, Adv. Mater. 13 (2001) 1099.
[7] F.K. de Theije, A.R. Balkenende, M.A. Verheijen, M.R.
Baklanov, K.P. Mogilnikov, Y. Furukawa, J. Phys. Chem.
B 107 (2003) 4280.
[8] V. Dufaud, Mark E. Davis, J. Am. Chem. Soc. 125 (31)
(2003) 9403.
[9] E. Rodriguez-Castellon, A. Jimenez-Lopez, P. Maireles-
Torres, D.J. Jones, J. Roziere, M. Trombetta, G. Busca,
M. Lenarda, L. Storaro, J. Solid State Chem. 175 (2)
(2003) 159.
[10] D. Trong On, D. Desplantier-Giscard, C. Danumah, S.
Kaliaguine, Appl. Catal. A 222 (2001) 299.
[11] D. Brunel, A.C. Blanc, A. Galarneau, F. Fajula, Catal.
Today 73 (2002) 139.

354 P. Cheyssac et al. / Optics Communications 252 (2005) 344–354
[12] L. Mercier, T.J. Pinnavaia, Adv. Mater. 9 (6) (1997) 500.
[13] Y.-H. Chu, H.-J. Kim, K.-Y. Song, Y.-G. Shul, K.-T.
Jung, K. Lee, M.-H. Han, Catal. Today 74 (2002) 249.
[14] B.L. Newalkar, N.V. Choudary, U.T. Turaga, R.P. Vija-
yalakshimi, P. Kumar, S. Komarneni, T.S.G. Bhat, Chem.
Mater. 15 (2003) 1474.
[15] R.C. Hayward, P. Alberius-Henning, B.F. Chmelka, G.D.
Stucky, Micropor. Mesopor. Mat. 44–45 (2001) 619.
[16] G. Wirnsberger, B.J. Scott, G.D. Stucky, Chem. Commun.
(2001) 119.
[17] G. Wirnsberger, P. Yang, B.J. Scott, B.F. Chmelka, G.D.
Stucky, Spectrochim. Acta A 57 (2001) 2049.
[18] B.J. Scott, G. Wirnsberger, G.D. Stucky, Chem. Mater. 13
(10) (2001) 3140.
[19] J. Wang, G.D. Stucky, Advanced Functional Materials. 14
(5) (2004).
[20] A. Bourgeois, A. Brunet Bruneau, S. Fisson, B. Demarets,
D. Grosso, F. Cagnol, C. Sanchez, J. Rivory, Thin Solid
Films 447–448 (2004) 46.
[21] S. Besson, T. Gacoin, C. Jacquiod, C. Ricolleau, D.
Babonneau, J.-P. Boilot, J. Mater. Chem. 10 (2000)
1331.
[22] S. Besson, C. Ricolleau, T. Gacoin, C. Jacquiod, J.-P.
Boilot, J. Phys. Chem. B 104 (2000) 12095.
[23] C.J. Brinker, G.W. Scherer, Sol–gel Science, Academic
Press, San Diego, 1990.
[24] M. Klotz, S. Besson, C. Ricolleau, F. Bosc, A. Ayral,
Mat. Res. Soc. Symp. Proc. 752 (2003) AA8.6.1.
[25] S. Besson, T. Gacoin, C. Ricolleau, C. Jacquiod, J.-P.
Boilot, Nanoletters 2 (2002) 409.
[26] R. Kofman, P. Cheyssac, J. Richard, Phys. Rev. B 16
(1977) 5216.
[27] Wvase 32, from J.A. Woollam Co., Inc., 645 M. Street,
Suite 102 Lincoln, NE 68508, USA. Available from:
<www.jawoollam.com>.
[28] Virginia Semiconductor, Inc. 1501 Powhatan Street, Fred-
ericksburg, Va 22401, Optical Properties of Silicon. Avail-
able from: <www.vriginiasemi.com>.
[29] C.M. Herzinger, B. Johs, W.A. McGahan, J.A. Woollam,
W. Paulson, J. Appl. Phys. 83 (615) (1998) 3323.
[30] D.A. Minkov, J. Phys. D 22 (1989) 1157.
[31] D.A. Minkov, J. Phys. D 22 (1989) 199.
[32] R. Rusli, G.A.J. Amaratunga, Appl. Opt. 34 (1995) 7914.
[33] J.M. Gonzalez-Leal, E. Marquez, A.M. Bernal-Oliva, J.J.
Ruiz-Perez, R. Jimenez-Garay, Thin Solid Films 317 (1998)
223.
[34] V.A. Sterligov, P. Cheyssac, Appareil et procede de
caracterisation optique d�un objet, CNRS Patent Nos.
0115232, 23.11.2001.
[35] D. Grosso, A.R. Balkenende, P.A. Albouy, M. Lavergne,
L. Mazerolles, F. Babonneau, J. Mater. Chem. 10 (9)
(2000) 2085.
[36] S. Besson, Organized mesoporous silica films: synthesis,
characterization of the structure and application to the
growth of nanoparticles, PhD thesis, Ecole Polytechnique,
Paris, 2002 (in French).
[37] A. Brunet-Bruneau, S. Besson, T. Gacoin, J.P. Boilot, J.
Rivory, Thin Solid Films 447–448 (2004) 51.
[38] A. Brunet-Bruneau, S. Fisson, B. Gallas, G. Vuye, J.
Rivory, Thin Solid Films 377–378 (2000) 57.
[39] P. Roche, E. Pelletier, G. Albrand, J. Opt. Soc. Am. A 1
(1984) 1032.
[40] C. Amra, G. Albrand, P. Roche, Appl. Opt. 16 (1986) 2695.
[41] H. Giovannini, C. Amra, Appl. Opt. 36 (1997) 5574.


![Functionalisation of mesoporous silica gel with 2-[(phosphonomethyl)-amino]acetic acid functional groups. Characterisation and application](https://static.fdokumen.com/doc/165x107/6323840b5f71497ea9045e24/functionalisation-of-mesoporous-silica-gel-with-2-phosphonomethyl-aminoacetic.jpg)