Quantitative assessment and source apportionment of metal pollution in soil along Chao River
10
This article was downloaded by: [Professor Yingxia Li] On: 14 May 2013, At: 06:41 Publisher: Taylor & Francis Informa Ltd Registered in England and Wales Registered Number: 1072954 Registered office: Mortimer House, 37-41 Mortimer Street, London W1T 3JH, UK Desalination and Water Treatment Publication details, including instructions for authors and subscription information: http://www.tandfonline.com/loi/tdwt20 Quantitative assessment and source apportionment of metal pollution in soil along Chao River Yingxia Li a , Hongchao Gao a , Li Mo b , Yanhong Kong b & Inchio Lou c a State Key Laboratory of Water Environment Simulation , School of Environment, Beijing Normal University , Beijing , 100875 , China b China Academy of Urban Planning & Design , Beijing , 100044 , China c Department of Civil and Environmental Engineering , University of Macau , Macau SAR , China Published online: 14 May 2013. To cite this article: Yingxia Li , Hongchao Gao , Li Mo , Yanhong Kong & Inchio Lou (2013): Quantitative assessment and source apportionment of metal pollution in soil along Chao River, Desalination and Water Treatment, DOI:10.1080/19443994.2013.781073 To link to this article: http://dx.doi.org/10.1080/19443994.2013.781073 PLEASE SCROLL DOWN FOR ARTICLE Full terms and conditions of use: http://www.tandfonline.com/page/terms-and-conditions This article may be used for research, teaching, and private study purposes. Any substantial or systematic reproduction, redistribution, reselling, loan, sub-licensing, systematic supply, or distribution in any form to anyone is expressly forbidden. The publisher does not give any warranty express or implied or make any representation that the contents will be complete or accurate or up to date. The accuracy of any instructions, formulae, and drug doses should be independently verified with primary sources. The publisher shall not be liable for any loss, actions, claims, proceedings, demand, or costs or damages whatsoever or howsoever caused arising directly or indirectly in connection with or arising out of the use of this material.
Transcript of Quantitative assessment and source apportionment of metal pollution in soil along Chao River

This article was downloaded by: [Professor Yingxia Li]On: 14 May 2013, At: 06:41Publisher: Taylor & FrancisInforma Ltd Registered in England and Wales Registered Number: 1072954 Registered office: Mortimer House,37-41 Mortimer Street, London W1T 3JH, UK
Desalination and Water TreatmentPublication details, including instructions for authors and subscription information:http://www.tandfonline.com/loi/tdwt20
Quantitative assessment and source apportionment ofmetal pollution in soil along Chao RiverYingxia Li a , Hongchao Gao a , Li Mo b , Yanhong Kong b & Inchio Lou ca State Key Laboratory of Water Environment Simulation , School of Environment, BeijingNormal University , Beijing , 100875 , Chinab China Academy of Urban Planning & Design , Beijing , 100044 , Chinac Department of Civil and Environmental Engineering , University of Macau , Macau SAR ,ChinaPublished online: 14 May 2013.
To cite this article: Yingxia Li , Hongchao Gao , Li Mo , Yanhong Kong & Inchio Lou (2013): Quantitative assessmentand source apportionment of metal pollution in soil along Chao River, Desalination and Water Treatment,DOI:10.1080/19443994.2013.781073
To link to this article: http://dx.doi.org/10.1080/19443994.2013.781073
PLEASE SCROLL DOWN FOR ARTICLE
Full terms and conditions of use: http://www.tandfonline.com/page/terms-and-conditions
This article may be used for research, teaching, and private study purposes. Any substantial or systematicreproduction, redistribution, reselling, loan, sub-licensing, systematic supply, or distribution in any form toanyone is expressly forbidden.
The publisher does not give any warranty express or implied or make any representation that the contentswill be complete or accurate or up to date. The accuracy of any instructions, formulae, and drug doses shouldbe independently verified with primary sources. The publisher shall not be liable for any loss, actions, claims,proceedings, demand, or costs or damages whatsoever or howsoever caused arising directly or indirectly inconnection with or arising out of the use of this material.

Quantitative assessment and source apportionment of metalpollution in soil along Chao River
Yingxia Lia,*, Hongchao Gaoa, Li Mob, Yanhong Kongb, Inchio Louc
aState Key Laboratory of Water Environment Simulation, School of Environment, Beijing Normal University,Beijing 100875, ChinaEmail: [email protected] Academy of Urban Planning & Design, Beijing 100044, ChinacDepartment of Civil and Environmental Engineering, University of Macau, Macau SAR, China
Received 30 June 2012; Accepted 31 December 2012
ABSTRACT
Heavy metal pollution in surface soil is a serious threat to the drinking water source area,which might be washed into the reservoir by stormwater runoff. In this study, concentrationsof 26 metals were measured for 15 surface soil samples taken along Chao River, which is themajor inflow river for Miyun reservoir. The characteristics of metal concentrations were dem-onstrated and the pollution sources were analyzed by principal component analysis/multiplelinear regression method and positive matrix factorization method. Results show that themean concentrations of nickel (Ni), chromium (Cr), copper (Cu), and mercury (Hg) are largerthan their standard values. Moderate risk of Hg pollution and lightly risk of lead (Pb) andNi pollution are found in the study area. Anthropogenic behaviors of mining, vehicularemission, and coal combustion are the dominant metal pollution sources, which contribute to33–35, 17–27, and 11–26% of the total metal pollution, respectively. Most of Hg, Pb, Cu, Cr,and manganese come from these sources. Natural source contributes to 22–29% of the totalmetal pollution, which is the main source of zinc and cadmium.
Keywords: Heavy metal pollution; Miyun reservoir; Principle component analysis; Sourceapportionment; Surface soil
1. Introduction
Heavy metal pollution at drinking water sourcearea has become a serious threat to the safety of urbanwater supply and human health in many places inChina [1]. Various metal elements from many sources
accumulate in the surface soil and can be flushed intothe reservoirs and lakes nearby, which will eitherreach the drinking water supply plant or settle downat the bottom of the reservoir [2]. This will increasethe risk of heavy metal pollution for urban watersupply. For example, mercury (Hg) concentration haskept rising in recent years in Lake Songhua, which is
*Corresponding author.
Presented at the Nonpoint Source (NPS) Workshopsat the Third International Conference on Rainwater Harvesting & Management, Goseong, Korea, 20–24 May 2012and the Korea-China World Expo Exhibition Plan, Beijing Normal University, Beijing, China, 4–7 July 2012
1944-3994/1944-3986 � 2013 Balaban Desalination Publications. All rights reserved.
Desalination and Water Treatmentwww.deswater.com
doi: 10.1080/19443994.2013.781073
(2013) 1–9
Dow
nloa
ded
by [
Prof
esso
r Y
ingx
ia L
i] a
t 06:
41 1
4 M
ay 2
013

the drinking water source for JinLin and ChangChuncity [3]. A high risk of heavy metal contamination,especially cadmium (Cd), was found near theGuanting reservoir [4].
Therefore, it is necessary to characterize the metalcontamination status in surface soil and discerning thesources of metals. This will be helpful to controldifferent pollution sources for the heavy metalpollution in soil.
Generally, metal pollution sources can beclassified into two groups. One is the natural mate-rial group and the other is anthropogenic sourcegroup. Nowadays, the main method to indentifydifferent sources is to investigate trace elements insamples. For example, a coexistence of high concen-trations of iron (Fe) and manganese (Mn) usuallyrelates to the existence of soil parent material [5,6].Likewise, a close association between magnesium(Mg) and Mn or an association among chromium(Cr), nickel (Ni), aluminum (Al) and Fe alsoindicates that these elements may originate from theparental materials [7]. Similarly, a strong relation-ship between zinc (Zn) and Cd also implies theexistence of nature sources [8].
On the other hand, there are many anthropogenicsources for metal elements in soil such as vehicleemission, coal combustion, sewage for irrigation,fertilizer, pesticide, and mining [9]. Usually, both Hgand arsenic (As) are tracer elements in coal combus-tion [10]. The existence of Cr, lead (Pb), and Ni isusually associated with vehicular emission [11]. In lotsof fertilizers, Hg and Cd are common elements whichcan be used as tracer elements for fertilizers [12]. InTariq’s study [13], strong correlation among Zn, Cr,and calcium (Ca) was considered to originate fromtannery effluents.
Currently, many approaches including principalcomponent analysis/multiple linear regression(PCA/MLR), positive matrix factorization (PMF),chemical mass balance, unmix method, etc. have beenapplied to identify different pollution sources. Differ-ent approaches need different kinds of data and usedifferent basic theories. Therefore, the results of differ-ent methods might not be the same. As a result, theapplication of multi-methods in source apportionmentstudy is necessary to scientifically evaluate the sourceidentification results [14–18].
The objective of this study is to characterize thecurrent pollution situation of metal elements in soilalong the Chao River, which is the main upperstream of Miyun Reservoir. Since Miyun Reservoiris the main surface water supply source for Beijing,the results of this study will be useful to thepollution source management for Miyun reservoir.
2. Materials and methods
2.1. Study area and sampling method
As shown in Fig. 1, Chao River is the main inflowreach of Miyun Reservoir. In this study, the surround-ing land along the lower reach of Chao River isselected as study area, which contributes a largeproportion of nonpoint source pollution to ChaoRiver. Agriculture is the major land use in this areaand the anthropogenic activities greatly influence thewater quality of Miyun Reservoir.
A total of 15 sampling sites were selected, whichwere about evenly distributed along the Chao Riveras shown in Fig. 1. The detailed information ofsampling sites is shown in Table 1. There are threekinds of land uses including grassland, forestland,and arable land. The grasslands of S2, S14, and S15are usually drowned in the rainy season due to theirshort distance to the river. S3, S5, and S12 are forest-lands. Among these sites, S3 and S5 are protectiveforest near the river to reduce the nonpoint sourcepollution to the river and S12 is a natural forest nearthe villages. Other sites are arable lands which includecorn field (S1 S6, S8, S10, S11, and S13) and orchardfield (S4, S7, and S9). In addition, topographical differ-ences among sampling sites also exist. These siteshave three kinds of topography including plain,sloping land, and terrace land.
Samples were taken in October 2011. At eachsampling site, the top 15 cm surface soil was takenfrom three evenly distributed points within 1m2 area,then these three samples were mixed together to bethe only sample for each sampling site. Samples wereput into plastic bags and taken back to the laboratoryfor chemical analysis. All samples were air dried for3weeks before analysis.
Fig. 1. Sampling site locations.
2 Y. Li et al. / Desalination and Water Treatment
Dow
nloa
ded
by [
Prof
esso
r Y
ingx
ia L
i] a
t 06:
41 1
4 M
ay 2
013

2.2. Chemical analysis
Before chemical analysis, large stones and plantparts were removed by a sieve with an opening sizeof 2mm. Then the sieved samples were grounded.The concentrations of 26 metal elements (As, barium(Ba), Cd, cerium (Ce), cobalt (Co), Cr, copper (Cu),Hg, lanthanum (La), Mn, molybdenum (Mo), niobium(Nb), Ni, Pb, antimony (Sb), scandium (Sc), titanium(Ti), thallium (Tl), yttrium (Y), Zn, aluminum oxide(Al2O3), ferric oxide (Fe2O3), magnesium oxide (MgO),calcium oxide (CaO), sodium monoxide (Na2O), andpotassium oxide (K2O)) including heavy metals andgeochemical parameters were measured on thegrounded samples. Cd, Ce, Co, Cu, La, Mo, Nb, Ni,Pb, Sc, Tl, Y, and Zn were analyzed by inductivelycoupled plasma-mass spectrometry. Ba, Cr, Mn, Ti,Al2O3, Fe2O3, MgO, CaO, Na2O, and K2O wereanalyzed by inductively coupled plasma optical emis-sion spectrometer. As, Hg, and Sb were measured byatomic fluorescence spectrometry method. Duplicatesamples (one duplicate per 7 samples) were measuredand geochemical reference materials (GSS17, GSS25,GSS26, GSS27) were used in the experiment for qual-ity control. The average deviation from the referencematerials is less than 5%.
2.3. Source apportionment analysis
2.3.1. PCA/MLR method
In this study, the PCA/MLR method was usedwith SPSS 18.0. Influential factors from different pollu-tion sources were determined with PCA analysis
[19,20]. After PCA analysis, the contribution rate ofeach factor was calculated by MLR method.
2.3.2. PMF method
To better understand the contribution of variouspollution sources, PMF method was applied for sourceapportionment. Firstly, the uncertainty of the experi-mental data was evaluated by the fractional error andminimum detection limits. Secondly, the data werediagnosed by the signal-to-noise ratio and determinedto be good, bad, or weak. Then the number of factorswas obtained. Finally, the preliminary result will beregulated until the best result is obtained [21]. TheEPA PMF 3.0 was used in this research.
3. Results and discussion
3.1. Heavy metal concentrations
Statistical summary of concentrations of the 26metal elements is shown in Table 2. Ba, Mn, and Ti arequite enriched in the samples with mean concentra-tions higher than 500mg/g, which are 620.63, 782.77,and 4668.27mg/g, respectively. The concentrations ofother metals are all less than 500mg/g. The variationof the metal concentrations caused by site difference isrepresented by coefficient of variation (CV) values.Results show that the concentrations of most metalelements do not vary very much at different sites withCV values between 12 and 50% except Hg, which hasa CV value of 86.95%. This indicates that Hg mightcome from different pollution sources than other
Table 1Sampling site description
Site No Land use Topography Coordinate
S1 Arable land (corn field) Plain 40˚34´0.24´´N, 117˚8´34.29´´E
S2 Grassland Plain 40˚34´53.73´´N, 117˚8´27.48´´E
S3 Forestland Plain 40˚35´14.18´´N, 117˚7´45.53´´E
S4 Arable land (orchard) Terrace land 40˚35´34.86´´N, 117˚7´0.88´´E
S5 Forestland Plain 40˚35´35.09´´N, 117˚6´7.94´´E
S6 Arable land (corn field) Plain 40˚35´32.57´´N, 117˚5´30.60´´E
S7 Arable land (orchard) Terrace land 40˚34´11.87´´N, 117˚4´15.98´´E
S8 Arable land (corn field) Sloping land 40˚34´12.66´´N, 117˚3´10.29´´E
S9 Arable land (orchard) Sloping land 40˚34´22.83´´N, 117˚2´26.81´´E
S10 Arable land (corn field) Plain 40˚33´39.18´´N, 117˚2´18.65´´E
S11 Arable land (corn field) Plain 40˚33´49.39´´N, 117˚1´42.78´´E
S12 Forestland Sloping land 40˚33´21.69´´N, 117˚1´22.73´´E
S13 Arable land (corn field) Plain 40˚32´53.98´´N, 117˚1´18.00´´E
S14 Grassland Plain 40˚32´23.59´´N, 117˚1´3.16´´E
S15 Grassland Plain 40˚31´50.22´´N, 117˚1´1.41´´E
Y. Li et al. / Desalination and Water Treatment 3
Dow
nloa
ded
by [
Prof
esso
r Y
ingx
ia L
i] a
t 06:
41 1
4 M
ay 2
013

elements. The standard error of mean concentration ofeach element is represented by S.E. Mean values. TheS.E. Mean values for most of the metals are muchsmaller than their mean values except Hg, whichshows the representativeness of the mean values formost metal element. It is noticeable that the S.E. Meanvalue of Hg is more than two times of its mean value.This demonstrates the less representativeness of itsmean. More attention should be paid on the statisticalinference of Hg concentration.
The mean concentrations of eight heavy metals inthis study are compared with the soil backgroundconcentrations in Beijing, soil quality standard, andthe concentrations of soil in Shanghai as shown inTable 3. The sampling sites in Shanghai’s study [23]are located in the drinking water conservation area ofShanghai, which is near Songjiang industrial area.Table 3 shows that most mean concentrations in thisstudy are higher than the background values exceptPb. The mean concentrations of Ni, Cr, Cu, and Hg
Table 2Statistical summary of concentrations of 26 metal elements
Min (lg/g) Max (lg/g) Mean (lg/g) CV (%) S.E. mean (±lg/g)
As 3.27 15.00 7.94 44.95 0.92
Ba 300.50 850.30 620.63 23.67 37.88
Cd 0.08 0.31 0.16 36.93 0.02
Ce 42.88 89.68 63.32 16.90 2.76
Co 9.47 32.09 18.60 28.17 1.35
Cr 51.38 283.30 127.71 49.08 16.18
Cu 17.05 68.52 40.42 39.55 4.13
Hg 0.06 0.76 0.22 86.95 0.49
La 20.38 44.75 31.09 18.44 1.48
Mn 548.60 1,326 782.77 24.32 49.14
Mo 0.32 1.00 0.69 27.60 0.05
Nb 8.41 15.03 11.44 17.34 0.51
Ni 16.14 95.10 45.97 42.08 5.00
Pb 9.87 38.17 21.98 29.28 1.66
Sb 0.31 1.02 0.66 33.81 0.06
Sc 9.22 23.10 13.08 23.58 0.80
Ti 3,438 6,390 4668.27 16.34 196.98
Tl 0.22 0.92 0.61 27.81 0.04
Y 18.19 41.57 26 22.10 1.49
Zn 54.71 115.90 81.06 21.36 4.44
Al2O3⁄ 11.14 18.48 13.38 12.60 0.44
Fe2O3⁄ 4.53 9.80 6.73 21.62 0.38
MgO⁄ 1.41 3.72 2.17 31.83 0.18
CaO⁄ 1.15 5.54 2.48 49.35 0.32
Na2O⁄ 1.29 3.60 2.48 22.51 0.14
K2O⁄ 1.10 2.85 2.33 22.29 0.13
⁄The unit for the min, max, mean, and S.E. mean of these metal oxides is %.
Table 3Comparison of the mean concentrations of this study with soil background values, standard values, and other study
As Ni Pb Cd Zn Cr Cu Hg
Mean of this study (lg/g) 7.94 45.97 21.98 0.16 81.06 127.7 38.45 0.22
Background value (lg/g) [22] 7.09 26.8 24.6 0.119 57.5 29.8 18.7 0.08
Standard (GB15618-1995) (lg/g) 15 40 35 0.2 100 90 35 0.15
Over standard rate (%) 0 53.3 6.7 13.3 13.3 73.3 46.7 53.3
ShangHai [23] 6.31 24.04 30.14 0.16 103.79 65.75 30.66 0.33
4 Y. Li et al. / Desalination and Water Treatment
Dow
nloa
ded
by [
Prof
esso
r Y
ingx
ia L
i] a
t 06:
41 1
4 M
ay 2
013

are higher than the soil standard values. For example,the concentration of Cr is higher than the backgroundvalue at all sites with the maximum value of283.3mg/g, which is about 20 times of the back-ground value. The concentration of Cr exceeds thestandard value at 11 sites in this study. Likewise,concentrations of Hg, Cu, and Ni are also higher thanthe background and standard values. These resultsindicate that there is a potential risk of heavy metalpollution in the soil of the study area, especially Crand Hg. Compared with the study in Shanghai, theconcentrations of Ni and Cr in this study are abouttwo times of their concentrations in Shanghai.Concentrations of As and Cu are slightly higher.Meanwhile, concentrations of Pb, Zn, and Hg areslightly lower than those of Shanghai. These might becaused by more traffic pollution in Shanghai.
Metal concentration distribution at various sites isdifferent for different metals. As, Hg, and Pb have asimilar distribution with the maximum concentrationat S15. The distributions of Ni and Cr are similar withhigh values at S4 and S6. These indicate that certainmetal elements might come from similar sources andsome of them might not have the same sources. It isnoticeable that the S.E. Mean value of Hg is very largetherefore more attention should be paid on this metalelement.
Heavy metal concentrations demonstrate obviousdifference for different land uses. The mean concen-trations of As, Ni, Pb, Cd, Cr, Zn, Cu, and Hg atdifferent land uses are presented in Table 4. Arableland use contains three terrains of plain, terrace,and sloping. Forestland use includes natural andprotection forests. Heavy metal concentrations of As,Cd, Cr, Pb, and Zn of forestland are generally lessthan those of other land uses. This might be causedby the intense anthropogenic input at arable landand grassland. Therefore, enlarging forestland use is
an effective method for heavy metal control atdrinking water resource area. On the other hand,the concentrations of Hg, Pb, and As are highest atgrassland especially at S14 and S15. Meanwhile, theconcentrations of Cu and Cr are relatively low atthese sites. The heavy metal concentrations at arableland are moderate compared with other land uses.The difference among different topographies at ara-ble land is not obvious.
To evaluate the potential risk of heavy metals in thestudy area, Nemerow index [24] was calculated for eachof the eight heavy metals by the following equations:
Pij ¼ Cij=Si ð1Þ
Pi ¼ffiffiffiffiffiffiffiffiffiffiffiffiffiffiffiffiffiffiffiffiffiffiffiffiffiffiffiffiffiffiffiffiffiffiffiffiffiffiffiffiðPijÞ2 þ ðmaxðPijÞÞ2
2
sð2Þ
where Pij is the Nemerow index of pollutant i andobservation j. Cij is the concentration of pollutant iand observation j. Si is the standard value of pollutanti. Max(Pij) is the maximum value of Pij for all observa-tions and Pij is the average value of Pij. Based on thevalue of Pi, metal element i is classified to be unpol-luted (Pi< 1), lightly polluted (1 <Pi< 2), moderatepolluted 2<Pi< 3), and strongly polluted (Pi> 3). Inthis research, the Nemerow indexes of As, Ni, Pb, Cd,Zn, Cr, Cu, and Hg in the study area are calculatedand presented in Fig. 2.
As Fig. 2 presents, the Nemerow index values ofAs, Pb, Cd, Zn, and Cu are less than 1, whichsuggests little impact on the environment from theseelements. The Nemerow index values of Hg, Ni, Crare larger than one with Hg’s value even larger thantwo. This indicates that there is a lightly risk of Niand Cr pollution, and a moderate risk of Hg pollutionin the study area.
Table 4Mean concentrations of heavy metals from different land uses
Arable land Grassland Forestland
Plain Terrace Sloping Natural forest Protection forest
As 7.46 5.46 10.79 11.43 5.54 3.86
Cd 0.15 0.20 0.15 0.17 0.16 0.08
Cr 157.92 157.12 122.10 98.26 82.64 107.60
Cu 40.04 51.26 36.75 38.48 23.06 68.52
Hg 0.13 0.15 0.26 0.43 0.17 0.15
Ni 52.73 56.37 43.41 41.86 27.42 45.91
Pb 21.56 17.41 23.87 29.42 20.61 9.87
Zn 78.30 93.29 76.55 90.68 67.09 78.51
Y. Li et al. / Desalination and Water Treatment 5
Dow
nloa
ded
by [
Prof
esso
r Y
ingx
ia L
i] a
t 06:
41 1
4 M
ay 2
013

3.2. PCA/MLR analysis
To investigate the relationships among metals inthe soil, Pearson correlation analysis was conducted.Results show that Co, Cr, Cu, Mn, Ni, Sc, and Znhave very significant correlations with Fe2O3 andMgO with the correlation coefficient of r larger than0.7. Besides, Cd, Mn, and Zn have strong correlationwith each other. Hg does not show any strongcorrelation with other elements.
Then PCA analysis using Varimax rotation wasemployed to find different sources of metals. TheEigen values were used to determine the number ofcomponents, which was curtained when the cumula-tive percentage variance was more than 80%. Traceelements of each component were obtained by thefactor loadings to identify specific source. Using thedata from all the 15 sites, four principal components(PC) were identified, accounting for 87% of the totalvariance in the dataset as shown in Table 5.
The first principle component (PC1) explains 31.2%of the total variance. It is strongly correlated with Pb,As, and Hg. The close association between Hg and Asindicates a possible source of coal combustion andmining. There are some out-of-date mining areas inthe upstream of Chao River, which is one of the mainreasons for heavy metal pollution in the soil of Miyunbasin, especially Pb and Hg pollution. These elementsare flushed into Chao River from the mining area byrunoff process, reaching Miyun reservoir andaccumulate in the sediment. The concentrations of Pband Hg are highest at grasslands, which are oftendrowned in the rainy season. Suspended solids withhigh Pb and Hg concentrations settle down at thedrowned area. In addition, Pb and Ti usually have astrong correlation in natural environment, which isnot found in this study area. All these results indicatethat PC1 represents an anthropogenic factor especiallymining behavior.
PC2 is strongly correlated with Zn, Cd, MgO, andCaO, and accounts for 19.5% of the total variance. Mgand Ca are common mineral elements, such as calciteand dolomite. Besides, in nature, Zn and Cd arealways strongly correlated with each other, which istrue in this study as shown in Table 3. These indicatethat PC2 represents natural sources.
About 19.3% of the total variance is explained byPC3, in which Ba, Cu, Mn, Ti, K2O, and Co have ahigh loading. Al2O3 and Fe2O3 have a moderate load-ing. Previous studies showed that Cu and Mn werefound in vehicular emissions and Co was a necessarymaterial for auto-exhaust catalyst. As a result, PC3might represent vehicular emission.
PC4 explains about 18% of total variance. Co, Cr, Cu,Ni, Fe2O3, and MgO are dominant metals associatedwith PC4. Based on related studies, Cr and Ni arecommonly found in coal combustion from industry [25–27]. Therefore, PC4 represents the source of coalcombustion.
Fig. 2. Nemerow index values of eight heavy metals.
Table 5Results of Varimax-rotated principal component analysisof all samples
PC1 PC2 PC3 PC4
As 0.95 �0.15 0.05 �0.18
Ba 0.19 �0.31 0.87 0.05
Cd 0.22 0.88 0.12 0.17
Ce 0.83 0.37 �0.30 �0.04
Co �0.21 0.44 0.59 0.62
Cr �0.31 0.17 0.02 0.87
Cu �0.26 0.26 0.53 0.71
Hg 0.74 0.02 0.27 �0.01
La 0.83 0.25 �0.37 �0.08
Mn 0.13 0.70 0.55 0.38
Mo 0.57 0.52 �0.29 0.14
Nb 0.90 �0.03 �0.09 �0.30
Ni �0.21 0.24 0.13 0.90
Pb 0.89 0.12 �0.33 �0.03
Sb 0.91 �0.08 0.00 �0.29
Sc �0.05 0.70 0.49 0.44
Ti �0.17 0.20 0.85 0.25
Tl 0.84 �0.03 �0.47 �0.22
Y 0.31 0.80 0.44 0.06
Zn 0.29 0.73 0.26 0.44
Al2O3 �0.10 �0.06 0.66 0.32
Fe2O3 �0.13 0.34 0.50 0.69
MgO �0.22 0.58 0.17 0.75
CaO �0.23 0.79 �0.06 0.25
Na2O �0.07 �0.17 0.23 0.25
K2O 0.60 �0.19 0.75 �0.15
Explained variance % 31.2 19.5 19.3 17.9
Cumulative % 31.2 50.7 69.9 87.8
6 Y. Li et al. / Desalination and Water Treatment
Dow
nloa
ded
by [
Prof
esso
r Y
ingx
ia L
i] a
t 06:
41 1
4 M
ay 2
013

MLR was employed to calculate the specific contri-bution rate of different sources after PCA. Factor
scores were regressed on the metal concentration foreach sample. Stepwise method was used in MLR. Thecontribution of each factor was calculated with regres-sion coefficient. The regression result is shown as thefollowing equation:
Z ¼ 7:1� PC1þ 6:4� PC2þ 6� PC3þ 2:3� PC4
ðR2 ¼ 0:991Þ ð3Þ
where Z is the standardized normal deviates ofmetals.
The contribution proportion of each component ispresented in Fig. 3. The contribution proportions ofPC1, PC2, PC3, and PC4 are about 33, 29, 27, and11%, respectively.
Fig. 3. Contribution proportion of each componentcalculated by PCA/MLR method.
As
Ba
Cd
Ce
Co Cr
Cu
Hg La
Mn
Mo
Nb Ni
Pb Sb Sc Ti
Tl Y Zn
Al 2O
3
Fe2O
3
MgO
CaO
Na 2O
K2O
020406080
100
Prop
ortio
n of
Var
inac
e E
xpla
ined
(%
)
Factor 1
Metal Elements
Factor 2
As
Ba
Cd
Ce
Co Cr
Cu
Hg La
Mn
Mo
Nb Ni
Pb Sb Sc Ti
Tl Y Zn
Al 2O
3
Fe2O
3
MgO
CaO
Na 2O
K2O
020406080
100
Prop
ortio
n of
V
arin
ace
Exp
lain
ed (
%)
Metal Elements
As
Ba
Cd
Ce
Co Cr
Cu
Hg La
Mn
Mo
Nb Ni
Pb Sb Sc Ti
Tl Y Zn
Al 2O
3
Fe2O
3
MgO
CaO
Na 2O
K2O
020406080
100
Prop
ortio
n of
Var
inac
e E
xpla
ined
(%
)
Metal Elements
Factor 3
As
Ba
Cd
Ce
Co Cr
Cu
Hg La
Mn
Mo
Nb Ni
Pb Sb Sc Ti
Tl Y Zn
Al 2O
3
Fe2O
3
MgO
CaO
Na 2O
K2O
020406080
100
Prop
ortio
n of
Var
inac
e E
xpla
ined
(%
)
Metal Elements
Factor 4
Fig. 4. The proportion of variance explained by each factor for 26 metal elements using PMF analysis.
Y. Li et al. / Desalination and Water Treatment 7
Dow
nloa
ded
by [
Prof
esso
r Y
ingx
ia L
i] a
t 06:
41 1
4 M
ay 2
013
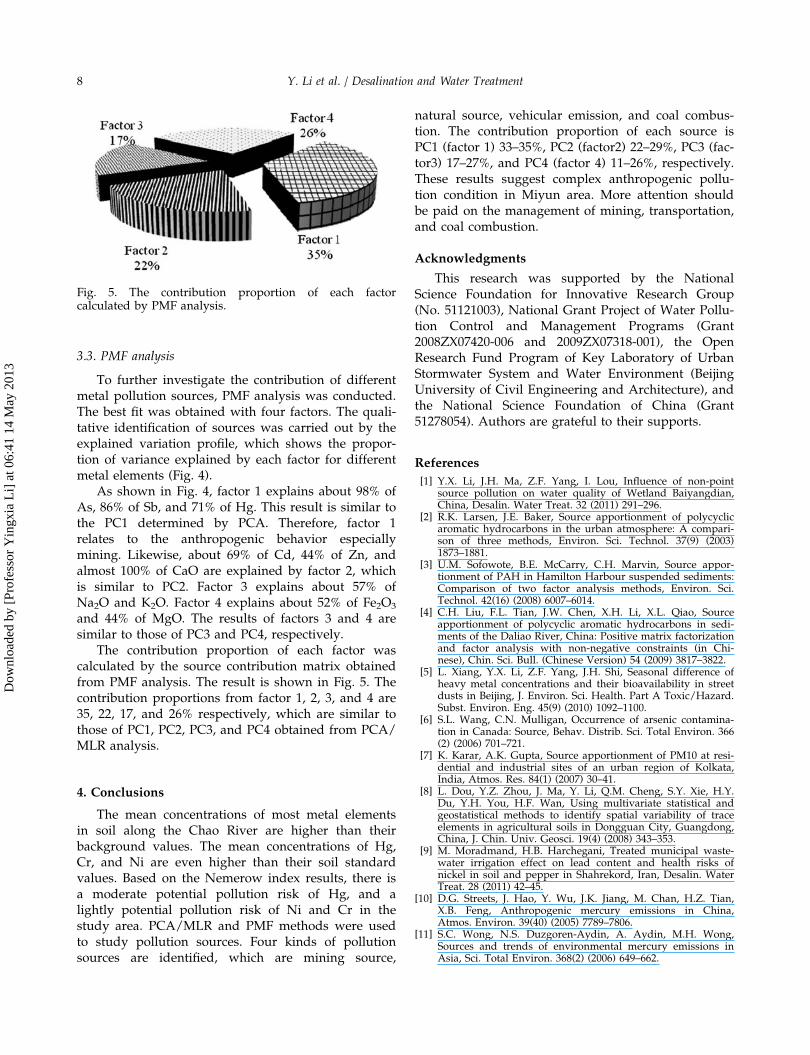
3.3. PMF analysis
To further investigate the contribution of differentmetal pollution sources, PMF analysis was conducted.The best fit was obtained with four factors. The quali-tative identification of sources was carried out by theexplained variation profile, which shows the propor-tion of variance explained by each factor for differentmetal elements (Fig. 4).
As shown in Fig. 4, factor 1 explains about 98% ofAs, 86% of Sb, and 71% of Hg. This result is similar tothe PC1 determined by PCA. Therefore, factor 1relates to the anthropogenic behavior especiallymining. Likewise, about 69% of Cd, 44% of Zn, andalmost 100% of CaO are explained by factor 2, whichis similar to PC2. Factor 3 explains about 57% ofNa2O and K2O. Factor 4 explains about 52% of Fe2O3
and 44% of MgO. The results of factors 3 and 4 aresimilar to those of PC3 and PC4, respectively.
The contribution proportion of each factor wascalculated by the source contribution matrix obtainedfrom PMF analysis. The result is shown in Fig. 5. Thecontribution proportions from factor 1, 2, 3, and 4 are35, 22, 17, and 26% respectively, which are similar tothose of PC1, PC2, PC3, and PC4 obtained from PCA/MLR analysis.
4. Conclusions
The mean concentrations of most metal elementsin soil along the Chao River are higher than theirbackground values. The mean concentrations of Hg,Cr, and Ni are even higher than their soil standardvalues. Based on the Nemerow index results, there isa moderate potential pollution risk of Hg, and alightly potential pollution risk of Ni and Cr in thestudy area. PCA/MLR and PMF methods were usedto study pollution sources. Four kinds of pollutionsources are identified, which are mining source,
natural source, vehicular emission, and coal combus-tion. The contribution proportion of each source isPC1 (factor 1) 33–35%, PC2 (factor2) 22–29%, PC3 (fac-tor3) 17–27%, and PC4 (factor 4) 11–26%, respectively.These results suggest complex anthropogenic pollu-tion condition in Miyun area. More attention shouldbe paid on the management of mining, transportation,and coal combustion.
Acknowledgments
This research was supported by the NationalScience Foundation for Innovative Research Group(No. 51121003), National Grant Project of Water Pollu-tion Control and Management Programs (Grant2008ZX07420-006 and 2009ZX07318-001), the OpenResearch Fund Program of Key Laboratory of UrbanStormwater System and Water Environment (BeijingUniversity of Civil Engineering and Architecture), andthe National Science Foundation of China (Grant51278054). Authors are grateful to their supports.
References
[1] Y.X. Li, J.H. Ma, Z.F. Yang, I. Lou, Influence of non-pointsource pollution on water quality of Wetland Baiyangdian,China, Desalin. Water Treat. 32 (2011) 291–296.
[2] R.K. Larsen, J.E. Baker, Source apportionment of polycyclicaromatic hydrocarbons in the urban atmosphere: A compari-son of three methods, Environ. Sci. Technol. 37(9) (2003)1873–1881.
[3] U.M. Sofowote, B.E. McCarry, C.H. Marvin, Source appor-tionment of PAH in Hamilton Harbour suspended sediments:Comparison of two factor analysis methods, Environ. Sci.Technol. 42(16) (2008) 6007–6014.
[4] C.H. Liu, F.L. Tian, J.W. Chen, X.H. Li, X.L. Qiao, Sourceapportionment of polycyclic aromatic hydrocarbons in sedi-ments of the Daliao River, China: Positive matrix factorizationand factor analysis with non-negative constraints (in Chi-nese), Chin. Sci. Bull. (Chinese Version) 54 (2009) 3817–3822.
[5] L. Xiang, Y.X. Li, Z.F. Yang, J.H. Shi, Seasonal difference ofheavy metal concentrations and their bioavailability in streetdusts in Beijing, J. Environ. Sci. Health. Part A Toxic/Hazard.Subst. Environ. Eng. 45(9) (2010) 1092–1100.
[6] S.L. Wang, C.N. Mulligan, Occurrence of arsenic contamina-tion in Canada: Source, Behav. Distrib. Sci. Total Environ. 366(2) (2006) 701–721.
[7] K. Karar, A.K. Gupta, Source apportionment of PM10 at resi-dential and industrial sites of an urban region of Kolkata,India, Atmos. Res. 84(1) (2007) 30–41.
[8] L. Dou, Y.Z. Zhou, J. Ma, Y. Li, Q.M. Cheng, S.Y. Xie, H.Y.Du, Y.H. You, H.F. Wan, Using multivariate statistical andgeostatistical methods to identify spatial variability of traceelements in agricultural soils in Dongguan City, Guangdong,China, J. Chin. Univ. Geosci. 19(4) (2008) 343–353.
[9] M. Moradmand, H.B. Harchegani, Treated municipal waste-water irrigation effect on lead content and health risks ofnickel in soil and pepper in Shahrekord, Iran, Desalin. WaterTreat. 28 (2011) 42–45.
[10] D.G. Streets, J. Hao, Y. Wu, J.K. Jiang, M. Chan, H.Z. Tian,X.B. Feng, Anthropogenic mercury emissions in China,Atmos. Environ. 39(40) (2005) 7789–7806.
[11] S.C. Wong, N.S. Duzgoren-Aydin, A. Aydin, M.H. Wong,Sources and trends of environmental mercury emissions inAsia, Sci. Total Environ. 368(2) (2006) 649–662.
Fig. 5. The contribution proportion of each factorcalculated by PMF analysis.
8 Y. Li et al. / Desalination and Water Treatment
Dow
nloa
ded
by [
Prof
esso
r Y
ingx
ia L
i] a
t 06:
41 1
4 M
ay 2
013

[12] H.J. Liao, Investigation and assessment of pollution of heavymetals in the soil of the upstream area of Miyun reservoir,Beijing, City Geol. (in Chinese) 2(3) (2007) 31–34.
[13] M. Bacardit, M. Krachler, L. Camarero, Whole-catchmentinventories of trace metals in soils and sediments inmountain lake catchments in the central Pyrenees:Apportioning the anthropogenic and natural contributions,Geochim. Cosmochim. Acta 82 (2012) 52–67.
[14] S. Comero, G. Locoro, G. Free, S. Vaccaro, L.D. Capitani,B.M. Gawlik, Characterization of alpine lake sediments usingmultivariate statistical techniques, Chemom. Intell. Lab. Syst.107(1) (2011) 24–30.
[15] S. Demir, A. Saral, F. Erturk, L. Kuzu, Combined use ofprincipal component analysis (PCA) and chemical massbalance (CMB) for source identification and sourceapportionment in air pollution modeling studies, Water AirSoil Pollut. 212(1) (2010) 429–439.
[16] C. Zhang, L.H. Wu, Y.M. Luo, Identifying sources of soilinorganic pollutants on a regional scale using a multivariatestatistical approach: Role of pollutant migration and soilphysicochemical properties, Environ. Pollut. 151(3) (2008)470–476.
[17] C.S. Lee, X.D. Li, W.Z. Shi, S.C. Cheung, I. Thornoton,Metal contamination in urban, suburban, and countrypark soils of Hong Kong a study based on GIS and mul-tivariate statistics, Sci. Total Environ. 356(1) (2006)470–476.
[18] M.R. Mostert, G.A. Ayoko, S. Kokot, Multi-criteria rankingand source identification of metals in public playgrounds inQueensland, Australia, Geoderma 173 (2012) 173–183.
[19] S.R. Tariq, M.H. Shah, N. Shaheen, A. Khalique, S. Manzoor,M. Jaffar,Multivariateanalysisof selectedmetals in tanneryefflu-entsandrelatedsoil, J.Hazard.Mater.122(1–2) (2005)17–22.
[20] Y.F. Xu, C.Z. Ma, S.L. Huo, B.D. Ci, G.R. Qian, Performanceassessment of water quality monitoring system and identifica-tion of pollution source using pattern recognition techniques:A case study of Chaohu Lake, China, Desalin. Water Treat.47 (2012) 182–197.
[21] E. Lee, C.K. Chan, P. Paatero, Application of positive matrixfactorization in source apportionment of particulate pollu-tants in Hong Kong, Atmos. Environ. 33(19) (1999) 3201–3212.
[22] T.B. Chen, Y.M. Zheng, H. Chen, G.D. Zheng, Backgroundconcentrations of soil heavy metals in Beijing, Environ. Sci.(In Chinese) 25(1) (2004) 117–122.
[23] G.T. Shi, Z.L. Chen, C. Zhang, C.J. Bi, C. Cheng, J.Y. Teng,J. Shen, D.Q. Wang, S.Y. Xu, Heavy metals in environmentalmedia around drinking water conservation area of Shanghai,Environ. Sci. (In Chinese), 29(7) (2008) 1797–1805.
[24] N.L. Nemerow, Stream, Lake, Estuary, and Ocean Pollution,Van Nostrand Reinhold Company, New York, NY, 1985.
[25] S. Vaccaro, E. Sobiecka, S. Contini, G. Locoro, G. Free,B.M. Gawlik, The application of positive matrix factorizationin the analysis, characterisation and detection of contami-nated soils, Chemosphere 69(7) (2007) 1055–1063.
[26] J.Q. Chen, Z.X. Wang, X. Wu, J.J. Zhu, W.B. Zhou, Sourceand hazard identification of heavy metals in soils of Chang-sha based on TIN model and direct exposure method, Trans.Nonferrous Met. Soc. China 21(3) (2011) 642–651.
[27] J.H. Liu, W.H. Wang, A. Peng, The source of mercury in rain-fall in Beijing, Environ. Sci. 2 (2000) 77–80, (In Chinese).
Y. Li et al. / Desalination and Water Treatment 9
Dow
nloa
ded
by [
Prof
esso
r Y
ingx
ia L
i] a
t 06:
41 1
4 M
ay 2
013