MOTION ALONG A STRAIGHT LINE - Spada UNS
34
35 2 LEARNING GOALS By studying this chapter, you will learn: • How to describe straight-line motion in terms of average velocity, instantaneous velocity, average acceleration, and instantaneous acceleration. • How to interpret graphs of position versus time, velocity versus time, and acceleration versus time for straight-line motion. • How to solve problems involving straight-line motion with constant acceleration, including free-fall problems. • How to analyze straight-line motion when the acceleration is not constant. MOTION ALONG A STRAIGHT LINE W hat distance must an airliner travel down a runway before reaching takeoff speed? When you throw a baseball straight up in the air, how high does it go? When a glass slips from your hand, how much time do you have to catch it before it hits the floor? These are the kinds of questions you will learn to answer in this chapter. We are beginning our study of physics with mechanics, the study of the relationships among force, matter, and motion. In this chapter and the next we will study kinematics, the part of mechanics that enables us to describe motion. Later we will study dynamics, which relates motion to its causes. In this chapter we concentrate on the simplest kind of motion: a body moving along a straight line. To describe this motion, we introduce the physical quantities velocity and acceleration. In physics these quantities have definitions that are more precise and slightly different from the ones used in everyday language. Both velocity and acceleration are vectors: As you learned in Chapter 1, this means that they have both magnitude and direction. Our concern in this chapter is with motion along a straight line only, so we won’t need the full mathematics of vectors just yet. But using vectors will be essential in Chapter 3 when we con- sider motion in two or three dimensions. We’ll develop simple equations to describe straight-line motion in the impor- tant special case when the acceleration is constant. An example is the motion of a freely falling body. We’ll also consider situations in which the acceleration varies during the motion; in this case, it’s necessary to use integration to describe the motion. (If you haven’t studied integration yet, Section 2.6 is optional.) ? A bungee jumper speeds up during the first part of his fall, then slows to a halt as the bungee cord stretches and becomes taut. Is it accurate to say that the jumper is accelerating as he slows during the final part of his fall?
-
Upload
khangminh22 -
Category
Documents
-
view
2 -
download
0
Transcript of MOTION ALONG A STRAIGHT LINE - Spada UNS

35
2LEARNING GOALS
By studying this chapter, you will
learn:
• How to describe straight-line motion
in terms of average velocity,
instantaneous velocity, average
acceleration, and instantaneous
acceleration.
• How to interpret graphs of position
versus time, velocity versus time,
and acceleration versus time for
straight-line motion.
• How to solve problems involving
straight-line motion with constant
acceleration, including free-fall
problems.
• How to analyze straight-line motion
when the acceleration is not
constant.
MOTION ALONG A STRAIGHT LINE
What distance must an airliner travel down a runway before reachingtakeoff speed? When you throw a baseball straight up in the air, howhigh does it go? When a glass slips from your hand, how much time
do you have to catch it before it hits the floor? These are the kinds of questionsyou will learn to answer in this chapter. We are beginning our study of physicswith mechanics, the study of the relationships among force, matter, and motion.In this chapter and the next we will study kinematics, the part of mechanics thatenables us to describe motion. Later we will study dynamics, which relatesmotion to its causes.
In this chapter we concentrate on the simplest kind of motion: a body movingalong a straight line. To describe this motion, we introduce the physical quantitiesvelocity and acceleration. In physics these quantities have definitions that aremore precise and slightly different from the ones used in everyday language.Both velocity and acceleration are vectors: As you learned in Chapter 1, thismeans that they have both magnitude and direction. Our concern in this chapter iswith motion along a straight line only, so we won’t need the full mathematics ofvectors just yet. But using vectors will be essential in Chapter 3 when we con-sider motion in two or three dimensions.
We’ll develop simple equations to describe straight-line motion in the impor-tant special case when the acceleration is constant. An example is the motionof a freely falling body. We’ll also consider situations in which the accelerationvaries during the motion; in this case, it’s necessary to use integration todescribe the motion. (If you haven’t studied integration yet, Section 2.6 isoptional.)
? A bungee jumper speeds up during the first part of his fall, then slows to a haltas the bungee cord stretches and becomes taut. Is it accurate to say that thejumper is accelerating as he slows during the final part of his fall?

2.1 Displacement, Time, and Average VelocitySuppose a drag racer drives her AA-fuel dragster along a straight track (Fig. 2.1).To study the dragster’s motion, we need a coordinate system. We choose the x-axis to lie along the dragster’s straight-line path, with the origin O at the startingline. We also choose a point on the dragster, such as its front end, and representthe entire dragster by that point. Hence we treat the dragster as a particle.
A useful way to describe the motion of the particle that represents the dragsteris in terms of the change in the particle’s coordinate x over a time interval. Sup-pose that 1.0 s after the start the front of the dragster is at point 19 m from theorigin, and 4.0 s after the start it is at point 277 m from the origin. Thedisplacement of the particle is a vector that points from to (see Section 1.7).Figure 2.1 shows that this vector points along the x-axis. The x-component of the displacement is the change in the value of x,that took place during the time interval of We define the dragster’s average velocity during this time interval as a vectorquantity whose x-component is the change in x divided by the time interval:
In general, the average velocity depends on the particular time interval cho-sen. For a 3.0-s time interval before the start of the race, the average velocitywould be zero because the dragster would be at rest at the starting line and wouldhave zero displacement.
Let’s generalize the concept of average velocity. At time the dragster is atpoint with coordinate and at time it is at point with coordinate The displacement of the dragster during the time interval from to is the vec-tor from to The x-component of the displacement, denoted is thechange in the coordinate x:
(2.1)
The dragster moves along the x-axis only, so the y- and z-components of the dis-placement are equal to zero.
CAUTION The meaning of Note that is not the product of and x; it is a singlesymbol that means “the change in the quantity x.” We always use the Greek capital letter
(delta) to represent a change in a quantity, equal to the final value of the quantity minusthe initial value—never the reverse. Likewise, the time interval from to is thechange in the quantity t: (final time minus initial time). ❙
The x-component of average velocity, or average x-velocity, is the x-component of displacement, divided by the time interval during which¢t¢x,
¢t = t2 - t1
¢t,t2t1
¢
¢¢x≤x
¢x = x2 - x1
¢x,P2.P1
t2t1
x2.P2,t2x1,P1,t1
1258 m2>13.0 s2 = 86 m>s.
14.0 s - 1.0 s2 = 3.0 s.1277 m - 19 m2 = 258 m,
P2P1
P2,P1,
36 CHAPTER 2 Motion Along a Straight Line
Position at t2 5 4.0 sPosition at t1 5 1.0 s
P1 P2
O
Displacement from t1 to t2
x1 5 19 mDx 5 1x2 2 x12 5 258 m
x2 5 277 mxx-axis
FINISHSTART
When the dragster moves in the +x-direction, the displacementDx is positive and so is the average x-velocity:
x-coordinate ofdragster at 1.0 s
x is positive to the right of theorigin 1O2, negative to the leftof it.
x-coordinate ofdragster at 4.0 s
DxD t
258 m3.0 s
5 86 m/s5vav-x 5
2.1 Positions of a dragster at two times during its run.

2.1 Displacement, Time, and Average Velocity 37
the displacement occurs. We use the symbol for average x-velocity (thesubscript “av” signifies average value and the subscript x indicates that this isthe x-component):
(average x-velocity, straight-line motion) (2.2)
As an example, for the dragster andso Eq. (2.2) gives
The average x-velocity of the dragster is positive. This means that during the timeinterval, the coordinate x increased and the dragster moved in the positive x-direction (to the right in Fig. 2.1).
If a particle moves in the negative x-direction during a time interval, its aver-age velocity for that time interval is negative. For example, suppose an official’struck moves to the left along the track (Fig. 2.2). The truck is at at
and is at at Then and The x-component of average
velocity is Table 2.1 listssome simple rules for deciding whether the x-velocity is positive or negative.
CAUTION Choice of the positive x-direction You might be tempted to conclude thatpositive average x-velocity must mean motion to the right, as in Fig. 2.1, and that negativeaverage x-velocity must mean motion to the left, as in Fig. 2.2. But that’s correct only ifthe positive x-direction is to the right, as we chose it to be in Figs. 2.1 and 2.2. Had wechosen the positive x-direction to be to the left, with the origin at the finish line, the drag-ster would have negative average x-velocity and the official’s truck would have positiveaverage x-velocity. In most problems the direction of the coordinate axis will be yours tochoose. Once you’ve made your choice, you must take it into account when interpretingthe signs of and other quantities that describe motion! ❙
With straight-line motion we sometimes call simply the displacementand simply the average velocity. But be sure to remember that these arereally the x-components of vector quantities that, in this special case, have onlyx-components. In Chapter 3, displacement, velocity, and acceleration vectorswill have two or three nonzero components.
Figure 2.3 is a graph of the dragster’s position as a function of time—that is,an x-t graph. The curve in the figure does not represent the dragster’s path inspace; as Fig. 2.1 shows, the path is a straight line. Rather, the graph is a pictorialway to represent how the dragster’s position changes with time. The points and on the graph correspond to the points and along the dragster’s path.Line is the hypotenuse of a right triangle with vertical side ¢x = x2 - x1p1p2
P2P1p2
p1
vav-x
¢x
vav-x
vav-x = ¢x>¢t = 1-258 m2>19.0 s2 = -29 m>s.¢t = 125.0 s - 16.0 s2 = 9.0 s.-258 m
¢x = 119 m - 277 m2=t2 = 25.0 s.x2 = 19 mt1 = 16.0 sx1 = 277 m
vav-x =277 m - 19 m
4.0 s - 1.0 s=
258 m
3.0 s= 86 m>s
t2 = 4.0 s,t1 = 1.0 s,x2 = 277 m,x1 = 19 m,
vav-x =x2 - x1
t2 - t1=
¢x
¢t
vav-x
Position at t1 5 16.0 sPosition at t2 5 25.0 s
O
Displacement from t1 to t2
x2 5 19 mDx 5 1x2 2 x12 5 2258 m
x1 5 277 mx
FINISHSTART
When the truck moves in the 2x-direction, Dx isnegative and so is the average x-velocity:
This position is now x1.This position is now x2.
P2 P1
DxD t
5 229 m/s5vav-x 52258 m
9.0 s
2.2 Positions of an official’s truck attwo times during its motion. The points and now indicate the positions of thetruck, and so are the reverse of Fig. 2.1.
P2
P1
Table 2.1 Rules for the Sign of x-Velocity
If the x-coordinate is: . . . the x-velocity is:
Positive & increasing Positive: Particle is (getting more positive) moving in -direction
Positive & decreasing Negative: Particle is (getting less positive) moving in -direction
Negative & increasing Positive: Particle is (getting less negative) moving in -direction
Negative & decreasing Negative: Particle is(getting more negative) moving in -direction
Note: These rules apply to both the average x-velocity and the instantaneous x-velocity
(to be discussed in Section 2.2).vx
vav-x
-x
+x
-x
+x

and horizontal side The average x-velocity of thedragster equals the slope of the line —that is, the ratio of the triangle’s verti-cal side to its horizontal side
The average x-velocity depends only on the total displacement that occurs during the time interval not on the details of what happens during the time interval. At time a motorcycle might have raced pastthe dragster at point in Fig. 2.1, then blown its engine and slowed down to pass through point at the same time as the dragster. Both vehicles have thesame displacement during the same time interval and so have the same average x-velocity.
If distance is given in meters and time in seconds, average velocity is meas-ured in meters per second Other common units of velocity are kilometersper hour feet per second miles per hour and knots
Table 2.2 lists some typical velocitymagnitudes.11 knot = 1 nautical mile>h = 6080 ft>h2.
1mi>h2,1ft>s2,1km>h2,1m>s2.
t2P2
P1
t1
¢t = t2 - t1,¢x = x2 - x1
¢t.¢xp1p2
vav-x = ¢x/¢t¢t = t2 - t1.
38 CHAPTER 2 Motion Along a Straight Line
2.3 The position of a dragster as a function of time.
Slope 5 rise over run 5
For a displacement along the x-axis, an object’s average x-velocityvav-x equals the slope of a line connecting the corresponding pointson a graph of position 1x2versus time 1t2.
x (m)
x2
P1
p1
P2 p2
x1
t2
t (s)O
400
300
200
100
1 2 3
Dragster track1not to scale2
4 5
Dx 5 x2 2 x1
Slope 5x-v
elocit
y
Dt 5 t2 2 t1
t1
DxDt
2.4 The winner of a 50-m swimmingrace is the swimmer whose average veloc-ity has the greatest magnitude—that is, theswimmer who traverses a displacement of 50 m in the shortest elapsed time ¢t.
¢x
Test Your Understanding of Section 2.1 Each of the following auto-mobile trips takes one hour. The positive x-direction is to the east. (i) AutomobileA travels 50 km due east. (ii) Automobile B travels 50 km due west. (iii) Automo-bile C travels 60 km due east, then turns around and travels 10 km due west. (iv) Auto-mobile D travels 70 km due east. (v) Automobile E travels 20 km due west, then turnsaround and travels 20 km due east. (a) Rank the five trips in order of average x-velocityfrom most positive to most negative. (b) Which trips, if any, have the same average x-velocity? (c) For which trip, if any, is the average x-velocity equal to zero? ❙
2.2 Instantaneous VelocitySometimes the average velocity is all you need to know about a particle’smotion. For example, a race along a straight line is really a competition to seewhose average velocity, has the greatest magnitude. The prize goes to thecompetitor who can travel the displacement from the start to the finish line inthe shortest time interval, (Fig. 2.4).
But the average velocity of a particle during a time interval can’t tell us howfast, or in what direction, the particle was moving at any given time during theinterval. To do this we need to know the instantaneous velocity, or the velocityat a specific instant of time or specific point along the path.
CAUTION How long is an instant? Note that the word “instant” has a somewhat differ-ent definition in physics than in everyday language. You might use the phrase “It lastedjust an instant” to refer to something that lasted for a very short time interval. But inphysics an instant has no duration at all; it refers to a single value of time. ❙
¢t¢x
vav-x,
Table 2.2 Typical Velocity Magnitudes
A snail’s pace
A brisk walk
Fastest human
Freeway speeds
Fastest car
Random motion of air molecules
Fastest airplane
Orbiting communications satellite
Electron orbiting in a hydrogen atom
Light traveling in a vacuum 3 * 108 m>s
2 * 106 m>s
3000 m>s
1000 m>s
500 m>s
341 m>s
30 m>s
11 m>s
2 m>s
10-3 m>s

2.2 Instantaneous Velocity 39
To find the instantaneous velocity of the dragster in Fig. 2.1 at the point wemove the second point closer and closer to the first point and compute theaverage velocity over the ever-shorter displacement and timeinterval. Both and become very small, but their ratio does not necessarilybecome small. In the language of calculus, the limit of as approacheszero is called the derivative of x with respect to t and is written Theinstantaneous velocity is the limit of the average velocity as the time intervalapproaches zero; it equals the instantaneous rate of change of position with time.We use the symbol with no “av” subscript, for the instantaneous velocityalong the x-axis, or the instantaneous x-velocity:
(instantaneous x-velocity, straight-line motion) (2.3)
The time interval is always positive, so has the same algebraic sign asA positive value of means that x is increasing and the motion is in the pos-
itive x-direction; a negative value of means that x is decreasing and the motionis in the negative x-direction. A body can have positive x and negative or thereverse; x tells us where the body is, while tells us how it’s moving (Fig. 2.5).The rules that we presented in Table 2.1 (Section 2.1) for the sign of average x-velocity also apply to the sign of instantaneous x-velocity .
Instantaneous velocity, like average velocity, is a vector quantity; Eq. (2.3)defines its x-component. In straight-line motion, all other components of instan-taneous velocity are zero. In this case we often call simply the instantaneousvelocity. (In Chapter 3 we’ll deal with the general case in which the instanta-neous velocity can have nonzero x-, y-, and z-components.) When we use theterm “velocity,” we will always mean instantaneous rather than average velocity.
The terms “velocity” and “speed” are used interchangeably in everyday lan-guage, but they have distinct definitions in physics. We use the term speed todenote distance traveled divided by time, on either an average or an instantaneousbasis. Instantaneous speed, for which we use the symbol with no subscripts,measures how fast a particle is moving; instantaneous velocity measures how fastand in what direction it’s moving. Instantaneous speed is the magnitude of instan-taneous velocity and so can never be negative. For example, a particle with instan-taneous velocity and a second particle with aremoving in opposite directions at the same instantaneous speed
CAUTION Average speed and average velocity Average speed is not the magnitude ofaverage velocity. When César Cielo set a world record in 2009 by swimming 100.0 m in
, his average speed was But because he swamtwo lengths in a 50-m pool, he started and ended at the same point and so had zero totaldisplacement and zero average velocity! Both average speed and instantaneous speed arescalars, not vectors, because these quantities contain no information about direction. ❙
1100.0 m2>146.91 s2 = 2.132 m>s.46.91 s
25 m>s.vx = -25 m>svx = 25 m>s
v
vx
vxvav-x
vx
vx,vx
vx¢x.vx¢t
vx = lim¢tS0
¢x
¢t=
dx
dt
vx,
dx>dt.¢t¢x>¢t
¢t¢xvav-x = ¢x>¢t
P1P2
P1,
2.5 Even when he’s moving forward, thiscyclist’s instantaneous x-velocity can benegative—if he’s traveling in the negativex-direction. In any problem, the choice ofwhich direction is positive and which isnegative is entirely up to you.
Example 2.1 Average and instantaneous velocities
A cheetah is crouched 20 m to the east of an observer (Fig. 2.6a). Attime the cheetah begins to run due east toward an antelope thatis 50 m to the east of the observer. During the first 2.0 s of the attack,the cheetah’s coordinate x varies with time according to the equation
(a) Find the cheetah’s displacementbetween and (b) Find its average velocityduring that interval. (c) Find its instantaneous velocity at by taking then then (d) Derive an0.001 s.0.01 s,¢t = 0.1 s,
t1 = 1.0 st2 = 2.0 s.t1 = 1.0 s
15.0 m>s22t 2.x = 20 m +
t = 0expression for the cheetah’s instantaneous velocity as a function oftime, and use it to find at and
SOLUTION
IDENTIFY and SET UP: Figure 2.6b shows our sketch of the cheetah’s motion. We use Eq. (2.1) for displacement, Eq. (2.2) foraverage velocity, and Eq. (2.3) for instantaneous velocity.
t = 2.0 s.t = 1.0 svx
Continued

40 CHAPTER 2 Motion Along a Straight Line
EXECUTE: (a) At the cheetah’s positionsare
The displacement during this 1.0-s interval is
(b) The average x-velocity during this interval is
(c) With the time interval is from to anew . At the position is
The average x-velocity during this 0.1-s interval is
vav-x =26.05 m - 25 m
1.1 s - 1.0 s= 10.5 m>s
x2 = 20 m + 15.0 m>s2211.1 s)2 = 26.05 m
t2t2 = 1.1 st1 = 1.0 s¢t = 0.1 s
vav-x =x2 - x1
t2 - t1=
40 m - 25 m
2.0 s - 1.0 s=
15 m
1.0 s= 15 m>s
¢x = x2 - x1 = 40 m - 25 m = 15 m
x2 = 20 m + 15.0 m>s2212.0 s22 = 40 m
x1 = 20 m + 15.0 m>s2211.0 s22 = 25 m
x1 and x2
t1 = 1.0 s and t2 = 2.0 s Following this pattern, you can calculate the average x-velocitiesfor 0.01-s and 0.001-s intervals: The results are and
As gets smaller, the average x-velocity gets closerto so we conclude that the instantaneous x-velocity at
is (We suspended the rules for significant-figure counting in these calculations.)
(d) To find the instantaneous x-velocity as a function of time,we take the derivative of the expression for x with respect to t. Thederivative of a constant is zero, and for any n the derivative of is
so the derivative of is 2t. We therefore have
At this yields , as we found in part (c); at
EVALUATE: Our results show that the cheetah picked up speed from(when it was at rest) to to
This makes sense; the cheetah coveredonly 5 m during the interval to but it covered 15 mduring the interval to t = 2.0 s.t = 1.0 s
t = 1.0 s,t = 01vx = 20 m>s2.t = 2.0 s
1vx = 10 m>s2t = 1.0 st = 0
vx = 20 m>s.t = 2.0 s,vx = 10 m>st = 1.0 s,
vx =dx
dt= 15.0 m>s2212t2 = 110 m>s22t
t 2nt n-1,t n
10.0 m>s.t = 1.0 s10.0 m>s,
¢t10.005 m>s.10.05 m>s
(a) The situation
(b) Our sketch
(c) Decisions Point axis indirection cheetah runs,so that all values willbe positive.
1 Place originat vehicle.2 Mark initial
positions of cheetahand antelope.
3 Mark positionsfor cheetah at 1 sand 2 s.
4 Add the knownand unknownquantities.
5
2.6 A cheetah attacking an antelope from ambush. The animals are not drawn to the same scale as the axis.
Finding Velocity on an x-t GraphWe can also find the x-velocity of a particle from the graph of its position as a function of time. Suppose we want to find the x-velocity of the dragster in Fig. 2.1 at point As point in Fig. 2.1 approaches point point in the x-t graphs of Figs. 2.7a and 2.7b approaches point and the average x-velocityis calculated over shorter time intervals In the limit that shown inFig. 2.7c, the slope of the line equals the slope of the line tangent to thecurve at point Thus, on a graph of position as a function of time for straight-line motion, the instantaneous x-velocity at any point is equal to the slope of thetangent to the curve at that point.
If the tangent to the x-t curve slopes upward to the right, as in Fig. 2.7c, thenits slope is positive, the x-velocity is positive, and the motion is in the positive x-direction. If the tangent slopes downward to the right, the slope of the x-t graph
p1.p1p2
¢tS 0,¢t.p1
p2P1,P2P1.ActivPhysics 1.1: Analyzing Motion UsingDiagrams

2.2 Instantaneous Velocity 41
and the x-velocity are negative, and the motion is in the negative x-direction.When the tangent is horizontal, the slope and the x-velocity are zero. Figure 2.8illustrates these three possibilities.
Figure 2.8 actually depicts the motion of a particle in two ways: as (a) an x-tgraph and (b) a motion diagram that shows the particle’s position at variousinstants (like frames from a video of the particle’s motion) as well as arrows torepresent the particle’s velocity at each instant. We will use both x-t graphs andmotion diagrams in this chapter to help you understand motion. You will find itworth your while to draw both an x-t graph and a motion diagram as part of solv-ing any problem involving motion.
As the average x-velocity vav-x is calculatedover shorter and shorter time intervals ...
... its value vav-x 5 Dx/Dt approaches theinstantaneous x-velocity.
The instantaneous x-velocity vx at anygiven point equals the slope of the tangentto the x-t curve at that point.
5 40 m/svx 5
160 m4.0 s
Dt 5 1.0 sDx 5 55 m
vav-x 5 55 m/s
Slope of tangent 5
instantaneous x-velocity
p1 4.0 s
160 m
t (s)1 2 3 4 5O
x (m)
400
300
200
100
(a) (b) (c)
t (s)1 2 3 4 5
p2
p1 DxDt
x (m)
OO
400
300
200
100
t (s)1 2 3 4 5
p2
Dt 5 2.0 sDx 5 150 m
vav-x 5 75 m/s
p1
DxDt
x (m)
400
300
200
100
2.7 Using an x-t graph to go from (a), (b) average x-velocity to (c) instantaneous x-velocity In (c) we find the slope of the tangentto the x-t curve by dividing any vertical interval (with distance units) along the tangent by the corresponding horizontal interval (withtime units).
vx.
The particle is at x , 0 and movingin the 1x-direction.
From tA to tB it speeds up, ...
... and from tB to tC it slows down,then halts momentarily at tC.
From tC to tD it speeds up in the 2x-direction, ...
... and from tD to tE it slows down in the 2x-direction.
The steeper the slope (positive or negative) of an object’s x-t graph, thegreater is the object’s speed in the positive or negative x-direction.
Slope positive:vx . 0
Slope zero: vx 5 0
Slope negative:vx , 0
(a) x-t graph (b) Particle’s motion
tA 5 0
tB
tC
tD
tE
v
0x
v0
x
0x
v
v
v 5 0
0x
0x
0
A
B
xC
D
Et
2.8 (a) The x-t graph of the motion of a particular particle. The slope of the tangent at any point equals the velocity at that point.(b) A motion diagram showing the position and velocity of the particle at each of the times labeled on the x-t graph.
Test Your Understanding of Section 2.2 Figure 2.9 is an x-t graph ofthe motion of a particle. (a) Rank the values of the particle’s x-velocity at thepoints P, Q, R, and S from most positive to most negative. (b) At which points is
positive? (c) At which points is negative? (d) At which points is zero? (e) Rankthe values of the particle’s speed at the points P, Q, R, and S from fastest to slowest. ❙
vxvxvx
vx
Rt
S
Q
P
x
2.9 An x-t graph for a particle.
2.3 Average and Instantaneous AccelerationJust as velocity describes the rate of change of position with time, accelerationdescribes the rate of change of velocity with time. Like velocity, acceleration is avector quantity. When the motion is along a straight line, its only nonzero compo-nent is along that line. As we’ll see, acceleration in straight-line motion can referto either speeding up or slowing down.
Average AccelerationLet’s consider again a particle moving along the x-axis. Suppose that at time the particle is at point and has x-component of (instantaneous) velocity and at a later time it is at point and has x-component of velocity So thex-component of velocity changes by an amount during the timeinterval
We define the average acceleration of the particle as it moves from to tobe a vector quantity whose x-component (called the average x-acceleration)equals the change in the x-component of velocity, divided by the time inter-val
(average x-acceleration,straight-line motion)
aav-x =v2x - v1x
t2 - t1=
¢vx
¢t
¢t:¢vx,
aav-x
P2P1
¢t = t2 - t1.¢vx = v2x - v1x
v2x.P2t2
v1x,P1
t1
42 CHAPTER 2 Motion Along a Straight Line
(2.4)
For straight-line motion along the x-axis we will often call simply the aver-age acceleration. (We’ll encounter the other components of the average accelera-tion vector in Chapter 3.)
If we express velocity in meters per second and time in seconds, then averageacceleration is in meters per second per second, or This is usually writ-ten as and is read “meters per second squared.”
CAUTION Acceleration vs. velocity Be very careful not to confuse acceleration withvelocity! Velocity describes how a body’s position changes with time; it tells us howfast and in what direction the body moves. Acceleration describes how the velocitychanges with time; it tells us how the speed and direction of motion are changing. Itmay help to remember the phrase “acceleration is to velocity as velocity is to position.”It can also help to imagine yourself riding along with the moving body. If the bodyaccelerates forward and gains speed, you feel pushed backward in your seat; if it accel-erates backward and loses speed, you feel pushed forward. If the velocity is constantand there’s no acceleration, you feel neither sensation. (We’ll see the reason for thesesensations in Chapter 4.) ❙
m>s21m>s2>s.
aav-x
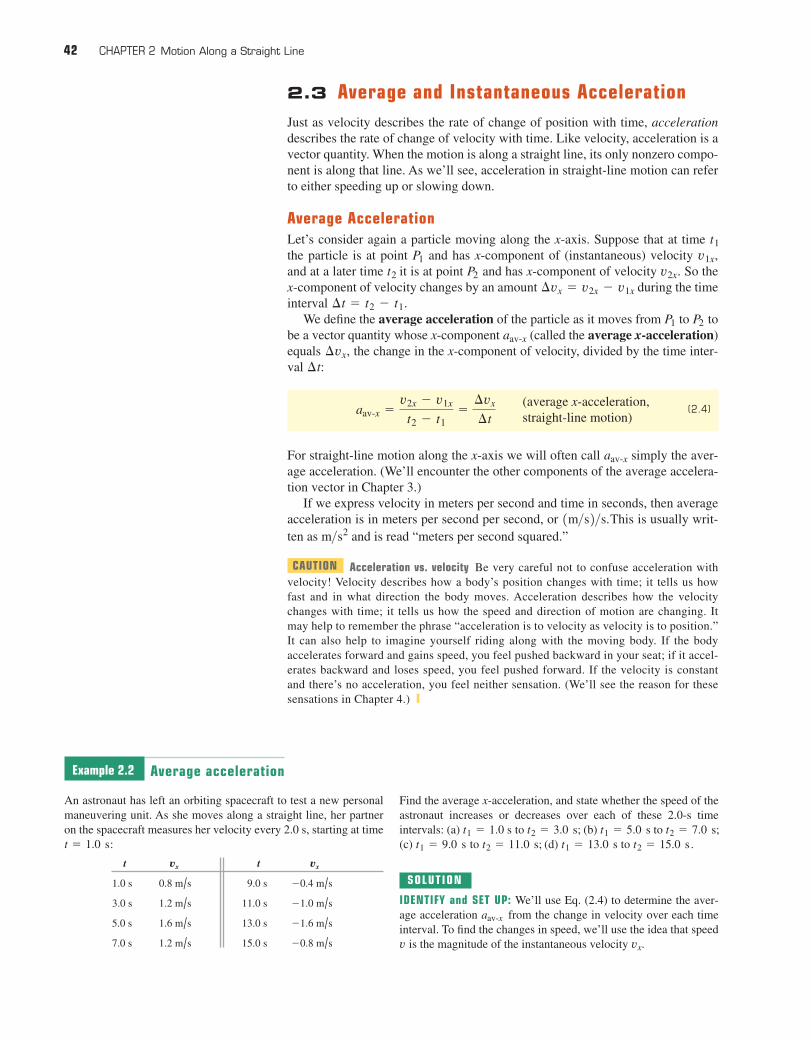
Example 2.2 Average acceleration
An astronaut has left an orbiting spacecraft to test a new personalmaneuvering unit. As she moves along a straight line, her partneron the spacecraft measures her velocity every 2.0 s, starting at timet = 1.0 s:
Find the average x-acceleration, and state whether the speed of theastronaut increases or decreases over each of these 2.0-s timeintervals: (a) to (b) to (c) to (d) to
SOLUTION
IDENTIFY and SET UP: We’ll use Eq. (2.4) to determine the aver-age acceleration from the change in velocity over each timeinterval. To find the changes in speed, we’ll use the idea that speed
is the magnitude of the instantaneous velocity vx.v
aav-x
t2 = 15.0 s .t1 = 13.0 st2 = 11.0 s;t1 = 9.0 st2 = 7.0 s;t1 = 5.0 st2 = 3.0 s;t1 = 1.0 s
t t
20.8 m/s15.0 s1.2 m/s7.0 s
21.6 m/s13.0 s1.6 m/s5.0 s
21.0 m/s11.0 s1.2 m/s3.0 s
20.4 m/s9.0 s0.8 m/s1.0 s
vxvx

2.3 Average and Instantaneous Acceleration 43
Instantaneous AccelerationWe can now define instantaneous acceleration following the same procedurethat we used to define instantaneous velocity. As an example, suppose a racecar driver is driving along a straightaway as shown in Fig. 2.11. To define theinstantaneous acceleration at point we take the second point in Fig. 2.11to be closer and closer to so that the average acceleration is computed overshorter and shorter time intervals. The instantaneous acceleration is the limit ofthe average acceleration as the time interval approaches zero. In the languageof calculus, instantaneous acceleration equals the derivative of velocity withtime. Thus
(instantaneous x-acceleration,straight-line motion) (2.5)
Note that in Eq. (2.5) is really the x-component of the acceleration vec-tor, or the instantaneous x-acceleration; in straight-line motion, all othercomponents of this vector are zero. From now on, when we use the term“acceleration,” we will always mean instantaneous acceleration, not averageacceleration.
ax
ax = lim¢tS0
¢vx
¢t=
dvx
dt
P1
P2P1,
The upper part of Fig. 2.10 is our graph of the x-velocity as afunction of time. On this graph, the slope of the line connect-ing the endpoints of each interval is the average x-acceleration
for that interval. The four slopes (and thus thesigns of the average accelerations) are, respectively, positive, neg-ative, negative, and positive. The third and fourth slopes (and thusthe average accelerations themselves) have greater magnitude thanthe first and second.
aav-x = ¢vx>¢t
vx-tEXECUTE: Using Eq. (2.4), we find:
(a)The speed (magnitude of instantaneous x-velocity)
increases from to (b)
The speed decreases from to (c)
The speed increases from to (d)
The speed decreases from to
In the lower part of Fig. 2.10, we graph the values of
EVALUATE: The signs and relative magnitudes of the average accel-erations agree with our qualitative predictions. For future refer-ence, note this connection among speed, velocity, and acceleration:Our results show that when the average x-acceleration has thesame direction (same algebraic sign) as the initial velocity, as inintervals (a) and (c), the astronaut goes faster. When has theopposite direction (opposite algebraic sign) from the initial velocity,as in intervals (b) and (d), she slows down. Thus positive x-accelera-tion means speeding up if the x-velocity is positive [interval (a)]but slowing down if the x-velocity is negative [interval (d)]. Simi-larly, negative x-acceleration means speeding up if the x-velocity isnegative [interval (c)] but slowing down if the x-velocity is posi-tive [interval (b)].
aav-x
aav-x.
0.8 m>s.1.6 m>s0.4 m>s2.aav-x = 3-0.8 m>s - 1-1.6 m>s24>115.0 s - 13.0 s2 =
1.0 m>s.0.4 m>s-0.3 m>s2.aav-x = 3-1.0 m>s - 1-0.4 m>s24>111.0 s - 9.0 s2 =
1.2 m>s.1.6 m>s-0.2 m>s2.aav-x = 11.2 m>s - 1.6 m>s2>17.0 s - 5.0 s2 =
1.2 m>s.0.8 m>s0.2 m>s2.
aav-x = 11.2 m>s - 0.8 m>s2>13.0 s - 1.0 s2 =
The slope of the line connecting eachpair of points on the vx-t graph ...
... equals the average x-accelerationbetween those points.
2.10 Our graphs of x-velocity versus time (top) and average x-acceleration versus time (bottom) for the astronaut.
Speed v2x-velocity v2x
Speed v1x-velocity v1x
P2P1Ox
2.11 A Grand Prix car at two points on the straightaway.

44 CHAPTER 2 Motion Along a Straight Line
Example 2.3 Average and instantaneous accelerations
Suppose the x-velocity of the car in Fig. 2.11 at any time t isgiven by the equation
(a) Find the change in x-velocity of the car in the time intervalto (b) Find the average x-acceleration in
this time interval. (c) Find the instantaneous x-acceleration at timeby taking to be first 0.1 s, then 0.01 s, then 0.001 s.
(d) Derive an expression for the instantaneous x-acceleration as afunction of time, and use it to find at and
SOLUTION
IDENTIFY and SET UP: This example is analogous to Example 2.1in Section 2.2. (Now is a good time to review that example.) InExample 2.1 we found the average x-velocity from the change inposition over shorter and shorter time intervals, and we obtainedan expression for the instantaneous x-velocity by differentiatingthe position as a function of time. In this example we have an exactparallel. Using Eq. (2.4), we’ll find the average x-accelerationfrom the change in x-velocity over a time interval. Likewise, usingEq. (2.5), we’ll obtain an expression for the instantaneous x-acceleration by differentiating the x-velocity as a function oftime.
EXECUTE: (a) Before we can apply Eq. (2.4), we must find the x-velocity at each time from the given equation. At and
, the velocities are
The change in x-velocity between and is
(b) The average x-acceleration during this time interval of dura-tion is
aav-x =v2x - v1x
t2 - t1=
4.0 m>s
2.0 s= 2.0 m>s2
t2 - t1 = 2.0 s
¢vx = v2x - v1x = 64.5 m>s - 60.5 m>s = 4.0 m>s
t2 = 3.0 st1 = 1.0 s¢vx
v2x = 60 m>s + 10.50 m>s3213.0 s22 = 64.5 m>s
v1x = 60 m>s + 10.50 m>s3211.0 s22 = 60.5 m>s
t2 = 3.0 st1 = 1.0 s
t = 3.0 s.t = 1.0 sax
¢tt1 = 1.0 s
t2 = 3.0 s.t1 = 1.0 s
vx = 60 m>s + 10.50 m>s32t 2
vx During this time interval the x-velocity and average x-accelerationhave the same algebraic sign (in this case, positive), and the carspeeds up.
(c) When we have . Proceeding asbefore, we find
You should follow this pattern to calculate for and the results are and
respectively. As gets smaller, the averagex-acceleration gets closer to 1.0 so the instantaneous x-acceleration at is
(d) By Eq. (2.5) the instantaneous x-acceleration isThe derivative of a constant is zero and the deriva-
tive of is 2t, so
When ,
When
EVALUATE: Neither of the values we found in part (d) is equal tothe average x-acceleration found in part (b). That’s because thecar’s instantaneous x-acceleration varies with time. The rate ofchange of acceleration with time is sometimes called the “jerk.”
ax = 11.0 m>s3213.0 s2 = 3.0 m>s2
t = 3.0 s,
ax = 11.0 m>s3211.0 s2 = 1.0 m>s2
t = 1.0 s
= 10.50 m>s3212t2 = 11.0 m>s32t
ax =dvx
dt=
d
dt360 m>s + 10.50 m>s32t 24
t 2ax = dvx>dt.
1.0 m>s2.t = 1.0 sm>s2,¢taav-x = 1.0005 m>s2,
aav-x = 1.005 m>s2¢t = 0.001 s;¢t = 0.01 saav-x
aav-x =¢vx
¢t=
0.105 m>s
0.1 s= 1.05 m>s2
¢vx = 0.105 m>s
v2x = 60 m>s + 10.50 m>s3211.1 s22 = 60.605 m>s
t2 = 1.1 s¢t = 0.1 s,
Finding Acceleration on a vx-t Graph or an x-t GraphIn Section 2.2 we interpreted average and instantaneous x-velocity in terms of theslope of a graph of position versus time. In the same way, we can interpret aver-age and instantaneous x-acceleration by using a graph with instantaneous veloc-ity on the vertical axis and time t on the horizontal axis—that is, a graph(Fig. 2.12). The points on the graph labeled and correspond to points and
in Fig. 2.11. The average x-acceleration during this interval isthe slope of the line As point in Fig. 2.11 approaches point point in the graph of Fig. 2.12 approaches point and the slope of the line approaches the slope of the line tangent to the curve at point Thus, on a graphof x-velocity as a function of time, the instantaneous x-acceleration at any pointis equal to the slope of the tangent to the curve at that point. Tangents drawn atdifferent points along the curve in Fig. 2.12 have different slopes, so the instanta-neous x-acceleration varies with time.
p1.p1p2p1,vx-t
p2P1,P2p1p2.aav-x = ¢vx>¢tP2
P1p2p1
vx-tvx

2.3 Average and Instantaneous Acceleration 45
CAUTION The signs of x-acceleration and x-velocity By itself, the algebraic sign ofthe x-acceleration does not tell you whether a body is speeding up or slowing down.You must compare the signs of the x-velocity and the x-acceleration. When and havethe same sign, the body is speeding up. If both are positive, the body is moving in the pos-itive direction with increasing speed. If both are negative, the body is moving in the nega-tive direction with an x-velocity that is becoming more and more negative, and again thespeed is increasing. When and have opposite signs, the body is slowing down. If is positive and is negative, the body is moving in the positive direction with decreasingspeed; if is negative and is positive, the body is moving in the negative directionwith an x-velocity that is becoming less negative, and again the body is slowing down.Table 2.3 summarizes these ideas, and Fig. 2.13 illustrates some of these possibilities. ❙
The term “deceleration” is sometimes used for a decrease in speed. Because itmay mean positive or negative depending on the sign of we avoid this term.
We can also learn about the acceleration of a body from a graph of its positionversus time. Because and we can write
(2.6)ax =dvx
dt=
d
dta
dx
dtb =
d2x
dt 2
vx = dx>dt,ax = dvx>dt
vx,ax,
axvx
ax
vxaxvx
axvx
vx
v2x
v1x
t2t1t
O
p1
p2
Dt 5 t2 2 t1
Dvx 5 v2x 2 v1x
Slope of tangent to vx-t curve at a given point5 instantaneous x-acceleration at that point.
For a displacement along the x-axis, an object’s average x-accelerationequals the slope of a line connecting the corresponding points on agraph of x-velocity (vx) versus time (t).
Slope 5 av
erage a
ccele
ration
2.12 A graph of the motion in Fig. 2.11.
vx-t
?
Slope zero: ax 5 0
The steeper the slope (positive or negative) of anobject’s vx-t graph, the greater is the object’sacceleration in the positive or negative x-direction.
Object is at x , 0, moving in the 2x-direction (vx , 0),and slowing down (vx and ax have opposite signs).
Object is at x . 0, moving in the 2x-direction (vx , 0),and speeding up (vx and ax have the same sign).
Object is at x . 0, moving in the 1x-direction (vx . 0);its speed is instantaneously not changing (ax 5 0).
Object is at x , 0, instantaneously at rest (vx 5 0), andabout to move in the 1x-direction (ax . 0).
Object is at x . 0, instantaneously at rest (vx 5 0), andabout to move in the 2x-direction (ax , 0).
Slope positive:ax . 0
Slope negative:ax , 0
(a) vx-t graph for an object moving on the x-axis
(b) Object’s position, velocity, and acceleration on the x-axis
0
A
B
C
D
E
t
vx
tE
tA 5 0
tB
tC
tD
0x
0x
0x
0x
a
a
va 5 0
v
v 5 0
0x
a
v 5 0
va
2.13 (a) A graph of the motion of a different particle from that shown in Fig. 2.8. The slope of the tangent at any pointequals the x-acceleration at that point. (b) A motion diagram showing the position, velocity, and acceleration of the particle ateach of the times labeled on the graph. The positions are consistent with the graph; for instance, from to the velocity isnegative, so at the particle is at a more negative value of x than at tA.tB
tBtAvx-tvx-t
vx-t
Table 2.3 Rules for the Sign of x-Acceleration
If x-velocity is: . . . x-acceleration is:
Positive & increasing Positive: Particle is (getting more positive) moving in -direction
& speeding up
Positive & decreasing Negative: Particle is (getting less positive) moving in -direction
& slowing down
Negative & increasing Positive: Particle is (getting less negative) moving in -direction
& slowing down
Negative & decreasing Negative: Particle is (getting more negative) moving in -direction
& speeding up
Note: These rules apply to both the average x-acceleration and the instantaneous x-acceleration .ax
aav-x
-x
-x
+x
+x
That is, is the second derivative of x with respect to t. The second derivative ofany function is directly related to the concavity or curvature of the graph of thatfunction (Fig. 2.14). Where the x-t graph is concave up (curved upward), the x-acceleration is positive and is increasing; at a point where the x-t graph isconcave down (curved downward), the x-acceleration is negative and isdecreasing. At a point where the x-t graph has no curvature, such as an inflectionpoint, the x-acceleration is zero and the velocity is not changing. Figure 2.14shows all three of these possibilities.
Examining the curvature of an x-t graph is an easy way to decide what thesign of acceleration is. This technique is less helpful for determining numeri-cal values of acceleration because the curvature of a graph is hard to measureaccurately.
vx
vx
ax
46 CHAPTER 2 Motion Along a Straight Line
The greater the curvature (upward or downward) ofan object’s x-t graph, the greater is the object’sacceleration in the positive or negative x-direction.
Object is at x , 0, moving in the 1x-direction(vx . 0), and speeding up (vx and ax have thesame sign).
Object is at x . 0, moving in the 2x-direction(vx , 0), and slowing down (vx and ax have opposite signs).
Object is at x . 0, instantaneously at rest (vx 5 0), and about to move in the 2x-direction (ax , 0).
Object is at x 5 0, moving in the 1x-direction(vx . 0); speed is instantaneously not changing (ax 5 0).
Object is at x . 0, moving in the 2x-direction(vx , 0); speed is instantaneously not changing (ax 5 0).
Slope positive: vx . 0Curvature upward: ax . 0
Slope positive: vx . 0Curvature zero: ax 5 0
Slope negative: vx , 0Curvature zero: ax 5 0
Slope negative:vx , 0Curvature upward:ax . 0
Slope zero: vx 5 0Curvature downward: ax , 0
0
A
B
C
D
Et
x
(a) x-t graph
tC
tD
tB
tE
tA 5 0
(b) Object’s motion
0x
0x
0x
0x
v
v
v 5 0
v
v
0x
a
a 5 0
a
a 5 0
a
2.14 (a) The same x-t graph as shown in Fig. 2.8a. The x-velocity is equal to the slope of the graph, and the acceleration is givenby the concavity or curvature of the graph. (b) A motion diagram showing the position, velocity, and acceleration of the particle ateach of the times labeled on the x-t graph.
2.4 Motion with Constant AccelerationThe simplest kind of accelerated motion is straight-line motion with constantacceleration. In this case the velocity changes at the same rate throughout themotion. As an example, a falling body has a constant acceleration if the effects ofthe air are not important. The same is true for a body sliding on an incline oralong a rough horizontal surface, or for an airplane being catapulted from thedeck of an aircraft carrier.
Figure 2.15 is a motion diagram showing the position, velocity, and accelera-tion for a particle moving with constant acceleration. Figures 2.16 and 2.17 depictthis same motion in the form of graphs. Since the x-acceleration is constant, the
graph (graph of x-acceleration versus time) in Fig. 2.16 is a horizontal line.The graph of x-velocity versus time, or graph, has a constant slope becausethe acceleration is constant, so this graph is a straight line (Fig. 2.17).
vx-tax-t
Test Your Understanding of Section 2.3 Look again at the x-t graph inFig. 2.9 at the end of Section 2.2. (a) At which of the points P, Q, R, and S is the x-acceleration positive? (b) At which points is the x-acceleration negative? (c)At which points does the x-acceleration appear to be zero? (d) At each point state whether the velocity is increasing, decreasing, or not changing. ❙
ax
If a particle moves in astraight line with constantx-acceleration ax ...
... the x-velocity changesby equal amounts in equaltime intervals.
However, the position changes by differentamounts in equal time intervals because thevelocity is changing.
t � 2Dt0
t � 3Dt0
0t � Dt
t � 4Dt0
vt � 0
0
a
v
v
v
va
a
a
a
x
x
x
x
x
2.15 A motion diagram for a particlemoving in a straight line in the positivex-direction with constant positive x-acceleration The position, velocity,and acceleration are shown at five equallyspaced times.
ax.

2.4 Motion with Constant Acceleration 47
When the x-acceleration is constant, the average x-acceleration for anytime interval is the same as This makes it easy to derive equations for theposition x and the x-velocity as functions of time. To find an expression for we first replace in Eq. (2.4) by
(2.7)
Now we let and let be any later time t. We use the symbol for the x-velocity at the initial time the x-velocity at the later time t is ThenEq. (2.7) becomes
(constant x-acceleration only) (2.8)
In Eq. (2.8) the term is the product of the constant rate of change of x-velocity, and the time interval t. Therefore it equals the total change in x-velocity from the initial time to the later time t. The x-velocity at anytime t then equals the initial x-velocity (at plus the change in x-velocity
(Fig. 2.17).Equation (2.8) also says that the change in x-velocity of the particle
between and any later time t equals the area under the graph betweenthose two times. You can verify this from Fig. 2.16: Under this graph is a rectangleof vertical side , horizontal side t, and area . From Eq. (2.8) this is indeed equalto the change in velocity In Section 2.6 we’ll show that even if the x-acceleration is not constant, the change in x-velocity during a time interval is stillequal to the area under the curve, although in that case Eq. (2.8) does not apply.
Next we’ll derive an equation for the position x as a function of time when thex-acceleration is constant. To do this, we use two different expressions for theaverage x-velocity during the interval from to any later time t. The firstexpression comes from the definition of Eq. (2.2), which is true whether ornot the acceleration is constant. We call the position at time the initial posi-tion, denoted by The position at the later time t is simply x. Thus for the timeinterval the displacement is and Eq. (2.2) gives
(2.9)
We can also get a second expression for that is valid only when the x-acceleration is constant, so that the x-velocity changes at a constant rate. In thiscase the average x-velocity for the time interval from 0 to t is simply the averageof the x-velocities at the beginning and end of the interval:
(constant x-acceleration only) (2.10)
(This equation is not true if the x-acceleration varies during the time interval.) Wealso know that with constant x-acceleration, the x-velocity at any time t is givenby Eq. (2.8). Substituting that expression for into Eq. (2.10), we find
(constant x-acceleration only) (2.11)= v0x + 12 axt
vav-x = 12 1v0x + v0x + axt2
vx
vx
vav-x =v0x + vx
2
vav-x
vav-x =x - x0
t
¢x = x - x0,¢t = t - 0x0.
t = 0vav-x,
t = 0vav-x
ax-t
vx - v0x.axtax
ax-tt = 0vx - v0x
axtt = 0)v0x
vxt = 0ax,
axt
vx = v0x + axt
ax =vx - v0x
t - 0 or
vx.t = 0;v0xt2t1 = 0
ax =v2x - v1x
t2 - t1
ax:aav-x
vx,vx
ax.aav-xax
Constant x-acceleration: ax-t graphis a horizontal line (slope 5 0).
Area under ax-t graph 5 vx 2 v0x5 change in x-velocity from time 0 to time t.
O
ax
ax
tt
2.16 An acceleration-time graphfor straight-line motion with constant positive x-acceleration ax.
(ax-t)
Constantx-acceleration:vx-t graph is astraight line.
During timeinterval t, thex-velocity changesby vx 2 v0x 5 axt.
Slope 5 x-acceleration
Total area under vx-t graph 5 x 2 x05 change in x-coordinate from time 0 to time t.
vx
vx
v0x
Ot
t
vx
axt
v0x
2.17 A velocity-time graph forstraight-line motion with constant positivex-acceleration The initial x-velocityis also positive in this case.
v0xax.
1vx-t2
PhET: Forces in 1 DimensionActivPhysics 1.1: Analyzing Motion UsingDiagramsActivPhysics 1.2: Analyzing Motion UsingGraphsActivPhysics 1.3: Predicting Motion fromGraphsActivPhysics 1.4: Predicting Motion fromEquationsActivPhysics 1.5: Problem-Solving Strategiesfor KinematicsActivPhysics 1.6: Skier Races Downhill

Finally, we set Eqs. (2.9) and (2.11) equal to each other and simplify:
(constant x-acceleration only) (2.12)
Here’s what Eq. (2.12) tells us: If at time a particle is at position andhas x-velocity its new position x at any later time t is the sum of threeterms—its initial position plus the distance that it would move if its x-velocity were constant, plus an additional distance caused by the changein x-velocity.
A graph of Eq. (2.12)—that is, an x-t graph for motion with constant x-acceleration (Fig. 2.18a)—is always a parabola. Figure 2.18b shows such agraph. The curve intercepts the vertical axis (x-axis) at the position at The slope of the tangent at equals the initial x-velocity, and the slopeof the tangent at any time t equals the x-velocity at that time. The slope and x-velocity are continuously increasing, so the x-acceleration is positive; youcan also see this because the graph in Fig. 2.18b is concave up (it curvesupward). If is negative, the x-t graph is a parabola that is concave down (hasa downward curvature).
If there is zero x-acceleration, the x-t graph is a straight line; if there is a con-stant x-acceleration, the additional term in Eq. (2.12) for x as a function of t curves the graph into a parabola (Fig. 2.19a). We can analyze the graph inthe same way. If there is zero x-acceleration this graph is a horizontal line (the x-velocity is constant); adding a constant x-acceleration gives a slope to the graph (Fig. 2.19b).
vx-t
vx-t
12 axt 2
ax
ax
vx
v0x,t = 0t = 0.x0,
12 axt 2
v0xtx0,v0x,
x0t = 0
x = x0 + v0xt + 12 axt 2
v0x + 12 axt =
x - x0
t or
48 CHAPTER 2 Motion Along a Straight Line
During time interval t,the x-velocity changesby vx 2 v0x 5 axt.
Constant x-acceleration:x-t graph is a parabola.
(a) A race car moves in the x-directionwith constant acceleration.
(b) The x-t graph
v0x
vx 5 v0x 1 axt
x
xx
x0x0
O
x
Ot
t
Slope 5 vx
Slope 5 v0x
2.18 (a) Straight-line motion with con-stant acceleration. (b) A position-time (x-t)graph for this motion (the same motion asis shown in Figs. 2.15, 2.16, and 2.17). Forthis motion the initial position the ini-tial velocity and the acceleration are all positive.
axv0x,x0,
The graph with constant x-acceleration:x 5 x0 1 v0xt 1 axt21
2
The graph we would getwith zero x-acceleration:x 5 x0 1 v0xt
The effect ofx-acceleration:
axt212
The graph with zero x-acceleration:vx 5 v0x
The graph with constant x-acceleration:vx 5 v0x 1 ax t
The added velocitydue to x-acceleration:axt
(a) An x-t graph for an object moving withpositive constant x-acceleration
(b) The vx-t graph for the same object
x
x0
Ot
Ot
v0x
vx
2.19 (a) How a constant x-acceleration affects a body’s (a) x-t graph and (b) graph.vx-t
Application Testing Humans at HighAccelerationsIn experiments carried out by the U.S. Air Forcein the 1940s and 1950s, humans riding arocket sled demonstrated that they could with-stand accelerations as great as . Thefirst three photos in this sequence show AirForce physician John Stapp speeding up fromrest to injust 5 s. Photos 4–6 show the even greatermagnitude of acceleration as the rocket sledbraked to a halt.
421 mi>h21678 km>h =188 m>s
440 m>s2

2.4 Motion with Constant Acceleration 49
Just as the change in x-velocity of the particle equals the area under the graph, the displacement—that is, the change in position—equals the area underthe graph. To be specific, the displacement of the particle between
and any later time t equals the area under the graph between those twotimes. In Fig. 2.17 we divide the area under the graph into a dark-colored rectan-gle (vertical side , horizontal side t, and area ) and a light-colored righttriangle (vertical side , horizontal side t, and area . The totalarea under the graph is
in agreement with Eq. (2.12).The displacement during a time interval is always equal to the area under the
curve. This is true even if the acceleration is not constant, although in thatcase Eq. (2.12) does not apply. (We’ll show this in Section 2.6.)
It’s often useful to have a relationship for position, x-velocity, and (constant)x-acceleration that does not involve the time. To obtain this, we first solve Eq. (2.8) for t and then substitute the resulting expression into Eq. (2.12):
We transfer the term to the left side and multiply through by
Finally, simplifying gives us
(constant x-acceleration only) (2.13)
We can get one more useful relationship by equating the two expressionsfor Eqs. (2.9) and (2.10), and multiplying through by t. Doing this, weobtain
(constant x-acceleration only) (2.14)
Note that Eq. (2.14) does not contain the x-acceleration This equation can behandy when is constant but its value is unknown.
Equations (2.8), (2.12), (2.13), and (2.14) are the equations of motion withconstant acceleration (Table 2.4). By using these equations, we can solve anyproblem involving straight-line motion of a particle with constant acceleration.
For the particular case of motion with constant x-acceleration depicted inFig. 2.15 and graphed in Figs. 2.16, 2.17, and 2.18, the values of and are all positive. We invite you to redraw these figures for cases in which one,two, or all three of these quantities are negative.
axv0x ,x0 ,
ax
ax .
x - x0 = av0x + vx
2b t
vav-x ,
vx2 = v0x
2 + 2ax 1x - x02
2ax 1x - x02 = 2v0x vx - 2v0x2 + vx
2 - 2v0x vx + v0x2
2ax :x0
x = x0 + v0x avx - v0x
axb + 1
2 ax avx - v0x
axb
2
t =vx - v0x
ax
vx-t
x - x0 = v0x t + 12 ax t 2
vx-t
12 (axt)(t) = 1
2 axt
2)axtv0xtv0x
vx-tt = 0x - x0vx-t
ax-t
Table 2.4 Equations of Motionwith Constant Acceleration
IncludesEquation Quantities
(2.8) t
(2.12) t x
(2.13) x
(2.14) t x vx x - x0 = av0x + vx
2b t
axvx vx2 = v0x
2 + 2ax 1x - x02
axx = x0 + v0x t + 12 ax t
2
axvx vx = v0x + axt
PhET: The Moving ManActivPhysics 1.8: Seat Belts Save LivesActivPhysics 1.9: Screeching to a HaltActivPhysics 1.11: Car Starts, Then StopsActivPhysics 1.12: Solving Two-Vehicle ProblemsActivPhysics 1.13: Car Catches TruckActivPhysics 1.14: Avoiding a Rear-End Collision

50 CHAPTER 2 Motion Along a Straight Line
Example 2.4 Constant-acceleration calculations
A motorcyclist heading east through a small town accelerates at aconstant after he leaves the city limits (Fig. 2.20). Attime he is 5.0 m east of the city-limits signpost, moving eastat (a) Find his position and velocity at (b) Where is he when his velocity is
SOLUTION
IDENTIFY and SET UP: The x-acceleration is constant, so we canuse the constant-acceleration equations. We take the signpost as theorigin of coordinates and choose the positive x-axis to pointeast (see Fig. 2.20, which is also a motion diagram). The knownvariables are the initial position and velocity, and
, and the acceleration, The unknowntarget variables in part (a) are the values of the position x and the x-velocity at the target variable in part (b) is the valueof x when vx = 25 m > s .
t = 2.0 s;vx
ax = 4.0 m > s2.v0x = 15 m > sx0 = 5.0 m
(x = 0)
25 m > s?t = 2.0 s.15 m > s.
t = 04.0 m > s2
Eq. (2.12) and the x-velocity at this time by using Eq. (2.8):
(b) We want to find the value of x when but wedon’t know the time when the motorcycle has this velocity. Table2.4 tells us that we should use Eq. (2.13), which involves x, , and
but does not involve t:
Solving for x and substituting the known values, we find
EVALUATE: You can check the result in part (b) by first using Eq. (2.8), to find the time at which which turns out to be t 2.5 s. You can then use Eq. (2.12),
, to solve for x. You should find ,the same answer as above. That’s the long way to solve the problem,though. The method we used in part (b) is much more efficient.
x = 55 mv0xt + 12 axt
2x = x0 +=
vx = 25 m>s,vx = v0x + axt,
= 5.0 m +125 m > s22 - 115 m > s22
214.0 m > s22= 55 m
x = x0 +v 2
x - v 20x
2ax
v 2x = v 2
0x + 2ax1x - x02
ax
vx
vx = 25 m > s,
= 15 m > s + 14.0 m > s2212.0 s2 = 23 m > s
vx = v0x + axt
= 43 m = 5.0 m + 115 m > s212.0 s2 + 1
2 14.0 m > s2212.0 s22 x = x0 + v0xt + 1
2 axt2
vx
EXECUTE: (a) Since we know the values of , , and , Table2.4 tells us that we can find the position x at by using t = 2.0 s
axv0xx0
19651AWx
19651AWx
x (east)x 5 ?t 5 2.0 s
O
v0x 5 15 m/s vx 5 ?
ax 5 4.0 m/s2
x0 5 5.0 m t 5 0
OSAGE
2.20 A motorcyclist traveling with constant acceleration.
Problem-Solving Strategy 2.1 Motion with Constant Acceleration
IDENTIFY the relevant concepts: In most straight-line motion prob-lems, you can use the constant-acceleration equations (2.8), (2.12),(2.13), and (2.14). If you encounter a situation in which the accelera-tion isn’t constant, you’ll need a different approach (see Section 2.6).
SET UP the problem using the following steps:1. Read the problem carefully. Make a motion diagram showing
the location of the particle at the times of interest. Decidewhere to place the origin of coordinates and which axis direc-tion is positive. It’s often helpful to place the particle at the ori-gin at time then Remember that your choice ofthe positive axis direction automatically determines the posi-tive directions for x-velocity and x-acceleration. If x is positiveto the right of the origin, then and are also positive towardthe right.
2. Identify the physical quantities (times, positions, velocities, andaccelerations) that appear in Eqs. (2.8), (2.12), (2.13), and(2.14) and assign them appropriate symbols — x, and , or symbols related to those. Translate the prose intophysics: “When does the particle arrive at its highest point”means “What is the value of t when x has its maximum value?”In Example 2.4 below, “Where is the motorcyclist when hisvelocity is ” means “What is the value of x when
” Be alert for implicit information. For example,“A car sits at a stop light” usually means
3. Make a list of the quantities such as x, and t.Some of them will be known and some will be unknown.
ax,v0x,vx,x0,v0x = 0.
vx = 25 m > s?25 m > s?
ax
v0x,vx,x0,
axvx
x0 = 0.t = 0;
Write down the values of the known quantities, and decidewhich of the unknowns are the target variables. Make note ofthe absence of any of the quantities that appear in the fourconstant-acceleration equations.
4. Use Table 2.4 to identify the applicable equations. (These are oftenthe equations that don’t include any of the absent quantities thatyou identified in step 3.) Usually you’ll find a single equation thatcontains only one of the target variables. Sometimes you must findtwo equations, each containing the same two unknowns.
5. Sketch graphs corresponding to the applicable equations. The graph of Eq. (2.8) is a straight line with slope . The
graph of Eq. (2.12) is a parabola that’s concave up if ispositive and concave down if is negative.
6. On the basis of your accumulated experience with such prob-lems, and taking account of what your sketched graphs tell you,make any qualitative and quantitative predictions you can aboutthe solution.
EXECUTE the solution: If a single equation applies, solve it for thetarget variable, using symbols only; then substitute the known val-ues and calculate the value of the target variable. If you have twoequations in two unknowns, solve them simultaneously for the target variables.
EVALUATE your answer: Take a hard look at your results to seewhether they make sense. Are they within the general range of val-ues that you expected?
ax
axx-taxvx-t

2.4 Motion with Constant Acceleration 51
Example 2.5 Two bodies with different accelerations
A motorist traveling with a constant speed of aboutpasses a school-crossing corner, where the speed limit is
about . Just as the motorist passes the school-crossing sign, a police officer on a motorcycle stopped there startsin pursuit with a constant acceleration of (Fig. 2.21a). (a)How much time elapses before the officer passes the motorist? (b)What is the officer’s speed at that time? (c) At that time, what dis-tance has each vehicle traveled?
SOLUTION
IDENTIFY and SET UP: The officer and the motorist both movewith constant acceleration (equal to zero for the motorist), so wecan use the constant-acceleration formulas. We take the origin atthe sign, so for both, and we take the positive direction to the right. Let and represent the positions of the officer andthe motorist at any time; their initial velocities are and
, and their accelerations are and. Our target variable in part (a) is the time when the offi-
cer passes the motorist—that is, when the two vehicles are at thesame position x; Table 2.4 tells us that Eq. (2.12) is useful for thispart. In part (b) we’re looking for the officer’s speed (the magni-tude of his velocity) at the time found in part (a). We’ll use Eq. (2.8) for this part. In part (c) we’ll use Eq. (2.12) again to findthe position of either vehicle at this same time.
Figure 2.21b shows an graph for both vehicles. The straightline represents the motorist’s motion,
. The graph for the officer’s motion is the right half of a concave–up parabola:
A good sketch will show that the officer and motorist are at thesame position at about , at which time bothhave traveled about 150 m from the sign.
EXECUTE: (a) To find the value of the time t at which the motoristand police officer are at the same position, we set byequating the expressions above and solving that equation for t:
t = 0 or t =2vM0x
aPx=
2115 m>s2
3.0 m>s2= 10 s
vM0xt = 12 aPxt
2
xP = xM
t = 10 s1xP = xM2
xP = xP0 + vP0xt + 12 aPxt
2 = 12 aPxt
2
vM0xtxM = xM0 + vM0xt =
x-t
v
aMx = 0aPx = 3.0 m>s2vM0x = 15 m>s
vP0x = 0xMxP
x0 = 0
3.0 m>s2
22 mi>h2110 m>s34 mi>h2
115 m>s Both vehicles have the same x-coordinate at two times, as Fig. 2.21bindicates. At the motorist passes the officer; at theofficer passes the motorist.
(b) We want the magnitude of the officer’s x-velocity at thetime t found in part (a). Substituting the values of and intoEq. (2.8) along with from part (a), we find
The officer’s speed is the absolute value of this, which is also .
(c) In 10 s the motorist travels a distance
and the officer travels
This verifies that they have gone equal distances when the officerpasses the motorist.
EVALUATE: Our results in parts (a) and (c) agree with our estimatesfrom our sketch. Note that at the time when the officer passes themotorist, they do not have the same velocity. At this time themotorist is moving at and the officer is moving at 30 m s.You can also see this from Fig. 2.21b. Where the two curvescross, their slopes (equal to the values of for the two vehicles)are different.
Is it just coincidence that when the two vehicles are at the sameposition, the officer is going twice the speed of the motorist? Equa-tion (2.14), , gives the answer. Themotorist has constant velocity, so , and the distance
that the motorist travels in time t is . The officer haszero initial velocity, so in the same time t the officer travels a dis-tance . If the two vehicles cover the same distance in the sameamount of time, the two values of must be the same. Hence when the officer passes the motorist and
—that is, the officer has exactly twice the motorist’svelocity. Note that this is true no matter what the value of the offi-cer’s acceleration.
vPx = 2vM0x
vM0xt = 12 vPxt
x - x0
12 vPxt
vM0xtx - x0
vM0x = vMx
x - x0 = 31v0x + vx2>24t
vx
x-t>15 m>s
xP = 12 aPxt
2 = 12 13.0 m>s22110 s22 = 150 m
xM = vM0xt = 115 m>s2110 s2 = 150 m
30 m>s
vPx = vP0x + aPxt = 0 + 13.0 m>s22110 s2 = 30 m>s
t = 10 saPxvP0x
vPx
t = 10 st = 0
POLICE
Police officer: initially at rest,constant x-acceleration
The police officer and motoristmeet at the time t where theirx-t graphs cross.
Motorist: constant x-velocity
xPO
aPx 5 3.0 m/s2 vM0x 5 15 m/sCROSSING
xM
40
80
120
160
x (m)
xO 1210862
t (s)
Motorist
Officer
4
(a)
(b)
SCHOOL
2.21 (a) Motion with constant acceleration overtaking motion with constant velocity. (b) A graph of x versus t for each vehicle.
2.5 Freely Falling BodiesThe most familiar example of motion with (nearly) constant acceleration is abody falling under the influence of the earth’s gravitational attraction. Suchmotion has held the attention of philosophers and scientists since ancient times.In the fourth century B.C., Aristotle thought (erroneously) that heavy bodies fallfaster than light bodies, in proportion to their weight. Nineteen centuries later,Galileo (see Section 1.1) argued that a body should fall with a downward acceler-ation that is constant and independent of its weight.
Experiment shows that if the effects of the air can be neglected, Galileo isright; all bodies at a particular location fall with the same downward acceleration,regardless of their size or weight. If in addition the distance of the fall is smallcompared with the radius of the earth, and if we ignore small effects due to theearth’s rotation, the acceleration is constant. The idealized motion that resultsunder all of these assumptions is called free fall, although it includes rising aswell as falling motion. (In Chapter 3 we will extend the discussion of free fall toinclude the motion of projectiles, which move both vertically and horizontally.)
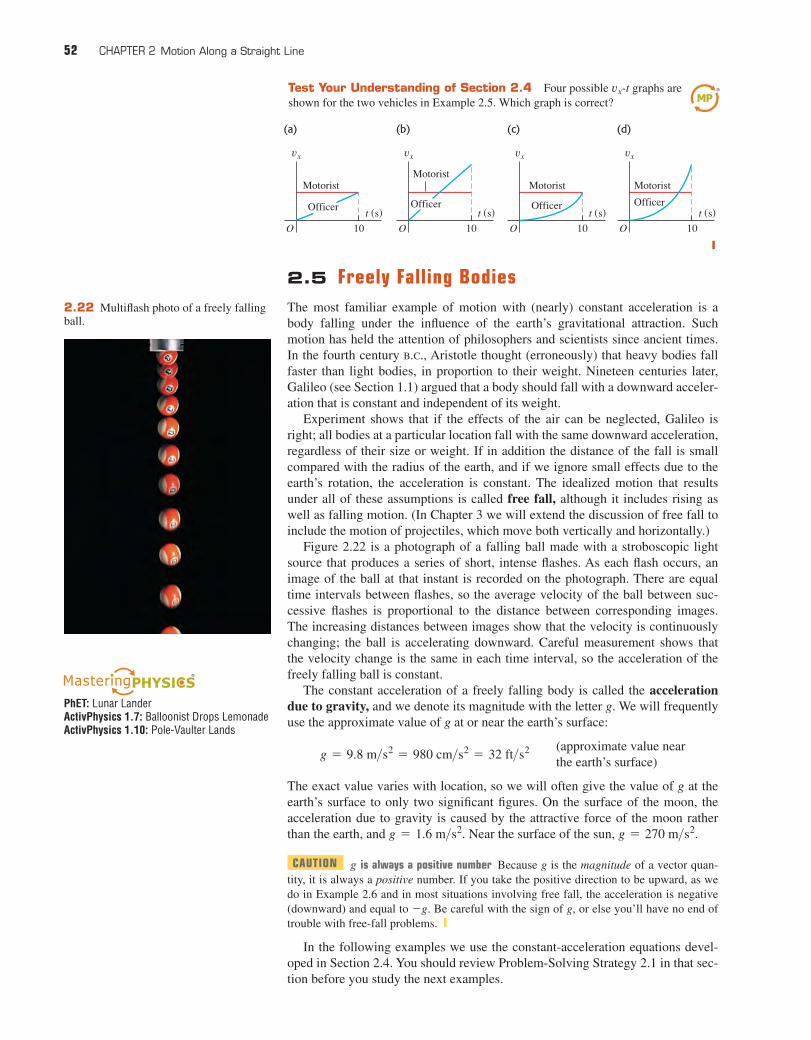
Figure 2.22 is a photograph of a falling ball made with a stroboscopic lightsource that produces a series of short, intense flashes. As each flash occurs, animage of the ball at that instant is recorded on the photograph. There are equaltime intervals between flashes, so the average velocity of the ball between suc-cessive flashes is proportional to the distance between corresponding images.The increasing distances between images show that the velocity is continuouslychanging; the ball is accelerating downward. Careful measurement shows thatthe velocity change is the same in each time interval, so the acceleration of thefreely falling ball is constant.
The constant acceleration of a freely falling body is called the accelerationdue to gravity, and we denote its magnitude with the letter g. We will frequentlyuse the approximate value of g at or near the earth’s surface:
(approximate value near the earth’s surface)
The exact value varies with location, so we will often give the value of g at theearth’s surface to only two significant figures. On the surface of the moon, theacceleration due to gravity is caused by the attractive force of the moon ratherthan the earth, and Near the surface of the sun,
CAUTION g is always a positive number Because g is the magnitude of a vector quan-tity, it is always a positive number. If you take the positive direction to be upward, as wedo in Example 2.6 and in most situations involving free fall, the acceleration is negative(downward) and equal to . Be careful with the sign of g, or else you’ll have no end oftrouble with free-fall problems. ❙
In the following examples we use the constant-acceleration equations devel-oped in Section 2.4. You should review Problem-Solving Strategy 2.1 in that sec-tion before you study the next examples.
-g
g = 270 m>s2.g = 1.6 m>s2.
g = 9.8 m>s2 = 980 cm>s2 = 32 ft>s2
52 CHAPTER 2 Motion Along a Straight Line
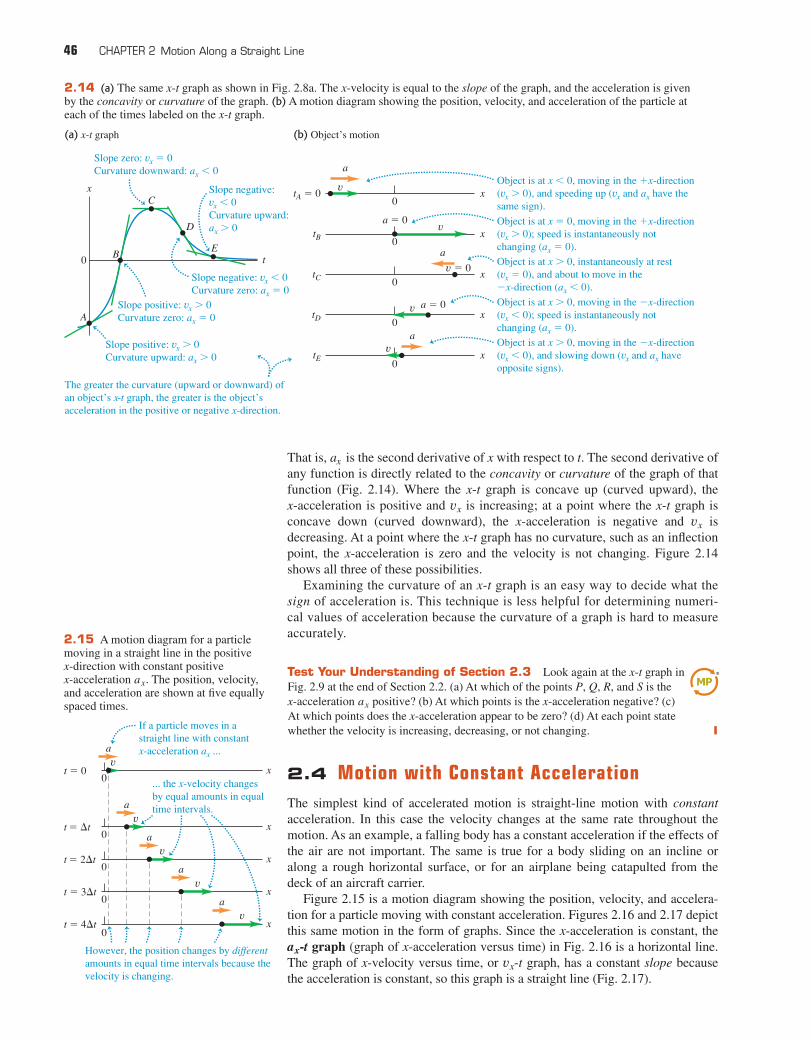
Test Your Understanding of Section 2.4 Four possible graphs areshown for the two vehicles in Example 2.5. Which graph is correct?
vx-t
(a) (b) (c) (d)
vx
O 10
t (s)
Motorist
Officer
vx
O 10
t (s)
Motorist
Officer
vx
O 10
t (s)
Motorist
Officer
vx
O 10
t (s)
Motorist
Officer
❙
2.22 Multiflash photo of a freely fallingball.
PhET: Lunar LanderActivPhysics 1.7: Balloonist Drops LemonadeActivPhysics 1.10: Pole-Vaulter Lands

2.5 Freely Falling Bodies 53
Example 2.6 A freely falling coin
A one-euro coin is dropped from the Leaning Tower of Pisa andfalls freely from rest. What are its position and velocity after 1.0 s,2.0 s, and 3.0 s?
SOLUTION
IDENTIFY and SET UP: “Falls freely” means “falls with constantacceleration due to gravity,” so we can use the constant-accelera-tion equations. The right side of Fig. 2.23 shows our motion dia-gram for the coin. The motion is vertical, so we use a vertical
coordinate axis and call the coordinate y instead of x. We take theorigin O at the starting point and the upward direction as positive.The initial coordinate and initial y-velocity are both zero.The y-acceleration is downward (in the negative y-direction), so
(Remember that, by definition, g itself isa positive quantity.) Our target variables are the values of y andat the three given times. To find these, we use Eqs. (2.12) and (2.8)with x replaced by y. Our choice of the upward direction as posi-tive means that all positions and velocities we calculate will benegative.
EXECUTE: At a time t after the coin is dropped, its position and y-velocity are
vy
ay = -g = -9.8 m>s2.
v0yy0
The Leaning Tower Our sketch for the problem
2.23 A coin freely falling from rest.
Example 2.7 Up-and-down motion in free fall
You throw a ball vertically upward from the roof of a tall building.The ball leaves your hand at a point even with the roof railing withan upward speed of the ball is then in free fall. On itsway back down, it just misses the railing. Find (a) the ball’s posi-tion and velocity 1.00 s and 4.00 s after leaving your hand; (b) theball’s velocity when it is 5.00 m above the railing; (c) the maxi-mum height reached; (d) the ball’s acceleration when it is at itsmaximum height.
SOLUTION
IDENTIFY and SET UP: The words “in free fall” mean that the accel-eration is due to gravity, which is constant. Our target variables areposition [in parts (a) and (c)], velocity [in parts (a) and (b)], andacceleration [in part (d)]. We take the origin at the point where theball leaves your hand, and take the positive direction to be upward(Fig. 2.24). The initial position is zero, the initial y-velocity
is and the y-acceleration is ay = -g = -9.80 m>s2.+15.0 m>s,
v0yy0
15.0 m>s;
In part (a), as in Example 2.6, we’ll use Eqs. (2.12) and (2.8) tofind the position and velocity as functions of time. In part (b) wemust find the velocity at a given position (no time is given), sowe’ll use Eq. (2.13).
Figure 2.25 shows the and graphs for the ball. The graph is a concave-down parabola that rises and then falls, and the
graph is a downward-sloping straight line. Note that the ball’svelocity is zero when it is at its highest point.
EXECUTE: (a) The position and y-velocity at time t are given byEqs. (2.12) and (2.8) with x’s replaced by y’s:
= 15.0 m>s + 1-9.80 m>s22t
vy = v0y + ayt = v0y + 1-g2t
= 102 + 115.0 m>s2t + 12 1-9.80 m>s22t 2
y = y0 + v0yt + 12 ayt
2 = y0 + v0yt + 12 1-g2t 2
vy-t
y-tvy-ty-t
Continued
y = y0 + v0yt + 12 ayt
2 = 0 + 0 + 12 1-g2t 2 = 1-4.9 m>s22t 2
vy = v0y + ayt = 0 + 1-g2t = 1-9.8 m>s22t
When and after , the coin is
below the origin (y is negative) and has a downward velocity ( isnegative) with magnitude
We can find the positions and y-velocities at 2.0 s and 3.0 s inthe same way. The results are and at
and and at
EVALUATE: All our answers are negative, as we expected. If we hadchosen the positive y-axis to point downward, the accelerationwould have been and all our answers would have beenpositive.
ay = +g
t = 3.0 s.vy = -29 m>sy = -44 mt = 2.0 s,vy = -20 m>sy = -20 m
9.8 m>s.vy
4.9 m1 s1-9.8 m>s2211.0 s2 = -9.8 m>s;vy =y = 1-4.9 m>s2211.0 s22 = -4.9 mt = 1.0 s,

54 CHAPTER 2 Motion Along a Straight Line
When these equations give and. That is, the ball is 10.1 m above the origin (y is
positive) and moving upward ( is positive) with a speed ofThis is less than the initial speed because the ball slows
as it ascends. When those equations giveand . The ball has passed its high-
est point and is 18.4 m below the origin (y is negative). It is mov-ing downward ( is negative) with a speed of The ballgains speed as it descends; Eq. (2.13) tells us that it is moving atthe initial speed as it moves downward past the ball’slaunching point, and continues to gain speed as it descends further.
(b) The y-velocity at any position y is given by Eq. (2.13) withx’s replaced by y’s:
When the ball is 5.00 m above the origin we have so
We get two values of because the ball passes through the pointtwice, once on the way up (so is positive) and
once on the way down (so is negative) (see Figs. 2.24 and2.25a).
vy
vyy = +5.00 mvy
vy = �11.3 m>s
v 2y = 115.0 m>s22 + 21-9.80 m>s2215.00 m2 = 127 m2>s2
y = +5.00 m,
= 115.0 m>s22 + 21-9.80 m>s22y
v 2y = v 2
0y + 2ay1y - y02 = v 20y + 21-g21y - 02
15.0-m >s
24.2 m>s.vy
vy = -24.2 m>sy = -18.4 mt = 4.00 s,
5.2 m>s.vy
vy = +5.2 m>sy = +10.1 mt = 1.00 s, (c) At the instant at which the ball reaches its maximum height
, its y-velocity is momentarily zero: We use Eq. (2.13) tofind . With and , we get
(d) CAUTION A free-fall misconception It’s a common mis-conception that at the highest point of free-fall motion, where thevelocity is zero, the acceleration is also zero. If this were so, oncethe ball reached the highest point it would hang there suspended inmidair! Remember that acceleration is the rate of change of veloc-ity, and the ball’s velocity is continuously changing. At everypoint, including the highest point, and at any velocity, includingzero, the acceleration in free fall is always
.
EVALUATE: A useful way to check any free-fall problem is to drawthe y-t and graphs as we did in Fig. 2.25. Note that these aregraphs of Eqs. (2.12) and (2.8), respectively. Given the numericalvalues of the initial position, initial velocity, and acceleration, youcan easily create these graphs using a graphing calculator or anonline mathematics program.
vy-t
-9.80 m>s2ay = -g =
y1 =v 2
0y
2g=115.0 m>s22
219.80 m>s22= +11.5 m
0 = v 20y + 21-g21y1 - 02
ay = -gy0 = 0,vy = 0,y1
vy = 0.y1
Before t 5 1.53 sthe y-velocity ispositive.
Before t 5 1.53 s theball moves upward.
After t 5 1.53 sthe ball movesdownward.
(a) y-t graph (curvature isdownward because ay 5 2gis negative)
5
10
15
220
215
210
25
225
0
(b) vy-t graph (straight line withnegative slope because ay 5 2gis constant and negative)
431t (s)
2
vy (m/s)
431t (s)
2
5
10
15
y (m)
220
215
210
25
0After t 5 1.53 sthe y-velocity isnegative.
2.25 (a) Position and (b) velocity as functions of time for aball thrown upward with an initial speed of 15 m>s.
Example 2.8 Two solutions or one?
At what time after being released has the ball in Example 2.7 fallen5.00 m below the roof railing?
SOLUTION
IDENTIFY and SET UP: We treat this as in Example 2.7, so and have the same values as there. In this example, how-ever, the target variable is the time at which the ball is at y = -5.00 m.
ay = -gv0y,y0,
The best equation to use is Eq. (2.12), which gives the position y asa function of time t:
This is a quadratic equation for t, which we want to solve for thevalue of t when y = -5.00 m.
y = y0 + v0yt + 12 ayt
2 = y0 + v0yt + 12 1-g2t 2
The ball actually moves straight up andthen straight down; we show a U-shaped path for clarity.
t 5 0, v0y 5 15.0 m/s
t 5 1.00 s, vy 5 ?y 5 ?y 5 ?
y 5 ?
y 5 5.00 m
y 5 0
y
t 5 4.00 svy 5 ?
vy 5 ?t 5 ?
t 5 ?vy 5 0
ay 5 2g
t 5 ?, vy 5 ?
5 29.80 m/s2
2.24 Position and velocity of a ball thrown vertically upward.

2.6 Velocity and Position by Integration 55
2.6 Velocity and Position by IntegrationThis section is intended for students who have already learned a little integralcalculus. In Section 2.4 we analyzed the special case of straight-line motion withconstant acceleration. When is not constant, as is frequently the case, the equa-tions that we derived in that section are no longer valid (Fig. 2.26). But evenwhen varies with time, we can still use the relationship to find thex-velocity as a function of time if the position x is a known function of time.And we can still use to find the x-acceleration as a function oftime if the x-velocity is a known function of time.
In many situations, however, position and velocity are not known functions oftime, while acceleration is (Fig. 2.27). How can we find the position and velocityin straight-line motion from the acceleration function
We first consider a graphical approach. Figure 2.28 is a graph of x-accelerationversus time for a body whose acceleration is not constant. We can divide the timeinterval between times and into many smaller intervals, calling a typical one
Let the average x-acceleration during be From Eq. (2.4) the changein x-velocity during is
Graphically, equals the area of the shaded strip with height and width—that is, the area under the curve between the left and right sides of The
total change in x-velocity during any interval (say, to is the sum of the x-velocity changes in the small subintervals. So the total x-velocity change isrepresented graphically by the total area under the curve between the verticalax-t
¢vx
t2)t1
¢t.¢taav-x¢vx
¢vx = aav-x ¢t
¢t¢vx
aav-x.¢t¢t.t2t1
ax1t2?
vx
axax = dvx>dtvx
vx = dx>dtax
ax
Substituting the values and m, we findy = -5.00
g = 9.80 m>s2,v0y = +15.0 m>s,y0 = 0,
EXECUTE: We rearrange the equation so that is has the standard formof a quadratic equation for an unknown x,
By comparison, we identify and The quadratic formula (see Appendix B) tells us that this equationhas two solutions:
=v0y � 2v 2
0y - 2g1y - y02
g
=-1-v0y2 � 21-v0y2
2 - 4112g21y - y022
2112g2
t =-B � 2B2 - 4AC
2A
C = y - y0.B = -v0y,A = 12g,
112 g2t 2 + 1-v0y2t + 1y - y02 = At 2 + Bt + C = 0
Ax2 + Bx + C = 0:
Test Your Understanding of Section 2.5 If you toss a ball upward witha certain initial speed, it falls freely and reaches a maximum height h a time t afterit leaves your hand. (a) If you throw the ball upward with double the initial speed,what new maximum height does the ball reach? (i) (ii) 2h; (iii) 4h; (iv) 8h; (v) 16h.(b) If you throw the ball upward with double the initial speed, how long does it take toreach its new maximum height? (i) (ii) (iii) t; (iv) (v) 2t.
❚t12 ;t>12 ;t>2;
h12 ;
2.26 When you push your car’s acceler-ator pedal to the floorboard, the resultingacceleration is not constant: The greaterthe car’s speed, the more slowly it gainsadditional speed. A typical car takes twiceas long to accelerate from to
as it does to accelerate from 0 to50 km>h.100 km>h
50 km>h
sense, since it refers to a time before the ball left your hand at. So the correct answer is .
EVALUATE: Why did we get a second, fictitious solution? Theexplanation is that constant-acceleration equations like Eq. (2.12)are based on the assumption that the acceleration is constant for allvalues of time, whether positive, negative, or zero. Hence the solu-tion refers to an imaginary moment when a freelyfalling ball was 5.00 m below the roof railing and rising to meetyour hand. Since the ball didn’t leave your hand and go into freefall until , this result is pure fiction.
You should repeat these calculations to find the times when theball is 5.00 m above the origin The two answersare and These are both positive valuesof t, and both refer to the real motion of the ball after leaving yourhand. At the earlier time the ball passes through moving upward; at the later time it passes through this point mov-ing downward. [Compare this with part (b) of Example 2.7, andagain refer to Fig. 2.25a.]
You should also solve for the times when In thiscase, both solutions involve the square root of a negative number, sothere are no real solutions. Again Fig. 2.25a shows why; we found inpart (c) of Example 2.7 that the ball’s maximum height is
so it never reaches While a quadraticequation such as Eq. (2.12) always has two solutions, in some situa-tions one or both of the solutions will not be physically reasonable.
y = +15.0 m.y = +11.5 m,
y = +15.0 m.
y = +5.00 m
t = +2.68 s.t = +0.38 s1y = +5.00 m2.
t = 0
t = -0.30 s
t = +3.36 st = 0
t =115.0 m>s2 � 2115.0 m>s22 - 219.80 m >s221-5.00 m - 02
9.80 m>s2
You can confirm that the numerical answers are and . The answer doesn’t make physicalt = -0.30 st = -0.30 s
t = +3.36 s

lines and (In Section 2.4 we showed this for the special case in which theacceleration is constant.)
In the limit that all the become very small and their number very large,the value of for the interval from any time t to approaches the instan-taneous x-acceleration at time t. In this limit, the area under the curve isthe integral of (which is in general a function of t) from to If is the x-velocity of the body at time and is the velocity at time then
(2.15)
The change in the x-velocity is the time integral of the x-accelerationWe can carry out exactly the same procedure with the curve of x-velocity ver-
sus time. If is a body’s position at time and is its position at time fromEq. (2.2) the displacement during a small time interval is equal to where is the average x-velocity during The total displacement during the interval is given by
(2.16)
The change in position x—that is, the displacement—is the time integral of x-velocity . Graphically, the displacement between times and is the areaunder the curve between those two times. [This is the same result that weobtained in Section 2.4 for the special case in which is given by Eq. (2.8).]
If and is any later time t, and if and are the position andvelocity, respectively, at time then we can rewrite Eqs. (2.15) and (2.16)as follows:
(2.17)
(2.18)
Here x and are the position and x-velocity at time t. If we know the x-accelerationas a function of time and we know the initial velocity we can use Eq. (2.17)
to find the x-velocity at any time; in other words, we can find as a function of time. Once we know this function, and given the initial position we can use Eq. (2.18) to find the position x at any time.
x0,vxvx
v0x,ax
vx
x = x0 + Lt
0vx dt
vx = v0x + Lt
0ax dt
t = 0,v0xx0t2t1 = 0
vx
vx-tt2t1vx
x2 - x1 = Lx2
x1
dx = Lt2
t1
vx dt
t2 - t1
x2 - x1¢t.vav-x
vav-x ¢t,¢t¢xt2,x2t1x1
ax.vx
v2x - v1x = Lv2x
v1x
dvx = Lt2
t1
ax dt
t2,v2xt1
v1xt2.t1ax
ax-tax
t + ¢taav-x
¢t’s
t2.t1
56 CHAPTER 2 Motion Along a Straight Line
Total area under the x-t graph from t1 to t25 Net change in x-velocity from t1 to t2
Area of this strip 5 Dvx5 Change in x-velocityduring time interval Dt
O
aav-x
ax
t1 t2t
Dt
2.28 An graph for a body whose x-acceleration is not constant.
ax-t
Example 2.9 Motion with changing acceleration
Sally is driving along a straight highway in her 1965 Mustang. Atwhen she is moving at in the positive x-direction,
she passes a signpost at Her x-acceleration as a func-tion of time is
(a) Find her x-velocity and position x as functions of time. (b) When is her x-velocity greatest? (c) What is that maximum x-velocity? (d) Where is the car when it reaches that maximum x-velocity?
vx
ax = 2.0 m>s2 - 10.10 m>s32t
x = 50 m.10 m>st = 0,
SOLUTION
IDENTIFY and SET UP: The x-acceleration is a function of time, sowe cannot use the constant-acceleration formulas of Section 2.4.Instead, we use Eq. (2.17) to obtain an expression for as a func-tion of time, and then use that result in Eq. (2.18) to find an expres-sion for x as a function of t. We’ll then be able to answer a varietyof questions about the motion.
vx
2.27 The inertial navigation system(INS) on board a long-range airliner keepstrack of the airliner’s acceleration. Thepilots input the airliner’s initial positionand velocity before takeoff, and the INSuses the acceleration data to calculate theairliner’s position and velocity throughoutthe flight.

2.6 Velocity and Position by Integration 57
EXECUTE: (a) At Sally’s position is and her x-velocity is To use Eq. (2.17), we note that the inte-gral of (except for ) is . Hence wefind
= 10 m>s + 12.0 m>s22t - 12 10.10 m>s32t 2
vx = 10 m>s + Lt
032.0 m>s2 - 10.10 m>s32t4dt
1t ndt = 1n + 1 t n+1n = -1t n
v0x = 10 m>s.x0 = 50 mt = 0, (c) We find the maximum x-velocity by substituting ,
the time from part (b) when velocity is maximum, into the equa-tion for from part (a):
(d) To find the car’s position at the time that we found in part(b), we substitute into the expression for x from part (a):
EVALUATE: Figure 2.29 helps us interpret our results. The topgraph shows that is positive between and andnegative after that. It is zero at the time at which ismaximum (the high point in the middle graph). The car speeds upuntil (because and have the same sign) and slowsdown after (because and have opposite signs).
Since is maximum at , the x-t graph (the bottomgraph in Fig. 2.29) has its maximum positive slope at this time.Note that the x-t graph is concave up (curved upward) from to when is positive. The graph is concave down(curved downward) after when is negative.axt = 20 s,
axt = 20 s,t = 0
t = 20 svx
axvxt = 20 saxvxt = 20 s
vxt = 20 s,t = 20 st = 0ax
= 517 m
- 16 10.10 m>s32120 s23
x = 50 m + 110 m>s2120 s2 + 12 12.0 m>s22120 s22
t = 20 s
= 30 m>s
vmax-x = 10 m>s + 12.0 m>s22120 s2 - 12 10.10 m>s32120 s22
vx
t = 20 s
Now we use Eq. (2.18) to find x as a function of t:
= 50 m + 110 m>s2t + 12 12.0 m>s22t 2 - 1
6 10.10 m>s32t 3
x = 50 m + Lt
0310 m>s + 12.0 m>s22t - 1
2 10.10 m>s32t 24 dt
Figure 2.29 shows graphs of , and x as functions of time asgiven by the equations above. Note that for any time t, the slope ofthe graph equals the value of and the slope of the x-t graphequals the value of .
(b) The maximum value of occurs when the x-velocity stopsincreasing and begins to decrease. At that instant, So we set the expression for equal to zero and solve for t :
t =2.0 m>s2
0.10 m>s3= 20 s
0 = 2.0 m>s2 - 10.10 m>s32t
ax
dvx>dt = ax = 0.vx
vx
axvx-t
vxax,
25
x-t graph curvesdownward aftert 5 20 s.
x-t graph curvesupward beforet 5 20 s.
x-velocityincreases beforet 5 20 s.
x-velocitydecreases aftert 5 20 s.
x-acceleration ispositive before t 5 20 s.
x-acceleration isnegative after t 5 20 s.
vx (m/s)
O
10
20
30
5 10 15 20 25 30t (s)
x (m)
t (s)O
200
400
600
800
5 10 15 20 25 30
ax (m/s2)
O
1.0
2.0
5 10 15 20 30
�1.0
t (s)
2.29 The position, velocity, and acceleration of the car in Example 2.9 as functions of time. Can you show that if this motion contin-ues, the car will stop at t = 44.5 s?
Test Your Understanding of Section 2.6 If the x-accelerationis increasing with time, will the graph be (i) a straight line, (ii) concave up(i.e., with an upward curvature), or (iii) concave down (i.e., with a downward curvature)? ❚
vx-tax

58
Straight-line motion with constant acceleration: Whenthe x-acceleration is constant, four equations relate theposition x and the x-velocity at any time t to the initial position the initial x-velocity (both measured at time and the x-acceleration(See Examples 2.4 and 2.5.)
ax.t = 0),v0xx0,
vx
Freely falling bodies: Free fall is a case of motion withconstant acceleration. The magnitude of the accelerationdue to gravity is a positive quantity, g. The accelerationof a body in free fall is always downward. (See Exam-ples 2.6–2.8.)
(2.4)
(2.5)ax = lim¢tS0
¢vx
¢t=
dvx
dt
aav-x =v2x - v1x
t2 - t1=
¢vx
¢t
Constant x-acceleration only:
(2.8)
(2.12)
(2.13)
(2.14)x - x0 = av0x + vx
2b t
vx2 = v0x
2 + 2ax1x - x02
x = x0 + v0xt + 12 axt 2
vx = v0x + axt
Straight-line motion with varying acceleration: When theacceleration is not constant but is a known function oftime, we can find the velocity and position as functionsof time by integrating the acceleration function. (SeeExample 2.9.)
(2.17)
(2.18)x = x0 + Lt
0vx dt
vx = v0x + Lt
0ax dt
Straight-line motion, average and instantaneous x-velocity: When a particle moves along a straight line,we describe its position with respect to an origin O bymeans of a coordinate such as x. The particle’s averagex-velocity during a time interval isequal to its displacement divided by The instantaneous x-velocity at any time t is equal tothe average x-velocity for the time interval from t to
in the limit that goes to zero. Equivalently, is the derivative of the position function with respect totime. (See Example 2.1.)
vx¢tt + ¢t
vx
¢t.¢x = x2 - x1
¢t = t2 - t1vav-x
(2.2)
(2.3)vx = lim¢tS0
¢x
¢t=
dx
dt
vav-x =x2 - x1
t2 - t1=
¢x
¢t
x
p1
p2
Ot
�x
5x 2
2x 1
�t 5 t2 2 t1t2t1
x1
x2
Slop
e 5v av
-x
Slope 5 v x
vx
v2x
v1x
t2t1t
O
p1
p2
Dt 5 t2 2 t1
Dv x
5v 2
x2
v 1x
Slope 5a av
-x
Slope 5 ax
0
0
0
0
0
t 5 2Dt
t 5 3Dt
t 5 Dt
t 5 4Dt
t 5 0v
a
va
va
va
va
x
x
x
x
x
ay 5 2g 5 29.80 m/s2
O
aav-x
ax
t1 t2t
Dt
Average and instantaneous x-acceleration: The averagex-acceleration during a time interval is equal to the change in velocity duringthat time interval divided by The instantaneous x-acceleration is the limit of as goes to zero,or the derivative of with respect to t. (See Examples2.2 and 2.3.)
vx
¢taav-xax
¢t.¢vx = v2x - v1x
¢taav-x
CHAPTER 2 SUMMARY

Discussion Questions 59
The superhero Green Lantern steps from the top of a tall building.He falls freely from rest to the ground, falling half the total dis-tance to the ground during the last 1.00 s of his fall. What is theheight h of the building?
SOLUTION GUIDE
See MasteringPhysics® study area for a Video Tutor solution.
IDENTIFY and SET UP1. You’re told that Green Lantern falls freely from rest. What does
this imply about his acceleration? About his initial velocity?2. Choose the direction of the positive y-axis. It’s easiest to make
the same choice we used for freely falling objects in Section 2.5.3. You can divide Green Lantern’s fall into two parts: from the top
of the building to the halfway point and from the halfway pointto the ground. You know that the second part of the fall lasts1.00 s. Decide what you would need to know about Green
BRIDGING PROBLEM The Fall of a Superhero
Lantern’s motion at the halfway point in order to solve for thetarget variable h. Then choose two equations, one for the firstpart of the fall and one for the second part, that you’ll usetogether to find an expression for h. (There are several pairs ofequations that you could choose.)
EXECUTE4. Use your two equations to solve for the height h. Note that
heights are always positive numbers, so your answer should bepositive.
EVALUATE5. To check your answer for h, use one of the free-fall equations to
find how long it takes Green Lantern to fall (i) from the top ofthe building to half the height and (ii) from the top of the build-ing to the ground. If your answer for h is correct, time (ii)should be 1.00 s greater than time (i). If it isn’t, you’ll need togo back and look for errors in how you found h.
Problems For instructor-assigned homework, go to www.masteringphysics.com
DISCUSSION QUESTIONSQ2.1 Does the speedometer of a car measure speed or velocity?Explain.Q2.2 The top diagram in Fig. Q2.2 represents a series of high-speed photographs of an insect flying in a straight line from left toright (in the positive x-direction). Which of the graphs in Fig. Q2.2most plausibly depicts this insect’s motion?
the BMW reaches Elwood’s Car Wash. How are the cars’ averagevelocities between these two times related?Q2.8 A driver in Massachusetts was sent to traffic court for speeding.The evidence against the driver was that a policewoman observed thedriver’s car alongside a second car at a certain moment, and thepolicewoman had already clocked the second car as going faster thanthe speed limit. The driver argued, “The second car was passing me. I was not speeding.” The judge ruled against the driver because, inthe judge’s words, “If two cars were side by side, you were bothspeeding.” If you were a lawyer representing the accused driver, howwould you argue this case?Q2.9 Can you have a zero displacement and a nonzero averagevelocity? A nonzero velocity? Illustrate your answers on an x-t graph.Q2.10 Can you have zero acceleration and nonzero velocity?Explain using a graph.Q2.11 Can you have zero velocity and nonzero average accelera-tion? Zero velocity and nonzero acceleration? Explain using a graph, and give an example of such motion.Q2.12 An automobile is traveling west. Can it have a velocitytoward the west and at the same time have an acceleration towardthe east? Under what circumstances?Q2.13 The official’s truck in Fig. 2.2 is at at
and is at at (a) Sketch twodifferent possible x-t graphs for the motion of the truck. (b) Doesthe average velocity during the time interval from to have the same value for both of your graphs? Why or why not?Q2.14 Under constant acceleration the average velocity of a parti-cle is half the sum of its initial and final velocities. Is this still trueif the acceleration is not constant? Explain.
t2t1vav-x
t2 = 25.0 s.x2 = 19 mt1 = 16.0 sx1 = 277 m
vx-t
vx-t
., .., ...: Problems of increasing difficulty. CP: Cumulative problems incorporating material from earlier chapters. CALC: Problemsrequiring calculus. BIO: Biosciences problems.
(a)
vx
tO
(b)
ax
tO
(c)
x
tO
(d)
vx
tO
(e)
vx
tO
Figure Q2.2
Q2.3 Can an object with constant acceleration reverse its directionof travel? Can it reverse its direction twice? In each case, explainyour reasoning.Q2.4 Under what conditions is average velocity equal to instanta-neous velocity?Q2.5 Is it possible for an object (a) to be slowing down while itsacceleration is increasing in magnitude; (b) to be speeding upwhile its acceleration is decreasing? In each case, explain your reasoning.Q2.6 Under what conditions does the magnitude of the averagevelocity equal the average speed?Q2.7 When a Dodge Viper is at Elwood’s Car Wash, a BMW Z3 isat Elm and Main. Later, when the Dodge reaches Elm and Main,

60 CHAPTER 2 Motion Along a Straight Line
Q2.15 You throw a baseball straight up in the air so that it rises toa maximum height much greater than your height. Is the magni-tude of the acceleration greater while it is being thrown or after itleaves your hand? Explain.Q2.16 Prove these statements: (a) As long as you can neglect theeffects of the air, if you throw anything vertically upward, it willhave the same speed when it returns to the release point as when itwas released. (b) The time of flight will be twice the time it takesto get to its highest point.Q2.17 A dripping water faucet steadily releases drops 1.0 s apart.As these drops fall, will the distance between them increase,decrease, or remain the same? Prove your answer.Q2.18 If the initial position and initial velocity of a vehicle areknown and a record is kept of the acceleration at each instant, canyou compute the vehicle’s position after a certain time from thesedata? If so, explain how this might be done.Q2.19 From the top of a tall building you throw one ball straightup with speed and one ball straight down with speed .(a) Which ball has the greater speed when it reaches the ground?(b) Which ball gets to the ground first? (c) Which ball has a greaterdisplacement when it reaches the ground? (d) Which ball has trav-eled the greater distance when it hits the ground?Q2.20 A ball is dropped from rest from the top of a building ofheight h. At the same instant, a second ball is projected verticallyupward from ground level, such that it has zero speed when itreaches the top of the building. When the two balls pass each other,which ball has the greater speed, or do they have the same speed?Explain. Where will the two balls be when they are alongside eachother: at height above the ground, below this height, or abovethis height? Explain.Q2.21 An object is thrown straight up into the air and feels no airresistance. How is it possible for the object to have an accelerationwhen it has stopped moving at its highest point?Q2.22 When you drop an object from a certain height, it takes timeT to reach the ground with no air resistance. If you dropped it fromthree times that height, how long (in terms of T ) would it take toreach the ground?
EXERCISESSection 2.1 Displacement, Time, and Average Velocity2.1 . A car travels in the �x-direction on a straight and levelroad. For the first 4.00 s of its motion, the average velocity of thecar is . How far does the car travel in 4.00 s?2.2 .. In an experiment, a shearwater (a seabird) was taken fromits nest, flown 5150 km away, and released. The bird found its wayback to its nest 13.5 days after release. If we place the origin in thenest and extend the to the release point, what was thebird’s average velocity in (a) for the return flight, and (b) forthe whole episode, from leaving the nest to returning?2.3 .. Trip Home. You normally drive on the freeway betweenSan Diego and Los Angeles at an average speed of
and the trip takes 2 h and 20 min. On a Friday after-noon, however, heavy traffic slows you down and you drive thesame distance at an average speed of only How much longer does the trip take?2.4 .. From Pillar to Post. Starting from a pillar, you run 200 meast (the ) at an average speed of and thenrun 280 m west at an average speed of to a post. Calculate(a) your average speed from pillar to post and (b) your averagevelocity from pillar to post.
4.0 m>s5.0 m>s,+x-direction
143 mi>h2.70 km>h
165 mi>h2,105 km>h
m>s+x-axis
vav-x = 6.25 m>s
h>2
v0v0
2.5 . Starting from the front door of your ranch house, you walk60.0 m due east to your windmill, and then you turn around andslowly walk 40.0 m west to a bench where you sit and watch thesunrise. It takes you 28.0 s to walk from your house to the wind-mill and then 36.0 s to walk from the windmill to the bench. Forthe entire trip from your front door to the bench, what are (a) youraverage velocity and (b) your average speed?2.6 .. A Honda Civic travels in a straight line along a road. Itsdistance x from a stop sign is given as a function of time t by theequation where and
Calculate the average velocity of the car for eachtime interval: (a) to (b) to (c) to
Section 2.2 Instantaneous Velocity2.7 . CALC A car is stopped at a traffic light. It then travels alonga straight road so that its distance from the light is given by
where and (a)Calculate the average velocity of the car for the time interval to (b) Calculate the instantaneous velocity of the car at
and (c) How long after starting fromrest is the car again at rest?2.8 . CALC A bird is flying due east. Its distance from a tall build-ing is given by What is the instantaneous velocity of the bird when ?2.9 .. A ball moves in a straight line (the x-axis). The graph in Fig. E2.9 shows this ball’s velocity as a function of time. (a) What arethe ball’s average speed and average velocity during the first 3.0 s?(b) Suppose that the ball moved in such a way that the graph seg-ment after 2.0 s was instead of Find the ball’saverage speed and average velocity in this case.
+3.0 m>s.-3.0 m>s
t = 8.00 sx1t2 = 28.0 m + 112.4 m>s2t - 10.0450 m>s32t3.
t = 10.0 s.t = 5.0 s,t = 0,t = 10.0 s.
t = 0c = 0.120 m>s3.b = 2.40 m>s2x1t2 = bt 2 - ct 3,
t = 4.00 s.t = 2.00 st = 4.00 s;t = 0t = 2.00 s;t = 0
0.0500 m>s3.b =a = 1.50 m>s2x1t2 = at 2 - bt 3,
vx (m/s)
3.0
2.0
1.0
t (s)1.0 2.0 3.0O
Figure E2.9
1 2 3 4 5 6 7 8t (min)
O
400
300
200
100
x (m)
III
IIIIV
V
Figure E2.10
2.10 . A physics professor leaves her house and walks along thesidewalk toward campus. After 5 min it starts to rain and shereturns home. Her distance from her house as a function of time isshown in Fig. E2.10. At which of the labeled points is her velocity(a) zero? (b) constant and positive? (c) constant and negative? (d) increasing in magnitude? (e) decreasing in magnitude?

Exercises 61
is the velocity of the turtle zero? (c) How long after starting does ittake the turtle to return to its starting point? (d) At what times t isthe turtle a distance of 10.0 cm from its starting point? What is thevelocity (magnitude and direction) of the turtle at each of thesetimes? (e) Sketch graphs of x versus t, versus t, and versus t,for the time interval to 2.16 . An astronaut has left the International Space Station to testa new space scooter. Her partner measures the following velocitychanges, each taking place in a 10-s interval. What are the magni-tude, the algebraic sign, and the direction of the average accelera-tion in each interval? Assume that the positive direction is to theright. (a) At the beginning of the interval the astronaut is movingtoward the right along the x-axis at and at the end of theinterval she is moving toward the right at (b) At thebeginning she is moving toward the left at and at the endshe is moving toward the left at (c) At the beginning sheis moving toward the right at and at the end she is mov-ing toward the left at 2.17 . CALC A car’s velocity as a function of time is given by
where and (a)Calculate the average acceleration for the time interval to
(b) Calculate the instantaneous acceleration for and (c) Draw and graphs for the car’s motionbetween and 2.18 .. CALC The position of the front bumper of a test car under microprocessor control is given by
(a) Find its position and accel-eration at the instants when the car has zero velocity. (b) Draw x-t,
and graphs for the motion of the bumper between and
Section 2.4 Motion with Constant Acceleration2.19 .. An antelope moving with constant acceleration covers thedistance between two points 70.0 m apart in 7.00 s. Its speed as itpasses the second point is (a) What is its speed at thefirst point? (b) What is its acceleration?2.20 .. BIO Blackout? A jet fighter pilot wishes to acceleratefrom rest at a constant acceleration of 5g to reach Mach 3 (threetimes the speed of sound) as quickly as possible. Experimentaltests reveal that he will black out if this acceleration lasts for morethan 5.0 s. Use for the speed of sound. (a) Will the periodof acceleration last long enough to cause him to black out? (b)What is the greatest speed he can reach with an acceleration of 5gbefore blacking out?2.21 . A Fast Pitch. The fastest measured pitched baseball leftthe pitcher’s hand at a speed of If the pitcher was incontact with the ball over a distance of 1.50 m and produced con-stant acceleration, (a) what acceleration did he give the ball, and(b) how much time did it take him to pitch it?2.22 .. A Tennis Serve. In the fastest measured tennis serve,the ball left the racquet at A served tennis ball is typi-cally in contact with the racquet for 30.0 ms and starts from rest.Assume constant acceleration. (a) What was the ball’s accelera-tion during this serve? (b) How far did the ball travel during theserve?2.23 .. BIO Automobile Airbags. The human body can survivean acceleration trauma incident (sudden stop) if the magnitudeof the acceleration is less than If you are in an auto-mobile accident with an initial speed of and you are stopped by an airbag that inflates from the dashboard,over what distance must the airbag stop you for you to survivethe crash?
165 mi>h2105 km>h250 m>s2.
73.14 m>s.
45.0 m>s.
331 m>s
15.0 m>s.
t = 2.00 s.t = 0ax-tvx-t,
10.100 m>s62t 6.14.80 m>s22t 2 -x1t2 = 2.17 m +
t = 5.00 s.t = 0ax-tvx-tt = 5.00 s.
t = 0t = 5.00 s.t = 0
b = 0.100 m>s3.a = 3.00 m>sa + bt 2,vx1t2 =
15.0 m>s.15.0 m>s,
15.0 m>s.5.0 m>s,
5.0 m>s.15.0 m>s,
t = 40 s.t = 0axvx
40302010
A
1 2 3 4 5 6 7 8 9 10E
F G
BC
D
t (s)
x (m)
O
Figure E2.11
2.11 .. A test car travels in a straight line along the x-axis. Thegraph in Fig. E2.11 shows the car’s position x as a function oftime. Find its instantaneous velocity at points A through G.
2.13 . The Fastest (and Most Expensive) Car! The tableshows test data for the Bugatti Veyron, the fastest car made. Thecar is moving in a straight line (the x-axis).
O 10 20 30t (s)
405 15 25 35
vx (km/h)
20
30
40
60
10
50
Time (s) 0 2.1 20.0 53Speed (mi h) 0 60 200 253>
(a) Make a graph of this car’s velocity (in ) as a functionof time. Is its acceleration constant? (b) Calculate the car’s averageacceleration (in ) between (i) 0 and 2.1 s; (ii) 2.1 s and 20.0 s;(iii) 20.0 s and 53 s. Are these results consistent with your graph inpart (a)? (Before you decide to buy this car, it might be helpful toknow that only 300 will be built, it runs out of gas in 12 minutes attop speed, and it costs $1.25 million!)2.14 .. CALC A race car starts from rest and travels east along a straight and level track. For the first 5.0 s of the car’s motion, the eastward component of the car’s velocity is given by
. What is the acceleration of the car when?
2.15 . CALC A turtle crawls along a straight line, which we willcall the x-axis with the positive direction to the right. The equationfor the turtle’s position as a function of time is
(a) Find the turtle’s initialvelocity, initial position, and initial acceleration. (b) At what time t12.00 cm>s2t - 10.0625 cm>s22t 2.
x1t2 = 50.0 cm +
vx = 16.0 m>svx1t2 = 10.860 m/s32t 2
m>s2
mi>hvx-t
Section 2.3 Average and Instantaneous Acceleration2.12 . Figure E2.12 shows the velocity of a solar-powered car asa function of time. The driver accelerates from a stop sign, cruisesfor 20 s at a constant speed of and then brakes to cometo a stop 40 s after leaving the stop sign. (a) Compute the averageacceleration during the following time intervals: (i) to
(ii) to (iii) to (iv)to (b) What is the instantaneous acceleration at
and at t = 35 s?t = 20 st = 40 s.t = 0
t = 30 s;t = 10 st = 40 s;t = 30 st = 10 s;t = 0
60 km>h,
Figure E2.12

62 CHAPTER 2 Motion Along a Straight Line
2.24 . BIO If a pilot accelerates at more than 4g, he begins to“gray out” but doesn’t completely lose consciousness. (a) Assum-ing constant acceleration, what is the shortest time that a jet pilotstarting from rest can take to reach Mach 4 (four times the speed ofsound) without graying out? (b) How far would the plane travelduring this period of acceleration? (Use 331 m s for the speed ofsound in cold air.)2.25 . BIO Air-Bag Injuries. During an auto accident, thevehicle’s air bags deploy and slow down the passengers more gen-tly than if they had hit the windshield or steering wheel. Accordingto safety standards, the bags produce a maximum acceleration of60g that lasts for only 36 ms (or less). How far (in meters) does aperson travel in coming to a complete stop in 36 ms at a constantacceleration of 60g?2.26 . BIO Prevention of Hip Fractures. Falls resulting in hipfractures are a major cause of injury and even death to the elderly.Typically, the hip’s speed at impact is about If this can bereduced to or less, the hip will usually not fracture. Oneway to do this is by wearing elastic hip pads. (a) If a typical pad is5.0 cm thick and compresses by 2.0 cm during the impact of a fall,what constant acceleration (in and in g’s) does the hipundergo to reduce its speed from 2.0 m s to (b) Theacceleration you found in part (a) may seem rather large, but tofully assess its effects on the hip, calculate how long it lasts.2.27 . BIO Are We Martians? It has been suggested, and notfacetiously, that life might have originated on Mars and been car-ried to the earth when a meteor hit Mars and blasted pieces of rock(perhaps containing primitive life) free of the surface. Astronomersknow that many Martian rocks have come to the earth this way.(For information on one of these, search the Internet for “ALH84001.”) One objection to this idea is that microbes would have toundergo an enormous lethal acceleration during the impact. Let usinvestigate how large such an acceleration might be. To escapeMars, rock fragments would have to reach its escape velocity of
and this would most likely happen over a distance ofabout 4.0 m during the meteor impact. (a) What would be theacceleration (in and g’s) of such a rock fragment, if the accel-eration is constant? (b) How long would this acceleration last? (c)In tests, scientists have found that over 40% of Bacillius subtilisbacteria survived after an acceleration of 450,000g. In light of youranswer to part (a), can we rule out the hypothesis that life mighthave been blasted from Mars to the earth?2.28 . Entering the Freeway. A car sits in an entrance ramp toa freeway, waiting for a break in the traffic. The driver accelerateswith constant acceleration along the ramp and onto the freeway.The car starts from rest, moves in a straight line, and has a speed of
when it reaches the end of the 120-m-longramp. (a) What is the acceleration of the car? (b) How much timedoes it take the car to travel the length of the ramp? (c) The trafficon the freeway is moving at a constant speed of What dis-tance does the traffic travel while the car is moving the length ofthe ramp?2.29 .. Launch of the Space Shuttle. At launch the spaceshuttle weighs 4.5 million pounds. When it is launched from rest, ittakes 8.00 s to reach and at the end of the first 1.00 minits speed is (a) What is the average acceleration (in
) of the shuttle (i) during the first 8.00 s, and (ii) between 8.00 sand the end of the first 1.00 min? (b) Assuming the acceleration isconstant during each time interval (but not necessarily the same inboth intervals), what distance does the shuttle travel (i) during thefirst 8.00 s, and (ii) during the interval from 8.00 s to 1.00 min?
m>s21610 km>h.
161 km>h,
20 m>s.
145 mi>h220 m>s
m>s2
5.0 km>s,
1.3 m>s?>m>s2
1.3 m>s2.0 m>s.
>
2.30 .. A cat walks in a straight line, which we shall call the x-axis with the positive direction to the right. As an observantphysicist, you make measurements of this cat’s motion and con-struct a graph of the feline’s velocity as a function of time (Fig. E2.30). (a) Find the cat’s velocity at and at
(b) What is the cat’s acceleration at AtAt (c) What distance does the cat move dur-
ing the first 4.5 s? From to (d) Sketch clear graphsof the cat’s acceleration and position as functions of time, assumingthat the cat started at the origin.
t = 7.5 s?t = 0t = 7.0 s?t = 6.0 s?
t = 3.0 s?t = 7.0 s.t = 4.0 s
2.31 .. The graph in Fig. E2.31 shows the velocity of a motorcyclepolice officer plotted as a function of time. (a) Find the instantaneousacceleration at at and at (b) How fardoes the officer go in the first 5 s? The first 9 s? The first 13 s?
t = 11 s.t = 7 s,t = 3 s,
2.32 . Two cars, A and B, movealong the x-axis. Figure E2.32 isa graph of the positions of A andB versus time. (a) In motion dia-grams (like Figs. 2.13b and2.14b), show the position, veloc-ity, and acceleration of each ofthe two cars at and (b) At what time(s),if any, do A and B have the sameposition? (c) Graph velocity ver-sus time for both A and B. (d) At what time(s), if any, do A and Bhave the same velocity? (e) At what time(s), if any, does car A passcar B? (f) At what time(s), if any, does car B pass car A?
t = 3 s.t = 1 s,t = 0,
t (s)O 1 2 3 4 5 6 7
vx(cm/s)
2
3
4
1
5
6
7
8
Figure E2.30
50
v (m/s)x
51015202530354045
O 2 4 6 8 10 12t (s)
14
Figure E2.31
1 2 3 4t (s)
A
B
20
15
10
5
x (m)
O
25
Figure E2.32

Exercises 63
2.33 .. Mars Landing. In January 2004, NASA landed explo-ration vehicles on Mars. Part of the descent consisted of the fol-lowing stages:
Stage A: Friction with the atmosphere reduced the speed fromto in 4.0 min.
Stage B: A parachute then opened to slow it down to in94 s.Stage C: Retro rockets then fired to reduce its speed to zero over adistance of 75 m.
Assume that each stage followed immediately after the precedingone and that the acceleration during each stage was constant. (a) Find the rocket’s acceleration (in ) during each stage. (b) What total distance (in km) did the rocket travel during stagesA, B, and C?2.34 . At the instant the traffic light turns green, a car that has beenwaiting at an intersection starts ahead with a constant accelerationof At the same instant a truck, traveling with a constantspeed of overtakes and passes the car. (a) How farbeyond its starting point does the car overtake the truck? (b) Howfast is the car traveling when it overtakes the truck? (c) Sketch anx-t graph of the motion of both vehicles. Take at the inter-section. (d) Sketch a graph of the motion of both vehicles.
Section 2.5 Freely Falling Bodies2.35 .. (a) If a flea can jump straight up to a height of 0.440 m,what is its initial speed as it leaves the ground? (b) How long is itin the air?2.36 .. A small rock is thrown vertically upward with a speed of
from the edge of the roof of a 30.0-m-tall building. Therock doesn’t hit the building on its way back down and lands in thestreet below. Air resistance can be neglected. (a) What is the speedof the rock just before it hits the street? (b) How much time elapsesfrom when the rock is thrown until it hits the street?2.37 . A juggler throws a bowling pin straight up with an initialspeed of 8.20 m s. How much time elapses until the bowling pinreturns to the juggler’s hand?2.38 .. You throw a glob of putty straight up toward the ceiling,which is 3.60 m above the point where the putty leaves your hand.The initial speed of the putty as it leaves your hand is . (a) What is the speed of the putty just before it strikes the ceiling?(b) How much time from when it leaves your hand does it take theputty to reach the ceiling?2.39 .. A tennis ball on Mars, where the acceleration due to grav-ity is 0.379g and air resistance is negligible, is hit directly upwardand returns to the same level 8.5 s later. (a) How high above itsoriginal point did the ball go? (b) How fast was it moving just afterbeing hit? (c) Sketch graphs of the ball’s vertical position, verticalvelocity, and vertical accelera-tion as functions of time whileit’s in the Martian air.2.40 .. Touchdown on theMoon. A lunar lander ismaking its descent to MoonBase I (Fig. E2.40). The landerdescends slowly under the retro-thrust of its descent engine. Theengine is cut off when the lan-der is 5.0 m above the surfaceand has a downward speed of
With the engine off,0.8 m>s.
9.50 m>s
>
18.0 m>s
vx-tx = 0
20.0 m>s,3.20 m>s2.
m>s2
321 km>h1600 km>h19,300 km>h
the lander is in free fall. What is the speed of the lander justbefore it touches the surface? The acceleration due to gravity onthe moon is 2.41 .. A Simple Reaction-Time Test. A meter stick is held ver-tically above your hand, with the lower end between your thumband first finger. On seeing the meter stick released, you grab it withthese two fingers. You can calculate your reaction time from thedistance the meter stick falls, read directly from the point whereyour fingers grabbed it. (a) Derive a relationship for your reactiontime in terms of this measured distance, d. (b) If the measured dis-tance is 17.6 cm, what is the reaction time?2.42 .. A brick is dropped (zero initial speed) from the roof of abuilding. The brick strikes the ground in 2.50 s. You may ignore airresistance, so the brick is in free fall. (a) How tall, in meters, is thebuilding? (b) What is the magnitude of the brick’s velocity justbefore it reaches the ground? (c) Sketch and y-t graphsfor the motion of the brick.2.43 .. Launch Failure. A 7500-kg rocket blasts off verticallyfrom the launch pad with a constant upward acceleration of
and feels no appreciable air resistance. When it hasreached a height of 525 m, its engines suddenly fail so that theonly force acting on it is now gravity. (a) What is the maximumheight this rocket will reach above the launch pad? (b) How muchtime after engine failure will elapse before the rocket comes crash-ing down to the launch pad, and how fast will it be moving justbefore it crashes? (c) Sketch and y-t graphs of therocket’s motion from the instant of blast-off to the instant justbefore it strikes the launch pad.2.44 .. A hot-air balloonist, ris-ing vertically with a constantvelocity of magnitude releases a sandbag at an instantwhen the balloon is 40.0 m abovethe ground (Fig. E2.44). After it isreleased, the sandbag is in free fall.(a) Compute the position andvelocity of the sandbag at 0.250 sand 1.00 s after its release. (b) Howmany seconds after its release willthe bag strike the ground? (c) Withwhat magnitude of velocity does itstrike the ground? (d) What is thegreatest height above the groundthat the sandbag reaches? (e)Sketch and y-t graphs forthe motion.
2.45 . BIO The rocket-driven sled Sonic Wind No. 2, used forinvestigating the physiological effects of large accelerations, runson a straight, level track 1070 m (3500 ft) long. Starting from rest,it can reach a speed of in 0.900 s. (a) Com-pute the acceleration in assuming that it is constant. (b)What is the ratio of this acceleration to that of a freely falling body(g)? (c) What distance is covered in 0.900 s? (d) A magazine articlestates that at the end of a certain run, the speed of the sleddecreased from to zero in 1.40 s and thatduring this time the magnitude of the acceleration was greater than40g. Are these figures consistent?2.46 . An egg is thrown nearly vertically upward from a pointnear the cornice of a tall building. It just misses the cornice on theway down and passes a point 30.0 m below its starting point 5.00 safter it leaves the thrower’s hand. Air resistance may be ignored.
1632 mi>h2283 m>s
m>s2,1500 mi>h2224 m>s
vy-t,ay-t,
5.00 m>s,
vy-t,ay-t,
2.25 m>s2
vy-t,ay-t,
1.6 m>s2.
5.0 m
40.0 m to ground
v 5 5.00 m/sFigure E2.44
Figure E2.40
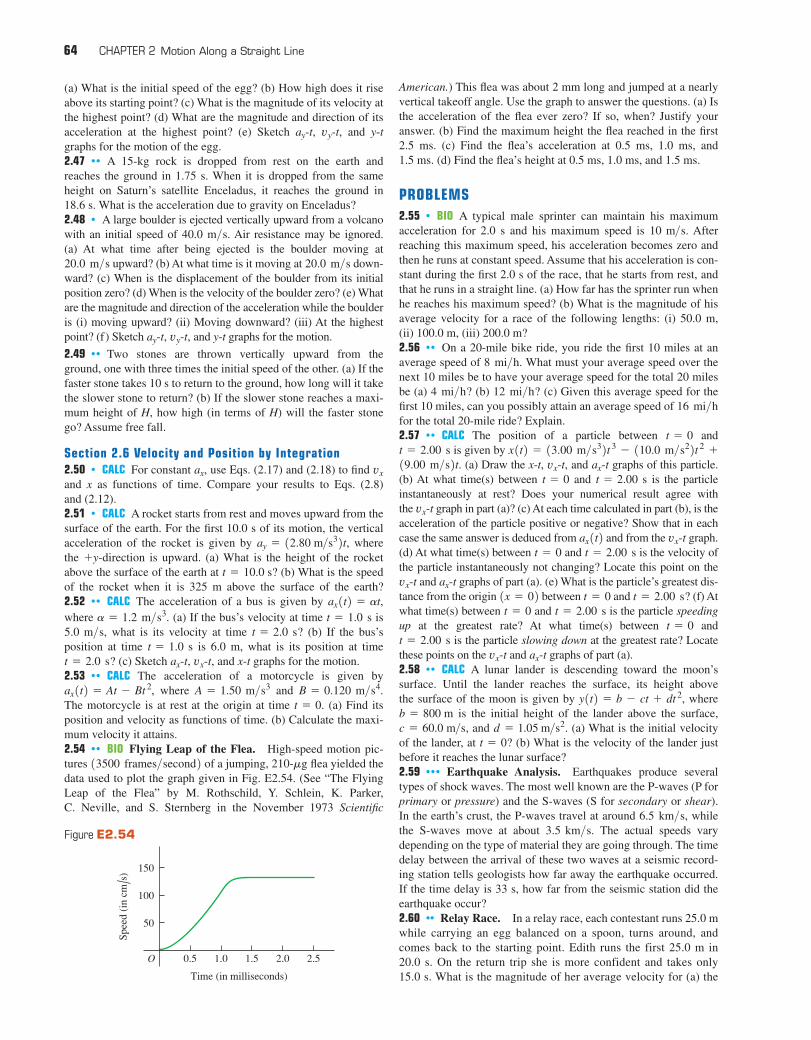
64 CHAPTER 2 Motion Along a Straight Line
(a) What is the initial speed of the egg? (b) How high does it riseabove its starting point? (c) What is the magnitude of its velocity atthe highest point? (d) What are the magnitude and direction of itsacceleration at the highest point? (e) Sketch and y-tgraphs for the motion of the egg.2.47 .. A 15-kg rock is dropped from rest on the earth andreaches the ground in 1.75 s. When it is dropped from the sameheight on Saturn’s satellite Enceladus, it reaches the ground in 18.6 s. What is the acceleration due to gravity on Enceladus?2.48 . A large boulder is ejected vertically upward from a volcanowith an initial speed of Air resistance may be ignored. (a) At what time after being ejected is the boulder moving at
upward? (b) At what time is it moving at down-ward? (c) When is the displacement of the boulder from its initialposition zero? (d) When is the velocity of the boulder zero? (e) Whatare the magnitude and direction of the acceleration while the boulderis (i) moving upward? (ii) Moving downward? (iii) At the highestpoint? (f) Sketch and y-t graphs for the motion.
2.49 .. Two stones are thrown vertically upward from theground, one with three times the initial speed of the other. (a) If thefaster stone takes 10 s to return to the ground, how long will it takethe slower stone to return? (b) If the slower stone reaches a maxi-mum height of H, how high (in terms of H) will the faster stonego? Assume free fall.
Section 2.6 Velocity and Position by Integration2.50 . CALC For constant use Eqs. (2.17) and (2.18) to find and x as functions of time. Compare your results to Eqs. (2.8) and (2.12).2.51 . CALC A rocket starts from rest and moves upward from thesurface of the earth. For the first 10.0 s of its motion, the verticalacceleration of the rocket is given by , wherethe y-direction is upward. (a) What is the height of the rocketabove the surface of the earth at ? (b) What is the speedof the rocket when it is 325 m above the surface of the earth?2.52 .. CALC The acceleration of a bus is given by where (a) If the bus’s velocity at time is
what is its velocity at time (b) If the bus’sposition at time is 6.0 m, what is its position at time
(c) Sketch and x-t graphs for the motion.2.53 .. CALC The acceleration of a motorcycle is given by
where and The motorcycle is at rest at the origin at time (a) Find itsposition and velocity as functions of time. (b) Calculate the maxi-mum velocity it attains.2.54 .. BIO Flying Leap of the Flea. High-speed motion pic-tures of a jumping, flea yielded thedata used to plot the graph given in Fig. E2.54. (See “The FlyingLeap of the Flea” by M. Rothschild, Y. Schlein, K. Parker, C. Neville, and S. Sternberg in the November 1973 Scientific
210-mg13500 frames>second2
t = 0.B = 0.120 m>s4.A = 1.50 m>s3ax1t2 = At - Bt 2,
vx-t,ax-t,t = 2.0 s?t = 1.0 s
t = 2.0 s?5.0 m>s,t = 1.0 sa = 1.2 m>s3.ax1t2 = at,
t = 10.0 s+
ay = 12.80 m>s32t
vxax,
vy-t,ay-t,
20.0 m>s20.0 m>s
40.0 m>s.
vy-t,ay-t,
American.) This flea was about 2 mm long and jumped at a nearlyvertical takeoff angle. Use the graph to answer the questions. (a) Isthe acceleration of the flea ever zero? If so, when? Justify youranswer. (b) Find the maximum height the flea reached in the first2.5 ms. (c) Find the flea’s acceleration at 0.5 ms, 1.0 ms, and 1.5 ms. (d) Find the flea’s height at 0.5 ms, 1.0 ms, and 1.5 ms.
PROBLEMS2.55 . BIO A typical male sprinter can maintain his maximumacceleration for 2.0 s and his maximum speed is Afterreaching this maximum speed, his acceleration becomes zero andthen he runs at constant speed. Assume that his acceleration is con-stant during the first 2.0 s of the race, that he starts from rest, andthat he runs in a straight line. (a) How far has the sprinter run whenhe reaches his maximum speed? (b) What is the magnitude of hisaverage velocity for a race of the following lengths: (i) 50.0 m, (ii) 100.0 m, (iii) 200.0 m?2.56 .. On a 20-mile bike ride, you ride the first 10 miles at anaverage speed of What must your average speed over thenext 10 miles be to have your average speed for the total 20 milesbe (a) (b) (c) Given this average speed for thefirst 10 miles, can you possibly attain an average speed of for the total 20-mile ride? Explain.2.57 .. CALC The position of a particle between and
is given by (a) Draw the x-t, and graphs of this particle.
(b) At what time(s) between and is the particleinstantaneously at rest? Does your numerical result agree with the graph in part (a)? (c) At each time calculated in part (b), is theacceleration of the particle positive or negative? Show that in eachcase the same answer is deduced from and from the graph.(d) At what time(s) between and is the velocity ofthe particle instantaneously not changing? Locate this point on the
and graphs of part (a). (e) What is the particle’s greatest dis-tance from the origin between and (f) Atwhat time(s) between and is the particle speedingup at the greatest rate? At what time(s) between and
is the particle slowing down at the greatest rate? Locatethese points on the and graphs of part (a).2.58 .. CALC A lunar lander is descending toward the moon’ssurface. Until the lander reaches the surface, its height above the surface of the moon is given by , where
is the initial height of the lander above the surface,, and . (a) What is the initial velocity
of the lander, at ? (b) What is the velocity of the lander justbefore it reaches the lunar surface?2.59 ... Earthquake Analysis. Earthquakes produce severaltypes of shock waves. The most well known are the P-waves (P forprimary or pressure) and the S-waves (S for secondary or shear).In the earth’s crust, the P-waves travel at around whilethe S-waves move at about The actual speeds varydepending on the type of material they are going through. The timedelay between the arrival of these two waves at a seismic record-ing station tells geologists how far away the earthquake occurred.If the time delay is 33 s, how far from the seismic station did theearthquake occur?2.60 .. Relay Race. In a relay race, each contestant runs 25.0 mwhile carrying an egg balanced on a spoon, turns around, andcomes back to the starting point. Edith runs the first 25.0 m in 20.0 s. On the return trip she is more confident and takes only15.0 s. What is the magnitude of her average velocity for (a) the
3.5 km>s.6.5 km>s,
t = 0d = 1.05 m>s2c = 60.0 m>s
b = 800 my1t2 = b - ct + dt 2
ax-tvx-tt = 2.00 s
t = 0t = 2.00 st = 0
t = 2.00 s?t = 01x = 02ax-tvx-t
t = 2.00 st = 0vx-tax1t2
vx-t
t = 2.00 st = 0ax-tvx-t,19.00 m>s2t.
x1t2 = 13.00 m>s32t 3 - 110.0 m>s22t 2 +t = 2.00 st = 0
16 mi>h12 mi>h?4 mi>h?
8 mi>h.
10 m>s.
Time (in milliseconds)
Spee
d (i
n cm
/s)
O
50
150
100
0.5 1.0 1.5 2.0 2.5
Figure E2.54

Problems 65
first 25.0 m? (b) The return trip? (c) What is her average velocityfor the entire round trip? (d) What is her average speed for theround trip?2.61 ... A rocket carrying a satellite is accelerating straight upfrom the earth’s surface. At 1.15 s after liftoff, the rocket clears thetop of its launch platform, 63 m above the ground. After an addi-tional 4.75 s, it is 1.00 km above the ground. Calculate the magni-tude of the average velocity of the rocket for (a) the 4.75-s part ofits flight and (b) the first 5.90 s of its flight.2.62 ... The graph in Fig. P2.62 describes the acceleration as afunction of time for a stone rolling down a hill starting from rest.(a) Find the stone’s velocity at and at (b) Sketch a graph of the stone’s velocity as a function of time.
t = 7.5 s.t = 2.5 s
acceleration during the last 5.1 s? (c) What is his average accelera-tion for the entire race? (d) Explain why your answer to part (c) isnot the average of the answers to parts (a) and (b).2.66 .. A sled starts from rest at the top of a hill and slides downwith a constant acceleration. At some later time the sled is 14.4 mfrom the top, 2.00 s after that it is 25.6 m from the top, 2.00 s later 40.0 m from the top, and 2.00 s later it is 57.6 m from the top. (a)What is the magnitude of the average velocity of the sled duringeach of the 2.00-s intervals after passing the 14.4-m point? (b) What is the acceleration of the sled? (c) What is the speed ofthe sled when it passes the 14.4-m point? (d) How much timedid it take to go from the top to the 14.4-m point? (e) How fardid the sled go during the first second after passing the 14.4-mpoint?2.67 . A gazelle is running in a straight line (the x-axis). Thegraph in Fig. P2.67 shows this animal’s velocity as a function oftime. During the first 12.0 s, find (a) the total distance moved and(b) the displacement of the gazelle. (c) Sketch an graphshowing this gazelle’s acceleration as a function of time for thefirst 12.0 s.
ax-t
ax(cm/s2)
t (s)O
2
3
4
1
5
6
7
8
1 2 3 4 5 6 987
Figure P2.62
2.63 .. Dan gets on Interstate Highway I–80 at Seward,Nebraska, and drives due west in a straight line and at an averagevelocity of magnitude After traveling 76 km, he reachesthe Aurora exit (Fig. P2.63). Realizing he has gone too far, he turnsaround and drives due east 34 km back to the York exit at an aver-age velocity of magnitude For his whole trip fromSeward to the York exit, what are (a) his average speed and (b) themagnitude of his average velocity?
72 km>h.
88 km>h.
Y
34 km76 km
Aurora ork Seward
N E B R A S K A
Figure P2.63
2.64 ... A subway train starts from rest at a station and acceler-ates at a rate of for 14.0 s. It runs at constant speed for70.0 s and slows down at a rate of until it stops at thenext station. Find the total distance covered.2.65 .. A world-class sprinter accelerates to his maximum speedin 4.0 s. He then maintains this speed for the remainder of a 100-mrace, finishing with a total time of 9.1 s. (a) What is the runner’saverage acceleration during the first 4.0 s? (b) What is his average
3.50 m>s21.60 m>s2
t (s)O
4.00
12.0
8.00
2.00 4.00 6.00 8.00 12.010.0
vx (m/s)
Figure P2.67
2.68 . A rigid ball traveling in a straight line (the x-axis) hits asolid wall and suddenly rebounds during a brief instant. The graph in Fig. P2.68 shows this ball’s velocity as a function of time.During the first 20.0 s of its motion, find (a) the total distance theball moves and (b) its displacement. (c) Sketch a graph of forthis ball’s motion. (d) Is the graph shown really vertical at 5.00 s?Explain.
ax-t
vx-t
10.0
20.0
220.0
210.0
30.0
O 5.0 10.0 15.0 20.0
vx (m/s)
t (s)
Figure P2.68
2.69 ... A ball starts from rest and rolls down a hill with uniformacceleration, traveling 150 m during the second 5.0 s of its motion.How far did it roll during the first 5.0 s of motion?2.70 .. Collision. The engineer of a passenger train traveling at
sights a freight train whose caboose is 200 m ahead on25.0 m>s

66 CHAPTER 2 Motion Along a Straight Line
the same track (Fig. P2.70). The freight train is traveling atin the same direction as the passenger train. The engi-
neer of the passenger train immediately applies the brakes, causinga constant acceleration of in a direction opposite to thetrain’s velocity, while the freight train continues with constantspeed. Take at the location of the front of the passenger trainwhen the engineer applies the brakes. (a) Will the cows nearby wit-ness a collision? (b) If so, where will it take place? (c) On a singlegraph, sketch the positions of the front of the passenger train andthe back of the freight train.2.71 ... Large cockroaches can run as fast as in shortbursts. Suppose you turn on the light in a cheap motel and see onescurrying directly away from you at a constant If youstart 0.90 m behind the cockroach with an initial speed of
toward it, what minimum constant acceleration wouldyou need to catch up with it when it has traveled 1.20 m, just shortof safety under a counter?2.72 .. Two cars start 200 m apart and drive toward each other ata steady On the front of one of them, an energeticgrasshopper jumps back and forth between the cars (he has stronglegs!) with a constant horizontal velocity of relative to theground. The insect jumps the instant he lands, so he spends no timeresting on either car. What total distance does the grasshoppertravel before the cars hit?2.73 . An automobile and a truck start from rest at the sameinstant, with the automobile initially at some distance behind thetruck. The truck has a constant acceleration of and theautomobile an acceleration of The automobile over-takes the truck after the truck has moved 40.0 m. (a) How muchtime does it take the automobile to overtake the truck? (b) How farwas the automobile behind the truck initially? (c) What is thespeed of each when they are abreast? (d) On a single graph, sketchthe position of each vehicle as a function of time. Take atthe initial location of the truck.2.74 ... Two stunt drivers drive directly toward each other. Attime the two cars are a distance D apart, car 1 is at rest, andcar 2 is moving to the left with speed Car 1 begins to move at
speeding up with a constant acceleration Car 2 contin-ues to move with a constant velocity. (a) At what time do the twocars collide? (b) Find the speed of car 1 just before it collides withcar 2. (c) Sketch x-t and graphs for car 1 and car 2. For eachof the two graphs, draw the curves for both cars on the same set of axes.2.75 .. A marble is released from one rim of a hemisphericalbowl of diameter 50.0 cm and rolls down and up to the oppositerim in 10.0 s. Find (a) the average speed and (b) the average veloc-ity of the marble.
vx-t
ax.t = 0,v0.
t = 0
x = 0
3.40 m>s2.2.10 m>s2,
15 m>s
10 m>s.
0.80 m>s
1.50 m>s.
1.50 m>s
x = 0
0.100 m>s2
15.0 m>s
2.76 .. CALC An object’s velocity is measured to be where and At the
object is at (a) Calculate the object’s position and accelerationas functions of time. (b) What is the object’s maximum positive dis-placement from the origin?2.77 .. Passing. The driver of a car wishes to pass a truck that istraveling at a constant speed of (about ). Ini-tially, the car is also traveling at and its front bumper is24.0 m behind the truck’s rear bumper. The car accelerates at aconstant then pulls back into the truck’s lane when therear of the car is 26.0 m ahead of the front of the truck. The car is4.5 m long and the truck is 21.0 m long. (a) How much time isrequired for the car to pass the truck? (b) What distance does thecar travel during this time? (c) What is the final speed of the car?2.78 .. On Planet X, you drop a25-kg stone from rest and measureits speed at various times. Thenyou use the data you obtained toconstruct a graph of its speed as afunction of time t (Fig. P2.78).From the information in the graph,answer the following questions: (a)What is g on Planet X? (b) Anastronaut drops a piece of equip-ment from rest out of the landingmodule, 3.5 m above the surface of Planet X. How long will it takethis equipment to reach the ground, and how fast will it be movingwhen it gets there? (c) How fast would an astronaut have to projectan object straight upward to reach a height of 18.0 m above therelease point, and how long would it take to reach that height?2.79 ... CALC The acceleration of a particle is given by
(a) Find the initial velocity suchthat the particle will have the same x-coordinate at as ithad at (b) What will be the velocity at 2.80 . Egg Drop. You are onthe roof of the physics building,46.0 m above the ground (Fig.P2.80). Your physics professor,who is 1.80 m tall, is walkingalongside the building at a con-stant speed of If youwish to drop an egg on your pro-fessor’s head, where should theprofessor be when you releasethe egg? Assume that the egg isin free fall.2.81 . A certain volcano onearth can eject rocks vertically toa maximum height H. (a) Howhigh (in terms of H) would these rocks go if a volcano on Marsejected them with the same initial velocity? The acceleration dueto gravity on Mars is and you can neglect air resistanceon both planets. (b) If the rocks are in the air for a time T on earth,for how long (in terms of T) will they be in the air on Mars?2.82 .. An entertainer juggles balls while doing other activities.In one act, she throws a ball vertically upward, and while it is inthe air, she runs to and from a table 5.50 m away at a constantspeed of returning just in time to catch the falling ball.(a) With what minimum initial speed must she throw the ballupward to accomplish this feat? (b) How high above its initialposition is the ball just as she reaches the table?
2.50 m>s,
3.71 m>s2,
1.20 m>s.
t = 4.00 s?t = 0.t = 4.00 s
v0x-2.00 m>s2 + 13.00 m>s32t.ax1t2 =
v
0.600 m>s2,
20.0 m>s45 mi>h20.0 m>s
x = 0.t = 0b = 2.00 m>s3.a = 4.00 m>sa - bt 2,vx1t2 =
200 m
vPT 5 25.0 m/s
a 5 20.100 m/s2
vFT 5 15.0 m/s
302010
1 2t (s)
v (m/s)
O
1.80 m
v 5 1.20 m/s
46.0 m
Figure P2.70
Figure P2.80
Figure P2.78

Challenge Problems 67
2.83 . Visitors at an amusement park watch divers step off a plat-form 21.3 m above a pool of water. According to theannouncer, the divers enter the water at a speed of
Air resistance may be ignored. (a) Is the announcer cor-rect in this claim? (b) Is it possible for a diver to leap directlyupward off the board so that, missing the board on the way down,she enters the water at If so, what initial upward speedis required? Is the required initial speed physically attainable?2.84 ... A flowerpot falls off a windowsill and falls past the win-dow below. You may ignore air resistance. It takes the pot 0.420 s topass from the top to the bottom of this window, which is 1.90 mhigh. How far is the top of the window below the windowsill fromwhich the flowerpot fell?2.85 ... Look Out Below. Sam heaves a 16-lb shot straightupward, giving it a constant upward acceleration from rest of
for 64.0 cm. He releases it 2.20 m above the ground.You may ignore air resistance. (a) What is the speed of the shotwhen Sam releases it? (b) How high above the ground does it go?(c) How much time does he have to get out of its way before itreturns to the height of the top of his head, 1.83 m above theground?2.86 ... A Multistage Rocket. In the first stage of a two-stagerocket, the rocket is fired from the launch pad starting from rest butwith a constant acceleration of upward. At 25.0 s afterlaunch, the second stage fires for 10.0 s, which boosts the rocket’svelocity to upward at 35.0 s after launch. This firinguses up all the fuel, however, so after the second stage has finishedfiring, the only force acting on the rocket is gravity. Air resistancecan be neglected. (a) Find the maximum height that the stage-tworocket reaches above the launch pad. (b) How much time after theend of the stage-two firing will it take for the rocket to fall back tothe launch pad? (c) How fast will the stage-two rocket be movingjust as it reaches the launch pad?2.87 .. Juggling Act. A juggler performs in a room whose ceil-ing is 3.0 m above the level of his hands. He throws a ball upwardso that it just reaches the ceiling. (a) What is the initial velocity ofthe ball? (b) What is the time required for the ball to reach the ceil-ing? At the instant when the first ball is at the ceiling, the jugglerthrows a second ball upward with two-thirds the initial velocity ofthe first. (c) How long after the second ball is thrown do the twoballs pass each other? (d) At what distance above the juggler’shand do they pass each other?2.88 .. A physics teacher performing an outdoor demonstrationsuddenly falls from rest off a high cliff and simultaneously shouts“Help.” When she has fallen for 3.0 s, she hears the echo of hershout from the valley floor below. The speed of sound is (a) How tall is the cliff? (b) If air resistance is neglected, how fastwill she be moving just before she hits the ground? (Her actualspeed will be less than this, due to air resistance.)2.89 ... A helicopter carrying Dr. Evil takes off with a constantupward acceleration of Secret agent Austin Powersjumps on just as the helicopter lifts off the ground. After the twomen struggle for 10.0 s, Powers shuts off the engine and steps outof the helicopter. Assume that the helicopter is in free fall after itsengine is shut off, and ignore the effects of air resistance. (a) Whatis the maximum height above ground reached by the helicopter?(b) Powers deploys a jet pack strapped on his back 7.0 s after leav-ing the helicopter, and then he has a constant downward accelera-tion with magnitude How far is Powers above theground when the helicopter crashes into the ground?2.90 .. Cliff Height. You are climbing in the High Sierra whereyou suddenly find yourself at the edge of a fog-shrouded cliff. To
2.0 m>s2.
5.0 m>s2.
340 m>s.
132.5 m>s
3.50 m>s2
35.0 m>s2
25.0 m>s?
125 m>s2.56 mi>h
170 ft2
find the height of this cliff, you drop a rock from the top and 10.0 slater hear the sound of it hitting the ground at the foot of the cliff.(a) Ignoring air resistance, how high is the cliff if the speed ofsound is (b) Suppose you had ignored the time it takesthe sound to reach you. In that case, would you have overestimatedor underestimated the height of the cliff? Explain your reasoning.2.91 ... Falling Can. A painter is standing on scaffolding that israised at constant speed. As he travels upward, he accidentallynudges a paint can off the scaffolding and it falls 15.0 m to theground. You are watching, and measure with your stopwatch that ittakes 3.25 s for the can to reach the ground. Ignore air resistance.(a) What is the speed of the can just before it hits the ground? (b)Another painter is standing on a ledge, with his hands 4.00 m abovethe can when it falls off. He has lightning-fast reflexes and if thecan passes in front of him, he can catch it. Does he get the chance?2.92 .. Determined to test the law of gravity for himself, a studentwalks off a skyscraper 180 m high, stopwatch in hand, and starts hisfree fall (zero initial velocity). Five seconds later, Superman arrivesat the scene and dives off the roof to save the student. Supermanleaves the roof with an initial speed that he produces by pushinghimself downward from the edge of the roof with his legs of steel.He then falls with the same acceleration as any freely falling body.(a) What must the value of be so that Superman catches the stu-dent just before they reach the ground? (b) On the same graph,sketch the positions of the student and of Superman as functions oftime. Take Superman’s initial speed to have the value calculated inpart (a). (c) If the height of the skyscraper is less than some mini-mum value, even Superman can’t reach the student before he hits theground. What is this minimum height?2.93 ... During launches, rockets often discard unneeded parts. Acertain rocket starts from rest on the launch pad and acceleratesupward at a steady When it is 235 m above the launchpad, it discards a used fuel canister by simply disconnecting it.Once it is disconnected, the only force acting on the canister isgravity (air resistance can be ignored). (a) How high is the rocketwhen the canister hits the launch pad, assuming that the rocket doesnot change its acceleration? (b) What total distance did the canistertravel between its release and its crash onto the launch pad?2.94 .. A ball is thrown straight up from the ground with speed
. At the same instant, a second ball is dropped from rest from aheight H, directly above the point where the first ball was thrownupward. There is no air resistance. (a) Find the time at which thetwo balls collide. (b) Find the value of H in terms of and g sothat at the instant when the balls collide, the first ball is at the high-est point of its motion.2.95 . CALC Two cars, A and B, travel in a straight line. The dis-tance of A from the starting point is given as a function of time by
with and Thedistance of B from the starting point is with
and (a) Which car is ahead justafter they leave the starting point? (b) At what time(s) are the carsat the same point? (c) At what time(s) is the distance from A to Bneither increasing nor decreasing? (d) At what time(s) do A and Bhave the same acceleration?
CHALLENGE PROBLEMS2.96 ... In the vertical jump, an athlete starts from a crouch andjumps upward to reach as high as possible. Even the best athletesspend little more than 1.00 s in the air (their “hang time”). Treatthe athlete as a particle and let be his maximum height abovethe floor. To explain why he seems to hang in the air, calculate the
ymax
d = 0.20 m>s3.g = 2.80 m>s2xB1t2 = gt 2 - dt 3,b = 1.20 m>s2.a = 2.60 m>sxA1t2 = at + bt 2,
v0
v0
3.30 m>s2.
v0
v0
330 m>s?

68 CHAPTER 2 Motion Along a Straight Line
ratio of the time he is above to the time it takes him to gofrom the floor to that height. You may ignore air resistance.2.97 ... Catching the Bus. A student is running at her top speedof to catch a bus, which is stopped at the bus stop. Whenthe student is still 40.0 m from the bus, it starts to pull away, mov-ing with a constant acceleration of (a) For how muchtime and what distance does the student have to run at before she overtakes the bus? (b) When she reaches the bus, howfast is the bus traveling? (c) Sketch an x-t graph for both the stu-dent and the bus. Take at the initial position of the student.(d) The equations you used in part (a) to find the time have a sec-ond solution, corresponding to a later time for which the studentand bus are again at the same place if they continue their specifiedmotions. Explain the significance of this second solution. How fastis the bus traveling at this point? (e) If the student’s top speed is
will she catch the bus? (f) What is the minimum speedthe student must have to just catch up with the bus? For what timeand what distance does she have to run in that case?2.98 ... An alert hiker sees a boulder fall from the top of a distantcliff and notes that it takes 1.30 s for the boulder to fall the lastthird of the way to the ground. You may ignore air resistance.
3.5 m>s,
x = 0
5.0 m>s0.170 m>s2.
5.0 m>s
ymax>2 (a) What is the height of the cliff in meters? (b) If in part (a) youget two solutions of a quadratic equation and you use one for youranswer, what does the other solution represent?2.99 ... A ball is thrown straight up from the edge of the roof of abuilding. A second ball is dropped from the roof 1.00 s later. Youmay ignore air resistance. (a) If the height of the building is 20.0 m, what must the initial speed of the first ball be if both are tohit the ground at the same time? On the same graph, sketch theposition of each ball as a function of time, measured from whenthe first ball is thrown. Consider the same situation, but now let theinitial speed of the first ball be given and treat the height h ofthe building as an unknown. (b) What must the height of the build-ing be for both balls to reach the ground at the same time (i) if is
and (ii) if is (c) If is greater than somevalue a value of h does not exist that allows both balls to hitthe ground at the same time. Solve for The value has asimple physical interpretation. What is it? (d) If is less thansome value a value of h does not exist that allows both ballsto hit the ground at the same time. Solve for The value also has a simple physical interpretation. What is it?
vminvmin.vmin,
v0
vmaxvmax.vmax,
v09.5 m>s?v06.0 m>sv0
v0
Chapter Opening Question ?Yes. Acceleration refers to any change in velocity, including bothspeeding up and slowing down.
Test Your Understanding Questions2.1 Answer to (a): (iv), (i) and (iii) (tie), (v), (ii); answer to (b): (i)and (iii); answer to (c): (v) In (a) the average x-velocity is
For all five trips, For the individual trips,we have (i) (ii)
(iii)(iv)
(v) In (b) both have
2.2 Answers: (a) P, Q and S (tie), R The x-velocity is (b) positivewhen the slope of the x-t graph is positive (P), (c) negative whenthe slope is negative (R), and (d) zero when the slope is zero (Q and S). (e) R, P, Q and S (tie) The speed is greatest when theslope of the x-t graph is steepest (either positive or negative) andzero when the slope is zero.2.3 Answers: (a) S, where the x-t graph is curved upward (con-cave up). (b) Q, where the x-t graph is curved downward (concavedown). (c) P and R, where the x-t graph is not curved either up ordown. (d) At (velocity is not changing); at Q, ax 6 0P, ax = 0
vav-x = +50 km>h.vav-x = 0.¢x = -20 km + 20 km = 0,
vav-x = +70 km>h;¢x = +70 km,+50 km>h;vav-x =¢x = 60 km - 10 km = +50 km,vav-x = -50 km>h;
¢x = -50 km,vav-x = +50 km>h;¢x = +50 km,¢t = 1 h.vav-x = ¢x>¢t.
(velocity is decreasing, i.e., changing from positive to zero to neg-ative); at (velocity is not changing); and at (velocity is increasing, i.e., changing from negative to zero to pos-itive).2.4 Answer: (b) The officer’s x-acceleration is constant, so her
graph is a straight line, and the officer’s motorcycle is movingfaster than the motorist’s car when the two vehicles meet at
2.5 Answers: (a) (iii) Use Eq. (2.13) with x replaced by y andThe starting height is
and the y-velocity at the maximum height is so and If the initial y-velocity is increased by
a factor of 2, the maximum height increases by a factor of and the ball goes to height 4h. (b) (v) Use Eq. (2.8) with x replacedby y and The y-velocity at the maximumheight is so and If the initial y-velocity is increased by a factor of 2, the time to reach the maxi-mum height increases by a factor of 2 and becomes 2t.2.6 Answer: (ii) The acceleration is equal to the slope of the
graph. If is increasing, the slope of the graph is alsoincreasing and the graph is concave up.
Bridging ProblemAnswer: h = 57.1 m
vx-taxvx-tax
t = v0y>g.0 = v0y - gtvy = 0,vy = v0y - gt.ay = g;
22 = 4h = v0y
2>2g.v0y2 - 2gh
0 =vy = 0,y = hy0 = 0vy
2 = v0y2 - 2g1y - y02.ay = g;
t = 10 s.
vx-t
S, ax 7 0R, ax = 0
Answers