Early Anthropogenic Soil Formation at Tofts Ness, Sanday, Orkney
Upload
independentCategory
view
4download
0
*Corresponding author. Tel.: #34-93-4095410; fax: #34-93-4110012.
E-mail address: [email protected] (X. Querol).
Atmospheric Environment 35 (2001) 845}858
Monitoring of PM10 and PM2.5 around primary particulateanthropogenic emission sources
Xavier Querol!,*, AndreH s Alastuey!, Sergio Rodriguez!, Felicia Plana!,Enrique Mantilla", Carmen R. Ruiz#
!Instituto de Ciencias de la Tierra **Jaume Almera++, CSIC, C/Lluis Sole& Sabarn&s, s/n, 08028 Barcelona, Spain"Centro de Estudios Ambientales del Mediterra& neo, CEAM. Parque tecnolo& gico, C-4, sector oeste, 46980 Paterna (Valencia), Spain
#Instituto de Carboqun&mica, CSIC, C/Marn&a de Luna 12, 50015 Zaragoza, Spain
Received 29 February 2000; accepted 18 July 2000
Abstract
Investigations on the monitoring of ambient air levels of atmospheric particulates were developed around a largesource of primary anthropogenic particulate emissions: the industrial ceramic area in the province of CastelloH (EasternSpain). Although these primary particulate emissions have a coarse grain-size distribution, the atmospheric transportdominated by the breeze circulation accounts for a grain-size segregation, which results in ambient air particles occurringmainly in the 2.5}10lm range. The chemical composition of the ceramic particulate emissions is very similar to thecrustal end-member but the use of high Al, Ti and Fe as tracer elements as well as a peculiar grain-size distribution in theinsoluble major phases allow us to identify the ceramic input in the bulk particulate matter. PM2.5 instead of PM10monitoring may avoid the interference of crustal particles without a major reduction in the secondary anthropogenicload, with the exception of nitrate. However, a methodology based in PM2.5 measurement alone is not adequate formonitoring the impact of primary particulate emissions (such as ceramic emissions) on air quality, since the majorambient air particles derived from these emissions are mainly in the range of 2.5}10lm. Consequently, in areascharacterised by major secondary particulate emissions, PM2.5 monitoring should detect anthropogenic particulatepollutants without crustal particulate interference, whereas PM10 measurements should be used in areas with majorprimary anthropogenic particulate emissions. ( 2001 Elsevier Science Ltd. All rights reserved.
Keywords: Atmospheric particles; PM10; PM2.5; Ceramic emissions; Ambient air quality monitoring; Primary particles; Mediterraneanbasin
1. Introduction
Atmospheric particulates, especially secondary an-thropogenic "ne particles, have been proven to havea major impact on human health (Dockery and Pope,1996). For many years, the atmospheric particulate stan-dards of many countries were based on the mass concen-tration measurement of the total suspended particles
(TSP). Since an important mass fraction of TSP is madeof non-inhalable particles with a lower impact on respir-atory and cardiovascular diseases, the relationship be-tween health e!ects and TSP levels was found to be muchlower than the levels of atmospheric particulates "nerthan 10, 2.5 or 1lm (PM10, PM2.5 and PM1, respec-tively), on comparison. This was the reason for the ap-plication of PM10 and PM2.5 measurements to the USambient air quality standards (US-EPA, 1987 for PM10;US-EPA, 1996 for PM2.5). Although a decade later,the European Union (EU) countries have followed thesame trend of replacing ambient air standards basedon TSP by PM10 standards. Currently, the incorpora-tion of ambient air standards based on PM2.5 is also
AEA=3126=Durai=Venkatachala=BG
1352-2310/01/$ - see front matter ( 2001 Elsevier Science Ltd. All rights reserved.PII: S 1 3 5 2 - 2 3 1 0 ( 0 0 ) 0 0 3 8 7 - 3
Fig. 1. Location of major ceramic production areas and "xedsampling stations for PM10/PM2.5 measurements.
being considered in the EU (EU Directive 1999/30/EC,1999)
Another important pattern of atmospheric partic-ulates, which is still not considered in ambient air stan-dards, is the chemical composition of TSP, PM10, PM2.5and PM1. Major secondary acidic aerosols and hazard-ous organic particulates are "ne-grained. Generally, in-organic secondary aerosols are in the (0.5lm (sulphateand nitrate) and 0.5}5.0lm (a fraction of nitrate) sizerange (Mildford and Davidson, 1987), marine aerosolsalts have a major fraction in the range of 1.0}5.0lm,whereas, primary natural particles, mainly made of Al}Siminerals (clay minerals, quartz, feldspars) and calciumand magnesium carbonates, have a major proportion inthe 5}25lm range. The carbon contents of atmosphericparticulates have a bimodal grain-size distribution with amode in the (2.5lm (corresponding to anthropogenicorganic particles) and '10lm (corresponding to mineralcarbonates). Primary anthropogenic particulate emissionsare also usually in the '2.5lm range.
At a global scale, the anthropogenic emissions donot exceed the 10% of the global particulate emissions,whereas the natural primary emissions reach the 84%(2.9]109 t yr~1, after Kiehl and Rhode, 1995; IPCC,1996). Concerning the global anthropogenic particulateemissions, the secondary aerosols exceed the primaryparticulate emissions (0.26]109 and 0.11]109 t yr~1).Consequently, the global emissions of natural partic-ulates are mainly primary, whereas, the anthropogenicemissions are predominantly secondary.
Future trends for particulate monitoring strategiestend to monitor PM2.5 rather than PM10 because of itsmore direct relationship with health e!ects and to avoidnatural particulate interference. However, industrial ac-tivities with high primary particulate emissions, such ascement, concrete, ceramics or the mining sectors, mayhave a great impact on the ambient air quality due totheir intensive particulate emissions in the 2.5}10lmrange. Moreover, these emissions usually have a chemicalcomposition similar to that of natural crustal emissions(high Ca, Al, Si, Fe, K proportions), which impedes theappropriate monitoring of ambient air particulate levels.
This paper introduces the results obtained from a re-search project supported by the Spanish Ministry of theEnvironment and the CICYT (ComisioH n Interministerialde Ciencia y TecnologmHa) to develop source apportion-ment analyses of PM10 and PM2.5 focussed on thespeci"c atmospheric and geographical characteristics ofSpain. The present study focuses on the evaluation of thephysico-chemical patterns of ambient air particulatematter in ceramic industrial zones. In these areas, al-though high levels of secondary particulates may beemitted, the largest source contribution in high partic-ulate events is due to primary emissions of mineral mat-ter from atomiser plants and fugitive emissions frompiling stock. Continuous grain-size analysis of TSP from
di!erent sources and simultaneous PM2.5 and PM10sampling and analysis were carried out to de"ne the bestparameter for monitoring the impact of ceramic indus-trial emissions on ambient air quality.
2. The study area
The ceramic industrial areas of L'Alcora, Onda andVilareal spread along the Millars river basin from thecoast to the interior of the CastelloH Province in EasternSpain (Fig. 1). The CastelloH industrial area is the secondlargest ceramic-producing zone in the world, accountingfor 17% of the world's basic ceramic production(600]106m2yr~1). The supply of clays for the industrycomes mainly from an open-pit mine at a Triassic redkaolinite-rich clay deposit in Sant Joan de MoroH (east ofthe city of L'Alcora, Fig. 1) and from the Cretaceouskaolinite-rich deposits in the province of Teruel. In a mi-nor proportion, a large variety of other natural andsynthetic products, such as feldspars, melting phases and
Aea=3126=Durai=VVC
846 X. Querol et al. / Atmospheric Environment 35 (2001) 845}858
Table 1Location of the "xed monitoring and sampling stations
Sampling site Location Latitude Longitude
Mt. Bartolo Telecom antenna peak 40305@09@@N 00301@53@@WOnda Monitoring station (urban background station) 39357@43@@N 00315@43@@WVilareal Post o$ce (urban background station) 39356@34@@N 00306@25@@WGrau Monitoring station (urban background station) 39358@59@@N 00300@31@@WL'Alcora Council house (urban background station) 40305@09@@N 00301@53@@W
colourants, are also broadly consumed. The kaolinite-rich material is "nely ground in the atomisers, whichproduces a homogeneous "ne powder ((63lm). Thisprocess coupled with the large clay consumption(20]106 t in 1998) and the large fugitive emissions fromthe storage, handling and transport of the clay, probablyaccounts for the largest fraction of the local anthropo-genic particulate emissions.
Secondary particulate emissions from the manufactur-ing of glass and enamel may account more for the emis-sion of hazardous atmospheric trace pollutants than fortheir signi"cant contribution to the bulk particulateemissions. Other particulate emission sources such asintensive road transport, frequent biomass combustionfrom intensive orange tree cropping, and marine aero-sols, must also be considered.
This puzzling particulate-emission setting is placed ina complex Mediterranean atmospheric environment. Theintensive convective dynamics, the breeze circulation,the low rainfall rate, the highly mineralised soils and thefrequent occurrence of high particulate Sahara air-massintrusions further complicate the monitoring of the an-thropogenic particulate emissions impact on ambient airquality. The study was made in July because of the largeimpact of some of the previously mentioned atmosphericenvironmental factors on the particulate levels.
In summer, the North Atlantic anticyclone becomesreinforced over the northern latitudes. Weak-gradientconditions on the Iberian Peninsula and strong groundheating give rise to the development of the Iberian ther-mal low (ITL), due to thermally induced local and meso-scale circulations, such as sea breeze, up-slope winds andconvective cells (MillaH n et al., 1991).
The study area (Fig. 1) includes the CastelloH alluvialplain (La Plana) which is limited on the north by thePalmes mountain chain (6}7km from the coast) andincludes Mt. Bartolo as its highest peak (780m.a.s.l.). TheMillars basin, with an approximate E}W direction, con-verges with the "rst range of mountains at 20 km fromthe coast.
The movement of the air masses over the eastern Coastof the Iberian Peninsula as well as the evolution of theboundary layer are strongly linked to its complex top-ography. During the daytime the sea breeze is channelled
along the bottom of the valleys up to 60}80km inland,whereas at the top of the mountains and valley slopesa combination of sea breeze and up-slope winds gives riseto a chimney e!ect, injecting air from low levels to alti-tudes ranging from a few hundred meters up to 2}3 km.The anticyclonic subsidence and the dynamics formationof the sea breeze cells favour the formation of reservoirlayers of secondary pollutants (thermally separated be-tween themselves by inversions) in the return #ow mov-ing toward the Mediterranean Sea. A compensatorysinking over the sea, due to thermal buoyancy over thewarmed terrain and anticyclonic subsidence, reinforcesthe sea-breeze circulation and prepares the reservoirlayers over the sea for re-entrance a few days later.During the evening and night, the solar-activated circula-tions cease, and a reversal in the breeze takes place.
Thus, the sea-breeze circulation in summer favoursgood ventilation conditions in the valleys but scarceair-mass renovation, due to the above-described re-circu-lations of the air masses (MillaH n et al., 1997), resultingin a potential atmospheric reservoir e!ect for secondaryair pollutants in the Western Mediterranean.
3. Methodology
3.1. Sampling sites
The following sampling and measurement sites (Fig.1 and Table 1) were selected based on the distribution ofthe major emission sources (marine, rural, urban andindustrial sites) and on the atmospheric-circulation pecu-liarities of the study area:
The Grau station is located in a rural or semi-urbanarea, which is sporadically in#uenced by the industrialand urban plumes, especially the plume from CastelloH innight-breeze conditions.
The station of the Villareal city is an urban site in thelower watercourse of the Millars, situated 10 km from thecoastline, in the centre of a zone of a large ceramic-industrial activity. This station is under the in#uence ofboth urban (mainly tra$c) and industrial emissions. Dur-ing the daytime period this location is situated leeward ofthe city and the ceramic emissions with respect to the
Aea=3126=Durai=VVC
X. Querol et al. / Atmospheric Environment 35 (2001) 845}858 847

Fig. 2. Correlation of PM10 and PM2.5 measurements betweenthe GRIMM laser spectrometer and the high-volume sampler.Solid lines indicate 1:1, dashed line is the correlation line. InPM10, correlation was performed at the following sites: (1) Solidcircles, suburban Onda station; (2) Solid triangles, rural Mona-grega station; (3) Triangles, urban Barcelona station; (4) Squares,urban L'Hospitalet station. PM2.5 correlation was performed atOnda (2 samples) and L'Hospitalet.
characteristic breeze #ow. For this reason, the contribu-tions due to tra$c emissions should be equal or moreimportant than the industrial emissions. On the otherhand, the in#uence of the ceramic emissions are expectedto predominate during the nocturnal breeze period.
The Onda station is a suburban background stationnear the city of Onda, situated in an open area, 20 kmfrom the coastline, without direct in#uence from urbanor road tra$c activities. It is situated on the leewardof the nearby ceramic industries, and in sea-breezeconditions it is also in#uenced by the coastal industrialemissions.
The L+Alcora station is located in an urban backgroundsite in the municipality of L'Alcora, in the most produc-tive ceramic zone of CastelloH . In the daytime the breezedrags the atmospheric emissions with a northwesterntransport, whereas in the nocturnal breeze phase thepreviously emitted particulates travel seawards towardsL'Alcora.
Finally, the Mt. Bartolo station is located at the top ofthe Mt. Bartolo peak. Possible anthropogenic emissionscould come from a nearby residential area and fromvarious roadways concentrated on the coastal fringe. Theobjective of using this emplacement was to provide a ver-tical gradient for discriminating possible high-altitudecontributions not present at lower levels.
Lastly, meteorological data from the air quality net-work cabins of Ermita and Penyeta and the meteorologi-cal towers of Cirat, Rambla of the Viuda and Borrianawere also used to carry out the interpretations.
3.2. Sampling and measurements
The sampling of atmospheric particulate matter wascarried out by means of high-volume samplers (DH-80and MCV-CAF, 30m3h~1) equipped with PM10 andPM2.5 DIGITEL and MCV cut-o! inlets and quartzglass "lters (QF20 Schleicher and Schuell). Daily samp-ling was made from 12 to 23 July 1999 at the "ve "xedmonitoring stations (Table 1). Furthermore, sampling ofTSP grain-size fractions (seven stages from 0.3 to'20lm) was performed for 4 days (from 11 to 23 July1999) at the Onda station by means of a Retsch PI-1cascade impactor.
Once the levels of bulk particulates were obtained byweighting the "lters using standard procedures, one-halfof each of them (PM10 and PM2.5) plus the insolublefractions of the di!erent stages of the cascade impactor(previously "ltered with MQ cellulose membrane "lters)and blank "lters were digested following the method ofQuerol et al. (1998). The soluble fraction of 1/4 ofeach "lter and the di!erent grain-size stages obtainedwith the cascade impactor were extracted with distilledwater at 803C. The last 1/4 of each "lter was usedto directly determine the total C content by LECOmethodology.
The solutions obtained were analysed by: (a) induc-tively coupled plasma-atomic emission spectrometry(ICP-AES) for major elements, (b) capillary electrophor-esis (CEF) for anions, and (c) colorimetry-#ow injectionanalysis (FIA) for NH`
4. The digestion of blank "lters
with 2}3mg of NBS-1633a reference material was used toensure analysis quality for the same levels of the sampledigestion concentrations. Relative analytical errors werebetween 3 and 10% for the elements studied.
Automatic measurements of atmospheric particulatelevels and grain-size distribution were performed withthe laser spectrometer dust monitor GRIMM 1108(Labortechnik GmbH & Co. KG) at the "xed and mobilestations. This dust monitor permits the determinationof particulate levels in 15 di!erent grain-size channelsfrom 0.3 to '20lm. The accuracy of the GRIMM-1108measurements was checked, before, during and after the"eld campaigns, by comparing the levels of simultaneousdaily PM10 and PM2.5 measurements obtained with thestandard gravimetric methodology. Fig. 2 shows goodagreement between the PM10 measurements obtained
Aea=3126=Durai=VVC
848 X. Querol et al. / Atmospheric Environment 35 (2001) 845}858
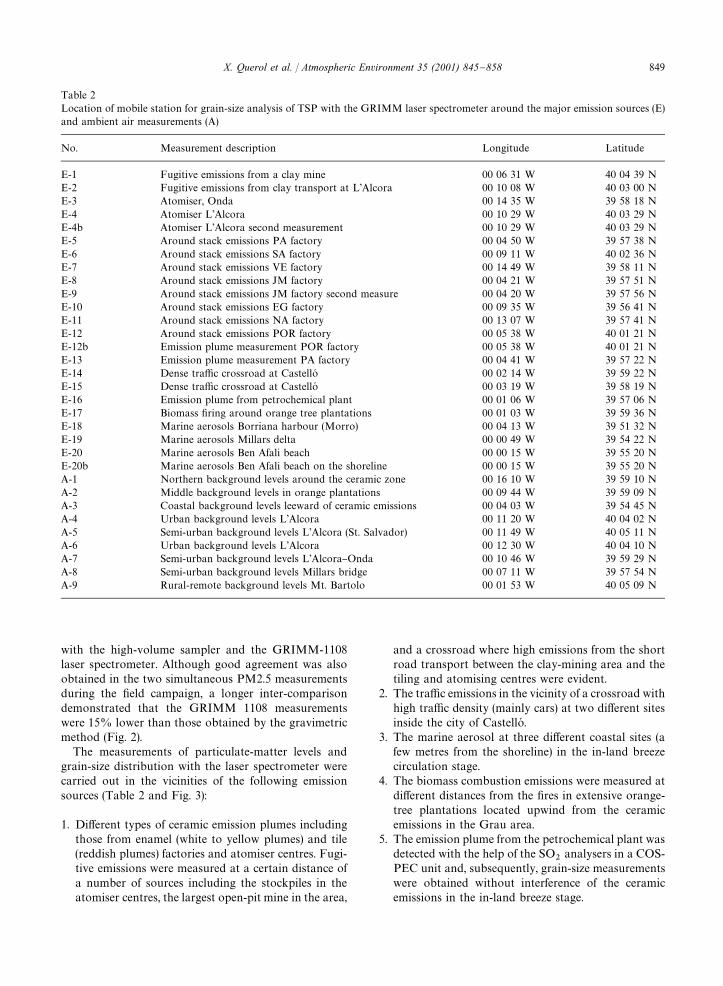
Table 2Location of mobile station for grain-size analysis of TSP with the GRIMM laser spectrometer around the major emission sources (E)and ambient air measurements (A)
No. Measurement description Longitude Latitude
E-1 Fugitive emissions from a clay mine 00 06 31 W 40 04 39 NE-2 Fugitive emissions from clay transport at L'Alcora 00 10 08 W 40 03 00 NE-3 Atomiser, Onda 00 14 35 W 39 58 18 NE-4 Atomiser L'Alcora 00 10 29 W 40 03 29 NE-4b Atomiser L'Alcora second measurement 00 10 29 W 40 03 29 NE-5 Around stack emissions PA factory 00 04 50 W 39 57 38 NE-6 Around stack emissions SA factory 00 09 11 W 40 02 36 NE-7 Around stack emissions VE factory 00 14 49 W 39 58 11 NE-8 Around stack emissions JM factory 00 04 21 W 39 57 51 NE-9 Around stack emissions JM factory second measure 00 04 20 W 39 57 56 NE-10 Around stack emissions EG factory 00 09 35 W 39 56 41 NE-11 Around stack emissions NA factory 00 13 07 W 39 57 41 NE-12 Around stack emissions POR factory 00 05 38 W 40 01 21 NE-12b Emission plume measurement POR factory 00 05 38 W 40 01 21 NE-13 Emission plume measurement PA factory 00 04 41 W 39 57 22 NE-14 Dense tra$c crossroad at CastelloH 00 02 14 W 39 59 22 NE-15 Dense tra$c crossroad at CastelloH 00 03 19 W 39 58 19 NE-16 Emission plume from petrochemical plant 00 01 06 W 39 57 06 NE-17 Biomass "ring around orange tree plantations 00 01 03 W 39 59 36 NE-18 Marine aerosols Borriana harbour (Morro) 00 04 13 W 39 51 32 NE-19 Marine aerosols Millars delta 00 00 49 W 39 54 22 NE-20 Marine aerosols Ben Afali beach 00 00 15 W 39 55 20 NE-20b Marine aerosols Ben Afali beach on the shoreline 00 00 15 W 39 55 20 NA-1 Northern background levels around the ceramic zone 00 16 10 W 39 59 10 NA-2 Middle background levels in orange plantations 00 09 44 W 39 59 09 NA-3 Coastal background levels leeward of ceramic emissions 00 04 03 W 39 54 45 NA-4 Urban background levels L'Alcora 00 11 20 W 40 04 02 NA-5 Semi-urban background levels L'Alcora (St. Salvador) 00 11 49 W 40 05 11 NA-6 Urban background levels L'Alcora 00 12 30 W 40 04 10 NA-7 Semi-urban background levels L'Alcora}Onda 00 10 46 W 39 59 29 NA-8 Semi-urban background levels Millars bridge 00 07 11 W 39 57 54 NA-9 Rural-remote background levels Mt. Bartolo 00 01 53 W 40 05 09 N
with the high-volume sampler and the GRIMM-1108laser spectrometer. Although good agreement was alsoobtained in the two simultaneous PM2.5 measurementsduring the "eld campaign, a longer inter-comparisondemonstrated that the GRIMM 1108 measurementswere 15% lower than those obtained by the gravimetricmethod (Fig. 2).
The measurements of particulate-matter levels andgrain-size distribution with the laser spectrometer werecarried out in the vicinities of the following emissionsources (Table 2 and Fig. 3):
1. Di!erent types of ceramic emission plumes includingthose from enamel (white to yellow plumes) and tile(reddish plumes) factories and atomiser centres. Fugi-tive emissions were measured at a certain distance ofa number of sources including the stockpiles in theatomiser centres, the largest open-pit mine in the area,
and a crossroad where high emissions from the shortroad transport between the clay-mining area and thetiling and atomising centres were evident.
2. The tra$c emissions in the vicinity of a crossroad withhigh tra$c density (mainly cars) at two di!erent sitesinside the city of CastelloH .
3. The marine aerosol at three di!erent coastal sites (afew metres from the shoreline) in the in-land breezecirculation stage.
4. The biomass combustion emissions were measured atdi!erent distances from the "res in extensive orange-tree plantations located upwind from the ceramicemissions in the Grau area.
5. The emission plume from the petrochemical plant wasdetected with the help of the SO
2analysers in a COS-
PEC unit and, subsequently, grain-size measurementswere obtained without interference of the ceramicemissions in the in-land breeze stage.
Aea=3126=Durai=VVC
X. Querol et al. / Atmospheric Environment 35 (2001) 845}858 849
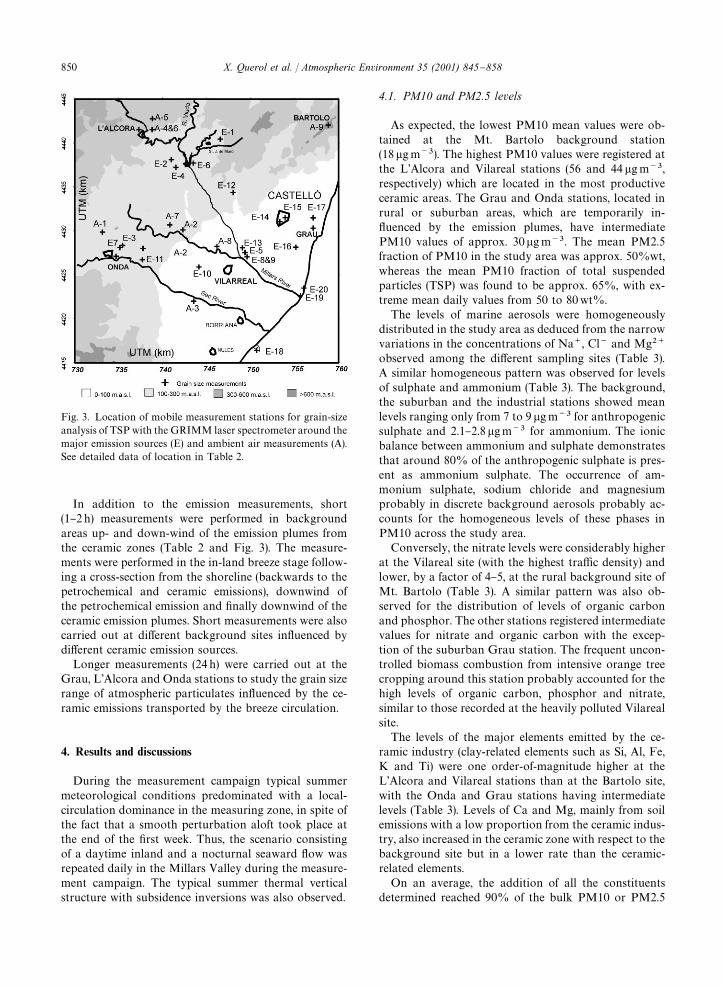
Fig. 3. Location of mobile measurement stations for grain-sizeanalysis of TSP with the GRIMM laser spectrometer around themajor emission sources (E) and ambient air measurements (A).See detailed data of location in Table 2.
In addition to the emission measurements, short(1}2h) measurements were performed in backgroundareas up- and down-wind of the emission plumes fromthe ceramic zones (Table 2 and Fig. 3). The measure-ments were performed in the in-land breeze stage follow-ing a cross-section from the shoreline (backwards to thepetrochemical and ceramic emissions), downwind ofthe petrochemical emission and "nally downwind of theceramic emission plumes. Short measurements were alsocarried out at di!erent background sites in#uenced bydi!erent ceramic emission sources.
Longer measurements (24 h) were carried out at theGrau, L'Alcora and Onda stations to study the grain sizerange of atmospheric particulates in#uenced by the ce-ramic emissions transported by the breeze circulation.
4. Results and discussions
During the measurement campaign typical summermeteorological conditions predominated with a local-circulation dominance in the measuring zone, in spite ofthe fact that a smooth perturbation aloft took place atthe end of the "rst week. Thus, the scenario consistingof a daytime inland and a nocturnal seaward #ow wasrepeated daily in the Millars Valley during the measure-ment campaign. The typical summer thermal verticalstructure with subsidence inversions was also observed.
4.1. PM10 and PM2.5 levels
As expected, the lowest PM10 mean values were ob-tained at the Mt. Bartolo background station(18lgm~3). The highest PM10 values were registered atthe L'Alcora and Vilareal stations (56 and 44 lgm~3,respectively) which are located in the most productiveceramic areas. The Grau and Onda stations, located inrural or suburban areas, which are temporarily in-#uenced by the emission plumes, have intermediatePM10 values of approx. 30lgm~3. The mean PM2.5fraction of PM10 in the study area was approx. 50%wt,whereas the mean PM10 fraction of total suspendedparticles (TSP) was found to be approx. 65%, with ex-treme mean daily values from 50 to 80wt%.
The levels of marine aerosols were homogeneouslydistributed in the study area as deduced from the narrowvariations in the concentrations of Na`, Cl~ and Mg2`
observed among the di!erent sampling sites (Table 3).A similar homogeneous pattern was observed for levelsof sulphate and ammonium (Table 3). The background,the suburban and the industrial stations showed meanlevels ranging only from 7 to 9lgm~3 for anthropogenicsulphate and 2.1}2.8lgm~3 for ammonium. The ionicbalance between ammonium and sulphate demonstratesthat around 80% of the anthropogenic sulphate is pres-ent as ammonium sulphate. The occurrence of am-monium sulphate, sodium chloride and magnesiumprobably in discrete background aerosols probably ac-counts for the homogeneous levels of these phases inPM10 across the study area.
Conversely, the nitrate levels were considerably higherat the Vilareal site (with the highest tra$c density) andlower, by a factor of 4}5, at the rural background site ofMt. Bartolo (Table 3). A similar pattern was also ob-served for the distribution of levels of organic carbonand phosphor. The other stations registered intermediatevalues for nitrate and organic carbon with the excep-tion of the suburban Grau station. The frequent uncon-trolled biomass combustion from intensive orange treecropping around this station probably accounted for thehigh levels of organic carbon, phosphor and nitrate,similar to those recorded at the heavily polluted Vilarealsite.
The levels of the major elements emitted by the ce-ramic industry (clay-related elements such as Si, Al, Fe,K and Ti) were one order-of-magnitude higher at theL'Alcora and Vilareal stations than at the Bartolo site,with the Onda and Grau stations having intermediatelevels (Table 3). Levels of Ca and Mg, mainly from soilemissions with a low proportion from the ceramic indus-try, also increased in the ceramic zone with respect to thebackground site but in a lower rate than the ceramic-related elements.
On an average, the addition of all the constituentsdetermined reached 90% of the bulk PM10 or PM2.5
Aea=3126=Durai=VVC
850 X. Querol et al. / Atmospheric Environment 35 (2001) 845}858

Table 3Mean daily major elements, carbonates, ammonium, organic#elemental carbon and bulk PM10 levels obtained at Mt. Bartolo, Grau,Onda, Vilareal and L'Alcora sampling sites
Location Bartolo Grau Onda Vilareal L'Alcora
N! 5 9 11 9 2
CO2~3
(lgm~3) 0.7 2.0 1.6 3.5 4.3Org#Elem C (lgm~3) 2.9 6.1 3.9 6.8 5.5SiO
2(lgm~3) 1.1 2.7 3.6 6.0 12.0
Al2O
3(lgm~3) 0.4 1.1 1.4 2.4 4.8
Ca (lgm~3) 0.5 1.3 1.0 2.3 2.9K (lgm~3) 0.2 0.5 0.5 0.8 1.5Mg (lgm~3) 0.2 0.3 0.2 0.4 0.4Fe (lgm~3) 0.2 0.4 0.4 0.7 1.2NO~
3(lgm~3) 0.9 2.9 1.8 3.5 1.8
NH`4
(lgm~3) 1.9 2.5 2.3 2.1 1.9SO2~
4no marine (lgm~3) 7.0 8.4 8.7 9.0 8.4
SO2~4
marine (lgm~3) 0.2 0.3 0.2 0.4 0.2Na (lgm~3) 0.8 1.2 1.0 1.4 0.9Cl~ (lgm~3) 0.2 0.8 0.4 0.9 0.5
R major elements (lgm~3) 17 31 27 41 48PM10 gravimetry (lgm~3) 19 36 32 44 56Determined (%) 91 85 85 94 86
Crustal (%) 19 27 33 40 58Secondary (%) 57 45 47 37 27Org#Elem C (%) 17 20 14 17 12Marine A (%) 7 8 6 7 4
!N, number of daily samples. The results of the source apportionment analysis including crustal sources, secondary particulates(ammonium sulphate and nitrate), organic#elemental carbon, and marine aerosols are also reported as the percentage of contributionof each source with respect to the bulk PM10 levels.
levels obtained by the gravimetric method. The resultsindicate that the mean marine aerosol input representsbetween 4 (L'Alcora) and 8 (Grau) wt% of the bulkPM10 levels (Table 3). The proportion of organic andelemental carbon, mainly proceeding from combustionprocesses, is relatively homogeneously distributed acrossthe study area with values from 12 to 20% wt of bulkPM10, with the highest values being recorded for theGrau and Vilareal sites (Table 3). The PM10 proportionfrom the crustal input (both soil and ceramic emissions)ranged from 18% of bulk PM10 at the Bartolo site, up to40}55wt% in the ceramic productive area. The Ondaand Grau sites have intermediate proportions (around30wt%). Finally, the proportion of secondary inorganicaerosols (ammonium, sulphate and nitrate) is very high atthe background site (near by 60% of bulk PM10 levels)and the Onda and Grau sites (45}50wt%), whereas in theceramic zone (Vilareal and L'Alcora) it is much lower(approx. 30wt%), the background origin of ammoniumsulphate in the study area. Thus, in the rural backgroundsite, these external phases account for most of the par-ticulate fraction, whereas this proportion is drastically
reduced in the ceramic zone, where local input pre-dominates.
Levels of Pb and Zn also reached high values in theceramic zone (around 0.4lg m~3) but very low levels atthe rural background site (0.05lg m~3, Table 4). Al-though the levels of the other elements were relativelylow, with the exception of As (up to 25 ngm~3) and Cr(up to 7 ngm~3) at L'Alcora and Vilareal, the spatialvariation of levels of As, Cr, Cs, Pb, Rb, Sr, Ti, V, Zn andZr suggests a chie#y ceramic origin for these elements(Table 4). However, Ba, Cd, Co, Cu, Ga, Hf, Mn, Mo, Nb,Ni, Sb, Sc, Sn, Th, U and Y do not show any relationshipwith ceramic emissions (Table 4). The last conclusiondemonstrates that the well-known relationship betweensome ceramic activities and the high levels of Hf, U andTh in atmospheric particles has a very local incidence.
Analysis of simultaneous samples of PM10 and PM2.5has evidenced that the crustal and marine loads arestrongly reduced in the PM2.5 with respect to the PM10(Table 5) measurements. In contrast, most of the second-ary anthropogenic phases are trapped by the PM2.5sampling, with the exception of nitrate which registers
Aea=3126=Durai=VVC
X. Querol et al. / Atmospheric Environment 35 (2001) 845}858 851
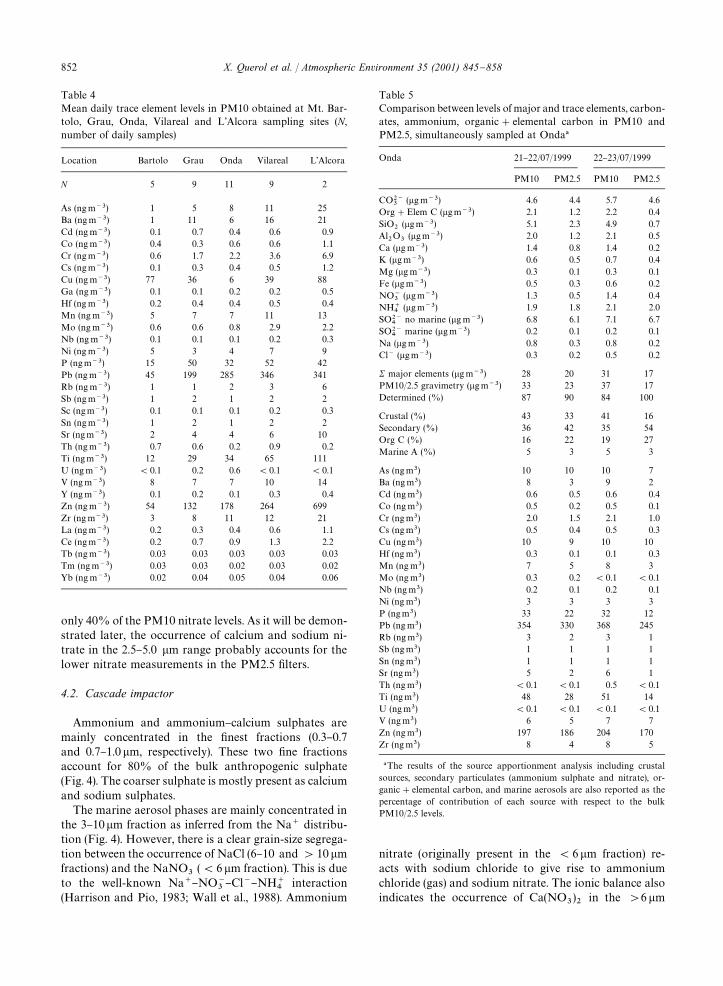
Table 4Mean daily trace element levels in PM10 obtained at Mt. Bar-tolo, Grau, Onda, Vilareal and L'Alcora sampling sites (N,number of daily samples)
Location Bartolo Grau Onda Vilareal L'Alcora
N 5 9 11 9 2
As (ngm~3) 1 5 8 11 25Ba (ngm~3) 1 11 6 16 21Cd (ng m~3) 0.1 0.7 0.4 0.6 0.9Co (ng m~3) 0.4 0.3 0.6 0.6 1.1Cr (ngm~3) 0.6 1.7 2.2 3.6 6.9Cs (ngm~3) 0.1 0.3 0.4 0.5 1.2Cu (ng m~3) 77 36 6 39 88Ga (ng m~3) 0.1 0.1 0.2 0.2 0.5Hf (ng m~3) 0.2 0.4 0.4 0.5 0.4Mn (ng m~3) 5 7 7 11 13Mo (ng m~3) 0.6 0.6 0.8 2.9 2.2Nb (ng m~3) 0.1 0.1 0.1 0.2 0.3Ni (ng m~3) 5 3 4 7 9P (ngm~3) 15 50 32 52 42Pb (ng m~3) 45 199 285 346 341Rb (ng m~3) 1 1 2 3 6Sb (ngm~3) 1 2 1 2 2Sc (ngm~3) 0.1 0.1 0.1 0.2 0.3Sn (ngm~3) 1 2 1 2 2Sr (ngm~3) 2 4 4 6 10Th (ng m~3) 0.7 0.6 0.2 0.9 0.2Ti (ngm~3) 12 29 34 65 111U (ng m~3) (0.1 0.2 0.6 (0.1 (0.1V (ng m~3) 8 7 7 10 14Y (ng m~3) 0.1 0.2 0.1 0.3 0.4Zn (ng m~3) 54 132 178 264 699Zr (ng m~3) 3 8 11 12 21La (ngm~3) 0.2 0.3 0.4 0.6 1.1Ce (ngm~3) 0.2 0.7 0.9 1.3 2.2Tb (ng m~3) 0.03 0.03 0.03 0.03 0.03Tm (ngm~3) 0.03 0.03 0.02 0.03 0.02Yb (ng m~3) 0.02 0.04 0.05 0.04 0.06
Table 5Comparison between levels of major and trace elements, carbon-ates, ammonium, organic#elemental carbon in PM10 andPM2.5, simultaneously sampled at Onda!
Onda 21}22/07/1999 22}23/07/1999
PM10 PM2.5 PM10 PM2.5
CO2~3
(lg m~3) 4.6 4.4 5.7 4.6Org#Elem C (lgm~3) 2.1 1.2 2.2 0.4SiO
2(lgm~3) 5.1 2.3 4.9 0.7
Al2O
3(lgm~3) 2.0 1.2 2.1 0.5
Ca (lg m~3) 1.4 0.8 1.4 0.2K (lg m~3) 0.6 0.5 0.7 0.4Mg (lg m~3) 0.3 0.1 0.3 0.1Fe (lgm~3) 0.5 0.3 0.6 0.2NO~
3(lgm~3) 1.3 0.5 1.4 0.4
NH`4
(lgm~3) 1.9 1.8 2.1 2.0SO2~
4no marine (lg m~3) 6.8 6.1 7.1 6.7
SO2~4
marine (lgm~3) 0.2 0.1 0.2 0.1Na (lg m~3) 0.8 0.3 0.8 0.2Cl~ (lgm~3) 0.3 0.2 0.5 0.2
R major elements (lgm~3) 28 20 31 17PM10/2.5 gravimetry (lgm~3) 33 23 37 17Determined (%) 87 90 84 100
Crustal (%) 43 33 41 16Secondary (%) 36 42 35 54Org C (%) 16 22 19 27Marine A (%) 5 3 5 3
As (ngm3) 10 10 10 7Ba (ngm3) 8 3 9 2Cd (ng m3) 0.6 0.5 0.6 0.4Co (ng m3) 0.5 0.2 0.5 0.1Cr (ngm3) 2.0 1.5 2.1 1.0Cs (ngm3) 0.5 0.4 0.5 0.3Cu (ng m3) 10 9 10 10Hf (ng m3) 0.3 0.1 0.1 0.3Mn (ng m3) 7 5 8 3Mo (ng m3) 0.3 0.2 (0.1 (0.1Nb (ng m3) 0.2 0.1 0.2 0.1Ni (ng m3) 3 3 3 3P (ngm3) 33 22 32 12Pb (ng m3) 354 330 368 245Rb (ng m3) 3 2 3 1Sb (ngm3) 1 1 1 1Sn (ngm3) 1 1 1 1Sr (ngm3) 5 2 6 1Th (ng m3) (0.1 (0.1 0.5 (0.1Ti (ngm3) 48 28 51 14U (ng m3) (0.1 (0.1 (0.1 (0.1V (ng m3) 6 5 7 7Zn (ng m3) 197 186 204 170Zr (ng m3) 8 4 8 5
!The results of the source apportionment analysis including crustalsources, secondary particulates (ammonium sulphate and nitrate), or-ganic#elemental carbon, and marine aerosols are also reported as thepercentage of contribution of each source with respect to the bulkPM10/2.5 levels.
only 40% of the PM10 nitrate levels. As it will be demon-strated later, the occurrence of calcium and sodium ni-trate in the 2.5}5.0 lm range probably accounts for thelower nitrate measurements in the PM2.5 "lters.
4.2. Cascade impactor
Ammonium and ammonium}calcium sulphates aremainly concentrated in the "nest fractions (0.3}0.7and 0.7}1.0 lm, respectively). These two "ne fractionsaccount for 80% of the bulk anthropogenic sulphate(Fig. 4). The coarser sulphate is mostly present as calciumand sodium sulphates.
The marine aerosol phases are mainly concentrated inthe 3}10lm fraction as inferred from the Na` distribu-tion (Fig. 4). However, there is a clear grain-size segrega-tion between the occurrence of NaCl (6}10 and '10 lmfractions) and the NaNO
3((6lm fraction). This is due
to the well-known Na`}NO~3}Cl~}NH`
4interaction
(Harrison and Pio, 1983; Wall et al., 1988). Ammonium
nitrate (originally present in the (6lm fraction) re-acts with sodium chloride to give rise to ammoniumchloride (gas) and sodium nitrate. The ionic balance alsoindicates the occurrence of Ca(NO
3)2
in the '6lm
Aea=3126=Durai=VVC
852 X. Querol et al. / Atmospheric Environment 35 (2001) 845}858

Fig. 4. Grain-size distribution of weekly levels of the solublefraction of major species (neqm~3) and selected trace metals(ngm~3) in total suspended particles obtained at Onda from 12to 23 July 1999.
Fig. 5. Comparison of the grain-size distributions of weeklylevels of the insoluble fraction of major elements and selectedtrace metals in total suspended particles obtained at Onda inthis study with that of a typical urban distribution obtained inBarcelona. Levels in ngm~3.
fraction probably due to nitri"cation of soil particles(Harrison and Kito, 1990) and NH
4NO
3in the (1.5lm
fraction (Fig. 4).As expected, SO2~
4, NO~
3, Cl~, NH`
4, Ca, Mg, Mn, Pb,
V and Zn have a major soluble fraction (Fig. 4), and Al,K, Sr, Ba, Cr, Cu, Ni, Ti and Fe are mainly present ininsoluble phases (Fig. 5). Insoluble soil and ceramic par-ticulates such as clay minerals, calcium carbonate andfeldspars (crustal phases) showed a bi-modal grain-sizedistribution with modes occurring in the 1.5}6.0 and'25lm fractions as deduced from the grain-size distri-bution of insoluble levels of Ca, Al, K and Fe (Fig. 5).
Soluble fractions of Mn, Fe, V and Cr, probably occur-ring in di!erent oxide phases with an anthropogenicorigin, are mostly in the 6}10lm range (Figs. 4 and 5).However, Pb and Zn mainly occur in the soluble very"ne grain-size fraction, '85% of bulk Pb levels occur-ring in the PM2.5 fraction (Fig. 4).
Unusually high proportions of insoluble levels of Al,Ca, Na, Sr, S, P and Fe were found in the "ne grain-sizemodes ((1.5lm) when compared with a normal urbanor industrial grain-size distribution (Fig. 5). This atypicaloccurrence of "ne grain sizes for these elements and theunusually high proportion of insoluble Na levels (up to30% of bulk Na) are probably the result of the condensa-tion of volatile emissions from high temperature pro-cesses developed in the enamel manufacture. These pecu-liar patterns may be a good tool for tracing the input ofceramic emissions on bulk PM10 levels, since the bulkchemical patterns, characterised by high Al, Si, Fe andCa levels, are similar to the soil end-member.
4.3. Grain-size distribution of atmospheric particulatesaround the emission sources
The fugitive emissions from the largest open-pit claymine in the area induced very high ambient air PM10
Aea=3126=Durai=VVC
X. Querol et al. / Atmospheric Environment 35 (2001) 845}858 853
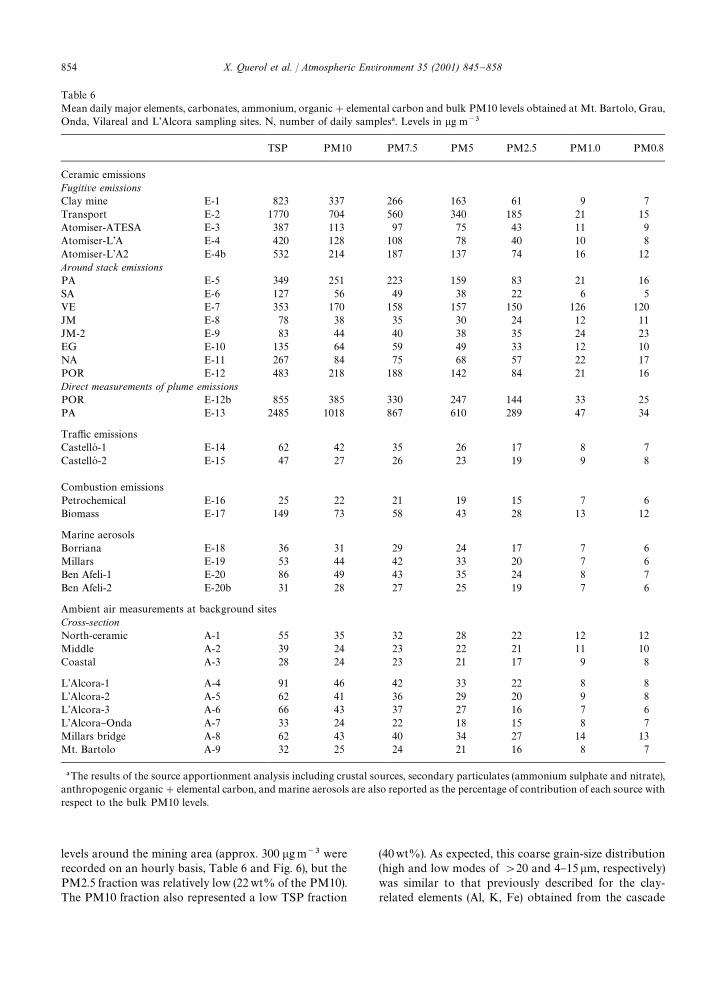
Table 6Mean daily major elements, carbonates, ammonium, organic#elemental carbon and bulk PM10 levels obtained at Mt. Bartolo, Grau,Onda, Vilareal and L'Alcora sampling sites. N, number of daily samples!. Levels in lg m~3
TSP PM10 PM7.5 PM5 PM2.5 PM1.0 PM0.8
Ceramic emissionsFugitive emissionsClay mine E-1 823 337 266 163 61 9 7Transport E-2 1770 704 560 340 185 21 15Atomiser-ATESA E-3 387 113 97 75 43 11 9Atomiser-L'A E-4 420 128 108 78 40 10 8Atomiser-L'A2 E-4b 532 214 187 137 74 16 12Around stack emissionsPA E-5 349 251 223 159 83 21 16SA E-6 127 56 49 38 22 6 5VE E-7 353 170 158 157 150 126 120JM E-8 78 38 35 30 24 12 11JM-2 E-9 83 44 40 38 35 24 23EG E-10 135 64 59 49 33 12 10NA E-11 267 84 75 68 57 22 17POR E-12 483 218 188 142 84 21 16Direct measurements of plume emissionsPOR E-12b 855 385 330 247 144 33 25PA E-13 2485 1018 867 610 289 47 34
Tra$c emissionsCastelloH -1 E-14 62 42 35 26 17 8 7CastelloH -2 E-15 47 27 26 23 19 9 8
Combustion emissionsPetrochemical E-16 25 22 21 19 15 7 6Biomass E-17 149 73 58 43 28 13 12
Marine aerosolsBorriana E-18 36 31 29 24 17 7 6Millars E-19 53 44 42 33 20 7 6Ben Afeli-1 E-20 86 49 43 35 24 8 7Ben Afeli-2 E-20b 31 28 27 25 19 7 6
Ambient air measurements at background sitesCross-sectionNorth-ceramic A-1 55 35 32 28 22 12 12Middle A-2 39 24 23 22 21 11 10Coastal A-3 28 24 23 21 17 9 8
L'Alcora-1 A-4 91 46 42 33 22 8 8L'Alcora-2 A-5 62 41 36 29 20 9 8L'Alcora-3 A-6 66 43 37 27 16 7 6L'Alcora}Onda A-7 33 24 22 18 15 8 7Millars bridge A-8 62 43 40 34 27 14 13Mt. Bartolo A-9 32 25 24 21 16 8 7
!The results of the source apportionment analysis including crustal sources, secondary particulates (ammonium sulphate and nitrate),anthropogenic organic#elemental carbon, and marine aerosols are also reported as the percentage of contribution of each source withrespect to the bulk PM10 levels.
levels around the mining area (approx. 300 lgm~3 wererecorded on an hourly basis, Table 6 and Fig. 6), but thePM2.5 fraction was relatively low (22 wt% of the PM10).The PM10 fraction also represented a low TSP fraction
(40wt%). As expected, this coarse grain-size distribution(high and low modes of '20 and 4}15lm, respectively)was similar to that previously described for the clay-related elements (Al, K, Fe) obtained from the cascade
Aea=3126=Durai=VVC
854 X. Querol et al. / Atmospheric Environment 35 (2001) 845}858

Fig. 6. Selected cases of grain-size distribution of hourly levels of total suspended particles measured in the vicinities of the majorceramic emission sources. Levels in lgm~3. See codes in Table 6 and Fig. 3 for location of measurement sites.
impactor measurements. The grain-size distribution ofambient air particulates around di!erent clay atomisersand from several crossroads with high densities of clayroad-based transport was also very similar (Fig. 6and Table 6), with a major proportion in the '20 lmand two secondary modes occurring in the 4}7.5 and10}15lm fractions. The PM10 levels around these sitesalso reached very high levels (from 120 to 700lgm~3 onan hourly basis). The percentages of PM10 over TSP andPM2.5 over PM10 were constantly low (from 30 to45wt% and from 40 to 45wt%, respectively) around thefour atomisers. Although the TSP grain size pattern wasslightly "ner around the atomisers when compared withthe fugitive emissions from clay mining and transport,the similarity of these grain-size distributions suggeststhat the major emission source from these activities is thefugitive emissions from the large clay stockpiles andtransport.
PM10 levels around 10 ceramic factories includingtiling and enamel factories were signi"cantly lower thanaround the mining, atomiser and clay-transport sources(Table 6 and Fig. 6). Levels ranging from 40 to250lgm~3 of PM10 on an hourly basis were obtainedaround these ceramic factories which emit particulate mat-ter mainly through small-stacks. The percentage of PM10over TSP and PM2.5 over PM10 increased considerablywith respect to the previous emission sources. Althougha similar percentages of PM10 over TSP was determinedfor both tiling and enamel factories (from 50 to 65wt%),the enamel sources were characterised by a higher propor-tion of "ne particles (from 80 to 95wt% of PM10 were inthe PM2.5 range) with respect to the tiling factories(60}70wt% of PM10 were in the PM2.5 range).
The grain-size distribution of tra$c particulate emis-sions was measured at di!erent places of the study areaincluding major crossroads in the ceramic zone and in
the city of CastelloH . Under typical summer conditions,direct tra$c emissions did not give rise to high PM10ambient air levels. PM10 levels of 30}40lg m~3 on anhourly basis were obtained around major crossroadsinside the city of CastelloH (Table 6). The percentage ofPM10 over TSP ranged between 60 and 65wt%, whereasthe PM2.5 fraction over PM10 ranged from 45 to 70wt%(Fig. 7).
Intermediate PM10 ambient air levels (around70lgm~3 of PM10 for a 1/2 h basis) were obtained inareas with intensive biomass combustion activitiesaround large orange-tree plantations. However, the highdensity of biomass "res could make this emission typea very important source for PM10 in the study area. Inthe vicinity of the "res the percentage of PM10 over TSPwas approx. 50wt%, whereas the PM2.5 fraction overPM10 reached only 40wt% (Table 6 and Fig. 7).
Measurements of the marine aerosols obtained at dif-ferent sites of the shoreline in periods with a dominantdaytime in-land breeze #ow, showed PM10 levels from25 to 50lgm~3 of PM10 (on an hourly basis). Thepercentage of PM10 over TSP was constantly around85wt% and the PM2.5 fraction over PM10 ranged from45 to 75wt%. Constant levels of 5}8lgm~3 were mea-sured for fractions (0.8lm (Table 6 and Fig. 7) whichcoincide with the levels and the grain size distributionobtained for ammonium sulphate phases with the cas-cade impactor.
Measurements were also made in the plume of thepetrochemical plant located on a coastal site at the southof the city of CastelloH . PM10 levels were relatively low(approx. 20lgm~3 hourly PM10) compared with theother anthropogenic source. The grain-size distributionwas very similar to that of the marine aerosols, with levelsof "ne secondary particles similar to those of the back-ground marine measurements (Fig. 7).
Aea=3126=Durai=VVC
X. Querol et al. / Atmospheric Environment 35 (2001) 845}858 855

Fig. 7. Selected cases of grain-size distribution of hourly levels of total suspended particles measured in the vicinities of non-ceramicemission sources. Levels in lgm~3. See codes in Table 6 and Fig. 3 for location of measurement sites.
Fig. 8. Grain-size distribution of hourly levels of total suspended particles measured in rural-remote (Bartolo Mt.) and semi-urban(Alcora, Onda) background areas. Levels in lgm~3. See codes in Table 6 and Fig. 3 for location of measurement sites.
4.4. Grain-size distribution of atmospheric particulates:ambient air measurements
One set of measurements was performed followinga cross-section from the coastal area towards the ce-ramic-producing zones during the daytime in-land breezecirculation stage (Table 6). The measurements were per-formed in background rural and suburban areas andshowed a clear trend of an increase in the particulatelevels from the coastal area (20lg PM10m~3 and 15lgPM2.5m~3) towards the ceramic area (36lg PM10m~3
and 25lg PM2.5m~3). The "nest fraction (mainly(0.8lm sulphate) also followed the same trend (from8 to 12lgm~3). All the measurements of this cross-section also showed two grain-size modes of around1.6}3.0 and 5.0}7.5lm, corresponding to marine aero-sols. However, there is a marked trend to increase pro-gressively the 5.0}7.5lm mode (Fig. 8), probably due tothe increase in nitrate levels and primary ceramic partic-ulates towards the ceramic zone. In addition to these
modes, two additional coarse particulate inputs are evi-dent (in the 10}15 and '20 lm) as the ceramic area isapproached (Fig. 8). These grain size patterns and levelswere also constantly recorded by a number of additionalmeasurements performed at ceramic background sitesaround L'Alcora and Onda (Table 6 and Fig. 8).
The results of the measurements performed on therural background station of Mt. Bartolo evidenced levelsof PM10 around 25lg m~3, of which 1/3 proceedfrom the ammonium sulphate phases (8lgm~3 in the(0.8lm fraction). In addition to other possible partic-ulate inputs such as nitrates and crustal particles, the twoother modes (2}3 and 5}7.5lm) identi"ed were coinci-dent with the bi-modal distribution of the marine aerosol(Fig. 8). The presence of relatively high levels of am-monium sulphate at this site during the daytime breezestage supports the high re-circulation of this secondaryphase.
In summer, the emission plumes from the ceramiczones are dragged by the nocturnal seaward breeze which
Aea=3126=Durai=VVC
856 X. Querol et al. / Atmospheric Environment 35 (2001) 845}858

Fig. 9. Time evolution of levels of di!erent grain-size fractionsof atmospheric particulates in the daily breeze cycle at the Grau,Onda and L'Alcora monitoring stations. Levels in lgm~3. Thesimultaneous wind speed and direction measurements are alsoincluded to show the breeze dynamics observed during themeasuring period.
accounts for a rise of the nighttime coastal particulatelevels. 24 h measurements with semi-hourly particulatelevels performed at the Grau station demonstrated thatin the daytime stage all grain-size fractions remained atrelatively low levels due to the relatively clean marine airmass #ows (see levels of particles and wind velocity anddirection in Fig. 9). Later, in the nocturnal stage (21}7h)the PM10 levels increased drastically as a consequence of
the seaward transport of pollutants from the ceramicarea (Fig. 9). However, the levels of PM1 and PM2.5 didnot exhibit major changes during the daily cycle, with the2.5}10lm fractions being responsible for the increasein PM10 levels (Fig. 9). Because of the longer transportof pollutants, the increase in the '10lm fraction regis-tered close to the ceramic emission sources (Onda) wasnot recorded at the Grau station.
The high impact of 2.5}10lm particles on bulk PM10levels is also evidenced by the measurements performedat L'Alcora. At this site, high levels of PM25 and PM10are reached during the daytime stage, when local ceramicemissions are relatively high. At this stage the emissionplumes are dragged towards the northwestern areas bythe inland breeze circulation. Subsequently, in the noc-turnal period, these high particulate air masses travelback to the emission-source area due to the seawardbreeze. These processes account for the higher PM10levels reached during the nocturnal stage with respect tothe daytime stage (Fig. 9). Because of the breeze transportand consequent grain-size segregation, nocturnal levelsof '10 lm particles are low when compared with thedaytime stage. Once more it becomes very evident thatthe grain-size range which detects the impact of thesepolluted air masses on the ambient air quality is that of2.5}10lm (Fig. 9). The two major PM10 peaks registeredbetween 21}22 and 7}8 h (both local time, see Fig. 9)probably mark the calm periods produced during thechange in wind direction between the breeze stages.
A similar situation was found at the Onda stationwhere the impact of emission plumes from the nearbyceramic emission sources is not as important as inL'Alcora, but the nocturnal breeze circulation also ac-counts for high 2.5}10 and '10lm particulate levels.The PM2.5 levels did not evidence the impact of theseplumes at all (Fig. 9). The calm periods between breezestages are also evidenced in the late evening and earlymorning by high particulate events (Fig. 9).
5. Conclusions
Although the ceramic primary particulate emissionsfrom the CastelloH area have a coarse grain-size distribu-tion, the particulate transport dominated by the breezecirculation accounts for a subsequent grain-size segrega-tion. Thus, major impacts on the ambient air quality ofthe coastal area induced by the particulate ceramic emis-sions occur in the nocturnal period due to the seawardtransport of polluted air masses. Levels of ambient airparticles increase mainly in the 2.5}10lm range due tograin-size segregation by transport.
The chemical composition of the ceramic particulateemissions is very similar to the crustal end-memberbut high Al, Fe and Ti levels coupled with a peculiargrain-size distribution in the major insoluble phases
Aea=3126=Durai=VVC
X. Querol et al. / Atmospheric Environment 35 (2001) 845}858 857

allows us to identify the ceramic input in the particulatematter.
Although replacement of PM10 by PM2.5 measure-ments in ambient air quality monitoring standards isa likely trend for the future, the PM2.5 is not an adequateparameter for monitoring the impact of primary partic-ulate emissions (such as ceramic emissions) on air quality,since the major particulate ambient air levels are in therange of 2.5}10lm.
As demonstrated from the analysis of major and traceelements in simultaneous PM10 and PM2.5 samplingand cascade impactor and from the Grimm measure-ments, PM2.5 measurement avoids the interference ofcrustal particulates without major reduction in the sec-ondary anthropogenic load with the exception of nitrate.However, occasionally industrial primary particulateemissions may have the crustal particulate grain-size, andconsequently these emissions will not be detected byPM2.5 measurements. From a technical point of view,the measurement of atmospheric particulates has to bespeci"c for monitoring areas with major secondary orprimary particulate emissions. In areas characterised bymajor secondary particulate emissions, PM2.5 monitor-ing should detect anthropogenic particulate pollutantswithout crustal particulate interference, whereas PM10measurements should be used in areas with major pri-mary anthropogenic particulate emissions.
Acknowledgements
The present study has been supported by the PlanNacional de I#D of the Spanish CICYT, projectAMB98-1044, and by the Spanish Ministry of the Envir-onment. We would like to express our gratitude to theDireccioH General de EducacioH i Qualitat Ambiental ofthe Generalitat Valenciana for supplying the data fromthe monitoring stations and for their interest in the develop-ment of this study.
References
Dockery, D., Pope, A., 1996. Epidemiology of acute healthe!ects: summary of time-series studies. In: Wilson, R.,
Spengler, J.D. (Eds.), Particles in Air: Concentration andHealth E!ects. Harvard University Press, Cambridge, USA,pp. 123}147.
EU Directive 1999/30/EC, 1999. Council directive relating tolimit values for sulphur dioxide, nitrogen dioxide and oxideof nitrogen, particulate matter and lead in ambient air. TheCouncil of the European Union.
Harrison, R.M., Pio, C., 1983. Size di!erentiated composition ofinorganic aerosol of both marine and polluted continentalorigin. Atmospheric Environment 17, 1733}1738.
Harrison, R.M., Kito, A.M.N., 1990. Field inter-comparison of"lter pack and denuder sampling methods for reactive gas-eous and particulate pollutants. Atmospheric Environment24A, 2633}2640.
IPCC, 1996. Climate change. In: Houghton, J.T., Meira Filho,L.G., Callander, B.A., Harris, N., Kattenberg, A., Maskell, K.(Eds.), The Science of Climate Change. Cambridge Univer-sity Press, Cambridge, UK, 584pp.
Kiehl, J.T., Rhode, H., 1995. Modelling geographical and sea-sonal forcing due to aerosols. In: Charlson, R.J., Heintzen-berg, J. (Eds.), Aerosol Forcing of Climate. Wiley, New York,pp. 281}296.
Mildford, J.B., Davidson, C.I., 1987. The sizes of particulatesulphate and nitrate in the atmosphere: a review. Journal ofAir Pollution Control Association 37 (2), 125}134.
MillaH n, M.M., Artin8 ano, B., Alonso, L., Navazo, M., 1991. Thee!ect of meso-scale #ows on regional and long-range atmo-spheric transport in the Western Mediterranean area. Atmo-spheric Environment 25A (5/6), 949}963.
MillaH n, M.M., Salvador, R., Mantilla, E., 1997. Photooxidantdynamics in the Mediterranean basin in summer: resultsfrom European research projects. Journal of GeophysicalResearch 102 (D7), 8811}8823.
Querol, X., Alastuey, A., Puicercus, J.A., Mantilla, E., Ruiz, C.R.,LoH pez-Soler, A., Plana, F., Juan, R., 1998. Seasonal evolutionof suspended particles around a large coal-"red power sta-tion: chemical characterisation. Atmospheric Environment32 (11), 719}731.
US-EPA, 1987. Second addendum to air quality criteria forparticulate matter and sulfur oxides (1982): assessment ofnewly available health e!ects information. Research TrianglePark, EPA Report 600/8-86-020F, NTIS PB87-176574.
US-EPA, 1996. Air quality criteria for particulate matter.EPA/600/P-95/001F, US Environmental Protection Agency,Washington, DC.
Wall, S.M., John, W., Ondo, J.L., 1988. Measurement of aerosolsize distribution for nitrate and major ionic species. Atmo-spheric Environment 22, 1649}1656.
Aea=3126=Durai=VVC
858 X. Querol et al. / Atmospheric Environment 35 (2001) 845}858
Copyright © 2022 FDOKUMEN