Analysis of PM2.5and PM10 in the Atmosphere of Mexico City during 2000-2002
13
Analysis of PM 2.5 and PM 10 in the Atmosphere of Mexico City during 2000 –2002 Elizabeth Vega, Elizabeth Reyes, Hugo Ruiz, Jose ´ Garcı ´a, Gabriela Sa ´ nchez, Gerardo Martı ´nez-Villa, and Uriel Gonza ´lez Mexican Petroleum Institute, Mexico City, Mexico Judith C. Chow and John G. Watson Desert Research Institute, Reno, Nevada ABSTRACT During the last 10 years, high atmospheric concentrations of airborne particles recorded in the Mexico City metro- politan area have caused concern because of their poten- tial harmful effects on human health. Four monitoring campaigns have been carried out in the Mexico City met- ropolitan area during 2000 –2002 at three sites: (1) Xalos- toc, located in an industrial region; (2) La Merced, located in a commercial area; and (3) Pedregal, located in a resi- dential area. Results of gravimetric and chemical analyses of 330 samples of particulate matter (PM) with an aero- dynamic diameter less than 2.5 m (PM 2.5 ) and PM with an aerodynamic diameter less than 10 m (PM 10 ) indicate that (1) PM 2.5 /PM 10 average ratios were 0.42, 0.46, and 0.52 for Xalostoc, La Merced, and Pedregal, respectively; (2) the highest PM 2.5 and PM 10 concentrations were found at the industrial site; (3) PM 2.5 and PM 10 concen- trations were lower at nighttime; (4) PM 2.5 and PM 10 spatial averages concentrations were 35 and 76 g/m 3 , respectively; and (5) when the PM 2.5 standard was ex- ceeded, nitrate, sulfate, ammonium, organic carbon, and elemental carbon concentrations were high. Twenty-four hour averaged PM 2.5 concentrations in Mexico City and Sao Paulo were similar to those recorded in the 1980s in Los Angeles. PM 10 concentrations were comparable in Sao Paulo and Mexico City but 3-fold lower than those found in Santiago. INTRODUCTION Particulate matter (PM) is one of the main air pollution problems with significant economic and human health implications, especially in those urban areas with poor ventilation, unfavorable geographical and meteorological conditions, and a high number of emission sources, in- cluding uncontrolled sources, as in the case of Mexico City. Although the Mexican government, through the Sec- retary of the Environment and Natural Resources, has striven to reduce air pollution, more stringent measures to control emission sources need to be devised. Local envi- ronmental authorities in Mexico City established a man- ual air-quality monitoring network in 1986 and an auto- matic network (RAMA) in 1995. The RAMA measurements are the most complete long-term and widely used data set. This data set provides information for compliance with the Mexican standards for PM and other criteria pollut- ants. In October 2002, the Mexican 24-hr average PM with an aerodynamic diameter less than 10 m (PM 10 ) standard was modified from 150 to 120 g/m 3 , and a 24-hr average PM with an aerodynamic diameter less than 2.5 m (PM 2.5 ) standard of 65 g/m 3 was added (NOM- 025-SSA1–1993). PM chemical composition data are needed to com- plement the information provided by the RAMA, to iden- tify and control emission sources. To this respect, fossil fuels have gained attention as an important PM source. One of the environmental policies consists of improving composition of fuels employed in industrial activities, transportation, and residential use, such as the introduc- tion of Diesel Sin (maximum level of sulfur [S] of 0.05%) and unleaded gasoline (Magna Sin), and the substitution IMPLICATIONS Mexico City experiences PM problems which are of con- cern for public health and visibility deterioration. Although there have been several strategies to diminish air pollution, PM 2.5 and PM 10 standards are still exceeded. In this study, several sampling campaigns were carried out from 2000 to 2002 to chemically characterize PM 2.5 and PM 10 and eval- uate some of current control strategies. PM 2.5 standard exceedances were associated with elevated concentra- tions of secondary aerosols, as well as Pb and carbona- ceous particles. PM 10 standard exceedances were associ- ated with elevated concentrations of geological material, secondary aerosols, Cu, Zn, and Ba. TECHNICAL PAPER ISSN 1047-3289 J. Air & Waste Manage. Assoc. 54:786 –798 Copyright 2004 Air & Waste Management Association 786 Journal of the Air & Waste Management Association Volume 54 July 2004
-
Upload
independent -
Category
Documents
-
view
2 -
download
0
Transcript of Analysis of PM2.5and PM10 in the Atmosphere of Mexico City during 2000-2002

Analysis of PM2.5 and PM10 in the Atmosphere of MexicoCity during 2000–2002
Elizabeth Vega, Elizabeth Reyes, Hugo Ruiz, Jose Garcıa, Gabriela Sanchez,Gerardo Martınez-Villa, and Uriel GonzalezMexican Petroleum Institute, Mexico City, Mexico
Judith C. Chow and John G. WatsonDesert Research Institute, Reno, Nevada
ABSTRACTDuring the last 10 years, high atmospheric concentrationsof airborne particles recorded in the Mexico City metro-politan area have caused concern because of their poten-tial harmful effects on human health. Four monitoringcampaigns have been carried out in the Mexico City met-ropolitan area during 2000–2002 at three sites: (1) Xalos-toc, located in an industrial region; (2) La Merced, locatedin a commercial area; and (3) Pedregal, located in a resi-dential area. Results of gravimetric and chemical analysesof 330 samples of particulate matter (PM) with an aero-dynamic diameter less than 2.5 �m (PM2.5) and PM withan aerodynamic diameter less than 10 �m (PM10) indicatethat (1) PM2.5/PM10 average ratios were 0.42, 0.46, and0.52 for Xalostoc, La Merced, and Pedregal, respectively;(2) the highest PM2.5 and PM10 concentrations werefound at the industrial site; (3) PM2.5 and PM10 concen-trations were lower at nighttime; (4) PM2.5 and PM10
spatial averages concentrations were 35 and 76 �g/m3,respectively; and (5) when the PM2.5 standard was ex-ceeded, nitrate, sulfate, ammonium, organic carbon, andelemental carbon concentrations were high. Twenty-fourhour averaged PM2.5 concentrations in Mexico City and
Sao Paulo were similar to those recorded in the 1980s inLos Angeles. PM10 concentrations were comparable in SaoPaulo and Mexico City but 3-fold lower than those foundin Santiago.
INTRODUCTIONParticulate matter (PM) is one of the main air pollutionproblems with significant economic and human healthimplications, especially in those urban areas with poorventilation, unfavorable geographical and meteorologicalconditions, and a high number of emission sources, in-cluding uncontrolled sources, as in the case of MexicoCity.
Although the Mexican government, through the Sec-retary of the Environment and Natural Resources, hasstriven to reduce air pollution, more stringent measures tocontrol emission sources need to be devised. Local envi-ronmental authorities in Mexico City established a man-ual air-quality monitoring network in 1986 and an auto-matic network (RAMA) in 1995. The RAMA measurementsare the most complete long-term and widely used data set.This data set provides information for compliance withthe Mexican standards for PM and other criteria pollut-ants. In October 2002, the Mexican 24-hr average PMwith an aerodynamic diameter less than 10 �m (PM10)standard was modified from 150 to 120 �g/m3, and a24-hr average PM with an aerodynamic diameter less than2.5 �m (PM2.5) standard of 65 �g/m3 was added (NOM-025-SSA1–1993).
PM chemical composition data are needed to com-plement the information provided by the RAMA, to iden-tify and control emission sources. To this respect, fossilfuels have gained attention as an important PM source.One of the environmental policies consists of improvingcomposition of fuels employed in industrial activities,transportation, and residential use, such as the introduc-tion of Diesel Sin (maximum level of sulfur [S] of 0.05%)and unleaded gasoline (Magna Sin), and the substitution
IMPLICATIONSMexico City experiences PM problems which are of con-cern for public health and visibility deterioration. Althoughthere have been several strategies to diminish air pollution,PM2.5 and PM10 standards are still exceeded. In this study,several sampling campaigns were carried out from 2000 to2002 to chemically characterize PM2.5 and PM10 and eval-uate some of current control strategies. PM2.5 standardexceedances were associated with elevated concentra-tions of secondary aerosols, as well as Pb and carbona-ceous particles. PM10 standard exceedances were associ-ated with elevated concentrations of geological material,secondary aerosols, Cu, Zn, and Ba.
TECHNICAL PAPER ISSN 1047-3289 J. Air & Waste Manage. Assoc. 54:786–798
Copyright 2004 Air & Waste Management Association
786 Journal of the Air & Waste Management Association Volume 54 July 2004
of fuel oil by natural gas at the beginning of the 1990s.The content of S in gasoline is known to adversely affectthe oxides of nitrogen (NOx) storage-reduction character-istic of the catalytic converter. The use of very low-Sgasoline might be essential in achieving low emissionsand high fuel economy in the future. In Mexico City, theaverage S content is 450 ppm, whereas that in the rest ofthe country is higher (750 ppm).1 The TIER 1 emissionstandard has been in use since 2001. The introduction ofTIER 2 emission specification will start in 2006 and, inagreement with the national automotive industry, it willbe necessary to reduce the S contents to 50 ppm.
There are some studies reporting mass and chemicalcomposition of PM in Mexico City.2–5 During 1997 (Feb-ruary 23–March 22), a 4-week sampling campaign of PMand other air pollutants took place in Mexico City as partof the project Investigacion sobre Materia Particulada yDeterioro Atmosferico—Aerosol and Visibility EvaluationResearch (IMADA-AVER).6 This was the most comprehen-sive monitoring campaign ever done in terms of the num-ber of studied sites and the amount of human and scien-tific resources involved. Although results of thesestudies4–8 have contributed to the understanding of thePM problem, issues such as toxicity, origin, and distribu-tion of PM have not yet been addressed in depth.
Four sampling campaigns were carried out during2000–2002 as part of the project Research for the Devel-opment of Low Environmental Impact Fuels at the Mex-ican Petroleum Institute. In this paper, the results of thespatial and temporal distribution as well as the chemicalcomposition of PM2.5 and PM10 from ambient air in Mex-ico City are presented.
METHODOLOGYMonitoring Campaign
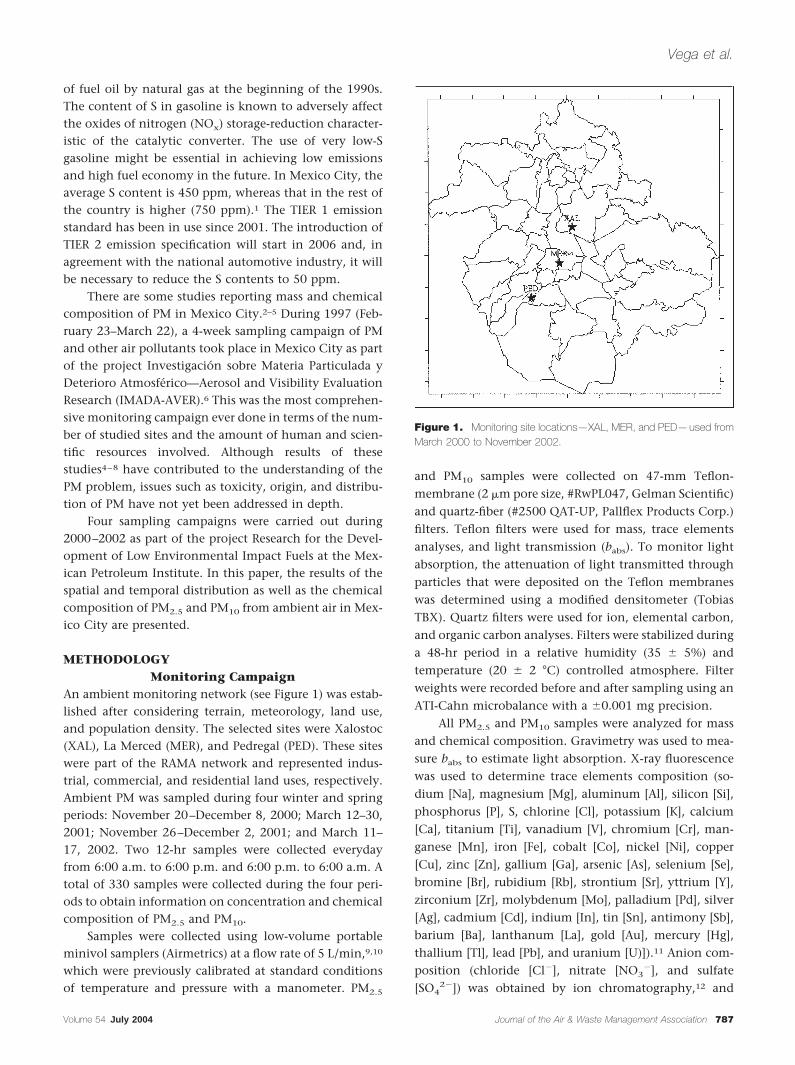
An ambient monitoring network (see Figure 1) was estab-lished after considering terrain, meteorology, land use,and population density. The selected sites were Xalostoc(XAL), La Merced (MER), and Pedregal (PED). These siteswere part of the RAMA network and represented indus-trial, commercial, and residential land uses, respectively.Ambient PM was sampled during four winter and springperiods: November 20–December 8, 2000; March 12–30,2001; November 26–December 2, 2001; and March 11–17, 2002. Two 12-hr samples were collected everydayfrom 6:00 a.m. to 6:00 p.m. and 6:00 p.m. to 6:00 a.m. Atotal of 330 samples were collected during the four peri-ods to obtain information on concentration and chemicalcomposition of PM2.5 and PM10.
Samples were collected using low-volume portableminivol samplers (Airmetrics) at a flow rate of 5 L/min,9,10
which were previously calibrated at standard conditionsof temperature and pressure with a manometer. PM2.5
and PM10 samples were collected on 47-mm Teflon-membrane (2 �m pore size, #RwPL047, Gelman Scientific)and quartz-fiber (#2500 QAT-UP, Pallflex Products Corp.)filters. Teflon filters were used for mass, trace elementsanalyses, and light transmission (babs). To monitor lightabsorption, the attenuation of light transmitted throughparticles that were deposited on the Teflon membraneswas determined using a modified densitometer (TobiasTBX). Quartz filters were used for ion, elemental carbon,and organic carbon analyses. Filters were stabilized duringa 48-hr period in a relative humidity (35 � 5%) andtemperature (20 � 2 °C) controlled atmosphere. Filterweights were recorded before and after sampling using anATI-Cahn microbalance with a �0.001 mg precision.
All PM2.5 and PM10 samples were analyzed for massand chemical composition. Gravimetry was used to mea-sure babs to estimate light absorption. X-ray fluorescencewas used to determine trace elements composition (so-dium [Na], magnesium [Mg], aluminum [Al], silicon [Si],phosphorus [P], S, chlorine [Cl], potassium [K], calcium[Ca], titanium [Ti], vanadium [V], chromium [Cr], man-ganese [Mn], iron [Fe], cobalt [Co], nickel [Ni], copper[Cu], zinc [Zn], gallium [Ga], arsenic [As], selenium [Se],bromine [Br], rubidium [Rb], strontium [Sr], yttrium [Y],zirconium [Zr], molybdenum [Mo], palladium [Pd], silver[Ag], cadmium [Cd], indium [In], tin [Sn], antimony [Sb],barium [Ba], lanthanum [La], gold [Au], mercury [Hg],thallium [Tl], lead [Pb], and uranium [U)]).11 Anion com-position (chloride [Cl�], nitrate [NO3
�], and sulfate[SO4
2�]) was obtained by ion chromatography,12 and
Figure 1. Monitoring site locations—XAL, MER, and PED—used fromMarch 2000 to November 2002.
Vega et al.
Volume 54 July 2004 Journal of the Air & Waste Management Association 787
soluble cation composition (sodium [Na�] and potassium[K�]) was determined by atomic absorption spectrometry.Ammonium (NH4
�) was analyzed by automatic colorim-etry, and organic carbon (OC) or organic matter (OM) andelemental carbon (EC) were analyzed by thermo-opticalreflectance.13
Results of sample analyses were subject to a valida-tion process, which is described in more detail by Watsonet al.14 and Chow et al.15,16 Level 0 was for raw datadirectly recorded for the equipment, Level I was for inval-idated measurements caused by malfunctioning of theequipment, and Level II accounted for known physicalrelations between variables, such as (1) PM2.5 � PM10
concentration, (2) the sum of individual chemical spe-cies � measured mass, and (3) correlations between cationversus anion, EC versus babs, chloride (Cl�) versus Cl,soluble potassium (K�) versus K, S versus SO4
2� and cal-culated NH4
� versus measured NH4�.
RESULTSPM2.5/PM10 Mass Ratio and Data Validation
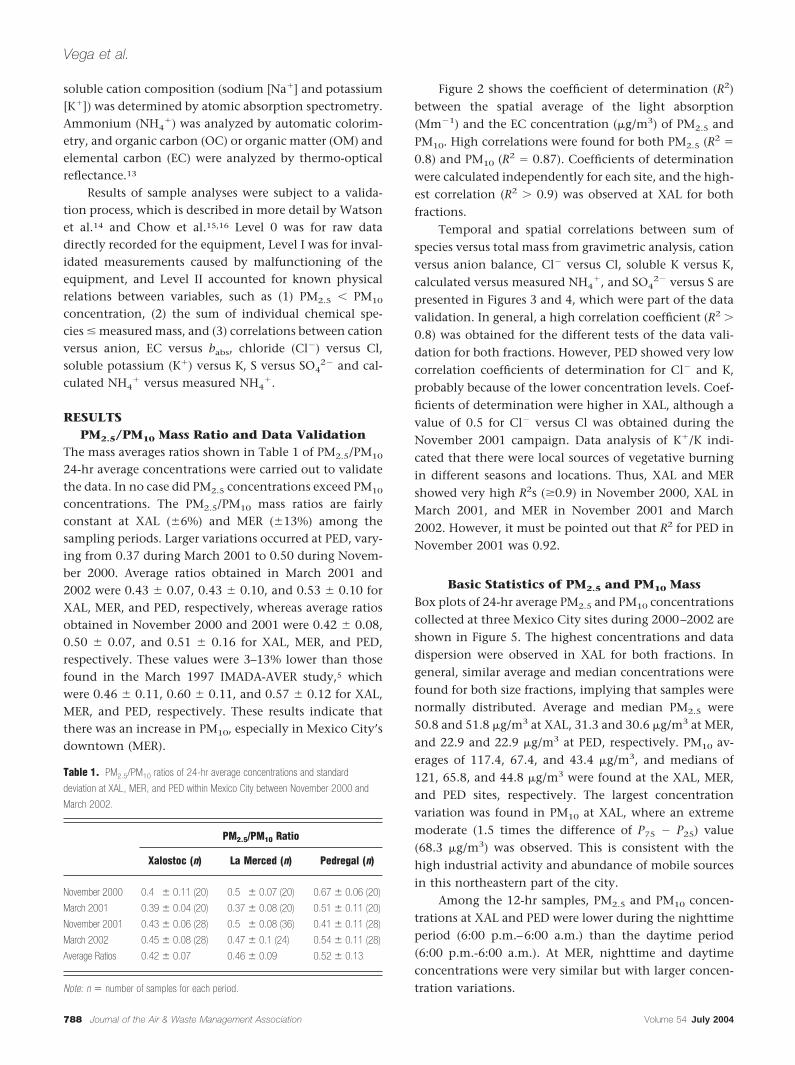
The mass averages ratios shown in Table 1 of PM2.5/PM10
24-hr average concentrations were carried out to validatethe data. In no case did PM2.5 concentrations exceed PM10
concentrations. The PM2.5/PM10 mass ratios are fairlyconstant at XAL (�6%) and MER (�13%) among thesampling periods. Larger variations occurred at PED, vary-ing from 0.37 during March 2001 to 0.50 during Novem-ber 2000. Average ratios obtained in March 2001 and2002 were 0.43 � 0.07, 0.43 � 0.10, and 0.53 � 0.10 forXAL, MER, and PED, respectively, whereas average ratiosobtained in November 2000 and 2001 were 0.42 � 0.08,0.50 � 0.07, and 0.51 � 0.16 for XAL, MER, and PED,respectively. These values were 3–13% lower than thosefound in the March 1997 IMADA-AVER study,5 whichwere 0.46 � 0.11, 0.60 � 0.11, and 0.57 � 0.12 for XAL,MER, and PED, respectively. These results indicate thatthere was an increase in PM10, especially in Mexico City’sdowntown (MER).
Figure 2 shows the coefficient of determination (R2)between the spatial average of the light absorption(Mm�1) and the EC concentration (�g/m3) of PM2.5 andPM10. High correlations were found for both PM2.5 (R2 �
0.8) and PM10 (R2 � 0.87). Coefficients of determinationwere calculated independently for each site, and the high-est correlation (R2 � 0.9) was observed at XAL for bothfractions.
Temporal and spatial correlations between sum ofspecies versus total mass from gravimetric analysis, cationversus anion balance, Cl� versus Cl, soluble K versus K,calculated versus measured NH4
�, and SO42� versus S are
presented in Figures 3 and 4, which were part of the datavalidation. In general, a high correlation coefficient (R2 �
0.8) was obtained for the different tests of the data vali-dation for both fractions. However, PED showed very lowcorrelation coefficients of determination for Cl� and K,probably because of the lower concentration levels. Coef-ficients of determination were higher in XAL, although avalue of 0.5 for Cl� versus Cl was obtained during theNovember 2001 campaign. Data analysis of K�/K indi-cated that there were local sources of vegetative burningin different seasons and locations. Thus, XAL and MERshowed very high R2s (�0.9) in November 2000, XAL inMarch 2001, and MER in November 2001 and March2002. However, it must be pointed out that R2 for PED inNovember 2001 was 0.92.
Basic Statistics of PM2.5 and PM10 MassBox plots of 24-hr average PM2.5 and PM10 concentrationscollected at three Mexico City sites during 2000–2002 areshown in Figure 5. The highest concentrations and datadispersion were observed in XAL for both fractions. Ingeneral, similar average and median concentrations werefound for both size fractions, implying that samples werenormally distributed. Average and median PM2.5 were50.8 and 51.8 �g/m3 at XAL, 31.3 and 30.6 �g/m3 at MER,and 22.9 and 22.9 �g/m3 at PED, respectively. PM10 av-erages of 117.4, 67.4, and 43.4 �g/m3, and medians of121, 65.8, and 44.8 �g/m3 were found at the XAL, MER,and PED sites, respectively. The largest concentrationvariation was found in PM10 at XAL, where an extrememoderate (1.5 times the difference of P75 � P25) value(68.3 �g/m3) was observed. This is consistent with thehigh industrial activity and abundance of mobile sourcesin this northeastern part of the city.
Among the 12-hr samples, PM2.5 and PM10 concen-trations at XAL and PED were lower during the nighttimeperiod (6:00 p.m.–6:00 a.m.) than the daytime period(6:00 p.m.-6:00 a.m.). At MER, nighttime and daytimeconcentrations were very similar but with larger concen-tration variations.
Table 1. PM2.5/PM10 ratios of 24-hr average concentrations and standard
deviation at XAL, MER, and PED within Mexico City between November 2000 and
March 2002.
PM2.5/PM10 Ratio
Xalostoc (n) La Merced (n) Pedregal (n)
November 2000 0.4 � 0.11 (20) 0.5 � 0.07 (20) 0.67 � 0.06 (20)
March 2001 0.39 � 0.04 (20) 0.37 � 0.08 (20) 0.51 � 0.11 (20)
November 2001 0.43 � 0.06 (28) 0.5 � 0.08 (36) 0.41 � 0.11 (28)
March 2002 0.45 � 0.08 (28) 0.47 � 0.1 (24) 0.54 � 0.11 (28)
Average Ratios 0.42 � 0.07 0.46 � 0.09 0.52 � 0.13
Note: n � number of samples for each period.
Vega et al.
788 Journal of the Air & Waste Management Association Volume 54 July 2004

Figure 2. Correlation coefficients of babs (Mm�1) and EC concentration (�g/m3) of PM2.5 and PM10 during the 2000–2002 monitoring campaigns.
Figure 3. Correlation coefficients of the PM2.5 spatial averages during 2000–2002. Calculated NH4� � 10.38 � SO4
2� � 0.29 � NO3� (assuming
all SO42� and NO3
� are fully neutralized).
Vega et al.
Volume 54 July 2004 Journal of the Air & Waste Management Association 789

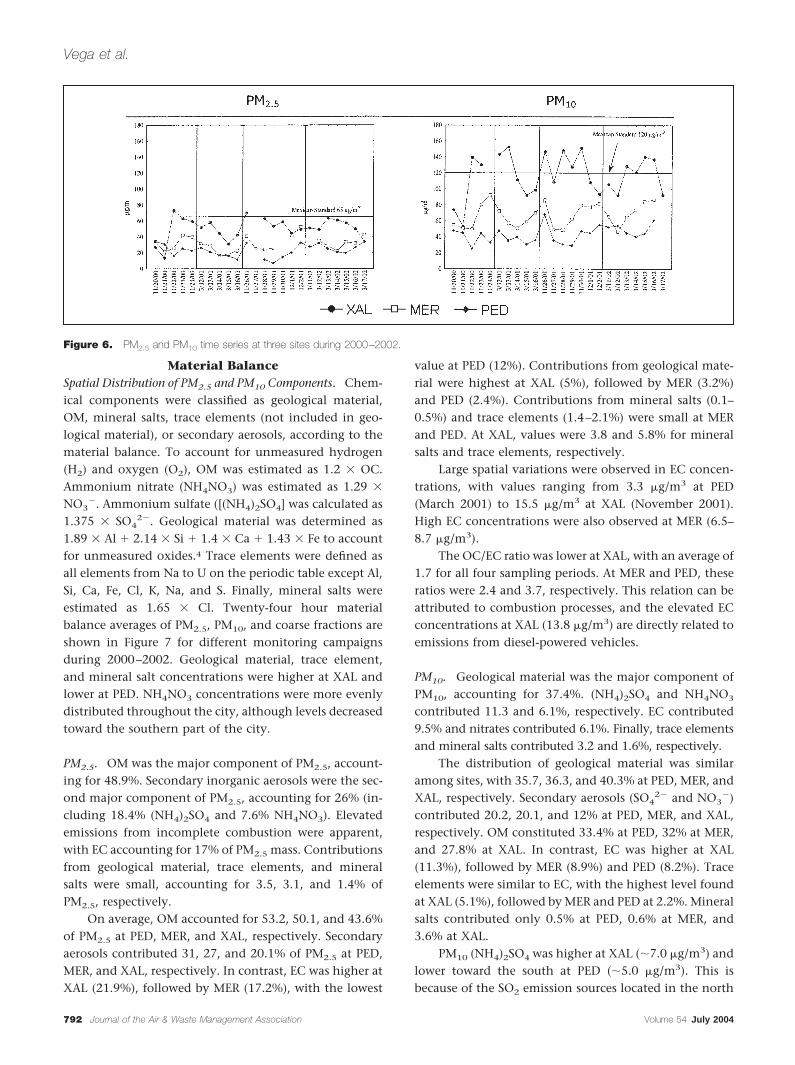
PM2.5 and PM10 Time SeriesFigure 6 shows that the highest PM2.5 and PM10 concen-trations were observed at the industrial XAL site, whereasthe lowest concentrations were recorded at the residentialPED site. Similar results were found during the 1997IMADA-AVER Campaign.5 Mexico’s recent 24-hr PM2.5
standard of 65 �g/m3 (NOM-025-SSA1–1993) was ex-ceeded at XAL on two sampling days (70.0 �g/m3 onNovember 26, 2001, and 73.3 �g/m3 on November 22,2000). The 24-hr PM10 standard of 120 �g/m3 was ex-ceeded at XAL on 12 sampling days, with a maximumconcentration of 152.7 �g/m3 on March 13, 2001.
PM2.5 and PM10 Chemical CompositionAverage and maximum mass, babs, and chemical concen-trations of 24-hr PM2.5 and PM10 are shown in Tables 2
and 3, respectively. PM2.5 constituted 46% of spatialaverage PM10 mass and a higher portion (50%) toward thesouth of the city. Average PM2.5 concentration varied3-fold from 22.4 �g/m3 at PED to 73.3 �g/m3 at XAL, witha spatial average of 35 �g/m3. Spatial variations of PM10
were 30%, with a spatial average of 76 �g/m3. Theselevels are similar to the 38.7 �g/m3 PM2.5 and 72 �g/m3
PM10 reported during the 1997 IMADA-AVER campaign.4
Elevated levels of OC, EC, NO3�, SO4
2�, NH4�, and
Pb were found on PM2.5 exceedance days. The highestmeasured concentrations occurred on November 23,2000, with 35 �g/m3 OC, 15 �g/m3 EC, 9.45 �g/m3 NO3
�,8.8 �g/m3 SO4
2�, 6.9 �g/m3 NH4�, and 1.98 �g/m3 Pb.
Cu and Zn concentrations were also elevated.When the PM10 standard was exceeded, Al, Si, Ca, Fe,
Cu, Zn, and Ba concentrations were high. Elevated levels
Figure 4. Correlation coefficients of the PM10 spatial averages during 2000–2002. Calculated NH4� � 10.38 � SO4
2� � 0.29 � NO3� (assuming
all SO42� and NO3
� are fully neutralized).
Vega et al.
790 Journal of the Air & Waste Management Association Volume 54 July 2004

of geological elements (Al, Si, Ca, Fe, Cu, Zn, and Ba) werefound on PM10 exceedance days. On November 22 and23, 2000, NO3
�, SO42�, and NH4
� concentrations were10.5, 10.3, and 6.5 �g/m3, respectively; these values were1.5–3 times higher than the spatial averages of 3.6, 6.4,and 2.9 �g/m3, respectively. When the standard wasexceeded at XAL, the major contributors were geologicalmaterial (24%), EC (13%), and secondary aerosols (10%,
including 4.3% NO3� and 5.7% SO4
2�). The maximum Pbconcentration (2.1 �g/m3 measured at XAL on November22, 2000) was 7 times higher than the site average. PM10
OC and EC levels were also elevated on these two days,reaching 41 and 37 �g/m3, respectively, although the max-imum OC concentration (44.7 �g/m3) was measured onNovember 30, 2001. These levels are 2–4 times higher thanthe spatial averages of OC (21.6 �g/m3) and EC (8.8 �g/m3).
Figure 5. PM2.5 and PM10 basic statistics at different sampling periods at three sites.
Vega et al.
Volume 54 July 2004 Journal of the Air & Waste Management Association 791
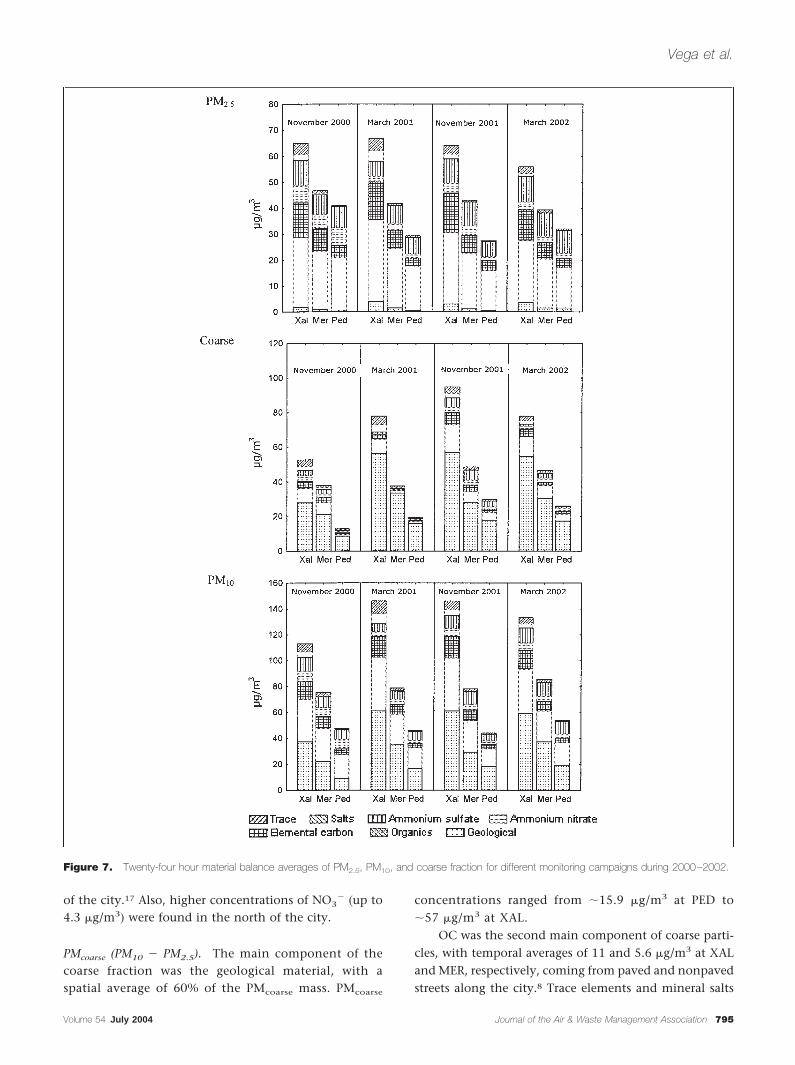
Material BalanceSpatial Distribution of PM2.5 and PM10 Components. Chem-ical components were classified as geological material,OM, mineral salts, trace elements (not included in geo-logical material), or secondary aerosols, according to thematerial balance. To account for unmeasured hydrogen(H2) and oxygen (O2), OM was estimated as 1.2 � OC.Ammonium nitrate (NH4NO3) was estimated as 1.29 �
NO3�. Ammonium sulfate ([(NH4)2SO4] was calculated as
1.375 � SO42�. Geological material was determined as
1.89 � Al � 2.14 � Si � 1.4 � Ca � 1.43 � Fe to accountfor unmeasured oxides.4 Trace elements were defined asall elements from Na to U on the periodic table except Al,Si, Ca, Fe, Cl, K, Na, and S. Finally, mineral salts wereestimated as 1.65 � Cl. Twenty-four hour materialbalance averages of PM2.5, PM10, and coarse fractions areshown in Figure 7 for different monitoring campaignsduring 2000–2002. Geological material, trace element,and mineral salt concentrations were higher at XAL andlower at PED. NH4NO3 concentrations were more evenlydistributed throughout the city, although levels decreasedtoward the southern part of the city.
PM2.5. OM was the major component of PM2.5, account-ing for 48.9%. Secondary inorganic aerosols were the sec-ond major component of PM2.5, accounting for 26% (in-cluding 18.4% (NH4)2SO4 and 7.6% NH4NO3). Elevatedemissions from incomplete combustion were apparent,with EC accounting for 17% of PM2.5 mass. Contributionsfrom geological material, trace elements, and mineralsalts were small, accounting for 3.5, 3.1, and 1.4% ofPM2.5, respectively.
On average, OM accounted for 53.2, 50.1, and 43.6%of PM2.5 at PED, MER, and XAL, respectively. Secondaryaerosols contributed 31, 27, and 20.1% of PM2.5 at PED,MER, and XAL, respectively. In contrast, EC was higher atXAL (21.9%), followed by MER (17.2%), with the lowest
value at PED (12%). Contributions from geological mate-rial were highest at XAL (5%), followed by MER (3.2%)and PED (2.4%). Contributions from mineral salts (0.1–0.5%) and trace elements (1.4–2.1%) were small at MERand PED. At XAL, values were 3.8 and 5.8% for mineralsalts and trace elements, respectively.
Large spatial variations were observed in EC concen-trations, with values ranging from 3.3 �g/m3 at PED(March 2001) to 15.5 �g/m3 at XAL (November 2001).High EC concentrations were also observed at MER (6.5–8.7 �g/m3).
The OC/EC ratio was lower at XAL, with an average of1.7 for all four sampling periods. At MER and PED, theseratios were 2.4 and 3.7, respectively. This relation can beattributed to combustion processes, and the elevated ECconcentrations at XAL (13.8 �g/m3) are directly related toemissions from diesel-powered vehicles.
PM10. Geological material was the major component ofPM10, accounting for 37.4%. (NH4)2SO4 and NH4NO3
contributed 11.3 and 6.1%, respectively. EC contributed9.5% and nitrates contributed 6.1%. Finally, trace elementsand mineral salts contributed 3.2 and 1.6%, respectively.
The distribution of geological material was similaramong sites, with 35.7, 36.3, and 40.3% at PED, MER, andXAL, respectively. Secondary aerosols (SO4
2� and NO3�)
contributed 20.2, 20.1, and 12% at PED, MER, and XAL,respectively. OM constituted 33.4% at PED, 32% at MER,and 27.8% at XAL. In contrast, EC was higher at XAL(11.3%), followed by MER (8.9%) and PED (8.2%). Traceelements were similar to EC, with the highest level foundat XAL (5.1%), followed by MER and PED at 2.2%. Mineralsalts contributed only 0.5% at PED, 0.6% at MER, and3.6% at XAL.
PM10 (NH4)2SO4 was higher at XAL (7.0 �g/m3) andlower toward the south at PED (5.0 �g/m3). This isbecause of the SO2 emission sources located in the north
Figure 6. PM2.5 and PM10 time series at three sites during 2000–2002.
Vega et al.
792 Journal of the Air & Waste Management Association Volume 54 July 2004
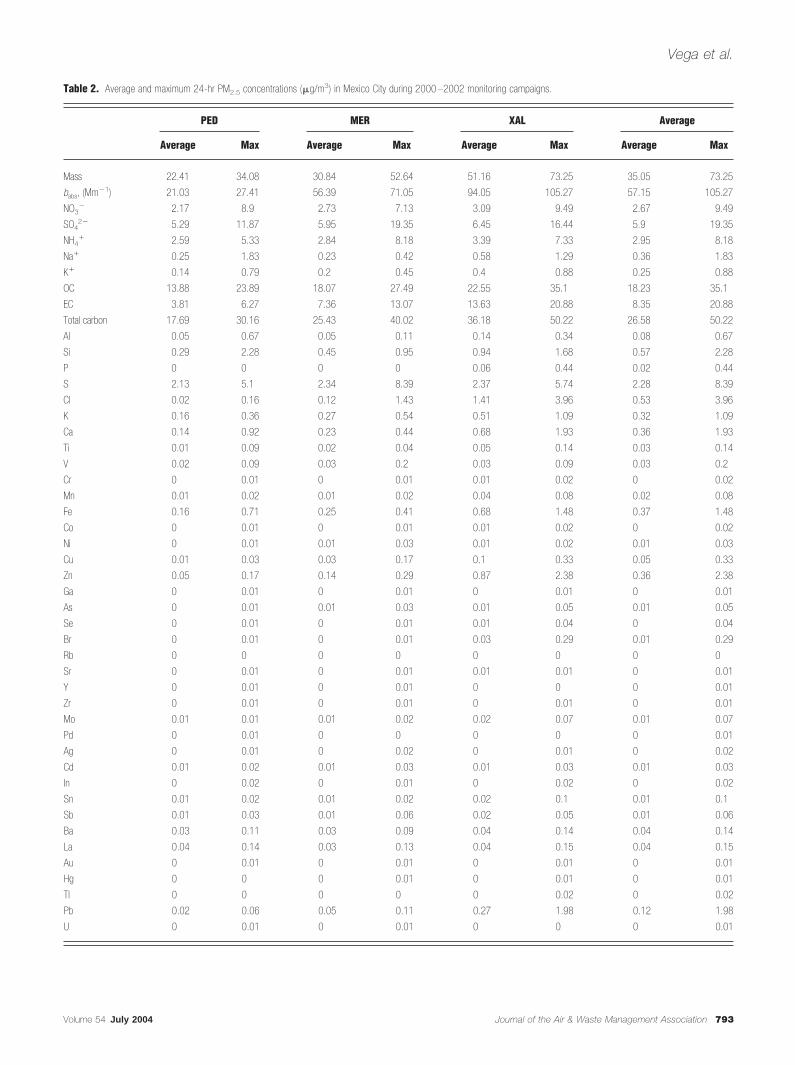
Table 2. Average and maximum 24-hr PM2.5 concentrations (�g/m3) in Mexico City during 2000 –2002 monitoring campaigns.
PED MER XAL Average
Average Max Average Max Average Max Average Max
Mass 22.41 34.08 30.84 52.64 51.16 73.25 35.05 73.25
babs, (Mm�1) 21.03 27.41 56.39 71.05 94.05 105.27 57.15 105.27
NO3� 2.17 8.9 2.73 7.13 3.09 9.49 2.67 9.49
SO42� 5.29 11.87 5.95 19.35 6.45 16.44 5.9 19.35
NH4� 2.59 5.33 2.84 8.18 3.39 7.33 2.95 8.18
Na� 0.25 1.83 0.23 0.42 0.58 1.29 0.36 1.83
K� 0.14 0.79 0.2 0.45 0.4 0.88 0.25 0.88
OC 13.88 23.89 18.07 27.49 22.55 35.1 18.23 35.1
EC 3.81 6.27 7.36 13.07 13.63 20.88 8.35 20.88
Total carbon 17.69 30.16 25.43 40.02 36.18 50.22 26.58 50.22
Al 0.05 0.67 0.05 0.11 0.14 0.34 0.08 0.67
Si 0.29 2.28 0.45 0.95 0.94 1.68 0.57 2.28
P 0 0 0 0 0.06 0.44 0.02 0.44
S 2.13 5.1 2.34 8.39 2.37 5.74 2.28 8.39
Cl 0.02 0.16 0.12 1.43 1.41 3.96 0.53 3.96
K 0.16 0.36 0.27 0.54 0.51 1.09 0.32 1.09
Ca 0.14 0.92 0.23 0.44 0.68 1.93 0.36 1.93
Ti 0.01 0.09 0.02 0.04 0.05 0.14 0.03 0.14
V 0.02 0.09 0.03 0.2 0.03 0.09 0.03 0.2
Cr 0 0.01 0 0.01 0.01 0.02 0 0.02
Mn 0.01 0.02 0.01 0.02 0.04 0.08 0.02 0.08
Fe 0.16 0.71 0.25 0.41 0.68 1.48 0.37 1.48
Co 0 0.01 0 0.01 0.01 0.02 0 0.02
Ni 0 0.01 0.01 0.03 0.01 0.02 0.01 0.03
Cu 0.01 0.03 0.03 0.17 0.1 0.33 0.05 0.33
Zn 0.05 0.17 0.14 0.29 0.87 2.38 0.36 2.38
Ga 0 0.01 0 0.01 0 0.01 0 0.01
As 0 0.01 0.01 0.03 0.01 0.05 0.01 0.05
Se 0 0.01 0 0.01 0.01 0.04 0 0.04
Br 0 0.01 0 0.01 0.03 0.29 0.01 0.29
Rb 0 0 0 0 0 0 0 0
Sr 0 0.01 0 0.01 0.01 0.01 0 0.01
Y 0 0.01 0 0.01 0 0 0 0.01
Zr 0 0.01 0 0.01 0 0.01 0 0.01
Mo 0.01 0.01 0.01 0.02 0.02 0.07 0.01 0.07
Pd 0 0.01 0 0 0 0 0 0.01
Ag 0 0.01 0 0.02 0 0.01 0 0.02
Cd 0.01 0.02 0.01 0.03 0.01 0.03 0.01 0.03
In 0 0.02 0 0.01 0 0.02 0 0.02
Sn 0.01 0.02 0.01 0.02 0.02 0.1 0.01 0.1
Sb 0.01 0.03 0.01 0.06 0.02 0.05 0.01 0.06
Ba 0.03 0.11 0.03 0.09 0.04 0.14 0.04 0.14
La 0.04 0.14 0.03 0.13 0.04 0.15 0.04 0.15
Au 0 0.01 0 0.01 0 0.01 0 0.01
Hg 0 0 0 0.01 0 0.01 0 0.01
Tl 0 0 0 0 0 0.02 0 0.02
Pb 0.02 0.06 0.05 0.11 0.27 1.98 0.12 1.98
U 0 0.01 0 0.01 0 0 0 0.01
Vega et al.
Volume 54 July 2004 Journal of the Air & Waste Management Association 793

Table 3. Average and maximum 24-hr PM10 concentrations (�g/m3) in Mexico City during the 2000 –2002 monitoring campaigns.
PED MER XAL Average
Average Max Average Max Average Max Average Max
Mass 43.73 68.25 67.44 92.6 117.43 152.71 75.74 152.71
babs (Mm�1) 27.63 31.69 55.13 67.21 105.8 124.25 62.85 124.25
NO3� 2.73 8.88 3.71 8.37 4.32 11.02 3.58 11.02
SO42� 5.29 13.67 6.56 25.94 7.37 18.29 6.39 25.94
NH4� 2.49 5.76 2.91 10.23 3.38 7.17 2.92 10.23
Na� 0.2 0.56 0.37 0.72 0.98 1.7 0.51 1.7
K� 0.16 0.36 0.35 0.71 0.58 0.91 0.36 0.91
OC 13.63 20.08 20.28 30.01 31.2 44.66 21.59 44.66
EC 3.53 6.29 7.69 12.54 15.27 22.23 8.75 22.23
Total carbon 17.16 26.13 27.98 42.47 46.47 66.89 30.34 66.89
Al 1.54 3.33 2.82 5.42 4.54 6.48 2.95 6.48
Si 4.81 9.98 9.37 15.69 16.94 23.79 10.29 23.79
P 0 0.02 0 0.04 0.16 0.83 0.05 0.83
S 2.29 5.41 2.63 8.79 2.63 6.44 2.52 8.79
Cl 0.07 0.59 0.37 2.05 2.84 7.04 1.08 7.04
K 0.44 0.83 0.82 1.5 1.39 2.5 0.88 2.5
Ca 1.33 2.29 2.55 4.25 5.08 8.66 2.97 8.66
Ti 0.08 0.17 0.12 0.23 0.29 0.58 0.16 0.58
V 0.02 0.1 0.04 0.27 0.05 0.21 0.04 0.27
Cr 0 0.01 0.01 0.01 0.02 0.04 0.01 0.04
Mn 0.02 0.03 0.04 0.05 0.08 0.15 0.05 0.15
Fe 0.84 1.44 1.46 2.21 3.05 4.88 1.77 4.88
Co 0.01 0.01 0.01 0.02 0.02 0.04 0.01 0.04
Ni 0.01 0.02 0.01 0.05 0.01 0.04 0.01 0.05
Cu 0.02 0.05 0.06 0.21 0.13 0.38 0.07 0.38
Zn 0.06 0.27 0.2 0.38 1.05 2.77 0.43 2.77
Ga 0 0.01 0 0.01 0 0.01 0 0.01
As 0 0.01 0.01 0.06 0.01 0.07 0.01 0.07
Se 0 0.01 0 0.01 0.01 0.04 0.01 0.04
Br 0 0.01 0 0.02 0.03 0.34 0.01 0.34
Rb 0 0 0 0 0 0.01 0 0.01
Sr 0.01 0.02 0.02 0.03 0.03 0.05 0.02 0.05
Y 0 0.01 0 0.01 0 0.01 0 0.01
Zr 0.01 0.01 0.01 0.01 0.02 0.04 0.01 0.04
Mo 0.01 0.01 0.01 0.01 0.02 0.08 0.01 0.08
Pd 0 0.01 0 0.01 0 0.01 0 0.01
Ag 0 0.02 0 0.02 0 0.02 0 0.02
Cd 0.01 0.02 0.01 0.02 0.01 0.04 0.01 0.04
In 0.01 0.02 0 0.01 0.01 0.02 0 0.02
Sn 0 0.02 0.01 0.04 0.03 0.12 0.02 0.12
Sb 0.01 0.03 0.02 0.05 0.01 0.05 0.01 0.05
Ba 0.05 0.17 0.07 0.24 0.12 0.34 0.08 0.34
La 0.03 0.11 0.04 0.16 0.02 0.11 0.03 0.16
Au 0 0.01 0 0.01 0 0.01 0 0.01
Hg 0 0 0 0.01 0 0.01 0 0.01
Tl 0 0 0 0 0 0.04 0 0.04
Pb 0.03 0.08 0.08 0.14 0.31 2.14 0.14 2.14
U 0 0.01 0 0.01 0 0.01 0 0.01
Vega et al.
794 Journal of the Air & Waste Management Association Volume 54 July 2004
of the city.17 Also, higher concentrations of NO3� (up to
4.3 �g/m3) were found in the north of the city.
PMcoarse (PM10 � PM2.5). The main component of thecoarse fraction was the geological material, with aspatial average of 60% of the PMcoarse mass. PMcoarse
concentrations ranged from 15.9 �g/m3 at PED to57 �g/m3 at XAL.
OC was the second main component of coarse parti-cles, with temporal averages of 11 and 5.6 �g/m3 at XALand MER, respectively, coming from paved and nonpavedstreets along the city.8 Trace elements and mineral salts
Figure 7. Twenty-four hour material balance averages of PM2.5, PM10, and coarse fraction for different monitoring campaigns during 2000–2002.
Vega et al.
Volume 54 July 2004 Journal of the Air & Waste Management Association 795

contributed with 3.8 and 2.6 �g/m3 at XAL and 1.3 and0.5 �g/m3 at MER. EC and secondary aerosols contributedwith concentrations lower than 5 �g/m3 at XAL. In MER,contribution by secondary aerosols was less significant(2 �g/m3 of NO3
�, 3 �g/m3 of SO42�), whereas EC
contribution was 2.3 �g/m3. In PED, after geologicalmaterial, OC, and secondary aerosols were the secondmost important components, with 2.7 and 2.4 �g/m3,respectively.
Daily Temporal Variations. Daily variations in PMcoarse
geological material (i.e., Al, Si, Ca, and Fe) are shown inFigure 8. Note that Si is the most abundant species, ac-counting for 25% of PMcoarse mass for all three sites. Ingeneral, Ca and Al contributions were less than 50% ofthat of Si, and Fe contributions were less than 25% of thatof Si. PMcoarse mass was more than 53% of PM10 mass ateach site, and the PMcoarse spatial average was 58% ofPM10.
Comparison between 1997 and 2000–2002Mexico City Data
Table 4 shows the comparison between 1997 and 2000–2002 data for Mexico City.4,5 PM10 mass observed in the2000–2002 period increased slightly from 1997 levels,whereas PM2.5 remained unchanged. However, the OCconcentration increased by 1.5 and 1.7 times for PM10
and PM2.5, respectively, which can be attributed to thegrowth of the Mexico City’s vehicle fleet and an incre-ment of industrial and commercial activities. NH4
� andSO4
2� also increased slightly in both size fractions.
Comparison of PM2.5 and PM10 Mass, OC, and ECamong Different Urban Locations
Figure 9 shows a comparison among atmospheric PMconcentrations observed in Mexico City; Santiago, SaoPaulo, and Los Angeles. PM10 concentrations are compa-rable to those recorded in Sao Paulo in 198617 but aremuch lower than those found in Santiago in 1991.18 Av-erage PM10 concentrations in Mexico City in the 1980swere comparable to those in Santiago in 1991, althoughsome 24-hr levels in Mexico City were as high as 918�g/m3. The higher OC and EC levels in Santiago areprimarily attributable to uncombusted diesel, lubricatingoil, and other petrochemical fuel used.18 Annual PM10
geometric means of 265, 213, and 285 �g/m3 were measuredin 1988, 1989, and 1990, respectively, in southeastern
Figure 8. Temporal variation of coarse fraction (PM10 � PM2.5) massand geological material at three sites during 2000 and 2002.
Table 4. Comparison between 1997 and 2000 –2002 of PM2.5 and PM10 total
mass (�g/m3), chemical species, and standard deviation in Mexico City.
PM2.5 PM10
1997 2000–2002 1997 2000–2002
Total mass 35.2 � 9.93 35 � 14.32 70.7 � 27.95 75.7 � 37.62
Total carbon 15.8 � 4.36 26.6 � 9.31 20.2 � 6.35 30.3 � 14.82
OC 10 � 1.84 18.3 � 4.29 13.9 � 3.63 21.6 � 8.87
EC 5.8 � 2.69 8.4 � 5.03 6.4 � 2.79 8.8 � 5.95
NH4� 2.2 � 0.34 2.9 � 0.37 2.1 � 0.45 2.9 � 0.45
NO3� 2.8 � 0.44 2.6 � 0.43 3.8 � 0.56 3.6 � 0.8
SO42� 5.1 � 0.64 5.9 � 0.5 5.8 � 0.87 6.4 � 1.05
Na� 0.3 � 0.29 0.4 � 0.2 0.4 � 0.2 0.5 � 0.41
K� 0.2 � 0.05 0.3 � 0.13 0.7 � 0.89 0.4 � 0.21
Vega et al.
796 Journal of the Air & Waste Management Association Volume 54 July 2004
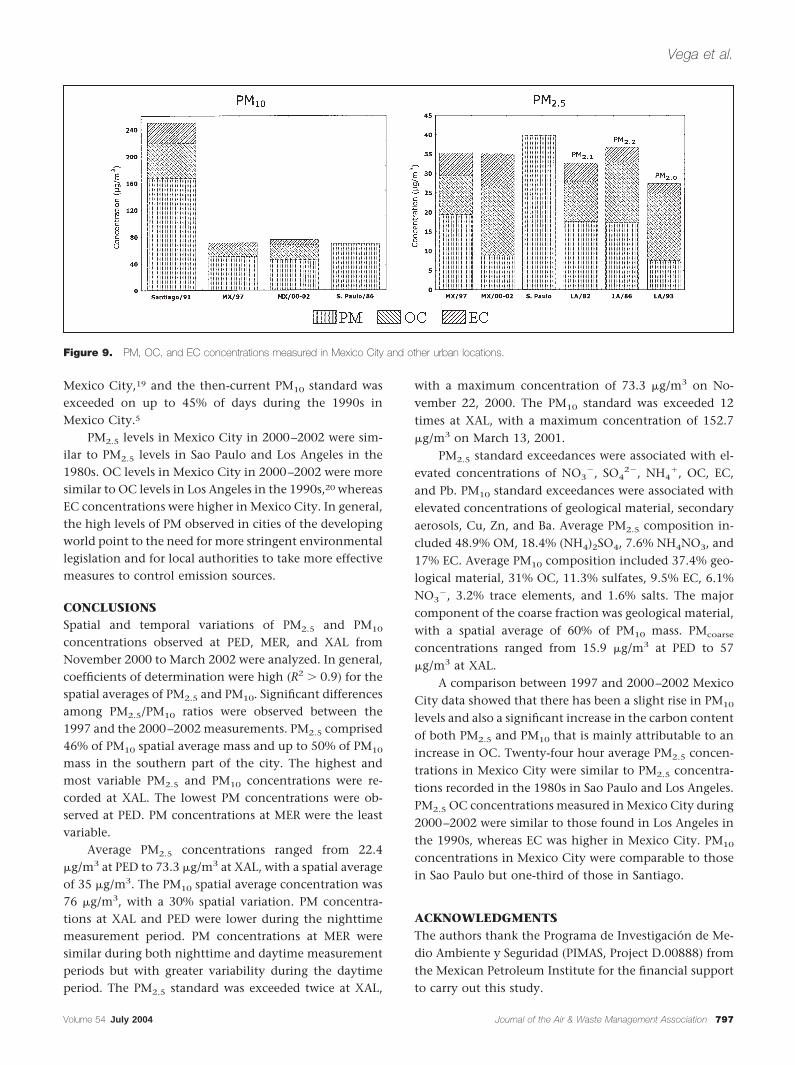
Mexico City,19 and the then-current PM10 standard wasexceeded on up to 45% of days during the 1990s inMexico City.5
PM2.5 levels in Mexico City in 2000–2002 were sim-ilar to PM2.5 levels in Sao Paulo and Los Angeles in the1980s. OC levels in Mexico City in 2000–2002 were moresimilar to OC levels in Los Angeles in the 1990s,20 whereasEC concentrations were higher in Mexico City. In general,the high levels of PM observed in cities of the developingworld point to the need for more stringent environmentallegislation and for local authorities to take more effectivemeasures to control emission sources.
CONCLUSIONSSpatial and temporal variations of PM2.5 and PM10
concentrations observed at PED, MER, and XAL fromNovember 2000 to March 2002 were analyzed. In general,coefficients of determination were high (R2 � 0.9) for thespatial averages of PM2.5 and PM10. Significant differencesamong PM2.5/PM10 ratios were observed between the1997 and the 2000–2002 measurements. PM2.5 comprised46% of PM10 spatial average mass and up to 50% of PM10
mass in the southern part of the city. The highest andmost variable PM2.5 and PM10 concentrations were re-corded at XAL. The lowest PM concentrations were ob-served at PED. PM concentrations at MER were the leastvariable.
Average PM2.5 concentrations ranged from 22.4�g/m3 at PED to 73.3 �g/m3 at XAL, with a spatial averageof 35 �g/m3. The PM10 spatial average concentration was76 �g/m3, with a 30% spatial variation. PM concentra-tions at XAL and PED were lower during the nighttimemeasurement period. PM concentrations at MER weresimilar during both nighttime and daytime measurementperiods but with greater variability during the daytimeperiod. The PM2.5 standard was exceeded twice at XAL,
with a maximum concentration of 73.3 �g/m3 on No-vember 22, 2000. The PM10 standard was exceeded 12times at XAL, with a maximum concentration of 152.7�g/m3 on March 13, 2001.
PM2.5 standard exceedances were associated with el-evated concentrations of NO3
�, SO42�, NH4
�, OC, EC,and Pb. PM10 standard exceedances were associated withelevated concentrations of geological material, secondaryaerosols, Cu, Zn, and Ba. Average PM2.5 composition in-cluded 48.9% OM, 18.4% (NH4)2SO4, 7.6% NH4NO3, and17% EC. Average PM10 composition included 37.4% geo-logical material, 31% OC, 11.3% sulfates, 9.5% EC, 6.1%NO3
�, 3.2% trace elements, and 1.6% salts. The majorcomponent of the coarse fraction was geological material,with a spatial average of 60% of PM10 mass. PMcoarse
concentrations ranged from 15.9 �g/m3 at PED to 57�g/m3 at XAL.
A comparison between 1997 and 2000–2002 MexicoCity data showed that there has been a slight rise in PM10
levels and also a significant increase in the carbon contentof both PM2.5 and PM10 that is mainly attributable to anincrease in OC. Twenty-four hour average PM2.5 concen-trations in Mexico City were similar to PM2.5 concentra-tions recorded in the 1980s in Sao Paulo and Los Angeles.PM2.5 OC concentrations measured in Mexico City during2000–2002 were similar to those found in Los Angeles inthe 1990s, whereas EC was higher in Mexico City. PM10
concentrations in Mexico City were comparable to thosein Sao Paulo but one-third of those in Santiago.
ACKNOWLEDGMENTSThe authors thank the Programa de Investigacion de Me-dio Ambiente y Seguridad (PIMAS, Project D.00888) fromthe Mexican Petroleum Institute for the financial supportto carry out this study.
Figure 9. PM, OC, and EC concentrations measured in Mexico City and other urban locations.
Vega et al.
Volume 54 July 2004 Journal of the Air & Waste Management Association 797
REFERENCES1. Schifter, I.; Diaz, L.; Vera, M.; Guzman, E.; Lopez-Salinas, E. Impact of
Sulfur-in-Gasoline on Motor Vehicle Emissions in the MetropolitanArea of Mexico City; Fuel 2003, 82, 1605-1612.
2. Aldape, F.; Flores, J.; Dıaz, R.; Miranda, J.; Cahill, T.; Morales, J. TwoYears Study of Elemental Composition of Atmospheric Aerosols inMexico City; Int. J. PIXE; 1991, 4, 373-388.
3. Miranda, J.; Crespo, I.; Morales, M.A. Absolute Principal ComponentAnalysis of Atmospheric Aerosols in Mexico City; Environ. Sci. Pollut.Res. 2000, 7, 1-5.
4. Chow, J.C.; Watson, J.G.; Edgerton, S.A.; Vega, E. Chemical Compo-sition of PM2.5 and PM10 in Mexico City during Winter 1997; Sci. TotalEnviron. 2002, 287, 177-201.
5. Vega, E.; Reyes, E.; Sanchez, G.; Ortiz, E.; Ruiz, M.; Chow, J.; Watson,J.; Edgerton, S. Basic Statistics of PM10 and PM2.5 in the Atmosphere ofMexico City; Sci. Total Environ. 2002, 287, 167-176.
6. Edgerton, S.A.; Bian, X.; Doran, J.C.; Fast, J.D.; Hubbe, J.M.; Malone,E.L.; Shaw, W.J.; Whiteman, C.D.; Zhong, S.; Arriaga, J.L.; et al. Par-ticulate Air Pollution in Mexico City; J. Air & Waste Manage. Assoc.1999, 49, 1221-1229.
7. Chow, J.C.; Watson, J.G.; Edgerton, S.A.; Vega, E.; Ortiz, E. SpatialDifferences in Outdoor PM10 Mass and Aerosol Composition in Mex-ico City; J. Air & Waste Manage. Assoc. 2002, 52, 423-434.
8. Vega, E.; Mugica, V.; Reyes, E.; Sanchez, G.; Chow, J.; Watson,J. Chemical Composition of Fugitive Dust Emitters in Mexico City;Atmos. Environ. 2001, 35, 4033-4039.
9. Chow, J.; Fujita, E.; Watson, J.; Zhiqiang, L.; Lawson, D.; Ashbaugh, L.Evaluation of Filter-Based Aerosol Measurements during the 1987Southern California Air Quality Study; Environ. Monitor. Assess. 1994,30, 49-80.
10. Chow, J. Measurement Methods to Determine Compliance with Am-bient Air Quality Standards for Suspended Particles; J. Air & WasteManage. Assoc. 1995, 45, 320-382.
11. Watson, J.G.; Chow, J.C.; Frazier, C.A. X-Ray Fluorescence Analysis ofAmbient Air Samples. In Elemental Analysis of Airborne Particles; Lands-berger, S., Creatchman, M., Eds.; Gordon and Breach: Newark, NJ,1999; pp 67-96.
12. Chow, J.C.; Watson, J.G. Ion Chromatography. In Elemental Analysisof Airborne Particles; Landsberger, S., Creatchman, M., Eds.; Gordonand Breach: Newark, NJ, 1999; pp 97-137.
13. Chow, J.C.; Watson, J.G.; Crow, D.; Lowenthal, D.H.; Merrifield, T.Comparison of IMPROVE and NIOSH Carbon Measurements; AerosolSci. Technol. 2001, 34, 1-12.
14. Watson, J.G.; Lioy, P.; Mueller, P. The Measurement Process: Precision,Accuracy, and Validity. In Air Sampling Instruments for Evaluation ofAtmospheric Contaminants, 8th ed.; Cohen, B., Hering S., Eds.; Ameri-can Conference of Governmental Industrial Hygienists: Cincinnati,OH, 1995; Chapter 10.
15. Chow, J.; Watson, J.; Zhiqiang, L.; Lowenthal, D.; Frazier, C.; So-lomon, P.; Thuillier, R.; Magliano, K. Descriptive Analysis of PM2.5 andPM10 at Regionally Representative Locations during SJVAQS/AUSPEX;Atmos. Environ. 1996, 12, 2079-2112.
16. Chow, J.; Fujita, E.; Watson, J.; Zhiqiang, L.; Lawson, D.; Ashbaugh, L.Evaluation of Filter-Based Aerosol Measurements during the 1987Southern California Air Quality Study; Environ. Monitor. Assess. 1994,30, 49-80.
17. Alonso, C.D.; Martins, M.H.R.B.; Romano, J.; Godinho, R. Sao PauloAerosol Characterization Study; J. Air & Waste Manage Assoc. 1997, 47,1297-1300.
18. Didyk, B.M.; Simoneit, B.R.T.; Pezoa, L.A.; Riveros, M.L.; Flores, A.A.Urban Aerosol Particles in Santiago, Chile: Organic Content and Mo-lecular Characterization; Atmos. Environ. 2000, 34, 1167-1179.
19. Vega, E.; Mora, V.; Mugica, V. Particulate Matter Pollution in MexicoCity. Presented at the 91st Annual Conference & Exhibition ofA&WMA, San Diego, CA, June 1998; Paper 98-TP57.04.
20. Christoforou, C.S.; Salmon, L.G.; Hannigan, M.P.; Solomon, P.A.;Cass, G.R. Trends in Fine Particle Concentration and Chemical Com-position in Southern California; J. Air & Waste Manage. Assoc. 2000,50, 43-53.
About the AuthorsElizabeth Vega, Elizabeth Reyes, Gabriela Sanchez, Ger-ardo Martınez-Villa, and Uriel Gonzalez are environmentalresearchers, Hugo Ruiz is a postgraduate student, andJose Garcıa is a laboratory technician at the Mexican Pe-troleum Institute in Mexico City, Mexico. Judith C. Chowand John G. Watson are research professors at the DesertResearch Institute, part of the University and CommunityCollege System of Nevada, in Reno, NV. Address corre-spondence to: Elizabeth Vega, Instituto Mexicano del Pe-troleo, Eje Central Lazaro Cardenas 152, Col. San BartoloAtepehuacan, Delegacion Gustavo A. Madero, 07730 Mex-ico, D.F.; fax: �(5255) 9175-6935; e-mail: [email protected].
Vega et al.
798 Journal of the Air & Waste Management Association Volume 54 July 2004