PM2.5 and ultrafine particles in passenger car cabins in ...
16
RESEARCH ARTICLE PM 2.5 and ultrafine particles in passenger car cabins in Sweden and northern China—the influence of filter age and pre-ionization Dixin Wei 1,2 & Filip Nielsen 1 & Lars Ekberg 2 & Anders Löfvendahl 1 & Maria Bernander 1 & Jan-Olof Dalenbäck 2 Received: 29 December 2019 /Accepted: 7 May 2020 # The Author(s) 2020 Abstract The main aim of the study was to evaluate the influence of filter status (new and aged), pre-ionization, on the particle filtration in modern passenger cars. Measurements of in-cabin and outside PM 2.5 (dp < 2.5 μm) concentration and UFP (ultrafine particle, dp < 100 nm) counts, to calculate I/O (indoor to outdoor) ratios, were performed. They were done at two locations, to study the influence of different outside conditions on the HVAC (heating, ventilation, and air-conditioning) system. The measurements were performed in two new cars, with similar HVAC systems and settings, using a new filter and an aged synthetic filter. Furthermore, an ionization unit was installed upstream of the filter in both cars. This enabled the study of filter status, with and without ionization, under common driving conditions. The results show that the HVAC system performances were very similar at the two locations, with average I/O ratios of 0.35–0.40 without ionization and 0.15–0.20 with ionization applied, although the outside conditions were considerably different. Furthermore, the aged filter clearly worsened the filtration ability. Considering the corresponding average PM 2.5 I/O ratios in one location as an example, the average for the new filter was 0.20 and 0.60 for the aged filter. The corresponding UFP I/O ratios were 0.24 and 0.57. Other findings are that the aged filter with ionization reached a performance close to the new filter (without ionization), and that increased ventilation airflow and decreased recirculation degree, as expected, led to an increase in the I/O ratio for both particle sizes. Keywords PM 2.5 . UFP . Ionization . Filter . Vehicle cabin . Airflow . Recirculation Introduction During the last 50 years, we have seen an increased population with increased living standards, followed by an increased number of plants for electricity generation and an ever- growing demand for transports, to a large extent based on fossil fuels. This has led to air quality problems, especially increased number of airborne particulate matter. Epidemiology studies have shown that high particle con- centrations influence human health. Gan et al. (2011) stated correlations between exposure to PM 2.5 (particles of aerody- namic diameter less than 2.5 μm) and risks of respiratory and cardiovascular diseases. UFPs (ultrafine particles, which have aerodynamic diameter less than 100 nm) can more easily de- posit in the lung alveoli (Mitsakou et al. 2007), cause greater inflammatory response and move to other organs (Oberdörster 2000). Vehicle passengers are specifically challenged with pollutants from dense surrounding traffic, where elevated par- ticle concentration could exist (Ramos et al. 2016), and also attributable to UFPs from traffic exposure potentially damage lung function (McCreanor et al. 2007). Nowadays, main protection against outdoor pollutions in vehicles is provided by HVAC (heating, ventilation, and air- conditioning) system, advanced filters, recirculation, incom- ing air sensors and improved cabin air tightness. Multi-layer filters containing active carbon, electrostatic filter, and two- step filters exist in different cars. However, filter causes a pressure drop which increases as dust loading builds up, and thus deterioration of particle removal. Besides, filters normal- ly provide lower removal at the most penetrating particle size around 100–300 nm. Thus, there is a need to know current air Responsible editor: Gerhard Lammel * Dixin Wei [email protected] 1 Volvo Car Corporation, Gothenburg, Sweden 2 Division of Building Services Engineering, Department of Architecture and Civil Engineering, Chalmers University of Technology, Gothenburg, Sweden https://doi.org/10.1007/s11356-020-09214-0 / Published online: 30 May 2020 Environmental Science and Pollution Research (2020) 27:30815–30830
-
Upload
khangminh22 -
Category
Documents
-
view
3 -
download
0
Transcript of PM2.5 and ultrafine particles in passenger car cabins in ...
RESEARCH ARTICLE
PM2.5 and ultrafine particles in passenger car cabins in Swedenand northern China—the influence of filter age and pre-ionization
Dixin Wei1,2 & Filip Nielsen1& Lars Ekberg2
& Anders Löfvendahl1 & Maria Bernander1 & Jan-Olof Dalenbäck2
Received: 29 December 2019 /Accepted: 7 May 2020# The Author(s) 2020
AbstractThe main aim of the study was to evaluate the influence of filter status (new and aged), pre-ionization, on the particle filtration inmodern passenger cars. Measurements of in-cabin and outside PM2.5 (dp < 2.5 μm) concentration and UFP (ultrafine particle, dp< 100 nm) counts, to calculate I/O (indoor to outdoor) ratios, were performed. They were done at two locations, to study theinfluence of different outside conditions on the HVAC (heating, ventilation, and air-conditioning) system. The measurementswere performed in two new cars, with similar HVAC systems and settings, using a new filter and an aged synthetic filter.Furthermore, an ionization unit was installed upstream of the filter in both cars. This enabled the study of filter status, with andwithout ionization, under common driving conditions. The results show that the HVAC system performances were very similar atthe two locations, with average I/O ratios of 0.35–0.40 without ionization and 0.15–0.20 with ionization applied, although theoutside conditions were considerably different. Furthermore, the aged filter clearly worsened the filtration ability. Consideringthe corresponding average PM2.5 I/O ratios in one location as an example, the average for the new filter was 0.20 and 0.60 for theaged filter. The corresponding UFP I/O ratios were 0.24 and 0.57. Other findings are that the aged filter with ionization reached aperformance close to the new filter (without ionization), and that increased ventilation airflow and decreased recirculation degree,as expected, led to an increase in the I/O ratio for both particle sizes.
Keywords PM2.5. UFP . Ionization . Filter . Vehicle cabin . Airflow . Recirculation
Introduction
During the last 50 years, we have seen an increased populationwith increased living standards, followed by an increasednumber of plants for electricity generation and an ever-growing demand for transports, to a large extent based onfossil fuels. This has led to air quality problems, especiallyincreased number of airborne particulate matter.
Epidemiology studies have shown that high particle con-centrations influence human health. Gan et al. (2011) stated
correlations between exposure to PM2.5 (particles of aerody-namic diameter less than 2.5 μm) and risks of respiratory andcardiovascular diseases. UFPs (ultrafine particles, which haveaerodynamic diameter less than 100 nm) can more easily de-posit in the lung alveoli (Mitsakou et al. 2007), cause greaterinflammatory response and move to other organs (Oberdörster2000). Vehicle passengers are specifically challenged withpollutants from dense surrounding traffic, where elevated par-ticle concentration could exist (Ramos et al. 2016), and alsoattributable to UFPs from traffic exposure potentially damagelung function (McCreanor et al. 2007).
Nowadays, main protection against outdoor pollutions invehicles is provided by HVAC (heating, ventilation, and air-conditioning) system, advanced filters, recirculation, incom-ing air sensors and improved cabin air tightness. Multi-layerfilters containing active carbon, electrostatic filter, and two-step filters exist in different cars. However, filter causes apressure drop which increases as dust loading builds up, andthus deterioration of particle removal. Besides, filters normal-ly provide lower removal at the most penetrating particle sizearound 100–300 nm. Thus, there is a need to know current air
Responsible editor: Gerhard Lammel
* Dixin [email protected]
1 Volvo Car Corporation, Gothenburg, Sweden2 Division of Building Services Engineering, Department of
Architecture and Civil Engineering, Chalmers University ofTechnology, Gothenburg, Sweden
https://doi.org/10.1007/s11356-020-09214-0
/ Published online: 30 May 2020
Environmental Science and Pollution Research (2020) 27:30815–30830
quality in vehicles and the influence of parameters, to supportthe development in the vehicle industry.
Particle level in-cabin has been studied in private cars,trams and other vehicles. The study scope mainly includedPM2.5, and sometimes UFP. The focus in the studies was onvariation of transportation microenvironments (Kaur et al.2005; Knibbs and de Dear 2010; Huang et al. 2012; Bothet al. 2013; Qiu et al. 2017), influence of ventilation settings(Zhu et al. 2007; Knibbs et al. 2010; Abi-Esber and El-Fadel2013; Jain 2017), influence of the surrounding traffic (Knibbset al. 2009), and measurement methods (Kumar et al. 2018).Basic information about these comparative studies is summa-rized in Table 4 in Appendix. Except for urban and highwaymeasurements, some studies in road tunnels were able to ex-pose vehicles to excessive particle levels and discovered ele-vated exposure to UFPs in the tunnel compared with urbanoutdoors (Kaminsky et al. 2009; Knibbs et al. 2010; NayebYazdi et al. 2019; Qiu et al. 2019).
Ambient particle concentration and filter ageing have beenrecognized to have dominant influence on in-cabin particleconcentrations, while aforementioned studies seldom com-pared different filter statuses and locations.
Pre-ionization of particles has been proven to increase thefiltration performance. Several studies presented improvementof filtration efficiency in test rigs or chambers, by 5–70% units(Agranovski et al. 2006; Park et al. 2011; Shi 2012).Ionization-combined filtration already stands for a large mar-ket share of air cleaners in building appliances (Kim et al.2017a), while application in vehicle environments is notcommon.
Thus, by performing vehicle on-road measurement, thisstudy aimed to expand the understanding of in-cabin and out-door levels of particles and gain knowledge about the influ-ence of filter status and pre-ionization. The measurementswere carried out at two sites—in a road tunnel in Swedenand on-road in Northern China—with different outdoor levelsof particles. All measurements were based on the use of thesame filters and similar HVAC systems. The measurementswere further carried out for a new filter, as well as an agedfilter, in both cases without and with pre-ionization. Differentventilation airflow and recirculation degrees were tested aswell. Controlled climate settings, such as air conditioning(AC) temperature and air distribution in different vents, wereused during all testings.
Methods
Measurement area and vehicle
The data utilized in this study were obtained from two mea-surement campaigns, to achieve extended data ranges in dif-ferent ambient particle concentration levels. Winter testing in
China and summer testing in Sweden also represented Asianand European environments.
Gothenburg city is located on the west coast of Sweden. Byyear 2018, this second largest city in Sweden reached a pop-ulation of around 571,900 people; the annual average atmo-spheric PM2.5 concentration was reported to 7.7 μg/m3 fromthe local environment monitoring station (GothenburgMunicipality 2018). In total, 250,483 motor vehicles were inuse in year 2018, 76% of the total vehicles were passengercars, and goods vehicles accounted for 9%; within passengercars, 56% were petrol powered, 34% diesel, hybrid 4%, andpure electric 1%, while 91% of goods vehicles were diesel(Transport Analysis 2018).
The Lundby Tunnel located in Gothenburg was chosen asthe test site, where the ambient particle level is elevated, com-pared with open city roads or highways in Gothenburg, sincetunnels exhibit low dispersion and dilution of pollutants.Westbound and eastbound directions each have 2 lanes.According to the local traffic management institute, totally26,562 vehicles passed the 2060-m-long tunnel in westbounddirection in 24 h and 85% of them were personal cars drivingin an average speed of 69 km/h, on April 26 in 2018 (SwedishTransport Adminstration 2018).
The measurements were performed during May 2018 untilJuly 2018, between 08:00 and 14:00 in rain-free days, whenrelative humidity was lower than 70%, to maintain a suitableworking environment for the measuring instruments. No ma-jor differences of the metrological parameters and no obvioustraffic events or congestions were noted. Repetitions of thesame test case were performed during different days with sim-ilar conditions. The test vehicle was standing inside the tunnelwith engine and HVAC system on, at an uphill emergencyparking spot in westbound direction, where passing vehiclescan be expected to release elevated pollutants. This was tomaintain long stable measurement periods for each test case,compared with driving through the tunnel which takes 2 min.
The winter measurements were performed during January2019 driving on freeways and highways, with speeds rangingwithin 50–120 km/h, along the relatively polluted 760-kmroute from Linyi to Beijing, Northern China, as in Fig. 1.Monthly average ambient PM2.5 concentrations in major citieson the route at that time were, Beijing 52, Linyi 114 andBaoding 137 μg/m3 (CNEMC 2019). Beijing had a popula-tion of 21.54 million, and 6.08 million cars in 2018, of which5.74 million were passenger cars (Survey Office 2018).Passenger cars accounted for around 89% of on-road vehiclesin China, while goods vehicles were 11%, and 89% of allvehicles were petrol powered, 9% were diesel. Heavy goodsvehicles were estimated to contribute to around 59.9% of totalannual particle emission from all vehicles (MEEPRC 2018).
The measurements were carried out in two similar Volvocars produced in 2018. The test vehicle used in Gothenburgwas a PHEV (plug-in hybrid electric vehicle), Model Volvo
30816 Environ Sci Pollut Res (2020) 27:30815–30830

XC90 (Table 1) with its original HVAC system. The testvehicle used in China was a diesel car, Model Volvo S90(Table 1), with the same type of HVAC system as thePHEV used in Gothenburg.
The filter type used in both vehicles was a multi-layer elec-trostatically charged synthetic filter made of polypropyleneand active carbon, with dimensions of 337 × 238 × 41 mm.One newly manufactured filter and one aged filter were usedin both cars. The aged filter was aged in an HVAC test rig withducts connected to outdoor air, in 2018 April at Shanghai,where monthly average outdoor PM2.5 level at time was42 μg/m3 (CNEMC 2018). To simulate the actual usage offilter in customer driving, ventilation fan speed was set to low(1430 rpm, around 200 kg/h), no recirculation, and ageingtime was 500 h, which represents around 1-year driving, therecommended filter service interval in China.
Furthermore, both cars were equipped with an ionizer unit tostudy the influence of ionization on air filtration. The unit ismanufactured to fit the air inlet dimensions and is installed beforethe water separation unit in front of the HVAC, around 50 cmupstream of the filter. It was manufactured to fit to the inletdimensions and worked with a voltage of − 7 ± 1 kV. Thehigh-voltage bars with sharp edges form corona discharge tips,and continuously discharge unipolar ions. Particles contained inthe incoming air thus changed polarity when colliding with ions.
Instrumentation
Particle mass and number concentration measurementswere performed with Grimm MiniWRAS (Mini WideRange Aerosol Spectrometer) model 1.371, with a log in-terval of 1 min. The instrument measures particles of aero-dynamic diameter from 10 nm to 35 μm, distributed into41 channels. Light scattering and electric mobility detec-tion methods are jointly adopted, for size ranges of 0.253to 35 μm, and 10 to 193 nm, respectively. Within a mea-surable mass concentration range 0.1 μg/m3 to 100 mg/m3,reproducibility of mass concentration is ± 2 μg, and ± 3%of count values (GRIMM 2019). Thus, mass and numberconcentration of all size channels are acquired, includingPM2.5, UFP counts from 10 to 100 nm. Annual calibrationwas performed by a supplier and automatic self-test doneby instrument at each startup.
Two inter-calibrated MiniWRAS were measuring simulta-neously outside and inside the cabin. The outside samplingtube was placed immediately outside of the HVAC air intakebelow the wind shield, which measured exactly the air atHVAC upstream. The inside sampling tube was placed abovethe middle armrest between the front seats, as in Fig. 2, asrecommended by Abi-Esber and El-Fadel (2013). This posi-tion was chosen to measure the particle concentration in the
Fig. 1 The test route in Northern China, from Linyi to Beijing, passing by Baoding
30817Environ Sci Pollut Res (2020) 27:30815–30830
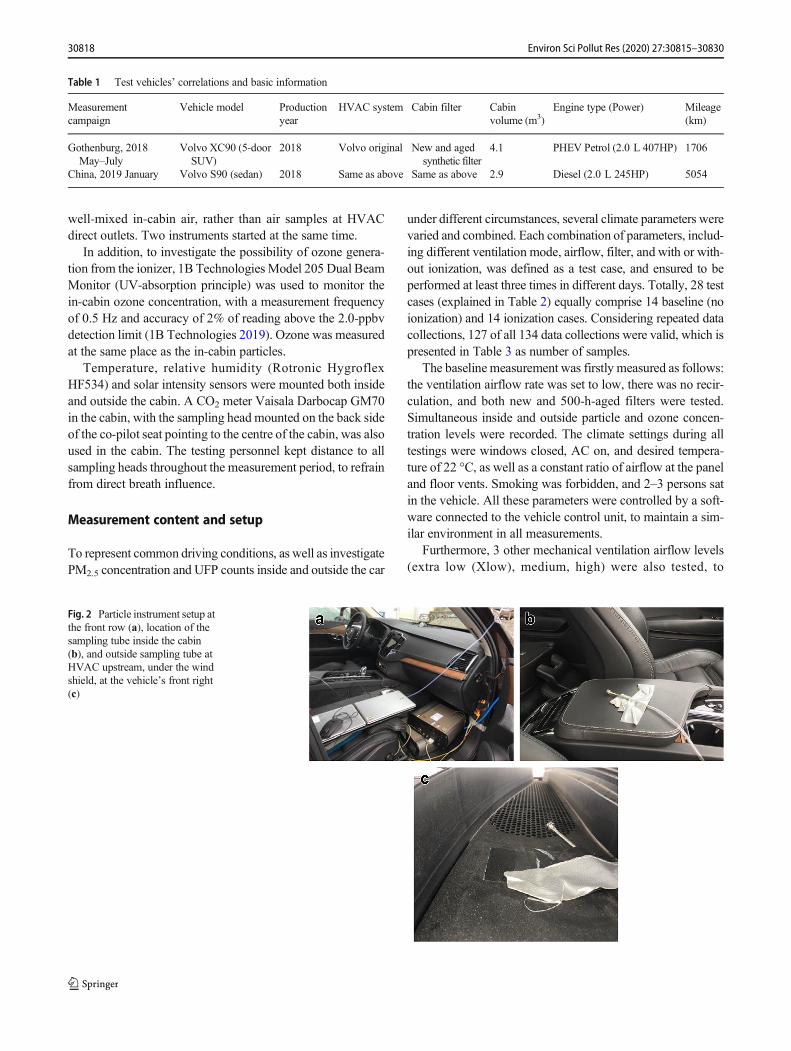
well-mixed in-cabin air, rather than air samples at HVACdirect outlets. Two instruments started at the same time.
In addition, to investigate the possibility of ozone genera-tion from the ionizer, 1B Technologies Model 205 Dual BeamMonitor (UV-absorption principle) was used to monitor thein-cabin ozone concentration, with a measurement frequencyof 0.5 Hz and accuracy of 2% of reading above the 2.0-ppbvdetection limit (1B Technologies 2019). Ozone was measuredat the same place as the in-cabin particles.
Temperature, relative humidity (Rotronic HygroflexHF534) and solar intensity sensors were mounted both insideand outside the cabin. A CO2 meter Vaisala Darbocap GM70in the cabin, with the sampling head mounted on the back sideof the co-pilot seat pointing to the centre of the cabin, was alsoused in the cabin. The testing personnel kept distance to allsampling heads throughout the measurement period, to refrainfrom direct breath influence.
Measurement content and setup
To represent common driving conditions, as well as investigatePM2.5 concentration and UFP counts inside and outside the car
under different circumstances, several climate parameters werevaried and combined. Each combination of parameters, includ-ing different ventilation mode, airflow, filter, and with or with-out ionization, was defined as a test case, and ensured to beperformed at least three times in different days. Totally, 28 testcases (explained in Table 2) equally comprise 14 baseline (noionization) and 14 ionization cases. Considering repeated datacollections, 127 of all 134 data collections were valid, which ispresented in Table 3 as number of samples.
The baseline measurement was firstly measured as follows:the ventilation airflow rate was set to low, there was no recir-culation, and both new and 500-h-aged filters were tested.Simultaneous inside and outside particle and ozone concen-tration levels were recorded. The climate settings during alltestings were windows closed, AC on, and desired tempera-ture of 22 °C, as well as a constant ratio of airflow at the paneland floor vents. Smoking was forbidden, and 2–3 persons satin the vehicle. All these parameters were controlled by a soft-ware connected to the vehicle control unit, to maintain a sim-ilar environment in all measurements.
Furthermore, 3 other mechanical ventilation airflow levels(extra low (Xlow), medium, high) were also tested, to
Fig. 2 Particle instrument setup atthe front row (a), location of thesampling tube inside the cabin(b), and outside sampling tube atHVAC upstream, under the windshield, at the vehicle’s front right(c)
Table 1 Test vehicles’ correlations and basic information
Measurementcampaign
Vehicle model Productionyear
HVAC system Cabin filter Cabinvolume (m3)
Engine type (Power) Mileage(km)
Gothenburg, 2018May–July
Volvo XC90 (5-doorSUV)
2018 Volvo original New and agedsynthetic filter
4.1 PHEV Petrol (2.0 L 407HP) 1706
China, 2019 January Volvo S90 (sedan) 2018 Same as above Same as above 2.9 Diesel (2.0 L 245HP) 5054
30818 Environ Sci Pollut Res (2020) 27:30815–30830

investigate the influence of the ventilation rate (estimated air-flow rates at these 4 levels are around 100, 180, 260, and380 kg/h, respectively). Three recirculation (RC) levels(30%, 50%, and 70% of total ventilation air comes from re-circulation) were compared as well. Recirculation air from thevehicle cabin was mixed with incoming air and then filtered.Test cases of 4 airflow rates were always done in sequence,similar to 4 recirculation degrees, to gain similar ambient con-ditions when relevant cases were compared. These parameterswere also controlled by the aforementioned software.
Apart from baseline testing, pre-ionization was added asanother varying parameter. The ionizer was turned on, aftereach corresponding test case, and then the same data collec-tion procedures were repeated. The aim was to maintain asclose ambient pollutant and metrological conditions as possi-ble for comparisons of with and without ionizer.
All the instruments were turned on at least 30 min in ad-vance for warming up and stabilization. The ventilation pa-rameters were varied firstly, and when a stable in-cabin airquality was achieved, a data collection interval of around 5–10 min started.
Data analysis
Average inside and outside PM2.5 concentrations and UFPcounts were calculated for each data collection interval firstly,
by averaging the 1-min data, and then the general average wascalculated for each test case (based on all data collection rep-etitions). The indoor to outdoor ratio (I/O ratio) of PM2.5 massconcentration and UFP counts were analysed afterwards, toevaluate the filtration performance regardless of ambient pol-lution level.
Results
Introduction
The introduction of the results is focused on the differencesbetween the twomeasurement sites (inside a road tunnel in theCity of Gothenburg, Sweden, and driving on highways be-tween Linyi and Beijing, Northern China), and the differencebetween with and without pre-ionization. The results arebased on PM2.5 concentrations and UFP counts (10–100 nm), both inside and outside the car, as well as I/O ratios,in order to facilitate comparisons with results from otherstudies.
To represent common driving settings in passenger cars,and increase comparability with previous particle level stud-ies, the ventilation settings during all measurements includewindows closed, AC on during the entire testing periods(22 °C), 4 levels of mechanical ventilation airflow (mainlylow), and ventilation through fresh outside air or partial recir-culation (mainly no recirculation).
First, average data for all test cases are summarized inTable 3, where baseline (without ionization) and ionizationdata are presented for Gothenburg and Northern China sepa-rately. The detailed results are found in Tables 5, 6 and 7 in theAppendix. Further on, results for different locations, baselineand with ionization, filter status (new and aged), differentairflows and recirculation degrees are shown in diagrams inthe following sub-chapters. The I/O ratios will only bediscussed in relation to the diagrams.
Considering the measurements in Gothenburg, altogetherthere are 40 baseline test cases with average inside and outsidePM2.5 concentrations of 20 and 55 μg/m
3, and UFPs of about
Table 3 Summarized overall dataof inside and outside PM2.5
concentrations, UFP counts and I/O ratio, grouped by location andionization status
N of samples PM2.5 mass concentration (μg/m3) UFP counts (×103 particles/cm3)
In-cabin Out. In-cabin Out.
AM AM I/O AM AM AM I/O AM
GOT baseline 40 19.8 0.36 54.9 9.24 0.37 25.8
GOT ion. 41 9.9 0.20 50.0 4.27 0.18 24.0
China baseline 23 58.1 0.35 159.7 10.8 0.40 25.0
China ion. 23 30.0 0.15 190.7 6.10 0.20 30.5
Out. outside, AM arithmetic mean, GOT Gothenburg, Ion. ionization applied cases
Table 2 Description of varied parameters in all test cases
Filterstatus
Ventilation airflow level a Recirculationdegree (%) b
Ionization
New Xlow 0 Offc
Aged Low 30 On
Medium 50
High 70
aXlow (extra low) ventilation, medium ventilation and high ventilationare only used in combination with 0 recirculationb Thirty percent, 50% and 70% recirculation degrees are only used incombination with low airflowc Ionization off test cases means the baseline cases
30819Environ Sci Pollut Res (2020) 27:30815–30830

9200 and 26,000 particles/cm3. Both inside size fractions areconsiderably lower applying ionization, in comparison withthe baseline result, where 41 test cases present average insideand outside PM2.5 of 10 and 50 μg/m3, and UFPs of about4300 and 24,000 particles/cm3. Results in China followed thattrend.
Comparing results from two locations, the main differencewas that outside PM2.5 concentrations on average were con-siderably higher in Northern China (baseline average 160 μg/m3) than in the road tunnel in Gothenburg (baseline average55 μg/m3). Thereby, also the inside PM2.5 concentrations areon average higher in Northern China (baseline average 58 μg/m3) than in the road tunnel Gothenburg (baseline average20 μg/m3). The relationship of I/O ratios is discussed in laterdiagrams. Besides, the average outside temperature duringmeasurements was 24.8 and 3.3 °C in Gothenburg andChina respectively, and corresponding relative humidity was54% and 26%. The solar intensity in China was 257 W/m2,and that in Gothenburg was around zero due to the tunnelenvironment.
Location and filter status
The most important results presented in the introduction arehere presented in more detail using diagrams showing PM2.5
concentrations, UFP counts and the corresponding I/O ratios.Figure 3 shows comparisons between inside PM2.5 concen-
trations and inside UFP counts for the two locations, togetherwith corresponding I/O ratios. The cases included are all thebaseline cases, i.e. no ionization utilized. The already men-tioned differences between inside PM2.5 concentrations for thetwo locations are clearly shown. The UFP counts are howeverof the same order in both locations. An independent-sample ttest shows no statistically significant difference of inside UFPcounts, neither for new nor for aged filters (p = 0.52 and 0.94,respectively).
The differences of using new and aged filters are also clear-ly shown. The inside PM2.5 concentration and the UFP countsare about three times higher using an aged filter in comparisonwith a new filter.
I/O ratios are further compared, to gain understandingof the system filtration performance. We can notice thatthe I/O ratios are almost equal across two locations,when the same filter is used, compared with the differ-ence found in PM2.5 concentrations and UFP counts. Onemain reason is that the same filters and HVAC systemare used for both locations, and the main protectionagainst particles comes from the HVAC, or specificallythe filter. The overall baseline case average of 0.36 inGothenburg and 0.35 in China (see Table 3) shows arelatively effective HVAC system regardless of ambientcondition. While when new and aged filters were com-pared, in both locations around a triple I/O ratio is
presented for the aged filter. The reduction of perfor-mance was apparent when the aged filter was mounted.
Further, we compare all 63 individual trip averages fromthe baseline testing (the baseline samples in Table 3). ThePearson correlation coefficient (r) is calculated between in-cabin and outside PM2.5 or UFP using software SPSS, for eachfilter type. All groups show statistical significance (all p value< 0.01). The correlations between in-cabin and ambient PM2.5
values are strong (r = 0.866, 0.945 for new and aged filters) asshown in Fig. 4. Clearly, the aged filter resulted in higher in-cabin PM2.5 and UFP counts. When dust was loaded on thesurface and within the filter material and the electrostaticcharacteristics reduced, the filtration capabilities arediminished. Similarly, Huang et al. (2012) stated that highcorrelations (r = 0.863) were observed between PM2.5 concen-trations while commuting and PM2.5 concentrations at thefixed monitoring site. Jain (2017) reported a significant corre-lation between ambient and in-vehicle concentrations forPM2.5.
The UFP counts followed similar trends with slightly lowercorrelations (r = 0.735, 0.904 for new and aged filters).Likewise, Zhu et al. (2007) mentioned that in-cabin UFPsfollow outdoor with a 30-s delay, but do not change as sharpas outside UFPs, while inside UFPs still follow the trend ofoutside UFPs when comparing different highways.
Utilization of pre-ionization
The most important results for PM2.5 concentrations and in-side UFP counts with ionization applied presented in the in-troduction are here presented in more detail using diagramsshowing the corresponding I/O ratios.
Figure 5 shows comparisons of I/O ratios, between allbaseline tests and all ionization tests. All the ionization testswere performed directly after corresponding the baseline testof the same ventilation settings. Thus, the comparison groupsshare the same distribution in different airflow and recircula-tion levels, expect for one sample which was invalid due toinstrument error. The main result is that there is a considerablereduction of the I/O ratios for both PM2.5 and UFP and forboth new and used filters, in both locations.
The new filter demonstrates more stable performance in thetwo locations, with and without pre-ionization, and the PM2.5
I/O ratio decreased by 0.13 and 0.11 respectively. The en-hancement for the aged filter is more distinct and observedto relate with locations. The PM2.5 I/O ratio decreased by 0.20and 0.31 in Gothenburg and China correspondingly, althoughwith higher fluctuations. More importantly, ionization appliedto a used filter makes it almost comparable with a new filterwithout ionization. Four comparisons were made between theI/O ratios of the aged filter with ionization and the new filterwithout ionization, for two locations and two particle sizesrespectively. The comparisons show no significant difference
30820 Environ Sci Pollut Res (2020) 27:30815–30830

0
50
100
150
200
250
300
0 50 100 150 200 250 300 350 400In-c
abin
PM
2.5
conc
entra
tion
( µg/
m3 )
Ambient PM2.5 concentration (µg/m3)
new filter aged filter
0
5000
10000
15000
20000
25000
30000
35000
40000
0 10,000 20,000 30,000 40,000 50,000 60,000In-
/p(stnuoc
PFU
nibaccm
3 )
Ambient UFP counts (p/cm3)
new filter aged filter
Fig. 4 Correlations betweenaverage in-cabin and outsidePM2.5 concentration and UFPcounts, grouped by new and agedfilters. Samples include all base-line (no ionization) cases
0
20
40
60
80
100
120
140
160
GOT China
In-ca
bin
PM
2.5
(3)
aged filter
new filter
0
0.1
0.2
0.3
0.4
0.5
0.6
0.7
0.8
0.9
1
GOT China
PM
2.5
I/O
aged filter new filter
0
5000
10000
15000
20000
25000
30000
GOT China
In-
mc/
p(
stn
uo
cP
FU
nib
ac
3)
aged filter new filter
0
0.1
0.2
0.3
0.4
0.5
0.6
0.7
0.8
0.9
1
GOT China
UF
PI/
O
aged filter new filter
Fig. 3 Comparison of all baseline(no ionization) cases in-cabinPM2.5 concentration, in-cabinUFP counts and I/O ratios,grouped by locations, new andaged filter. Error bars presentstandard deviation. GOT:Gothenburg
30821Environ Sci Pollut Res (2020) 27:30815–30830
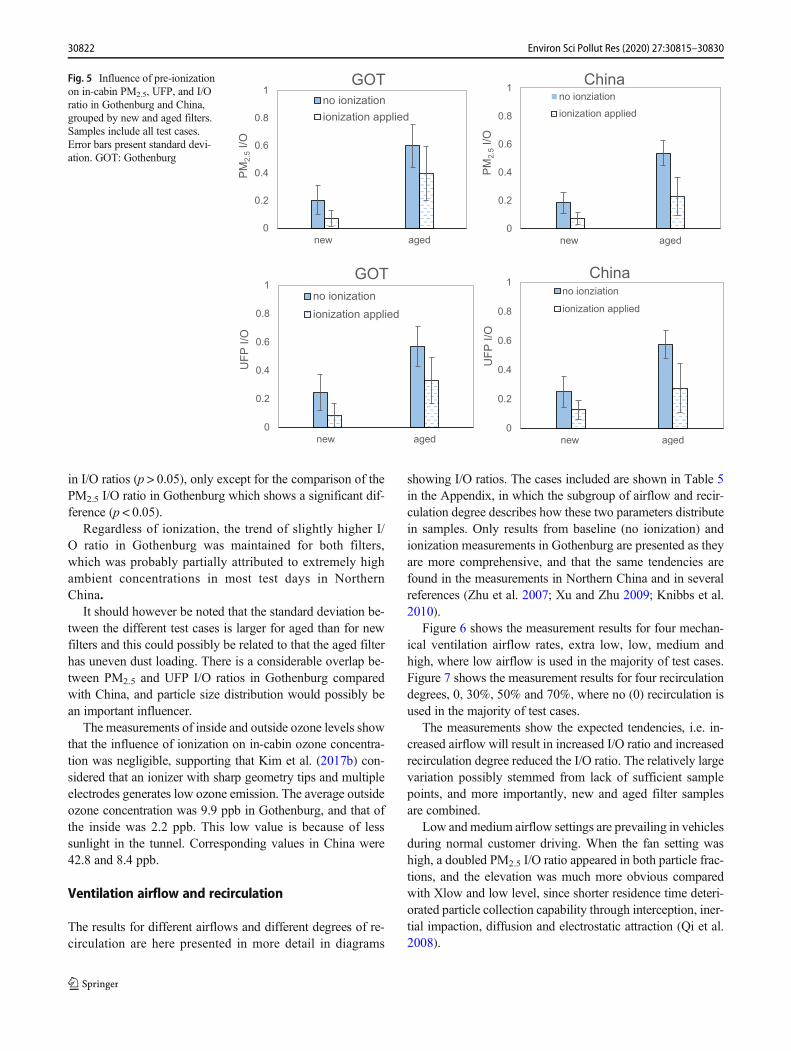
in I/O ratios (p > 0.05), only except for the comparison of thePM2.5 I/O ratio in Gothenburg which shows a significant dif-ference (p < 0.05).
Regardless of ionization, the trend of slightly higher I/O ratio in Gothenburg was maintained for both filters,which was probably partially attributed to extremely highambient concentrations in most test days in NorthernChina.
It should however be noted that the standard deviation be-tween the different test cases is larger for aged than for newfilters and this could possibly be related to that the aged filterhas uneven dust loading. There is a considerable overlap be-tween PM2.5 and UFP I/O ratios in Gothenburg comparedwith China, and particle size distribution would possibly bean important influencer.
The measurements of inside and outside ozone levels showthat the influence of ionization on in-cabin ozone concentra-tion was negligible, supporting that Kim et al. (2017b) con-sidered that an ionizer with sharp geometry tips and multipleelectrodes generates low ozone emission. The average outsideozone concentration was 9.9 ppb in Gothenburg, and that ofthe inside was 2.2 ppb. This low value is because of lesssunlight in the tunnel. Corresponding values in China were42.8 and 8.4 ppb.
Ventilation airflow and recirculation
The results for different airflows and different degrees of re-circulation are here presented in more detail in diagrams
showing I/O ratios. The cases included are shown in Table 5in the Appendix, in which the subgroup of airflow and recir-culation degree describes how these two parameters distributein samples. Only results from baseline (no ionization) andionization measurements in Gothenburg are presented as theyare more comprehensive, and that the same tendencies arefound in the measurements in Northern China and in severalreferences (Zhu et al. 2007; Xu and Zhu 2009; Knibbs et al.2010).
Figure 6 shows the measurement results for four mechan-ical ventilation airflow rates, extra low, low, medium andhigh, where low airflow is used in the majority of test cases.Figure 7 shows the measurement results for four recirculationdegrees, 0, 30%, 50% and 70%, where no (0) recirculation isused in the majority of test cases.
The measurements show the expected tendencies, i.e. in-creased airflow will result in increased I/O ratio and increasedrecirculation degree reduced the I/O ratio. The relatively largevariation possibly stemmed from lack of sufficient samplepoints, and more importantly, new and aged filter samplesare combined.
Low and medium airflow settings are prevailing in vehiclesduring normal customer driving. When the fan setting washigh, a doubled PM2.5 I/O ratio appeared in both particle frac-tions, and the elevation was much more obvious comparedwith Xlow and low level, since shorter residence time deteri-orated particle collection capability through interception, iner-tial impaction, diffusion and electrostatic attraction (Qi et al.2008).
0
0.2
0.4
0.6
0.8
1
new agedP
M2
.5I/
O
GOT
no ionization
ionization applied
0
0.2
0.4
0.6
0.8
1
new aged
PM
2.5
I/O
China
no ionziation
ionization applied
0
0.2
0.4
0.6
0.8
1
new aged
UF
P I
/O
GOT
no ionization
ionization applied
0
0.2
0.4
0.6
0.8
1
new aged
UF
P I
/O
China
no ionziation
ionization applied
Fig. 5 Influence of pre-ionizationon in-cabin PM2.5, UFP, and I/Oratio in Gothenburg and China,grouped by new and aged filters.Samples include all test cases.Error bars present standard devi-ation. GOT: Gothenburg
30822 Environ Sci Pollut Res (2020) 27:30815–30830
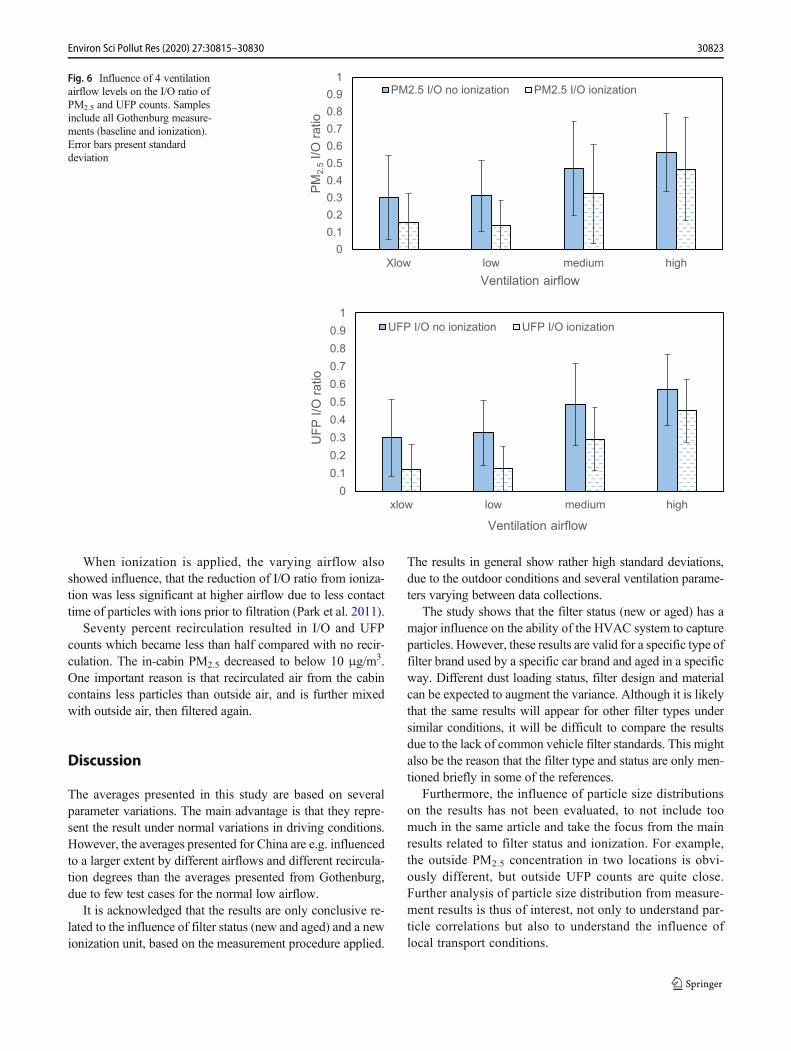
When ionization is applied, the varying airflow alsoshowed influence, that the reduction of I/O ratio from ioniza-tion was less significant at higher airflow due to less contacttime of particles with ions prior to filtration (Park et al. 2011).
Seventy percent recirculation resulted in I/O and UFPcounts which became less than half compared with no recir-culation. The in-cabin PM2.5 decreased to below 10 μg/m3.One important reason is that recirculated air from the cabincontains less particles than outside air, and is further mixedwith outside air, then filtered again.
Discussion
The averages presented in this study are based on severalparameter variations. The main advantage is that they repre-sent the result under normal variations in driving conditions.However, the averages presented for China are e.g. influencedto a larger extent by different airflows and different recircula-tion degrees than the averages presented from Gothenburg,due to few test cases for the normal low airflow.
It is acknowledged that the results are only conclusive re-lated to the influence of filter status (new and aged) and a newionization unit, based on the measurement procedure applied.
The results in general show rather high standard deviations,due to the outdoor conditions and several ventilation parame-ters varying between data collections.
The study shows that the filter status (new or aged) has amajor influence on the ability of the HVAC system to captureparticles. However, these results are valid for a specific type offilter brand used by a specific car brand and aged in a specificway. Different dust loading status, filter design and materialcan be expected to augment the variance. Although it is likelythat the same results will appear for other filter types undersimilar conditions, it will be difficult to compare the resultsdue to the lack of common vehicle filter standards. This mightalso be the reason that the filter type and status are only men-tioned briefly in some of the references.
Furthermore, the influence of particle size distributionson the results has not been evaluated, to not include toomuch in the same article and take the focus from the mainresults related to filter status and ionization. For example,the outside PM2.5 concentration in two locations is obvi-ously different, but outside UFP counts are quite close.Further analysis of particle size distribution from measure-ment results is thus of interest, not only to understand par-ticle correlations but also to understand the influence oflocal transport conditions.
0
0.1
0.2
0.3
0.4
0.5
0.6
0.7
0.8
0.9
1
Xlow low medium high
PM
2.5
I/O
ra
tio
Ventilation airflow
PM2.5 I/O no ionization PM2.5 I/O ionization
0
0.1
0.2
0.3
0.4
0.5
0.6
0.7
0.8
0.9
1
xlow low medium high
UF
P I
/O r
atio
Ventilation airflow
UFP I/O no ionization UFP I/O ionization
Fig. 6 Influence of 4 ventilationairflow levels on the I/O ratio ofPM2.5 and UFP counts. Samplesinclude all Gothenburg measure-ments (baseline and ionization).Error bars present standarddeviation
30823Environ Sci Pollut Res (2020) 27:30815–30830

The baseline measurement results from this study are listedtogether with the main results presented in 10 references for acomparison in Table 8 in the Appendix. The two main differ-ences between our study and these studies are (1) the filterstatus (new and aged) and ionization and (2) parallel measure-ments of inside and outside PM2.5 concentrations and UFPcounts, for all test cases. Most of the publications do not con-tain information regarding filter status. However, a few ofthem state that the tested vehicle had filters without replace-ment since purchase, i.e. highly aged filter.
The in-cabin particle PM2.5 concentrations are reported in 7out of 10 references, while only 2 rather specific studies re-ported PM2.5 I/O and/or outside PM2.5 concentrations. Theresults for in-cabin particle PM2.5 concentrations presentedin this study generally indicate lower or similar concentrationsand higher performances (lower I/O ratios); especially, ourresults are closer to studies on newer vehicles.
The in-cabin UFP counts are reported in 6 out of 10 refer-ences, while only 3 rather specific studies reported UFPcounts I/O and/or outside UFP counts. The results for in-cabin UFP counts presented in this study generally indicatelower counts and similar or higher performances (I/O ratios).The outside UFP counts are however much higher in somereferences.
Our f indings also presented effect iveness ofionization-assisted filtration in vehicle context. Whencomparing the improvement on the particle filtration,the results from car measurements are relatively lessprominent than single filter tests (Agranovski et al.2006; Park et al. 2011; Shi 2012). Likely reasons arethat system efficiency and component efficiency arecompared, and the car cabin itself combined with theconnected HVAC system is a less enclosed environmentthen test rigs or chambers. Air infiltration and leakagecould contribute. In addition, the vehicle’s entire systemalso includes the HVAC ducts, material surfaces andground mats, which constitute potential particle deposi-tion locations.
Conclusion
Measurements of in-cabin and outside PM2.5 concentrationand UFP counts were performed, firstly in a road tunnel inGothenburg, Sweden, and afterwards on roads in NorthernChina, in order to study the influence of different outsideconditions on the performance of the studied HVAC system.The conclusion is here that the HVAC system performance is
0
0.1
0.2
0.3
0.4
0.5
0.6
0.7
0.8
0.9
1
0 30 50 70
PM
2.5
I/O
ra
tio
Recirculation degree (%)
PM2.5 I/O no ionization PM2.5 I/O ionization
0
0.1
0.2
0.3
0.4
0.5
0.6
0.7
0.8
0.9
1
0 30 50 70
UF
P I
/O r
atio
Recirculation degree (%)
UFP I/O no ionization UFP I/O ionization
Fig. 7 Influence of 4 recirculationdegrees on the I/O ratio of PM2.5
and UFP counts. Samples includeall Gothenburg measurements(baseline and ionization). Errorbars present standard deviation
30824 Environ Sci Pollut Res (2020) 27:30815–30830
very similar for the two outside conditions, with average I/Oratios of the order of 0.35–0.40 for baseline conditions and ofthe order of 0.15–0.20 with ionization applied.
The main aim was then to evaluate the influence of filterstatus (new and aged), without and with pre-ionization, usingthe same HVAC system.
First, the aged filter clearly worsened the particle filtrationability, between two to three times, for both in-cabin PM2.5
and UFP counts, in both test locations, compared with the newfilter of the same type. As an example, the average PM2.5
concentration I/O ratio for all baseline variations inGothenburg is 0.36, while the average for the aged filter is0.60 and the average for the new filter is 0.20. Moreover, thecorresponding UFP I/O ratio values were 0.57, 0.24.
Second, ionization upstream of the cabin filter clearlyimproved the particle filtration ability, for both in-cabinPM2.5 and UFP counts, in both locations, compared withno ionization upstream of the filter. On average, the I/Owas decreased by around 0.15–0.20. The results also in-dicate that ionization combined with an aged filter could
result in a performance similar like that of a new filterwithout ionization applied.
Third, the test cases with varying ventilation air flows andvarying recirculation degrees show expected results. The I/Oratios increase with increased air flow and decrease with in-creased recirculation degree.
Acknowledgements Open access funding provided by ChalmersUniversity of Technology.
Author contributions All authors contributed to the study design.Measurement preparation, data collection and analysis were performedby DixinWei. The first draft of the manuscript was written by DixinWei,and all authors commented on previous versions of the manuscript. Allauthors read and approved the final manuscript.
Funding information This project is funded by the Swedish EnergyAgency (Energimyndigheten).
Compliance with ethical standards
Conflict of interest The authors declare that they have no conflict ofinterest.
Appendix
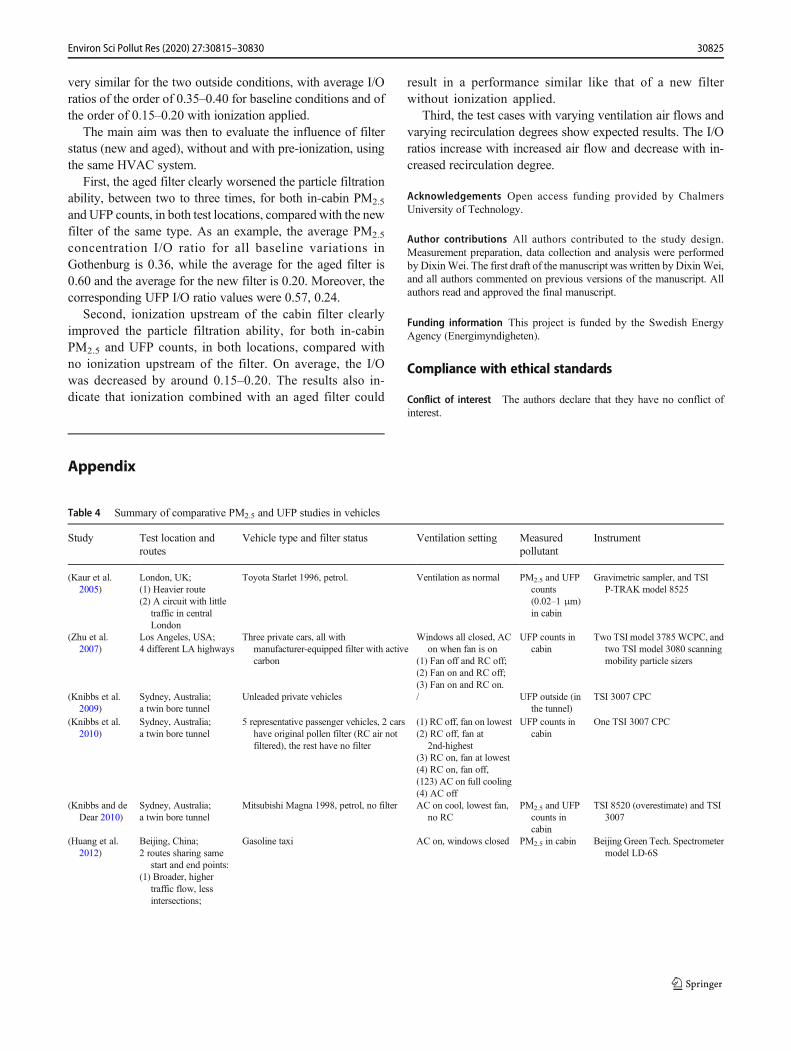
Table 4 Summary of comparative PM2.5 and UFP studies in vehicles
Study Test location androutes
Vehicle type and filter status Ventilation setting Measuredpollutant
Instrument
(Kaur et al.2005)
London, UK;(1) Heavier route(2) A circuit with little
traffic in centralLondon
Toyota Starlet 1996, petrol. Ventilation as normal PM2.5 and UFPcounts(0.02–1 μm)in cabin
Gravimetric sampler, and TSIP-TRAK model 8525
(Zhu et al.2007)
Los Angeles, USA;4 different LA highways
Three private cars, all withmanufacturer-equipped filter with activecarbon
Windows all closed, ACon when fan is on
(1) Fan off and RC off;(2) Fan on and RC off;(3) Fan on and RC on.
UFP counts incabin
Two TSI model 3785WCPC, andtwo TSI model 3080 scanningmobility particle sizers
(Knibbs et al.2009)
Sydney, Australia;a twin bore tunnel
Unleaded private vehicles / UFP outside (inthe tunnel)
TSI 3007 CPC
(Knibbs et al.2010)
Sydney, Australia;a twin bore tunnel
5 representative passenger vehicles, 2 carshave original pollen filter (RC air notfiltered), the rest have no filter
(1) RC off, fan on lowest(2) RC off, fan at
2nd-highest(3) RC on, fan at lowest(4) RC on, fan off,(123) AC on full cooling(4) AC off
UFP counts incabin
One TSI 3007 CPC
(Knibbs and deDear 2010)
Sydney, Australia;a twin bore tunnel
Mitsubishi Magna 1998, petrol, no filter AC on cool, lowest fan,no RC
PM2.5 and UFPcounts incabin
TSI 8520 (overestimate) and TSI3007
(Huang et al.2012)
Beijing, China;2 routes sharing same
start and end points:(1) Broader, higher
traffic flow, lessintersections;
Gasoline taxi AC on, windows closed PM2.5 in cabin Beijing Green Tech. Spectrometermodel LD-6S
30825Environ Sci Pollut Res (2020) 27:30815–30830

Table 5 Gothenburg baseline (no ionization) data. Summarized data of inside and outside PM2.5 concentrations, UFP counts and I/O ratio, grouped byfilter status, ventilation airflow and recirculation degree
N PM2.5 mass concentration (μg/m3) UFP counts (particles/cm3)
In-cabin Out. In-cabin Out.
AM Range (min–max) AM I/O Range (min–max) AM AM Range (min–max) AM I/O Range (min–max) AM
All samples 40 19.8 3.6–60.1 0.36 0.07–0.83 54.9 9241 1687–30,913 0.37 0.08–0.76 25,816
Filter status
New 24 9.2 3.6–19.4 0.20 0.07–0.50 50.6 5056 1687–10,332 0.24 0.08–0.61 24,401
Aged 16 35.8 18.0–60.1 0.60 0.31–0.83 61.2 15,519 6497–30,913 0.57 0.33–0.76 27,939
Ventilation airflow
Xlow 5 19.1 4.5–42.5 0.30 0.10–0.64 62.6 7931 2469–16,408 0.30 0.11–0.61 28,363
Low 25 18.5 3.6–59.2 0.31 0.07–0.70 57.7 8715 1687–30,913 0.33 0.08–0.67 27,405
Medium 5 22.8 6.8–60.1 0.47 0.19–0.78 46.7 10,652 3196–30,006 0.48 0.26–0.76 21,111
High 5 24.3 10.6–46.0 0.56 0.35–0.83 41.0 11,773 5746–22,761 0.57 0.34–0.76 20,030
Recirculation degree (%)
0 25 23.4 4.5–60.1 0.42 0.10–0.83 54.6 10,987 2469–30,913 0.44 0.11–0.76 25,843
30 5 18.4 9.8–30.0 0.34 0.17–0.57 57.7 9179 4488–12,792 0.34 0.19–0.57 31,159
50 5 13.7 4.8–25.1 0.25 0.11–0.49 55.0 5899 2432–10,547 0.26 0.12–0.46 23,976
70 5 9.8 3.6–18.5 0.18 0.07–0.36 53.5 3914 1687–7280 0.19 0.08–0.35 22,176
AM arithmetic mean, I/O indoor to outdoor ratio, N number of samples, Out. outside, UFP ultrafine particle, Xlow extra low
Table 4 (continued)
Study Test location androutes
Vehicle type and filter status Ventilation setting Measuredpollutant
Instrument
(2) Narrower, heavycongestions
(Abi-Esber andEl-Fadel2013)
Beirut, Lebanon;(1) A circuit in
commercial/residential area(2) Highway
6 different passengercars, original filternever replaced sincepurchase
(1) W1/2O(2) AC on RC(3) AC on OSA
PM2.5 in and out of cabin
TSI DustTrak(Both et al.
2013)Jakarta, Indonesia / AC on/off PM2.5 and UFP
counts incabin
TSI DustTrak 8520, lightscattering photometer andP-TRAK model 8525
(Qiu et al. 2017) Xi’an, China;One major city road
Gasoline car (1) WC fan off(2) WC AC on RC(3) WC AC on OSA(4) W1/2O, fan off
PM2.5 in cabin Grimm aerosol monitor 1.109
(Jain 2017) Delhi, Indiaa ~ 15-km long ring road
/ AC and non-AC cars PM2.5 in cabin Grimm aerosol monitor 1.108
This study Gothenburg, Sweden,city tunnel andNorthern Chinahighway.
Volvo PHEV XC90 and Diesel V60 2018,New and pre-aged filters, the same filtertype as the vehicle original
(1) AC on OSA (4airflow levels), RCoff
(2) AC on OSA, RC on(4 RC levels)
PM2.5 and UFPcounts in andout of cabin
Grimm MiniWRAS Wide RangeAerosol Spectrometer model1.371
AC air conditioning, CPC/WCPC (water-based) condensation particle counter, OSA outside air, RC recirculation, UFP ultrafine particle, WC windowclosed, W1/2O window half opened
30826 Environ Sci Pollut Res (2020) 27:30815–30830

Table 6 Gothenburg ionization applied data. Summarized data of inside and outside PM2.5 concentrations, UFP counts and I/O ratio, grouped by filterstatus, ventilation airflow and recirculation degree
PM2.5 mass concentration(μg/m3) UFP counts (particles/cm3)
In-cabin Out. In-cabin Out.
N AM Range (min–max) AM I/O Range (min–max) AM AM Range (min–max) AM I/O Range (min–max) AM
All samples 41 9.9 0.8–46.0 0.20 0.01–0.74 50.0 4274 157–19,220 0.18 0.01–0.61 24,038
Filter status
New 25 2.8 0.8–8.2 0.07 0.01–0.23 50.6 1420 157–5975 0.08 0.01–0.33 22,403
Aged 16 21.0 4.8–46.0 0.40 0.12–0.74 61.2 8732 1650–19,220 0.33 0.09–0.61 26,593
Ventilation airflow
Xlow 5 7.7 1.1–19.0 0.16 0.02–0.40 62.6 3076 397–8365 0.12 0.02–0.34 25,390
Low 27 7.0 0.8–30.5 0.14 0.01–0.47 57.7 2780 157–12,368 0.13 0.01–0.42 23,835
Medium 5 17.2 2.1–43.4 0.32 0.08–0.73 46.7 8322 1130–19,220 0.29 0.09–0.52 25,293
High 4 23.3 3.4–46.0 0.47 0.18–0.74 41.0 10,793 1920–18,945 0.45 0.26–0.61 22,148
Recirculation degree (%)
0 26 12.5 1.1–46.0 0.25 0.02–0.74 54.6 5596 397–19,220 0.23 0.02–0.61 23,450
30 5 7.8 1.3–20.1 0.15 0.02–0.34 57.7 2990 524–7222 0.14 0.02–0.30 24,352
50 5 5.3 0.8–14.2 0.10 0.01–0.26 55.0 1866 321–5048 0.08 0.01–0.18 27,868
70 5 3.1 0.8–7.4 0.07 0.02–0.15 53.5 1090 157–2842 0.05 0.01–0.10 22,953
AM arithmetic mean, I/O indoor to outdoor ratio, N number of samples, Out. outside, UFP ultrafine particle, Xlow extra low
Table 7 China baseline and ionization data. Summarized data of inside and outside PM2.5 concentration, UFP counts and I/O ratio, grouped by filterstatus
PM2.5 mass concentration(μg/m3) UFP counts (particles/cm3)
In-cabin Out. In-cabin Out.
N AM Range (min–max)
AMI/O
Range (min–max)
AM AM Range (min–max)
AMI/O
Range(min–max)
AM
Baseline
All baseline samples 23 58.1 1.8–239.0 0.35 0.08–0.69 159.7 10,843 312–36,885 0.40 0.08–0.68 24,966
Filter status
New 12 28.5 1.8–62.0 0.18 0.08–0.31 153.3 6362 312–23,615 0.25 0.08–0.44 22,672
Aged 11 90.5 21.8–239.0 0.54 0.39–0.69 166.6 15,731 7067–36,885 0.57 0.40–0.68 27,469
Ionization applied
All ionizationsamples
23 30.0 3.5–127.2 0.15 0.02–0.46 190.7 6101 957–31,279 0.20 0.05–0.55 30,534
Filter status
New 11 14.5 5.1–30.2 0.07 0.02–0.15 200.1 3019 957–5163 0.13 0.05–0.25 25,752
Aged 12 44.3 3.5–127.2 0.23 0.05–0.46 182.1 8926 1319–31,279 0.27 0.05–0.55 34,917
AM arithmetic mean, I/O indoor to outdoor ratio, N number of samples, Out. outside, UFP ultrafine particle
30827Environ Sci Pollut Res (2020) 27:30815–30830

Table8
Sum
marized
measurementresultsof
comparativ
estudieson
PM
2.5andUFP
(including
thisstudy).D
etailedinform
ationof
thesestudiesislistedin
Table4
PM
2.5
Reference
Relevan
tventila
tion
cond
itions
aPM
2.5in
cabin(μg/m
3 )PM
2.5I/O
PM
2.5ou
tside(μg/m
3 )(K
auretal.2005)
Privatecar,ventilatio
nas
norm
alAM
=38.07
±14.1(sam
pleN=29)
//
(Knibbsandde
Dear2010)
ACon
andcool
thecabin,lowestfan
speed,no
RC
GM:2
2.6,AM:2
7.3
//
(Huang
etal.2
012)
taxi'sACon,w
indowclosed
31.64±20.77
Median:
0.79
to1.04
FMS:
35.15±23.97
(Abi-Esber
andEl-Fadel2
013)
(resultspresentedformobile
tests)
windowclosed,A
Con
OSA
,fan
medium
79±34
Above
1(~1.1)
/windowclosed,A
Con
RC,fan
medium
38±28
Below
1(~0.5)
/(Bothetal.2013)
privatecarACandnon-AC
mean(SD)=91
(38)
//
(Qiu
etal.2017)
windowclosed,A
Con
RC
Morning:
Afternoon:
10.09±6.63
8.95
±1.08
//
windowclosed,A
Con
OSA
Morning:
Afternoon:
22.06±3.61
14.56±10.86
//
(Jain2017)
ACprivatecar
roughlyaround
80/
/ThisstudyGOTbaselin
ebFanon
2ndlevel,RCoffnewfilter
AM
9.2
AM
0.20
AM
50.6
Fanon
2ndlevel,RCoffaged
filter
AM
35.8
AM
0.60
AM
61.2
ThisstudyChina
baselin
ebFanon
2ndlevel,RCoffnewfilter
AM
28.5
AM
0.18
AM
153.3
Fanon
2ndlevel,RCoffaged
filter
AM
90.5
AM
0.54
AM
166.6
UFP
Reference
Relevan
tventila
tion
cond
itions
aUFPin
cabin(×
103p/cm
3 )UFPI/O
ratio
UFPou
tside(×10
3p/cm
3 )(K
auretal.2005)
Privatecar,ventilatio
nas
norm
alAM=99.7/cm
3
range36.5-151.81(sam
pleN=13)
//
(Zhu
etal.2007)
(resultspresentedfordifferent
locatio
ns,n
ewestvehiclemodel)
FanoffRCoff
9.1±
33to
150±3
4~0
.15
22±24
to256±119
Fanon
RCoff
~0.3
Fanon
RCon.
~0.05
(Knibbsetal.2
009)
Privatecardrivingin
atunnel
//
Average:6000
Median:1700
Privatecardrivingin
mixed
city
routes
//
Median:
160
(Knibbsetal.2
010)
(Resultspresentedfor2vehicles
fittedwith
HVACandfilter,separatedwith
)RCoff,fanlowest,ACfullcooling
Mean282;127
Median0.66;0.88
/RCoff,fan2n
d -highest,ACfullcooling
Mean611;257
Median0.84;0.91
/RCon,fan
lowest,ACfullcooling
Mean34;40
Median0.08;0.45
/(K
nibbsandde
Dear2010)
ACon
cooling,fanlowest,no
RC
GM
75AM
89/
/
(Bothetal.2013)
privatecarACandnon-AC
Median
Non-A
C:~400
AC:~140
//
ThisstudyGOTbaselin
eb,c
Fan2n
dlow,R
Coffnewfilter
AM
5.1
AM
0.24
AM
24.4
Fan2n
dlow,R
Coffaged
filter
AM
15.5
AM
0.57
AM
27.9
ThisstudyChina
baselin
eb,c
Fan2n
dlow,R
Coffnewfilter
AM
6.4
AM
0.25
AM
22.6
Fan2n
dlow,R
Coffaged
filter
AM
15.7
AM
0.57
AM
27.5
AMarithmeticmean,AC
airconditioning,FMSfixed
monitoringsite,G
OTGothenburg,GMgravimetric
mean,Nnumberofsam
ples,O
SAoutsideair,RC
recirculation,UFP
ultrafineparticle,SD
standarddeviation
a:Relevantv
entilationconditionsto
thisstudyareselected
from
correspondingstudiessummarized
inTable4
bBaselinemeasurementsmeantestcaseswith
outionization
cUFP
size
range10–100
nm
30828 Environ Sci Pollut Res (2020) 27:30815–30830
Open Access This article is licensed under a Creative CommonsAttribution 4.0 International License, which permits use, sharing,adaptation, distribution and reproduction in any medium or format, aslong as you give appropriate credit to the original author(s) and thesource, provide a link to the Creative Commons licence, and indicate ifchanges weremade. The images or other third party material in this articleare included in the article's Creative Commons licence, unless indicatedotherwise in a credit line to the material. If material is not included in thearticle's Creative Commons licence and your intended use is notpermitted by statutory regulation or exceeds the permitted use, you willneed to obtain permission directly from the copyright holder. To view acopy of this licence, visit http://creativecommons.org/licenses/by/4.0/.
References
2B Technologies (2019) Model 205 Dual Beam Ozone Monitor™.https://twobtech.com/model-205-ozone-monitor.html. AccessedJune 2019
Abi-Esber L, El-FadelM (2013) Indoor to outdoor air quality associationswith self-pollution implications inside passenger car cabins. AtmosEnviron 81:450–463. https://doi.org/10.1016/j.atmosenv.2013.09.040
Agranovski I, Huang R, Pyankov O et al (2006) Enhancement of theperformance of low-efficiency HVAC filters due to continuous uni-polar ion emission. Aerosol Sci Technol 40:963–968. https://doi.org/10.1080/02786820600833203
Both AF, Westerdahl D, Fruin S, Haryanto B, Marshall JD (2013)Exposure to carbon monoxide, fine particle mass, and ultrafine par-ticle number in Jakarta, Indonesia: effect of commute mode. SciTotal Environ 443:965–972. https://doi.org/10.1016/j.scitotenv.2012.10.082
CNEMC (2018) Air Quality Report of 74 cities, April 2018. ChinaNational Environmental Monitoring Centre. http://www.cnemc.cn/jcbg/kqzlzkbg/201806/t20180611_646988.shtml
CNEMC (2019) Air quality report of 168 cities, January 2019. ChinaNational Environmental Monitoring Centre. http://www.cnemc.cn/jcbg/kqzlzkbg/201903/W020190328455620750403.pdf
Gan WQ, Koehoorn M, Davies HW, Demers PA, Tamburic L,Brauer M (2011) Long-term exposure to traffic-related airpollution and the risk of coronary heart disease hospitaliza-tion and mortality. Environ Health Perspect 119:501–507.https://doi.org/10.1289/ehp.1002511
Gothenburg Municipality (2018) Air in Gothenburg, annual report.Miljöförvaltningen, Gothenburg. https://goteborg.se/wps/wcm/connect/2485bad2-4214-46b7-96b3-84d5b0eeb186/N800_R_2019_15.pdf?MOD=AJPERES. Accessed July 2019
GRIMM (2019) MINI WIDE RANGE AEROSOL SPECTROMETER.https://www.grimm-aerosol.com/products-en/indoor-air-quality/the-wide-range-hybrid/1371/. Accessed June 2019
Huang J, Deng F, Wu S, Guo X (2012) Comparisons of personal expo-sure to PM2.5 and CO by different commuting modes in Beijing,China. Sci Total Environ 425:52–59. https://doi.org/10.1016/j.scitotenv.2012.03.007
Jain S (2017) Exposure to in-vehicle respirable particulate matter in pas-senger vehicles under different ventilation conditions and seasons.Sustain Environ Res 27:87–94. https://doi.org/10.1016/j.serj.2016.08.006
Kaminsky JA, Gaskin EALM, Matsuda M, Miguel AH (2009) In-cabincommuter exposure to ultrafine particles on commuter roads in andaround Hong Kong’s Tseung Kwan O Tunnel. Aerosol Air QualRes 9:353–357. https://doi.org/10.4209/aaqr.2008.09.0041
Kaur S, Nieuwenhuijsen M, Colvile R (2005) Personal exposure of streetcanyon intersection users to PM2.5, ultrafine particle counts andcarbon monoxide in Central London, UK. Atmos Environ 39:3629–3641. https://doi.org/10.1016/j.atmosenv.2005.02.046
Kim HJ, Han B, Woo CG, Kim YJ, Lim GT, Shin WG (2017a)Air cleaning performance of a novel electrostatic air purifierusing an activated carbon fiber filter for passenger cars. IEEETrans Ind Appl 53:5867–5874. https://doi.org/10.1109/TIA.2017.2745499
KimHJ, HanB,Woo CG, KimYJ (2017b) Ozone emission and electricalcharacteristics of ionizers with different electrode materials, num-bers, and diameters. IEEE Trans Ind Appl 53:459–465. https://doi.org/10.1109/TIA.2016.2606362
Knibbs LD, de Dear RJ (2010) Exposure to ultrafine particles and PM2.5in four Sydney transport modes. Atmos Environ 44:3224–3227.https://doi.org/10.1016/j.atmosenv.2010.05.026
Knibbs LD, de Dear RJ, Morawska L, Mengersen KL (2009) On-roadultrafine particle concentration in the M5 East road tunnel, Sydney,Australia. Atmos Environ 43:3510–3519. https://doi.org/10.1016/j.atmosenv.2009.04.029
Knibbs LD, De Dear RJ, Morawska L (2010) Effect of cabin ventilationrate on ultrafine particle exposure inside automobiles. Environ SciTechnol 44:3546–3551. https://doi.org/10.1021/es9038209
Kumar P, Patton AP, Durant JL, Frey HC (2018) A review offactors impacting exposure to PM 2.5 , ultrafine particles andblack carbon in Asian transport microenvironments. AtmosEnviron 187:301–316. https://doi.org/10.1016/j.atmosenv.2018.05.046
McCreanor J, Cullinan P, Nieuwenhuijsen MJ, Stewart-Evans J,Malliarou E, Jarup L, Harrington R, Svartengren M, Han IK,Ohman-Strickland P, Chung KF, Zhang J (2007) Respiratory effectsof exposure to diesel traffic in persons with asthma. N Engl J Med357:2348–2358. https://doi.org/10.1056/NEJMoa071535
MEEPRC (2018) China vehicle environmental management annual re-port. Ministry of Ecology and Environment of the People's Republico f Ch i n a . h t t p : / / d qh j .mee . gov . c n / j d ch j g l / 2 01806 /P020180604354753261746.pdf
Mitsakou C, Housiadas C, Eleftheriadis K, Vratolis S, Helmis C,Asimakopoulos D (2007) Lung deposition of fine and ultrafine par-ticles outdoors and indoors during a cooking event and a no activityperiod. Indoor Air 17:143–152. https://doi.org/10.1111/j.1600-0668.2006.00464.x
Nayeb Yazdi M, Arhami M, Delavarrafiee M, Ketabchy M (2019)Developing air exchange rate models by evaluating vehicle in-cabin air pollutant exposures in a highway and tunnel setting: casestudy of Tehran, Iran. Environ Sci Pollut Res 26:501–513. https://doi.org/10.1007/s11356-018-3611-9
Oberdörster G (2000) Pulmonary effects of inhaled ultrafine particles. IntArch Occup Environ Health 74:1–8. https://doi.org/10.1007/s004200000185
Park JH, Yoon KY, Hwang J (2011) Removal of submicron particlesusing a carbon fiber ionizer-assisted medium air filter in a heating,ventilation, and air-conditioning (HVAC) system. Build Environ 46:1699–1708. https://doi.org/10.1016/j.buildenv.2011.02.010
Qi C, Stanley N, Pui DYHH, Kuehn TH (2008) Laboratory and on-roadevaluations of cabin air filters using number and surface area con-centration monitors. Environ Sci Technol 42:4128–4132. https://doi.org/10.1021/es703216c
Qiu Z, Song J, Xu X, Luo Y, Zhao R, Zhou W, Xiang B, Hao Y (2017)Commuter exposure to particulate matter for different transportationmodes in Xi’an, China. Atmos Pollut Res 8:940–948. https://doi.org/10.1016/j.apr.2017.03.005
Qiu Z, Liu W, Gao HO, Li J (2019) Variations in exposure to in-vehicleparticle mass and number concentrations in different road environ-ments. J Air Waste Manage Assoc 69:988–1002. https://doi.org/10.1080/10962247.2019.1629357
30829Environ Sci Pollut Res (2020) 27:30815–30830

Ramos CA, Wolterbeek HT, Almeida SM (2016) Air pollutant exposureand inhaled dose during urban commuting: a comparison betweencycling and motorized modes. Air Qual Atmos Heal 9:867–879.https://doi.org/10.1007/s11869-015-0389-5
Shi B (2012) Removal of ultrafine particles by intermediate air filters inventilation systems evaluation of performance and analysis of appli-cations ventilation systems. Dissertation, Chalmers University ofTechnology
Survey Office (2018) Annual societal report. Beijing Municipal Bureauof Statistics. http://tjj.beijing.gov.cn/zxfb/201903/t20190320_418991.html
Swedish Transport Adminstration (2018) Road Traffic Flow Map 2018.http://vtf.trafikverket.se/SeTrafikinformation. Accessed July 2019
Transport Analysis (2018) Vehicles in counties and municipalities 2018.https://www.trafa.se/en/road-traffic/vehicle-statistics/
Xu B, Zhu Y (2009) Quantitative analysis of the parameters affecting in-cabin to on-roadway (I/O) ultrafine particle concentration ratios.Aerosol Sci Technol 43:400–410. https://doi.org/10.1080/02786820802705837
Zhu Y, Eiguren-Fernandez A, Hinds WC, Miguel AH (2007) In-cabincommuter exposure to ultrafine particles on Los Angeles freeways.Environ Sci Technol 41:2138–2145. https://doi.org/10.1021/es0618797
Publisher’s note Springer Nature remains neutral with regard to jurisdic-tional claims in published maps and institutional affiliations.
30830 Environ Sci Pollut Res (2020) 27:30815–30830