request for redesignation of the libby pm2.5 nonattainment ...

Atmospheric Environment 35 (2001) 2757–2771
PM10 and PM2.5 concentrations in Central and EasternEurope: results from the Cesar study
Danny Houthuijsa,*, Oscar Breugelmansa, Gerard Hoekb, !Eva Vask .ovic,Eva Mih!alikov!ad, Jozef S. Pastuszkae, Vitezslav Jirikf, Stela Sachelarescug,
Dobrinka Lolovah, Kees Meliefsteb, Evtimia Uzunovah, Carmen Marinescug,Jaroslav Volff, Frank de Leeuwa, Henk van de Wiela, Tony Fletcheri,
Erik Lebreta, Bert Brunekreefb
aLaboratory of Exposure Assessment and Environmental Epidemiology, National Institute of Public Health and the Environment
(RIVM), P.O. Box 1, 3720 BA, Bilthoven, The Netherlandsb Institute for Risk Assessment Sciences, Utrecht University, P.O. Box 80176, 3508 TD Utrecht, The Netherlands
c ’J.Fodor’ National Public Health Centre, National Institute of Environmental Health, Gy !ali ut 2-6, H-1097 Budapest, HungarydState Health Institute, Cesta k nemocnici 1, 975 56 Bansk !a Bystrica, Slovak Republic
e Institute of Occupational Medicine and Environmental Health, 13 Koscienla Street, 41-200 Sosnowiec, PolandfRegional Institute of Hygiene, Partyz !ansk !e n !amesti 7, 728 92 Ostrava, Czech Republic
g Institute of Public Health Bucharest, Leonte str. 1-3, 76256 Bucharest, RomaniahNational Centre of Hygiene, Blvd Dimitar Nestorov 15, 1431 Sofia, Bulgaria
iLondon School of Hygiene and Tropical Medicine, Environmental Epidemiology Unit, Keppel Street, London WC1E 7HT, UK
Received 4 August 2000; received in revised form 17 January 2001; accepted 27 January 2001
Abstract
Between November 1995 and October 1996, particulate matter concentrations (PM10 and PM2.5) were measured in 25study areas in six Central and Eastern European countries: Bulgaria, Czech Republic, Hungary, Poland, Romania andSlovak Republic. To assess annual mean concentration levels, 24-h averaged concentrations were measured every sixth
day on a fixed urban background site using Harvard impactors with a 2.5 and 10mm cut-point. The concentration of thecoarse fraction of PM10 (PM10�2.5) was calculated as the difference between the PM10 and the PM2.5 concentration.Spatial variation within study areas was assessed by additional sampling on one or two urban background sites within
each study area for two periods of 1 month. QA/QC procedures were implemented to ensure comparability of resultsbetween study areas. A two to threefold concentration range was found between study areas, ranging from an annualmean of 41 to 98 mg m�3 for PM10, from 29 to 68mg m�3 for PM2.5 and from 12 to 40mg m�3 for PM10�2.5. The lowestconcentrations were found in the Slovak Republic, the highest concentrations in Bulgaria and Poland. The variation in
PM10 and PM2.5 concentrations between study areas was about 4 times greater than the spatial variation within studyareas suggesting that measurements at a single sampling site sufficiently characterise the exposure of the population inthe study areas. PM10 concentrations increased considerably during the heating season, ranging from an average
*Corresponding author. Fax: +31-30-2744451.
E-mail addresses: [email protected] (D. Houthuijs), [email protected] (G. Hoek), [email protected] ( !E. Vask.ovi),
[email protected] (E. Mih!alikov!a), [email protected] (J.S. Pastuszka), [email protected] (V. Jirik),
[email protected] (D. Lolova), [email protected] (K. Meliefste), [email protected] (E. Uzunova), [email protected]
(J. Volf), [email protected] (F. de Leeuw), [email protected] (H. van de Wiel), [email protected] (T. Fletcher),
[email protected] (E. Lebret), [email protected] (B. Brunekreef).
1352-2310/01/$ - see front matter # 2001 Elsevier Science Ltd. All rights reserved.
PII: S 1 3 5 2 - 2 3 1 0 ( 0 1 ) 0 0 1 2 3 - 6
increase of 18 mg m�3 in the Slovak Republic to 45mg m�3 in Poland. The increase of PM10 was mainly driven byincreases in PM2.5; PM10�2.5 concentrations changed only marginally or even decreased. Overall, the results indicate
high levels of particulate air pollution in Central and Eastern Europe with large changes between seasons, likely causedby local heating. # 2001 Elsevier Science Ltd. All rights reserved.
Keywords: Particulate matter; QA/QC; Central and Eastern Europe
1. Introduction
From the scientific and policy viewpointhuman exposure to particulate air pollution is of great
interest. Studies in Western Europe and theUnited States suggest associations between short-term exposure to PM10 and increased mortality,hospital admissions, medication use, respiratory
symptoms and reduced pulmonary function (Dockeryand Pope, 1994; Hoek and Brunekreef, 1993;Katsouyanni et al., 1995; Ostro et al., 1999).
An increasing number of studies indicates thatlong-term exposure to particulate matter has adverseeffects on respiratory health as well (Abbey et al., 1998;
Braun-Fahrl.ander et al., 1997; Dockery et al., 1993,1996; Pope et al., 1995). Some results suggest that healtheffects are more strongly associated with exposure toairborne particulate matter less than 2.5 mm (PM2.5)
than with the coarse fraction of PM10 (Wilson and Suh,1997).
The majority of epidemiological studies looking
into the relation between particulate matter andadverse health effects have been carried out in NorthAmerica and Western Europe. Studies in Central and
Eastern Europe are still scarce, mainly due to limitedresources and the absence of reliable air pollution dataand health statistics. To fill this gap, the Central
European Study on Air pollution and Respiratoryhealth (CESAR) was initiated in 1995 to study thehealth effects of exposure to particulate matter. Theprimary objectives of the study were: (1) to establish
comparable baseline data on respiratory health inchildren and on current exposure to air pollutants inpolluted regions in six Central and Eastern European
countries (Bulgaria, Czech Republic, Hungary, Poland,Romania, and Slovak Republic), and (2) to investigatethe relation between respiratory health and air
pollutants.The aim of this paper is to present the study design
and the baseline results of the PM10 and PM2.5
measurements in the CESAR study. For the purpose
of the health effects study, we also report on theconcentrations of coarse particulate matter (PM10�2.5).PM10�2.5 was not measured separately, but calculated as
the difference between the PM10 and the PM2.5
concentration.
2. Methods
2.1. Study design
The six participating national research centres selectedfour study areas each, based on historical air pollutionlevels gathered from existing ambient air pollutionmonitoring networks. The Hungarian team selected a
fifth study area due to the limited number of schoolchildren in the other four Hungarian areas, bringing thetotal number of study areas to 25. The study areas were
selected to represent differences in the expected exposurelevels of the air pollution components between studyareas within countries. Preferably, the areas also differed
in the sources that dominate the local air pollution levelssuch as traffic, local combustion, or industry.
To assess annual mean concentration levels, 24-haveraged concentrations of PM10 and PM2.5 were
measured every sixth day on a fixed urban backgroundsite from November 1995 until October 1996. Thechosen sampling design is able to produce a precise
measure of the annual mean PM10 and PM2.5 concen-trations, enabling the detection of concentration differ-ences between two study areas in the order of 10–20%
when the standard deviations are expected to be between50% and 75% of the mean. Sampling dates and timeswere synchronised between all study areas within a
country with a margin of 1 h.Traditionally, the heating period in Central and
Eastern Europe is centrally imposed. The period startson 15 October and lasts until 15 April. Since an increase
in air pollution was expected due to local heating, thedifferences in particulate matter concentrations betweenthe heating and non-heating season were explored.
To document the degree of spatial variability ofparticulate matter concentrations within study areas asvalidation of the main measurement program, two
additional urban background sampling sites wereselected in each study area. Two sampling units rotatedbetween study areas within countries, resulting in spatialmeasurements on every sixth day for two periods of 1
month in each study area: one in the heating season, andone in the non-heating season. The spatial variabilitymeasurements were carried out on the same dates and
with the same start and end times as the measurementson the main sampling sites.
D. Houthuijs et al. / Atmospheric Environment 35 (2001) 2757–27712758

2.2. Study areas and sampling sites
An overview of the 25 study locations is presented inFig. 1. The areas are roughly located along a North–South axis between southern Poland and southern
Bulgaria, covering a distance of approximately1100 km. The study areas were selected based on thefollowing criteria: (1) no major changes in air qualitylevels during the last 5–10 years, (2) the presence of a
measurement site of an existing monitoring network forparticulate matter, SO2, NO2, and O3, (3) a relativelyhomogeneously exposed population, (4) a population
with a comparable socio-economic profile to the otherareas in the countries, (5) the presence of at least 1500primary school children 7–11 years of age, and (6) a
relatively low rate of migration. To achieve contrastingparticulate matter concentrations between areas, mostcentres selected study areas in different parts of their
country. The centre in the Czech Republic selected fourareas in and around the city of Ostrava, located in thenortheast of the country. Characteristics of the selectedstudy areas are presented in Table 1.
To adequately represent the pollution levels in eachstudy area, main and spatial sampling sites were selectedaccording to EPA (1987) requirements. The main
criteria for selection were: the site should be in thecatchment area of the study population and representtheir exposure, be located away from local sources
(distance from busy roads and small sources ofcombustion gases and particulate matter >50 m, not
on roofs with chimneys removing waste gases fromburning oil, coal or solid waste), have an unrestricted airflow around the sampler, not be within 5 m of exhaust
flues or vents, the inlet of the sampler should be locatedat least 2 m away from a high volume sampler inlet and1 m from a medium volume sampler, and the samplingheight should be between 1.5 and 4 m.
2.3. Measurement methods
Harvard impactors (Marple et al., 1987) designed to
sample PM10 and PM2.5 were obtained from AirDiagnostics and Engineering Inc. (Naples, Maine,USA). The Harvard impactors have a size selective inletthat collects particulate matter with a 50% cut-off
aerodynamic diameter of 10mm (PM10) or 2.5mm(PM2.5) at a flow of 10 l min�1. Pump units that wereable to operate a PM10 and PM2.5 Harvard impactor
simultaneously were built centrally. Each unit wasplaced in an aluminium box to protect the pump againstrain and equipped with an elapsed time indicator to
record the running time of the pump, a timer to allowfor synchronisation of sampling times between studyareas, and two 10 l min�1 critical orifices for flowcontrol. Each centre received six pump units, six
Fig. 1. Map of the 25 study areas in Central and Eastern Europe.
D. Houthuijs et al. / Atmospheric Environment 35 (2001) 2757–2771 2759

impactors for the measurement of PM10, six impactorsfor PM2.5 and four centrally calibrated flowrators.
PM10 and PM2.5 were collected using Andersen 37 mm
2mm pore size Teflon filters; these were used forgravimetric analyses. Both before and after sampling,the conditioning of the filters took place at constantrelative humidity and temperature for at least 24 h
following EPA requirements (EPA, 1987). In theabsence of climate controlled weighing rooms, desicca-tors containing a saturated solution of K2CO3 were used
to achieve a constant relative humidity of 44%. Aftersampling, the filters were collected from the field and
stored in a refrigerator at 5� 38C within 24 h to limitlosses of volatile components (Chow, 1995). Theresearch centres used analytical balances with a mini-
mum reading precision of 10 mg for the weighing of thefilters.
2.4. Quality assurance and quality control
Quality assurance and quality control procedureswere an integral part of the CESAR study, starting with
the central procurement of sampling equipment andconsumables to increase comparability between the
Table 1
Characteristics of CESAR study areas
Study area Main local sources and other characteristics # inhabitants
Bulgaria
1. Sofia suburb Thermal power station; 2% of homes oil or coal heated; shallow valley 110,000
2. Sofia centre Traffic; local heating (13% oil or coal); city centre; shallow valley 250,000
3. Assenovgrad 80% of homes coal or oil heated; lead and zinc smelter; hillside 52,000
4. Vratza 70% of homes coal or oil heated; chemical plant; hillside 80,000
Czech Republic
5. Ostrava Centre Ironworks; 11% of homes coal or oil heated; traffic; city centre; open plain 32,000
6. Ostrava-Vitkovice Ironworks; power station; cokes oven; centre of industrial complex; 6% local coal or
oil heating; open plain
32,000
7. Ostrava Poruba No major industrial sources; residential area; no local heating; hillside 36,000
8. Ostrava-Radvanice Ironworks; local heating (16% coal or oil); cokes oven; open plain 32,000
Hungary
9. Dorog Industrial complex; waste incinerator; traffic; local heating (50% coal or oil); valley 13,000
10. Tata 60% of the homes coal or oil heated; traffic; shallow valley 24,000
11. Cegled No major industrial sources; 40% of homes coal or oil heated; open plain 35,000
12. Tatabanya Oil/coal power station; agricultural industry; traffic; local heating (30% coal or oil);
shallow valley
70,000
13. Eger 30% of the homes coal or oil heated; traffic; hillside 60,000
Poland
14. Swietochlowice Coal mining; >95% of homes heated by coal; heavy industry; hillside in
Silesian industrial zone
60,000
15. Kedzierzyn-Kozle Chemical industry; >95% of homes heated by coal; two towns in open plain 70,000
16. Pszczyna No major industrial sources; >95% of homes heated by coal; open plain 40,000
17. Kielce No major industrial sources; >95% of homes heated by coal; open plain 215,000
Romania
18. Baia Mare Two non-ferrous metallurgical plants; 11% of the homes coal or wood heated; hillside 150,000
19. Bucharest Traffic; industry; local heating (15% coal or wood); open plain 2,1 mill.
20. Ploiesti Petrochemical and chemical industry; traffic; local heating (12% coal or wood);
open plain
250,000
21. Targu Mures Fertilizer and photochemical plant; local heating (3% coal or wood); open plain 160,000
Slovak Republic
22. Bansk!a Bystrica suburb No major local sources; 1% of the homes coal or wood heated; hillside 42,500
23. Bansk!a Bystrica centre Traffic; local heating (2% coal or wood); wood and cement plant; central heating
station; deep valley
42,500
24. Zilina Traffic; local heating (2% coal or wood); chemical and paper plant; heating station;
shallow valley
90,000
25. Bratislava Traffic; city centre; 4% of the homes coal or wood heated; open plain 450,000
D. Houthuijs et al. / Atmospheric Environment 35 (2001) 2757–27712760
laboratories. Preparation and analyses of the sampleswere limited to one laboratory per country. Field
sampling and weighing procedures were carried outaccording to a detailed protocol centrally prepared forthe study. The flow rate of the impactors was checked
before and after each sampling session. A control setof two blank and two exposed Teflon filters, thatremained in the laboratory in a temperature andhumidity controlled place, was weighed on each day
that a filter weighing session took place. To allowcontinuation of the weighing procedure, deviation frommean filter weight averaged over the two filters of both
the blank and exposed control set had to be less than150mg. Accuracy of the analytical balance was checkedusing a certified mass piece. Results from the laboratory
analysis were combined with the field logs in a standardspreadsheet format and centrally checked using auniform set of criteria.
Since PM10�2.5 was derived from PM10 and PM2.5
concentrations that were measured with different sam-plers, negative concentrations for PM10�2.5 were found.Observed negative differences between PM10 and PM2.5
were accepted up to a limit of three times the samplingerror of the measurement of the difference. Assuming acoefficient of variation (CV) of 3.5% for each of the
measurement methods, the CV of the measurement ofthe difference is 5%. The subsequent inclusion criterionwas PM1050.85�PM2.5. For relative low particulate
matter concentrations, a CV of 2.5 mg m�3 for each ofthe methods was assumed, which led to the criterionPM105PM2.5�10. Non-compliance with the less strin-gent criterion led to removal of both the PM10 and the
PM2.5 concentration from the data set.A pilot study was carried out to familiarise the
research centres with the measurement methods and to
get an indication whether the accuracy and precision ofthe participating laboratories was sufficient. Six blankand six exposed Teflon filters were weighed on five
different days. The difference between the minimum andmaximum value had to be smaller than 100mg for allfilters. On five different days all six pump units were used
to sample PM10 and PM2.5 in the same location for 24 h.The daily standard deviation of the concentrations onthe 5 days had to be less than 5mg m�3. In addition,before and during the main sampling period an
interlaboratory comparison was carried out. Six sets ofexposed and blank filters were prepared and weighed atone central co-ordinating laboratory. The exposed filters
were heated overnight to evaporate volatile componentsof the particulate matter. Each national laboratoryreceived a carefully packed and sealed set of two
exposed and two blank filters by express mail. Afterweighing, the filters were sent back to the co-ordinatinglaboratory to be weighed again to document potential
differences in weight due to transport. Because thecomparison with the central laboratory was essential, all
these filters were weighed in one mixed design analysisrun. The target for the filter weight of the blank and the
exposed filters was a deviation less than 70mg of themedian of the six centres, i.e. a maximum concentrationdifference of 5% for a 24 h sampling period. Further-
more, the difference between blank and exposed filterswas not allowed to deviate more than 50 mg from themedian of the six centres.
To support the QA/QC procedures, the laboratory in
each of the countries was visited by an audit team,consisting of a professional lead assessor for laboratoryaccreditation, two trained participant assessors from
Central and Eastern Europe, and two analytical expertsacting as support. The laboratories were evaluated usingthe Criteria for laboratories (1996) of the Dutch Council
for accreditation, which is based on ISO IEC Guide 25(1990) and EN45001 (1989). The audits served to assessthe implementation of measurement procedures and
techniques, and at the same time it trained studyparticipants in conducting audits and understandingthe practice of laboratory accreditation.
2.5. Data analysis
Since particulate matter concentrations in most study
areas were approximately log-normally distributed,statistical analyses were carried out using log-trans-formed PM10 and PM2.5 values. Concentration differ-
ences between the non-heating and heating season weretested using a two-sided t-test. The design of the spatialvariability study enabled the comparison of the between
study area and between sampling dates variation withthe within study area variation, using analysis ofvariance. Because log-transformed values were used forthe analysis, coefficients of variation (CV) were calcu-
lated from the mean squares to quantify the contribu-tion of the different sources of variation. Theassociations between 24-h averaged concentration levels
in the various study areas were characterised usingPearson correlation coefficients.
In the calculation of the annual mean concentration,
observations with missing values are usually ignored,resulting in loss of information and perhaps bias of themean. Multiple imputation was used as tool to solve
these problems. Using information obtained from theobserved part of the data set in a study area, missingobservations were simulated 20 times using a Markovchain Monte Carlo technique, creating 20 equally
plausible versions of the complete data set. This wasdone separately for the heating and the non-heatingseason. An imputed data set of the heating season was
combined with an imputed data set of the non-heatingseason. From each of the 20 combined data sets themean and standard error for PM10, PM2.5 and PM10�2.5
were calculated. The 20 sets of results were then com-bined, using Rubin’s (1987) rules for scalar estimands to
D. Houthuijs et al. / Atmospheric Environment 35 (2001) 2757–2771 2761
produce one set of means and 95% confidence intervalsthat incorporate missing-data uncertainty.
Statistical analyses were performed using STATAstatistical software (StataCorp, 1999), and missingconcentration values were imputed using the NORM
multiple imputation software (Schafer, 1999).
3. Results
3.1. Quality assurance and quality control
During the period November 1995–October 1996 amaximum number of sixty-one 24-h concentrations
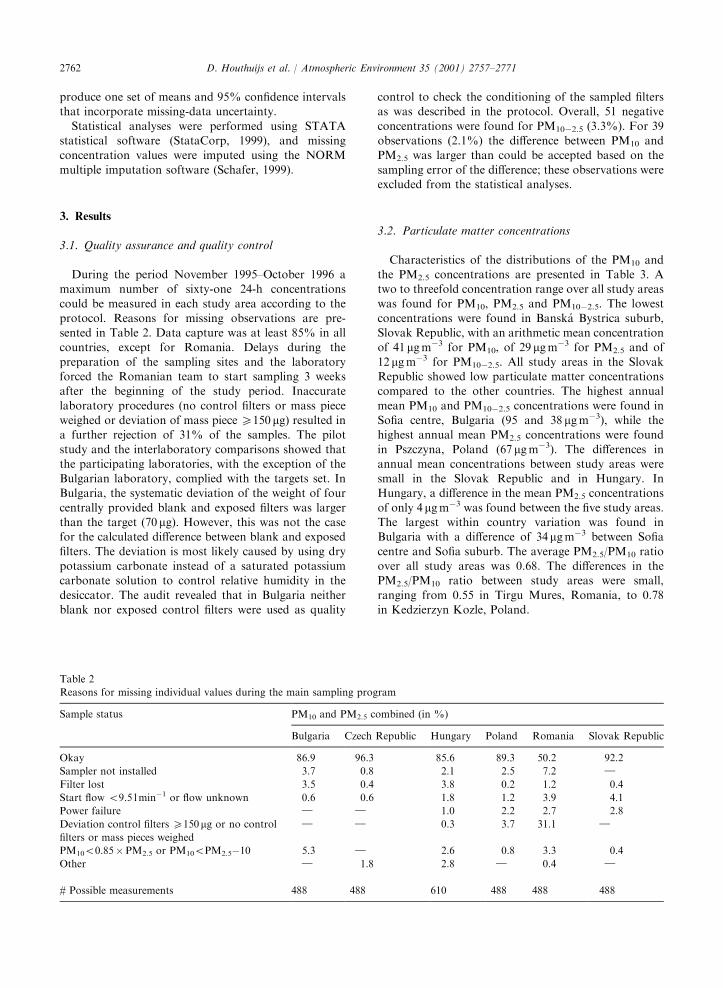
could be measured in each study area according to theprotocol. Reasons for missing observations are pre-sented in Table 2. Data capture was at least 85% in allcountries, except for Romania. Delays during the
preparation of the sampling sites and the laboratoryforced the Romanian team to start sampling 3 weeksafter the beginning of the study period. Inaccurate
laboratory procedures (no control filters or mass pieceweighed or deviation of mass piece 5150 mg) resulted ina further rejection of 31% of the samples. The pilot
study and the interlaboratory comparisons showed thatthe participating laboratories, with the exception of theBulgarian laboratory, complied with the targets set. InBulgaria, the systematic deviation of the weight of four
centrally provided blank and exposed filters was largerthan the target (70 mg). However, this was not the casefor the calculated difference between blank and exposed
filters. The deviation is most likely caused by using drypotassium carbonate instead of a saturated potassiumcarbonate solution to control relative humidity in the
desiccator. The audit revealed that in Bulgaria neitherblank nor exposed control filters were used as quality
control to check the conditioning of the sampled filtersas was described in the protocol. Overall, 51 negative
concentrations were found for PM10�2.5 (3.3%). For 39observations (2.1%) the difference between PM10 andPM2.5 was larger than could be accepted based on the
sampling error of the difference; these observations wereexcluded from the statistical analyses.
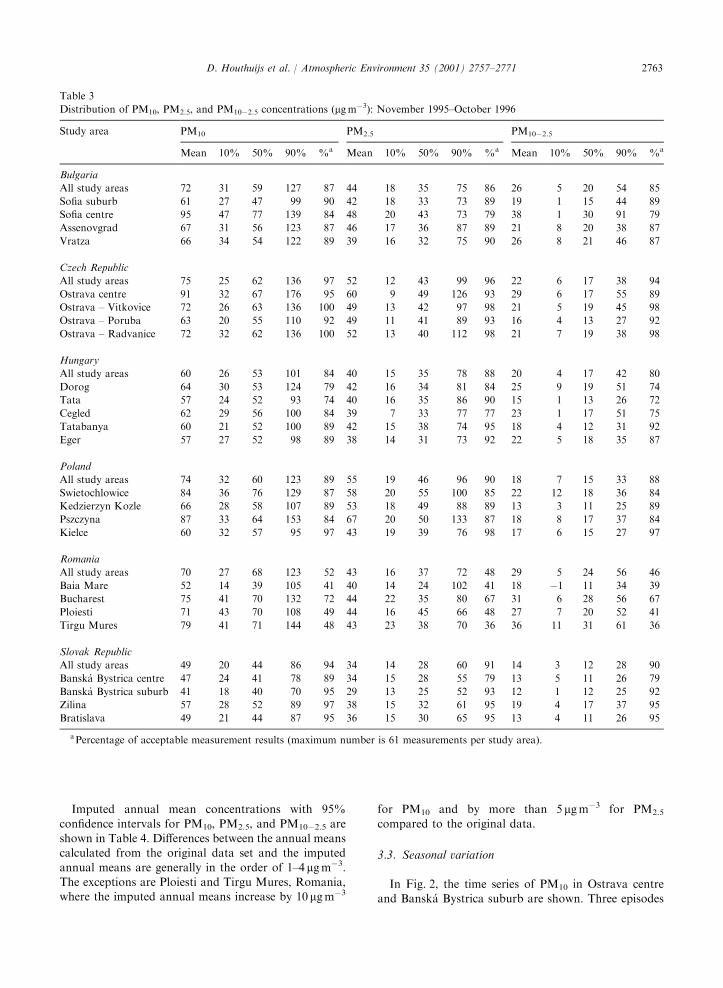
3.2. Particulate matter concentrations
Characteristics of the distributions of the PM10 andthe PM2.5 concentrations are presented in Table 3. Atwo to threefold concentration range over all study areas
was found for PM10, PM2.5 and PM10�2.5. The lowestconcentrations were found in Bansk!a Bystrica suburb,Slovak Republic, with an arithmetic mean concentrationof 41 mg m�3 for PM10, of 29 mg m�3 for PM2.5 and of
12 mg m�3 for PM10�2.5. All study areas in the SlovakRepublic showed low particulate matter concentrationscompared to the other countries. The highest annual
mean PM10 and PM10�2.5 concentrations were found inSofia centre, Bulgaria (95 and 38 mg m�3), while thehighest annual mean PM2.5 concentrations were found
in Pszczyna, Poland (67 mg m�3). The differences inannual mean concentrations between study areas weresmall in the Slovak Republic and in Hungary. InHungary, a difference in the mean PM2.5 concentrations
of only 4 mg m�3 was found between the five study areas.The largest within country variation was found inBulgaria with a difference of 34mg m�3 between Sofia
centre and Sofia suburb. The average PM2.5/PM10 ratioover all study areas was 0.68. The differences in thePM2.5/PM10 ratio between study areas were small,
ranging from 0.55 in Tirgu Mures, Romania, to 0.78in Kedzierzyn Kozle, Poland.
Table 2
Reasons for missing individual values during the main sampling program
Sample status PM10 and PM2.5 combined (in %)
Bulgaria Czech Republic Hungary Poland Romania Slovak Republic
Okay 86.9 96.3 85.6 89.3 50.2 92.2
Sampler not installed 3.7 0.8 2.1 2.5 7.2 }
Filter lost 3.5 0.4 3.8 0.2 1.2 0.4
Start flow 59.5 l min�1 or flow unknown 0.6 0.6 1.8 1.2 3.9 4.1
Power failure } } 1.0 2.2 2.7 2.8
Deviation control filters 5150mg or no control
filters or mass pieces weighed
} } 0.3 3.7 31.1 }
PM1050.85�PM2.5 or PM105PM2.5�10 5.3 } 2.6 0.8 3.3 0.4
Other } 1.8 2.8 } 0.4 }
# Possible measurements 488 488 610 488 488 488
D. Houthuijs et al. / Atmospheric Environment 35 (2001) 2757–27712762
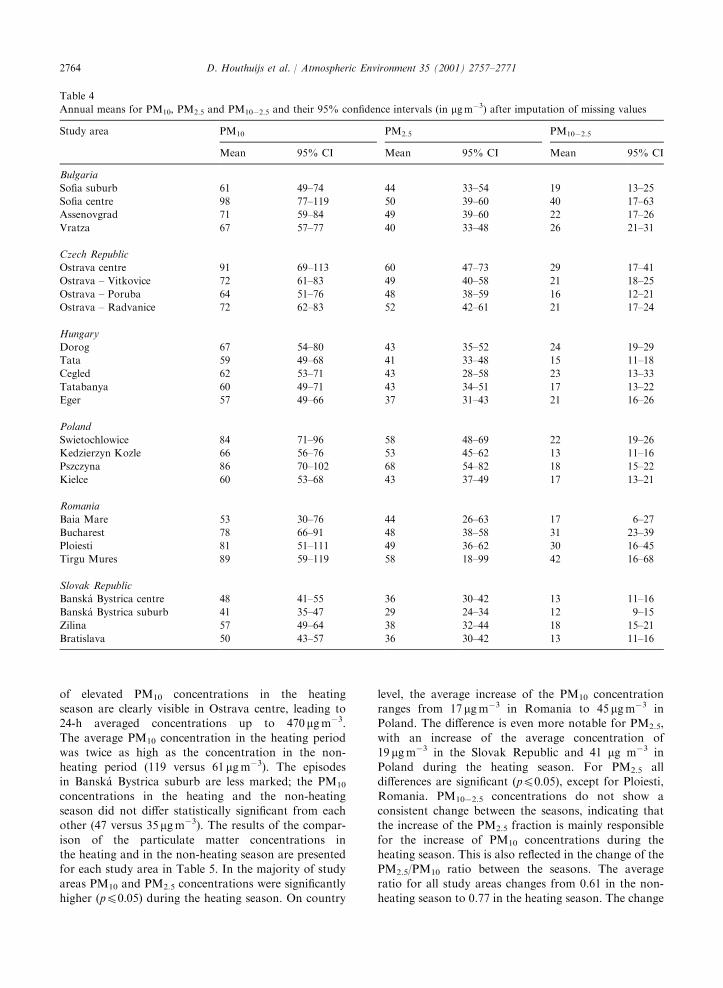
Imputed annual mean concentrations with 95%
confidence intervals for PM10, PM2.5, and PM10�2.5 areshown in Table 4. Differences between the annual meanscalculated from the original data set and the imputed
annual means are generally in the order of 1–4 mg m�3.The exceptions are Ploiesti and Tirgu Mures, Romania,where the imputed annual means increase by 10mg m�3
for PM10 and by more than 5 mg m�3 for PM2.5
compared to the original data.
3.3. Seasonal variation
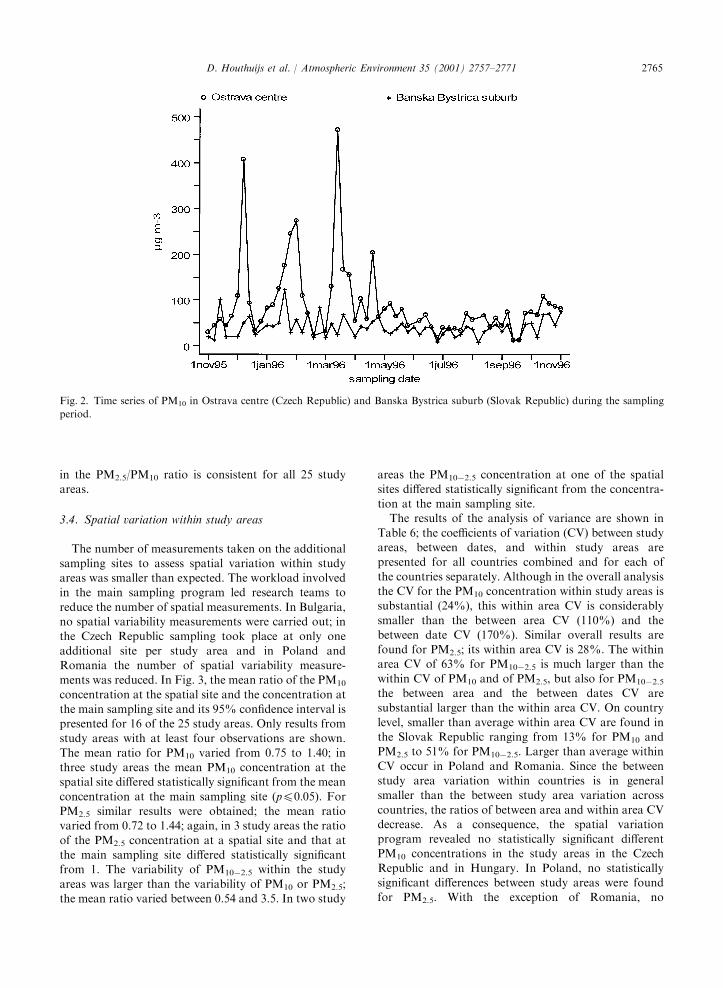
In Fig. 2, the time series of PM10 in Ostrava centreand Bansk!a Bystrica suburb are shown. Three episodes
Table 3
Distribution of PM10, PM2.5, and PM10�2.5 concentrations (mg m�3): November 1995–October 1996
Study area PM10 PM2.5 PM10�2.5
Mean 10% 50% 90% %a Mean 10% 50% 90% %a Mean 10% 50% 90% %a
Bulgaria
All study areas 72 31 59 127 87 44 18 35 75 86 26 5 20 54 85
Sofia suburb 61 27 47 99 90 42 18 33 73 89 19 1 15 44 89
Sofia centre 95 47 77 139 84 48 20 43 73 79 38 1 30 91 79
Assenovgrad 67 31 56 123 87 46 17 36 87 89 21 8 20 38 87
Vratza 66 34 54 122 89 39 16 32 75 90 26 8 21 46 87
Czech Republic
All study areas 75 25 62 136 97 52 12 43 99 96 22 6 17 38 94
Ostrava centre 91 32 67 176 95 60 9 49 126 93 29 6 17 55 89
Ostrava – Vitkovice 72 26 63 136 100 49 13 42 97 98 21 5 19 45 98
Ostrava – Poruba 63 20 55 110 92 49 11 41 89 93 16 4 13 27 92
Ostrava – Radvanice 72 32 62 136 100 52 13 40 112 98 21 7 19 38 98
Hungary
All study areas 60 26 53 101 84 40 15 35 78 88 20 4 17 42 80
Dorog 64 30 53 124 79 42 16 34 81 84 25 9 19 51 74
Tata 57 24 52 93 74 40 16 35 86 90 15 1 13 26 72
Cegled 62 29 56 100 84 39 7 33 77 77 23 1 17 51 75
Tatabanya 60 21 52 100 89 42 15 38 74 95 18 4 12 31 92
Eger 57 27 52 98 89 38 14 31 73 92 22 5 18 35 87
Poland
All study areas 74 32 60 123 89 55 19 46 96 90 18 7 15 33 88
Swietochlowice 84 36 76 129 87 58 20 55 100 85 22 12 18 36 84
Kedzierzyn Kozle 66 28 58 107 89 53 18 49 88 89 13 3 11 25 89
Pszczyna 87 33 64 153 84 67 20 50 133 87 18 8 17 37 84
Kielce 60 32 57 95 97 43 19 39 76 98 17 6 15 27 97
Romania
All study areas 70 27 68 123 52 43 16 37 72 48 29 5 24 56 46
Baia Mare 52 14 39 105 41 40 14 24 102 41 18 �1 11 34 39
Bucharest 75 41 70 132 72 44 22 35 80 67 31 6 28 56 67
Ploiesti 71 43 70 108 49 44 16 45 66 48 27 7 20 52 41
Tirgu Mures 79 41 71 144 48 43 23 38 70 36 36 11 31 61 36
Slovak Republic
All study areas 49 20 44 86 94 34 14 28 60 91 14 3 12 28 90
Bansk!a Bystrica centre 47 24 41 78 89 34 15 28 55 79 13 5 11 26 79
Bansk!a Bystrica suburb 41 18 40 70 95 29 13 25 52 93 12 1 12 25 92
Zilina 57 28 52 89 97 38 15 32 61 95 19 4 17 37 95
Bratislava 49 21 44 87 95 36 15 30 65 95 13 4 11 26 95
a Percentage of acceptable measurement results (maximum number is 61 measurements per study area).
D. Houthuijs et al. / Atmospheric Environment 35 (2001) 2757–2771 2763
of elevated PM10 concentrations in the heatingseason are clearly visible in Ostrava centre, leading to24-h averaged concentrations up to 470 mg m�3.
The average PM10 concentration in the heating periodwas twice as high as the concentration in the non-heating period (119 versus 61 mg m�3). The episodesin Bansk!a Bystrica suburb are less marked; the PM10
concentrations in the heating and the non-heatingseason did not differ statistically significant from eachother (47 versus 35mg m�3). The results of the compar-
ison of the particulate matter concentrations inthe heating and in the non-heating season are presentedfor each study area in Table 5. In the majority of study
areas PM10 and PM2.5 concentrations were significantlyhigher (p40:05) during the heating season. On country
level, the average increase of the PM10 concentrationranges from 17 mg m�3 in Romania to 45 mg m�3 inPoland. The difference is even more notable for PM2.5,
with an increase of the average concentration of19 mg m�3 in the Slovak Republic and 41 mg m�3 inPoland during the heating season. For PM2.5 alldifferences are significant (p40:05), except for Ploiesti,
Romania. PM10�2.5 concentrations do not show aconsistent change between the seasons, indicating thatthe increase of the PM2.5 fraction is mainly responsible
for the increase of PM10 concentrations during theheating season. This is also reflected in the change of thePM2.5/PM10 ratio between the seasons. The average
ratio for all study areas changes from 0.61 in the non-heating season to 0.77 in the heating season. The change
Table 4
Annual means for PM10, PM2.5 and PM10�2.5 and their 95% confidence intervals (in mg m�3) after imputation of missing values
Study area PM10 PM2.5 PM10�2.5
Mean 95% CI Mean 95% CI Mean 95% CI
Bulgaria
Sofia suburb 61 49–74 44 33–54 19 13–25
Sofia centre 98 77–119 50 39–60 40 17–63
Assenovgrad 71 59–84 49 39–60 22 17–26
Vratza 67 57–77 40 33–48 26 21–31
Czech Republic
Ostrava centre 91 69–113 60 47–73 29 17–41
Ostrava – Vitkovice 72 61–83 49 40–58 21 18–25
Ostrava – Poruba 64 51–76 48 38–59 16 12–21
Ostrava – Radvanice 72 62–83 52 42–61 21 17–24
Hungary
Dorog 67 54–80 43 35–52 24 19–29
Tata 59 49–68 41 33–48 15 11–18
Cegled 62 53–71 43 28–58 23 13–33
Tatabanya 60 49–71 43 34–51 17 13–22
Eger 57 49–66 37 31–43 21 16–26
Poland
Swietochlowice 84 71–96 58 48–69 22 19–26
Kedzierzyn Kozle 66 56–76 53 45–62 13 11–16
Pszczyna 86 70–102 68 54–82 18 15–22
Kielce 60 53–68 43 37–49 17 13–21
Romania
Baia Mare 53 30–76 44 26–63 17 6–27
Bucharest 78 66–91 48 38–58 31 23–39
Ploiesti 81 51–111 49 36–62 30 16–45
Tirgu Mures 89 59–119 58 18–99 42 16–68
Slovak Republic
Bansk!a Bystrica centre 48 41–55 36 30–42 13 11–16
Bansk!a Bystrica suburb 41 35–47 29 24–34 12 9–15
Zilina 57 49–64 38 32–44 18 15–21
Bratislava 50 43–57 36 30–42 13 11–16
D. Houthuijs et al. / Atmospheric Environment 35 (2001) 2757–27712764
in the PM2.5/PM10 ratio is consistent for all 25 studyareas.
3.4. Spatial variation within study areas
The number of measurements taken on the additionalsampling sites to assess spatial variation within studyareas was smaller than expected. The workload involvedin the main sampling program led research teams to
reduce the number of spatial measurements. In Bulgaria,no spatial variability measurements were carried out; inthe Czech Republic sampling took place at only one
additional site per study area and in Poland andRomania the number of spatial variability measure-ments was reduced. In Fig. 3, the mean ratio of the PM10
concentration at the spatial site and the concentration atthe main sampling site and its 95% confidence interval ispresented for 16 of the 25 study areas. Only results from
study areas with at least four observations are shown.The mean ratio for PM10 varied from 0.75 to 1.40; inthree study areas the mean PM10 concentration at thespatial site differed statistically significant from the mean
concentration at the main sampling site (p40:05). ForPM2.5 similar results were obtained; the mean ratiovaried from 0.72 to 1.44; again, in 3 study areas the ratio
of the PM2.5 concentration at a spatial site and that atthe main sampling site differed statistically significantfrom 1. The variability of PM10�2.5 within the study
areas was larger than the variability of PM10 or PM2.5;the mean ratio varied between 0.54 and 3.5. In two study
areas the PM10�2.5 concentration at one of the spatialsites differed statistically significant from the concentra-tion at the main sampling site.
The results of the analysis of variance are shown in
Table 6; the coefficients of variation (CV) between studyareas, between dates, and within study areas arepresented for all countries combined and for each of
the countries separately. Although in the overall analysisthe CV for the PM10 concentration within study areas issubstantial (24%), this within area CV is considerably
smaller than the between area CV (110%) and thebetween date CV (170%). Similar overall results arefound for PM2.5; its within area CV is 28%. The withinarea CV of 63% for PM10�2.5 is much larger than the
within CV of PM10 and of PM2.5, but also for PM10�2.5
the between area and the between dates CV aresubstantial larger than the within area CV. On country
level, smaller than average within area CV are found inthe Slovak Republic ranging from 13% for PM10 andPM2.5 to 51% for PM10�2.5. Larger than average within
CV occur in Poland and Romania. Since the betweenstudy area variation within countries is in generalsmaller than the between study area variation across
countries, the ratios of between area and within area CVdecrease. As a consequence, the spatial variationprogram revealed no statistically significant differentPM10 concentrations in the study areas in the Czech
Republic and in Hungary. In Poland, no statisticallysignificant differences between study areas were foundfor PM2.5. With the exception of Romania, no
Fig. 2. Time series of PM10 in Ostrava centre (Czech Republic) and Banska Bystrica suburb (Slovak Republic) during the sampling
period.
D. Houthuijs et al. / Atmospheric Environment 35 (2001) 2757–2771 2765

statistically significant differences in PM10�2.5 concen-
trations between study areas were found for individualcountries.
3.5. Associations between study areas
Pearson correlation coefficients between study areaswere found to be significant (p40:05) in the majority of
the pairwise comparisons for PM10 and PM2.5. Out of a
total of 300 pairwise comparisons, 80 non-significantcorrelation coefficients were found for PM10; 11 of the80 coefficients relate to one of the Bulgarian areas, the
other 69 to Romanian study areas. For PM2.5, 247correlation coefficients were statistically significant; 6non-significant coefficients involved one of the Bulgarian
areas, the remaining 47 related to Romanian study
Table 5
Difference in mean concentrations of PM10, PM2.5 and PM10�2.5 between the heating and non-heating season (in mg m�3)
Study area PM10 PM2.5 PM10�2.5
Non-heating Heating Difference Non-heating Heating Difference Non-heating Heating Difference
Bulgaria
All study areas 54 92 38a 29 61 32a 24 27 3
Sofia suburb 45 78 33a 28 57 29a 17 21 4
Sofia centre 80 113 33 37 62 25a 42 33 �9a
Assenovgrad 44 98 54a 25 72 47a 19 24 5
Vratza 49 85 36a 27 53 26a 21 31 10
Czech Republic
All study areas 54 94 40a 33 70 37a 20 23 3
Ostrava centre 61 119 58a 37 82 45a 23 35 12
Ostrava – Vitkovice 57 86 29a 34 64 30a 23 20 �3
Ostrava – Poruba 46 79 33a 32 63 29a 13 19 6
Ostrava – Radvanice 52 93 41a 30 73 37a 21 20 �1
Hungary
All study areas 47 74 27a 28 54 26a 21 19 �2
Dorog 50 84 34a 30 57 27a 25 24 �1
Tata 43 72 29a 26 54 28a 17 13 �4a
Cegled 55 69 14 29 51 22a 27 17 �10
Tatabanya 44 76 32a 30 55 25a 14 21 7
Eger 45 69 24a 23 51 28a 21 22 �1
Poland
All study areas 51 96 45a 34 75 41a 17 18 1
Swietochlowice 61 104 43a 39 74 35a 22 23 1
Kedzierzyn Kozle 45 87 42a 34 72 38a 12 15 3
Pszczyna 46 123 77a 32 102 70a 14 22 8a
Kielce 51 69 18a 30 55 25a 21 14 �7
Romania
All study areas 64 81 17a 34 57 23a 31 24 �7a
Baia Mare 35 70 35a 21 58 37a 16 20 4
Bucharest 73 78 5 35 57 23a 38 22 �16a
Ploiesti 67 80 13 40 50 10 27 29 2
Tirgu Mures 68 105 37a 35 67 32a 36 37 1
Slovak Republic
All study areas 40 58 18a 25 44 19a 16 13 �3a
Bansk!a Bystrica centre 37 59 22a 25 46 21a 14 12 �2
Bansk!a Bystrica suburb 35 47 12 22 36 14a 13 11 �2
Zilina 47 67 20a 26 50 24a 21 16 �5
Bratislava 41 57 16a 26 46 20a 16 11 �5a
a Difference is statistically significant (p40:05, two-sided).
D. Houthuijs et al. / Atmospheric Environment 35 (2001) 2757–27712766

areas. Given the substantial number of non-significant
correlation coefficients for Romania which clearlydeviate from the picture that arises from the othercountries, we excluded the Romanian data from the
statistical analyses of the associations between studyareas. The median correlation coefficient for PM10 of theremaining 210 pairwise comparisons was 0.57, with a
range of �0.04–0.92. The median of the correlation
coefficients between study areas within the same countrywas 0.76; the median of the correlation coefficient forPM10 between study areas from different countries was
0.54. For PM2.5, the median of all correlation coeffi-cients was 0.57, with a range of 0.17–0.89. The mediancorrelation coefficient for study areas within the same
Fig. 3. Mean ratio of PM10 concentration at spatial and main sampling sites in the study areas and its 95% confidence interval. The
numbers on the x-axis refer to the numbering of the study areas in Table 1. Only study areas with at least four observations are
presented.
Table 6
Between area and within area effects for PM10, PM2.5 and PM10�2.5 with associated degrees of freedom, coefficients of variation (CV)
and ratio’s between CVs
Country Effect PM10 PM2.5 PM10�2.5
N DF CV (%) Ratio N DF CV (%) Ratio N DF CV (%) Ratio
All Between area 371 20 110 4.5a 382 20 110 4.2a 335 20 200 3.2a
Between dates 56 170 7.0a 57 210 7.5a 55 210 3.3a
Residual (within area) 233 24 228 28 197 63
Czech Republic Between area 92 3 27 1.3 92 3 55 2.4a 87 3 70 1.4
Between dates 34 110 5.6a 34 130 5.8a 33 150 3.1a
Residual (within area) 46 20 46 23 43 49
Hungary Between area 79 4 32 1.3 85 4 72 2.6a 65 4 61 1.0
Between dates 27 98 3.8a 30 120 4.3a 24 100 1.7a
Residual (within area) 47 26 50 28 36 61
Poland Between area 42 3 84 2.3a 42 3 77 1.8 41 3 160 2.0
Between dates 10 170 4.7a 10 182 4.2a 10 190 2.4a
Residual (within area) 28 36 28 44 27 79
Romania Between area 51 3 130 4.3a 57 3 97 2.6a 45 3 380 4.1a
Between dates 16 50 1.6a 18 66 1.8a 14 110 1.2
Residual (within area) 31 31 35 37 27 92
Slovak Republic Between area 107 3 43 3.4a 106 3 33 2.6a 97 3 90 1.7
Between dates 32 150 11.4a 33 150 11.7a 29 220 4.2a
Residual (within area) 71 13 69 13 64 51
a Ratio differs statistically significant from 1 (p40:05, F-test).
D. Houthuijs et al. / Atmospheric Environment 35 (2001) 2757–2771 2767

country was 0.74, for study areas from differentcountries 0.54. Pearson correlation coefficients for
PM10�2.5 were consistently lower and ranged from�0.30 to 0.74 with a median of 0.27. Only 46% of thepairwise comparisons of the coarse fraction showed a
significant positive correlation (p40:05). The mediancorrelation coefficient of PM10�2.5 for study areas withinthe same country was 0.41; for study areas from differentcountries the correlation coefficient was 0.26.
4. Discussion
4.1. Quality assurance and quality control
The results of the CESAR study give an overview ofthe first systematic collection of annual mean concentra-tion levels of PM10 and PM2.5 in Central and Eastern
Europe. Stringent quality assurance and quality controlprocedures, interlaboratory comparisons, and qualityaudits ensured comparability of results between coun-tries. The quality audits indicated that satisfactory
laboratory procedures were used and data collectionmethods were generally under control in the CzechRepublic, Hungary, Poland, and the Slovak Republic.
The large percentage of missing data in Romania (50%)limits the generalisation of the obtained results. Thedivergent weighing procedures in Bulgaria probably
result in a systematic difference with the concentrationsobtained in other study areas. It is not possible toquantify the magnitude of this difference, but the results
of the interlaboratory comparison suggest that thedeviation is within 50mg per filter. At a sample volumeof 14 m3 per day, this is a deviation within 3.5 mg m�3. Itis likely that the relative ranking of study areas in
Bulgaria is not affected by this deviation of the protocol.
4.2. Particulate matter concentrations
The particulate matter concentrations found in theCESAR study are consistent with other studies con-
ducted in Central and Eastern Europe. Cyrys et al.(1995) found annual mean PM10 concentrations of66mg m�3 in Erfurt (former East Germany) and
59mg m�3 in Sokolov (former CSSR) in the year 1991.In the winter of 1993–1994 PM10 concentrations weremeasured in several Central European cities during thePEACE study (Hoek et al., 1997). In Poland, mean
wintertime PM10 concentrations of 63 mg m�3 werefound in Katowice and 59mg m�3 in Cracow. In theCzech Republic, PM10 concentrations of 75 and
53mg m�3 were found in Teplice and Prague, while amedian PM10 concentration of 61mg m�3 was found inBudapest, Hungary. These wintertime concentrations
are slightly lower than the results of the CESAR study,where the PM10 concentrations in the heating season
were 96 mg m�3 for Poland, 94 mg m�3 for the CzechRepublic and 74 mg m�3 for Hungary.
Compared to studies conducted elsewhere in Europeand North America particulate matter levels measuredin the CESAR study are relative high. Darlington et al.
(1997) found that annual mean PM10 concentrations at585 sampling sites in the United States dropped from34 mg m�3 in 1988 to 26 mg m�3 in 1995. Similar resultswere found in Canada, with annual median PM10
concentrations ranging from 9mg m�3 at a NationalPark site to 40 mg m�3 in Southeastern Ontario (Pryorand Barthelmie, 1996) and annual mean PM10 and
PM2.5 concentrations on 14 urban sites between 1986and 1994 of 28 and 14mg m�3, respectively (Brook et al.,1997). Results from the PEACE study (Hoek et al.,
1997) indicate a large wintertime concentration rangefor PM10 in Europe, from 13 mg m�3 at three ruralScandinavian sites, 44 mg m�3 in The Netherlands to 92
mg m�3 in Athens, Greece. The concentration levelsfound during the heating season in the CESAR and thePEACE study indicate that mean PM10 concentrationsare generally higher in Central and Eastern Europe than
in Scandinavia and Western Europe.
4.3. Seasonal variation
Source apportionment studies have shown that the
nature of sources of PM2.5 is different from that ofPM10�2.5. In general, the contribution of combustionsources is much larger in the PM2.5 fraction (Chow et al.,
1996; Wei et al., 1999). In our study, the increase inPM10 concentrations during the heating season is mainlydriven by an increase in the PM2.5 concentrations.PM10�2.5 increased in some places but decreased slightly
in others in the heating season. $Sr!am et al. (1996) foundsimilar results in two cities in the Czech Republic in thesummer and winter of 1993. In Teplice, the mean PM2.5
concentrations changed from 122mg m�3 in winter to29 mg m�3 in summer; PM10�2.5 decreased only slightlyfrom 19 to 11mg m�3. The high annual wintertime
concentration was for a large part determined by awinter inversion episode. However, a similar pattern wasfound in the so-called cleaner city of Prachatice where
mean PM2.5 concentrations changed from 44 mg m�3 inwinter to 18mg m�3 in summer and PM10�2.5 decreasedfrom 8 to 6mg m�3. In the Netherlands, data from theNational Air Quality Network show that in the period
1993–1998 the PM10 concentrations are on average5 mg m�3 higher in the winter than in the summer(RIVM, 1998). This is a substantially smaller difference
than observed in the CESAR study. These resultssuggest that local or regional combustion sources andless favourable meteorological conditions play an
important role in wintertime PM10 and PM2.5 concen-trations across Central and Eastern Europe.
D. Houthuijs et al. / Atmospheric Environment 35 (2001) 2757–27712768
4.4. Spatial variation
The results of the spatial variation program showthat, although the within areas coefficients of variation(CV) of PM10 and PM2.5 are substantial, their between
areas CV are more than 4 times greater. Also forPM10�2.5, the ratio of the between and the within areaCV is clearly elevated, despite the large within area CV.These results suggests that concentrations measured at
the main sampling site within a study area sufficientlycharacterise the exposure of the study population toPM10, PM2.5 and PM10�2.5. This is an important
windfall for the epidemiological part of the CESARstudy which aimed at a large exposure contrast betweenand low contrasts within study areas.
The two main limitations of the spatial variationprogram are that in the study areas due to logisticreasons the number of measurements was relative small
and the additional spatial sampling sites were restrictedto two urban background sites only. However, theselected additional sites were locations that could havebeen selected as the primary site for representing
exposure to ambient air pollution in the epidemiologicalstudy as well. Since only urban background sites wereselected, it is not possible to draw any conclusions about
the presence of ‘hotspots’ in the study areas related tonearby sources such as major roads or large industrialsources. Two studies conducted in the Netherlands
indeed suggest that there is spatial variation related tothe proximity of major roads (Janssen et al., 1997;Fischer et al., 2000). It is also possible that if thecomposition of the particles had been assessed, more
variability would have been present.The larger variation within study areas for PM10�2.5
than for PM10 and PM2.5 can partly be explained by the
fact that PM10�2.5 is a derived measure which measure-ment error is relative high since it is affected byuncertainties in both direct PM10 and PM2.5 measure-
ments. White (1998) has shown that collocated PM10�2.5
concentrations correlate poorly, even when the corre-sponding PM2.5 and PM10 concentrations correlate well.
Apart from an increase in measurement error, the highervariability of PM10�2.5 concentrations can be explainedby the nature of the particulate matter in the differentsize fractions. Studies in the United States (Chow et al.,
1994; US Environmental Protection Agency, 1998) haveshown that sources for PM2.5 tend to be regional innature and that fine particles are capable of travelling
long distances. This results in relatively uniformdistributions of PM2.5 concentrations over large areas.PM10�2.5 concentrations tend to be more dependent on
particulate matter emitted by local sources with a shortlifespan in the atmosphere, causing greater variability ona local scale. In a study by Leaderer et al. (1999) 24-h
PM2.5 and PM10 concentrations at a regional site inVinton, VA were significantly correlated with measure-
ments outdoors at residences, located at an averageseparation distance of 96 km. Even the mean values at
the regional site and outside the homes did not differsignificantly. No significant correlations were found forPM10�2.5. Our results support these findings, as sig-
nificant positive Pearson correlation coefficients forPM2.5 and PM10 were found between most study areas.Although the correlation coefficients between studyareas in the same country were in general higher than
the correlation coefficients between study areas fromdifferent countries, the size of the latter coefficientsreflect that PM10 and PM2.5 are large-scale phenomena.
4.5. Imputation of missing data
The multiple imputation technique was used toproperly reflect uncertainty in the data set due tomissing values. The imbalance in the number of missing
values over the heating and the non-heating seasonresulted, with the exception of two Romanian studyareas, in limited adjustments of the annual meanconcentrations. The uncertainty in the data due to
missing values is further reflected in the 95% confidenceintervals of the imputed annual means. The relativeincrease in the variance due to missing data was less than
50%, with the exception of the Romanian study areaswhere the variance increased up to 440% due to thelarge proportion of missing data (50%). If the original
data sets were not imputed at all or imputed only once,the 95% confidence intervals of the annual meanconcentrations would have been underestimated. The
advantage of the multiple imputation technique is that itcan describe quantitatively the uncertainty in the data,including the part introduced by the missing data.
4.6. Possible health consequences of concentration levels
In 1998, new air quality limit values for PM10 were
adopted by the European Union (EU) to protect publichealth; an annual mean limit value of 40 mg m�3 will beeffective by the year 2005. The PM10 concentrations in
all 25 study areas exceeded this future limit value. WHO(2000) does not provide guidelines for short- or long-term average PM10 or PM2.5 concentrations; health
effects are observed at low levels and no guidelines canbe derived from the current data. Instead of a guideline,the WHO provides risk estimates for various healthoutcomes. Assuming that PM10 has similar associations
with health effects as described by WHO (2000), it canbe estimated that based on an average PM10 concentra-tion of 66 mg m�3 in the study areas, on average 4.6% of
the daily mortality is premature death associated withshort-term variation in particulate air pollution. Also5.5% of the daily hospital admissions and 23% of the
daily bronchodilator use is associated with short-termvariation in concentration levels. Results from cohort
D. Houthuijs et al. / Atmospheric Environment 35 (2001) 2757–2771 2769
studies in the United States (Abbey et al., 1998; Dockeryet al., 1993; Pope et al., 1995) suggested that the life
expectancy of people living in areas with high PM levelsis shorter than that of people living in areas with low PMlevels. The ranges for PM10 was 18–47mg m�3 and for
PM2.5 11–30 mg m�3 in the study of Dockery et al.(1993). In the study of Pope et al. (1995) the range forPM2.5 was 9–34 mg m�3. The annual mean levels ofparticulate air pollution observed in the 25 study areas
are above the reported ranges in these cohort studies. Ifthese results are applicable for Central and EasternEurope, this implies that a part of the observed reduced
life expectancy in this region could be attributable toparticulate air pollution.
The results found in this study show that annual mean
particulate matter concentration levels in Central andEastern Europe exceed the limit values of the EU andmay lead to a substantial burden of disease and
premature death. Future member states of the EUshould pay great attention to particulate matterconcentration levels.
Acknowledgements
The Central European Study on Air pollution andRespiratory health (CESAR) was funded by theCommission of the European Communities (CEC):
Directorate General XII, Science Research and Devel-opment in the framework of the Cooperation with ThirdCountries and International Organisations research andtechnological development program (contract no. IC15-
CT98-0320), and Directorate General I, ExternalEconomic Relations, in the framework of the financialand technical assistance provided to Central and Eastern
Europe (CEE) under the Phare Multi-Country Environ-ment program (contract no. 94-0472). The authorswould like to thank Caroline Ameling, Nico Nagel-
kerke, Sam Pattenden, and Ben Armstrong for theirstatistical advice; Ronald Hoogerbrugge, Hans vanDalen, Jan Waldus, and Cock Oosterman for their
contributions to the Quality Assurance/Quality Controlprogram; Albena Izidorova, Zvetanka Koleva, ArdemBabikian, Libor Janca, Vera Vydrarova, JaroslavaHenkova, Zdena Dluhosova, Karla Vanova, Milada
Plucnarova, Zuzana Tunysova, Erzsebet Gyorgyos,Laszlo Jerszi, Miklos Vondra and Marieke Oldenweningfor their participation in the field and laboratory
activities.
References
Abbey, D.E., Burchette, R.J., Knutsen, S.F., McDonnell, W.F.,
Lebowitz, M.D., Enright, P.L., 1998. Long-term particulate
and other air pollutants and lung function in nonsmokers.
American Journal of Respiratory Critical Care Medicine 158,
289–298.
Braun-Fahrl.ander, C., Vuille, J.C., Sennhauser, F.H.,
Neu, U., K .unzle, T., Grize, L., Gassner, M., Minder, C.,
Schindler, C., Varonier, H.S., W .uthrich, B., and the
SCARPOL Team, 1997. Respiratory health and long-term
exposure to air pollutants in Swiss schoolchildren. American
Journal of Respiratory and Critical Care Medicine 155,
1042–1049.
Brook, J.R., Dann, T.F., Burnett, R.T., 1997. The relationship
among TSP, PM10, PM2.5, and inorganic constituents of
atmospheric particulate matter at multiple Canadian loca-
tions. Journal of the Air & Waste Management Association
47, 2–19.
Chow, J., 1995. Measurement methods to determine compli-
ance with ambient air quality standards for suspended
particles. Journal of Air Waste Management Association
45, 320–382.
Chow, J.C., Watson, J.G., Fujita, E.M., Zhiqiang, L., Lawson,
D.R., Ashbaugh, L.L., 1994. Temporal and spatial varia-
tions of PM2.5 and PM10 aerosol in the Southern California
air quality study. Atmospheric Environment 28 (12),
2061–2080.
Chow, J.C., Watson, J.G., Lu, Z., Lowenthal, D.H., Frazier,
C.A., Solomon, P.A., Thuillier, R.H., Magliano, K., 1996.
Descriptive analysis of PM2.5 and PM10 at regionally
representative locations during SJVAQS/AUSPEX. Atmo-
spheric Environment 30, 2079–2112.
Cyrys, J., Gutschmidt, K., Brauer, M., Dumyahn, T., Heinrich,
J., Spengler, J.D., Wichmann, H.E., 1995. Determination of
acidic sulfate aerosols in urban atmospheres in Erfurt
(F.R.G.) and Sokolov (former C.S.S.R.). Atmospheric
Environment 29 (23), 3545–3557.
Darlington, T.L., Kahlbaum, D.F., Heuss, J.M., Wolff, G.T.,
1997. Analysis of PM10 trends in the United States from 1988
through 1995. Journal of the Air & Waste Management
Association 47, 1070–1078.
Dockery, D.W., Cunningham, J., Damokosh, A.I., Neas, L.M.,
Spengler, J.D., Koutrakis, P., Ware, J.H., Raizenne, M.,
Speizer, F.E., 1996. Health effects of acid aerosols on North
American children: respiratory symptoms. Environmental
Health Perspectives 104, 500–505.
Dockery, D.W., Pope, C.A.III., Xu, X., Spengler, J.D., Ware,
J.H., Fay, M.E., Ferris Jr., B.G., Speizer, F.E., 1993. An
association between air pollution and mortality in six U.S.
cities. New England Journal of Medicine 329, 1753–1759.
Dockery, D.W., Pope III, C.A., 1994. Acute respiratory effects
of particulate air pollution. Annual Review of Public Health
15, 107–132.
Dutch Council for accreditation, 1996. Criteria for laboratories,
Document number SC00. Radboudkwartier 223, 3511 CJ
Utrecht, Netherlands.
EN45001, 1989. General Criteria for the Operation of Testing
Laboratories, 1st Edition. European Committee for Stan-
dardization (CEN), Brussels.
EPA, 1987. Reference method for the determination of
particulate matter as PM10 in the atmosphere. Federal
register, Vol. 52, no. 126, July 1.
Fischer, P.H., Hoek, G., Reeuwijk, H.van, Briggs, D.J., Lebret,
E., Wijnen, J.H.van, Kingham, S., Elliott, P.E., 2000. Traffic-
related differences in outdoor and indoor concentrations of
D. Houthuijs et al. / Atmospheric Environment 35 (2001) 2757–27712770
particles and volatile organic compounds in Amsterdam.
Atmospheric Environment 34, 3713–3722.
Hoek, G., Brunekreef, B., 1993. Acute effects of a winter air
pollution episode on pulmonary function and respiratory
disease of children. Archives of Environmental Health 48,
328–335.
Hoek, G., Forsberg, B., Borowska, M., Hlawiczka, S., Vask .ovi,
E., Welinder, H., Branis, M., Benes, I., Kotesovec, F., Otto
Hagen, L., Cyrys, J., Jantunen, M., Roemer, W., Brunekreef,
B., 1997. Wintertime PM10 and black smoke concentrations
across Europe: results from the PEACE study. Atmospheric
Environment 31 (21), 3609–3622.
ISO/IEC Guide 25, 1990. General Requirements for the
Competence of Calibration and Testing Laboratories, 3rd
Edition. International Organization for Standardization
(ISO), Geneva
Janssen, N.A.H., Mansom, D.F.M. van, Jagt, K. van der,
Harssema, H., Hoek, G., 1997. Mass concentrations and
elemental composition of airborne particulate matter at street
and background locations. Atmospheric Environment 31(8),
1185–1193.
Katsouyanni, K., Zmirou, D., Spix, C., Sunyer, J., Schouten,
J.P., P .onk.a, A., Anderson, H.R., Le Moullec, Y., Wojtyniak,
B., Vigotti, M.A., Bacharova, L., 1995. Short-term effects of
air pollution on health: a European approach using
epidemiological time-series data. European Respiratory
Journal 8, 1030–1038.
Leaderer, B.P., Naeher, L., Jankun, T., Balenger, K., Holford,
T.R., Toth, C., Sullivan, J., Wolfson, J.M., Koutrakis, P.,
1999. Indoor, outdoor, and regional summer and winter
concentrations of PM10, PM2.5, SO42�, H+, NH4
+, NO3�,
NH3, and nitrous acid in homes with and without kerosene
space heaters. Environmental Health Perspectives 107,
223–231.
Marple, V.A., Rubow, K.L., Turner, W., Spengler, J.D., 1987.
Low flow rate sharp cut impactors for indoor air sampling:
design and calibration. Journal of Air Pollution Control
Association 37, 1303–1307.
Ostro, B.D., Hurley, S., Lipsett, M.J., 1999. Air pollution and
daily mortality in the Coachella Valley, California: a study of
PM10 dominated by coarse particles. Environmental Re-
search 81, 231–238.
Pope, C.A.III., Thun, M.J., Namboodiri, M.M., et al., 1995.
Particulate air pollution as a predictor of mortality in a
prospective study of U.S. adults. American Journal of
Respiratory and Critical Care Medicine 151, 669–674.
Pryor, S.C., Barthelmie, R.J., 1996. PM10 in Canada. The
Science of the Total Environment 177, 57–71.
RIVM, 1998. Annual Survey Air Quality 1998. Report.
National Institute of Public Health and the Environment
(RIVM). Bilhoven, Netherlands (in Dutch).
Rubin, D.B., 1987. Multiple Imputation for Nonresponse in
Surveys. J. Wiley & Sons, New York.
Schafer, J.L. (1999) NORM: multiple imputation of incomplete
multivariate data under a normal model, version 2. Software
for Windows 95/98/NT, available from http://www.stat.p-
su.edu/�jls/misoftwa.html.$Sr!am, R.J., Bene$s, I., Binkov!a, B., Dejmek, J., Horstman, D.,
Kot$e$sovec, F., Otto, D., Perreault, S.D., Rube$s, J., Selevan,
S.G., Skal!ık, I., Stevens, R.K., Lewtas, J., 1996. Teplice
Program}the impact of air pollution on human
health. Environmental Health Perspectives 104 (Suppl. 4),
699–714.
StataCorp, 1999. Stata Statistical software: Release 6.0. Stata
Corporation, College Station, TX.
US Environmental Protection Agency, 1998. National air
quality and emissions trend report, 1997. Office of Air
Quality Planning and Standards, Research Triangle Park,
NC, report no. EPA 454/R-98-016.
Wei, F., Teng, E., Wu, G., Hu, W., Wilson, W.E., Chapman,
R.S., Pau, J.C., Zhang, J., 1999. Ambient concentrations
and elemental compositions of PM10 and PM2.5 in four
Chinese cities. Environmental Science & Technology 33,
4188–4193.
WHO, 2000. The 1999 WHO air quality guidelines. Geneva,
World Health Organisation.
White, W.H., 1998. Statistical considerations in the interpreta-
tion of size-resolved particulate mass data. Journal of the Air
& Waste Management Association 48, 454–458.
Wilson, W.E., Suh, H.H., 1997. Fine particles and coarse
particles: concentration relationships relevant to epidemiolo-
gical studies. Journal of the Air and Waste Management
Association 47, 1238–1249.
D. Houthuijs et al. / Atmospheric Environment 35 (2001) 2757–2771 2771
Copyright © 2022 FDOKUMEN