Petroleum Hydrocarbon Concentrations in the Surface ...
19
Page 1/19 Petroleum Hydrocarbon Concentrations in the Surface Sediments of Two Major Sea Ports, Bay of Bengal, India Sundaramanickam Arumugam ( [email protected] ) Annamalai University https://orcid.org/0000-0002-2682-445X Kumar Balachandar Annamalai University Kumaresan Saravanan Annamalai University Faculty of Marine Sciences Gopalsamy Idayachandiran Annamalai University Ajith Nithin Annamalai University Faculty of Marine Sciences Research Article Keywords: Total Petroleum Hydrocarbon, Total Organic Carbon, Ennore, Tuticorin, Creek Posted Date: February 15th, 2021 DOI: https://doi.org/10.21203/rs.3.rs-191714/v1 License: This work is licensed under a Creative Commons Attribution 4.0 International License. Read Full License
-
Upload
khangminh22 -
Category
Documents
-
view
10 -
download
0
Transcript of Petroleum Hydrocarbon Concentrations in the Surface ...

Page 1/19
Petroleum Hydrocarbon Concentrations in theSurface Sediments of Two Major Sea Ports, Bay ofBengal, IndiaSundaramanickam Arumugam ( �[email protected] )
Annamalai University https://orcid.org/0000-0002-2682-445XKumar Balachandar
Annamalai UniversityKumaresan Saravanan
Annamalai University Faculty of Marine SciencesGopalsamy Idayachandiran
Annamalai UniversityAjith Nithin
Annamalai University Faculty of Marine Sciences
Research Article
Keywords: Total Petroleum Hydrocarbon, Total Organic Carbon, Ennore, Tuticorin, Creek
Posted Date: February 15th, 2021
DOI: https://doi.org/10.21203/rs.3.rs-191714/v1
License: This work is licensed under a Creative Commons Attribution 4.0 International License. Read Full License

Page 2/19
AbstractThis investigation was made to assess the seasonal accumulation pattern of total petroleumhydrocarbon (TPH) in sediments along the two major ports such as Ennore and Tuticorin, located inSoutheast coast of India. The level of TPH was found to vary from 2.05µg g− 1to 17.47 µg g− 1. Toestablish the relationship among the TPH with total organic carbon (TOC) and sediment components, thetechniques of correlation analysis and principal component analysis (PCA) were used. The higheraccumulation of TPH during monsoon season indicates that all wastes discharged on land was washedand got deposited on the Ennore coast. The signi�cant positive correlation with TOC was noticed and theevidences indicated that the sedimentary organic carbon is acting as a strong binding agent for TPH.
1. IntroductionThe comprehensive use of petroleum and its byproducts as a source of energy its widespread distributionin the biosphere has become a matter of serious environmental concern in the entire world ( Barakat et al.,2011, Hassan et al., 2018). The Total Petroleum Hydrocarbon (TPH) gets released into the environmentthrough domestic and industrial wastewaters, ship accidents, spills or leaks and other petroleum by-products get emitted from commercial or domestic uses (Mohebbi-Nozar et al., 2015; Yuan et al., 2014).
The marine environment, particularly the coastal and estuarine regions are ecologically sensitive areaswith diverse morphology and unique hydrodynamic conditions. These vulnerable and ecologicallysensitive areas are often chosen for the establishment of major petroleum based industries for easytransportation and disposal that contributes to signi�cant pollution (NRC, 2003). The near shore areasare subjected to excessive contaminations not only by the anthropogenic inputs but also by the seabased activities (transportation, oil exploration and production etc). Shipping has a signi�cantcontribution of TPH by transporting these compounds in the marine environment (Massoud et al., 1996).
Crude oil consists of 17,000 organic compounds approximately and each of these compounds has theirown volatility (Marshall and Rodgers, 2004). They are collectively known as Total PetroleumHydrocarbons (TPH). The petroleum hydrocarbons contamination in marine and coastal sediments isextensive and the environmental consequences on these ecosystems turn out to be very serious. Theavailable TPH in the water and atmosphere tends to accumulate in the sediment by deposition andadsorption which later becomes stable. The tendency of retaining TPH by sediment affects in two ways;on one side it gives stability and on other side it acts as a prime source of environmental contamination(Mirsadeghi et al., 2011). Therefore, marine sediment can be considered as not only a reservoir of wastesand deposits but it also decides about the extent of marine pollutants (Wang et al., 2017).
The coastline of India is 8129 km, out of which 6,000 km is rich in estuaries, creeks, brackish waters,lagoons and lakes etc. The southeast coast of India is considered as an important stretch of coastlinewith many signi�cant attractive features. Here many major rivers drain into the Bay of Bengal and thesecoasts are wealthier in marine fauna as compared to other western coasts of India (Ananthan et al.,

Page 3/19
2005). The Ennore and Tuticorin are categorized under top 13 major ports in India. In recent years thesecoastal areas have observed many developments, which have affected both regions drastically.
Signi�cant increase of anthropogenic activities due to urbanization and industrialization disturb anddegrade the natural surroundings of the coastal environment. Environmental monitoring program needsto be continued in order to protect the marine environment, especially coastal regions, from continuouspollution of coastal resources. Therefore, monitoring the magnitude of the pollution in these vulnerableareas becomes more signi�cant to establish e�cient planning for controlling and combating coastalpollution. Hence, this study is focused to investigate the seasonal variations of Total PetroleumHydrocarbons in sediments of the selected major harbor regions, Ennore and Tuticorin of Tamil Nadustate situated on the Southeast coast of India.
2. Methodology
2.1 Study area descriptionEnnore and Tuticorin coasts are heavily industrialized which receive considerable quantity of industrialpollutants and domestic sewage that gets eventually drained into the Bay of Bengal. Both regions areencompassed with similar types of industries such as thermal power plants, oil re�neries, petro-chemicalindustries, etc. The periodic dredging activities in these regions for the natural resources likepetrochemicals result in changes in the landscape, sediment transport and add dust to the coastalenvironment. Different sampling locations were selected in each study area and the details of thesampling stations are
I, Ennore:
Ennore creek - (ENN I and II stations which are located at a distance of 0.5 Km and 2 Km from the shoretowards creek). Ennore Shore (ENN III- Ennore creek mouth) and Ennore coast (ENN IV, V and VI stationsthat are located at 1, 5 and 10 km distance from the shore line to off shore).
II, Tuticorin:
Korampallam channel - (TUT I and TUT II stations are located at 0.5 and 2 km distance from the shoretowards channel), Tuticorin shore (TUT III- Channel mouth) and Tuticorin coast (TUT IV, V and VI stationsare located at 1, 5 and 10 Km distance from the shore line to off shore) as shown in the Fig. 1.
The sediment samples were collected during the year 2013–2014 covering the four main seasons that issummer, pre-monsoon, monsoon and post-monsoon. The sediment was collected using Peterson grabwith an area of 0.1 m2. The collected sediment samples were preserved in pre-cleaned polythene bagskept in insulated ice box and brought to the laboratory for further analysis.

Page 4/19
About 100 gm. of air dried sediment was sieved by mechanical shaker (Buchanan, 1984) to investigatethe composition of sediment. The sand fraction was determined by the amount of sediment retained bysieve of 0.125mm pore size. The remaining portion which passed through the sieve of pore size 0.125mm but retained by sieve of pore size 0.063mm was taken as silt and the fraction which passed throughthe sieve of pore size 0.063mm wastaken as clay.
The Total Organic Carbon (TOC) was estimated in surface sediment (upper 2cm), collected from the grabby following the method of ammonium ferrous sulfate titration (Walkley–Black method), modi�ed bySchumacher (2002).
The sediment sample was saponi�ed using KOH-methyl alcohol mixture. About 10 gram of sample wassubjected for soxhlet extraction with n-hexane. Further, the extract was mixed with a required amount ofanhydrous sodium sulphate and shaken well so as to remove moisture. The obtained extract wasconcentrated by rotary evaporator at 30°C and subsequently by a gentle stream of nitrogen gas to bringto the volume of 1 ml. The TPH was measured using UV-Spectro�uorometer (Cary Eclipse �uorescencespectrophotometer) at 360 nm emission after excitation at 310 nm (IOC-UNESCO, 1984). All theexperiments were conducted in triplicate so that the average values are obtained in order to have moreaccuracy in the results. Further, the data was also subjected to statistical analysis such as correlationcoe�cient and Principal Component analysis (PCA) using the statistical software SPSS ver. 16.0 andPAST 2.07.
3. Results And DiscussionThe results of the percentage compositions of sand, silt and clay of the selected sediment samples fromEnnore and Tuticorin coasts are given in Fig. 2.The percentage of sand fraction at Ennore coast wasfound to have varied from 12.79 to 85.16% with a mean value of 36.28% ± 8.68%. The maximumpercentage of sand (85.16%) was noticed at Ennore creek mouth (ENN-III) during the post monsoonseason. The minimum of 12.79% was measured during the pre-monsoon season in the Ennore creekregion (ENN-I). The percentage of silt fraction was found to have varied from 10.57 to 59.47%with amean value of 39.98% ± 4.96%.The higher percentage of silt (59.47%) was noticed in sample from Ennorecreek (ENN-II) during the monsoon season. The lower percentage of silt (10.57%) was observed during thepost monsoon season in the sample from Ennore creek mouth (ENN-III) and the percentageof clayfraction was found to have varied from 2.27 to 52.62% with a mean value of 23.74% ± 4.42%. Themaximum percentage of clay fraction (52.62%) was observed during the monsoon season in the Ennorecreek sample (ENN-I) and the lower percentage of 2.27% was observed during the summer season in theEnnore creek mouth sample (ENN-III). In Tuticorin samples,the sand fraction was found to have variedfrom 13.42 to 84.16% with a mean value of 42.20% ± 2.65%. The maximum percentage of sand (84.16%)was noticed at Tuticorin channel mouth (TUT-III) during the summer season whereas minimum of 13.42%was measured during the post monsoon season in the Korampallam channel (TUT-I). The percentage ofsilt fraction was found to have varied from 12.07 to 46.14% with a mean value of 32.90% ± 1.55%. Thehigher percentage of silt (46.14%) was noticed during the monsoon season in the Korampallam channel

Page 5/19
(TUT-I) whereas lower percentage (12.07%) was observed during the post monsoon season in theTuticorin mouth region (TUT-III). The percentage of clay fraction was found to have varied from 3.57 to45.63% with a mean value of 24.89% ± 1.50%.The higher percentage of clay (45.63%) was observedduring the monsoon season (TUT-VI) whereas lower percentage (3.57%) was observed during the summerseason in the sample from Tuticorin channel mouth (TUT-III).
In general, the average percentage of silt fraction was calculated and found higher when compared withother fractions and it further indicates that the Ennore creek and Tuticorin channel receive higherfractions of silt because of the continuous disposal of sewage into these water ways. When consideringthe seasonal �uctuation, higher percentage of sand fractions was observed during the monsoon seasonwhich led to heavy �ooding in the rivers which further erodes the land and makes in�ux of sandconsiderably higher, as reported by Veerasingam et al., (2010) and Almeida et al., (2018).
There were reports on sediment compositions available previously in the studied coastal region underpresent study by Joydas and Damodaran (2009) and Yuan et al., (2017). Particularly, in the continentalshelf region of southeast coast of India and west coast of India, respectively. The results of present studyhave good agreement with before mentioned studies as the sediment composition dominated with higherpercentage of sand followed by silt and clay during the monsoon season.
The seasonal and spatial variations in the levels of TOC are presented in Table 1. The total organiccarbon was found to have varied from 1.55 to 12.58mgC g− 1 with a mean value of 5.38 ± 0.51mgC g− 1,in the samples from Ennore region. The highest TOC was observed (12.58 mgC g− 1) during the postmonsoon season in 2014 in sample from station ENN-I of Ennore creek. The lower value of TOC (1.55mgC g− 1) was found during the summer season in 2013 in sample from station ENN-III of Ennore coast.In the samples from Tuticorin region, the TOC was found to have ranged from 1.49 to 7.13mgC g− 1with amean value of 4.04 ± 0.27mgC g− 1. The higher value of TOC (7.13 mg g− 1) was observed during the postmonsoon season in 2014 in sample from station TUT-I whereas, the lower value of TOC (1.49 mg g− 1)was found during the summer season in 2013 in sample from station TUT-III. This clearly shows that theTOC level is high in Ennore study area when compared to Tutcorin study area. The increased value ofTOC in monsoon season might be due to the higher sedimentation process which is taking place in everymonsoon season in addition to the continuous discharge of sewage and industrial wastes into theEnnore creek (ENN-I). Total organic carbon (TOC) and clay shows similar patterns of distribution in bothstudy areas and a positive correlation (r = 0.894, p = 0.01 and r = 0.925, p = 0.01) is found which ispresented in Table 2.

Page 6/19
Table 1Spatial and seasonal Variation of TOC from Ennore and Tuticorin
harbour sediments.
SUM '13 PRM'13 MON'13 POM'14
ENN-I 10.24 ± 0.07 10.85 ± 0.06 12.47 ± 0.04 12.58 ± 0.13
ENN-II 5.61 ± 0.05 5.85 ± 0.03 6.42 ± 0.10 6.35 ± 0.06
ENN-III 1.55 ± 0.08 1.66 ± 0.02 2.04 ± 0.03 2.43 ± 0.06
ENN-IV 2.11 ± 0.07 2.39 ± 0.03 2.64 ± 0.05 2.20 ± 0.07
ENN-V 4.14 ± 0.06 4.26 ± 0.07 5.32 ± 0.15 5.05 ± 0.13
ENN-VI 5.25 ± 0.10 5.69 ± 0.03 6.07 ± 0.20 6.36 ± 0.08
TUT-I 6.23 ± 0.09 6.63 ± 0.05 6.99 ± 0.17 7.13 ± 0.04
TUT-II 4.13 ± 0.24 4.73 ± 0.13 5.19 ± 0.19 5.45 ± 0.25
TUT-III 1.49 ± 0.02 1.56 ± 0.05 2.12 ± 0.20 1.72 ± 0.06
TUT-IV 2.16 ± 0.026 2.72 ± 0.04 2.89 ± 0.04 1.70 ± 0.13
TUT-V 3.28 ± 0.07 3.50 ± 0.08 3.98 ± 0.24 4.27 ± 0.23
TUT-VI 5.00 ± 0.45 4.78 ± 0.08 5.60 ± 0.23 5.11 ± 0.04

Page 7/19
Table 2
Spatial and seasonal variation of TPH from Ennore and Tuticorinharbour sediments.
SUM '13 PRM'13 MON'13 POM'14
ENN-I 14.68 ± 0.35 13.82 ± 0.09 15.70 ± 0.21 17.47 ± 0.06
ENN-II 8.48 ± 0.05 7.30 ± 0.12 9.40 ± 0.06 10.51 ± 0.20
ENN-III 3.45 ± 0.03 3.25 ± 0.07 3.74 ± 0.13 4.18 ± 0.10
ENN-IV 10.49 ± 0.05 9.75 ± 0.09 12.62 ± 0.11 14.28 ± 0.12
ENN-V 9.67 ± 0.08 8.68 ± 0.19 9.45 ± 0.20 10.34 ± 0.14
ENN-VI 8.41 ± 0.12 8.38 ± 0.22 8.69 ± 0.09 9.25 ± 0.11
TUT-I 9.48 ± 0.11 9.68 ± 0.16 9.73 ± 0.19 10.16 ± 0.14
TUT-II 7.20 ± 0.013 6.39 ± 0.20 7.00 ± 0.16 7.34 ± 0.05
TUT-III 2.20 ± 0.13 2.05 ± 0.09 2.18 ± 0.15 2.43 ± 0.23
TUT-IV 4.75 ± 0.21 4.20 ± 0.14 4.89 ± 0.32 5.57 ± 0.27
TUT-V 6.35 ± 0.16 6.75 ± 0.32 6.18 ± 0.10 7.32 ± 0.14
TUT-VI 7.82 ± 0.14 7.65 ± 0.18 8.47 ± 12 8.09 ± 0.03
The results also indicate that the gradual deposition of organic matter observed in present study is maybecome less signi�cant in course of time, and it might be due to lesser deposition of clay from the riverand sewage which in turn does not support to retain TOC. In contrast to the present study, the study madeby Hong-Gung Ni et al., (2008) reported high amount of TOC in their study area in spite of having highamount of sand portion. Considering the average values of TOC in the two study areas under our presentstudy, Ennore creek and its coastal areas were found to have higher average values of TOC as comparedto Tuticorin study area. This might be due to the higher deposition of the sewage and industrial wastes inthe Ennore creek area as compared to Tuticorin. The signi�cant relationship between TOC and clay wasreported by Kim et al., (2017) Yan et al., (2019) showed a linear positive relationship between TOC andclay,similar to the results observed in the present study. Recent studies by Hassan et al., (2018)established that this relationship is signi�cant. Generally, �ne fractions prevent the diffusion of oxygeninto sediments, thus allowing for the conservation of organic matter, which in turn helps the enhancementof total organic carbon (TOC) concentrations in the sediments.
The observed values of TPH in both study areas are presented in Table 2.The total petroleumhydrocarban at Ennore region was found to have varied from 3.25 to 17.47 µg g− 1with a mean level of9.63 ± 1.05µg g− 1. The higher level of TPH was observed (17.47 µg g− 1) during the post monsoonseason, 2014 from samples of station ENN-I of Ennore creek whereas, the lower value of TPH (13.25 µg

Page 8/19
g− 1) was found during the pre-monsoon season, 2013 from samples of Ennore channel mouth (ENN-III).The total petroleum hydrocarban (TPH) at Tuticorin was found to have ranged from 2.05to 10.16 µg g−
1with a mean value of 6.41 ± 0.25µg g− 1.The maximum level of TPH was observed (10.16 µg g− 1) duringthe post-monsoon season, 2014 in samples from station TUT-I while the minimum level of TPH (2.05 µgg− 1) was found during the pre-monsoon season, 2013 in samples from Tuticorin channel mouth (TUT-III).
The higher TPH load recorded in Ennore creek region (ENN-I) might be due to the frequent dischargesfrom nearby petro chemical industries. In the present study, the maximum concentration of TPH wasobserved during the monsoon season, which clearly indicates that the �ood during the northeastmonsoonal rainfall transports the higher quantity of TPH to these coastal areas. Similar to the presentstudy Venkatachalapathy et al., (2015), reported higher values of TPH concentration in sediments (1.88–39.76 ppm) from Chennai coast, Southeast coast of India. The TPH concentrations showed extensive�uctuations because of the differential rate of input through river transport in different seasons.Therefore, a distinct seasonal variation could be observed in the levels of TPH in samples from differentstudy areas. The reason for petroleum hydrocarbon values recorded to be lower in ENN-III (Ennore creekmouth) & TUT-III (Tuticorin channel mouth), might be attributed to high proportion of sand which has lesse�ciency in binding the TPH whereas higher levelsof TPH in the Ennore creek and Tuticorin channel(ENN-I & TUT-I) could be noticed due to high proportions of silt and clay.
Similarly, Veerasingam et al., (2010); Muthukumar et al., (2013) reported 4.23ppm of TPH at Narimanamand 1.48 ppm of TPH at Nagapatinnam coasts of Tamil Nadu. Sediments containing �ne particles arealways found to be good accumulators of organic pollutants presumably because of their greater a�nitytowards pollutants like TPH (Law and Klungsoyr, 2000). The �ne sediment fractions like clay which aredispersed in the water column have high absorbing characters and they effectively scavenge the tracecontaminants that enter the aquatic ecosystem (Wang et al., 2014).
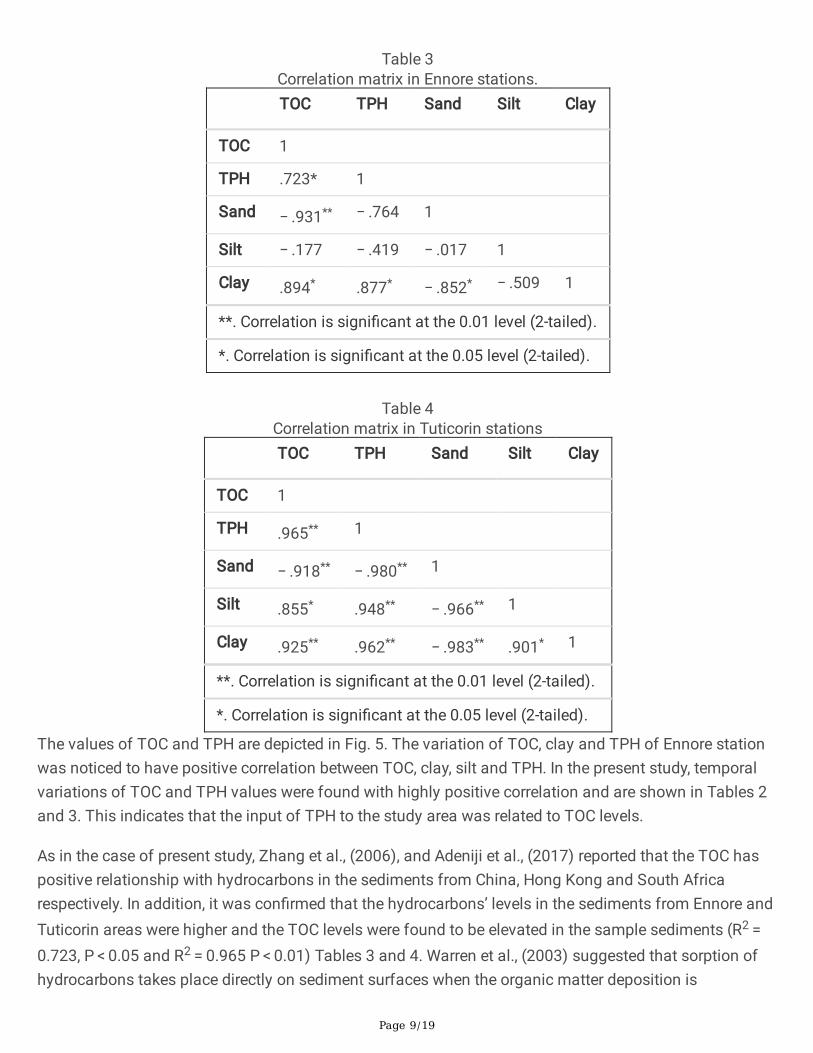
Pearson's correlation coe�cient was applied for both the study areas to understand the relationshipsamong TPH, TOC and soil characteristic sand the results are presented in Tables 3 and 4. A positivecorrelation was found between TPH and soil fractions such as clay and silt but the sand showed negativecorrelation.The signi�cant correlations between TPH with TOC, clay and silt suggest that the TPH isstrongly bound with TOC in clay and silt enriched sediments.
Page 9/19
Table 3Correlation matrix in Ennore stations.
TOC TPH Sand Silt Clay
TOC 1
TPH .723* 1
Sand − .931** − .764 1
Silt − .177 − .419 − .017 1
Clay .894* .877* − .852* − .509 1
**. Correlation is signi�cant at the 0.01 level (2-tailed).
*. Correlation is signi�cant at the 0.05 level (2-tailed).
Table 4
Correlation matrix in Tuticorin stations
TOC TPH Sand Silt Clay
TOC 1
TPH .965** 1
Sand − .918** − .980** 1
Silt .855* .948** − .966** 1
Clay .925** .962** − .983** .901* 1
**. Correlation is signi�cant at the 0.01 level (2-tailed).
*. Correlation is signi�cant at the 0.05 level (2-tailed).
The values of TOC and TPH are depicted in Fig. 5. The variation of TOC, clay and TPH of Ennore stationwas noticed to have positive correlation between TOC, clay, silt and TPH. In the present study, temporalvariations of TOC and TPH values were found with highly positive correlation and are shown in Tables 2and 3. This indicates that the input of TPH to the study area was related to TOC levels.
As in the case of present study, Zhang et al., (2006), and Adeniji et al., (2017) reported that the TOC haspositive relationship with hydrocarbons in the sediments from China, Hong Kong and South Africarespectively. In addition, it was con�rmed that the hydrocarbons’ levels in the sediments from Ennore andTuticorin areas were higher and the TOC levels were found to be elevated in the sample sediments (R2 = 0.723, P < 0.05 and R2 = 0.965 P < 0.01) Tables 3 and 4. Warren et al., (2003) suggested that sorption ofhydrocarbons takes place directly on sediment surfaces when the organic matter deposition is

Page 10/19
signi�cant. The studies by different researchers (Ruiz-Fernández et al., 2012; Vagge et al., 2018) alsosupport the fact that the silt and clay have signi�cant a�nity to TOC and hydrocarbons. Theaccumulation of hydrocarbons is mainly in�uenced by the factors such as the type of hydrocarbons andits sources (pyrolytic and / or petrogenic) and most signi�cantly the type of sediment (rated by thepresence of organic matter) which receives the TPH (Wang et al., 2014). The high presence of sandfractions in the sediment samples (60–99%) would have no impact on PAHs retention in the sediments.There were con�icting reports (Le Boeuf and Weber, 1997) which proposed that organic particles insediments containing majority of clay and silt fractions are more likely to be despoiled than those ofthicker grained sediments like sand, which is considered to be the most effective factor that in�uencesthe sorption characteristics of hydrocarbons.
The level of petroleum hydrocarbon concentrations in the present study are comparable with thosereported from coastal and estuarine regions of various countries, Arabian sea along the Indian coast(Sengupta et al., 1993), Shetland Island, UK (Kingston et al., 1995), Straits of Johor (Abdullah et al.,1996),Arabian Gulf reports (Al-Lihaibi and Ghazi 1997), UAE coast research (Shriadah 1998), Bassein-Mumbaicoast, India (Chouksey et al., 2004), Jiaozhou Bay, China (Wang et al., 2006), Gulf of Fos, France (Mille etal., 2007) Abu Dhabi, UAE (Abdet al., 2008) and Tamil Nadu coast, India (Veerasingam et al., 2010),Bufalo estuary, South Africa (Adeniji et al., 2017), Delaware River Estuary and Delmarva Peninsula, USA(Kim et al., 2018). The values observed Bouloubassi et al., (2001) at Changjiang estuary, China andYunker and Macdonald (2003) at Fraser River Basin, Canada were most similar to the values of thepresent observation made at creek and coastal regions of Indian waters (Table 5).

Page 11/19
Table 5The petroleum hydrocarbon data were reported from selected coastal areas.
Location PHC(Concentrations)
Reference
Arabian Sea along the Indian coast 0.6–5.8 ppm Sengupta et al., 1993
Shetland Island, UK 7–8816 ppm Kingston et al., 1995
Straits of Johor, Malaysia 0.7–36.7 ppm Abdullah et al., 1996
Arabian Gulf 5.4–92.0 ppm Al-Lihaibi & Ghazi, 1997
UAE coast 51,000 ppm Shriadah, 1998
Changjiang estuary, China 2.2–11.82 ppm Bouloubassi et al., 2001
Fraser River Basin, Canada 1.6–20.6 ppm Yunker and Macdonald,2003
Bassein-Mumbai coast, india 7.0–38.2 ppm Chouksey et al., 2004
Jiaozhou Bay, China 0.54–8.12 ppm Wang et al., 2006
Gulf of Fos, France 7.8–180 ppm Miller et al., 2007
Abu Dhabi, UAE 6.14–62.7 ppm Abd EL Gawad et al., 2008
Tamilnadu coast, India 1.48–4.23 ppm Veerasingam et al., 2010
Bufalo estuary, eastern Cape Province, SouthAfrica
12.59–1,100 µg g-1 Adeniji et al., 2017
Delaware River Estuary, USA 34–159 mg/kg Kim et al., 2018
Delmarva Peninsula, Virginia USA 38–616 mg/kg Kim et al., 2018
Saw Mill Creek, Staten Island, NewYork, USA 6524 to9586 mg/kg Vane et al., 2020
Tamilnadu coast, India 2.05–17.47 µg g-1 Present study
The following order of contamination pattern of TPH was found for each location: Ennore creek > Ennorecoastal > Tuticorin channel mouth > Tuticorin coastal.
The PCA was employed to concise the data analysis without changing the signi�cance of data. From theanalysis, it is evident that TPH, TOC and clay have signi�cant positive loading at Station ENN-I and ENN-II(Fig. 3). The PCA further indicates that Ennore creek was highly contaminated with TPH as compared toother stations. In Tuticorin, the TPH, TOC, silt and clay were found to have positive loading in the stationsTUT-I and TUT-II (Fig. 4). The results of the present study show close similarity with the reports made byLyla et al., (2012).
4. Conclusion

Page 12/19
It was noticed in the present study that PAH concentrations were positively correlated with sediment TOCindicating that hydrocarbon adsorption and retention are mainly due to the presence of organic carbon. Itwas also found that the particle size has in�uence over the distribution of hydrocarbons in the sediment.It shows that �ner the particle size higher is the accumulation level of hydrocarbons. Results of thepresent study provide a useful benchmark that the gradual declining in the levels of TPH in both studyareas show a good authoritative control over the hydrocarbon disposal to these coastal regions. However,Ennore coast is to be paid special attention on TPH pollution as it was recorded with higher levels of TPHpollution when compared to Tuticorin coast. Despite these efforts, erection of new petrochemicalindustries, vast urban development coupled with intensive shipping activities may lead to elevate thelevels of TPH in Ennore coast in near future.
Declarations
Author contributionsA. Sundaramaanickam (A S), K. Balachandar (K B), S. Kumaresan (S K), G. Idayachandiran (G I) and AjithNithin (AN).
A S designed the study; K B and G I performed the sample collection and sample Analysis; AS, KB, A Nand S K performed the data analysis and data processing; all authors contributed to the manuscriptpreparation.
Funding InformationThis study was supported by a research project “Seawater Quality Monitoring (SWQM)” from Ministry ofEarth Sciences (MoES), Government of India (Project File No.MoES / ICMAM-PD/ME/CAS-MB/53/2017).
Con�ict of interest:The authors declare that they have no con�ict of interest
Ethics approval:Not applicable
Consent to participate:Not applicable
Page 13/19
Consent to publish:Not applicable
Compliance with Ethical Standards
AcknowledgementsWe would like to acknowledge authorities of Annamalai University for providing necessary facilities.Authors like to give a special thanks to Prof. T. Balasubramanian, former Director and Dean of CAS inMarine Biology, Annamalai University
References1. Abd, E.L., Gawad, E.A., Lotfy, M.M., Sadooni, F.N., Katheery, B.E., 2008. Assessment of the Oil
Pollution Extent in the Offshore Sediments, Abu Dhabi, UAE. Aust. J. Ba. Appl. Sci. 2(3), 617-631.
2. Abdullah A.R., Woon, W.C., Bakar, R.A., 1996. Distribution of Oil and Grease and PetroleumHydrocarbons in the Straits of Johor, Peninsular Malaysia. Bull. Environ. Contam. Toxicology, 57,155– 162.
3. Adeniji O., Okoh O. O., Okoh A. I. 2017. Petroleum Hydrocarbon Fingerprints of Water and SedimentSamples of Buffalo River Estuary in the Eastern Cape Province, South Africa. J. Anal. Methods.Chem. 2629365, 1-13
4. Al-Lihaibi, S.S., Ghazi, S.J., 1997. Hydrocarbon distributions in sediments of the open area of theArabian Gulf following the 1991 Gulf War oil spill. Mar. Pollut. Bull. 34, 941–948.
5. Almeida, M., Danielle Vasconcelos do Nascimento,R.A., Mafalda P. O, Patired V.F., Albergaria-Barbosaa, A.C.R., 2018 Distribution and sources of polycyclic aromatic hydrocarbons (PAHs) insurface sediments of a Tropical Bay in�uenced by anthropogenic activities (Todosos Santos Bay, BA,Brazil) Mar. Pollut. Bull. 137, 399–407.
�. Ananthan, G.A., Sampathkumar, P., Soundarapandian, S., Kannan, L., 2005. Observation onenvironmental characteristics of Ariyankuppam estuary and Veerampattinam coast of Pondicherry,India. J. Aquatic Biology 19: 67-72.
7. Barakat, A.O., Mostafa, A., Wade, T.L., Sweet, S.T., Sayed, N.B.E., 2011. Distribution andcharacteristics of PAHs in sediments from the Mediterranean coastal environment of Egypt. Mar.Pollut. Bull. 62, 1969–1978
�. Bouloubassi, I., Fillaux, J., Saliot, A., 2001. Hydrocarbons in surface sediments from the Changiang(Yangtze River) estuary, East China Sea. Mar. Pollut. Bull. 42, 1335–1346.
9. Buchanan, J.B., 1984. Sediment analysis. In: Holme N.A, McInyre A.D. (eds), Blackwell scienti�cpublications (Methods for the study of marine benthos), 2: 41-65.

Page 14/19
10. Burns, K.A., Villeneuve, J.P., Anderlin, V.C., Fowler, S.W., 1982. Survey of tar, hydrocarbon and metalpollution in the coastal waters of Oman. Pollut. Bull.13(7), 240-247.
11. Chouksey, M.K, Kadam, A.N., Zingde, M.D., 2004. Petroleum hydrocarbon residues in the marineenvironment of Bassein – Mumbai. Mar. Pollut. Bull. 49, 637-647.
12. Hassan, H.M., Castillo, A.B., Yigiterhan, O., Elobaid, E.A., Al-Obaidly, A., AlAnsari, E., Obbard, J.P., 2018.Baseline concentrations and distributions of polycyclic aromatic hydrocarbons in surface sedimentsfrom the Qatar marine environment. Mar Pollut Bull 126:58–62
13. Hong-Gang Ni.,Feng-Hui Lu., Xian-Lin Luo., Hui-Yu Tian., Eddy., 2008. Riverine inputs of total organiccarbon and suspended particulate matter from the Pearl River Delta to the coastal ocean off SouthChina. Mar. Pollut. Bull. 56: 1150-1157.
14. Hostettler, F.D., Pereira, W.E., Kvenvolden, K.A., van Green, A., Luoma, SN., 1999. A record ofhydrocarbon input to San Francisco Bay as traced by biomarker pro�les in surface sediment andsediment core. Mar. Chem. 64: 115– 127.
15. IOC-UNESCO, 1984. Manual for monitoring oil and dissolved dispersed petroleum hydrocarbons inmarine waters and on beaches. Manual and Guides 13: UNESCO, Paris.
1�. Joydas, T.V., Damodaran, R., 2009. Infaunalmacrobenthos along the shelf waters of the west coastof India, Arabian Sea, Indian J. Mar. Sci. 38 (2): 191-204.
17. Kim, B.S.M., Bícego, M., Figueira, R., Siegle, E., Taniguchi, S., Alcántara-Carrió, J., 2017. Organic andinorganic contamination in sediments from Araçá Bay, São Sebastião, Brazil. Ocean & CoastalManagement 164:42-51.
1�. Kim, A.W., Vane, C.H., Moss-Hayes, V., Engelhart, S.E., Kemp, A.C., 2018. PAH, PCB, TPH and mercuryin surface sediments of the Delaware River Estuary and Delmarva Peninsula, USA. Mar. Pollut. Bull.129 (2), 835–845.
19. Kingston, P.F., Dixon, I.M.T., Hamilton, S., Moore, D.C., 1995. The impact of the Braer oil spill on theMacrobenthicinfauna of the sediments off the ShetLand Islands. Mar. Pollut. Bull. 30, 445–459.
20. Law, R. J., 1981. Hydrocarbon concentrations in water and sediments from UK marine waters,determined by �uorescence spectroscopy. Pollut. Bull.12(5), 153-157.
21. Law, R.J., Klungsoyr, J., 2000. The analysis of polycyclic aromatic hydrocarbons in marine samples.Int. J. Environ. Pollut. 13, 262–283.
22. Lyla, S., Manokaran, S., Khan, A., 2012. Petroleum hydrocarbon distribution in continental shelfregion of southeast coast of India. Intern. J. Sedim. Res. 27: 73-83.
23. Massoud, M.S., Haggag, S.S., Abd El Hamid, O.H., 1996. Rev. Roum. Chim. 41:21.
24. Meniconi, M.F.G., Massone, C.G., Sco�eld, A.L., Junior, V.J.F., 2005. Oil spill aftermath: temporalevaluation of hydrocarbon sources in Guanabara Bay, Brazil. In: Canada. Environment Canada.Proceedings of the Twenty-eighth Arctic and Marine Oil spill Program (AMOP) Technical Seminar,Calgary (Alberta), Canada, June (7-9): 75-92.
Page 15/19
25. Miller, G., Asia, L., Guiliano, M., Malleret L., Doumenq, P., 2007. Hydrocarbons in coastal sedimentsfrom the Mediterranean Sea (Gulf of Fos area, France). Mar Pollut Bull, 54,566–75.
2�. Mirsadeghi, S.A., Zakaria, M.P., Yap, C.K., Shahbazi, A., 2011. Risk assessment for the daily intake ofpolycyclic aromatic hydrocarbons from the ingestion of cockle (Anadaragranosa) and exposure tocontaminated water and sediments along the west coast of Peninsular, Malaysia. J. Environ. Sci.23(2): 336–345.
27. Mohebbi-Nozar, S.L., PauziZakaria, M.P., Ismail, W.R., Mortazawi, M.S., Salimizadeh, M., Momeni, M.,GholamaliAkbarzadeh, G., 2015. Total petroleum hydrocarbons in sediments from the coastline andmangroves of the northern Persian Gulf. Mar. Pollut. Bull. 95, 407–411.
2�. Muthukumar, A., Idayachandiran, G., Kumaresan, S., Ajith Kumar, T., Balasubramanian, T., 2013.Petroleum Hydrocarbons (TPH) in Sediments of Three Different Ecosystems from Southeast Coastof India, Intern. J. Pharma. & Bio. 4(3): 543-549.
29. Mzoughi, N., Dachraoui, M., Villeneuve, J.P., 2005. Evaluation of aromatic hydrocarbons byspectro�uorometry in marine sediments and biological matrix: what reference should beconsidered? ComptesRendusChimie, 8(1), 97-102.
30. NRC, 2003. Oil in the Sea: Inputs, Fates, and Effects. National Academy Press, Washington DC. 265.
31. Ruiz-Fernández A. C., Sanchez-Cabeza J. A., Alonso-Hernández C., Martínez-Herrera V., Pérez-BernalL. H., Preda M., Hillaire-Marcel C., Gastaud J., and Quejido-Cabezas A. J. 2012, Effects of land usechange and sediment mobilization on coastal contamination (Coatzacoalcos River, Mexico). Cont.Shelf. Res. (37), 57–65.
32. Sahu, K.C., Bhosale, U., 1991. Heavy metal pollution around the island city of Bombay, India. Part I:Quantification of heavy metal pollution of aquatic sediments and recognition of environmentaldiscriminants. Chem. Geol. 90, 263–283.
33. Schumacher, B.A., 2002. Methods for the Determination of Total Organic Carbon (TOC) in Soils andSediments. U.S. Environmental Protection Agency, Washington DC
34. Sengupta, R., Fondekar, S.P., Alagsamy, R., 1993. State of pollution in the northern Arabian Sea afterthe 1991 Gulf oil spill. Mar. Pollut. Bull. 27, 85–91.
35. Shriadah, M.A., 1998. Impacts of an oil spill on the marine environment of the United Arab Emiratesalong the Gulf of Oman. Mar. Pollut. Bull. 36, 876–879.
3�. Vagge G., Cutroneo L., Castellano M., Canepa G., Bertolotto R.M., Capello, M. 2018. The effects ofdredging and environmental conditions on concentrations of polycyclic aromatic hydrocarbons inthe water colMar. Poll. Bullet. 135, 704-713.
37. Vane, C.H., Kim A.W., Hayes, V. M., Turner, G., Mills, K., Chenery, S.R., Barlow, T.S., Kemp, A.C,Engelhart, S.E, Hill, T. D., 2020. Organic pollutants, heavy metals and toxicity in oil spill impacted saltmarsh sediment cores, Staten Island, New York City, USA. Mar. Pollut. Bull. 151(2020) 110721.https://doi.org/10.1016/j.marpolbul.2019.110721.
3�. Veerasingam, S., Raja, P., Venkatachalapathy, R., Mohan, R., Sutharsan, P., 2010. Distribution ofPetroleum Hydrocarbons in coastal sediments along the Tamilnadu coast, India. Carp. J. Ear.

Page 16/19
Environ. Sci. 5: 5-8.
39. Venkatachalapathy, R., Veerasingam, S., Rajeshwari, V., 2012. Distribution and Origin of PetroleumHydrocarbons in Pichavaram mangrove Swamp along Tamilnadu Coast, Bay of Bengal, India.Geochem. Intern.50(5): 476- 480
40. Wang, X.C., Sun, S., Ma, H.Q., Liu, Y., 2006. Sources and distribution of aliphatic and polyaromatichydrocarbons in sediments of Jiaozhou Bay, Qingdao, China. Mar. Pollut. Bull. 52: 129-38.
41. Wang, Z. Liu, Z., Xu, K., Mayer, L. M. Zhang, Z. Kolker, A. S. Wu, W., 2014. Concentrations and sourcesof polycyclic aromatic hydrocarbons in surface coastal sediments of the northern Gulf of Mexico.Geochem. Trans. 15 (1), 2
42. Wang, M., Wang, C., Lib, Y., 2017 Petroleum hydrocarbons in a water-sediment system from YellowRiver estuary and adjacent coastal area, China: Distribution pattern, risk assessment and sources.Mar. Pollut. Bull. 122, 139–148.
43. Yuan, H., Li, T.G., Ding, X.G., Zhao, G.M., Ye, S.Y., 2014. Distribution, sources and potentialtoxicological signi�cance of polycyclic aromatic hydrocarbons (PAHs) in surface soils of the YellowRiver Delta, China. Mar. Pollut. Bull. 83, 258–264
44. Yuan, H.W., Chen, Ye, Y., Lou, Z.H., Jin, A.M., Chen, X.G., Jiang, Z.P., Lin, Y.S., Chen, C.T.A., Loh, P.S.,2017. Sources and distribution of sedimentary organic matter along the Andong salt marsh,Hangzhou Bay. J. Mar. Syst. 174, 78–88.
45. Yunker, M.B., Macdonald, M.W., 2003. Petroleum biomarker sources in suspended particulate matterand sediments from the Fraser River Basin and Strait of Georgia, Canada. Organ. Geochem. 34:1525–1541.
Figures
Page 17/19
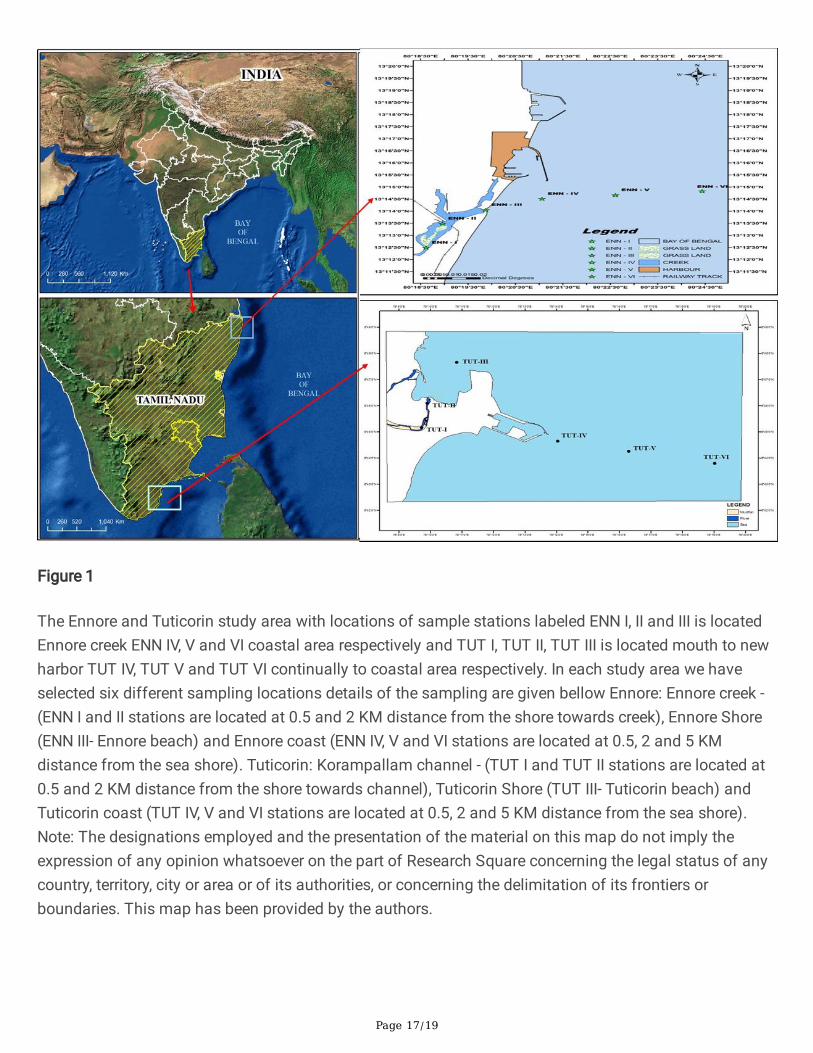
Figure 1
The Ennore and Tuticorin study area with locations of sample stations labeled ENN I, II and III is locatedEnnore creek ENN IV, V and VI coastal area respectively and TUT I, TUT II, TUT III is located mouth to newharbor TUT IV, TUT V and TUT VI continually to coastal area respectively. In each study area we haveselected six different sampling locations details of the sampling are given bellow Ennore: Ennore creek -(ENN I and II stations are located at 0.5 and 2 KM distance from the shore towards creek), Ennore Shore(ENN III- Ennore beach) and Ennore coast (ENN IV, V and VI stations are located at 0.5, 2 and 5 KMdistance from the sea shore). Tuticorin: Korampallam channel - (TUT I and TUT II stations are located at0.5 and 2 KM distance from the shore towards channel), Tuticorin Shore (TUT III- Tuticorin beach) andTuticorin coast (TUT IV, V and VI stations are located at 0.5, 2 and 5 KM distance from the sea shore).Note: The designations employed and the presentation of the material on this map do not imply theexpression of any opinion whatsoever on the part of Research Square concerning the legal status of anycountry, territory, city or area or of its authorities, or concerning the delimitation of its frontiers orboundaries. This map has been provided by the authors.

Page 18/19
Figure 2
The percentage composition sand, silt and clay in Ennore and Tuticorin harbours sediments.
Figure 3
Principal Component analysis (PCA) in sediments of Ennore harbour stations.

Page 19/19
Figure 4
Principal Component analysis (PCA) in sediments of Tuticorin harbour stations.