The polycyclic aromatic hydrocarbon concentrations in soils in the Region of Valasske Mezirici, the...
21
BioMed Central Page 1 of 21 (page number not for citation purposes) Geochemical Transactions Open Access Research article The polycyclic aromatic hydrocarbon concentrations in soils in the Region of Valasske Mezirici, the Czech Republic Daniela Plachá* 1 , Helena Raclavská 2 , Dalibor Matýsek 2 and Mark H Rümmeli 3 Address: 1 Centre of Nanotechnology, VSB - Technical University of Ostrava, 17.listopadu 15, 708 33 Ostrava - Poruba, Czech Republic, 2 Institute of Geological Engineering, VSB - Technical University of Ostrava, the Faculty of Mining and Geology, 17.listopadu 15, 708 33 Ostrava - Poruba, Czech Republic and 3 Leibniz Institute for Solid State and Materials Research Dresden, IFW Dresden, P.O. Box 27016, Helmholzstrase 20, 01069 Dresden, Germany Email: Daniela Plachá* - [email protected]; Helena Raclavská - [email protected]; Dalibor Matýsek - [email protected]; Mark H Rümmeli - [email protected] * Corresponding author Abstract The polycyclic aromatic hydrocarbon (PAH) contamination of urban, agricultural and forest soil samples was investigated from samples obtained in the surroundings of Valasske Mezirici. Valasske Mezirici is a town located in the north-east mountainous part of the Czech Republic, where a coal tar refinery is situated. 16 PAHs listed in the US EPA were investigated. Organic oxidizable carbon was also observed in the forest soils. The PAH concentrations ranged from 0.86-10.84 (with one anomalous value of 35.14) and 7.66-79.39 mg/kg dm in the urban/agricultural and forest soils, respectively. While the PAH levels in the urban/agricultural soils are within the range typically found in industrialized areas, the forest soils showed elevated PAH concentrations compared to other forest soils in Western and Northern Europe. The PAH concentrations and their molecular distribution ratios were studied as functions of the sample location and the meteorological history. The soils from localities at higher altitudes above sea level have the highest PAH concentrations, and the PAH concentrations decrease with increasing distance from the town. 1. Background Many sites in the Czech Republic have been negatively affected by industrial pollution. The town of Valasske Mezirici and its surroundings, in the northeast of the republic, is one of these sites. In the 1960s, a coal tar refin- ery was established there. Coal tar refineries are known sources of pollution; among the pollutants they produce are various organic compounds, including polycyclic aro- matic hydrocarbons (PAHs). The PAHs form a group of chemical compounds that are ubiquitous in the environment [1]. These compounds are well known for their characteristic properties, such as tox- icity and carcinogenity, environmental persistence and tendency for bioaccumulation [1-5]. They form through the incomplete combustion or pyrolysis of organic matter, and their release into the atmosphere is connected with energy and heat production, local heating facilities, vehi- cle exhausts, refuse burning, coke ovens, and so on. They also enter the environment via natural processes such as volcanic activity or forest and prairie fires [6,7]. After being emitted into the atmosphere, they are redistributed between the gas and particle phases, and subsequently deposited to the terrestrial environment through dry or Published: 14 December 2009 Geochemical Transactions 2009, 10:12 doi:10.1186/1467-4866-10-12 Received: 6 March 2009 Accepted: 14 December 2009 This article is available from: http://www.geochemicaltransactions.com/content/10/1/12 © 2009 Plachá et al; licensee BioMed Central Ltd. This is an Open Access article distributed under the terms of the Creative Commons Attribution License (http://creativecommons.org/licenses/by/2.0 ), which permits unrestricted use, distribution, and reproduction in any medium, provided the original work is properly cited.
Transcript of The polycyclic aromatic hydrocarbon concentrations in soils in the Region of Valasske Mezirici, the...

BioMed CentralGeochemical Transactions
ss
Open AcceResearch articleThe polycyclic aromatic hydrocarbon concentrations in soils in the Region of Valasske Mezirici, the Czech RepublicDaniela Plachá*1, Helena Raclavská2, Dalibor Matýsek2 and Mark H Rümmeli3Address: 1Centre of Nanotechnology, VSB - Technical University of Ostrava, 17.listopadu 15, 708 33 Ostrava - Poruba, Czech Republic, 2Institute of Geological Engineering, VSB - Technical University of Ostrava, the Faculty of Mining and Geology, 17.listopadu 15, 708 33 Ostrava - Poruba, Czech Republic and 3Leibniz Institute for Solid State and Materials Research Dresden, IFW Dresden, P.O. Box 27016, Helmholzstrase 20, 01069 Dresden, Germany
Email: Daniela Plachá* - [email protected]; Helena Raclavská - [email protected]; Dalibor Matýsek - [email protected]; Mark H Rümmeli - [email protected]
* Corresponding author
AbstractThe polycyclic aromatic hydrocarbon (PAH) contamination of urban, agricultural and forest soilsamples was investigated from samples obtained in the surroundings of Valasske Mezirici. ValasskeMezirici is a town located in the north-east mountainous part of the Czech Republic, where a coaltar refinery is situated. 16 PAHs listed in the US EPA were investigated. Organic oxidizable carbonwas also observed in the forest soils. The PAH concentrations ranged from 0.86-10.84 (with oneanomalous value of 35.14) and 7.66-79.39 mg/kg dm in the urban/agricultural and forest soils,respectively. While the PAH levels in the urban/agricultural soils are within the range typicallyfound in industrialized areas, the forest soils showed elevated PAH concentrations compared toother forest soils in Western and Northern Europe. The PAH concentrations and their moleculardistribution ratios were studied as functions of the sample location and the meteorological history.The soils from localities at higher altitudes above sea level have the highest PAH concentrations,and the PAH concentrations decrease with increasing distance from the town.
1. BackgroundMany sites in the Czech Republic have been negativelyaffected by industrial pollution. The town of ValasskeMezirici and its surroundings, in the northeast of therepublic, is one of these sites. In the 1960s, a coal tar refin-ery was established there. Coal tar refineries are knownsources of pollution; among the pollutants they produceare various organic compounds, including polycyclic aro-matic hydrocarbons (PAHs).
The PAHs form a group of chemical compounds that areubiquitous in the environment [1]. These compounds are
well known for their characteristic properties, such as tox-icity and carcinogenity, environmental persistence andtendency for bioaccumulation [1-5]. They form throughthe incomplete combustion or pyrolysis of organic matter,and their release into the atmosphere is connected withenergy and heat production, local heating facilities, vehi-cle exhausts, refuse burning, coke ovens, and so on. Theyalso enter the environment via natural processes such asvolcanic activity or forest and prairie fires [6,7]. Afterbeing emitted into the atmosphere, they are redistributedbetween the gas and particle phases, and subsequentlydeposited to the terrestrial environment through dry or
Published: 14 December 2009
Geochemical Transactions 2009, 10:12 doi:10.1186/1467-4866-10-12
Received: 6 March 2009Accepted: 14 December 2009
This article is available from: http://www.geochemicaltransactions.com/content/10/1/12
© 2009 Plachá et al; licensee BioMed Central Ltd. This is an Open Access article distributed under the terms of the Creative Commons Attribution License (http://creativecommons.org/licenses/by/2.0), which permits unrestricted use, distribution, and reproduction in any medium, provided the original work is properly cited.
Page 1 of 21(page number not for citation purposes)
Geochemical Transactions 2009, 10:12 http://www.geochemicaltransactions.com/content/10/1/12
wet deposition [8]. Before being deposited, they can betransported over long distances.
Thus, the soil is contaminated with PAHs mainly fromatmospheric depositions, directly or via vegetation, or inthe case of arable soil with biowaste used as fertilizers [2].Soil contamination by PAHs is considered to be a goodindicator of the level of environmental pollution byhuman activities [8,9]. It can provide information onregional pollution sources, the long-range transport ofPAHs, the rates of pollutant retention and their ultimatedestination [10,11].
The aim of this paper is to investigate the occurrence ofPAHs in urban and agricultural soils that are directlyimpacted by human activity (urban/agricultural soils) andin forest topsoils in the Valasske Mezirici Region in theCzech Republic, in the vicinity of a coal tar refinery andcarbon black production. This information on PAH distri-bution can be used for health risk assessment and futureurban development.
2. Materials and methods2.1. Site location and descriptionThe study area is located in the northeast of the CzechRepublic, in the district of Zlin (Figure 1). The town ofValasske Mezirici is situated at the foothills of the Mora-vian-Silesian Beskydy Mountains, the Hostyn Hills andthe Vsetin Hills, near the confluence of the Roznov Becvaand the Vsetin Becva Rivers (49°27' - 49°30'N and - 18°0'E), at altitudes 400-17°56' 600 m above sea level. The sur-face area is 5,481 ha [12]. According to the general ten-year wind data (Figure 2), the prevailing wind direction isfrom the south (30.8%), followed by calm (17.2%) andnortherly wind direction (12.60%). The other wind direc-tions account for up to 10% of the data. The eastern winddirection has the lowest frequency.
The town is an important industrial center and a signifi-cant railway and road junction, with a relatively high traf-fic density. The main industrial source of PAH pollution isthe coal tar refinery (DEZA Corporation) and the carbonblack production plant (CABOT CS). Both of thesesources are located in the north of the town (Figure 1).DEZA a.s. is the only Czech producer of aromatic hydro-carbons that are obtained by processing coal tar and ben-zol. The annual processing capacity of DEZA is 160,000Mt of crude benzol and 450,000 Mt of crude coal tar. Thecompany's business is processing coal tar, mixed tar oils,benzol and raw materials for the production of phenols.Coal tars are composed of hundreds of organic com-pounds: aromatic compounds, including PAHs, heterocy-clic PAHs, phenols, benzene, toluene, and xylenes, as wellas aliphatic and polar hydrocarbons, but the chemicalcomposition of coal tar may vary as a function of many
factors, including feed stock, plant operating conditionsand weathering once released to the environment [13,14].
The products of DEZA are mainly aromatic hydrocarbons- benzene, toluene, mixtures of xylenes, phenols, cresols,and xylenols - followed by polycyclic aromatic hydrocar-bons - anthracene, carbazol and naphthalene, phthalicanhydride, dioctyl phthalate. Coal tar pitch is also amongtheir important products. The company is the supplier ofraw materials for the production of carbon black in theaffiliated company CS-CABOT [15]. According to theCzech Integrated pollution register, the company reportedannual naphthalene emissions of 50,000 kg. The emittedquantities of the other PAH compounds are not reported[16].
2.2 Sampling of soils and analytical methodsForty samples were collected for the determination of thePAH distribution in soils from the area of Valasske Mezir-ici. Twenty samples were collected from urban grass-cov-ered and agricultural soils in the town and in its nearestsurroundings. Agricultural soil refers to soil that is usedfor agricultural uses, for example, soil for food produc-tion, pasture land and grassland. Urban soil refers to soilnot used for agriculture, occurring in the territory of theurban settlement. In this context, it represents soil in towngardens, soil along the roads and road junctions, parkingplaces, and so on. These type of soils are affected byhuman activities [17,18]. The sampling sites were selectedin order to reflect the diverse exposure of soils to the pol-lution sources and dominant wind directions. They repre-sent samples directly affected by industrial emissions, anddirectly subjected to transport and/or local heating emis-sions.
Twenty samples were collected from the humus layer offorest soils on the hill slopes in the surroundings of thetown; 15 in coniferous forests and 5 in mixed forests. Thesampling sites were also selected to represent a diversity ofdominant wind directions.
The sampling sites are shown in Figure 3 and described inTables 1 and 2. The sampling procedure, the physical sam-ple preparations and the representative sample divisionwere accomplished by using simple random shallow sam-pling according to Tan (2005) and ISO 10381-4:2003 andISO 10381-5:2005 [19-21]. The samples were collectedfrom the surface layer (from A-horizon of 0-10 cm depth),after removing grass in urban/agricultural soil and needlesand litter in forest soil. Approximately 2 kg of materialwere collected from a square area of 10 × 10 m in eachsampling site. All samples were put into glass containerswith a minimum headspace of air, and immediately trans-ported to the laboratory. In each series of samples, one
Page 2 of 21(page number not for citation purposes)

Geochemical Transactions 2009, 10:12 http://www.geochemicaltransactions.com/content/10/1/12
Page 3 of 21(page number not for citation purposes)
The local landscape around the town of Valasske Mezirici town and the coal tar refineryFigure 1The local landscape around the town of Valasske Mezirici town and the coal tar refinery. Some altitudes are marked (in orange).
Ostrava
ValašskéMeziříčí
Praha
Brno
Czech Republic
DEZA
102 3
km
Scale
Bečva
Rožnovská Bečva
Vse
tínsk
áBe
čva
ValašskéMeziříčí
Moravskosle zské Beskydy Mts.
Ro žno v - Vse tín Upland
397
639
508411
709
748
502
285
375
344
424
321409
439
515
534
608
572
534
578
557
458485
449
378
420

Geochemical Transactions 2009, 10:12 http://www.geochemicaltransactions.com/content/10/1/12
sample was collected to the depth of the A- and B- (14-50cm) horizons.
Analyses of 16 PAHs identified by the US EnvironmentalProtection Agency (EPA) as priority pollutants were per-formed at the Institute of Public Health, The Departmentof Hygienic Laboratories in Frydek-Mistek, working inaccordance with EN ISO/IEC 17025 and accredited by TheCzech Accreditation Institute. The laboratory is the CzechNational Reference Laboratory for Persistent Organic Pol-lutants.
All the solvents used (purchased from Sigma Aldrich)were of HPLC grade. The stock reference standard mixtureof 16 PAH EPA 610 PAH MIX (Supelco Co., Cat. No.
48743), including naphthalene, acenaphthylene,acenaphthene, fluorene, phenanthrene, anthracene,fluoranthene, pyrene, benz [a]anthracene, chrysene,benzo [b]fluoranthene, benzo [k]fluoranthene, benzo[a]pyrene, indeno [1,2,3-cd]pyrene, dibenzo [a,h]anthra-cene and benzo [ghi]perylene of 100-2000 ng/ml inmethanol, was used as an external calibration standard.The calibration was performed by direct injection ofdiluted standard solutions into GC or HPLC devices, andthe regressions of peak areas against concentrations werecalculated (R2 > 0.9998). The standards were simultane-ously treated using all procedure steps to eliminate lossesof PAH compounds during sample preparations andextractions. No surrogate standard was used, but matrix
The ten-year wind rose in the Valasske Mezirici RegionFigure 2The ten-year wind rose in the Valasske Mezirici Region.
05
101520253035
N
NE
E
SE
S
SW
W
NW
0 - 2.5 m/s
2.6 - 7.5 m/s
> 7.5 m s/
Total
Page 4 of 21(page number not for citation purposes)

Geochemical Transactions 2009, 10:12 http://www.geochemicaltransactions.com/content/10/1/12
influence was followed for different PAH-spiked materials(sewage sludge, different soils, ashes, rubbish).
The limits of detection and measurement uncertainties forPAH compounds are shown in Table 3. The values of thelimits of detection were derived 1) from the smallest inte-grable areas for each compound peaks in signal and 2)from the ratio between the analyte signal and the baselinenoise (limit of detection = peak height/noise ratio of 3).
The limits of detection were determined for contaminatedsoil matrices [22]. The measurement uncertainties areexpanded uncertainties calculated by multiplying thecombined standard uncertainties by a coverage factor k =2 for an approximate level of confidence of 95% [23].
A sufficient part of each sample was taken for the PAHextraction. The samples were not dried before extraction.The PAH compounds were extracted from the soil samples
Locations of sampling sites in the Valasske Mezirici RegionFigure 3Locations of sampling sites in the Valasske Mezirici Region.
1
2
3
4
5
6
9
8
12
11
10
21
20
7
18
13
17
16
14
15
10 2 3km
Scale
New analysis ofurban/agricultural soilsNew analysis offorest soils
Page 5 of 21(page number not for citation purposes)

Geochemical Transactions 2009, 10:12 http://www.geochemicaltransactions.com/content/10/1/12
using a 1:1 (v:v) mixture of acetone and hexane in a Sox-wav 3.6 microwave extractor (5 min of 20% microwaveperformance, following 55 min of 60% performance).The final extracts were filtered, dried with Na2SO4 andevaporated to produce near-dry residue. The residue wasredissolved in 1 ml of hexane and divided into two aliq-uots; one half of the volume was used for gas chromatog-
raphy - mass spectrometry (GC/MS) analysis and thesecond half was analyzed by high pressure liquid chroma-tography with fluorescence detector (HPLC/FD) after sol-vent exchange (hexane for methanol). Thechromatographic analyses were performed using a GCQ/Polaris Q ThermoFinnigan gas chromatograph, equippedwith a DB-5MS 30 m × 0.25 mm × 0.25 μm column, and
Table 1: Description of urban/agricultural soil sampling sites
Sample ID Soil sample type Altitude (m a.s.l.) Coordinates X.Y Direction* pH/KCl pH/H20
6 urban 441 499076 1138446 South-West 6,61 5,797 agricultural 427 498619 1137867 South 7,45 7,0311 urban 181 495031 11440205 South-East 6,62 5,8312 urban 409 494700 1138994 South-East 6,19 4,9513 agricultural 192 497293 1136156 North 6,14 5,0814 urban 403 496516 1138738 South 7,24 6,9815 agricultural 350 496016 1136550 East 6,28 4,7416 agricultural 352 496356 1134721 North 7,04 6,3617 urban 316 496189 1140722 South 6,63 5,9518 urban 318 497084 1141013 South 6,48 5,9319 urban 336 496803 1139240 South 5,71 4,6920 semi-urban 400 493484 1135740 North-East 6,10 5,0641 urban 207 498198 1137905 South 6,73 5,8354 agricultural 337 494944 1133779 North-East 6,80 5,7678 agricultural 313 498421 1135172 North 5,55 4,62108 agricultural 359 498827 1141290 South 6,13 5,28109 urban 300 497943 1140006 South 7,68 7,12116 agricultural 357 495296 1141360 South-East 6,60 5,68137 urban 321 497250 119944 South 7,30 6,86138 urban 404 495636 11338848 East 6,86 5,92
*direction from coal tar refinery
Table 2: Description of forest soil sampling sites
Sample ID Altitude (m a.s.l.) Coordinates X.Y Direction* Distance** pH/KCl pH/H20 Organic ox carbon (%)
1 400 495130.11 1133851.02 Nord 5,6 2,85 3,30 15,602 290 499432.48 1132383.39 Nord 7,0 2,88 3,35 18,013 275 500649.60 1136282.43 West 5,2 2,88 3,41 13.894 350 503261.27 1138848.46 West 6,5 3,06 3,51 11,055 400 502271.46 1141773.46 South-West 6,1 3,16 3,66 19,206 330 500403.36 1140301.10 South-West 3,8 3,06 3,59 10,257 500 499647.69 1142466.15 South 4,1 2,90 3,80 12,908 365 499887.02 1137853.47 West 3,6 3,35 3,84 10,319 400 498311.52 1138633.84 South 2,1 3,06 3,52 8,8810 300 495502.65 1136669.43 East 3,1 2,81 3,24 16.4511 295 498040.78 1135367.05 Nord-West 4,7 3,47 4,03 10,5912 350 504876.07 1135413.47 West 9,3 3,23 3,71 10,3113 450 495988.96 1143370.04 South 4,1 3,23 3,61 3,4514 625 492916.90 1143460.66 South-East 5,7 3,10 3,48 13.5415 670 491938.90 1149477.01 South 11,4 2,82 3,31 17.2116 550 496606.90 1148941.20 South 9,7 3,04 3,49 15.7817 400 502434.54 1146456.76 South 9,1 2,99 3,50 14.2718 400 500554.75 1144153.94 South 6,4 2,74 3,26 18.9120 400 493353.48 1137947.81 East 3,6 3,12 3,52 16.4721 400 493050.59 1135369.90 Nord East 5,3 3,09 3,38 17.85
* direction from coal tar refinery* *approximate distance of the middle town.
Page 6 of 21(page number not for citation purposes)

Geochemical Transactions 2009, 10:12 http://www.geochemicaltransactions.com/content/10/1/12
a Hewlett Packard Series 1100 liquid chromatograph witha fluorescence detector, equipped with a Merck LiChro-CART 250-3 column. The GC/MS analysis was used forthe determination of light PAHs - naphthalene, acenaph-thene, acenaphthylene and fluorene; the other PAHs wereanalyzed by HPLC/FD method.
The dry matter content of each soil sample was deter-mined after drying in an oven at 105 ± 3°C to constantweight. The organic oxidizable carbon (Cox) content (inpercentage) was determined in each forest soil sample bythe modified Walkley-Black (VB) dichromate methods[24]. The values were determined to be in the range 3.45-19.20% (Table 2). ISO 10390:2005 was used for the rou-tine determination of pH using a glass electrode in a 1:5(volume fraction) suspension of soil in water (pH inH2O) and 1 mol.l-1 potassium chloride solution (pH inKCl) (Table 1 and 2).
3. Results and discussion3.1 PAH content in urban/agricultural soilThe results of the PAH analysis of urban/agricultural soilsamples are shown in Tables 4, 5 in mg/kg dm, and thestatistical evaluation appears in Table 6. The total concen-trations of PAHs (viz. the selected 16 PAHs) varied from0.861-10.840 mg/kg dm, with one anomalous value of35.140 mg/kg dm; the arithmetic mean of the PAH con-centrations was 5.527 mg/kg dm and the median was3.370 mg/kg dm. Only the concentrations of those PAHswith values above the detection limits are calculated. Thesum of 7 carcinogenic PAHs (according to IARC - benzo[a]anthracene, chrysene, benzo [b]fluoranthene, benzo[k]fluoranthene, benzo [a]pyrene, dibenzo [a,h]anthra-
cene, indeno [1,2,3-cd]pyrene) ranged from 0.400 to5.090 mg/kg dm, with one value of 16.000 mg/kg dmbelonging to the anomalous PAH concentration. The sumof these 7 carcinogenic PAHs formed 40-57% of the totalPAHs; only one sample from locality Krhova (ID sample138) had the sum 30%. An analysis of the sample with A-and B-horizons is shown in Table 7. The observed valuesof the PAH concentrations in the B-horizon were similarto the concentrations in the A-horizon. The values were inthe range that was observed for typical concentrations inurban soils (0.600-3.000 mg/kg), and they are higher thantypical concentrations in forest and rural soils (up to1.000 mg/kg) [25]. We do not know the full history of thesite, but the relatively high PAH concentration valuesshow an influence due to human activity. The concentra-tions of the carcinogenic fraction - benzo [a]pyrene werein the range of 0.06-2.25 mg/kg dm, with an arithmeticmean of 0.36 mg/kg dm and a median of 0.22 mg/kg dm.
The highest concentrations of the 16 selected PAHs wereidentified in the urban soils in the Valasske Mezirici townterritory (ID 137, 109, 17, 18, 41, 11), and at the Jurinka(ID 6) and Policna (ID 108) sites. All of these samplingsites are situated south of the coal tar refinery and are inthe proximity of the town center and the coal tar refinery.Influences from all PAH sources (industrial activity, localheating and transport) are evident. The remaining sam-ples were collected north of the study area, and the iden-tified PAH concentrations were lower in these sites. Thesites (ID 13, 15, 20, 54, 78) are situated in the direction ofthe prevailing wind flow, and the landscape of this regiondecreases in altitude in this direction. The PAH atmos-
Table 3: Limit of detection and measurement uncertainty
PAHs Limit of detectionmg/kg
Measurement uncertainty*%
Naphthalene 0.050 30Acenaphthylene 0.050 30Acenaphthene 0.050 30Fluorene 0.050 30Phenanthrene 0.010 20Anthracene 0.005 20Fluoranthene 0.005 20Pyrene 0.005 20Benzo [a]anthracene 0.005 20Chrysene 0.005 20Benzo [b] fluoranthene 0.005 20Benzo [k] fluoranthene 0.005 20Benzo [a] pyrene 0.002 20Dibenzo [a.h] anthracene 0.010 20Benzo [ghi] perylene 0.005 20Indeno [123-cd] pyrene 0.010 20
* The measurement uncertainties are expanded uncertainties calculated by multiplying the combined standard uncertainties by a coverage factor k = 2 for an approximate level of confidence of 95%.
Page 7 of 21(page number not for citation purposes)

Geochemical Transactions 2009, 10:12 http://www.geochemicaltransactions.com/content/10/1/12
pheric dispersion is greater in this direction, and a lowerlevel of PAH deposition occurs at these sites.
Anomalous concentrations of the PAHs (35.16 mg/kgdm) and benzo [a]pyrene (2.25 mg/kg dm) were identi-fied in the sample ID 116, in Stepanov. The values of thePAHs were significantly higher than in the other soil sam-ples. This sample was collected in agricultural soil on theslope above the town in the southeast direction. It sug-gests that PAH deposition at higher altitudes in the prox-imity of PAH sources can occur as a consequence ofunfavorable meteorological conditions associated withthe low wind directions or calm conditions that are fre-quent in this region (see 2.1). These conditions are favo-rable for the occurrence of near ground high pollutantconcentrations and are not appropriate for good atmos-pheric dispersion of pollutants [26]. Graphical presenta-tions of the results are shown in Figures 4 and 5,illustrating the concentrations of the studied PAHs andbenzo [a]pyrene in urban/agricultural as well as forestsoils.
The average PAH16 distribution pattern is shown in Table8 and in Figure 6. Fluoranthene, pyrene, chrysene and
indeno [1,2,3-cd]pyrene are the most prominent com-pounds in the samples (calculated from average values).The predominance of 4-6 ring compounds in the soil sam-ples suggests pyrogenic sources [27]. However, higherconcentrations of naphthalene were found in 12 samples(IDs 7,12,13,15,16,17,18,19,20,54,78,138). Six of thesesamples were collected in the coal tar refinery surround-ings (IDs 7,13,15,16,54,78), four were collected in thetown territory (IDs 12,17,18,19) in the proximity of themain routes, and one (ID 20) was from the backgroundsite. The proportion of naphthalene in the PAH sampleswas generally in the range of 6.2-22.3%, and in one caseeven 35.3% (ID 138).
The presence of 2- and 3- ring PAHs can indicate morerecent PAH deposition [27]. It is well known that lightPAH compounds occur in soils in lower proportions thanheavier ones, due to their physico-chemical properties,such as higher water solubility, volatility and biodegrada-bility and lower sorption ability to soil organic matter orparticles [28,29]. Removal of the PAHs from the atmos-phere is accomplished by dry or wet deposition of parti-cles and vapors [30,31]. Generally, it is known that forhigh level sources, the level of deposition near the source
Table 4: PAH concentrations in selected urban/agricultural soils
Sample ID/locality
6/Jurinka
7/Jurinka orchard
11/Valmez swimming
pool
12/Hrachovec
13/Přiluky
14/Obora
III
15/Bynina
16/Jasenice
17/Valmez hospital
18/Valmez South
PAHs mg/kg dm
Naphthalene 0.100 0.400 0.190 0.120 0.720 0.100 0.140 0.130 0.470 1.050Acenaphthylene 0.006 < 0.005 0.006 0.003 0.007 0.007 < 0.005 < 0.005 0.007 0.015Acenaphthene 0.074 0.062 0.048 0.025 0.050 0.058 0.020 0.190 0.036 0.073Fluorene 0.071 0.052 0.037 0.028 0.047 0.046 0.020 0.110 0.030 0.064Phenanthrene 0.350 0.180 0.180 0.057 0.170 0.290 0.054 0.074 0.270 0.370Anthracene 0.047 0.030 0.041 0.009 0.036 0.046 0.009 0.012 0.066 0.044Fluoranthene 1.000 0.350 0.830 0.160 0.390 0.610 0.120 0.210 0.830 0.800Pyrene 0.700 0.240 0.620 0.120 0.280 0.410 0.087 0.150 0.620 0.560Benzo [a] anthracene
0.320 0.150 0.310 0.071 0.190 0.240 0.054 0.096 0.430 0.300
Chrysene 0.460 0.230 0.440 0.100 0.280 0.330 0.079 0.140 0.600 0.450Benzo [b] fluoranthene
0.240 0.140 0.230 0.053 0.180 0.180 0.053 0.082 0.310 0.240
Benzo [k] fluoranthene
0.150 0.082 0.140 0.032 0.110 0.110 0.029 0.048 0.190 0.140
Benzo [a] pyrene
0.290 0.160 0.280 0.060 0.220 0.210 0.056 0.093 0.400 0.260
Dibenzo [a.h] anthracene
0.220 0.140 0.240 0.052 0.180 0.160 0.050 0.080 0.300 0.210
Benzo [ghi] perylene
0.070 0.039 0.063 0.012 0.050 0.048 0.011 0.019 0.093 0.055
Indeno [123-cd] pyrene
0.440 0.260 0.440 0.083 0.320 0.310 0.079 0.130 0.550 0.390
Σ 16 PAHs 4.538 2.515 4.095 0.985 3.230 3.155 0.861 1.564 5.202 5.021Σ 7 carcinogenic PAHs
2.120 1.162 2.080 0.451 1.480 1.540 0.400 0.669 2.780 1.990
Page 8 of 21(page number not for citation purposes)
Geochemical Transactions 2009, 10:12 http://www.geochemicaltransactions.com/content/10/1/12
is small and increases with downwind distance from thesource until it reaches a maximum, after which itdecreases. For ground-level sources, the highest dry depo-sition is directly next to the source, and decreases down-wind. Thus, it is possible to explain higher naphthalenecontents in the soils in the territory of Valasske Meziricidue to naphthalene in PAH emissions from transport,local heating and the coal tar refinery.
Diagnostic ratios of selected PAH compounds are gener-ally considered to be a good indicator of the pollutionsources and of the mechanism of PAH transport into thesoil. The ratios Ind/(Ind+BghiP) and Flt/(Flt+Pyr) areoften used to distinguish between pyrogenic and petro-genic sources. The value of Ind/(Ind+BghiP) > 0.5 indi-cates grass/coal/wood combustion sources. The values ofFlt/(Flt+Pyr) > 0.4 indicates pyrogenic sources, and we candistinguish between the values 0.4-0.5 for fuel combus-tion and > 0.5 for grass/coal/wood combustion sources.The ratio BaP/BghiP can also be used as an indicator forthe determination of traffic and non-traffic sources, whenthe value > 0.6 is characteristic of traffic sources [2,11].The values of Ant/(Ant+Phe) < 0.1 and Baa/(Baa+Chry) <0.2 correspond to petrogenic sources; values > 0.1 and
>0.35, respectively, indicate pyrogenic sources. The valuesof the ratio Baa/(Baa+Chry) between 0.20-0.35 indicatemixed petrogenic and pyrogenic sources [32,33].
In our data set, the values of Ind/(Ind+BghiP) rangebetween 0.86-0.89, those of Flt/(Flt+Pyr) are in the rangeof 0.55-0.60 and those of BaP/BghiP are between 4.10-5.11. The values of Ind/(Ind+BghiP) and BaP/BghiP aresignificantly higher than those presented in Maliszewska-Kordybach et al. (2008), where the values are in the rangesof 0.45-0.7, 0.3-0.6 and 0.7-1.4, respectively [2]. The char-acteristic ratios indicate predominantly pyrogenic sourcesand coal/wood/grass combustion. The values of Ant/(Ant+Phe) are in the range of 0.09-0.2, and the Baa/(Baa+Chry) ratio ranges from 0.37-0.43. These ratio val-ues confirmed that pyrogenic sources are the main pollu-tion sources, even in the case of ID 116, where the highestPAH contents were determined. All these diagnostic ratiosare illustrated in Figure 7 and in Table 9.
The percentage of the sum of 8 PAHs compounds (with 4or more aromatic rings, excluding fluoranthene andpyrene) and the sum of naphthalene and phenanthreneconcentrations from the full set of PAHs are alternative
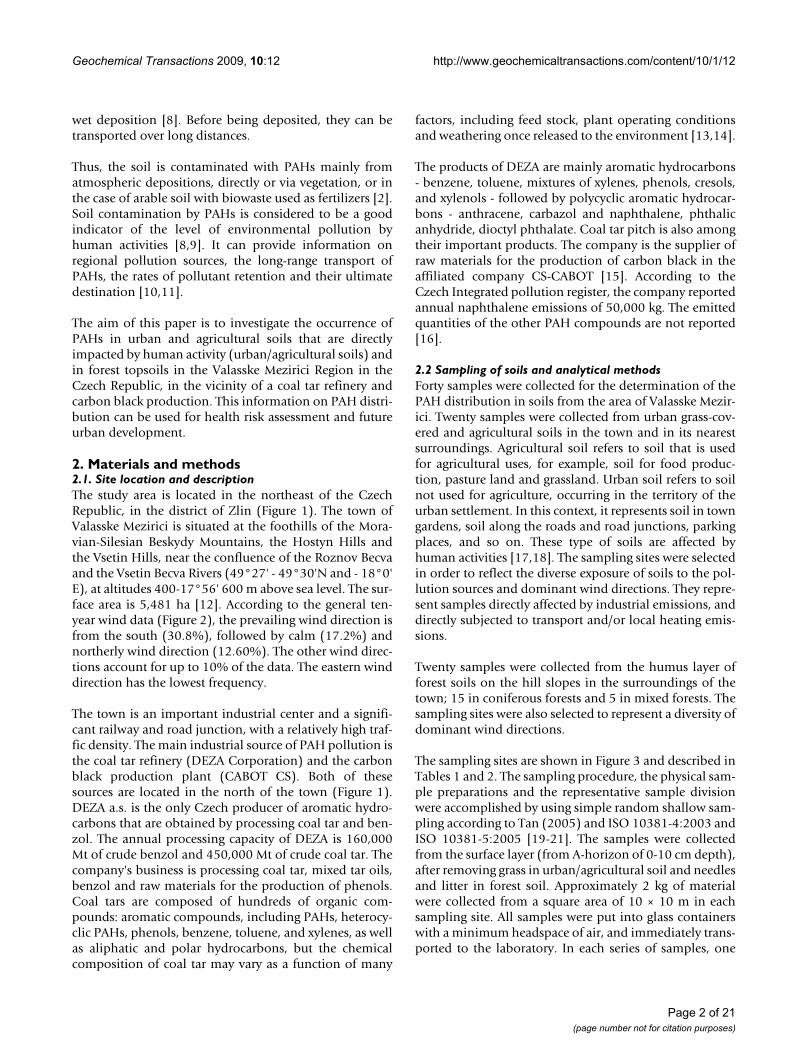
Table 5: PAH concentrations in selected urban/agricultural soils
Sample ID/locality
19/Valmez castle
20/backround
41/near coal tar refinery
54/Hostašo
vice
78/Vysoká
108/Poličná
109/Valmez
confluence
116/on ŠtЕpánov
137/Valmez
Janáčkova
138/Krhová
PAHs mg/kg dm
Naphthalene 0.230 0.230 0.180 0.220 0.200 0.180 0.210 0.210 0.440 0.500Acenaphthylene 0.007 0.013 0.007 0.007 0.006 0.006 < 0.05 < 0.05 < 0.04 0.022Acenaphthene 0.065 0.230 0.060 0.039 0.027 0.065 0.150 0.250 0.680 0.084Fluorene 0.049 0.150 0.043 0.035 0.032 0.050 0.083 0.210 0.480 0.050Phenanthrene 0.210 0.140 0.280 0.220 0.200 0.550 0.490 3.300 0.760 0.078Anthracene 0.027 0.015 0.045 0.030 0.025 0.120 0.160 0.720 0.140 0.008Fluoranthene 0.470 0.440 0.640 0.660 0.500 1.200 2.000 8.300 1.800 0.140Pyrene 0.330 0.310 0.460 0.530 0.360 0.800 1.400 5.700 1.300 0.100Benzo [a] anthracene
0.180 0.170 0.320 0.250 0.200 0.490 0.750 2.600 0.780 0.057
Chrysene 0.310 0.280 0.480 0.380 0.310 0.740 1.000 3.500 1.100 0.093Benzo [b] fluoranthene
0.210 0.170 0.300 0.210 0.180 0.390 0.470 1.600 0.570 0.058
Benzo [k] fluoranthene
0.110 0.097 0.170 0.120 0.110 0.240 0.300 1.100 0.350 0.031
Benzo [a] pyrene
0.190 0.180 0.340 0.220 0.220 0.460 0.610 2.300 0.720 0.056
Dibenzo [a.h] anthracene
0.180 0.160 0.280 0.190 0.200 0.370 0.470 1.800 0.580 0.050
Benzo [ghi] perylene
0.041 0.039 0.081 0.049 0.047 0.096 0.130 0.450 0.150 0.012
Indeno [123-cd] pyrene
0.320 0.270 0.530 0.350 0.340 0.630 0.860 3.100 0.990 0.077
Σ 16 PAHs 2.929 2.894 4.216 3.510 2.957 6.387 9.083 35.140 10.840 1.416Σ 7 carcinogenic PAHs
1.500 1.327 2.420 1.720 1.560 3.320 4.460 16.000 5.090 0.422
Page 9 of 21(page number not for citation purposes)

Geochemical Transactions 2009, 10:12 http://www.geochemicaltransactions.com/content/10/1/12
Page 10 of 21(page number not for citation purposes)
Table 6: Statistical evaluation of PAH concentrations in urban/agricultural soils
PAHs Unit Minimum Maximum Arithmetic mean
Standard deviation
Geometric mean
Median Number of samples
Naphthalene mg/kg dm 0.100 1.050 0.301 0.233 0.241 0.210 20Acenaphthylene mg/kg dm 0.003 0.022 0.009 0.005 0.008 0.007 20Acenaphthene mg/kg dm 0.020 0.680 0.114 0.145 0.073 0.064 20Fluorene mg/kg dm 0.020 0.480 0.084 0.101 0.059 0.050 20Phenanthrene mg/kg dm 0.054 3.300 0.411 0.685 0.234 0.215 20Anthracene mg/kg dm 0.008 0.720 0.082 0.152 0.039 0.039 20Fluoranthene mg/kg dm 0.120 8.300 1.073 1.730 0.603 0.625 20Pyrene mg/kg dm 0.087 5.700 0.754 1.187 0.431 0.435 20Benzo [a] anthracene
mg/kg dm 0.054 2.600 0.398 0.542 0.246 0.245 20
Chrysene mg/kg dm 0.079 3.500 0.565 0.725 0.364 0.355 20Benzo [b] fluoranthene
mg/kg dm 0.053 1.600 0.293 0.327 0.205 0.210 20
Benzo [k] fluoranthene
mg/kg dm 0.029 1.100 0.183 0.226 0.122 0.115 20
Benzo [a] pyrene mg/kg dm 0.056 2.300 0.366 0.475 0.236 0.220 20Dibenzo [a.h] anthracene
mg/kg dm 0.050 1.800 0.296 0.370 0.197 0.195 20
Benzo [ghi] perylene
mg/kg dm 0.011 0.450 0.078 0.093 0.051 0.050 20
Indeno[123-cd)pyrene
mg/kg dm 0.077 3.100 0.523 0.636 0.347 0.345 20
Σ 16 PAHs mg/kg dm 0.861 35.140 5.527 7.221 3.665 3.370 20Σ 7 carcinogenic PAHs
mg/kg dm 0.400 16.000 2.625 3.299 1.720 1.640 20
Table 7: PAH concentration in A- and B- horizons of urban/agricultural and forest soil in the Valasske Mezirici Region
Sample ID/locality ŠtЕpánov (19) Agricultural soil
A-horizon
ŠtЕpánov (19) Agricultural soil
B-horizon
Hodslavice (21) Forest soil A-horizon
Hodslavice (21)/Forest soil B-horizon
PAHs mg/kg dm
Naphthalene 0.008 0.009 0.32 0.006Acenaphthylene 0.004 0.007 < 0.10 0.003Acenaphthene 0.009 < 0.008 0.25 0.011Fluorene < 0.020 < 0.016 0.12 < 0.020Phenanthrene 0.11 0.093 1.3 0.02Anthracene 0.015 0.009 0.13 0.002Fluoranthene 0.26 0.25 3.2 0.044Pyrene 0.19 0.18 2 0.031Benzo [a] anthracene 0.099 0.088 0.97 0.013Chrysene 0.17 0.15 2.2 0.034Benzo [b] fluoranthene 0.13 0.092 1.8 0.037Benzo [k] fluoranthene 0.061 0.049 0.78 0.012Benzo [a] pyrene 0.12 0.093 1.1 0.015Dibenzo [a.h] anthracene 0.085 0.055 1.1 0.016Benzo [ghi] perylene 0.018 0.012 0.26 0.004Indeno [123-cd] pyrene 0.17 0.11 1.9 0.029Σ 16 PAHs 1.469 1.221 17.53 0.297Σ 7 carcinogenic PAHs 0.835 0.637 9.850 0.156cox (%) 3.82 1.78 17.85 4.58
cox content of organic oxidable carbon in soil samples (%)

Geochemical Transactions 2009, 10:12 http://www.geochemicaltransactions.com/content/10/1/12
ways to determine the pollution source [34]. The percent-ages of the naphthalene and phenanthrene sum from thePAHs under investigation were in the range 9-28.3%,except in one case (sample ID 138), where the value was40%. The contribution of compounds with 4 or more aro-matic rings was in the range of 41-59%. These values arein accordance with the data presented in Wilcke et al.(2007a), where soil evaluations were performed in Swit-zerland, Germany, Spain, Korea and China, and combus-
tion and long range transport were identified as the mainpollution sources in this study.
The Czech Republic requires the regular monitoring ofagricultural soils [35]. The PAHs level ranged from 0.056to 9.489 mg/kg dm for PAHs (16 except acenaphthylene)and < 0.004-0.624 mg/kg dm for benzo [a]pyrene, withannual arithmetic means ranging from 0.797-1.297 mg/kg dm for PAHs (16 except for acenaphthylene) and from
The PAH concentrations in urban/agricultural and forest soils in the Valasske Mezirici RegionFigure 4The PAH concentrations in urban/agricultural and forest soils in the Valasske Mezirici Region.
10 2 3km
Scale
Analysis of agricultural/urban soilsAnalysis offorest soils
100 75 50 25 10 5 1mg/kg
Page 11 of 21(page number not for citation purposes)

Geochemical Transactions 2009, 10:12 http://www.geochemicaltransactions.com/content/10/1/12
0.059-0.119 mg/kg dm for benzo [a]pyrene. The annualmedian values were in the range of 0.534-0.967 mg/kgdm for PAHs and 0.047-0.089 mg/kg dm for benzo[a]pyrene. The comparison of the arithmetic mean andmedian values with those identified in the agriculturaland urban soils in Valasske Mezirici confirm a higher loadof the PAHs pollution in the Valasske Mezirici Region.
These values were compared to the data reported in Mal-iszewska-Kordybach et al. (2008) for the top layer of soilsfrom non-industrial areas in Europe. Our minimum val-ues are significantly higher than the reported data set, butthe maximum values (except the sample ID 116) are com-parable with those in Norway (0.009-11.000 mg/kg dm),in the UK (0.042-11.200 mg/kg dm), and in Poland(0.075-11.391 mg/kg dm) [2].
The benzo [a]pyrene concentrations in urban/agricultural and forest soils in the Valasske Mezirici RegionFigure 5The benzo [a]pyrene concentrations in urban/agricultural and forest soils in the Valasske Mezirici Region.
10 2 3km
Scale
Analysis of agricultural/urban soilsAnalysis offorest soils
10 7 5. 5 2 5. 1 0.5mg/kg
Page 12 of 21(page number not for citation purposes)

Geochemical Transactions 2009, 10:12 http://www.geochemicaltransactions.com/content/10/1/12
3.2 PAHs in forest soilsTwo processes affect the fate of PAHs in forest soils: depo-sition and decomposition. In addition to the PAHs inputto the soil through litter, dry and wet deposition of aero-sol particles is an important pathway of path contamina-tion of acid forest soils. The highest PAH concentrations
in the air were in aerosol particles of grain size of 0.1-3μm[36]. PAHs may be degraded in forest soils/foresthumus, although microbial degradation activity decreasesat pH levels below 3.6 [37,38]. The scavenging effect is akey source of forest soil contamination, and the highamount of natural organic matter in forest soil also pro-
Comparison of PAH percentage distributions in urban/agricultural and forest soils in the Valasske Mezirici RegionFigure 6Comparison of PAH percentage distributions in urban/agricultural and forest soils in the Valasske Mezirici Region.
0,0
5,0
10,0
15,0
20,0
25,0
%
PAHs
PAH distributions
urban/agricultural soils forest soils
Table 8: The percentage distribution of each PAH compound in total PAH concentration
PAHs Percentage (%) PAHs Percentage (%)Urban/agricultural soil Forest soil Urban/agricultural soil Forest soil
Naphthalene 0.60-16.20 0.38-1.95 Benzo [a] anthracene 5.81-8.30 5.29-8.06Acenaphthylene 0.13-0.45 0.06-0.71 Chrysene 5.34-11.57 10.01-12.71Acenaphthene 0.69-12.17 0.73-2.45 Benzo [b] fluoranthene 4.87-6.21 6.98-10.27Fluorene 0.58-5.19 0.47-2.26 Benzo [k] fluoranthene 3.27-4.07 3.40-4.56Phenanthrene 4.44-9.26 4.79-9.44 Benzo [a] pyrene 5.20-7.62 6.27-9.83Anthracene 0.79-1.45 0.74-1.79 Benzo [ghi] perylene 4.11-6.67 4.72-6.67Fluoranthene 12.30-22.14 14.40-22.65 Dibenzo [a,h] anthracene 1.10-1.59 1.11-1.83Pyrene 8.72-16.30 9.48-13.86 Indeno [1,2,3-cd] pyrene 7.67-12.62 8.76-13.34
Page 13 of 21(page number not for citation purposes)

Geochemical Transactions 2009, 10:12 http://www.geochemicaltransactions.com/content/10/1/12
vides better conditions for the binding and accumulationof PAHs in soils [8,29,39]. Coniferous trees with needlesare more efficient at collecting particles and cloud drop-lets than leafy trees [30].
The observed PAH concentrations in forest soils are sum-marized in Tables 10, 11 and the statistical evaluation isin Table 12. The PAH concentrations varied from 7.657-79.385 mg/kg dm, with arithmetic mean 25.51 mg/kg dmand median 18.21 mg/kg dm. The benzo [a]pyrene con-centrations were in the range of 0.53-6.20 mg/kg dm, witharithmetic mean 1.85 and median 1.30 mg/kg dm. The
results of the analysis of A- and B-horizons for forest soilsample are shown in Table 7. The PAH content of the B-horizon are higher than those corresponding to typicalforest soils (0.005-0.100 mg/kg), which showed a higherpollution load in the forest soils in the region [25]. All theanalyzed PAHs were identified in each soil sample, exceptacenaphthylene, which was below the detection limit inmost samples.
Generally, high levels of the 16 investigated PAHs wereidentified in the transect zone of the north-south direc-tion. The highest concentrations of the PAHs, as well as of
The comparison of molecular diagnostic ratiosFigure 7The comparison of molecular diagnostic ratios.
Diagnostic ratios of in urban and forest soils: urban/agr icultural soils forest soils
Table 9: Characteristic PAH molecular diagnostic ratios for urban/agricultural and forest soils in Valasske Mezirici Region compared with [50]
Molecular diagnostic ratio valuesDiagnostic ratio Urban/agricultural Forest soil Coal Tar [16] Sources
Ant/(Ant + Phe) 0.09-0.25 0.10-0.20 0.22-0.27 pyrogenic (1 sample petrogenic)Baa/(Baa + Chry) 0.37-0.43 0.29-0.39 0.48-0.58 pyrogenic > 0. 35. petrogenic < 0.2.;10 samples of forest soils
> 0.2 and < 0.35Flt/(Flt + Pyr) 0.55-0.60 0.59-0.62 0.36-0.58 pyrogenic and coal/wood/grass combustionInd(Ind + BghiP) 0.86-0.89 0.85-0.90 0.38-0.59 pyrogenic and coal/wood/grass combustionBaP/BghiP 4.10-5.11 4.07-6.39 1.67-3.25 traffic
Page 14 of 21(page number not for citation purposes)

Geochemical Transactions 2009, 10:12 http://www.geochemicaltransactions.com/content/10/1/12
benzo [a]pyrene and the other single PAH compounds,were detected southeast of the coal tar refinery and thetown (IDs 13,14,15). The lowest concentrations wereidentified to the west of the town (IDs 7,12). These find-ings correspond to the meteorological conditions in theregion, with the frequent south and north wind direc-tions, inversion situations and the east wind directionbeing the least frequent.
The distribution of pollutants in the environment is influ-enced by landscape relief. This aspect is apparent in thisregion, due to the meteorological conditions low windvelocities and calm are the two most frequent wind flowsituations. The altitude increases to the south and eastfrom the town of Valasske Mezirici. In the north, the alti-tude decreases, and atmospheric pollutants can be betterdispersed by the south wind (Figure 1). However, the PAHdispersion during frequent calm and inversion situationsis very slow and is associated with pollutant concentra-tions increasing near the ground. These meteorologicalconditions are mainly correlated with low temperatures,and the PAHs are deposited on the slopes of the hills sur-rounding the town of Valasske Mezirici.
The PAH concentration trend shows that the highest con-centrations are obtained at higher altitudes in the proxim-ity of the town (Figure 4 and 8). In the case of the altitudeof 400 m above sea level, the PAH concentrations decreasewith increased distance from the town centre; this is inagreement with other authors [39]. The three last values inFigure 8 show the PAHs and benzo [a]pyrene concentra-tions at the highest altitudes of 450, 625 and 670 m, to thesoutheast of the town (IDs 13,14, respectively 15). Thesite with the altitude of 450 m is the nearest to the townof these three points, which is the reason for the highestPAH value there.
For two sites at higher altitudes (500 and 550 m above sealevel), the PAH and benzo [a]pyrene concentrations werenot as high as in the preceding three sites. Policna (ID 7,500 m above sea level) is located to the west of the town,outside the frequent wind flow, and the site Ruzdka (ID16, 550 m above sea level) is the furthest from the town.It is situated to the south and is sheltered from pollutantdeposition by higher hill barriers (481-691 m above sealevel) between the site and the town PAH sources. The lev-els of PAHs and benzo [a]pyrene at the altitudes of 450,625 and 670 m markedly exceeded other values.
Table 10: PAH concentrations in selected forest soils
Sample ID/locality
1/Nad Lipuvkou
2/Haj 3/Choryne
4/Branky-Kladeruby
5/Branky-Studanky
6/Zavadilka
7/Policna
8/Lhota u Choryne
9/Jurinka
10/Bynina
PAHs mg/kg dm
Naphthalene 0.360 0.250 0.180 0.120 0.096 0.110 0.190 0.150 0.350 0.350Acenaphthylene <0.07 <0.08 0.038 <0.04 <0.08 <0.06 <0.09 <0.03 <0.07 <0.05Acenaphthene 0.640 0.244 0.150 0.330 0.140 0.190 0.150 0.110 0.450 0.220Fluorene 0.670 0.160 0.120 0.210 0.084 0.100 0.110 0.081 0.280 0.170Phenanthrene 2.700 1.800 1.000 1.400 0.950 0.730 1.300 0.570 2.100 2.000Anthracene 0.500 0.250 0.120 0.150 0.120 0.150 0.170 0.076 0.510 0.280Fluoranthene 5.700 4.000 2.200 3.400 2.100 1.900 3.100 1.400 4.100 4.800Pyrene 4.000 2.700 1.400 2.300 1.300 1.200 1.900 0.900 2.700 3.100Benzo[a] anthracene
1.900 1.300 0.690 1.000 0.650 0.720 1.000 0.450 2.100 1.600
Chrysene 3.500 2.600 1.400 1.900 1.300 1.200 2.000 0.960 3.300 3.100Benzo[b] fluoranthene
2.300 2.000 0.990 1.300 1.100 0.880 1.400 0.710 2.200 2.300
Benzo[k] fluoranthene
1.100 0.950 0.490 0.640 0.480 0.440 0.690 0.320 1.300 1.100
Benzo[a] pyrene 1.900 1.500 0.840 1.100 0.800 0.860 1.100 0.530 2.800 1.700Dibenzo[a.h] anthracene
1.400 1.300 0.710 0.900 0.670 0.640 1.000 0.460 1.900 1.400
Benzo[ghi] perylene
0.330 0.310 0.170 0.230 0.160 0.140 0.230 0.110 0.520 0.340
Indeno[123-cd ] pyrene
2.600 2.300 1.300 1.600 1.300 1.200 1.900 0.830 3.800 2.600
Σ 16 PAHs 29.600 21.664 11.798 16.580 11.250 10.460 16.240 7.657 28.410 25.060Σ 7 carcinogenic PAHs
14.700 11.950 6.420 8.440 6.300 5.940 9.090 4.260 17.400 13.800
Cox (%) 15.600 18.010 13.890 11.050 19.200 10.250 12.900 10.310 8.880 16.450
Cox content of organic oxidizable carbon in soil samples (%)
Page 15 of 21(page number not for citation purposes)

Geochemical Transactions 2009, 10:12 http://www.geochemicaltransactions.com/content/10/1/12
Comparing the distributions of single PAHs compoundswith altitude, we found that all the compounds had thesame trend, except fluorene, acenaphthene and phenan-threne, where some deviations appeared. Fluorene,acenaphthene and anthracene are the least abundant inforest soil. The behavior of lower molecular PAHs isaffected by the collecting effect of the bark. Due to theirphysico-chemical characteristics, lower molecular PAHsare more efficiently adsorbed by the bark, they are leachedfrom the organic layers, they can be re-volatilized or bio-degraded, and so on [40]. The sum of the 7 carcinogenicPAHs (according to IARC, see 3.1) in the selected forestsoil ranged from 4.260-44.400 mg/kg dm, and theyformed 47-61% of the sum of the 16 PAHs. The averagePAH distribution pattern for forest soils is shown in Table8 and in Figure 6. Fluoranthene, pyrene, chrysene, indeno[1,2,3-cd]pyrene and the sum of benzo [b,k]fluoran-thenes are the most prominent compounds in the sam-ples (calculated from average values) as in the urban/agricultural soil data set. The contribution of naphthaleneto the sum of the 16 PAHs (0.38-1.95%) is lower than inurban/agricultural soil.
The diagnostic ratios Ind/(Ind+BghiP) and Flt/(Flt+Pyr)were also used to distinguish possible sources of high con-
centrations of PAHs in forest soils. The values of Ind/(Ind+BghiP), Flt/(Flt+Pyr), BaP/BghiP, Ant/(Ant+Phe)and Baa/(Baa+Chry) ranged from 0.85-0.90; 0.58-0.62;4.07-6.39; 0.10-0.20; 0.29-0.39, respectively. These valuesare close to those calculated in the urban/agricultural soilsin our study (Figure 7). The dominant pollution sourcesaccording to these values are pyrogenic sources, coal/wood/grass combustion, and the ratio of BaP/BghiP con-firms a contribution from traffic. We can observe somedifferences in the Baa/(Baa+Chry) ratio, whose values arelower than 0.35, corresponding to a mixture of pyrogenicand petrogenic sources in the 10 samples of forest soils.Only pyrogenic sources are found in urban/agriculturalsoils using this molecular ratio. Most of the forest soilsamples had a higher value of Ind/(Ind+BghiP) than theurban/agricultural soils (Figure 7).
The percentage of the sum of 8 PAH compounds (4-6)and of the sum of naphthalene and phenanthrene con-centrations in the complete PAH set were in the ranges 48-63% and 5-10%, respectively. In case of the naphthaleneand phenanthrene sum, we see a lower proportion in thesum of the 16 PAHs than in the case of urban/agriculturalsoil, whereas the proportion of the 8-PAH sum is slightlyhigher.
Table 11: PAH concentrations in selected forest soils
Sample ID/locality
11/Priluky
12/Doubrava
13/Podlesi
14/Velka Lhota
15/Dusna
16/Ruzdka
17/Mikuluvka
18/Oznice
20/Krhova-Jehlicna
PAHs mg/kg dm
Naphthalene 0.190 0.110 0.360 0.290 0.200 0.110 0.100 0.120 0.160Acenaphthylene <0.03 <0.04 0.055 0.043 0.043 <0.07 0.023 0.049 0.032Acenaphthene 0.300 0.190 0.580 1.200 1.300 0.190 0.310 0.180 0.360Fluorene 0.210 0.088 0.370 1.000 1.000 0.086 0.170 0.170 0.220Phenanthrene 1.400 0.660 3.800 6.900 5.000 0.950 1.100 1.700 2.400Anthracene 0.260 0.076 0.830 1.000 0.700 0.130 0.160 0.240 0.320Fluoranthene 2.800 1.700 17.000 15.000 12.000 2.600 3.100 4.400 5.700Pyrene 2.000 1.100 11.000 10.000 7.400 1.800 2.100 2.700 3.800Benzo[a] anthracene
1.200 0.500 6.400 5.000 3.300 0.910 1.000 1.400 1.800
Chrysene 2.100 1.200 10.000 8.500 5.300 1.700 1.800 2.700 3.500Benzo[b] fluoranthene
1.600 0.940 6.000 5.400 3.700 1.300 1.300 2.000 2.600
Benzo[k] fluoranthene
0.780 0.400 3.200 2.700 1.800 0.600 0.610 0.960 1.200
Benzo[a] pyrene 1.600 0.640 6.200 5.300 3.400 1.000 1.100 1.500 2.100Dibenzo[a.h] anthracene
1.100 0.570 4.500 3.600 2.500 0.820 0.880 1.300 1.600
Benzo[ghi] perylene
0.270 0.130 0.990 0.830 0.630 0.190 0.270 0.340 0.370
Indeno[123-cd] pyrene
2.200 1.100 8.100 6.600 4.700 1.500 1.500 2.500 3.000
Σ 16 PAHs 18.010 9.404 79.385 73.363 52.973 13.886 15.523 22.259 29.162Σ 7 carcinogenic PAHs
10.580 5.350 44.400 37.100 24.700 7.830 8.190 12.360 15.800
cox (%) 10.59 10.31 3.45 3.54 7.21 15.78 14.27 18.91 16.47
Cox content of organic oxidizable carbon in soil samples (%)
Page 16 of 21(page number not for citation purposes)

Geochemical Transactions 2009, 10:12 http://www.geochemicaltransactions.com/content/10/1/12
3.3 Comparison of the PAHs in soils from other geographic locationsThe PAH concentrations in the forest soils in the ValasskeMezirici Region are much higher than the concentrationspresented in [10,27,29,41]. PAH concentrations were sig-nificantly higher at upper than at lower slope sites, indi-cating long-distance transport [40]. The comparison ofPAH concentrations in forest soils of different regions inEurope with area of Valasske Mezirici is summarized inTable 13. The PAHs concentrations presented in thispaper correspond to those identified in forest soils inregions with elevated atmospheric PAH deposition: inNorthern Bavaria (0.644-19.919 mg/kg dm in A-horizon)and near a blast furnace plant located in the region ofHoogovens, in the Netherlands [39,42]. The PAH levels inurban/agricultural soils are in accordance with those inindustrialized areas [11,32,43-45]. In total, the PAH con-centrations in forest soils were significantly greater thanthose identified in urban/agricultural soils.
In their studies, Farrar et al. (2005) and Tao et al. (2007)observed clear decreasing trends in PAH concentrations inthe vertical distribution in the urban boundary atmos-pheric layer. There are three possible scenarios of the ver-tical concentration profiles due to differences in emissionsources, advection and vertical mixing conditions: 1) even
vertical mixing, with weak fresh emissions, dominantadvection and well-mixing conditions, 2) decrease withheight, with ground source domination and stable atmos-pheric boundary layer conditions, 3) increase with heightwith upper boundary layer emission sources [46,47]. Wecan suppose, especially in the winter and autumn periodsthat Scenario 2 predominates in the studied area, whenpyrogenic sources and traffic are the dominant pollutionsources according to the determined values of moleculardiagnostic ratios (see 3.1 and 3.2). Local heating and traf-fic are sources that emit pollutants at ground level. How-ever, an important source of PAH pollution is located inthis region the coal tar refinery. During coal tar treatment,some operations are performed (for example coal tarlaunching) that lead to organic compound escape to theambient air. The escape level depends on the air tempera-ture. The possible emissions sources in coal tar refinery are15 m of height and they can contribute to the pollutionsources at ground level not only in the winter days, butalso in periods with higher temperatures.
A higher level of deposition of PAH compounds on thehill slopes in the vicinity of the town occurs in this regionas a consequence of the prevailing meteorological condi-tions (on average, 66% of meteorological situations arecalm with wind velocities 0-2.5 m/s, 27.5% have wind
Table 12: Statistical evaluation of PAH concentrations in forest soils
PAHs Unit Minimum Maximum Arithmetic mean
Standard deviation
Geometric mean
Median Number of samples
Naphthalene mg/kg dm 0.100 0.360 0.210 0.100 0.180 0.190 20Acenaphthylene mg/kg dm LD* 0.100 0.020 0.020 0.040 0.040 20Acenaphthene mg/kg dm 0.110 1.300 0.370 0.320 0.290 0.250 20Fluorene mg/kg dm 0.080 1.000 0.270 0.280 0.190 0.170 20Phenanthrene mg/kg dm 0.570 6.900 1.990 1.550 1.580 1.400 20Anthracene mg/kg dm 0.080 1.000 0.310 0.260 0.230 0.210 20Fluoranthene mg/kg dm 1.400 17.000 5.010 4.300 3.860 3.300 20Pyrene mg/kg dm 0.900 11.000 3.270 2.790 2.520 2.200 20Benzo[a] anthracene
mg/kg dm 0.450 6.400 1.690 1.500 1.290 1.100 20
Chrysene mg/kg dm 0.960 10.000 3.010 2.330 2.430 2.150 20Benzo[b] fluoranthene
mg/kg dm 0.710 6.000 2.090 1.390 1.760 1.700 20
Benzo[k] fluoranthene
mg/kg dm 0.320 3.200 1.030 0.740 0.850 0.780 20
Benzo[a] pyrene mg/kg dm 0.530 6.200 1.850 1.480 1.470 1.300 20Dibenzo[a.h] anthracene
mg/kg dm 0.460 4.500 1.420 1.010 1.180 1.100 20
Benzo[ghi] perylene
mg/kg dm 0.110 0.990 0.340 0.230 0.280 0.270 20
Indeno[123-cd)pyrene
mg/kg dm 0.830 8.100 2.630 1.840 2.180 2.050 20
Σ 16 PAHs mg/kg dm 7.660 79.390 25.510 19.660 20.470 18.210 20Σ 7 carcinogenic PAHs
mg/kg dm 4.260 44.400 13.927 10.474 11.261 10.580 20
LD - limit of detection
Page 17 of 21(page number not for citation purposes)

Geochemical Transactions 2009, 10:12 http://www.geochemicaltransactions.com/content/10/1/12
velocity 2.6-7.5 m/s and 6.5% have wind velocities >7.6m/s, according to the Czech Hydrometeorological Insti-tute) and topographical terrain. The meteorological con-ditions are not favorable for atmospheric pollutantdispersion, and the pollutants are accumulated in theboundary layer, the altitude of the inversion layer gener-ally reaches a number of tens or hundreds meters) [26].The unfavorable meteorological conditions usually persistfor several days and are repeated (see 3.1).
The molecular diagnostic ratios indicate pyrogenicsources and combustion of coal, wood and grass as mainpollution sources. However, the coal tar composition isformed especially from naphthalene (10% by weight),phenanthrene (4.5% by weight), fluoranthene (3.0% byweight), acenaphthylene (2.5% by weight), pyrene (2.0%by weight), fluorene (1.8% by weight), anthracene (1.3%by weight), chrysene (1.0% by weight) and acenaphthene(0.2% by weight) [48]. This fact can explain the higherconcentrations of lighter PAHs, especially naphthalene, inurban/agricultural soils in the vicinity of the refinery andtheir higher contributions to the sum of the 16 PAHs inthe urban/agricultural soils compared to the forest soils(Table 8, Figure 6). The diagnostic ratios determined forcoal tar are 0.18 for Ant/(Ant+Phe), 0.58 for Flt/(Flt+Pyr),
0.54 for Baa/(Baa+Chry) and 0.53 for Ind/(Ind+BghiP)[49]. Thus, these values correspond to those in our sam-ples in the case of Ant/(Ant+Phe) and Flt/(Flt+Pyr). Thevalues of Baa/(Baa+Chry) were lower, and those of Ind/(Ind+BghiP) were higher in our samples. All the valuescorrespond to coal/wood/grass combustion and pyro-genic sources. Brown et al. (2006) compared eleven sam-ples of coal tars from 10 former manufactured gas plantsites in the Eastern United States [16]. The diagnosticratios determined in these coal tar samples were withinthe ranges (Table 9): 0,22-0,27 for Ant/(Ant+Phe), 0,36-0,58 for Flt/(Flt+Pyr), 0,48-0,58 for Baa/(Baa+Chry),0,38-0,59 for Ind/(Ind+BghiP) and 1,67-3,25 for BaP/BghiP. Thus, these values correspond to those in our sam-ples in case of Ant/(Ant+Phe) and Flt/(Flt+Pyr). It is notpossible to distinguish between pyrogenic sources and thecoal tar refinery in this way, because the ratios presentedare determined for cruel coal tar, but the coal tar refinerymay contribute to soil by emitted PAH deposition. Thediagnostic ratios in depositions can be completely differ-ent.
We observed in our samples higher concentrations ofindeno [1,2,3-cd]pyrene compared to benzo [ghi]peryl-ene. Yunker et al. (2002) listed in his work typical ratios
The total PAH concentration as a function of altitudeFigure 8The total PAH concentration as a function of altitude.
Page 18 of 21(page number not for citation purposes)
Geochemical Transactions 2009, 10:12 http://www.geochemicaltransactions.com/content/10/1/12
for petroleum, single source combustion and environ-mental samples; the Ind/(Ind+BghiP) values were in therange of 0.09-0.70, while we determined these values tobe above 0.85 in our samples, and higher in forest soilsthan in urban soils [49]. Indeno [1,2,3-cd]pyrene andbenzo [ghi]perylene are degraded photochemically atcomparable rates, and the original composition is pre-served during atmospheric transport. The concentrationsof benzo [a]pyrene were also significantly higher thanthose of benzo [ghi]perylene (4-6 times higher), and theratio values were higher in forest soils than urban/agricul-tural ones. An inverse trend was observed in the case ofBaa/(Baa+Chry), where mixed sources (pyrogenic andpetrogenic) were determined in most of forest soils, andpyrogenic sources in the urban soils. Because we did notsuppose petroleum sources in forest soils (the sampleswere collected in remote areas) this fact may correspondto faster benzo [a]anthracene degradation in forest soils orin the air during the atmospheric transport.
4. ConclusionsThe urban, agricultural and forest soils in the region ofValasske Mezirici are contaminated with polycyclic aro-matic hydrocarbons, which are emitted through industrialprocesses, transport and local heating sources. The highestPAH concentrations were found in forest soils from theforest-covered slopes of hills. The observed values weremuch higher than the PAH concentrations reported forforest soils in Western and Northern Europe. The PAHconcentrations in the urban soils were higher than in theagricultural soils, but comparable with other soils fromurban areas in the world. The highest PAH concentrationswere observed in forest soils collected at higher altitudesabove sea level. The PAH distribution in the mountainousregion is related to altitude and influenced by meteorolog-
ical conditions. The frequent calm conditions that areconnected with inversion conditions contribute to PAHdeposition at higher altitudes in the surroundings of thetown. Elevated PAH concentrations were identified at sitesfurther from the town, but the concentrations decreasedin comparison with sites in the proximity of the town.Compared to the PAH load in other world areas, it isclearly confirmed that the soils in the region of ValasskeMezirici, especially the forest soils, are highly polluted.There is a primary source of PAH pollution in the region acoal tar refinery. There are also contributions from othersources local heating, vehicle transport and long rangepollutant transport. It is not possible to distinguish thecontributions of each source on the basis of diagnosticratios.
AbbreviationsPAHs: polycyclic aromatic hydrocarbons; Ace: Acenaph-thene; Acy: Acenaphthylene; Ant: Anthracene; Baa: Benzo[a]anthracene; Bap: Benzo [a]pyrene; Bbf: Benzo[b]fluoranthene; Bkf: Benzo [k]fluoranthene; BghiP:Benzo [g.h.i]perylene; Chry Chrysene; Daa: Dibenzo[ah]anthracene, Flt: Fluoranthene; Flu: Fluorene; Ind:Indeno [1,2,3-cd]pyrene; Nap: Naphthalene; Phe: Phen-anthrene; Pyr: Pyrene; Dm: dry matter.
Competing interestsThe authors declare that they have no competing interests.
Authors' contributionsDP evaluated the results and wrote the manuscript. HRwas the head of the research groupe, she designed thisstudy and participated in preparation of the manuscript.DM prepared graphical part of the manuscript and the sta-tistical analysis. All of three authors participated in
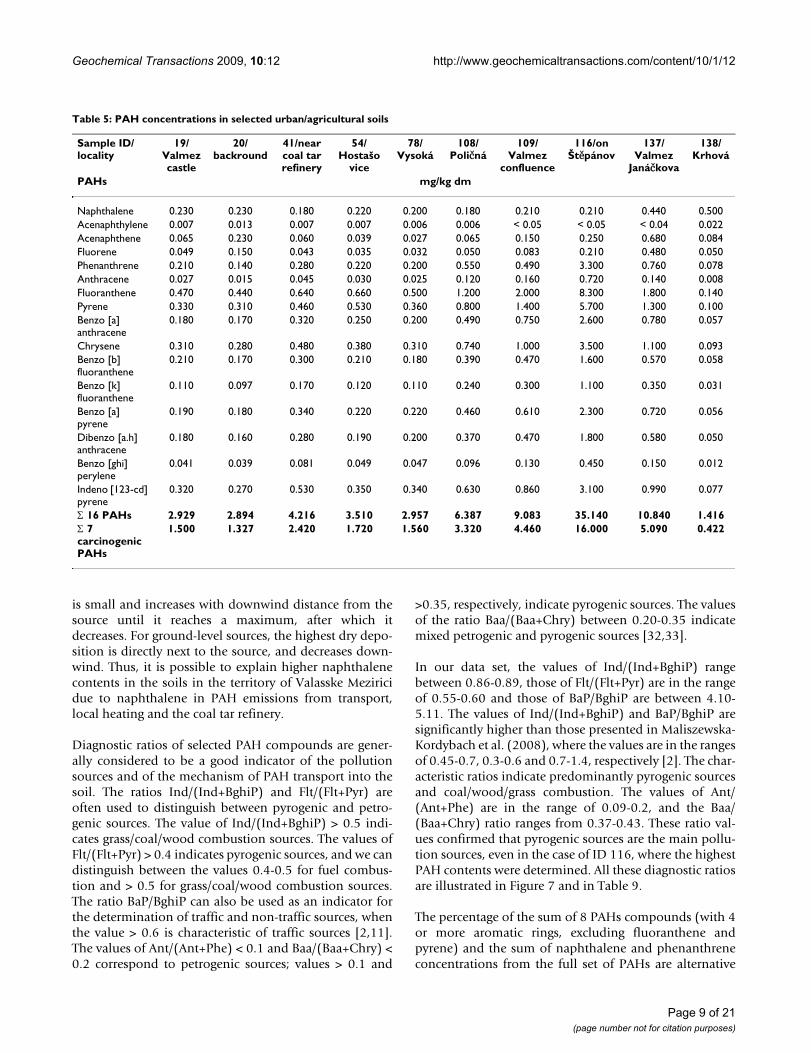
Table 13: The PAHs values in various types soils in various regions
Region Soil type PAHs Contents (mg/kg dm) Literature
Norway forest soils Σ16 PAHs < 006.2 - 010.0 Jensen et al., 2007,[27]Σ15 PAHs, except
Austria forest soils Naphthalene 0.068 - 1.342 Weiss et al., 2000,[29]UK woodland soils Σ15 PAHs up to 4.850 Nam et al., 2008,[10]Switzerland forest soils Σ16 PAHs 0.098 0.219 Bucheli et al., 2004,[41]Czech republic forest soils Σ16 PAHs 2.000-30.000 Wilcke et al., 2007b,[40]Northern Bavaria, Germany forest soils Σ16 PAHs 0.644 19.919 Krauss et al., 2000,[42]Valasske Mezirici forest soils Σ16 PAHs 7.657 - 79.385 Placha et al
Belgium industrial soil Σ16 PAHs 2.00 - 300.000 Bakker et al., 2000,[43]Germany river bank soils Σ16 PAHs 12.200 - 31.200 Pies et al., 2008,[32]Beijing, China urban soil Σ16 PAHs 0.220 - 27.830 Tang et al., 2005,[44]Nanjing, China urban soil Σ16 PAHs 0.290 - 17.640 Yin et al., 2008,[11]Nanjing, China residential areas Σ16 PAHs 0.460 - 3.110 Yin et al., 2008,[11]Nanjing, China agricultural soil Σ16 PAHs 0.310 - 27.580 Yin et al., 2008,[11]Spain urban soil Σ16 PAHs 0.340 - 6.060 Nadal et al., 2007,[45]Valasske Mezirici urban/agricultural soil Σ16 PAHs 0.861-10.840 (one anomalous value 35.140) Placha et al
Page 19 of 21(page number not for citation purposes)
Geochemical Transactions 2009, 10:12 http://www.geochemicaltransactions.com/content/10/1/12
designing of the study, in sample collecting and data eval-uation. MHR participated in design of the manuscript. Allauthors have read and approved the final manuscript.
AcknowledgementsWe acknowledge the financial support of the research project INTERVI-RON 2BE6068 (The Ministry of Education, Youth and Sport, the Czech Republic).
References1. Liu X, Zhang G, Jones KC, Li X, Peng X, Qi S: Compositional frac-
tionation of polycyclic aromatic hydrocarbons (PAHs) inmosses (Hypnum plumaeformae WILS.) from the northernslope of Nanling Mountains, South China. Atmospheric Environ-ment 2005, 39:5490-5499.
2. Maliszewska-Kordybach B, Smreczak B, Klimkowicz-Pawlas A, Tere-lak H: Monitoring of the total content of polycyclic aromatichydrocarbons (PAHs) in arable soils in Poland. Chemosphere2008, 73:1284-1291.
3. Vila-Escalé M, Vegas-Vilarrúbia T, Prat N: Release of polycyclicaromatic compounds into a Mediterranean creek (Catalo-nia, NE Spain) after a forest fire. Water Research 2007,41:2171-2179.
4. Wang Z, Chen J, Qiao X, Yang P, Tian F, Juany L: Distribution andsources of polycyclic aromatic hydrocarbons from urban torural soils: A case study in Dalian, China. Chemosphere 2007,68:965-971.
5. Holoubek I, Vokounová Š, Kompres J: Persistentní organicképolutanty v atmosféře a půdách, tЕkání z půd. Ochrana ovzduší2000, 3:4-19.
6. Kim EJ, Oh JE, Chány YS: Effects of forest fire on the level anddistribution of PCDD/Fs and PAHs in soil. The Science of TheTotal Environment 2003, 311:177-189.
7. Omar NYMJ, Bin Abas MR, Ketuly KA, Tahir NM: Concentrationsof PAHs in atmospheric particles (PM-10) and roadside soilparticles collected in Kuala Lumpur, Malaysia. AtmosphericEnvironment 2002, 36:247-254.
8. Wong F, Harnerb T, Liua QT, Diamonda ML: Using experimentaland forest soils to investigate the uptake of polycyclic aro-matic hydrocarbons (PAHs) along an urban-rural gradient.Environmental Pollution 2004, 129:387-398.
9. Chung MK, Hu R, Cheung KC, Wong MH: Pollutants in HongKong soils: Polycyclic aromatic hydrocarbons. Chemosphere2007, 67:464-470.
10. Nam JJ, Thomas GO, Jaward FM, Steinnes E, Gustafsson O, Jones KC:PAHs in background soils from Western Europe: Influenceof atmospheric deposition and soil organic matter. Chemos-pher 2008, 70:1596-1602.
11. Yin ChQ, Jiang X, Yang XL, Bian YR, Wang F: Polycyclic aromatichydrocarbons in soils in the vicinity of Nanjing, China. Chem-osphere 2008, 73:389-394.
12. Town of Valasske Mezirici. Profile of the town [http://www.valasskemezirici.cz/en/1928/]
13. Benhabib K, Faure P, Sardin M, Simonnot MO: Characteristics of asolid coal tar sampled from a contaminated soil and of theorganics transferred into water. Fuel 2009. doi:10.1016/j.fuel.2009.06.009
14. Brown DG, Gupta L, Kim TH, Moo-Young HK, Coleman AJ: Com-parative assessment of coal tars obtained from 10 formermanufactured gas plant sites in the Eastern United States.Chemosphere 2006, 65:1562-1569.
15. DEZA, member of Agrofert Group [http://www.deza.cz/]16. Integrovaný registr znečiš'ování životního prostředí (IRZ)
[http://www.irz.cz/]17. Scheyer JM, Hipple KW: Urban Soil Primer. 2005 [http://
soils.usda.gov/use]. United States Department of Agriculture, NaturalResources Conservation Service, National Soil Survey Center, Lin-coln, Nebraska
18. Lehmann A, Stahr K: Nature and Significance of AnthropogenicUrban Soils. J Soils Sediments 2007, 7:247-260.
19. Tan Kim H: Soil sampling, preparation and analysis. CRC Press,Taylor and Francis, Boca Raton, Florida; 2005:623.
20. ISO 10381-4:2003 Soil quality - Sampling - Part 4: Guidanceon the procedure for investigation of natural, near-naturaland cultivated sites. .
21. ISO 10381-5:2005 Soil quality - Sampling - Part 5: Guidanceon the procedure for the investigation of urban and indus-trial sites with regard to soil contamination. .
22. International Conference on Harmonization (ICH) of TechnicalRequirements for the Registration of Pharmaceuticals for HumanUse: Validation of analytical procedures: definitions and ter-minology. Geneva 1996.
23. EURACHEM/CITAC Guide CG 4, Quantifying Uncertaintyin Analytical Measurement. QUAM Second edition. 2000.
24. De Vos B, Lettens S, Muys B, Deckers JA: Walkley-Black analysisof forest soil organic carbon: recovery, limitations anduncertainty. Soil Use and Management 2007, 23:221-229.
25. Air Quality Guidelines. Second edition. WHO Regional Office forEurope, Copenhagen, Denmark; 2000.
26. Dordevič DS, Šolevič TM: The contributions of high- and lowaltitude emission sources to the near ground concentrationsof air pollutants. Atmospheric Research 2008, 87:170-182.
27. Jensen H, Reimann C, Finne TE, Ottesen RT, Arnoldussen A: PAH-concentrations and compositions in the top 2 cm of forestsoils along a 120 km long transect through agricultural areas,forests and the city of Oslo, Norway. Environmental Pollution2007, 14:829-838.
28. PAHs: An Ecotoxicological Perspective. 2003:404.29. Weiss P, Lorbeer G, Scharf S: Regional aspects and statistical
characterisation of the load with semivolatile organic com-pounds at remote Austrian forest sites. Chemosphere 2000,40:1159-1171.
30. Erisman JW, Draaijers G: Deposition to forest in Europe: mostimportant factors influencing dry deposition and modelsused for generalization. Environmental Pollution 2003,124:379-388.
31. Ravindra K, Sokhi R, Van Grieken R: Atmospheric polycyclic aro-matic hydrocarbons: Source attribution, emission factorsand regulation. Atmospheric Environment 2008, 42:2895-2921.
32. Pies C, Hoffmann B, Petrowsky J, Yang Y, Ternes TA, Hofmann T:Characterization and source identification of polycyclic aro-matic hydrocarbons (PAHs) in river bank soils. Chemosphere2008, 72:1594-1601.
33. Zhang HB, Luo YM, Wong MH, Zhao QG, Zhang GL: Distributionsand Concentrations of PAHs in Hong Kong Soils. Environmen-tal Pollution 2006, 141:107-114.
34. Wilcke W, Zech W: Polycyclic aromatic hydrocarbons (PAHs)in forest floors of the Northern Czech Mountains. Zeitschriftfür Pflanzenernährung und Bodenkunde 2007, 160:573-579.
35. Prášková L, Kubík L, Křivánek J, Majer F, Malý S: Kontrola a moni-toring cizorodých látek v zemЕdЕlské půdЕ a vstupech dopůdy. Zpráva za rok 2006. Central Institute for supervising andTesting in Agriculture, Brno; 2007.
36. Schönbuchner H, Guggenberger G, Peters K, Bergmann H, Zech W:Particle size distribution of PAH in the air of a remote nor-way spruce forest in northern Bavaria. Water, Air and Soil Pollu-tion 2001, 128:355-367.
37. Koivula TT, Salkinoja-Salonen M, Peltola R, Romantschuk M: Pyrenedegradation in forest humus microcosms with or withoutpine and its mycorrhizal fungus. Environ Qual 2004, 33:45-53.
38. West AW, Sparling GP, Feltham CW, Reynolds J: Microbial activityand survival in soils dried at different rates. Australian Journal ofSoil Research 1992, 30:209-222.
39. Van Brummelen TC, Verweij RA, Wedzinga SA, Van Gestel CAM:Enrichment of polycyclic aromatic hydrocarbons in forestsoils near blast furnace plant. Chemosphere 1996, 32:293-314.
40. Wilcke W: Global patterns of polycyclic aromatic hydrocar-bons (PAHs) in soil. Geoderma 2007, 141:157-166.
41. Bucheli TD, Blum F, Desaules A, Gustafsson O: Polycyclic aro-matic hydrocarbons, black carbon, and molecular markersin soils of Switzerland. Chemosphere 2004, 11:1061-1076.
42. Krauss M, Wilcke W, Zech W: Polycyclic aromatic hydrocar-bons and polychlorinated biphenyls in forest soils: depth dis-tribution as indicator of different fate. Environmental Pollution2000, 110:79-88.
43. Bakker MI, Casado B, Koerselman JW, Tolls J, Kollöffel C: Polycyclicaromatic hydrocarbons in soil and plant samples from the
Page 20 of 21(page number not for citation purposes)
Geochemical Transactions 2009, 10:12 http://www.geochemicaltransactions.com/content/10/1/12
Publish with BioMed Central and every scientist can read your work free of charge
"BioMed Central will be the most significant development for disseminating the results of biomedical research in our lifetime."
Sir Paul Nurse, Cancer Research UK
Your research papers will be:
available free of charge to the entire biomedical community
peer reviewed and published immediately upon acceptance
cited in PubMed and archived on PubMed Central
yours — you keep the copyright
Submit your manuscript here:http://www.biomedcentral.com/info/publishing_adv.asp
BioMedcentral
vicinity of an oil refinery. The Science of The Total Environment2000, 263:91-100.
44. Tang L, Tang XY, Zhu YG, Zheng MH, Miao QL: Contamination ofpolycyclic aromatic hydrocarbons (PAHs) in urban soils inBeijing, China. Environment International 2005, 31:822-828.
45. Nadal M, Schuhmacher M, Domino JL: Levels of metals, PCBs,PCNs and PAHs in soils of a highly industrialized chemical/petrochemical area: Temporal trend. Chemosphere 2007,66:267-276.
46. Farrar NJ, Harner T, Shoeib M, Sweetman A, Jones KC: Fielddeployment of thin film passive air samplers for persistentorganic pollutants: a study in the urban atmospheric bound-ary layer. Environmental Science and Technology 2005, 39:28-42.
47. Tao S, Wang Y, Wu S, Liu S, Dou H, Liu Y, Chang L, Hu F, Xing B:Vertical distribution of polycyclic aromatic hydrocarbons inatmospheric boundary layer of Beijing in winter. AtmosphericEnvironment 2007, 41:9594-9602.
48. VymЕtal J, Plesnik M: Zpracování černouhelného dehtu a smoly.DEZA Valasske Mezirici 1994:34-44.
49. Yunker MB, Macdonald RW, Vingarzan R, Mitchell RH, Goyette D,Sylvestre S: PAHs in the Fraser River basin: a critical appraisalof PAH ratios as indicators of PAH source and composition.Organic Geochemistry 2002, 33:489-515.
50. Katsoyiannis A, Terzi E, Cai QY: On the use of PAH moleculardiagnostic ratios in sewage sludge for the understanding ofthe PAH sources. Is this use appropriate? Chemosphere 2007,69:1337-1339.
Page 21 of 21(page number not for citation purposes)